Attached files
| file | filename |
|---|---|
| 8-K - 8-K - Agiliti Health, Inc. | a11-2267_28k.htm |
| EX-99.1 - EX-99.1 - Agiliti Health, Inc. | a11-2267_2ex99d1.htm |
Exhibit 99.2
|
|
UHOS Q4 2010 Earnings Teleconference March 10, 2011 |
|
|
Safe Harbor Statement under the Private Securities Litigation Reform Act of 1995: Universal Hospital Services, Inc. believes statements in this presentation looking forward in time involve risks and uncertainties based on management’s current views and assumptions. Actual events may differ materially. Please refer to the cautionary statement regarding forward-looking statements and risk factors that appear in the Company’s Annual Report on Form 10-K for the year ended December 31, 2010, and other filings with the SEC, which can be accessed at www.UHS.com under “Financials.” This presentation contains non-GAAP measures as defined by SEC rules. Reconciliations of these measures to the most directly comparable GAAP measures are contained in the appendix. Forward Looking Statements |
|
|
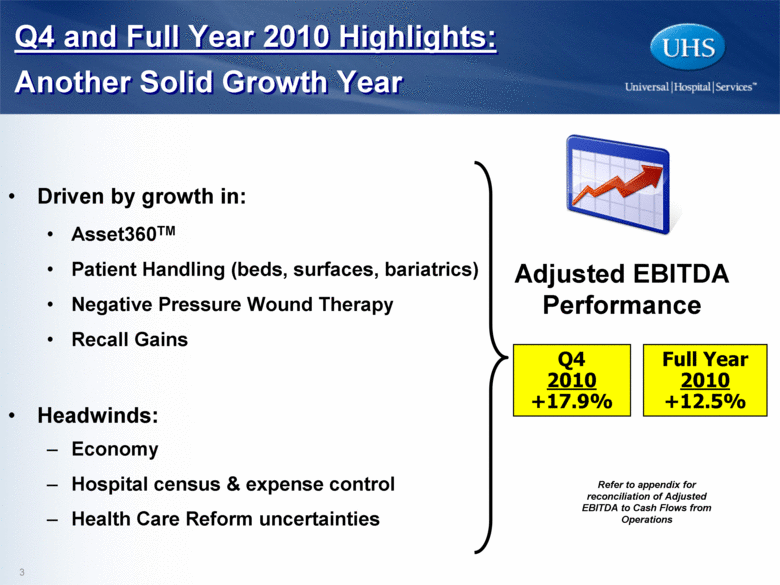
Q4 and Full Year 2010 Highlights: Another Solid Growth Year Driven by growth in: Asset360TM Patient Handling (beds, surfaces, bariatrics) Negative Pressure Wound Therapy Recall Gains Headwinds: Economy Hospital census & expense control Health Care Reform uncertainties Refer to appendix for reconciliation of Adjusted EBITDA to Cash Flows from Operations Q4 2010 +17.9% Full Year 2010 +12.5% Adjusted EBITDA Performance |
|
|
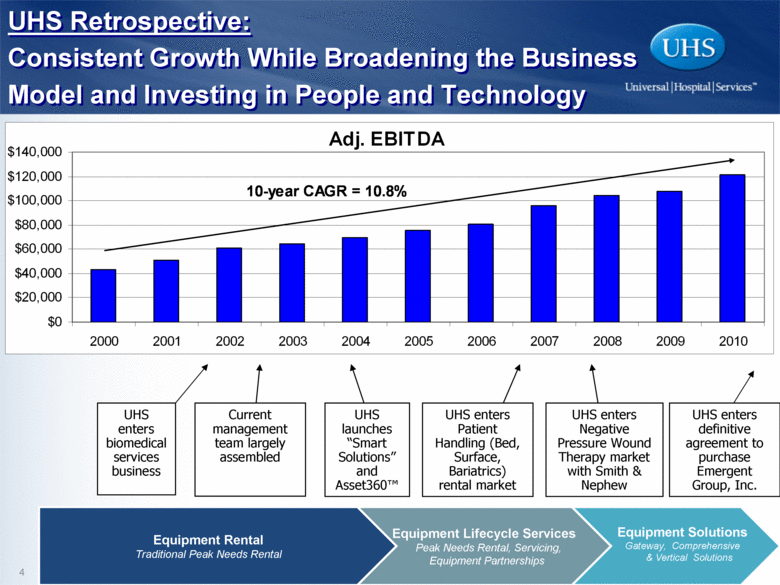
Current management team largely assembled UHS launches “Smart Solutions” and Asset360™ UHS enters Patient Handling (Bed, Surface, Bariatrics) rental market UHS enters Negative Pressure Wound Therapy market with Smith & Nephew UHS enters biomedical services business Equipment Rental Traditional Peak Needs Rental Equipment Lifecycle Services Peak Needs Rental, Servicing, Equipment Partnerships UHS enters definitive agreement to purchase Emergent Group, Inc. Equipment Solutions Gateway, Comprehensive & Vertical Solutions UHS Retrospective: Consistent Growth While Broadening the Business Model and Investing in People and Technology Adj. EBITDA $0 $20,000 $40,000 $60,000 $80,000 $100,000 $120,000 $140,000 2000 2001 2002 2003 2004 2005 2006 2007 2008 2009 2010 10-year CAGR = 10.8% |
|
|
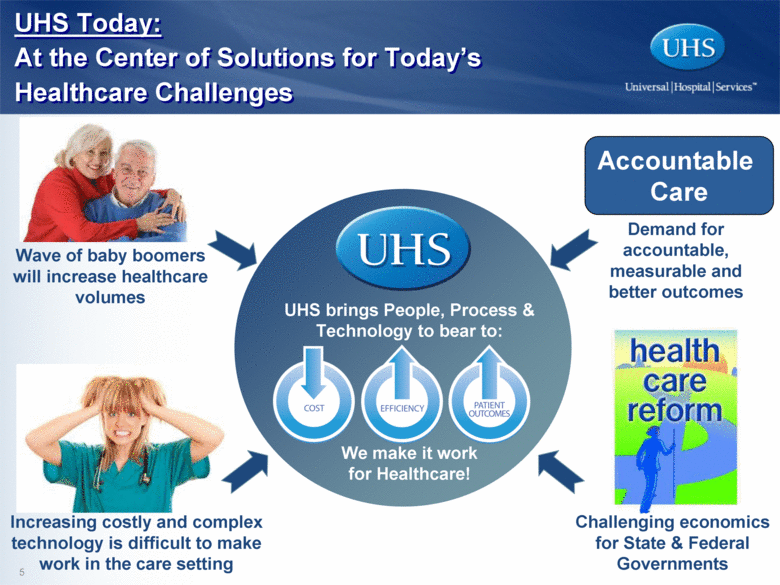
Wave of baby boomers will increase healthcare volumes Challenging economics for State & Federal Governments Increasing costly and complex technology is difficult to make work in the care setting We make it work for Healthcare! Demand for accountable, measurable and better outcomes Accountable Care UHS brings People, Process & Technology to bear to: UHS Today: At the Center of Solutions for Today’s Healthcare Challenges |
|
|
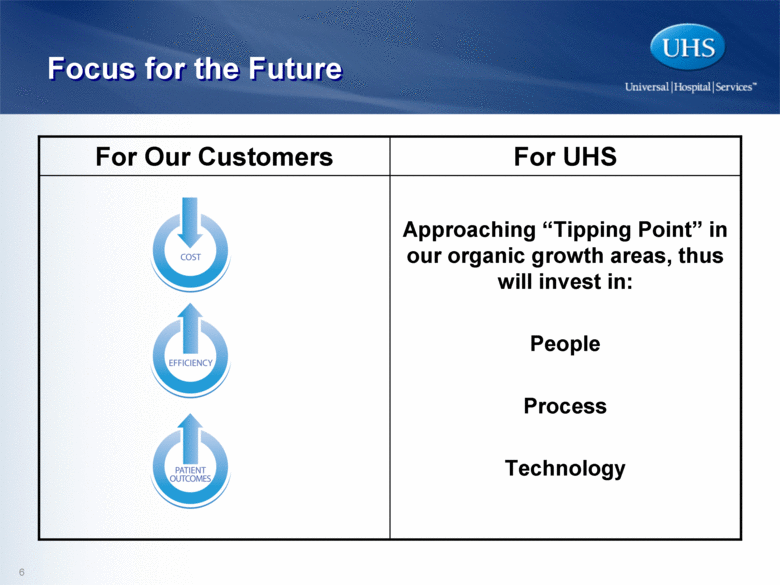
Focus for the Future Approaching “Tipping Point” in our organic growth areas, thus will invest in: People Process Technology For UHS For Our Customers |
|
|
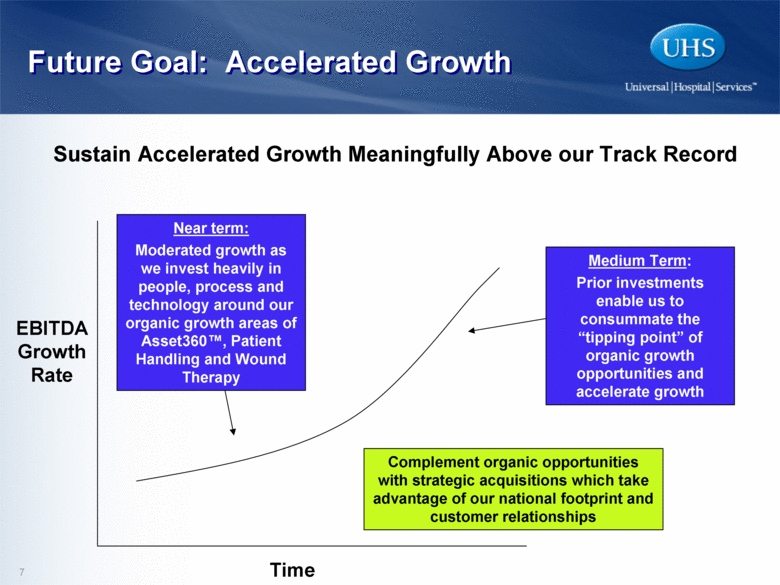
Future Goal: Accelerated Growth Sustain Accelerated Growth Meaningfully Above our Track Record EBITDA Growth Rate Time Near term: Moderated growth as we invest heavily in people, process and technology around our organic growth areas of Asset360™, Patient Handling and Wound Therapy Medium Term: Prior investments enable us to consummate the “tipping point” of organic growth opportunities and accelerate growth Complement organic opportunities with strategic acquisitions which take advantage of our national footprint and customer relationships |
|
|
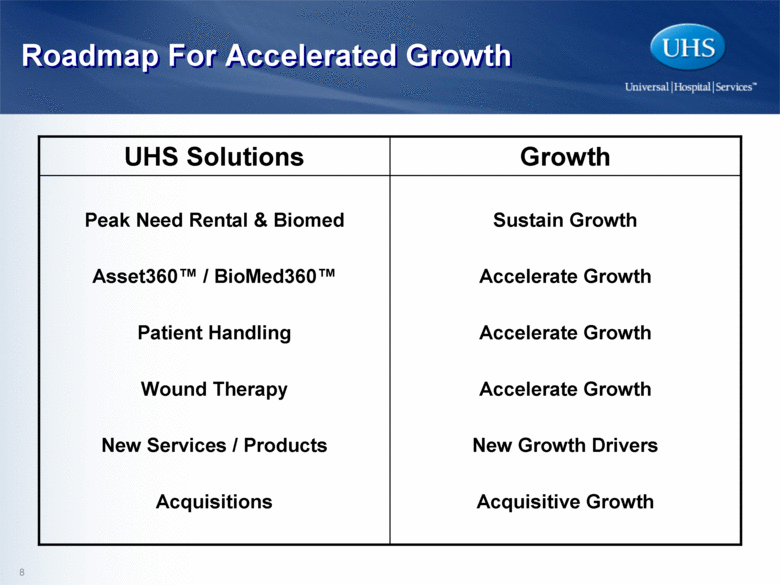
Roadmap For Accelerated Growth Sustain Growth Accelerate Growth Accelerate Growth Accelerate Growth New Growth Drivers Acquisitive Growth Peak Need Rental & Biomed Asset360™ / BioMed360™ Patient Handling Wound Therapy New Services / Products Acquisitions Growth UHS Solutions |
|
|
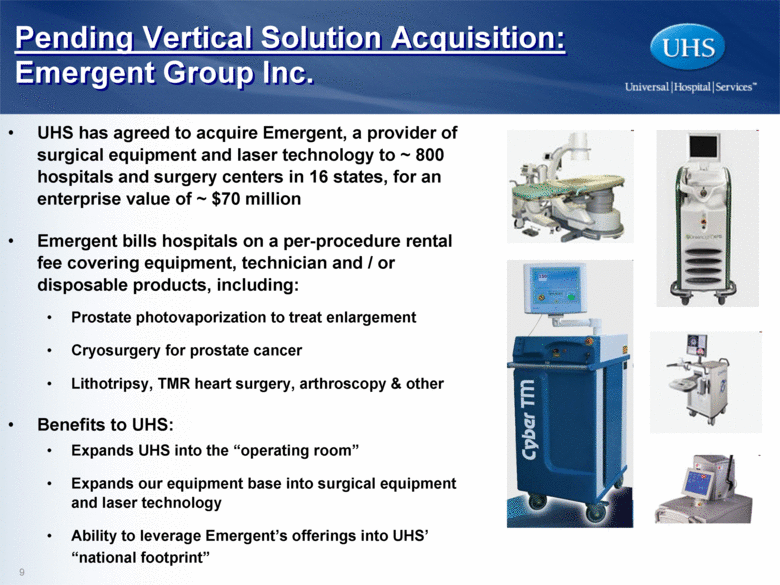
UHS has agreed to acquire Emergent, a provider of surgical equipment and laser technology to ~ 800 hospitals and surgery centers in 16 states, for an enterprise value of ~ $70 million Emergent bills hospitals on a per-procedure rental fee covering equipment, technician and / or disposable products, including: Prostate photovaporization to treat enlargement Cryosurgery for prostate cancer Lithotripsy, TMR heart surgery, arthroscopy & other Benefits to UHS: Expands UHS into the “operating room” Expands our equipment base into surgical equipment and laser technology Ability to leverage Emergent’s offerings into UHS’ “national footprint” Pending Vertical Solution Acquisition: Emergent Group Inc. |
|
|
Financial Review 4th Quarter 2010 and Full Year 2010 |
|
|
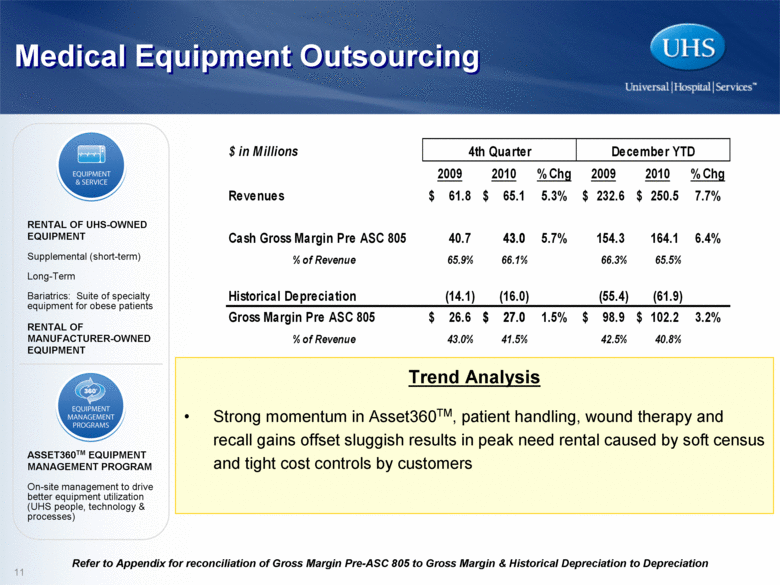
Refer to Appendix for reconciliation of Gross Margin Pre-ASC 805 to Gross Margin & Historical Depreciation to Depreciation Medical Equipment Outsourcing RENTAL OF UHS-OWNED EQUIPMENT Supplemental (short-term) Long-Term Bariatrics: Suite of specialty equipment for obese patients RENTAL OF MANUFACTURER-OWNED EQUIPMENT ASSET360TM EQUIPMENT MANAGEMENT PROGRAM On-site management to drive better equipment utilization (UHS people, technology & processes) Trend Analysis Strong momentum in Asset360TM, patient handling, wound therapy and recall gains offset sluggish results in peak need rental caused by soft census and tight cost controls by customers $ in Millions 2009 2010 % Chg 2009 2010 % Chg Revenues 61.8 $ 65.1 $ 5.3% 232.6 $ 250.5 $ 7.7% Cash Gross Margin Pre ASC 805 40.7 43.0 5.7% 154.3 164.1 6.4% % of Revenue 65.9% 66.1% 66.3% 65.5% Historical Depreciation (14.1) (16.0) (55.4) (61.9) Gross Margin Pre ASC 805 26.6 $ 27.0 $ 1.5% 98.9 $ 102.2 $ 3.2% % of Revenue 43.0% 41.5% 42.5% 40.8% December YTD 4th Quarter |
|
|
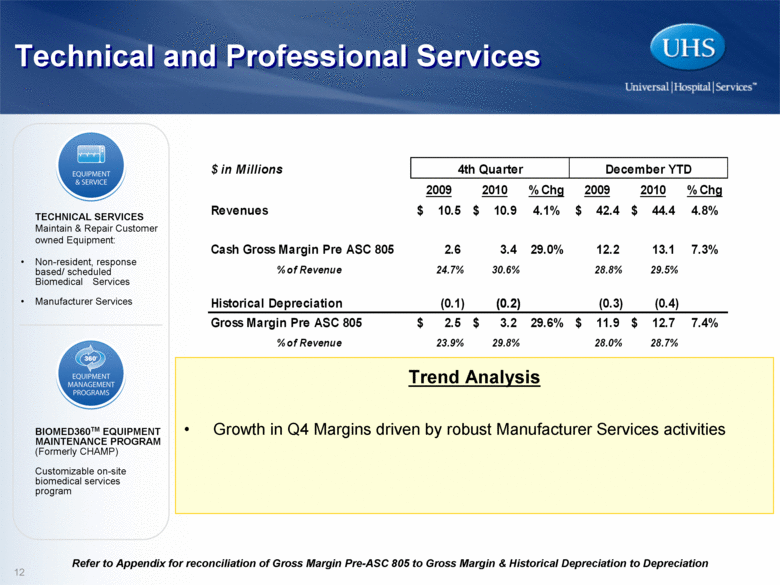
Technical and Professional Services TECHNICAL SERVICES Maintain & Repair Customer owned Equipment: Non-resident, response based/ scheduled Biomedical Services Manufacturer Services BIOMED360TM EQUIPMENT MAINTENANCE PROGRAM (Formerly CHAMP) Customizable on-site biomedical services program Trend Analysis Growth in Q4 Margins driven by robust Manufacturer Services activities Refer to Appendix for reconciliation of Gross Margin Pre-ASC 805 to Gross Margin & Historical Depreciation to Depreciation $ in Millions 2009 2010 % Chg 2009 2010 % Chg Revenues 10.5 $ 10.9 $ 4.1% 42.4 $ 44.4 $ 4.8% Cash Gross Margin Pre ASC 805 2.6 3.4 29.0% 12.2 13.1 7.3% % of Revenue 24.7% 30.6% 28.8% 29.5% Historical Depreciation (0.1) (0.2) (0.3) (0.4) Gross Margin Pre ASC 805 2.5 $ 3.2 $ 29.6% 11.9 $ 12.7 $ 7.4% % of Revenue 23.9% 29.8% 28.0% 28.7% 4th Quarter December YTD |
|
|
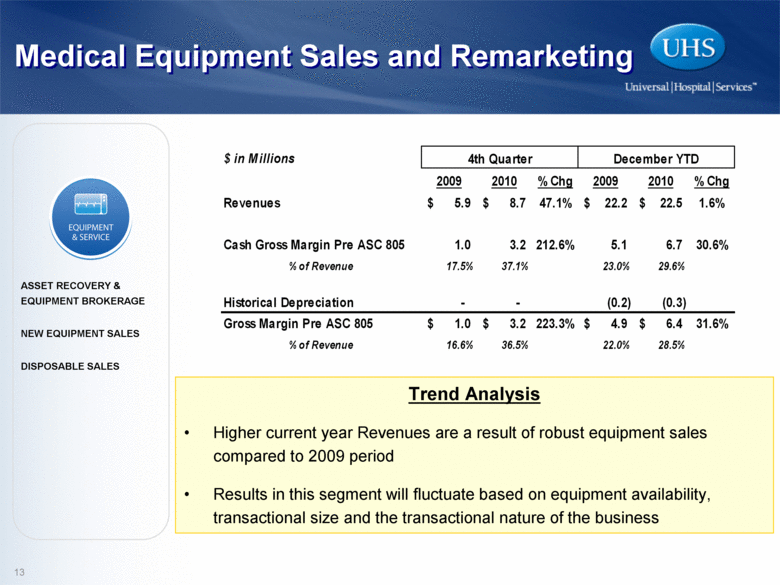
Medical Equipment Sales and Remarketing ASSET RECOVERY & EQUIPMENT BROKERAGE NEW EQUIPMENT SALES DISPOSABLE SALES Trend Analysis Higher current year Revenues are a result of robust equipment sales compared to 2009 period Results in this segment will fluctuate based on equipment availability, transactional size and the transactional nature of the business $ in Millions 2009 2010 % Chg 2009 2010 % Chg Revenues 5.9 $ 8.7 $ 47.1% 22.2 $ 22.5 $ 1.6% Cash Gross Margin Pre ASC 805 1.0 3.2 212.6% 5.1 6.7 30.6% % of Revenue 17.5% 37.1% 23.0% 29.6% Historical Depreciation --(0.2) (0.3) Gross Margin Pre ASC 805 1.0 $ 3.2 $ 223.3% 4.9 $ 6.4 $ 31.6% % of Revenue 16.6% 36.5% 22.0% 28.5% 4th Quarter December YTD |
|
|
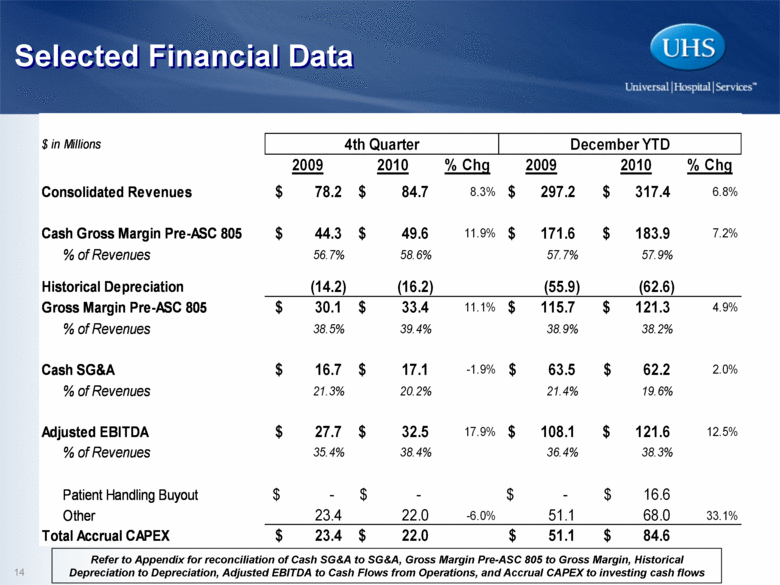
Selected Financial Data Refer to Appendix for reconciliation of Cash SG&A to SG&A, Gross Margin Pre-ASC 805 to Gross Margin, Historical Depreciation to Depreciation, Adjusted EBITDA to Cash Flows from Operations, and Accrual CAPEX to investing cash flows $ in Millions 2009 2010 % Chg 2009 2010 % Chg Consolidated Revenues 78.2 $ 84.7 $ 8.3% 297.2 $ 317.4 $ 6.8% Cash Gross Margin Pre-ASC 805 44.3 $ 49.6 $ 11.9% 171.6 $ 183.9 $ 7.2% % of Revenues 56.7% 58.6% 57.7% 57.9% Historical Depreciation (14.2) (16.2) (55.9) (62.6) Gross Margin Pre-ASC 805 30.1 $ 33.4 $ 11.1% 115.7 $ 121.3 $ 4.9% % of Revenues 38.5% 39.4% 38.9% 38.2% Cash SG&A 16.7 $ 17.1 $ -1.9% 63.5 $ 62.2 $ 2.0% % of Revenues 21.3% 20.2% 21.4% 19.6% Adjusted EBITDA 27.7 $ 32.5 $ 17.9% 108.1 $ 121.6 $ 12.5% % of Revenues 35.4% 38.4% 36.4% 38.3% Patient Handling Buyout -$ -$ -$ 16.6 $ Other 23.4 22.0 -6.0% 51.1 68.0 33.1% Total Accrual CAPEX 23.4 $ 22.0 $ 51.1 $ 84.6 $ 4th Quarter December YTD |
|
|
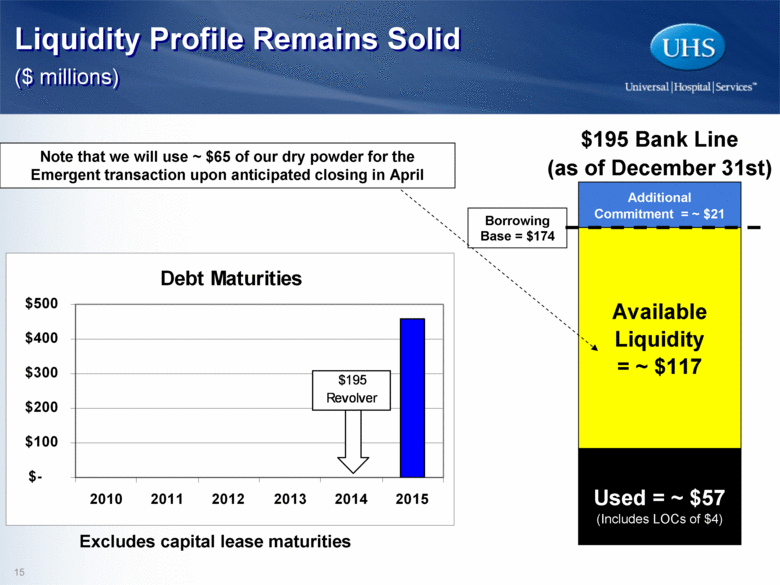
Additional Commitment = ~ $21 $195 Bank Line (as of December 31st) Available Liquidity = ~ $117 Used = ~ $57 Liquidity Profile Remains Solid ($ millions) Borrowing Base = $174 (Includes LOCs of $4) Excludes capital lease maturities Note that we will use ~ $65 of our dry powder for the Emergent transaction upon anticipated closing in April Debt Maturities $- $100 $200 $300 $400 $500 2010 2011 2012 2013 2014 2015 $195 Revolver |
|
|
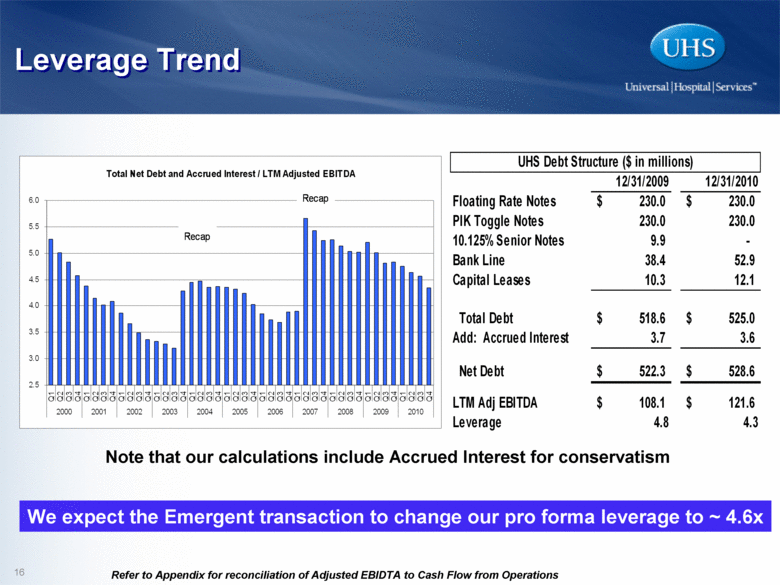
Leverage Trend Refer to Appendix for reconciliation of Adjusted EBIDTA to Cash Flow from Operations Note that our calculations include Accrued Interest for conservatism We expect the Emergent transaction to change our pro forma leverage to ~ 4.6x UHS Debt Structure ($ in millions) 12/31/2009 12/31/2010 Floating Rate Notes $ 230.0 $ 230.0 PIK Toggle Notes 230.0 230.0 10.125% Senior Notes 9.9 - Bank Line 38.4 52.9 Capital Leases 10.3 12.1 Total Debt $ 518.6 $ 525.0 Add: Accrued Interest 3.7 3.6 Net Debt $ 522.3 $ 528.6 LTM Adj EBITDA $ 108.1 $ 121.6 Leverage 4.8 4.3 |
|
|
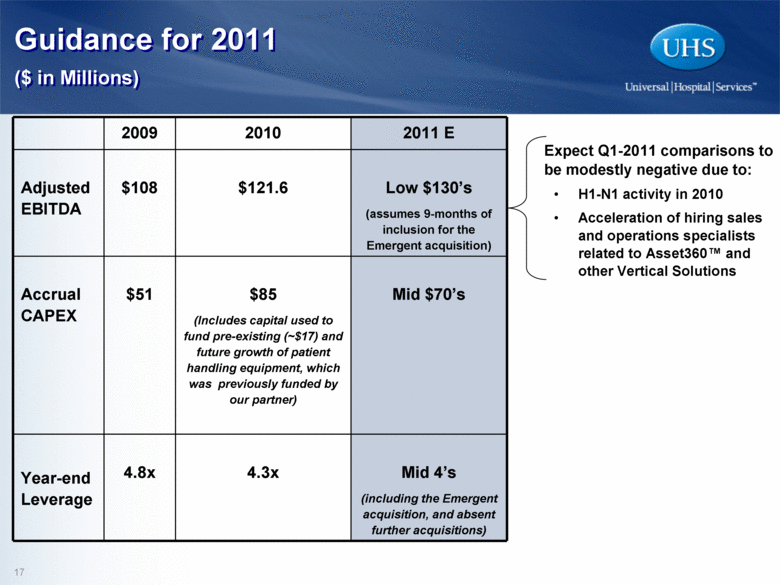
4.3x $85 (Includes capital used to fund pre-existing (~$17) and future growth of patient handling equipment, which was previously funded by our partner) $121.6 2010 2009 2011 E Adjusted EBITDA $108 Low $130’s (assumes 9-months of inclusion for the Emergent acquisition) Accrual CAPEX $51 Mid $70’s Year-end Leverage 4.8x Mid 4’s (including the Emergent acquisition, and absent further acquisitions) Guidance for 2011 ($ in Millions) Expect Q1-2011 comparisons to be modestly negative due to: H1-N1 activity in 2010 Acceleration of hiring sales and operations specialists related to Asset360™ and other Vertical Solutions |
|
|
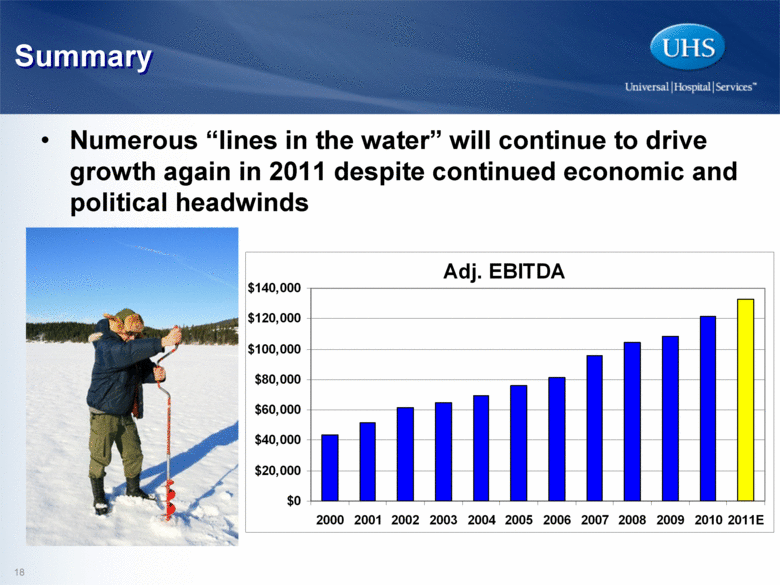
Numerous “lines in the water” will continue to drive growth again in 2011 despite continued economic and political headwinds Summary Adj. EBITDA $0 $20,000 $40,000 $60,000 $80,000 $100,000 $120,000 $140,000 2000 2001 2002 2003 2004 2005 2006 2007 2008 2009 2010 2011E |
|
|
Selected Reconciliations EBITDA Reconciliation: 2009 & 2010 EBITDA Reconciliation: 1998 – 2010 Depreciation and Amortization Reconciliation Other Reconciliations Appendix |
|
|
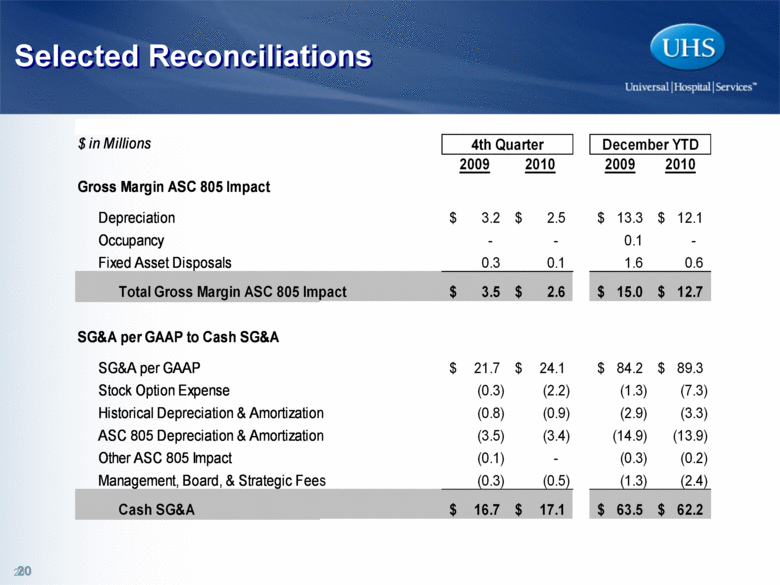
Selected Reconciliations 20 $ in Millions 4th Quarter December YTD 2009 2010 2009 2010 Gross Margin ASC 805 Impact Depreciation 3.2 $ 2.5 $ 13.3 $ 12.1 $ Occupancy - - 0.1 - Fixed Asset Disposals 0.3 0.1 1.6 0.6 Total Gross Margin ASC 805 Impact 3.5 $ 2.6 $ 15.0 $ 12.7 $ SG&A per GAAP to Cash SG&A SG&A per GAAP 21.7 $ 24.1 $ 84.2 $ 89.3 $ Stock Option Expense (0.3) (2.2) (1.3) (7.3) Historical Depreciation & Amortization (0.8) (0.9) (2.9) (3.3) ASC 805 Depreciation & Amortization (3.5) (3.4) (14.9) (13.9) Other ASC 805 Impact (0.1) - (0.3) (0.2) Management, Board, & Strategic Fees (0.3) (0.5) (1.3) (2.4) Cash SG&A 16.7 $ 17.1 $ 63.5 $ 62.2 $ |
|
|
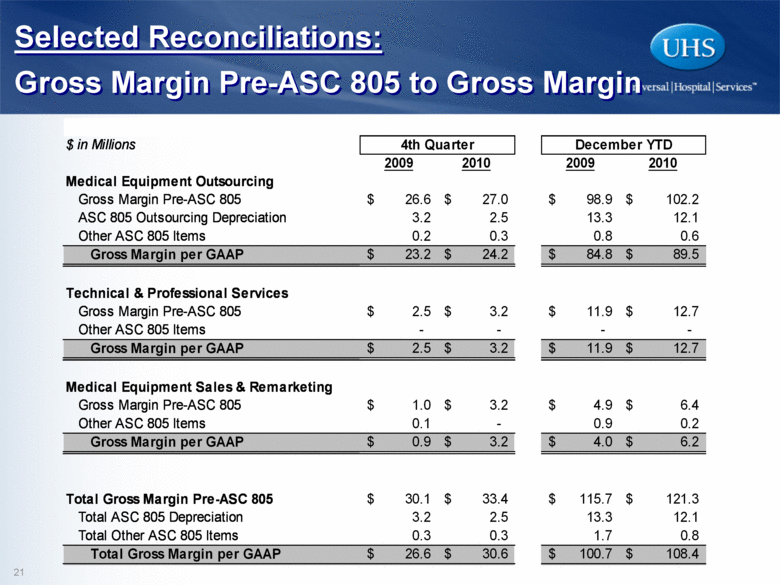
Selected Reconciliations: Gross Margin Pre-ASC 805 to Gross Margin $ in Millions 4th Quarter 2009 2010 2009 2010 Medical Equipment Outsourcing Gross Margin Pre-ASC 805 26.6 $ 27.0 $ 98.9 $ 102.2 $ ASC 805 Outsourcing Depreciation 3.2 2.5 13.3 12.1 Other ASC 805 Items 0.2 0.3 0.8 0.6 Gross Margin per GAAP 23.2 $ 24.2 $ 84.8 $ 89.5 $ Technical & Professional Services Gross Margin Pre-ASC 805 2.5 $ 3.2 $ 11.9 $ 12.7 $ Other ASC 805 Items - - - - Gross Margin per GAAP 2.5 $ 3.2 $ 11.9 $ 12.7 $ Medical Equipment Sales & Remarketing Gross Margin Pre-ASC 805 1.0 $ 3.2 $ 4.9 $ 6.4 $ Other ASC 805 Items 0.1 - 0.9 0.2 Gross Margin per GAAP 0.9 $ 3.2 $ 4.0 $ 6.2 $ Total Gross Margin Pre-ASC 805 30.1 $ 33.4 $ 115.7 $ 121.3 $ Total ASC 805 Depreciation 3.2 2.5 13.3 12.1 Total Other ASC 805 Items 0.3 0.3 1.7 0.8 Total Gross Margin per GAAP 26.6 $ 30.6 $ 100.7 $ 108.4 $ December YTD |
|
|
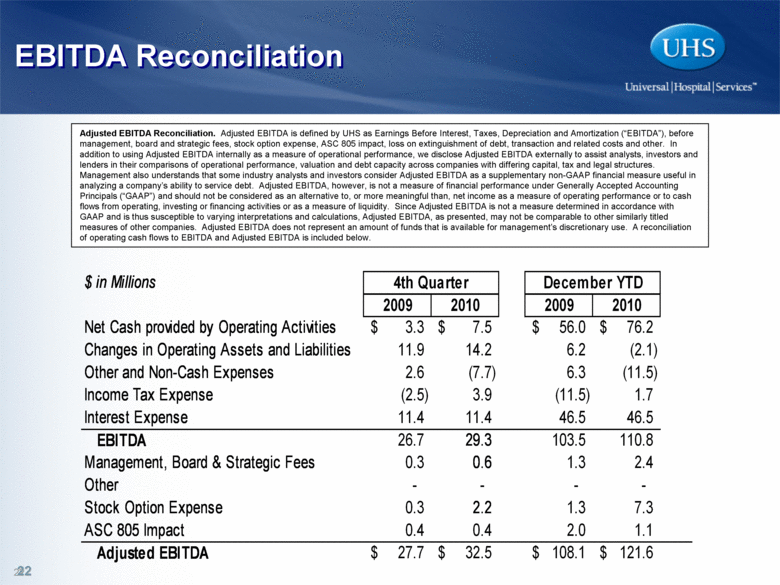
EBITDA Reconciliation Adjusted EBITDA Reconciliation. Adjusted EBITDA is defined by UHS as Earnings Before Interest, Taxes, Depreciation and Amortization (“EBITDA”), before management, board and strategic fees, stock option expense, ASC 805 impact, loss on extinguishment of debt, transaction and related costs and other. In addition to using Adjusted EBITDA internally as a measure of operational performance, we disclose Adjusted EBITDA externally to assist analysts, investors and lenders in their comparisons of operational performance, valuation and debt capacity across companies with differing capital, tax and legal structures. Management also understands that some industry analysts and investors consider Adjusted EBITDA as a supplementary non-GAAP financial measure useful in analyzing a company’s ability to service debt. Adjusted EBITDA, however, is not a measure of financial performance under Generally Accepted Accounting Principals (“GAAP”) and should not be considered as an alternative to, or more meaningful than, net income as a measure of operating performance or to cash flows from operating, investing or financing activities or as a measure of liquidity. Since Adjusted EBITDA is not a measure determined in accordance with GAAP and is thus susceptible to varying interpretations and calculations, Adjusted EBITDA, as presented, may not be comparable to other similarly titled measures of other companies. Adjusted EBITDA does not represent an amount of funds that is available for management’s discretionary use. A reconciliation of operating cash flows to EBITDA and Adjusted EBITDA is included below. 22 $ in Millions 4th Quarter 2009 2010 2009 2010 Net Cash provided by Operating Activities 3.3 $ 7.5 $ 56.0 $ 76.2 $ Changes in Operating Assets and Liabilities 11.9 14.2 6.2 (2.1) Other and Non-Cash Expenses 2.6 (7.7) 6.3 (11.5) Income Tax Expense (2.5) 3.9 (11.5) 1.7 Interest Expense 11.4 11.4 46.5 46.5 EBITDA 26.7 29.3 103.5 110.8 Management, Board & Strategic Fees 0.3 0.6 1.3 2.4 Other - - - - Stock Option Expense 0.3 2.2 1.3 7.3 ASC 805 Impact 0.4 0.4 2.0 1.1 Adjusted EBITDA 27.7 $ 32.5 $ 108.1 $ 121.6 $ December YTD |
|
|
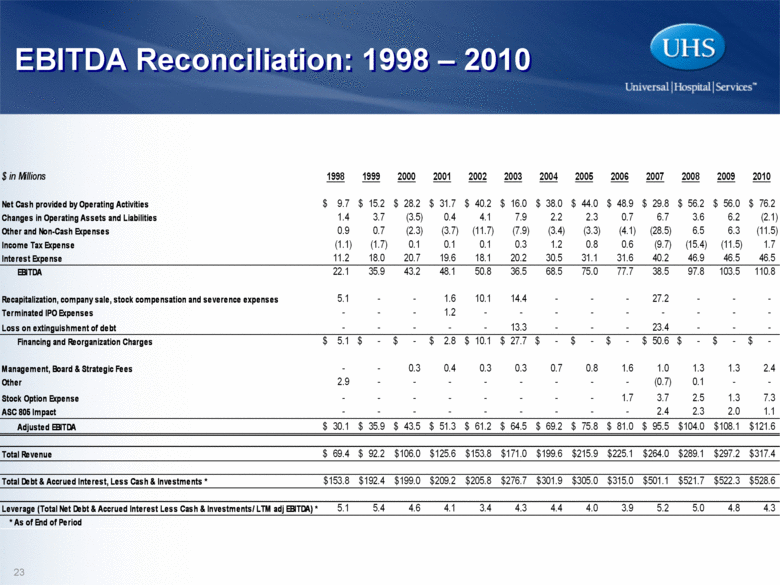
EBITDA Reconciliation: 1998 – 2010 $ in Millions 1998 1999 2000 2001 2002 2003 2004 2005 2006 2007 2008 2009 2010 Net Cash provided by Operating Activities 9.7 $ $ 15.2 $ 28.2 $ 31.7 $ 40.2 $ 16.0 $ 38.0 $ 44.0 $ 48.9 $ 29.8 $ 56.2 $ 56.0 $ 76.2 Changes in Operating Assets and Liabilities Other and Non-Cash Expenses 1.4 0.9 3.7 0.7 (3.5) (2.3) 0.4 (3.7) 4.1 (11.7) 7.9 (7.9) 2.2 (3.4) 2.3 (3.3) 0.7 (4.1) 6.7 (28.5) 3.6 6.5 6.2 6.3 (2.1) (11.5) Income Tax Expense Interest Expense (1.1) 11.2 (1.7) 18.0 0.1 20.7 0.1 19.6 0.1 18.1 0.3 20.2 1.2 30.5 0.8 31.1 0.6 31.6 (9.7) 40.2 (15.4) 46.9 (11.5) 46.5 1.7 46.5 EBITDA 22.1 35.9 43.2 48.1 50.8 36.5 68.5 75.0 77.7 38.5 97.8 103.5 110.8 Recapitalization, company sale, stock compensation and severence expenses Terminated IPO Expenses 5.1 - - - - - 1.6 1.2 10.1 - 14.4 - - - - - - - 27.2 - - - - - - - Loss on extinguishment of debt - - - - - 13.3 - - - 23.4 - - - Financing and Reorganization Charges 5.1 $ -$ -$ 2.8 $ $ 10.1 $ 27.7 -$ -$ -$ $ 50.6 -$ -$ -$ Management, Board & Strategic Fees Other 2.9 - - 0.3 - 0.4 - 0.3 - 0.3 - 0.7 - 0.8 - 1.6 - 1.0 (0.7) 1.3 0.1 1.3 - 2.4 - Stock Option Expense - - - - - - - - 1.7 3.7 2.5 1.3 7.3 ASC 805 Impact - - - - - - - - - 2.4 2.3 2.0 1.1 Adjusted EBITDA $ 30.1 $ 35.9 $ 43.5 $ 51.3 $ 61.2 $ 64.5 $ 69.2 $ 75.8 $ 81.0 $ 95.5 $104.0 $108.1 $121.6 Total Revenue $ 69.4 $ 92.2 $106.0 $125.6 $153.8 $171.0 $199.6 $215.9 $225.1 $264.0 $289.1 $297.2 $317.4 Total Debt & Accrued Interest, Less Cash & Investments * $153.8 $192.4 $199.0 $209.2 $205.8 $276.7 $301.9 $305.0 $315.0 $501.1 $521.7 $522.3 $528.6 Leverage (Total Net Debt & Accrued Interest Less Cash & Investments/ LTM adj EBITDA) * 5.1 5.4 4.6 4.1 3.4 4.3 4.4 4.0 3.9 5.2 5.0 4.8 4.3 * As of End of Period |
|
|
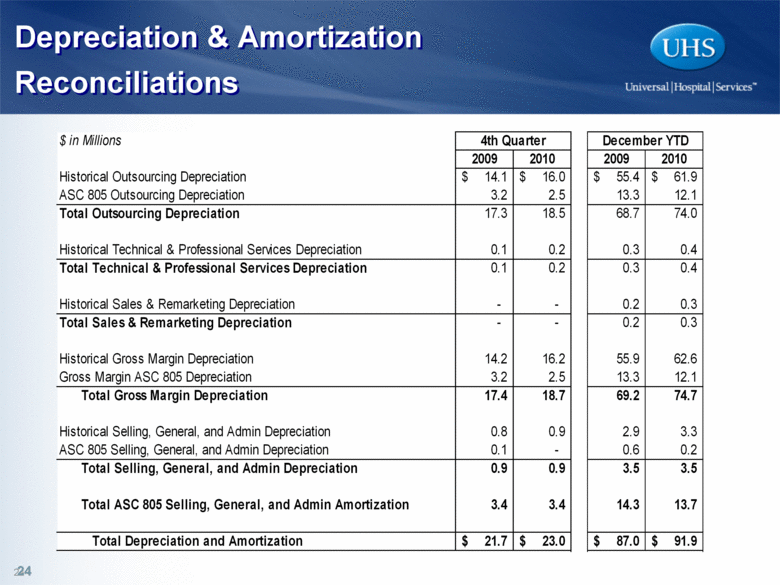
Depreciation & Amortization Reconciliations 24 $ in Millions 4th Quarter December YTD 2009 2010 2009 2010 Historical Outsourcing Depreciation 14.1 $ 16.0 $ 55.4 $ $ 61.9 ASC 805 Outsourcing Depreciation 3.2 2.5 13.3 12.1 Total Outsourcing Depreciation 17.3 18.5 68.7 74.0 Historical Technical & Professional Services Depreciation 0.1 0.2 0.3 0.4 Total Technical & Professional Services Depreciation 0.1 0.2 0.3 0.4 Historical Sales & Remarketing Depreciation - - 0.2 0.3 Total Sales & Remarketing Depreciation - - 0.2 0.3 Historical Gross Margin Depreciation 14.2 16.2 55.9 62.6 Gross Margin ASC 805 Depreciation 3.2 2.5 13.3 12.1 Total Gross Margin Depreciation 17.4 18.7 69.2 74.7 Historical Selling, General, and Admin Depreciation 0.8 0.9 2.9 3.3 ASC 805 Selling, General, and Admin Depreciation 0.1 - 0.6 0.2 Total Selling, General, and Admin Depreciation 0.9 0.9 3.5 3.5 Total ASC 805 Selling, General, and Admin Amortization 3.4 3.4 14.3 13.7 Total Depreciation and Amortization 21.7 $ 23.0 $ 87.0 $ $ 91.9 |
|
|
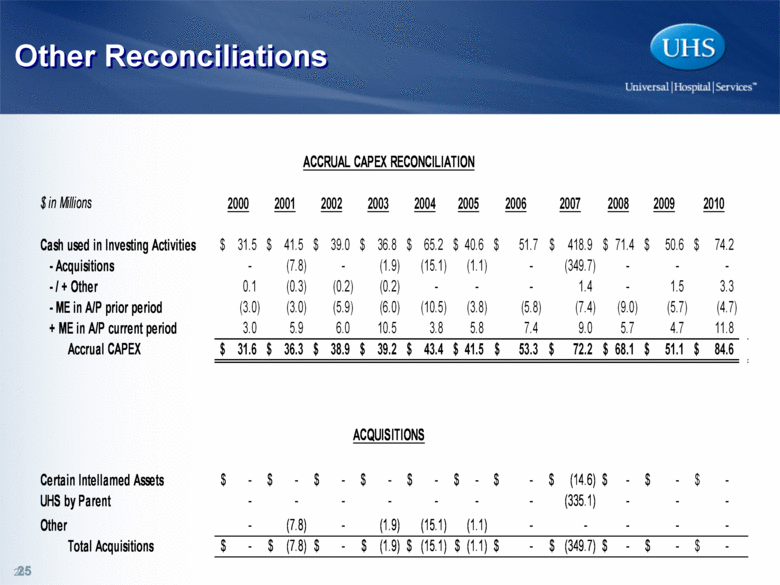
Other Reconciliations 25 $ in Millions 2000 2001 2002 2003 2004 2005 2006 2007 2008 2009 2010 Cash used in Investing Activities 31.5 $ 41.5 $ 39.0 $ 36.8 $ 65.2 $ $ 40.6 51.7 $ 418.9 $ $ 71.4 50.6 $ 74.2 $ -Acquisitions - (7.8) - (1.9) (15.1) (1.1) - (349.7) - - - -/+ Other 0.1 (0.3) (0.2) (0.2) - - -1.4 -1.5 3.3 -ME in A/P prior period (3.0) (3.0) (5.9) (6.0) (10.5) (3.8) (5.8) (7.4) (9.0) (5.7) (4.7) +ME in A/P current period 3.0 5.9 6.0 10.5 3.8 5.8 7.4 9.0 5.7 4.7 11.8 Accrual CAPEX 31.6 $ 36.3 $ 38.9 $ 39.2 $ 43.4 $ $ 41.5 53.3 $ 72.2 $ $ 68.1 51.1 $ 84.6 $ Certain Intellamed Assets -$ -$ -$ -$ -$ -$ -$ (14.6)$ -$ -$ -$ UHS by Parent - - - - - - - (335.1) - - - Other -(7.8) - (1.9) (15.1) (1.1) - - - - -Total Acquisitions -$ (7.8)$ -$ (1.9)$ (15.1) $ (1.1)$ -$ (349.7) $ -$ -$ -$ ACCRUAL CAPEX RECONCILIATION ACQUISITIONS |