Attached files
| file | filename |
|---|---|
| 8-K - FORM 8K - CNB FINANCIAL CORP/PA | d8k.htm |
 Financial Highlights
Year Ended December 31, 2010
NASDAQ: CCNE
March 4, 2011
Exhibit 99.1 |
 Forward-Looking Statements
This
presentation
includes
forward-looking
statements
within
the
meaning
of
Section
27A
of
the
Securities
Act
of
1933,
as
amended,
and
Section
21E
of
the
Securities
Exchange
Act
of
1934,
as
amended,
with
respect
to
the
financial
condition,
liquidity,
results
of
operations,
future
performance
and
business
of
CNB
Financial
Corporation.
These
forward-looking
statements
are
intended
to
be
covered
by
the
safe
harbor
for
“forward-looking
statements”
provided
by
the
Private
Securities
Litigation
Reform
Act
of
1995.
Forward-
looking
statements
are
those
that
are
not
historical
facts.
Forward-looking
statements
include
statements
with
respect
to
beliefs,
plans,
objectives,
goals,
expectations,
anticipations,
estimates
and
intentions
that
are
subject
to
significant
risks
and
uncertainties
and
are
subject
to
change
based
on
various
factors
(some
of
which
are
beyond
our
control).
Forward-looking
statements
often
include
the
words
“believes,”
“expects,”
“anticipates,”
“estimates,”
“forecasts,”
“intends,”
“plans,”
“targets,”
“potentially,”
“probably,”
“projects,”
“outlook”
or
similar
expressions
or
future
conditional
verbs
such
as
“may,”
“will,”
“should,”
“would”
and
“could.”
Such
known
and
unknown
risks,
uncertainties
and
other
factors
that
could
cause
the
actual
results
to
differ
materially
from
the
statements,
include,
but
are
not
limited
to:
(i)
changes
in
general
business,
industry
or
economic
conditions
or
competition;
(ii)
changes
in
any
applicable
law,
rule,
regulation,
policy,
guideline
or
practice
governing
or
affecting
financial
holding
companies
and
their
subsidiaries
or
with
respect
to
tax
or
accounting
principals
or
otherwise;
(iii)
adverse
changes
or
conditions
in
capital
and
financial
markets;
(iv)
changes
in
interest
rates;
(v)
changes
in
the
quality
or
composition
of
our
loan
and
investment
portfolios;
(vi)
adequacy
of
loan
loss
reserves;
(vii)
increased
competition;
(viii)
loss
of
certain
key
officers;
(ix)
continued
relationships
with
major
customers;
(x)
deposit
attrition;
(xi)
rapidly
changing
technology;
(xii)
unanticipated
regulatory
or
judicial
proceedings
and
liabilities
and
other
costs;
(xiii)
changes
in
the
cost
of
funds,
demand
for
loan
products
or
demand
for
financial
services;
and
(xiv)
other
economic,
competitive,
governmental
or
technological
factors
affecting
our
operations,
markets,
products,
services
and
prices.
Such
developments
could
have
an
adverse
impact
on
our
financial
position
and our results of operations.
The
forward-looking
statements
are
based
upon
management’s
beliefs
and
assumptions.
Any
forward-
looking
statement
made
herein
speaks
only
as
of
the
date
on
which
it
is
made.
Factors
or
events
that
could
cause
the
our
actual
results
to
differ
may
emerge
from
time
to
time,
and
it
is
not
possible
for
us
to
predict
all
of
them.
We
undertake
no
obligation
to
publicly
update
any
forward-looking
statement,
whether
as
a
result
of
new
information,
future
developments
or
otherwise,
except
as
may
be
required
by
law.
2 |
 Balance Sheet
•
Deposits of $1.163 billion, growth of 22% over December 31, 2009
–
Transaction, money market and savings deposits equal 68% of total
•
Loans of $795 million, growth of 11% over December 31, 2009
Profitability
•
Net income of $11.3 million, or $1.06 per share
•
Return on assets of 0.87% and return on equity of 11.6%
•
Net interest margin of 3.71%, net of prepayment penalty of $707 thousand
Asset Quality
•
Ratio of NPAs
/ Loans + OREO of 1.66%
•
Net charge-offs to average loans of 0.56%
•
Allowance for loan losses to loans of 1.36%
Capital
•
Tangible common equity to tangible assets of 7.1%*
•
Leverage ratio of 8.8%
•
Tier 1 Risk Based Ratio of 14.1%
•
Total Risk Based Capital Ratio of 15.4%
2010 Highlights
3
Note: Financial data as of or for the year ended December 31, 2010.
* Please see the Appendix for a reconciliation of non-GAAP financial
information. |
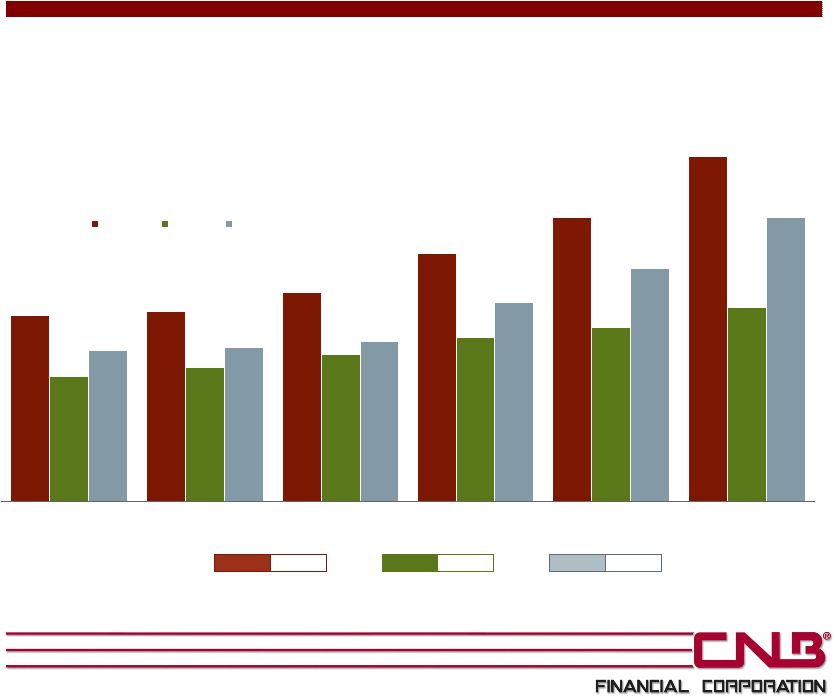 Balance Sheet Growth
$ in millions
* Compound annual growth rate from 2005-2010.
4
Average Annual Increase: *
Assets
13%
Loans
8%
Deposits
13%
$764
$781
$859
$1,017
$1,162
$511
$547
$600
$672
$715
$795
$619
$631
$659
$815
$957
$1,163
2005
2006
2007
2008
2009
2010
Assets
Loans
Deposits
$1,414 |
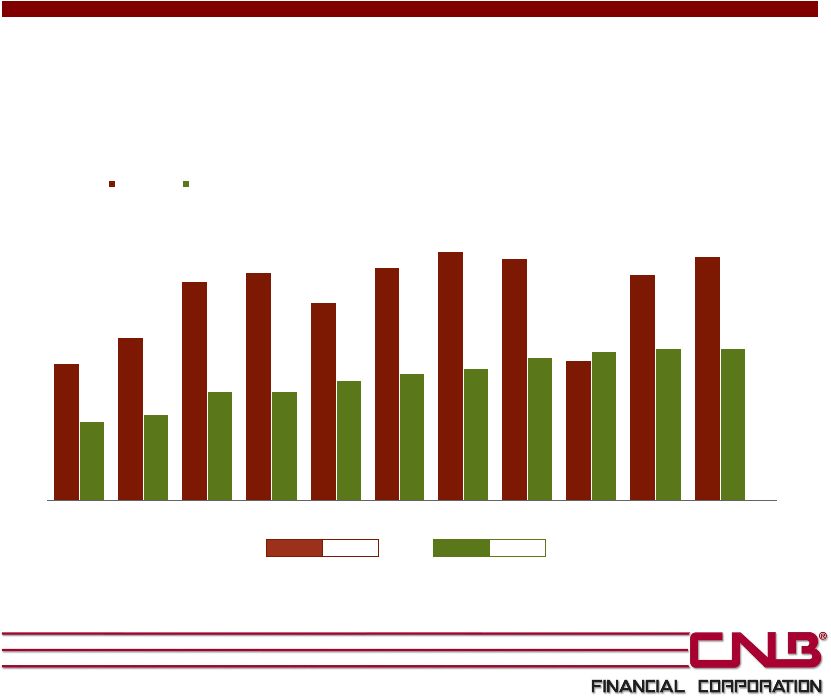 Earnings Per Share & Dividends
* Compound annual growth rate from 2000-2010.
5
Average Annual Increase: *
EPS
6.0%
Div.
6.9%
$0.59
$0.71
$0.95
$0.99
$0.86
$1.01
$1.08
$1.05
$0.61
$0.98
$1.06
$0.34
$0.37
$0.47
$0.47
$0.52
$0.55
$0.57
$0.62
$0.65
$0.66
$0.66
2000
2001
2002
2003
2004
2005
2006
2007
2008
2009
2010
EPS
Dividends |
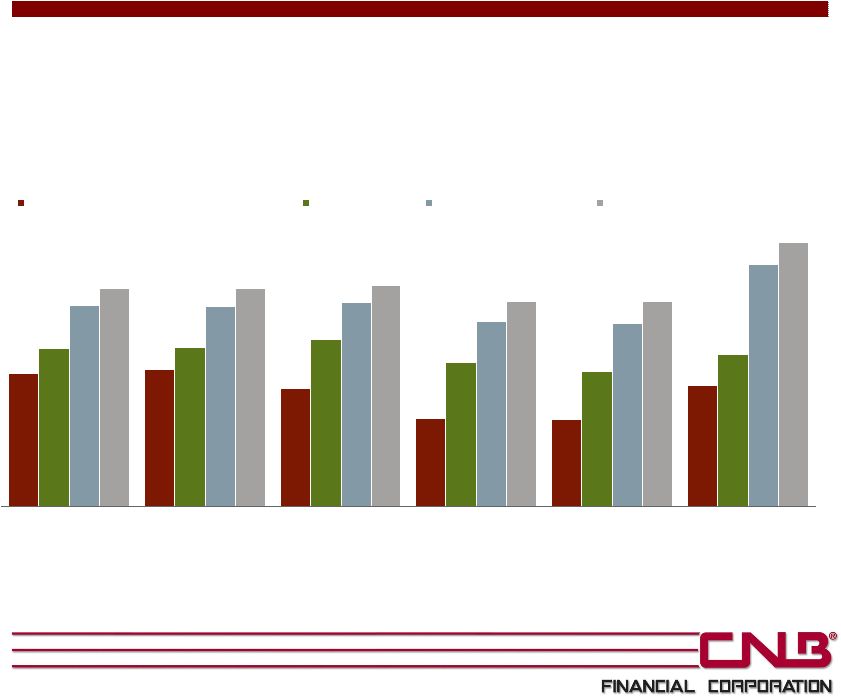 Capital Ratios
6
7.8%
7.9%
6.9%
5.1%
5.1%
7.1%
9.2%
9.2%
9.7%
8.4%
7.9%
8.8%
11.7%
11.7%
11.9%
10.8%
10.7%
14.1%
12.8%
12.8%
12.9%
12.0%
12.0%
15.4%
2005
2006
2007
2008
2009
2010
Tangible Common Equity to Tangible Assets
Leverage Ratio
Tier 1 Risk Based Ratio
Total Risk Based Capital Ratio
*
* Please see the Appendix for a reconciliation of non-GAAP financial
information. |
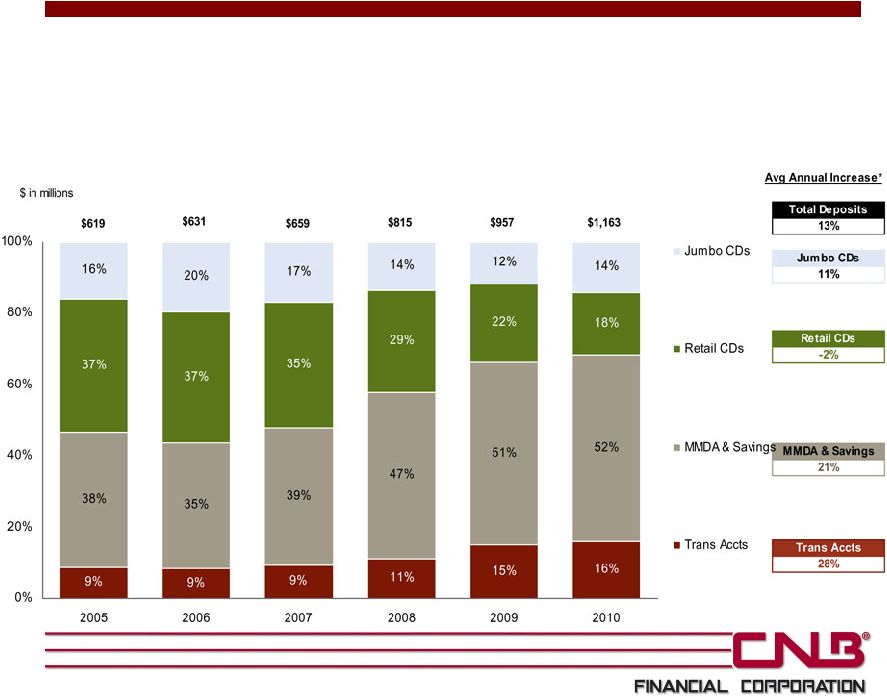 Deposit Composition
7
•
23% annual compound growth since 2005 in transaction, money market and savings
accounts; 2% in CDs •
Interest-bearing deposit cost of 1.42% (or total deposit cost of 1.25%) for the
year ended December 31, 2010 * Compound annual growth rate from
2005-2010. |
 Deposit Demographics
Source: SNL Financial 6/30/10
County
CNB Market
Rank
Number
of
Branches
CNB
Deposits
in Market
($000)
CNB
Market
Share
(%)
Total
Deposits
in Market
($000)
Total
Population
2010
(Actual)
Clearfield
1
11
405,489
29.65
1,367,426
83,248
Erie
6
4
271,572
7.25
3,745,173
279,906
Elk
4
4
105,820
16.16
654,902
32,583
McKean
3
3
87,717
11.77
745,411
43,660
Centre
10
1
65,370
2.93
2,333,913
146,264
Warren
4
1
43,613
4.72
923,841
40,631
Cambria
11
1
42,380
1.59
2,673,207
145,348
Crawford
8
1
41,277
3.68
1,120,484
89,185
Jefferson
6
1
35,155
3.96
888,499
45,343
Total
27
1,098,393
14,452,856
906,168
8 |
 Loan Portfolio Overview
9
30%
29%
29%
31%
31%
34%
26%
26%
27%
27%
27%
27%
38%
39%
36%
34%
33%
33%
6%
5%
8%
9%
8%
7%
0%
20%
40%
60%
80%
100%
2005
2006
2007
2008
2009
2010
Consumer and
other
Commercial,
industrial, and
agricultural
Commercial
mortgage
Residential
mortgage
$511
$547
$600
$672
$715
$795
$ in millions |
 Yield on earning assets, cost of funds and
net interest margin
7.32%
7.11%
5.89%
6.72%
5.23%
3.51%
3.40%
2.07%
2.64%
1.78%
4.17%
4.27%
4.33%
4.00%
3.71%
0%
2%
4%
6%
8%
2006
2007
2008
2009
2010
Yield on earning assets
Cost of funds
Net interest margin (tax equivalent)
10 |
 Asset Quality Summary
11
($ in '000s)
For the Year Ending
12/31/05
12/31/06
12/31/07
12/31/08
12/31/09
12/31/10
Nonaccrual
$1,561
$1,619
$1,979
$3,046
$12,757
$11,926
90+ Days Past Due
462
128
395
533
584
889
Total Non-Performing Loans
2,023
1,747
2,374
3,579
13,341
12,815
Other Real Estate Owned
85
181
516
671
252
396
Total Non-Performing Assets
2,108
1,928
2,890
4,250
13,593
13,211
Non-Performing Loans / Loans
0.40%
0.32%
0.40%
0.53%
1.87%
1.61%
Non-Performing Assets / Loans + OREO
0.41%
0.35%
0.48%
0.63%
1.90%
1.66%
Loan Loss Reserves
$5,603
$6,086
$6,773
$8,719
$9,795
$10,820
Reserves / Loans
1.10%
1.11%
1.13%
1.30%
1.37%
1.36%
Reserves / Non-Performing Loans
277%
348%
285%
244%
73%
84%
Net Charge-Offs (NCOs)
$765
$888
$825
$1,841
$3,389
$4,133
NCOs / Average Loans
0.15%
0.17%
0.14%
0.28%
0.49%
0.56% |
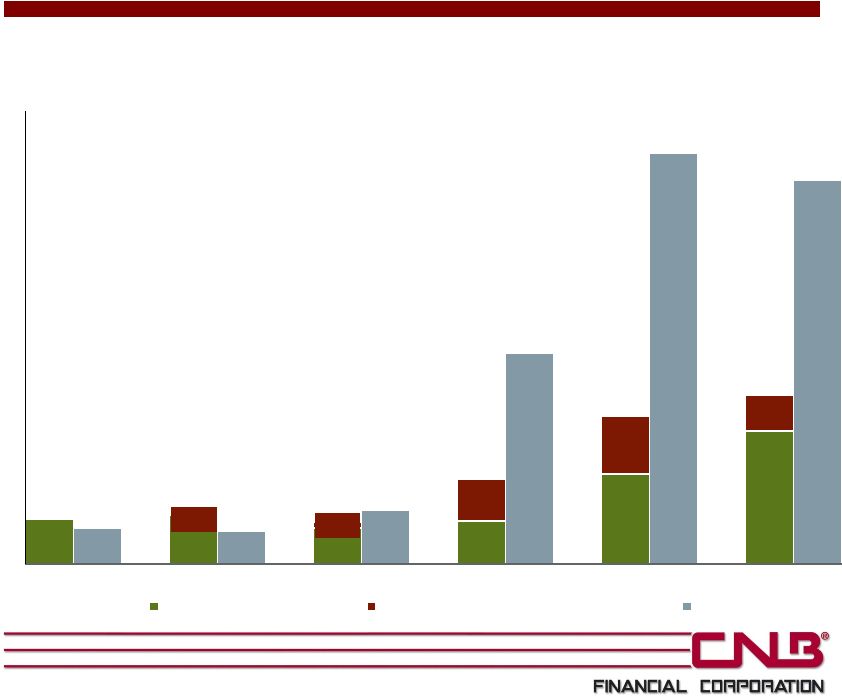 NCOs / Average Loans
0.15%
0.16%
0.12%
0.14%
0.30%
0.44%
0.14%
0.19%
0.12%
0.12%
0.11%
0.18%
0.70%
1.36%
1.27%
0.02%
0.01%
0.00%
0.20%
0.40%
0.60%
0.80%
1.00%
1.20%
1.40%
2005
2006
2007
2008
2009
2010
CCNE - CNB Bank
CCNE - Holiday Financial Services
Peers
Peers
include
U.S.
bank
holding
companies
with
assets
between
$1
and
$3
billion
for
2010,
2009,
and
2008,
and
U.S.
bank
holding
companies
with
assets
between
$500
million
and
$1
billion
for
2007,
2006
and
2005.
12 |
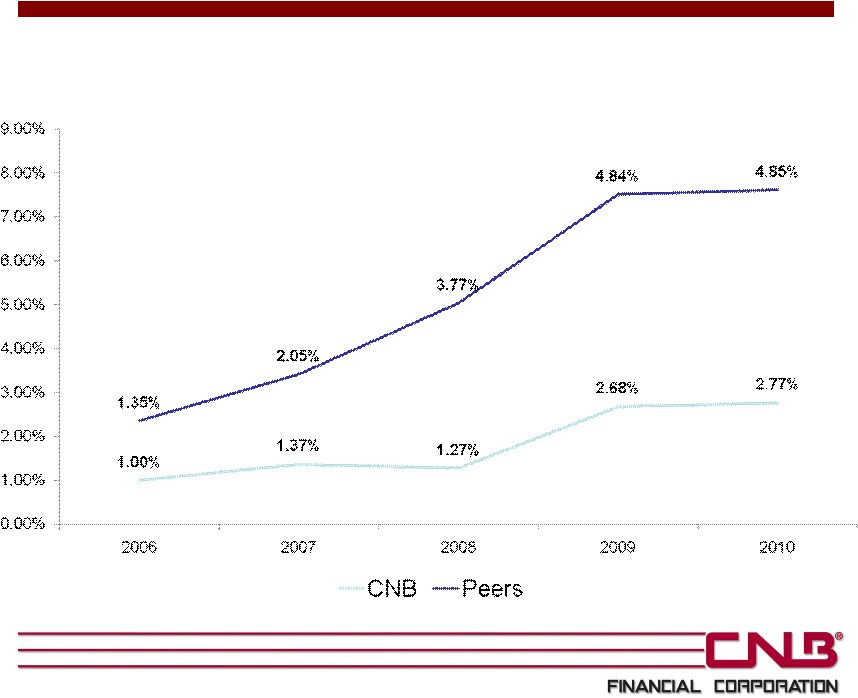
 Nonperforming Loans / Loans
13
Peers
include
U.S.
bank
holding
companies
with
assets
between
$1
and
$3
billion
for
2010,
2009,
and
2008,
and
U.S.
bank
holding
companies
with
assets
between
$500
million
and
$1
billion
for
2007,
2006
and
2005.
0.40%
0.32%
0.40%
0.53%
1.87%
1.61%
0.46%
0.56%
1.00%
2.41%
3.51%
3.53%
2005
2006
2007
2008
2009
2010
CCNE
Peers |
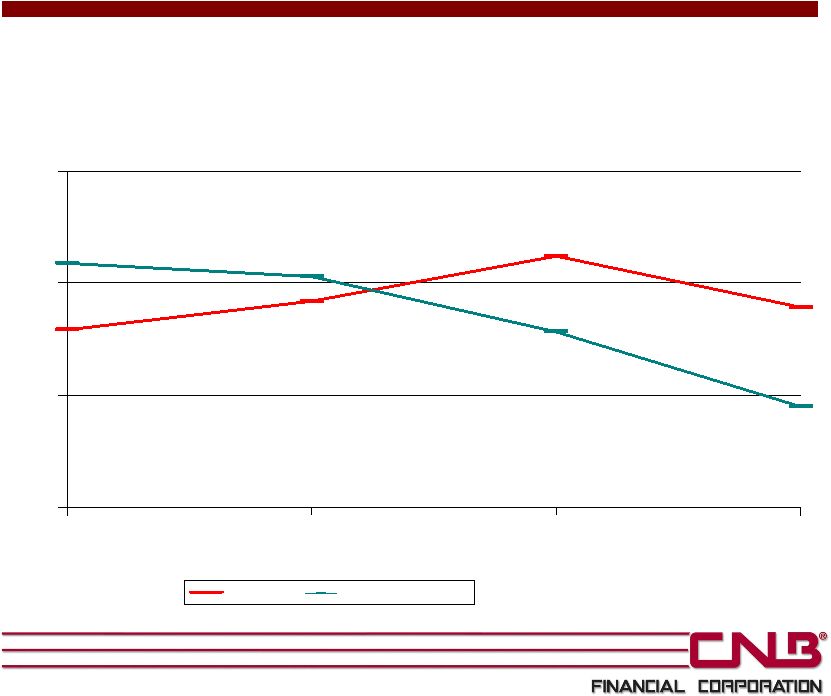
 Delinquent Loans/Total Loans
Peers
include
U.S.
bank
holding
companies
with
assets
between
$1
and
$3
billion
for
2010,
2009,
and
2008,
and
U.S.
bank
holding
companies
with
assets
between
$500
million
and
$1
billion
for
2007
and
2006.
14 |
 Non-interest expense ratio
{Non-interest expenses divided by average assets}
Peers include U.S. bank holding companies with assets between $1 and $3 billion for
2010, 2009, and 2008, and U.S. bank holding companies with assets between
$500 million and $1 billion for 2007. 3.12%
2.89%
2.79%
2.92%
2.45%
2.78%
3.03%
3.09%
2%
3%
3%
4%
2007
2008
2009
2010
Peer group
CNB Financial Corp.
15 |
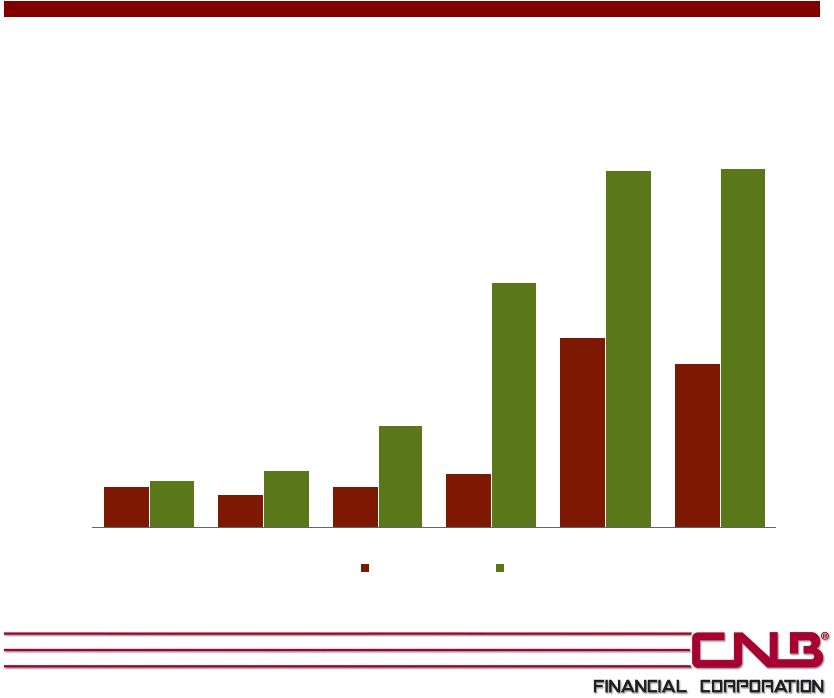
 Holiday Financial Services
Net Income
Charge-Offs
$225,000
$576,000
1,332,000
889,000
2009
2010
16 |
 Summary Financial Highlights
17
($ in millions, except per share data)
2005
2006
2007
2008
2009
2010
BALANCE SHEET
Assets
$764
$781
$859
$1,017
$1,162
$1,414
Loans
$511
$547
$600
$672
$715
$795
Deposits
$619
$631
$659
$815
$957
$1,163
Shareholders' Equity
$70
$72
$69
$62
$69
$110
PROFITABILITY
Net Income
$9.1
$9.6
$9.1
$5.2
$8.5
$11.3
EPS
$1.01
$1.08
$1.05
$0.61
$0.98
$1.06
Return on Average Assets
1.23%
1.26%
1.12%
0.55%
0.79%
0.87%
Return on Average Equity
13.4%
13.5%
12.8%
7.9%
12.9%
11.6%
Net Interest Margin
3.97%
4.17%
4.27%
4.33%
4.00%
3.71%
Efficiency Ratio
57.3%
57.7%
61.8%
65.1%
59.9%
57.9%
Noninterest Expense/ Avg Assets
2.70%
2.87%
3.09%
3.03%
2.73%
2.43%
CAPITAL
Tang. Common Equity / Tang. Assets
7.8%
7.9%
6.9%
5.1%
5.1%
7.1%
Leverage Ratio
9.2%
9.2%
9.7%
8.4%
7.9%
8.8%
Tier 1 Risk Based Ratio
11.7%
11.7%
11.9%
10.8%
10.7%
14.1%
Total Risk Based Capital Ratio
12.8%
12.8%
12.9%
12.0%
12.0%
15.3%
ASSET QUALITY
NPAs/ Assets
0.28%
0.25%
0.34%
0.42%
1.17%
0.93%
NPAs/Loans+OREO
0.41%
0.35%
0.48%
0.63%
1.90%
1.66%
NCOs / Average Loans
0.15%
0.17%
0.14%
0.28%
0.49%
0.56%
Reserves/ Loans
1.10%
1.11%
1.13%
1.30%
1.37%
1.36%
Return on Average Tangible Equity
16.0%
16.5%
15.3%
9.6%
15.5%
14.4%
*
* Please see the Appendix for a reconciliation of non-GAAP financial
information. |
 Appendix
Non-GAAP Financial Reconciliation
Tangible
common
equity
to
tangible
assets
is
a
non-GAAP
financial
measure
calculated
using
GAAP
amounts.
Tangible
common
equity
is
calculated
by
excluding
the
balance
of
goodwill
and
other
intangible
assets
from
the
calculation
of
stockholders’
equity.
Tangible
assets
is
calculated
by
excluding
the
balance
of
goodwill
and
other
intangible
assets
from
the
calculation
of
total
assets.
CNB
believes
that
this
non-GAAP
financial
measure
provides
information
to
investors
that
is
useful
in
understanding
our
financial
condition.
Because
not
all
companies
use
the
same
calculation
of
tangible
common
equity
and
tangible
assets,
this
presentation
may
not
be
comparable
to
other
similarly
titled
measures
calculated
by
other
companies.
A
reconciliation
of
this
non-GAAP
financial
measure
is
provided
below.
($ in thousands)
2005
2006
2007
2008
2009
2010
Total Shareholders' Equity
$69,968
$72,279
$69,283
$62,467
$69,409
$109,645
Less Goodwill
10,821
10,821
10,821
10,821
10,821
10,821
Less Other Intangible Assets
800
385
285
185
85
-
Tangible Common Equity
$58,347
$61,073
$58,177
$51,461
$58,503
$98,824
Total Assets
$764,018
$780,850
$858,700
$1,016,518
$1,161,591
$1,413,511
Less Goodwill
10,821
10,821
10,821
10,821
10,821
10,821
Less Other Intangible Assets
800
385
285
185
85
-
Tangible Assets
$752,397
$769,644
$847,594
$1,005,512
$1,150,685
$1,402,690
Total Shareholders' Equity / Total Assets
9.16%
9.26%
8.07%
6.15%
5.98%
7.76%
Tangible Common Equity / Tangible Assets
7.75%
7.94%
6.86%
5.12%
5.08%
7.05%
18 |
 Financial Highlights
Year Ended December 31, 2010
NASDAQ: CCNE
March 4, 2011 |