Attached files
| file | filename |
|---|---|
| 8-K - OVERSEAS SHIPHOLDING GROUP INC | osg4q20108k.htm |
| EX-99 - OVERSEAS SHIPHOLDING GROUP INC | osg4q20108kex991.htm |
Exhibit 99.2

Fourth Quarter and Fiscal Year 2010
Conference Call
Conference Call
February 28, 2011

page 2
This presentation contains forward-looking statements regarding the Company's prospects, including the outlook
for tanker and articulated tug barge markets, changing oil trading patterns, anticipated levels and timing of
newbuilding and scrapping, prospects for certain strategic alliances and investments, forecasted newbuilding
delivery schedule for 2011 through 2013, projected scheduled drydock and off hire days for 2011, projected
locked-in charter revenue and locked-in time charter days for 2011 through 2015 and thereafter, forecasted 2011
vessel expenses, charter hire expenses, depreciation and amortization, general and administrative expenses,
interest expense, and levels of equity income and capital expenditures, the profitability in 2011 of certain business
units and the Company’s two FSOs, ability to meet refinancing obligations in 2011 and 2012, the sustainability of
OSG’s annual dividend, prospects of OSG’s strategy of being a market leader in the segments in which it
competes and the forecast of world economic activity and oil demand. These statements are based on certain
assumptions made by OSG management based on its experience and perception of historical trends, current
conditions, expected future developments and other factors it believes are appropriate in the circumstances.
Forward-looking statements are subject to a number of risks, uncertainties and assumptions, many of which are
beyond the control of OSG, which may cause actual results to differ materially from those implied or expressed by
the forward-looking statements. Factors, risks and uncertainties that could cause actual results to differ from the
expectations reflected in these forward-looking statements are described in the Company’s Annual Report for
2009 on Form 10-K and those risks discussed in the other reports OSG files with the Securities and Exchange
Commission.
Forward-Looking Statements

page 3
< Fourth quarter results reflected continued weakness across our markets
• TCE revenues were $183M, down 10% from $204M in 4Q2009
• Reported net loss of $55.3M or $1.83 per diluted share
• Adjusted net loss was $59.0M or $1.96 per diluted share
< Fiscal 2010 results
• TCE revenues $853M, down 10% vs. 2009
• Reported net loss $134M; Adjusted net loss $98M
< TCE revenues impacted by weak spot rates, increased spot exposure
• Spot rates remained under pressure across all market segments
• Factors include excess tonnage supply, continued impact on ton-mile demand of China
sourcing more crude from the Middle East vs. West Africa, inventory drawdowns
sourcing more crude from the Middle East vs. West Africa, inventory drawdowns
• Time charters and VLCC forward cover that benefited 2009 results has rolled off
• VLCC TCE rate achieved in 4Q2010 (spot + fixed) was 55% below 4Q2009
Financial Highlights

page 4
1 Delivered February 2011
Fleet Expansion and U.S. Flag Turnaround Program
< Crude - turnaround of FSO JV
• Q4 was first full quarter both FSOs were on contract -
JV now a reliable contributor
< Products - averaging down on capital and charter-in
costs
costs
• Overseas Kythnos (MR) purchased and bareboat charter
cancelled
cancelled
• Two time-chartered MRs delivered - Carina and Atlantic
Grace 1
Grace 1
• Orderbook swap concluded - Two LR1s (3Q2011) out, two
2013 Aframaxes in, with improved value/cost tradeoff
2013 Aframaxes in, with improved value/cost tradeoff
< U.S. Flag - fleet modernization solidifies market position
• Overseas Chinook delivered; now under conversion to
shuttle tanker with 4-year time charter to Petrobras to
commence in 2Q2011
shuttle tanker with 4-year time charter to Petrobras to
commence in 2Q2011
• Delaware Bay lightering fleet renewal almost complete with
March delivery of OSG 351 - term contract cover in place
(through 2020)
March delivery of OSG 351 - term contract cover in place
(through 2020)
• Last three single hull vessel vessels sold or under sale
contract - 100% double hull by end of 1H2011
contract - 100% double hull by end of 1H2011

page 5
1 Projected estimates only. 2010 includes mark-to-market losses on the FSO Africa interest rate swap.
2 Includes all expenses, including allocated G&A.
In 2010 we have executed according to plan on a number of initiatives that are expected
to result in material improvement in financial performance in 2011 and beyond
to result in material improvement in financial performance in 2011 and beyond
2010 Accomplishments to Benefit 2011 Results
< Full year contribution from both FSOs expected to turn a $7M loss in
2010 to a $14M profit in 20111 - a $21M swing
2010 to a $14M profit in 20111 - a $21M swing
< U.S. Flag unit turnaround underway
- Positive contribution expected in 2011 from an operating loss of $35M 2 in 2010
< G&A initiative will continue in 2011 - further savings expected
- Approximately $95M overall spend for 2011 vs. $100M in 2010
< Holding the line on vessel expenses in 2011
< We expect no vessel impairments in 2011 compared with $29M in 2010
< We have continued to strengthen our commercial platforms
- Important contracts in Tankers International, Aframax International, and both
International and U.S. Flag lightering have been renewed
International and U.S. Flag lightering have been renewed
- We have added pool partners and vessels in Tankers International, Suezmax
International and Clean Products International
International and Clean Products International

page 6
Disciplined Expense Management
< G&A reduction program has borne fruit
• Savings are permanent
• Continued cost discipline in 2011 and
beyond
beyond
< OSG reduced daily vessel operating
expense from 2008 to 2010 on
international flag vessels while
improving operational performance
expense from 2008 to 2010 on
international flag vessels while
improving operational performance
• We expect to hold 2011 daily Opex below
2008 levels
2008 levels
• Daily Opex control achieved without
sacrificing safety, quality and environmental
oversight
sacrificing safety, quality and environmental
oversight
Operating Expense per Day 1
International Fleet
G&A Expenses
(~34%)
($ in millions)
1 Does not reflect offsetting impact of payments received on two U.S. Flag vessels trading internationally and one Canadian flag vessel.

page 7
|
Covenants on $1.8B facility 2
|
||
|
Covenant 4Q2010 Capacity
|
||
|
Maximum Leverage 3
< 60% |
43%
|
$2.0B add’l debt
|
|
Minimum Net Worth 4
³ $1.2B
|
$2.5B
|
$1.3B in losses
|
|
Minimum
Unencumbered Assets 5
³ 150%
|
235%
|
$0.8B new secured
debt on $1.1B of vessels |
1 Liquidity consists of Cash & Cash Equivalents, Short Term Investments and committed availability under bank facilities (does not reflect $150M reduction
in revolving credit facility effective in February 2011). 2 Preliminary figures. 3 Funded indebtedness to total capitalization. 4 Tangible net worth.
in revolving credit facility effective in February 2011). 2 Preliminary figures. 3 Funded indebtedness to total capitalization. 4 Tangible net worth.
5Unencumbered tangible assets to unsecured debt; capacity assumes 70% advance ratio.
Debt Repayment and Capital Commitments
Conservative financial policy creates financial flexibility and
the ability to execute on attractive growth opportunities
the ability to execute on attractive growth opportunities
< Strong liquidity and balance sheet
profile
profile
• $1.3B in liquidity 1
• Long term debt to capital = 48.0%
• Manageable debt and refinancing
obligations over next two years
obligations over next two years
• Future construction commitments of
$222M are fully funded
$222M are fully funded
• Ample room within covenants
< Recent capital raises have:
• Extended debt maturity profile
• Diversified capital sources
• Strengthened balance sheet
< Large unsecured asset base
• 70% of Vessel NBV is unsecured

page 8
2011 Outlook - Crude & Products
< Crude
• Demand picture is encouraging
• Net fleet growth in 2011 to exceed demand growth
• Slow steaming is growing in acceptance - benefits are significant
• Many wildcards - most are positive
< Products
• Vessel supply is being absorbed, while MR orders are being delayed, converted
to dry, or cancelled
to dry, or cancelled
• Clean product demand increasing at faster pace than overall oil demand
• Ton-mile growth expected to continue from longer-haul trading patterns
• Ton-mile growth in the MR sector expected to exceed supply growth in 2011

page 9
2011 Outlook - U.S. Flag
< Jones Act fleet expected to decline further
• 8 newbuilds delivering through 2014 will be more than offset by
mandated/expected retirements (including OSG’s last two single-hulls in 2011)
mandated/expected retirements (including OSG’s last two single-hulls in 2011)
< Refinery expansion in the Mid-continent and Gulf Coast to result in more
product available on Gulf Coast
product available on Gulf Coast
• Pipeline capacity to Northeast is limited - some will be exported (diesel to
Europe)
Europe)
• Balance will displace imports and generate coastwise movements
• Revival of Upcoast Jones Act movements in 4Q2010 continues in 2011
• Exports to Mexico via Brownsville pipeline growing with falling Mexican
production
production
< Delaware City refinery to reopen in 2Q2011 - will provide incremental
lightering volumes
lightering volumes

page 10
In Summary
< We have remained focused on executing our strategy during this
downturn
downturn
• We have further enhanced our commercial platforms
• We have reduced costs at sea and ashore
• We have continued to modernize and optimize our fleet
- Challenging shipyard projects are operational with attractive contract cover in
place - FSOs, lightering ATBs and U.S. Flag shuttle tankers
place - FSOs, lightering ATBs and U.S. Flag shuttle tankers
• We have maintained financial flexibility through the downturn and will
outlast it
outlast it
- Capital markets transactions have de-risked the firm and better positioned us to
seize opportunities, especially relative to our competition
seize opportunities, especially relative to our competition
• We have maintained discipline in pursuing our balanced growth strategy
- It has paid to wait
< By following a consistent strategy throughout this difficult period, OSG
is positioned to emerge ahead of the pack when markets recover
is positioned to emerge ahead of the pack when markets recover
• Spot exposure provides upside to upturn, balanced with contract cover

page *
Financial Review
Myles Itkin, CFO

page 12
59% of TCE revenues derived from spot market compared
with 45% in 2009. Expiring fixed rate business was
replaced at lower spot rates
with 45% in 2009. Expiring fixed rate business was
replaced at lower spot rates
Both FSOs fully employed for quarter and earned service
level bonuses. OSG’s share of FSO JV income was $5.2M,
which included $1.9M related to interest rate swaps that are
marked-to-market through earnings. LNG - $1.8M; ATC -
$2.8M
level bonuses. OSG’s share of FSO JV income was $5.2M,
which included $1.9M related to interest rate swaps that are
marked-to-market through earnings. LNG - $1.8M; ATC -
$2.8M
Debt maturity extended by issuing $300M of Notes due
2018 which resulted in $5M increase in interest expense,
net of reduction in expense achieved by repaying $42M in
secured loans with an average interest rate of 6%; average
amount of debt increased $233M quarter-over-quarter
2018 which resulted in $5M increase in interest expense,
net of reduction in expense achieved by repaying $42M in
secured loans with an average interest rate of 6%; average
amount of debt increased $233M quarter-over-quarter
Reflects 604 more charter-in days during 4Q2010
Reflects $2.6M reduction in Compensation costs; $1.2M
reduction in T&E, consulting and legal fees from expense
reduction programs; $7.6M in non-recurring expenses in
2009
reduction in T&E, consulting and legal fees from expense
reduction programs; $7.6M in non-recurring expenses in
2009
Prior year’s quarter tax benefit related to 2009 tax loss
carryback as a result of tax law change. No similar
carryback available for 2010
carryback as a result of tax law change. No similar
carryback available for 2010
Financial Review - Income Statement

page 13
Raised $450M in capital market transactions in Q1; net
reduction in outstanding balances under revolving credit
facilities of $176M; vessel expenditures totaled $421M
and $98M net advances to FSO joint venture
reduction in outstanding balances under revolving credit
facilities of $176M; vessel expenditures totaled $421M
and $98M net advances to FSO joint venture
Includes CIP of $807M for 9 vessels
Represents Overseas New Orleans under contract of
sale
sale
Funding conversion of FSOs and FSO Africa operating
and debt service costs prior to commencement of charter
($98M); net operating income ($3.6M); offset by
distributions ($10.3M)
and debt service costs prior to commencement of charter
($98M); net operating income ($3.6M); offset by
distributions ($10.3M)
Includes $41M tax refund received in January 2011
1 Short term investments consists of time deposits with maturities greater than 3 months
Financial Review - Balance Sheet

page 14
2011 Guidance
< Estimated vessel expenses $295M to $310M
< Time and bareboat charter hire expenses $380M to $395M
< Depreciation and amortization $185M to $195M
< G&A $95M to $100M
< Equity income of affiliated companies $20M to $25M
< Interest expense $95M to $110M
(assumes additional facilities and changes to the unsecured revolver)
< Capital expenditures
– Drydock costs $43M (on 29 vessels)
(Q1 $7M; Q2 $11M; Q3 $12M; Q4 $13M)
– Newbuild progress payments, vessel $176M
improvements and capitalized interest (Q1 $76M; Q2 $60M; Q3 $17M; Q4 $23M)

page *
Appendix
page 16
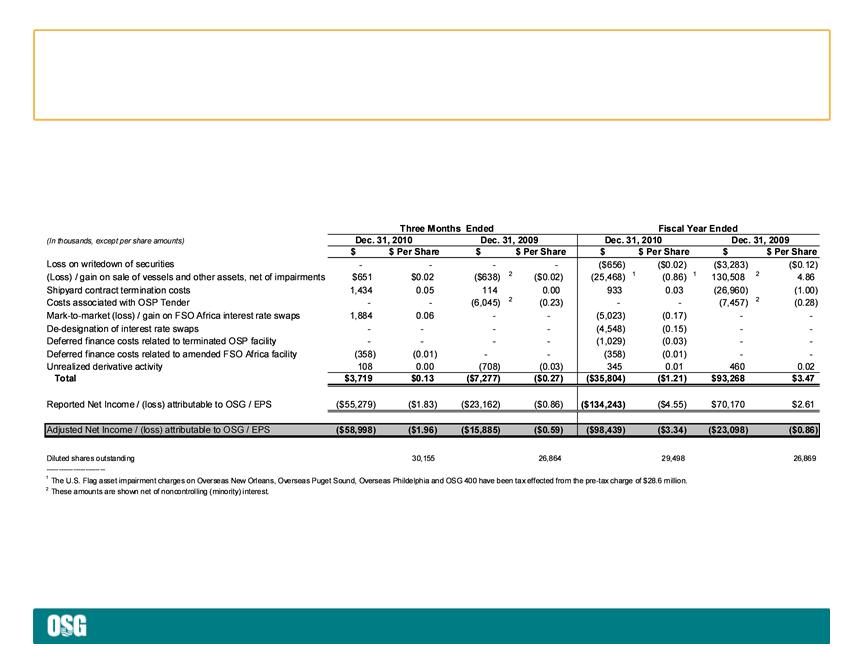
Special Items Affecting Net Income/(Loss)
Set forth below are significant items of income and expense that affected the Company’s results for the three months and fiscal year ended
December 31, 2010 and 2009, all of which are typically excluded by securities analysts in their published estimates of the Company’s financial
results.
December 31, 2010 and 2009, all of which are typically excluded by securities analysts in their published estimates of the Company’s financial
results.
Reconciling Items

page 17
EBITDA
TCE Revenues
Reconciling Items (cont’d)

page 18
|
|
Owned
|
Chartered-in
|
Total
|
Newbuild
|
Total
|
|
VLCC
|
9
|
6
|
15
|
2
|
17
|
|
FSO
|
2
|
-
|
2
|
-
|
2
|
|
Suezmax
|
-
|
2
|
2
|
-
|
2
|
|
Aframax
|
6
|
4
|
10
|
2
|
12
|
|
Panamax
|
9
|
-
|
9
|
-
|
9
|
|
Lightering
|
2
|
4
|
6
|
-
|
6
|
|
Total Crude
|
28
|
16
|
44
|
4
|
48
|
|
LR2
|
-
|
-
|
-
|
-
|
-
|
|
LR1
|
2
|
2
|
4
|
2
|
6
|
|
MR*
|
15
|
19
|
34
|
3
|
37
|
|
Total Products
|
17
|
21
|
38
|
5
|
43
|
|
Handysize
|
4
|
9
|
13
|
1
|
14
|
|
ATB
|
7
|
-
|
7
|
-
|
7
|
|
Lightering
|
3
|
-
|
3
|
1
|
4
|
|
Total U.S. Flag
|
14
|
9
|
23
|
2
|
25
|
|
Total Gas
|
4
|
-
|
4
|
-
|
4
|
|
TOTAL
|
63
|
46
|
109
|
11
|
120
|
* Products operating fleet Includes 2 owned U.S. Flag MRs that trade internationally and a car carrier; Products MR newbuild fleet includes a chemical
tanker.
tanker.
Fleet Composition - As of February 23, 2011

page 19
Off Hire and Scheduled Drydock
In addition to regular inspections by OSG personnel, all vessels are subject to periodic drydock, special survey and other scheduled or known
maintenance and repairs. The table below sets forth actual days off hire for the fourth quarter of 2010 and anticipated days off hire for the
above-mentioned events by vessel class for each quarter in 2011.
maintenance and repairs. The table below sets forth actual days off hire for the fourth quarter of 2010 and anticipated days off hire for the
above-mentioned events by vessel class for each quarter in 2011.
1 Includes one time chartered-in vessel that is expected to be off-hire for purposes of TCE revenue and charter hire expense.
2 Includes conversion of Overseas Chinook to shuttle tanker
Off Hire Schedule

page 20
For the Quarter Ended December 31, 2010
($ in thousands)
Note: Vessels chartered-in for less than one year are not on the Company’s fleet list. During the second quarter, the Gas segment chartered in an LPG
carrier for an initial term that was less than one year.
carrier for an initial term that was less than one year.
Charter Hire Expense by Segment

page 21
Locked-in Time Charter
Days by Segment
Days by Segment
Locked-in Time Charter
Revenue by Segment
Revenue by Segment
Locked-in
Charter Revenue
Charter Revenue
Note: Locked-in time charter days for 2011 are as of 12/31/10 and will differ from a more current date used in Appendices 3 and 4 in the quarterly
earnings press release. 1 Excludes $12M in time charter contracts, which were cancelled in February 2011.
earnings press release. 1 Excludes $12M in time charter contracts, which were cancelled in February 2011.
Future Revenue $/Days by Segment - As of 12/31/10

page *
www.osg.com