Attached files
| file | filename |
|---|---|
| EX-21 - OVERSEAS SHIPHOLDING GROUP INC | v175463_ex21.htm |
| EX-32 - OVERSEAS SHIPHOLDING GROUP INC | v175463_ex32.htm |
| EX-31.2 - OVERSEAS SHIPHOLDING GROUP INC | v175463_ex31-2.htm |
| EX-23.2 - OVERSEAS SHIPHOLDING GROUP INC | v175463_ex23-2.htm |
| EX-31.1 - OVERSEAS SHIPHOLDING GROUP INC | v175463_ex31-1.htm |
| EX-23.1 - OVERSEAS SHIPHOLDING GROUP INC | v175463_ex23-1.htm |
SECURITIES
AND EXCHANGE COMMISSION
Washington,
D.C. 20549
FORM
10-K
FOR
ANNUAL AND TRANSITION REPORTS
PURSUANT
TO SECTION 13 OR 15(d) OF THE
SECURITIES
EXCHANGE ACT OF 1934
(Mark
One)
x ANNUAL
REPORT PURSUANT TO SECTION 13 OR 15(d) OF THE SECURITIES EXCHANGE ACT
OF 1934
For the
fiscal year ended December 31, 2009
OR
¨ TRANSITION
REPORT PURSUANT TO SECTION 13 OR 15(d) OF THE SECURITIES EXCHANGE ACT
OF 1934
For the
Transition Period from
to .
Commission
File Number 1-6479-1
OVERSEAS
SHIPHOLDING GROUP, INC.
(Exact
name of registrant as specified in its charter)
|
Delaware
|
13-2637623
|
|
|
(State
or other jurisdiction of
incorporation
or organization)
|
(I.R.S.
Employer
Identification
Number)
|
|
|
666
Third Avenue, New York, New York
|
10017
|
|
|
(Address
of principal executive offices)
|
(Zip
Code)
|
Registrant’s
telephone number, including area code: 212-953-4100
Securities
registered pursuant to Section 12(b) of the Act:
|
Title
of each class
|
Name
of each exchange on which registered
|
|
|
Common
Stock (par value $1.00 per share)
|
New
York Stock Exchange
|
Securities
registered pursuant to Section 12(g) of the Act: NONE
Indicate
by check mark if the registrant is a well-known seasoned issuer, as defined in
Rule 405 of the Securities Act. Yes x No ¨
Indicate
by check mark if the registrant is not required to file reports pursuant to
Section 13 or Section 15(d) of the Exchange Act. Yes ¨ No x
Indicate
by check mark whether the registrant: (1) has filed all reports required to
be filed by Section 13 or 15(d) of the Securities Exchange Act of 1934
during the preceding 12 months (or for such shorter period that the
registrant was required to file such reports), and (2) has been subject to
such filing requirements for the past 90 days. Yes x No ¨
Indicate
by check mark whether the registrant has submitted electronically and posted on
its corporate Website, if any, every Interactive Data File required to be
submitted and posted pursuant to Rule 405 of Regulation S-T (Section 232.405 of
this chapter) during the preceding 12 months (or for such shorter period that
the registrant was required to submit and post such files). Yes ¨ No ¨
Indicate
by check mark if disclosure of delinquent filers pursuant to Item 405 of
Regulation S-K is not contained herein, and will not be contained, to the
best of registrant’s knowledge, in definitive proxy or information statements
incorporated by reference in Part III of this Form 10-K or any
amendment to this Form 10-K. x
Indicate
by check mark whether the registrant is a large accelerated filer, an
accelerated filer, a non-accelerated filer, or a smaller reporting company. See
definitions of “large accelerated filer,” “accelerated filer,” and “smaller
reporting company” in Rule 12b-2 of the Exchange Act. (Check
one):
|
Large accelerated filer x
|
Accelerated filer ¨
|
Non-accelerated
filer ¨
(Do not check if a smaller reporting
company)
|
Smaller reporting company ¨
|
Indicate
by check mark whether the registrant is a shell company (as defined in
Rule 12b-2 of the Exchange Act). Yes ¨ No x
The
aggregate market value of the Common Stock held by non-affiliates of the
registrant on June 30, 2009, the last business day of the registrant’s most
recently completed second quarter, was $797,137,960, based on the closing price
of $34.04 per share on the New York Stock Exchange on that date. (For this
purpose, all outstanding shares of Common Stock have been considered held by
non-affiliates, other than the shares beneficially owned by directors, officers
and certain 5% shareholders of the registrant; certain of such persons disclaim
that they are affiliates of the registrant.)
As of
February 25, 2010, 26,903,262 shares of Common Stock were
outstanding.
DOCUMENTS
INCORPORATED BY REFERENCE
Portions
of the registrant’s definitive proxy statement to be filed by the registrant in
connection with its 2010 Annual Meeting of Shareholders are incorporated by
reference in Part III.
TABLE
OF CONTENTS
|
Page
|
||
|
PART
I
|
||
|
Item 1.
|
Business
|
1
|
|
Overview
|
1
|
|
|
Business
Strategy
|
1
|
|
|
Summary
of 2009 Events
|
2
|
|
|
Fleet
Highlights
|
4
|
|
|
Commercial
Pools
|
4
|
|
|
Technical
Operations
|
4
|
|
|
Commercial
Teams
|
5
|
|
|
Customers
|
5
|
|
|
Liquidity
|
5
|
|
|
Employees
|
5
|
|
|
Forward-Looking
Statements
|
5
|
|
|
Operations
|
6
|
|
|
Charter
Types
|
7
|
|
|
Fleet
Summary
|
8
|
|
|
International
Fleet Operations
|
9
|
|
|
U.S.
Flag Fleet Operations
|
10
|
|
|
Investments
in Affiliated Companies
|
12
|
|
|
Competition
|
12
|
|
|
Environmental
and Security Matters Relating to Bulk Shipping
|
13
|
|
|
International
and Domestic Greenhouse Gas Regulations
|
14
|
|
|
International
Environmental and Safety Restrictions and Regulations
|
14
|
|
|
Domestic
Environmental and Safety Restrictions and Regulations
|
17
|
|
|
Security
Regulations
|
20
|
|
|
Insurance
|
20
|
|
|
Taxation
of the Company
|
20
|
|
|
Glossary
|
22
|
|
|
Available
Information
|
25
|
|
|
Item
1A.
|
Risk
Factors
|
25
|
|
Item
1B.
|
Unresolved
Staff Comments
|
36
|
|
Item
2.
|
Properties
|
36
|
|
Item
3.
|
Legal
Proceedings
|
36
|
|
Item
4.
|
Submission
of Matters to a Vote of Security Holders
|
36
|
|
Executive
Officers of the Registrant
|
37
|
|
|
PART
II
|
||
|
Item
5.
|
Market
for Registrant’s Common Equity, Related Stockholder Matters and Issuer
Purchases of Equity Securities
|
38
|
|
Item
6.
|
Selected
Financial Data
|
40
|
|
Item
7.
|
Management’s
Discussion and Analysis of Financial Condition and Results of
Operations
|
41
|
|
General
|
41
|
|
|
2009
Developments
|
41
|
|
|
Acquisition
of Heidmar Lightering
|
41
|
|
|
Operations
|
42
|
|
|
Critical
Accounting Policies
|
49
|
|
|
Income
from Vessel Operations
|
55
|
|
|
Equity
in Income of Affiliated Companies
|
60
|
|
Page
|
||
|
Interest
Expense
|
61
|
|
|
Provision/(Credit)
for Federal Income Taxes
|
61
|
|
|
EBITDA
|
62
|
|
|
Effects
of Inflation
|
62
|
|
|
Liquidity
and Sources of Capital
|
62
|
|
|
Risk
Management
|
66
|
|
|
Interest
Rate Sensitivity
|
67
|
|
|
Item
7A.
|
Quantitative
and Qualitative Disclosures about Market Risk
|
67
|
|
Item
8.
|
Financial
Statements and Supplementary Data
|
68
|
|
Management’s
Report on Internal Controls over Financial Reporting
|
105
|
|
|
Item
9.
|
Changes
in and Disagreements with Accountants on Accounting and Financial
Disclosure
|
106
|
|
Item
9A.
|
Controls
and Procedures
|
106
|
|
Item
9B.
|
Other
Information
|
106
|
|
PART
III
|
||
|
Item
10.
|
Directors
and Executive Officers of the Registrant
|
107
|
|
Item
11.
|
Executive
Compensation
|
107
|
|
Item
12.
|
Security
Ownership of Certain Beneficial Owners and Management and Related
Stockholder Matters
|
107
|
|
Item
13.
|
Certain
Relationships and Related Transactions
|
107
|
|
Item
14.
|
Principal
Accounting Fees and Services
|
107
|
|
PART
IV
|
||
|
Item
15.
|
Exhibits,
Financial Statement Schedules
|
108
|
|
Signatures
|
113
|
|
PART
I
ITEM
1. BUSINESS
OVERVIEW
Overseas
Shipholding Group, Inc. (“OSG” or the “Company”) is one of the world’s leading
bulk shipping companies engaged primarily in the ocean transportation of crude
oil and petroleum products. At December 31, 2009, the Company owned or operated
a modern fleet of 106 vessels (aggregating 10.9 million deadweight tons and
864,800 cubic meters) of which 84 vessels operated in the international market
and 22 operated in the U.S. Flag market. OSG’s newbuilding program of owned and
chartered-in vessels totaled 23 International and U.S. Flag vessels, bringing
the Company’s total owned, operated and newbuild fleet to 129
vessels.
The
Company’s vessel operations are organized into strategic business units and
focused on market segments: crude oil, refined petroleum products, U.S. Flag and
gas. The International Flag Crude Tanker unit manages International
Flag ULCC, VLCC, Suezmax, Aframax, Panamax and Lightering tankers; the
International Flag Product Carrier unit principally manages LR1 and MR product
carriers and the U.S. Flag unit manages most U.S. Flag
vessels. Through joint venture partnerships, the Company operates
four LNG carriers and, beginning in 2010, two Floating Storage and Offloading
(“FSO”) service vessels. Dedicated chartering and commercial
personnel manage specific fleets while the Company’s technical ship management
operations and corporate departments support the Company’s global
operations.
OSG
generally charters its vessels to customers either for specific voyages at spot
rates or for specific periods of time at fixed daily amounts. Spot market rates
are highly volatile, while time and bareboat charter rates are fixed for
specific periods of time and provide a more predictable stream of Time Charter
Equivalent Revenues (“TCE”). For a more detailed discussion on factors
influencing spot and time charter markets, see Operations—Charter Types later in
this section.
A
glossary of shipping terms (the “Glossary”) that should be used as a reference
when reading this Annual Report on Form 10-K can be found later in Item 1.
Capitalized terms that are used in this Annual Report are either defined when
they are first used or in the Glossary.
BUSINESS
STRATEGY
OSG is
committed to providing safe, reliable transportation services to its customers
while ensuring the safety of its crews, vessels and the environment. The Company
is also committed to creating long-term shareholder value by executing on a
growth strategy designed to maximize returns in all economic
cycles. The Company believes it can successfully deliver benefits to
both customers and shareholders by creating a rewarding and challenging work
environment for all employees. OSG’s growth strategy is focused on
four elements:
|
§
|
Sector
Leadership
|
OSG seeks
to maintain or achieve market leading positions in each of the primary markets
it operates: crude oil, products and U.S. Flag. The Company has
expanded its fleet through organic growth and acquisitions of companies that
have expanded its market presence, the scale of its fleet and service
offerings.
|
§
|
Fleet
Optimization
|
The
Company believes that it can improve returns in any shipping cycle by taking a
portfolio approach to managing its business. This approach includes
operating a diverse set of vessels that trade in different markets;
participating in commercial pools that maximize vessel utilization; managing a
fleet of owned and chartered-in tonnage that provides for flexibility and
optionality; and trading its fleet in both the spot and time charter markets to
enhance returns.
|
§
|
Superior
Technical Ship Management
|
OSG is
committed to operational excellence across its fleet. The Company’s
high-quality, modern fleet is operated by experienced crews supported by skilled
shore side personnel. One hundred percent of OSG’s owned
international flag fleet is double hull. OSG’s Safety Management
System (“SMS”) is designed to ensure that operational practices and procedures
are standardized fleet wide and those seafarers and vessel operations meet or
exceed all applicable safety, regulatory and environmental standards established
by International and U.S. maritime laws. For more information, see
Technical Operations later in this section.
|
2009
Annual Report
|
1
|
|
§
|
Financial
Flexibility
|
The
Company believes its strong balance sheet, comparatively high credit rating and
level of unencumbered assets provide significant financial
flexibility. OSG has been able to access both the unsecured bank
markets and the public debt markets, allowing it to borrow substantial amounts
on an unsecured basis. This financial flexibility permits the Company to pursue
attractive business opportunities.
Summary
of 2009 Events
OSG’s
growth strategy seeks to balance the expansion and renewal of its fleet across
multiple market segments and manage the mix of owned and chartered-in
assets. Chartering-in vessels gives the Company greater flexibility
in both contracting and expanding markets through an ability to exercise
redelivery, purchase or charter extension options. Sale and leaseback
transactions not only raise cash that can be redeployed or reinvested, but shift
risk, providing for greater flexibility in uncertain market
conditions.
Fleet
Expansion
In 2009,
OSG took delivery of ten vessels.
|
§
|
In
the Crude Oil segment, two 113,000 dwt owned Aframaxes, the Overseas
Yellowstone and Overseas Yosemite,
delivered.
|
|
§
|
In
Products, five vessels delivered. Four MRs included the 51,000
dwt Blue Emerald time chartered-in for three years, the Atlantic Polaris
and Atlantic Pisces, both 47,000 dwt vessels time chartered-in for 10
years and the Overseas Skopelos, a 50,000 dwt owned vessel. The
Overseas Mindoro, a 73,000 dwt owned LR1 also
delivered.
|
|
§
|
Three
U.S. Flag product carriers delivered, the Overseas Boston, Overseas
Nikiski and Overseas Cascade, all 46,815 dwt vessels. The
Overseas Cascade after operating briefly in December is being converted to
a shuttle tanker in order to trade in the ultra-deepwater U.S. Gulf, a
Jones Act trade. The Overseas Boston and Overseas Nikiski are chartered-in
for five years and OSG has extension options for the life of the
vessels.
|
Active
Asset Management
OSG’s
active asset management strategy includes managing the mix of its owned and
chartered-in fleet. In strong markets where asset values rise, the
Company may emphasize chartering-in over ownership due to a lower implicit cost
of capital. Similarly, sale leaseback transactions provide an
opportunity to capitalize on rising asset values while maintaining control of an
asset. Leaseback terms can offer extension and purchase options,
providing flexibility in volatile markets as well as transferring residual risk
to third parties. In declining market conditions where asset values
are falling, the Company may seek to increase its ownership of
vessels.
USale and Sale Leaseback
Transactions
During
the year, the Company sold or sold and leased back six vessels generating
$252 million in total proceeds.
|
·
|
In
the Crude Oil fleet, the Overseas Donna, a 2000-built VLCC was sold for
$127.5 million. A gain of approximately $77 million was
recognized.
|
|
§
|
In
the Products fleet, the charterer of two LR1s, the Overseas Reginamar and
Overseas Reinemar, exercised its purchase options, generating proceeds of
approximately $58 million. In connection with the delivery of
the Overseas Mindoro mentioned above, OSG sold and bareboat chartered-back
the LR1 for twelve years generating proceeds of $65.5
million. OSG has certain purchase option rights on the
vessel.
|
|
§
|
Two
U.S. Flag vessels, the Overseas Integrity and the M300 barge were
sold.
|
URedeliveries
During
the year, OSG oversaw the planned redeliveries of 20 vessels that had been time
or bareboat chartered in.
|
§
|
In
connection with the product carrier fleet renewal program, 11 single hull
MR product carriers redelivered in 2009. The remaining
International flag product carrier fleet is now fully double
hull.
|
|
§
|
The
crude oil fleet redelivered nine vessels including two VLCCs, the C. Dream
and Ardenne Venture, and four Aframaxes, the Phoenix Alpha, Phoenix Beta,
Cape Avila and Cape Aspro. The Hellespont Trinity, a Suezmax,
redelivered early when OSG exercised its right to do so. OSG
had less than 100% ownership interests in the aforementioned time
chartered-in vessels. Two bareboat chartered-in Panamaxes also
redelivered, the Overseas Cleliamar and Overseas
Polys.
|
|
2
|
Overseas
Shipholding Group, Inc.
|
UCancelled Charter-in
Obligations and Order Cancellation
OSG
actively managed a number of unplanned redeliveries and contract cancellations
during the year.
|
·
|
In
the crude oil fleet, the Company cancelled or terminated charter-in
obligations on five vessels. Time charter-in obligations were
cancelled on two newbuild Suezmaxes (the Profit and Pipe) with no penalty
because their scheduled delivery dates were delayed. OSG
consented to the termination of charter-in contracts on two Aframaxes, the
Peak and Wind, after the vessels were sold by the owner to a third
party. The four cancellations lowered OSG’s time charter-in
commitments by approximately $100 million. The time charter-in
on the Samho Crown was terminated four years before its scheduled expiry
due to the owner’s breach of the underlying contract, which resulted in
the reversal of the unamortized balance of the deferred gain that arose
from the sale leaseback transaction in 2006, of $13.9
million.
|
|
§
|
In
the Company’s U.S. Flag unit, contracts to complete six U.S. Flag vessels
at Bender Shipbuilding & Repair Co., Inc. (“Bender”) were
cancelled. Two of these vessels are being completed at
alternative shipyards.
|
UOrderbook
Modifications
Declining
asset prices during 2009 resulted in OSG renegotiating contract prices for some
of its newbuild orders. In connection with these
efforts:
|
§
|
The
Company agreed to accelerate payments in return for contract price
concessions on two of its VLCCs under
construction.
|
|
§
|
Orders
were cancelled for two LR1 product carriers that were scheduled to deliver
in 2010 and replaced with two MR product carriers delivering in 2011 and
one newbuild MR that will be bareboat chartered-in and is expected to
deliver in 2010.
|
New
Markets
In early
2008, OSG announced its entrance into the FSO (“Floating Storage and
Offloading”) service vessel market. Maersk Oil Qatar AS (“MOQ”) awarded two
service contracts to a joint venture between OSG and Euronav NV, each for a term
ending in 2017. In January 2010, the FSO Asia delivered on site to the Al
Shaheen oil field offshore Qatar. Subsequent to the delivery of the
FSO Asia, MOQ canceled the service contract on the FSO Africa, the second of two
vessels originally awarded the service contracts, due to delays in the
completion of its conversion. OSG and its joint venture partner
Euronav NV continue commercial discussions with MOQ about the project. For
additional information regarding the FSOs see Management’s Discussion and
Analysis of Financial Condition and Results of Operations set forth in Item 7,
and Note H to the Company’s financial statements set forth in Item
8.
Financial
Strength and Stability
The
Company entered into a $389 million, 12-year secured facility with The
Export-Import Bank of China (“China Exim Bank”). Borrowings under the facility
are financing three VLCCs and two Aframax crude oil tankers constructed in
China. The two Aframaxes, Overseas Yosemite and Overseas Yellowstone, delivered
in the first half of 2009. The facility is the first financing
arrangement that China Exim Bank has extended to a U.S. company.
U.S.
Flag Events
UTender for OSG America
L.P.
OSG
America L.P. (“OSG America”), a Delaware limited partnership and subsidiary of
OSG, completed its initial public offering of 7,500,000 common units,
representing a 24.5% limited partner interest, on November 9,
2007. In late 2008 and 2009, deteriorating Jones Act market
conditions, newbuild vessel cancellations and delivery delays on two ATB units
created significant near- and medium term challenges for OSG
America. Tight credit and equity market conditions further diminished
OSG America’s ability to finance planned fleet growth and expansion
opportunities, attributes that were integral to OSG America’s strategy at the
time of its initial public offering, and prospects of increasing dividend
distributions over time. As a result, on July 29, 2009, OSG announced
its intent to tender for all of the remaining outstanding publicly held common
units of OSG America. On December 17, 2009, OSG completed the tender
for $10.25 in cash per unit. OSG remains positive on the long-term prospects of
the Jones Act market and committed to operating both an International Flag and
U.S. Flag fleet.
|
2009
Annual Report
|
3
|
UPurchase of Two
Vessels
In the
fourth quarter 2009, the Company entered into an agreement with American
Shipping Company ASA (“AMSC”) and related entities and among other matters
agreed to purchase two U.S. Flag Handysize Product Carriers, the Overseas
Cascade and Overseas Chinook, for $115 million each. For additional
information, see Note O to the consolidated financial statements set forth in
Item 8.
UBender
In the
first quarter of 2009, OSG terminated contracts with Bender related to the
construction of six ATBs and two tug boats. The contracts were
terminated due to repeated delays in vessel delivery dates from the original
contract delivery dates, Bender’s request for substantial price increases on all
contracted vessels and OSG’s concern about Bender’s inability to complete the
ATBs and tug boats within contract terms, including Bender’s lack of performance
under such agreements and its financial condition. The Company moved two
partially completed ATBs and two tug boats, including unassembled parts and
purchased equipment, to alternative shipyards for completion. In
connection therewith, the Company has recorded shipyard contract termination
charges of $27.0 million in 2009. The ATBs are expected to deliver in
2010.
Fleet
Highlights
As of
December 31, 2009, OSG’s owned, operated and newbuild fleet aggregated 129
vessels. Of this total, 101 vessels are International Flag and 28 vessels are
U.S. Flag. The Marshall Islands is the principal flag of registry of the
Company’s International Flag vessels. At a time when customers are demonstrating
an increasingly clear preference for modern tonnage based on concerns about the
environmental risks associated with older vessels, 100% of OSG’s owned
International Flag fleet is double hull.
Additional
information about the Company’s fleet, including its ownership profile, is set
forth below under Operations—Fleet Summary, as well as on the Company’s website,
www.osg.com.
Commercial
Pools
To
increase vessel utilization and thereby revenues, the Company participates in
Commercial Pools with other like-minded shipowners of similar modern,
well-maintained vessels. By operating a large number of vessels as an integrated
transportation system, Commercial Pools offer customers greater flexibility and
a higher level of service while achieving scheduling efficiencies. Pools consist
of experienced commercial owners and operators who have close working
relationships with customers and brokers, while technical management is
performed by each shipowner. Pools negotiate charters with customers primarily
in the spot market. The size and scope of these pools enable them to enhance
utilization for pool vessels by securing backhaul voyages and Contracts of
Affreightment (“COAs”), thus generating higher effective TCE revenues than
otherwise might be obtainable in the spot market while providing a higher level
of service offerings to customers. As of December 31, 2009 OSG participates in
five pools: Tankers International (“TI”), Aframax International (“AI”), Panamax
International (“PI”), Clean Products International (“CPI”) and the newest pool,
Suezmax International (“SI”). For more information on the pools, see
Operations—International Fleet Operations.
Technical
Operations
OSG’s
global fleet operations are managed on an integrated platform by
segment: crude, products, U.S. Flag and gas. In addition
to regular maintenance and repair, crews onboard each vessel and shore side
personnel are responsible for ensuring that the Company’s fleet meets or exceeds
regulatory standards established by the International Maritime Organization
(“IMO”) and U.S. Coast Guard, including SOLAS (the International Convention for
the Safety of Life at Sea) and MARPOL.
The
Company is committed to providing safe, reliable and environmentally sound
transportation to its customers. Integral to meeting standards
mandated by worldwide regulators, customers and OSG is the Company’s
SMS. The SMS is a framework of processes and procedures that
addresses a spectrum of operational risks associated with quality, environment,
health and safety. The SMS is certified by ISM
(International Safety Management Code), ISO 9001 (Quality Management) and ISO
14001 (Environmental Management).
The
Company takes an active role in crewing its vessels and believes that the
quality of its senior officers, crew and shore side support personnel provide it
with a competitive advantage. OSG’s mandatory training and education
requirements meet the IMO Standards of Training, Certification and Watchkeeping
(STCW) principles. In early 2009, OSG completed the installation of
an integrated engine room and bridge simulator, located in its Manila
office. The simulator is to familiarize OSG engine and deck officers
with correct procedures and to respond effectively when faced with unusual or
unexpected situations. OSG believes its ability to provide
professional development and long-term employment opportunities for qualified
crew are competitive advantages in a market where skilled labor shortages are
expected to remain a challenge. In 2009, both International and U.S.
Flag crew retention was greater than 90%.
|
4
|
Overseas
Shipholding Group, Inc.
|
The fleet
is supported by shore side operations that include fleet managers, marine and
technical superintendents, purchasing staff, security officers, crewing and
training personnel and a safety, quality and environmental (“SQE”)
department. Further augmenting technical operations are a number of
assurance functions that conduct vessel audits and manage preparedness for
marine and environmental regulations and emergency response. In 2006,
OSG implemented an Open Reporting system whereby seafarers can anonymously
report possible violations of Company policies and procedures. All
open reports are investigated and appropriate actions are taken as
needed. Furthermore, the Company’s Operational Compliance Officer has
independent oversight of fleet-wide vessel operating practices and procedures
and global training programs.
Commercial
Teams
OSG’s
commercial teams based in offices in Houston, London, Montreal, New York,
Singapore, Philadelphia and Tampa enable customers to have access, at all times,
to information about their cargo’s position and status. The Company believes
that the scale of its fleet, its commercial management skills and its extensive
market knowledge allow it to achieve better rates than smaller, independent
shipowners on a consistent basis. OSG’s strong reputation in the marketplace is
the result of longstanding relationships with its customers and business
partners.
Customers
OSG’s
customers include major independent and state-owned oil companies, oil traders,
and U.S. and international government entities. The Company believes that it
distinguishes itself in the shipping market through an emphasis on service,
safety and reliability and its ability to maintain and grow long-term customer
relationships.
Liquidity
The
Company believes that the strength of its balance sheet, and the financial
flexibility that it affords, distinguishes it from many of its competitors. In
2009, total equity increased by $43 million to $1.9 billion. The change reflects
a reduction in the unrealized hedging expense of $78 million related to
derivatives that are accounted for as cash flow hedges, offset by a reduction of
$72 million attributable to the repurchase of the noncontrolling interest
(publicly held common units) in OSG America. Liquidity, including undrawn bank
facilities, was approximately $1.6 billion at December 31, 2009.
Liquidity
adjusted debt to capital was 40.1% at December 31, 2009, compared with 35.5% as
of December 31, 2008, adjusted to reflect the reclassification of the
noncontrolling interest to equity in accordance with accounting guidance that
became effective in 2009. For this purpose, liquidity adjusted debt is defined
as long-term debt reduced by cash, short-term investments and the balance in the
Capital Construction Fund.
Employees
As of
December 31, 2009, the Company had approximately 3,600 employees comprised of
3,150 seagoing personnel and 450 shore side staff. The Company has collective
bargaining agreements with three different maritime unions covering 530 seagoing
personnel employed on the Company’s U.S. Flag vessels. These agreements are in
effect for periods ending between March 2010 and June 2015. Under the collective
bargaining agreements, the Company is obligated to make contributions to pension
and other welfare programs. OSG believes that it has a satisfactory relationship
with its employees.
FORWARD-LOOKING
STATEMENTS
This Form
10-K contains forward looking statements regarding the outlook for tanker and
articulated tug/barge markets, and the Company's prospects, including prospects
for certain strategic alliances and investments. All statements other than
statements of historical facts should be considered forward-looking
statements. There are a number of factors, risks and uncertainties
that could cause actual results to differ from the expectations reflected in
these forward looking statements, including changes in production of or demand
for oil and petroleum products, either globally or in particular regions; the
outcome of the Company's negotiations with Maersk Oil Qatar AS; resolution of
possible claims against the Company by Bender Shipbuilding and Repair Co., Inc.;
prospects for the growth of the Gas segment; greater than anticipated levels of
newbuilding orders or less than anticipated rates of scrapping of older vessels;
changes in trading patterns for particular commodities significantly impacting
overall tonnage requirements; changes in the global economy and various regional
economies; risks incident to vessel operation, including accidents and discharge
of pollutants; unanticipated changes in laws and regulations; increases in costs
of operation; drydocking schedules differing from those previously anticipated;
the ability of the Company to attract and retain experienced, qualified and
skilled crewmembers; changes in credit risk of counterparties, including
shipyards, suppliers and financial lenders: delays (including failure to
deliver) or cost overruns in the building of new vessels or the conversion of
existing vessels for other uses; the cost and availability of insurance
coverage; the availability to the Company of suitable vessels for acquisition or
chartering-in on terms it deems favorable; changes in the pooling arrangements
in which the Company participates, including withdrawal of participants or
termination of such arrangements; estimates of future costs and other
liabilities for certain environmental matters and compliance plans; and
projections of the costs needed to develop and implement the Company's strategy
of being a market leader in the segments in which the Company competes. The
Company assumes no obligation to update or revise any forward looking
statements. Forward looking statements in this Form 10-K and written and oral
forward looking statements attributable to the Company or its representatives
after the date of this Form 10-K are qualified in their entirety by the
cautionary statement contained in this paragraph and in other reports hereafter
filed by the Company with the Securities and Exchange Commission.
|
2009
Annual Report
|
5
|
OPERATIONS
The bulk
shipping of crude oil and refined and unrefined petroleum products has many
distinct market segments based, in large part, on the size and design
configuration of vessels required and, in some cases, on the flag of registry.
Freight rates in each market segment are determined by a variety of factors
affecting the supply and demand for suitable vessels. Tankers, ATBs and Product
Carriers are not bound to specific ports or schedules and therefore can respond
to market opportunities by moving between trades and geographical areas. The
Company has established three reportable business segments: International Crude
Tankers, International Product Carriers, and U.S. vessels.
The
following chart reflects the percentage of TCE revenues generated by the
Company’s three reportable segments for each year in the three-year period ended
December 31, 2009 and excludes the Company’s proportionate share of TCE
revenues of affiliated companies.
|
Percentage of TCE Revenues
|
||||||||||||
|
2009
|
2008
|
2007
|
||||||||||
|
International
|
||||||||||||
|
Crude
Tankers
|
51.2 | % | 64.9 | % | 54.8 | % | ||||||
|
Product
Carriers
|
23.7 | % | 19.3 | % | 23.4 | % | ||||||
|
Other
|
0.8 | % | 1.4 | % | 2.3 | % | ||||||
|
Total
International Segments
|
75.7 | % | 85.6 | % | 80.5 | % | ||||||
|
U.S.
|
24.3 | % | 14.4 | % | 19.5 | % | ||||||
|
Total
|
100.0 | % | 100.0 | % | 100.0 | % | ||||||
The
following chart reflects the percentage of income from vessel operations
accounted for by each reportable segment. Income from vessel operations is
before general and administrative expenses, severance and relocation costs,
shipyard contract termination costs, gain/(loss) on disposal of vessels,
impairment charges (vessel and goodwill) and the Company’s share of income from
affiliated companies:
|
Percentage
of Income from
Vessel
Operations
|
||||||||||||
|
2009
|
2008
|
2007
|
||||||||||
|
International
|
||||||||||||
|
Crude
Tankers
|
81.2 | % | 83.1 | % | 69.3 | % | ||||||
|
Product
Carriers
|
(3.2 | )% | 11.3 | % | 17.6 | % | ||||||
|
Other
|
(1.4 | )% | 0.8 | % | 1.1 | % | ||||||
|
Total
International Segments
|
76.6 | % | 95.2 | % | 88.0 | % | ||||||
|
U.S.
|
23.4 | % | 4.8 | % | 12.0 | % | ||||||
|
Total
|
100.0 | % | 100.0 | % | 100.0 | % | ||||||
For
additional information regarding the Company’s three reportable segments for the
three years ended December 31, 2009, and reconciliations of (i) time
charter equivalent revenues to shipping revenues and (ii) income from
vessel operations for the segments to income before federal income taxes, as
reported in the consolidated statements of operations, see Management’s
Discussion and Analysis of Financial Condition and Results of Operations set
forth in Item 7, and Note F to the Company’s consolidated financial
statements set forth in Item 8.
Revenues
from International Crude Tankers are derived principally from voyage charters
and are, therefore, significantly affected by prevailing spot rates. In contrast
to International Crude Tankers, revenues from International Product Carriers and
the vessels included in the U.S. reportable segment are derived to a larger
extent from time charters, generating a more predictable level of TCE earnings.
Accordingly, the relative contributions of the Product Carriers and the U.S.
segment’s vessels to consolidated TCE revenues and to consolidated income from
vessel operations are influenced by the level of freight rates then existing in
the international market for crude oil tankers, increasing when such rates
decrease, as they did in 2009 and 2007, and decreasing when such rates increase
as was the case for 2008. The weak markets in 2009 resulted in TCE earnings for
the Company’s Product Carriers dropping below their total operating expense
levels, and in the lay up of four U.S. Flag vessels for substantial portions of
the year.
|
6
|
Overseas
Shipholding Group, Inc.
|
Charter
Types
The
Company believes that by balancing the mix of TCE revenues generated by voyage
charters and time charters, the Company is able to maximize its financial
performance throughout shipping cycles.
Spot
Market
Voyage
charters, including vessels operating in Commercial Pools that predominantly
operate in the spot market, constituted 49% of the Company’s TCE revenues in
2009, 65% in 2008 and 60% in 2007. The above information is based, in part, on
information provided by the pools or commercial ventures in which OSG
participates. Accordingly, the Company’s shipping revenues are significantly
affected by prevailing spot rates for voyage charters in the markets in which
the Company’s vessels operate. Spot market rates are highly volatile. Rates are
determined by market forces such as local and worldwide demand for the
commodities carried (such as crude oil or petroleum products), volumes of trade,
distances that the commodities must be transported, and the amount of available
tonnage both at the time such tonnage is required and over the period of
projected use. Seasonal trends greatly affect world oil consumption and
consequently vessel demand. While trends in consumption vary with seasons, peaks
in demand quite often precede seasonal consumption peaks as refiners and
suppliers try to anticipate consumer demand. Seasonal peaks in oil demand are
principally driven by increased demand prior to Northern Hemisphere winters, as
heating oil consumption increases, and increased demand for gasoline prior to
the summer driving season in the U.S. Available tonnage is affected over time,
by the volume of newbuilding deliveries and the removal (principally through
scrapping or conversion) of existing vessels from service. Scrapping is affected
by the level of freight rates, by the level of scrap prices and by international
and U.S. governmental regulations that require the maintenance of vessels within
certain standards and mandate the retirement of vessels lacking double
hulls.
Time
and Bareboat Charter Market
A
significant portion of the Company’s U.S. Flag fleet, its International Flag
Product Carrier fleet, the LNG fleet and the two FSOs are, or expected to be, on
time charter, providing a predictable level of earnings, which is not subject to
fluctuations inherent in spot-market rates. The Company has entered into FFAs
and related bunker swaps as hedges for reducing the volatility of earnings from
operating the Company’s VLCCs in the spot market. These derivative
instruments seek to create synthetic time charters. The impact of
these derivatives, which quality for hedge accounting treatment, is reported
together with time charters in the physical market. Time and bareboat
charters constituted 51% of the Company’s TCE revenues in 2009, 35% in 2008 and
40% in 2007.
|
2009
Annual Report
|
7
|
Fleet
Summary
As of
December 31, 2009, OSG’s International Flag and U.S. Flag operating fleet
consisted of 106 vessels, 56% of which were owned, with the remaining vessels
bareboat or time chartered-in. In order to maximize returns on invested capital,
particularly during periods when newbuilding prices and second-hand prices are
high, the Company charters-in tonnage, enabling it to expand its fleet without
making additional capital commitments. Vessels chartered-in may be Bareboat
Charters (where OSG is responsible for all Vessel Expenses) or Time Charters
(where the shipowner pays Vessel Expenses).
|
Vessels Owned
|
Vessels Chartered-in
|
Total at Dec. 31, 2009
|
||||||||||||||||||||||||||
|
Vessel Type
|
Number
|
Weighted by
Ownership
|
Number
|
Weighted by
Ownership
|
Total
Vessels
|
Vessels
Weighted by
Ownership
|
Total Dwt
|
|||||||||||||||||||||
|
Operating
Fleet
|
||||||||||||||||||||||||||||
|
FSO
|
1 | 0.5 | — | — | 1 | 0.5 | 432,023 | |||||||||||||||||||||
|
VLCC
and ULCC
|
8 | 8.0 | 7 | 6.0 | 15 | 14.0 | 4,735,659 | |||||||||||||||||||||
|
Suezmax
|
— | — | 2 | 2.0 | 2 | 2.0 | 317,000 | |||||||||||||||||||||
|
Aframax
|
6 | 6.0 | 8 | 6.4 | 14 | 12.4 | 1,571,060 | |||||||||||||||||||||
|
Panamax
|
9 | 9.0 | — | — | 9 | 9.0 | 626,834 | |||||||||||||||||||||
|
Lightering
|
2 | 2.0 | 5 | 4.0 | 7 | 6.0 | 642,319 | |||||||||||||||||||||
|
International
Flag Crude Tankers
|
26 | 25.5 | 22 | 18.4 | 48 | 43.9 | 8,324,895 | |||||||||||||||||||||
|
LR2
|
— | — | 1 | 1.0 | 1 | 1.0 | 104,024 | |||||||||||||||||||||
|
LR1
|
2 | 2.0 | 2 | 2.0 | 4 | 4.0 | 297,374 | |||||||||||||||||||||
|
MR
(1)
|
11 | 11.0 | 15 | 15.0 | 26 | 26.0 | 1,229,805 | |||||||||||||||||||||
|
International
Flag Product Carriers
|
13 | 13.0 | 18 | 18.0 | 31 | 31.0 | 1,631,203 | |||||||||||||||||||||
|
Car
Carrier
|
1 | 1.0 | — | — | 1 | 1.0 | 16,101 | |||||||||||||||||||||
|
Total
Int’l Flag Operating Fleet
|
40 | 39.5 | 40 | 36.4 | 80 | 75.9 | 9,972,199 | |||||||||||||||||||||
|
Handysize
Product Carriers (2)
|
5 | 5.0 | 7 | 7.0 | 12 | 12.0 | 561,840 | |||||||||||||||||||||
|
Clean
ATBs (2)
|
7 | 7.0 | — | — | 7 | 7.0 | 204,150 | |||||||||||||||||||||
|
Lightering:
|
||||||||||||||||||||||||||||
|
Crude
Carrier
|
1 | 1.0 | — | — | 1 | 1.0 | 39,732 | |||||||||||||||||||||
|
ATB
|
2 | 2.0 | — | — | 2 | 2.0 | 75,976 | |||||||||||||||||||||
|
Total
U.S. Flag Operating Fleet
|
15 | 15.0 | 7 | 7.0 | 22 | 22.0 | 881,698 | |||||||||||||||||||||
|
LNG
Fleet
|
4 | 2.0 | — | — | 4 | 2.0 |
864,800 cbm
|
|||||||||||||||||||||
|
Total
Operating Fleet
|
59 | 56.5 | 47 | 43.4 | 106 | 99.9 | 10,853,897 | |||||||||||||||||||||
|
864,800 cbm
|
||||||||||||||||||||||||||||
|
Newbuild/Conversion
Fleet
|
||||||||||||||||||||||||||||
|
International
Flag
|
||||||||||||||||||||||||||||
|
FSO
|
1 | 0.5 | — | — | 1 | 0.5 | 441,655 | |||||||||||||||||||||
|
VLCC
|
3 | 3.0 | — | — | 3 | 3.0 | 893,000 | |||||||||||||||||||||
|
LR1
|
4 | 4.0 | — | — | 4 | 4.0 | 294,000 | |||||||||||||||||||||
|
MR
|
4 | 4.0 | 4 | 4.0 | 8 | 8.0 | 395,350 | |||||||||||||||||||||
|
Chemical
Tankers
|
— | — | 1 | 1.0 | 1 | 1.0 | 19,900 | |||||||||||||||||||||
|
U.S. Flag
|
||||||||||||||||||||||||||||
|
Product
Carriers
|
1 | 1.0 | 3 | 3.0 | 4 | 4.0 | 187,260 | |||||||||||||||||||||
|
Lightering
ATBs
|
2 | 2.0 | — | — | 2 | 2.0 | 91,112 | |||||||||||||||||||||
|
Total
Newbuild Fleet
|
15 | 14.5 | 8 | 8.0 | 23 | 22.5 | 2,322,277 | |||||||||||||||||||||
|
Total
Operating & Newbuild Fleet
|
74 | 71 | 55 | 51.4 | 129 | 122.4 | 13,176,174 | |||||||||||||||||||||
|
864,800 cbm
|
||||||||||||||||||||||||||||
|
(1)
|
Includes
two owned U.S. Flag Product Carriers that trade internationally, thus
associated revenue is included in the Product Carrier
segment.
|
|
(2)
|
Includes
the New Orleans, Overseas Puget Sound, Overseas Galena Bay and OSG 214,
which were in lay-up at December 31,
2009.
|
Newbuild
Delivery Schedule as of December 31, 2009
|
Year/Segment
|
Q1 | Q2 | Q3 | Q4 |
Total
|
|||||||||||||||
|
2010
|
||||||||||||||||||||
|
Crude
|
2 | — | — | — | 2 | |||||||||||||||
|
Products
|
1 | 1 | 1 | 2 | 5 | |||||||||||||||
|
U.S.
Flag
|
2 | — | 2 | 1 | 5 | |||||||||||||||
|
Total
|
5 | 1 | 3 | 3 | 12 | |||||||||||||||
|
2011
|
||||||||||||||||||||
|
Crude
|
— | 1 | — | 1 | 2 | |||||||||||||||
|
Products
|
2 | 4 | 2 | — | 8 | |||||||||||||||
|
U.S.
Flag
|
1 | — | — | — | 1 | |||||||||||||||
|
Total
|
3 | 5 | 2 | 1 | 11 | |||||||||||||||
|
TOTAL
|
23 | |||||||||||||||||||
|
8
|
Overseas
Shipholding Group, Inc.
|
The table
below reflects the average age of the Company’s owned International Flag fleet
in comparison with the world fleet.
|
Vessel Type
|
Average Age of OSG’s
Owned Fleet at 12/31/09
|
Average Age of OSG’s
Owned Fleet at 12/31/08
|
Average Age of World
Fleet at 12/31/09*
|
|||
|
VLCC
(including ULCC)
|
9.1 years
|
8.1 years
|
8.0 years
|
|||
|
Aframax
|
8.0 years
|
9.5 years
|
7.4 years
|
|||
|
Panamax
|
6.4 years
|
5.3 years
|
7.0 years
|
|||
|
MR
|
6.7 years
|
6.4 years
|
8.1 years
|
|
*
|
Source:
Clarkson database as of January 1,
2010
|
International
Fleet Operations
Crude
Oil Tankers
OSG’s
crude oil fleet is comprised of all major crude oil vessel classes and includes
a fleet of seven International Flag lightering vessels that trade primarily in
the U.S. Gulf of Mexico (see Management’s Discussion and Analysis of Financial
Condition and Results of Operations set forth in Item 7, Acquisition of
Heidmar Lightering.) In order to enhance vessel utilization and TCE
revenues, the Company has placed its ULCC, VLCC, Suexmax, Aframax tankers
as well as a number of Panamax tankers into Commercial Pools that are
responsible for the Commercial Management of these vessels. The pools collect
revenue from customers, pay voyage-related expenses, and distribute TCE revenues
to the participants, after deducting administrative fees, according to formulas
based upon the relative carrying capacity, speed, and fuel consumption of each
vessel.
|
•
|
Tankers
International—Tankers International was formed in December 1999 by
OSG and other leading tanker companies in order to pool the commercial
operation of their modern VLCC fleets. As of December 31, 2009,
Tankers International had six participants and managed a fleet of 40
modern VLCCs and ULCCs that trade throughout the world, including all
15 (14.0 weighted by ownership) of the Company’s ULCC and VLCC owned
and chartered-in vessels.
|
Tankers
International performs the Commercial Management of its participants’ vessels.
The large number of vessels managed by Tankers International gives it the
ability to enhance vessel utilization through backhaul cargoes and COAs, thereby
generating greater TCE revenues. In recent years, crude oil shipments from West
Africa to Asia have expanded, increasing opportunities for vessels otherwise
returning in ballast (i.e., without cargo) from Europe and North America to
load cargoes in West Africa for delivery in Asia. Such combination voyages are
used to maximize vessel utilization by minimizing the distance vessels travel in
ballast.
By
consolidating the Commercial Management of its substantial fleet, Tankers
International is able to offer its customers access to an expanded fleet of
high-quality VLCCs and ULCCs. The size of its fleet enables Tankers
International to become the logistics partner of major customers and to help
them better manage their shipping programs, inventories and risk.
|
•
|
Suezmax
International— Suezmax International was formed in June 2008
and is currently solely managed by the Company. As of December 31, 2009,
the pool has four participants and provides the Commercial Management of a
fleet that primarily trades in the Atlantic Basin. As of December 31,
2009, Suezmax International managed a fleet of five modern Suezmaxes,
including both of the Company’s chartered-in
vessels.
|
|
•
|
Aframax
International—Since 1996, the Company and PDV Marina S.A., the
marine transportation subsidiary of the Venezuelan state-owned oil
company, have pooled the Commercial Management of their Aframax fleets. As
of December 31, 2009, there were 11 participants in Aframax
International and the pool Commercially Managed 42 vessels, including 13
(11.4 weighted by ownership) of the Company’s owned and chartered-in
vessels. Aframax International’s vessels generally trade in the Atlantic
Basin, North Sea and the Mediterranean. The Aframax International pool has
been able to enhance vessel utilization with backhaul cargoes and COAs,
thereby generating higher TCE revenues than would otherwise be attainable
in the spot market.
|
|
•
|
Panamax
International—Panamax International was formed in April 2004 and
provides the Commercial Management of the Panamax fleets of its three
participants. As of December 31, 2009, Panamax International managed
a fleet of 21 modern Panamaxes, which includes five of the Company’s crude
Panamaxes and three of its Panamax Product Carriers (LR1s), as well as
three crude Panamaxes that are time chartered to one of the pool
partners.
|
|
2009
Annual Report
|
9
|
Product
Carriers
International
Product Carriers constitutes one of the Company’s reportable business segments
and is made up of a diverse International Flag and U.S. Flag fleet that
transport refined petroleum products worldwide. The fleet, consisting of 26 MR
product carriers and four LR1s and one LR2, gives OSG the ability to provide a
broad range of services to global customers. Refined petroleum product cargoes
are transported from refineries to consuming markets characterized by both long-
and short-haul routes. The market is driven by global refinery capacity, changes
in consumer demand and product specifications and cargo arbitrage opportunities.
By expanding a core fleet of modern Handysize Product Carriers, OSG has grown
revenues in a market sector with more predictable earnings
characteristics.
In
contrast to the crude oil tanker market, the refined petroleum trades are more
complex due to the diverse nature of product cargoes, which include gasoline,
diesel, jet fuel, home heating oil, vegetable oils and organic chemicals
(e.g., methanol and ethylene glycols). The trades require crews to have
specialized certifications. Customer vetting requirements can be more rigorous
and, in general, vessel operations are more complex due to the fact that
refineries can be in closer proximity to importing nations, resulting in more
frequent port calls and discharging, cleaning and loading operations than crude
oil tankers.
OSG has
opportunistically expanded its commercial footprint in the Product Carrier
segment through acquisitions, newbuildings, chartering-in vessels and commercial
alliances.
|
•
|
OSG
trades seven of its Handysize Product Carriers, including four that are
time chartered to the other pool participants, in the Clean Products
International Pool, a regional Commercial Pool formed in 2006 with
Ultragas Group. As of December 31, 2009, the pool had four
participants. The pool is comprised of 12 vessels and concentrates on
triangulation trades in South
America.
|
|
•
|
Since
2005, OSG has ordered or chartered-in from third parties 21 MRs and eight
LR1s. Delivery of these vessels began in 2006 and will continue through
2011. These vessels are an important part of the business unit’s strategy
to modernize and expand its fleet, and offset redeliveries of older,
chartered-in Handysize vessels in 2008 and 2009. Of the Product Carrier
newbuild program, all except one of the MR1s vessels will be IMO III
compliant, allowing for increased flexibility when switching between cargo
grades.
|
|
•
|
Two
U.S. Flag vessels that participate in the U.S. government’s Maritime
Security Program, the Overseas Maremar and the Overseas Luxmar, are
included in the International Product Carrier unit. For detailed
information on the Maritime Security Program, see U.S. Flag Fleet
Operations, Maritime Security Program later in this section. The Overseas
Ambermar also participated in the U.S. government’s Maritime Security
Program, but ceased such participation in September 2008 and was reflagged
under Marshall Islands Flag.
|
Gas
Gas
constitutes one of the Company’s business units, which transports liquefied
natural gas. The expansion into the gas market further enhances the Company’s
fixed revenue and earnings base, since the LNG markets are characterized by
long-term time-charters.
|
•
|
The
joint venture between the Company and Qatar gas Transport Company Limited
(Nakilat) in which OSG has a 49.9% interest, owns four 216,000 cbm LNG
Carriers. Qatar Liquefied Gas Company Limited (II) has time chartered the
LNG Carriers for twenty-five years, with options to extend. The Company
provides Technical Management for these state-of-the-art vessels. For more
information about the financing of the LNG Carriers, see Note H to
the consolidated financial statements set forth in
Item 8.
|
U.S.
Flag Fleet Operations
OSG is
one of the largest commercial owners and operators of Jones Act vessels in the
United States. The Company’s U.S. Flag Fleet has expanded significantly since
2004 and today consists of 28 owned, operated and newbuild Handysize Product
Carriers and ATBs. As a U.S.-based company, OSG is uniquely positioned to
participate in the U.S. Jones Act shipping market, a trade that is not available
to its foreign-based competitors. Under the Jones Act, shipping between U.S.
ports, including the movement of Alaskan crude oil to U.S. ports, is reserved
for U.S. Flag vessels that are built in the U.S. and owned by U.S. companies
more than 75% owned and controlled by U.S. citizens. The Jones Act regulations,
coupled with tax law changes in the American Jobs Creation Act of 2004, have
provided the opportunity for OSG to significantly invest in and expand its U.S.
Fleet business. See Management’s Discussion and Analysis of Financial Condition
and Results of Operations set forth in Item 7, Provision/(Credit) for
Federal Income Taxes.
|
10
|
Overseas
Shipholding Group, Inc.
|
|
•
|
ATBs—In November 2006,
OSG acquired Maritrans Inc., a leading U.S. Flag crude oil and
petroleum product shipping company that owned and operated one of the
largest fleets of double hull Jones Act vessels serving the East and U.S.
Gulf coastwise trades. This strategic acquisition gave OSG a presence in
all major U.S. trading routes; intra U.S. Gulf, U.S. Gulf to the East
Coast, U.S. Gulf to the West Coast, the Alaskan North Slope trades and the
Delaware Bay. In addition, the acquisition provided for a qualifying use
of OSG’s Capital Construction Fund towards the acquisition of construction
contracts for ATBs that will be used for lightering services in the
Delaware Bay.
|
|
•
|
Jones Act Product Carrier
Newbuilds—In June 2005, OSG signed agreements to bareboat
charter-in 10 Jones Act Product Carriers to be constructed by Aker
Philadelphia Shipyard, Inc. and in October 2007, the order was
further expanded by an additional two sister ships. The unique market
dynamic of a declining Jones Act single hull fleet in the U.S. as a result
of the U.S. Oil Pollution Act of 1990 (“OPA 90”), coupled with the
expected continued growth in demand by U.S. consumers for crude oil and
petroleum products transported by sea, served as the basis for OSG placing
the series order for the Product Carriers prior to securing employment for
the vessels. OSG has chartered-in ten of the twelve vessels for initial
terms of five to ten years commencing on delivery of each vessel. The
Company has extension options for the lives of these vessels. As of
December 31, 2009, OSG has entered into long-term time charters-out
for 11 of these 12 vessels. Eight of the ships delivered prior to December
31, 2009. The remaining vessels under construction deliver from
2010 through 2011.
|
|
•
|
Alaskan North Slope
Trade—OSG has a significant presence in the Alaskan North Slope
trade through its 37.5% equity interest in Alaska Tanker Company, LLC
(“ATC”), a joint venture that was formed in 1999 among OSG, BP plc. (“BP”)
and Keystone Shipping Company (“Keystone”), to support BP’s Alaskan crude
oil transportation requirements. The Company’s participation in ATC
provides it with the ability to earn additional income (incentive hire)
based upon ATC’s meeting certain predetermined performance standards. Such
income, which is included in equity in income of affiliated companies,
amounted to $4.3 million in 2009, $5.3 million in 2008 and
$5.7 million in 2007.
|
|
•
|
Maritime Security
Program—Certain of the Company’s vessels participate in the U.S.
Maritime Security Program (the “Program”), which ensures that militarily
useful U.S. Flag vessels are available to the U.S. Department of Defense
in the event of war or national emergency. In 2005, the Company signed
four agreements with the Maritime Administrator of the Department of
Transportation pursuant to which the Company entered three reflagged U.S.
Flag Product Carriers and re-entered its U.S. Flag Pure Car Carrier into
the Program. The terms of the agreements relating to the reflagged Product
Carriers were for four years. Under the Company’s 10-year agreement
relating to the Pure Car Carrier, the vessel continued in the Program
through October 2007, at which time the vessel, Overseas Joyce, exited the
Program and was reflagged under the Marshalls Island flag. In September
2008, one of the three U.S. Flag Product Carriers exited the program and
was reflagged under the Marshall Islands Flag. In April 2009, the Maritime
Administrator determined that all statutory requirements for the
conversion of the agreements relating to the two Product Carriers
remaining in the MSP program from temporary to permanent status had been
satisfied and authorized amendments to the agreements incorporating this
change in status. Under the Program, the Company received
approximately $2.6 million per year for each vessel through 2008 and
$2.9 million for each vessel for 2009, and will receive $2.9 million
per year for each vessel from 2010 through 2011, and $3.1 million per
year for each vessel from 2012 through 2016, subject in each case to
annual Congressional
appropriations.
|
|
•
|
Capital Construction
Fund—To encourage private investment in U.S. Flag vessels, the
Merchant Marine Act of 1970 (the “Act”) permits deferral of taxes on
earnings from U.S. Flag vessels deposited into a Capital Construction Fund
and amounts earned thereon, which can be used for the construction or
acquisition of, or retirement of debt on, qualified U.S. Flag vessels
(primarily those limited to foreign, Great Lakes, and noncontiguous
domestic trades). The Company is a party to an agreement under such Act.
Under the agreement, the general objective is for U.S. Flag vessels to be
constructed or acquired through the use of assets accumulated in the fund.
If the agreement is terminated or amounts are withdrawn from the Capital
Construction Fund for non-qualified purposes, such amounts will then be
subject to federal income taxes. Monies can remain tax-deferred in the
fund for a maximum period of 25 years (commencing January 1,
1987 for deposits prior thereto). The Company had approximately
$41 million in its Capital Construction Fund as of December 31,
2009. The Company’s balance sheet at December 31, 2009 includes a
liability of approximately $14 million for deferred taxes on the fund
deposits and earnings thereon. During the three years ended December 31,
2009, the Company withdrew an aggregate of approximately $290 million
from its Capital Construction Fund towards the initial acquisition of the
construction contracts for the Lightering ATBs and for subsequent
construction costs.
|
|
2009
Annual Report
|
11
|
Investments
in Affiliated Companies
The
following chart reflects the percentage of income of investments in joint
ventures accounted for using the equity method by each reportable
segment. For additional information regarding income from affiliated
companies for the three years ended December 31, 2009 see Management’s
Discussion and Analysis of Financial Condition and Results of Operations set
forth in Item 7.
|
Percentage of Income of
Equity Method Investments
|
||||||||||||
|
2009
|
2008
|
2007
|
||||||||||
|
International
|
||||||||||||
|
Crude
Tankers
|
(1,347.0 | )% | (17.0 | )% | 40.9 | % | ||||||
|
Other
|
886.4 | % | 73.5 | % | (5.6 | )% | ||||||
|
Total
International Segments
|
(460.6 | )% | 56.5 | % | 35.3 | % | ||||||
|
U.S.
|
560.6 | % | 43.5 | % | 64.7 | % | ||||||
|
Total
|
100.0 | % | 100.0 | % | 100.0 | % | ||||||
The only
operating vessels held in companies accounted for by the equity method at
December 31, 2006 were those held through DHT Maritime Inc., formerly
Double Hull Tankers, Inc. (“DHT”), all of which are on time charters to
OSG, with profit sharing. In October 2005, the Company sold seven tankers (three
VLCCs and four Aframaxes) to DHT in connection with DHT’s initial public
offering. During the first six months of 2007, the Company sold its remaining
shares of DHT reducing its interest in DHT to 0.0% as of June 30, 2007 from
44.5% as of December 31, 2006. These vessels were time chartered back to
OSG at fixed rates for initial periods of five to six and one-half years. In
December 2008, OSG declared its option to extend the charter periods by
18 months for two of the Aframaxes and by 12 months for the other five
vessels. The fixed rate technical management agreements between the Company and
DHT were modified effective January 17, 2009. Under the renegotiated agreements,
DHT is responsible for all vessel expenses. The charters provide for the payment
of additional hire, on a quarterly basis, by OSG when the aggregate revenue
earned by these vessels for the Company exceeds the sum of the basic hire paid
during the quarter by the Company.
The four
216,000 cbm LNG Carriers were delivered from shipyards in the Far East, two in
the fourth quarter of 2007 with the remaining two delivering in the first
quarter of 2008. After a ballast voyage to the Middle East, the cost of which
was expensed in accordance with current accounting rules, each vessel commenced
25-year time charters. The Company’s share of the results of these vessels is
included in International—Other in the above table.
In
February 2008, MOQ awarded two service contracts to a joint venture between OSG
and Euronav NV for eight year terms. The Company has a 50% interest in this
joint venture. The service contracts provided for two ULCCs to be sold to
the joint venture and then converted to FSOs. The first ULCC entered the
joint venture in October 2008 and the second ULCC (the TI Africa, which was
owned by the Company) entered the joint venture in January 2009. For additional
information regarding the FSOs see Management’s Discussion and Analysis of
Financial Condition and Results of Operations set forth in Item 7, and Note H to
the Company’s financial statements set forth in Item 8. The Company’s share of
results of this joint venture is included in International—Crude in the above
table.
COMPETITION
The
shipping industry is highly competitive and fragmented with OSG competing with
other owners of U.S. and International Flag tankers. Competitors include other
independent shipowners and integrated oil companies and state owned entities
with their own fleets, oil traders with logistical operations, and
pipelines.
OSG’s
vessels compete with all other vessels of a size and type required by the
customer that can be available at the date specified. In the spot market,
competition is based primarily on price, although charterers are becoming more
selective with respect to the quality of the vessel they hire considering other
key factors such as the reliability and quality of operations and a preference
for modern double hull vessels based on concerns about environmental risks
associated with older vessels. Consequently, owners of large modern double hull
fleets have gained a competitive advantage over owners of older fleets. In the
time charter market, factors such as the age and quality of the vessel and
reputation of its owner and operator tend to be even more significant when
competing for business.
|
12
|
Overseas
Shipholding Group, Inc.
|
OSG’s
fleet of VLCCs and ULCCs is commercially managed though Tankers
International. Tankers International, with a total of 40 VLCCs and ULCCs as
of December 31, 2009 is a leading player in this highly competitive and
fragmented market. Its main competitors include Frontline Ltd., BW
Group Ltd., Mitsui OSK Lines, Ltd., Nippon Yusen Kabushiki Kaisha and
Agelef Shipping Co. (London) Ltd.
OSG
formed the Suezmax International pool in 2008. There are currently five tankers
in the pool that trades primarily in the Atlantic Basin and South America. The
main competitors of the Suezmax International pool include the Gemini Tankers
pool, the Stena Sonagol pool and the Blue Fin Tankers pool. Other competitors
include non-pool owners such as Dynacom Tankers Management, Ltd.,
Thenamaris Ships Management, Inc., Delta Tankers Ltd. and OAO
Sovcomflot.
OSG is a
founding member of Aframax International, which consists of 42 Aframaxes trading
primarily in the Atlantic Basin, North Sea, Baltic and the Mediterranean areas.
Aframax International is one of the largest operators in this market sector.
Aframax International’s main competitors include Teekay Corporation, General
Maritime Corporation and Sigma Tankers Inc.
OSG’s
main competitors in the highly fragmented Panamax trade include owners, trader’s
relets and pool operators. Substantially all of OSG’s fleet of Panamax tankers
is commercial managed by Panamax International, which commercially manages 21
double hull vessels. Main competitors include Star Tankers Inc., A/S
Dampskibsselskabet Torm and Scorpio Pool Management S.A.M.
In the
Handysize Product Carrier segment, OSG owns or charters-in a fleet of 26 vessels
that competes in a highly fragmented market. Seven of the OSG vessels are
operated in the Clean Product International Pool. Main competitors include
Glencore International AG, Handytankers K/S, Vitol Group, Trafigura, A/S
Dampskibsselskabet Torm, Navig8, Dorado Tankers Pool Inc. and OAO
Sovcomflot.
The U.S.
Jones Act restricts U.S. point-to-point seaborne shipments to vessels operating
under U.S. Flag that were built in the U.S., manned by U.S. crews and at least
75% owned and operated by U.S. citizens. OSG’s primary competitors are operators
of U.S. Flag oceangoing barges and tankers, such as Seacor Holdings Inc.,
Crowley Maritime Corporation and U.S. Shipping Corp. and operators of refined
product pipelines such as Colonial and Plantation pipeline systems that
transport refined petroleum products directly from refineries to
markets.
ENVIRONMENTAL
AND SECURITY MATTERS RELATING TO BULK SHIPPING
Government
regulation significantly affects the operation of the Company's vessels. OSG's
vessels are subject to international conventions, national, state and local laws
and regulations in force in the countries in which such vessels may operate or
are registered.
The
Company's vessels undergo regular and rigorous in-house safety reviews. In
addition, a variety of governmental and private entities subject the Company's
vessels to both scheduled and unscheduled inspections. These entities include
local port state control authorities (U.S. Coast Guard, harbor master or
equivalent), Classification Societies, flag state administration (country of
registry) and charterers, particularly major oil companies and petroleum
terminal operators. Certain of these entities require OSG to obtain permits,
licenses and certificates for the operation of the Company's vessels. Failure to
maintain necessary permits or approvals could require OSG to incur substantial
costs or temporarily suspend operation of one or more of the Company's
vessels.
The
Company believes that the heightened level of environmental and quality concerns
among insurance underwriters, regulators and charterers is leading to greater
inspection and safety requirements on all vessels. Increasing environmental
concerns have created a demand for tankers that conform to the stricter
environmental standards. The Company is required to maintain operating standards
for all of its tankers emphasizing operational safety, quality maintenance,
continuous training of its officers and crews and compliance with international
and U.S. regulations. OSG believes that the operation of its vessels is in
compliance with applicable environmental laws and regulations; however, because
such laws and regulations are frequently changed and may impose increasingly
stringent requirements, OSG cannot predict the ultimate cost of complying with
these requirements, or the impact of these requirements on the resale value or
useful lives of its tankers.
|
2009
Annual Report
|
13
|
International
and Domestic Greenhouse Gas Regulations
In
February 2005, the Kyoto Protocol to the United Nations Framework Convention on
Climate Change (commonly called the Kyoto Protocol) became
effective. Pursuant to the Kyoto Protocol, adopting countries are
required to implement national programs to reduce emissions of certain gases,
generally referred to as greenhouse gases, which contribute to global
warming. The European Union (“EU”) has indicated that it intends to
propose an expansion of the existing EU emissions trading scheme to include
emissions of greenhouse gases from vessels. In addition, climate
change-related legislation is pending before the U.S. Congress which, if
enacted, would limit and reduce greenhouse gas emissions through a
“cap-and-trade” system of allowances and credits and other
provisions. In the U.S., the Attorney Generals from 16 states and a
coalition of environmental groups in April 2008 filed a petition for a writ of
mandamus, or petition, with the D.C. Circuit Court of Appeals to request an
order requiring the U.S. Environmental Protection Agency, or EPA, to regulate
greenhouse gas emissions from ocean-going vessels under the Clean Air
Act. The court denied the petition in June 2008. Pursuant
to an April 2007 U.S. Supreme Court decision, EPA is required to consider
whether carbon dioxide should be considered a pollutant that endangers public
health and welfare, and thus subject to regulation under the Clean Air
Act. On December 1, 2009 the EPA issued an “endangerment finding”
regarding greenhouse gases under the Clean Air Act. The EPA found
that the current and projected concentrations of the six key well-mixed
greenhouse gases in the atmosphere—carbon dioxide (CO2), methane (CH4), nitrous
oxide (N2O), hydrofluorocarbons (HFCs), perfluorocarbons (PFCs), and sulfur
hexafluoride (SF6) – threaten the public health and welfare of
current and future generations. While this finding in itself does not
impose any requirements on industry or other entities, it authorizes the EPA to
regulate directly greenhouse gas emissions through a rule-making process. Future
passage of climate control legislation or other regulatory initiatives by the
IMO, EU, U.S. or other countries where we operate that restrict emissions of
greenhouse gases could result in financial and operational impacts on our
business, which impacts we cannot predict with certainty at this
time.
International
Environmental and Safety Restrictions and Regulations
Phase
Out of Non Double Hull Tankers:
In April
2001, the IMO adopted regulations under the International Convention for the
Prevention of Pollution from Ships, or MARPOL, requiring new tankers of 5,000
dwt and over, contracted for construction since July 6, 1993, to have
double hull, mid-deck or equivalent design. At that time the regulations also
required the phase out of non double hull tankers by 2015, with tankers having
double sides or double bottoms permitted to operate until the earlier of 2017 or
when the vessel reaches 25 years of age. Existing single hull tankers were
required to be phased out unless retrofitted with double hull, mid-deck or
equivalent design no later than 30 years after delivery. These regulations
were adopted by over 150 nations, including many of the jurisdictions in which
the Company's tankers operate. Subsequent amendments to the MARPOL regulations
accelerated the phase out of single hull tankers to 2005 (at the latest) for
Category I vessels and 2010 (at the latest) for Category II vessels.
Category I vessels include crude oil tankers of 20,000 dwt and above and
product carriers of 30,000 dwt and above that are pre-MARPOL Segregated Ballast
Tanks ("SBT") carriers. Category II vessels include crude oil vessels of
20,000 dwt and above and product carriers of 30,000 dwt and above that are
post-MARPOL SBT vessels.
In
addition, a Condition Assessment Scheme ("CAS") will apply to all single hull
tankers 15 years or older. Flag states, however, may permit the continued
operation of Category II tankers beyond 2010, subject to satisfactory CAS
results, but only to 2015 or 25 years of age, whichever comes earlier.
Category II tankers fitted with double bottoms or double sides not used for
the carriage of oil will be permitted to trade beyond 2010 to 25 years of
age, subject to the approval of the flag state. Although flag states may grant
life extensions to Category II tankers, port states are permitted to deny
entry to their ports and offshore terminals to single hull tankers operating
under such life extensions after 2010, and to double sided or double bottomed
tankers after 2015.
MARPOL
Regulation 13H banned the carriage of heavy grade oils ("HGO") in single
hull tankers of more than 5,000 dwt after April 5, 2005, except that flag
states may permit Category II tankers to continue to carry HGO beyond 2005
(until the vessel reaches 25 years of age), subject to satisfactory CAS
results. This regulation predominantly affected heavy crude oil from Latin
America, as well as heavy fuel oil, bitumen, tar and related
products.
The IMO
may adopt additional regulations in the future that could further restrict the
operation of single hull vessels.
EU
regulation (EC) No. 417/2002, which was introduced in the wake of the
sinking of the Erika off the coast of France in December 1999, provided a
timetable for the phase out of single hull tankers from EU waters. In 2003, in
response to the Prestige oil spill in November 2002, the EU adopted legislation
that (a) banned all Category I single hull tankers over the age of
23 years immediately, (b) phased out all other Category I single
hull tankers in 2005 and (c) prohibits all single hull tankers used for the
transport of oil from entering its ports or offshore terminals after 2010, with
double sided or double bottomed tankers permitted to trade until 2015 or until
reaching 25 years of age, whichever comes earlier. The EU, following the
lead of certain EU nations such as Italy and Spain, also banned all single hull
tankers carrying heavy grades of oil from entering or leaving its ports or
offshore terminals or anchoring in areas under its jurisdiction.
|
14
|
Overseas
Shipholding Group, Inc.
|
Many
users of oil transportation services operating around Europe are showing a
willingness to pay a higher freight rate for double hull tankers than for single
hull tankers. It is becoming increasingly more difficult to obtain clearance for
single hull tankers from many countries and oil terminals.
The
direct impact to the Company of the revised and accelerated IMO phase out
schedule is limited, as OSG's International Flag tanker fleet is comprised of
modern double hull vessels except for two chartered-in double sided Aframax
vessels, which do not qualify as double hull for MARPOL or EU purposes, that are
used exclusively in lightering activities in the U.S. Gulf. These two vessels
may not command premium rates if customers become less inclined to use non
double hull vessels generally or for this purpose. The Company's four double
bottom U.S. Flag Product Carriers participate in the U.S. Jones Act trades and
are therefore not affected by the IMO phase-out schedule. The U.S. has not
adopted the 2001 amendments to the MARPOL regulations, which were viewed as less
restrictive than OPA 90 regulations that were already in place.
Liability
Standards and Limits:
Many
countries have ratified and follow the liability plan adopted by the IMO and set
out in the International Convention on Civil Liability for Oil Pollution Damage
of 1969 (the "1969 Convention"). Some of these countries have also adopted the
1992 Protocol to the 1969 Convention (the "1992 Protocol"). Under both the 1969
Convention and the 1992 Protocol, a vessel's registered owner is strictly liable
for pollution damage caused in the territorial waters of a contracting state by
discharge of persistent oil, subject to certain complete defenses. These
conventions also limit the liability of the shipowner under certain
circumstances. As these conventions calculate liability in terms of a basket of
currencies, the figures in this section are converted into U.S. dollars based on
currency exchange rates on February 3, 2010.
Under the
1969 Convention, except where the owner is guilty of actual fault, its liability
is limited to $207 per gross ton (a unit of measurement for the total enclosed
spaces within a vessel) with a maximum liability of $21.8 million. Under
the 1992 Protocol, the owner's liability is limited except where the pollution
damage results from its personal act or omission, committed with the intent to
cause such damage, or recklessly and with knowledge that such damage would
probably result. Under the 2000 amendments to the 1992 Protocol, which became
effective on November 1, 2003, liability is limited to approximately
$7.0 million plus $980 for each additional gross ton over 5,000 for vessels
of 5,000 to 140,000 gross tons, and approximately $139.5 million for
vessels over 140,000 gross tons, subject to the exceptions discussed above for
the 1992 Protocol.
Vessels
trading to states that are parties to these conventions must provide evidence of
insurance covering the liability of the owner. The Company believes that its
P&I insurance will cover any liability under the plan adopted by the
IMO. See the discussion of Insurance below.
The U.S.
is not a party to the 1969 Convention or the 1992 Protocol. See the discussion
of Domestic Environmental and Safety Restrictions and Regulations below. In
other jurisdictions where the 1969 Convention has not been adopted, various
legislative schemes or common law govern, and liability is imposed either on the
basis of fault or in a manner similar to that convention.
The
International Convention on Civil Liability for Bunker Oil Pollution Damage,
2001, which was adopted on March 23, 2001 and became effective on
November 21, 2008, is a separate convention adopted to ensure that
adequate, prompt and effective compensation is available to persons who suffer
damage caused by spills of oil when used as fuel by vessels. The convention
applies to damage caused to the territory, including the territorial sea, and in
its exclusive economic zones, of states that are party to it. While the U.S. has
not yet ratified this convention, vessels operating internationally would be
subject to it, if sailing within the territories of those countries that have
implemented its provisions. The Company's vessels are currently in compliance
with these requirements.
Other
International Environmental and Safety Regulations:
Under the
International Safety Management Code, or ISM Code, promulgated by the IMO,
vessel operators are required to develop an extensive safety management system
that includes, among other things, the adoption of a safety and environmental
protection policy setting forth instructions and procedures for operating their
vessels safely and describing procedures for responding to emergencies. OSG has
developed such a safety management system. The ISM Code also requires that
vessel operators obtain a safety management certificate for each vessel they
operate. This certificate evidences compliance by a vessel's management with
code requirements for a safety management system. No vessel can obtain a
certificate unless its operator has been awarded a document of compliance,
issued by the flag state of that vessel, under the ISM Code.
|
2009
Annual Report
|
15
|
All of
the Company's vessels are certified under the standards promulgated by the
International Standards Organization in ISO 9001 in 2000 and ISO 14001
in 2004 and those promulgated by the IMO in its International Safety Management
("ISM") safety and pollution prevention protocols. The ISM Code requires a
document of compliance to be obtained for the vessel manager and a safety
management certificate to be obtained for each vessel that it operates. The
Company has obtained documents of compliance for its shore side offices that
have responsibility for vessel management and safety management certificates for
each of the vessels that such offices manage. These documents of compliance and
safety management certificates must be verified or renewed periodically
(annually or less frequently, depending on the type of document) in accordance
with the ISM Code.
IMO
regulations also require owners and operators of vessels to adopt Shipboard Oil
Pollution Emergency Plans, or SOPEPs. Periodic training and drills for response
personnel and for vessels and their crews are required. In addition to SOPEPs,
OSG has adopted Shipboard Marine Pollution Emergency Plans, or SMPEPs, which
cover potential releases not only of oil but of any noxious liquid substances
(known as NLSs).
Noncompliance
with the ISM Code and other IMO regulations may subject the shipowner or
charterer to increased liability, may lead to decreases in available insurance
coverage for affected vessels and may result in the denial of access to, or
detention in, some ports. For example, the U.S. Coast Guard and EU authorities
have indicated that vessels not in compliance with the ISM Code will be
prohibited from trading with U.S. and EU ports.
Other
EU Legislation and Regulations:
The EU
has adopted legislation that: (1) bans manifestly sub-standard vessels
(defined as those over 15 years old that have been detained by port
authorities at least twice in a six month period) from European waters, creates
an obligation for port states to inspect at least 25% of vessels using their
ports annually and provides for increased surveillance of vessels posing a high
risk to maritime safety or the marine environment, and (2) provides the EU
with greater authority and control over Classification Societies, including the
ability to seek to suspend or revoke the authority of negligent societies. In
addition, the EU is considering the adoption of criminal sanctions for certain
pollution events, such as the unauthorized discharge of tank washings. Certain
member states of the European Union, by virtue of their national legislation,
already impose criminal sanctions for pollution events under certain
circumstances. It is impossible to predict what additional legislation or
regulations, if any, may be promulgated by the EU or any other country or
authority.
International
Air Emission Standards:
Annex VI
to MARPOL, which was designed to address air pollution from vessels and which
became effective internationally on May 19, 2005, sets limits on sulfur
dioxide and nitrogen oxide emissions from ship exhausts and prohibits deliberate
emissions of ozone depleting substances, such as chlorofluorocarbons.
Annex VI also imposes a global cap (currently 4.50%) on the sulfur content
of fuel oil and allows for specialized areas to be established internationally
with more stringent controls on sulfur emissions. For vessels over 400 gross
tons, Annex VI imposes various survey and certification requirements. The
U.S. Maritime Pollution Prevention Act of 2008, signed into law by President
Bush in July 2008, amended the U.S. Act to Prevent Pollution from Ships to
provide for the adoption of Annex VI of MARPOL. In October 2008, the U.S.
became the 53rd state to ratify Annex VI, which came into force in the
U.S. on January 8, 2009.
Annex VI
was amended in 2008 to provide for a progressive and substantial reduction in
sulfur oxide ("SOx") and nitrogen oxide ("NOx") emissions from vessels and allow
for the designation of Emission Control Areas, for SOx and particulate matter,
or all three types of emissions from vessels, in which more stringent controls
would apply. The primary changes are that the global cap on the sulfur content
of fuel oil is reduced to 3.50% effective from January 1, 2012, and such
cap is further reduced progressively to 0.50% effective from January 1,
2020, subject to a feasibility review to be completed no later than
2018.
All
vessels in the Company's International and U.S. Flag fleets are currently
Annex VI compliant. However, additional or new conventions, laws and
regulations may be adopted in the future that could adversely affect the
Company's ability to comply with applicable air pollution regulations or could
result in material cost increases to assure such compliance.
|
16
|
Overseas
Shipholding Group, Inc.
|
Domestic
Environmental and Safety Restrictions and Regulations
The
U.S. regulates the shipping industry with an extensive regulatory and liability
regime for environmental protection and cleanup of oil spills, consisting
primarily of OPA 90, and the Comprehensive Environmental Response, Compensation,
and Liability Act, or CERCLA. OPA 90 affects all owners and operators whose
vessels trade with the U.S. or its territories or possessions, or whose vessels
operate in the waters of the U.S., which include the U.S. territorial sea and
the 200 nautical mile exclusive economic zone around the United States. CERCLA
applies to the discharge of hazardous substances (other than oil) whether on
land or at sea. Both OPA 90 and CERCLA impact the Company's
operations.
Phase
Out of Non Double Hull Tankers:
OPA 90
calls for the elimination of all single hull vessels by the year 2010 on a
phase-out schedule that is based on size and age, unless the tankers are
retrofitted with double hulls. The law permits existing single hull vessels to
operate until 2015 if they discharge at deep water ports, or lighter more than
60 miles offshore.
The
Company's four double bottom U.S. Flag Product Carriers will be affected by the
OPA 90 phase-out schedule in 2012 and 2013, with all four vessels being
30 years old when they are first affected by the phase-out schedule. The
OPA 90 phase-out dates for the Company's two double sided International Flag
lightering vessels are subsequent to their respective IMO phase-out
dates.
Liability
Standards and Limits:
Under OPA
90, vessel owners, operators and bareboat or demise charterers are "responsible
parties" who are liable, without regard to fault, for all containment and
clean-up costs and other damages, including property and natural resource
damages and economic loss without physical damage to property, arising from oil
spills and pollution from their vessels. In general, OPA 90 has historically
limited the liability of responsible parties to the greater of $1,200 per gross
ton or $10 million per vessel that is over 3,000 gross tons. Federal
legislation signed into law on July 11, 2006 increased these limits to the
greater of $1,900 per gross ton or $16 million per vessel that is over
3,000 gross tons (subject to possible adjustment for inflation). For OSG's
vessels, the increased limits became effective on October 9, 2006. The
statute specifically permits individual states to impose their own liability
regimes with regard to oil pollution incidents occurring within their
boundaries, and some states have enacted legislation providing for unlimited
liability for discharge of pollutants within their waters. In some cases, states
that have enacted this type of legislation have not yet issued implementing
regulations defining vessel owners' responsibilities under these laws. CERCLA,
which applies to owners and operators of vessels, contains a similar liability
regime and provides for cleanup, removal and natural resource damages associated
with discharges of hazardous substances (other than oil). Liability under CERCLA
is limited to the greater of $300 per gross ton or $5 million.
These
limits of liability do not apply, however, where the incident is caused by
violation of applicable U.S. federal safety, construction or operating
regulations, or by the responsible party's gross negligence or willful
misconduct. Similarly, these limits do not apply if the responsible party fails
or refuses to report the incident or to cooperate and assist in connection with
the substance removal activities. OPA 90 and CERCLA each preserve the right to
recover damages under existing law, including maritime tort law.
OPA 90
also requires owners and operators of vessels to establish and maintain with the
U.S. Coast Guard evidence of financial responsibility sufficient to meet the
limit of their potential strict liability under the statute. The U.S. Coast
Guard enacted regulations requiring evidence of financial responsibility
consistent with the previous limits of liability described above for OPA 90 and
CERCLA. Effective October 17, 2008, the Coast Guard updated its regulations
regarding required financial assurances to bring the amount of the required
financial assurance in line with the updated limits on liability provided for in
the 2006 amendments of OPA 90. Under the regulations, evidence of financial
responsibility may be demonstrated by insurance, surety bond, self-insurance,
guaranty or an alternative method subject to approval by the Director of the
U.S. Coast Guard National Pollution Funds Center. Under OPA 90 regulations, an
owner or operator of more than one vessel is required to demonstrate evidence of
financial responsibility for the entire fleet in an amount equal only to the
financial responsibility requirement of the vessel having the greatest maximum
strict liability under OPA 90 and CERCLA. OSG has provided the requisite
guarantees and has received certificates of financial responsibility from the
U.S. Coast Guard for each of its vessels required to have one.
OSG has
insurance for each of its vessels with pollution liability insurance in the
amount of $1 billion. However, a catastrophic spill could exceed the
insurance coverage available, in which event there could be a material adverse
effect on the Company's business.
|
2009
Annual Report
|
17
|
Other
Domestic Environmental and Safety Regulations:
OPA 90
also amended the Federal Water Pollution Control Act to require owners and
operators of vessels to adopt vessel response plans for reporting and responding
to oil spill scenarios up to a "worst case" scenario and to identify and ensure,
through contracts or other approved means, the availability of necessary private
response resources to respond to a "worst case discharge." The plans must
include contractual commitments with clean-up response contractors in order to
ensure an immediate response to an oil spill. The Company has developed and
filed its vessel response plans with the U.S. Coast Guard and has received
approval of such plans. The U.S. Coast Guard has announced its intention to
propose similar regulations requiring certain vessels to prepare response plans
for the release of hazardous substances.
OPA 90
also requires training programs and periodic drills for shore side staff and
response personnel and for vessels and their crews.
OPA 90
does not prevent individual U.S. states from imposing their own liability
regimes with respect to oil pollution incidents occurring within their
boundaries. In fact, most U.S. states that border a navigable waterway have
enacted environmental pollution laws that impose strict liability on a person
for removal costs and damages resulting from a discharge of oil or a release of
a hazardous substance. These laws are in some cases more stringent than U.S.
federal law.
In
addition, the U.S. Clean Water Act, or CWA, prohibits the discharge of oil or
hazardous substances in U.S. navigable waters and imposes strict liability in
the form of penalties for unauthorized discharges. The Clean Water Act also
imposes substantial liability for the costs of removal, remediation and damages
and complements the remedies available under the more recent OPA and CERCLA,
discussed above.
The EPA
had long exempted the discharge of ballast water and other substances incidental
to the normal operation of vessels in U.S. ports from the U.S. Clean Water Act
permitting requirements. However, on March 30, 2005, a U.S. District Court
ruled that the EPA exceeded its authority in creating an exemption for ballast
water. On September 18, 2006, the court issued an order invalidating the
exemption in EPA's regulations for all discharges incidental to the normal
operation of a vessel as of September 30, 2008 and directed EPA to develop
a system for regulating all discharges from vessels by that date. On
July 23, 2008, the United States Court of Appeals for the 9th Circuit
upheld the District Court's ruling, and the District Court subsequently issued
an order providing that the prior exemption from permitting would not be deemed
vacated until the extended date of December 19, 2008. As a result of the
judicial repeal of the exemption for ballast water, the Company's vessels are
subject to the U.S. Clean Water Act permitting requirements, including ballast
water treatment obligations and vessel discharge stream processing requirements
that could increase the cost of operating in the U.S. For example, repeal of the
ballast water exemption could require the installation of equipment on the
Company's vessels to treat ballast water before it is discharged or the
implementation of other port facility disposal arrangements or procedures at
potentially substantial cost and/or otherwise restrict the Company's vessels
from entering U.S. waters.
The EPA
has issued a Vessel General Permit, or VGP, which is deemed to cover all
regulated vessels as of February 6, 2009, addressing, among other matters,
the discharge of ballast water, and imposing new requirements, including
effluent limitations. The VGP identifies twenty-six vessel discharge streams,
establishes effluent limits for constituents of those streams and requires that
best management practices be implemented to decrease the amounts of certain
constituents of the discharges. The VGP does not impose numerical treatment
standards for the discharge of living organisms in ballast water. Rather, the
VGP mandates management practices that decrease the risk of introduction of
aquatic nuisance species to bodies of water receiving ballast water discharges.
The EPA has indicated, however, that as ballast water treatment technologies
become available in the future, the EPA will revisit its approach to the
management of ballast water discharges. In order to maintain coverage, the owner
or operator of the vessel subject to the regulations must file a Notice of
Intent to be covered no earlier than June 19, 2009 and no later than
September 19, 2009. The Company has filed such notices in compliance with
this requirement.
The VGP
system also permits individual states and territories to impose more stringent
requirements for discharges into the navigable waters of such state or
territory. Certain individual states have enacted legislation or regulations
addressing hull cleaning and ballast water management. For example, on
October 10, 2007, California Governor Schwarzenegger signed into law AB
740, legislation expanding regulation of ballast water discharges and the
management of hull-fouling organisms. California has extensive requirements for
more stringent effluent limits and discharge monitoring and testing requirements
with respect to discharges in its waters.
|
18
|
Overseas
Shipholding Group, Inc.
|
Legislation
has been proposed in the U.S. Congress to amend the Nonindigenous Aquatic
Nuisance Prevention and Control Act of 1990, which had been previously amended
and reauthorized by the National Invasive Species Act of 1996, to further
increase the regulation of ballast water discharges. However, it can not
currently be determined whether such legislation will eventually be enacted, and
if enacted, what requirements might be imposed on the Company’s operations under
such legislation.
Domestic
Air Emissions Standards:
As
discussed above, MARPOL Annex VI came into force in the U.S. in January
2009, although its U.S. implementing regulations have not all been finalized.
The Company's vessels are currently Annex VI compliant. Accordingly, absent
any new and onerous Annex VI implementing regulations, the Company does not
expect to incur material additional costs in order to comply with this
convention.
The U.S.
Clean Air Act of 1970, as amended by the Clean Air Act Amendments of 1977 and
1990, or CAA, requires the EPA to promulgate standards applicable to emissions
of volatile organic compounds and other air contaminants. OSG's vessels are
subject to vapor control and recovery requirements for certain cargoes when
loading, unloading, ballasting, cleaning and conducting other operations in
regulated port areas. Each of the Company's vessels operating in the transport
of clean petroleum products in regulated port areas where vapor control
standards are required has been outfitted with a vapor recovery system that
satisfies these requirements. In addition, in December 1999, the EPA issued a
final rule regarding emissions standards for marine diesel engines. The final
rule applies emissions standards to new engines beginning with the 2004 model
year. In the preamble to the final rule, the EPA noted that it may revisit the
application of emissions standards to rebuilt or remanufactured engines, if the
industry does not take steps to introduce new pollution control technologies. On
December 22, 2009, the EPA issued rules to increase the control of air pollutant
emissions from certain large marine engines by requiring certain new
marine-diesel engines installed on U.S. registered ships to meet lower nitrogen
oxide (NOx) standards which will be implemented in two phases. The new near-term
standards for newly built engines will apply beginning in 2011 and will require
more efficient use of current engine technologies, including engine timing,
engine cooling, and advanced computer controls to achieve a 15 to 25 percent NOx
reduction below the current levels. The new long-term standards for newly built
engines will apply beginning in 2016 and will require the use of high efficiency
emission control technology such as selective catalytic reduction to achieve NOx
reductions 80 percent below the current levels. Adoption of these and emerging
standards may require substantial modifications to some of the Company’s
existing marine diesel engines and may require the Company to incur substantial
capital expenditures.
Lightering
activities in Delaware are subject to Title V of the CAA, and OSG is the only
marine operator with a Title V permit to engage in lightering operations. The
State of Delaware is in non-compliance with EPA requirements for volatile
organic compounds, or VOCs. OSG's U.S. Flag lightering operations are the State
of Delaware's largest single source of VOCs. The Delaware Department of Natural
Resources and Environment Control, or DNREC, is currently engaged in rule making
to address emissions of VOCs from lightering operations, and the Company is
working closely with DNREC to craft regulations designed to reduce such
emissions. New regulations designed to reduce the release of VOCs during crude
oil lightering went into effect on May 11, 2007. In cooperation with DNREC,
the Company's U.S. Flag operations have engaged in a pilot project involving
vapor balancing between one of its tankers and "ships to be lightered." In
addition, OSG continues to evaluate other vapor reduction technologies and has
incorporated vapor control technologies in the design of the Company's new
ATBs.
The CAA
also requires states to draft State Implementation Plans, or SIPs, designed to
attain national health-based air quality standards in major metropolitan and
industrial areas. Where states fail to present approvable SIPs, or SIP revisions
by certain statutory deadlines, the U.S. government is required to draft a
Federal Implementation Plan. Several SIPs regulate emissions resulting from
barge loading and degassing operations by requiring the installation of vapor
control equipment. Where required, the Company's vessels are already equipped
with vapor control systems that satisfy these requirements. Although a risk
exists that new regulations could require significant capital expenditures and
otherwise increase its costs, the Company believes, based upon the regulations
that have been proposed to date, that no material capital expenditures beyond
those currently contemplated and no material increase in costs are likely to be
required as a result of the SIPs program.
Individual
states have been considering their own restrictions on air emissions from
engines on vessels operating within state waters. California regulations of
emissions of diesel particulate matter, nitrogen oxides and sulfur oxides from
the use of certain types of engines on ocean-going vessels within California
waters became effective January 1, 2007. On February 27, 2008, the
U.S. Court of Appeals for the 9th Circuit ruled that these California
regulations were preempted by federal law. However, on July 24, 2008, the
California Air Resources Board adopted new regulations providing for the
phasing-in of requirements that certain vessels operating within 24 nautical
miles of the Californian coast reduce air pollution by using only low-sulfur
marine distillate fuel rather than bunker fuel. The Company's vessels that
operate in California waters are in compliance with these
regulations.
|
2009
Annual Report
|
19
|
Security
Regulations
As
of July 1, 2004, all vessels involved in international commerce and the
port facilities that interface with those vessels must comply with the
International Ship and Port Facility Security Code ("ISPS Code"). This includes
passenger vessels, cargo vessels over 500 gross tons, and mobile offshore
drilling rigs. The ISPS Code provides a set of measures and procedures to
prevent acts of terrorism, which threaten the security of passengers and crew
and the safety of vessels and port facilities. All of OSG's Ship Security Plans
for its vessels have been approved by the appropriate regulatory authorities and
have been implemented.
Each of
the Company's vessels has obtained an International Ship Security Certificate
from a recognized security organization approved by the appropriate flag states
and each vessel has developed and implemented an approved Ship Security
Plan.
Insurance
Consistent
with the currently prevailing practice in the industry, the Company presently
carries protection and indemnity ("P&I") insurance coverage for pollution of
$1.0 billion per occurrence on every vessel in its fleet. P&I insurance is
provided by mutual protection and indemnity associations ("P&I
Associations"). The P&I Associations that comprise the International Group
insure approximately 90% of the world's commercial tonnage and have entered into
a pooling agreement to reinsure each association's liabilities. Each P&I
Association has capped its exposure to each of its members at approximately
$5.45 billion. As a member of a P&I Association which is a member of the
International Group, the Company is subject to calls payable to the Associations
based on its claim record as well as the claim records of all other members of
the individual Associations of which it is a member, and the members of the pool
of P&I Associations comprising the International Group. As of December 31,
2009, the Company was a member of three P&I Associations with each of its
vessels insured by one of these three Associations. While the Company has
historically been able to obtain pollution coverage at commercially reasonable
rates, no assurances can be given that such insurance will continue to be
available in the future.
The
Company carries marine hull and machinery and war risk insurance, which includes
the risk of actual or constructive total loss, for all of its vessels. The
vessels are each covered up to at least their fair market value, with
deductibles ranging from $100,000 to $500,000 per vessel per incident. The
Company is self insured for hull and machinery claims in amounts in excess of
the individual vessel deductibles up to a maximum aggregate loss of $3,500,000,
per policy year.
The
Company currently maintains loss of hire insurance to cover loss of charter
income resulting from accidents or breakdowns of its vessels that are covered
under the vessels' marine hull and machinery insurance. Loss of hire insurance
covers up to 180 days lost charter income per vessel per incident in excess of
the first 60 days lost for each covered incident, which is borne by the
Company.
Taxation
of the Company
The
following summary of the principal United States tax laws applicable to the
Company, as well as the conclusions regarding certain issues of tax law, are
based on the provisions of the U.S. Internal Revenue Code of 1986, as amended
(the “Code”), existing and proposed U.S. Treasury Department regulations,
administrative rulings, pronouncements and judicial decisions, all as of the
date of this Annual Report. No assurance can be given that changes in or
interpretation of existing laws will not occur or will not be retroactive or
that anticipated future circumstances will in fact occur. The Company’s views
should not be considered official, and no assurance can be given that the
conclusions discussed below would be sustained if challenged by taxing
authorities.
All of
the Company’s International Flag vessels are owned or operated by foreign
corporations that are subsidiaries of OSG International, Inc., a wholly
owned subsidiary of the Company incorporated in the Marshall Islands (“OIN”).
These corporations have made special U.S. tax elections under which they are
treated as “branches” of OIN rather than separate corporations for U.S. federal
income tax purposes.
As a
result of changes made by the American Jobs Creation Act of 2004 (“2004 Act”),
as discussed below, for taxable years beginning after December 31, 2004,
the Company is no longer required to report taxable income on a current basis
the undistributed foreign shipping income earned by OIN under the
“Subpart F” provisions of the Code.
Legislation
has been proposed that is aimed at deferring the claiming by a taxpayer of
interest deductions attributable to foreign source income that is not subject to
current U.S. taxation until the income is repatriated. The enactment of such
proposed legislation is uncertain and the effect on the Company can not be
determined until agreement has been reached on the exact wording of the
provision.
|
20
|
Overseas
Shipholding Group, Inc.
|
Taxation
to OIN of its Shipping Income: In General
OIN
derives substantially all of its gross income from the use and operation of
vessels in international commerce. This income principally consists of hire from
time and voyage charters for the transportation of cargoes and the performance
of services directly related thereto, which is referred to herein as “shipping
income.”
Shipping
income that is attributable to transportation that begins or ends, but that does
not both begin and end, in the U.S. will be considered to be 50% derived from
sources within the United States. Shipping income attributable to transportation
that both begins and ends in the United States will be considered to be 100%
derived from sources within the United States. OIN does not engage in
transportation that gives rise to 100% U.S. source income. Shipping income
attributable to transportation exclusively between non-U.S. ports will be
considered to be 100% derived from sources outside the United States. Shipping
income derived from sources outside the U.S. will not be subject to any U.S.
federal income tax. OIN’s vessels will operate in various parts of the world,
including to or from U.S. ports. Unless exempt from U.S. taxation under
Section 883 of the Code, OIN will be subject to U.S. federal income
taxation of 4% of its U.S. source shipping income on a gross basis without the
benefit of deductions.
Application
of Code Section 883
Under
Section 883 of the Code and temporary Treasury regulations, OIN will be
exempt from the foregoing U.S. taxation of its U.S source shipping income if,
for more than half of the days in its taxable year, it is a “controlled foreign
corporation” within the meaning of Section 957 of the Code and more than
50 percent of the total value of its stock is owned by certain U.S. persons
including a domestic corporation. These requirements should be met and therefore
OIN should continue to benefit from the application of Section 883 of the
Code. To the extent OIN is unable to qualify for exemption from tax under
Section 883, OIN’s U.S. source shipping income will become subject to the
4% gross basis tax regime described above.
Taxation
to OSG of OIN’s Shipping Income
For
taxable years beginning on or after January 1, 1987 and ending on or before
December 31, 2004, the Company, as a 10% shareholder or more of controlled
foreign corporations, was subject to current taxation on the shipping income of
its foreign subsidiaries. To make U.S.-controlled shipping companies competitive
with foreign-controlled shipping companies, through the passage of the 2004 Act,
Congress repealed the current income inclusion by 10% shareholders of the
shipping income of controlled foreign corporations. Accordingly, for years
beginning on or after January 1, 2005, the Company is not required to
include in income OIN’s undistributed shipping income.
For
taxable years beginning on or after January 1, 1976 and ending on or before
December 31, 1986, the Company was not required to include in income the
undistributed shipping income of its foreign subsidiaries that was reinvested in
qualified shipping assets. For taxable years beginning on or after
January 1, 1987, the Company is required to include in income the deferred
shipping income from this period to the extent that at the end of any year the
investment in qualified shipping assets is less than the corresponding amount at
December 31, 1986. By virtue of the nature of OIN’s business, the Company
anticipates that the recognition of this deferred income will be postponed
indefinitely. This is discussed in more detail in the notes to the Company’s
consolidated financial statements set forth in Item 8.
U.S.
Tonnage Tax Regime
The 2004
Act changed the U.S. tax treatment of the foreign operations of the Company’s
U.S. Flag vessels by allowing it to make an election to have such vessels taxed
under a new “tonnage tax” regime rather than the usual U.S. corporate income tax
regime. Because OSG made the tonnage tax election, its gross income for U.S.
income tax purposes with respect to eligible U.S. flag vessels for 2005 and
subsequent years does not include (1) income from qualifying shipping
activities in U.S. foreign trade (i.e., transportation
between the U.S. and foreign ports or between foreign ports), (2) income
from cash, bank deposits and other temporary investments that are reasonably
necessary to meet the working capital requirements of qualifying shipping
activities, and (3) income from cash or other intangible assets accumulated
pursuant to a plan to purchase qualifying shipping assets. The Company’s taxable
income with respect to the operations of its eligible U.S. Flag vessels is based
on a “daily notional taxable income,” which is taxed at the highest U.S.
corporate income tax rate. The daily notional taxable income from the operation
of a qualifying vessel is 40 cents per 100 tons of the net tonnage of the vessel
up to 25,000 net tons, and 20 cents per 100 tons of the net tonnage of the
vessel in excess of 25,000 net tons. The taxable income of each qualifying
vessel is the product of its daily notional taxable income and the number of
days during the taxable year that the vessel operates in U.S. foreign
trade.
|
2009
Annual Report
|
21
|
Glossary
Aframax—A
medium size crude oil tanker of approximately 80,000 to 120,000 deadweight tons.
Modern Aframaxes can generally transport from 500,000 to 800,000 barrels of
crude oil and are also used in Lightering.
Articulated
Tug Barge—ATB is the abbreviation for Articulated Tug Barge, which is a
tug-barge combination system capable of operating on the high seas, coastwise
and further inland. It combines a normal barge, with a bow resembling that of a
ship, but having a deep indent at the stern to accommodate the bow of a tug. The
fit is such that the resulting combination behaves almost like a single vessel
at sea as well as while maneuvering.
Bareboat
Charter—A Charter under which a customer pays a fixed daily or monthly rate for
a fixed period of time for use of the vessel. The customer pays all costs of
operating the vessel, including voyage and vessel expenses. Bareboat charters
are usually long term.
CAP—The
Condition Assessment Program of ABS Consulting, a subsidiary of the American
Bureau of Shipping, which evaluates a vessel’s operation, machinery, maintenance
and structure using the ABS Safe Hull Criteria. A CAP 1 rating indicates
that a vessel meets the standards of a newly built vessel.
Capesize
Bulk Carrier—A large Dry Bulk Carrier (any vessel used to carry non-liquid bulk
commodities) with a carrying capacity of more than 80,000 deadweight tons that
mainly transports iron ore and coal.
Charter—Contract
entered into with a customer for the use of the vessel for a specific voyage at
a specific rate per unit of cargo (“Voyage Charter”), or for a specific period
of time at a specific rate per unit (day or month) of time (“Time
Charter”).
Classification
Societies—Organizations that establish and administer standards for the design,
construction and operational maintenance of vessels. As a practical matter,
vessels cannot trade unless they meet these standards.
Compressed
Natural Gas or CNG—CNG is the abbreviation for compressed natural gas. CNG is a
gas that has been compressed for transportation in pressurized containers and
can be transported on ships, barges or trucks. In many parts of the world, gas
fields that cannot be readily connected by pipeline or are not large enough to
support the cost of developing LNG facilities are excellent candidates for CNG
development.
Commercial
Management or Commercially Managed—The management of the employment, or
chartering, of a vessel and associated functions, including seeking and
negotiating employment for vessels, billing and collecting revenues, issuing
voyage instructions, purchasing fuel, and appointing port agents.
Commercial
Pool—A commercial pool is a group of similar size and quality vessels with
different shipowners that are placed under one administrator or manager. Pools
allow for scheduling and other operating efficiencies such as multi-legged
charters and Contracts of Affreightment and other operating
efficiencies.
Condition
Assessment Scheme—An inspection program designed to check and report on the
vessel’s physical condition and on its past performance based on survey and
IMO’s International Safety Management audit reports and port state performance
records.
Contract
of Affreightment or COA—COA is the abbreviation for Contract of Affreightment,
which is an agreement providing for the transportation between specified points
for a specific quantity of cargo over a specific time period but without
designating specific vessels or voyage schedules, thereby allowing flexibility
in scheduling since no vessel designation is required. COAs can either have a
fixed rate or a market-related rate. One example would be two shipments of
70,000 tons per month for two years at the prevailing spot rate at the time of
each loading.
Consecutive
Voyage Charters or CVC—CVC is the abbreviation for Consecutive Voyage Charter,
which are used when a customer contracts for a particular vessel for a certain
period of time to transport cargo between specified points for a rate that is
determined based on the volume of cargo delivered. The Company bears the risk of
delays under CVC arrangements.
Crude
Oil—Oil in its natural state that has not been refined or altered.
Cubic
Meters or cbm—cbm is the abbreviation for cubic meters, the industry standard
for measuring the carrying capacity of a LNG Carrier.
|
22
|
Overseas
Shipholding Group, Inc.
|
Deadweight
tons or dwt—dwt is the abbreviation for deadweight tons, representing
principally the cargo carrying capacity of a vessel, but including the weight of
consumables such as fuel, lube oil, drinking water and stores.
Demurrage—Additional
revenue paid to the shipowner on its Voyage Charters for delays experienced in
loading and/or unloading cargo that are not deemed to be the responsibility of
the shipowner, calculated in accordance with specific Charter
terms.
Double
Hull—Hull construction design in which a vessel has an inner and an outer side
and bottom separated by void space, usually two meters in width.
Drydocking—An
out-of-service period during which planned repairs and maintenance are carried
out, including all underwater maintenance such as external hull painting. During
the drydocking, certain mandatory Classification Society inspections are carried
out and relevant certifications issued. Normally, as the age of a vessel
increases, the cost of drydocking increases.
Floating
Storage Offloading Unit or FSO—A converted or new build barge or tanker, moored
at a location to receive crude or other products for storage and transfer
purposes. FSOs are not equipped with processing facilities.
FSU—Former
Soviet Union.
Handysize
Product Carrier—A small size Product Carrier of approximately 29,000 to 53,000
deadweight tons. This type of vessel generally operates on shorter routes (short
haul). Also, may be referred to as an MR Product Carrier.
IMO—IMO
is the abbreviation for International Maritime Organization, an agency of the
United Nations, which is the body that is responsible for the administration of
internationally developed maritime safety and pollution treaties, including
MARPOL.
International
Flag vessel—A vessel that is registered under a flag other than that of the
U.S.
Jones
Act—U.S. law that applies to port-to-port shipments within the continental U.S.
and between the continental U.S. and Hawaii, Alaska, Puerto Rico, and Guam, and
restricts such shipments to U.S. Flag Vessels that are built in the U.S. and
that are owned by a U.S. company that is more than 75% owned and controlled by
U.S. citizens.
Lightering—The
process of off-loading crude oil or petroleum products from large size tankers,
typically VLCCs, into smaller tankers and/or barges for discharge in ports from
which the larger tankers are restricted due to the depth of the water, narrow
entrances or small berths.
LNG
Carrier—A vessel designed to carry liquefied natural gas, that is, natural gas
cooled to −163° centigrade, turning it into a liquid and reducing its volume to
1/600 of its volume in gaseous form. LNG is the abbreviation for liquefied
natural gas.
LR1—A
coated Panamax tanker. LR is an abbreviation is Long Range.
MARPOL—International
Convention for the Prevention of Pollution from Ships, 1973, as modified by the
Protocol of 1978 relating thereto. This convention includes regulations aimed at
preventing and minimizing pollution from ships by accident and by routine
operations.
MR—A
Handysize Product Carrier. MR is an abbreviation is Medium Range.
OECD—Organization
for Economic Cooperation and Development is a group of 30 developed countries in
North America, Europe and Asia.
OPA
90—OPA 90 is the abbreviation for the U.S. Oil Pollution Act of
1990.
Panamax—A
medium size vessel of approximately 53,000 to 80,000 deadweight tons. A coated
Panamax operating in the refined petroleum products trades may be referred to as
an LR1.
|
2009
Annual Report
|
23
|
Product
Carrier—General term that applies to any tanker that is used to transport
refined oil products, such as gasoline, jet fuel or heating oil.
Pure Car
Carrier—A single-purpose vessel with many decks, designed to carry automobiles,
which are driven on and off using ramps.
Safety
Management System or SMS—A framework of processes and procedures that addresses
a spectrum of operational risks associated with quality, environment, health and
safety. The MMS is certified by ISM (International Safety Management
Code), ISO 9001 (Quality Management) and ISO 14001 (Environmental
Management).
Scrapping—The
disposal of vessels by demolition for scrap metal.
Special
Survey—An extensive inspection of a vessel by classification society surveyors
that must be completed once within every five year period. Special Surveys
require a vessel to be drydocked.
Suezmax—A
large crude oil tanker of approximately 120,000 to 200,000 deadweight tons.
Modern Suezmaxes can generally transport about one million barrels of crude
oil.
Technical
Management—The management of the operation of a vessel, including physically
maintaining the vessel, maintaining necessary certifications, and supplying
necessary stores, spares, and lubricating oils. Responsibilities also generally
include selecting, engaging and training crew, and arranging necessary insurance
coverage.
Time
Charter—A Charter under which a customer pays a fixed daily or monthly rate for
a fixed period of time for use of the vessel. Subject to any restrictions in the
Charter, the customer decides the type and quantity of cargo to be carried and
the ports of loading and unloading. The customer pays all voyage expenses such
as fuel, canal tolls, and port charges. The shipowner pays all vessel expenses
such as the Technical Management expenses.
Time
Charter Equivalent or TCE—TCE is the abbreviation for Time Charter Equivalent.
TCE revenues, which is voyage revenues less voyage expenses, serves as an
industry standard for measuring and managing fleet revenue and comparing results
between geographical regions and among competitors.
Tonne-mile
demand—A calculation that multiplies the average distance of each route a tanker
travels by the volume of cargo moved. The greater the increase in long haul
movement compared with shorter haul movements, the higher the increase in
tonne-mile demand.
ULCC—ULCC
is an abbreviation for Ultra Large Crude Carrier, a crude oil tanker of more
than 350,000 deadweight tons. Modern ULCCs can transport three million
barrels of crude oil and are mainly used on the same long haul routes as
VLCCs.
U.S. Flag
vessel—A U.S. Flag vessel must be crewed by U.S. sailors, and owned and operated
by a U.S. company.
Vessel
Expenses—Includes crew costs, vessel stores and supplies, lubricating oils,
maintenance and repairs, insurance and communication costs associated with the
operations of vessels.
VLCC—VLCC
is the abbreviation for Very Large Crude Carrier, a large crude oil tanker of
approximately 200,000 to 320,000 deadweight tons. Modern VLCCs can generally
transport two million barrels or more of crude oil. These vessels are mainly
used on the longest (long haul) routes from the Arabian Gulf to North America,
Europe, and Asia, and from West Africa to the U.S. and Far Eastern
destinations.
Voyage
Charter—A Charter under which a customer pays a transportation charge for the
movement of a specific cargo between two or more specified ports. The shipowner
pays all voyage expenses, and all vessel expenses, unless the vessel to which
the Charter relates has been time chartered in. The customer is liable for
Demurrage, if incurred.
Voyage
Expenses—Includes fuel, port charges, canal tolls, cargo handling operations and
brokerage commissions paid by the Company under Voyage Charters. These expenses
are subtracted from shipping revenues to calculate Time Charter Equivalent
Revenues for Voyage Charters.
|
24
|
Overseas
Shipholding Group, Inc.
|
Worldscale—Industry
name for the Worldwide Tanker Nominal Freight Scale published annually by the
Worldscale Association as a rate reference for shipping companies, brokers, and
their customers engaged in the bulk shipping of oil in the international
markets. Worldscale is a list of calculated rates for specific voyage
itineraries for a standard vessel, as defined, using defined voyage cost
assumptions such as vessel speed, fuel consumption and port costs. Actual market
rates for voyage charters are usually quoted in terms of a percentage of
Worldscale.
Available
Information
The
Company makes available free of charge through its internet website, www.osg.com, its Annual
Report on Form 10-K, quarterly reports on Form 10-Q, current reports on Form 8-K
and amendments to these reports filed or furnished pursuant to
Section 13(a) or 15(d) of the Securities Exchange Act of 1934, as amended,
as soon as reasonably practicable after the Company electronically files such
material with, or furnishes it to, the Securities and Exchange
Commission.
The
Company also makes available on its website, its corporate governance
guidelines, its code of business conduct, and charters of the Audit Committee,
Compensation Committee and Corporate Governance and Nominating Committee of the
Board of Directors.
ITEM
1A. RISK FACTORS
The
following important risk factors could cause actual results to differ materially
from those contained in the forward-looking statements made in this report or
presented elsewhere by management from time to time. If any of the circumstances
or events described below actually arise or occur, the Company’s business,
results of operations and financial condition could be materially adversely
affected.
Industry
specific risk factors:
The
highly cyclical nature of the industry may lead to volatile changes in charter
rates and vessel values, which may adversely affect the Company’s
earnings
Factors
affecting the supply and demand for vessels are outside of the Company’s
control, and the nature, timing and degree of changes in industry conditions are
unpredictable and may adversely affect the values of the Company’s vessels and
result in significant fluctuations in the amount of charter hire the Company may
earn, which could result in significant fluctuations in OSG’s quarterly results.
The factors that influence the demand for tanker capacity include:
|
•
|
demand
for oil and oil products, which affect the need for vessel
capacity;
|
|
•
|
global
and regional economic and political conditions which among other things,
could impact the supply of oil as well as trading patterns and the demand
for various types of vessels;
|
|
•
|
changes
in the production of crude oil, particularly by OPEC and other key
producers, which impact the need for vessel
capacity;
|
|
•
|
developments
in international trade;
|
|
•
|
changes
in seaborne and other transportation patterns, including changes in the
distances that cargoes are
transported;
|
|
•
|
environmental
concerns and regulations;
|
|
•
|
new
pipeline construction and
expansions;
|
|
•
|
weather;
and
|
|
•
|
competition
from alternative sources of energy.
|
The
factors that influence the supply of vessel capacity include:
|
•
|
the
number of newbuilding deliveries;
|
|
•
|
the
scrapping rate of older vessels;
|
|
2009
Annual Report
|
25
|
|
•
|
the
number of vessels that are used for storage or as floating storage
offloading service vessels;
|
|
•
|
the
conversion of vessels from transporting oil and oil products to carrying
dry bulk cargo and the reverse
conversion;
|
|
•
|
the
number of vessels that are out of service;
and
|
|
•
|
environmental
and maritime regulations.
|
An
increase in the supply of vessels without an increase in demand for such vessels
could cause charter rates to decline, which could have a material adverse effect
on OSG’s revenues and profitability
Historically,
the marine transportation industry has been cyclical. The profitability and
asset values of companies in the industry have fluctuated based on changes in
the supply and demand of vessels. The supply of vessels generally increases with
deliveries of new vessels and decreases with the scrapping of older vessels. The
newbuilding order book equaled 31% of the existing world tanker fleet as of
December 31, 2009 and no assurance can be given that the order book will
not increase further in proportion to the existing fleet. If the number of new
ships delivered exceeds the number of vessels being scrapped, capacity will
increase. In addition, if dry bulk vessels are converted to oil tankers, the
supply of oil tankers will increase. If supply increases and demand does not,
the charter rates for the Company’s vessels could decline significantly. A
decline in charter rates could have a material adverse effect on OSG’s revenues
and profitability.
Charter
rates may decline from their current level, which could have a material adverse
effect on OSG’s revenues and profitability
Because
many of the factors that influence the supply of, and demand for, tanker
capacity are unpredictable and beyond the Company’s control, the nature, timing
and degree of changes in charter rates are unpredictable. The global economic
recession that started in 2008 and its accompanying adverse impact on demand has
resulted in a decline in charter rates. The lower charter rates have adversely
affected OSG’s revenues and profitability and any additional declines in charter
rates could have a material adverse effect on OSG’s revenues and
profitability.
OSG’s
revenues are subject to seasonal variations
OSG
operates its tankers in markets that have historically exhibited seasonal
variations in demand for tanker capacity, and therefore, charter rates. Charter
rates for tankers are typically higher in the fall and winter months as a result
of increased oil consumption in the Northern Hemisphere. Because a majority of
the Company’s vessels trade in the spot market, seasonality has affected OSG’s
operating results on a quarter-to-quarter basis and could continue to do so in
the future.
The
global economic recession and constraints on capital availability that commenced
in 2008 adversely affects the tanker industry and OSG’s business
The
current global economic recession and constraints on capital have adversely
affected the financial condition of entities throughout the world, including
certain of the Company’s customers, joint venture partners, financial lenders
and suppliers, including shipyards from whom the Company has contracted to
purchase vessels. Those entities that suffer a material adverse impact on their
financial condition may be unable or unwilling to comply with their contractual
commitments to OSG which, in turn, could have an adverse impact on OSG. The
failure of entities to comply with contractual commitments could include the
refusal or inability of customers to pay charter hire to OSG, shipyards’ failure
to construct and deliver to OSG newbuilds or joint ventures’ or financial
lenders’ inability or unwillingness to honor their commitments, such as to
contribute funds to a joint venture with OSG or to lend funds to OSG. While OSG
seeks to monitor the financial condition of such entities, the availability and
accuracy of information about the financial condition of such entities may be
limited and the actions that OSG may take to reduce possible losses resulting
from the failure of such entities to comply with their contractual obligations
may be restricted. See also under the heading “Company specific risk factors”
below the risk factor concerning credit risks with counterparties.
Terrorist
attacks, piracy and international hostilities can affect the tanker industry,
which could adversely affect OSG’s business
Additional
terrorist attacks like those in New York on September 11, 2001 and in
London on July 7, 2005, piracy attacks against merchant ships, including
oil tankers, particularly in the Gulf of Aden and off the East Coast of Africa,
especially Somalia, the outbreak of war, or the existence of international
hostilities could damage the world economy, adversely affect the availability of
and demand for crude oil and petroleum products and adversely affect the
Company’s ability to re-charter its vessels on the expiration or termination of
the charters and the charter rates payable under any renewal or replacement
charters. The Company conducts its operations internationally, and its business,
financial condition and results of operations may be adversely affected by
changing economic, political and government conditions in the countries and
regions where its vessels are employed. Moreover, OSG operates in a sector of
the economy that is likely to be adversely impacted by the effects of political
instability, terrorist or other attacks, war, international hostilities or
piracy.
|
26
|
Overseas
Shipholding Group, Inc.
|
The
market value of vessels fluctuates significantly, which could adversely affect
OSG’s liquidity, result in breaches of its financing agreements or otherwise
adversely affect its financial condition
The
market value of vessels has fluctuated over time. The fluctuation in market
value of vessels over time is based upon various factors,
including:
|
•
|
age
of the vessel;
|
|
•
|
general
economic and market conditions affecting the tanker industry, including
the availability of vessel
financing;
|
|
•
|
number
of vessels in the world fleet;
|
|
•
|
types
and sizes of vessels available;
|
|
•
|
changes
in trading patterns affecting demand for particular sizes and types of
vessels;
|
|
•
|
cost
of newbuildings;
|
|
•
|
prevailing
level of charter rates;
|
|
•
|
competition
from other shipping companies;
|
|
•
|
other
modes of transportation; and
|
|
•
|
technological
advances in vessel design and
propulsion.
|
Declining
values of the Company’s vessels could adversely affect its liquidity by limiting
its ability to raise cash by refinancing vessels. Declining vessel values could
also result in a breach of loan covenants or trigger events of default under
relevant financing agreements that require the Company to maintain certain
loan-to-value ratios. In such instances, if OSG is unable or unwilling to pledge
additional collateral to offset the decline in vessel values, its lenders could
accelerate its debt and foreclose on its vessels pledged as collateral for the
loans.
Shipping
is a business with inherent risks, and OSG’s insurance may not be adequate to
cover its losses
OSG’s
vessels and their cargoes are at risk of being damaged or lost because of events
such as:
|
•
|
marine
disasters;
|
|
•
|
bad
weather;
|
|
•
|
mechanical
failures;
|
|
•
|
human
error;
|
|
•
|
war,
terrorism and piracy; and
|
|
•
|
other
unforeseen circumstances or events.
|
In
addition, transporting crude oil creates a risk of business interruptions due to
political circumstances in foreign countries, hostilities, labor strikes, port
closings and boycotts. Any of these events may result in loss of revenues and
increased costs.
|
2009
Annual Report
|
27
|
The
Company carries insurance to protect against most of the accident-related risks
involved in the conduct of its business. OSG currently maintains one billion
dollars in coverage for each of its vessels for liability for spillage or
leakage of oil or pollution. OSG also carries insurance covering lost revenue
resulting from vessel off-hire due to vessel damage. Nonetheless, risks may
arise against which the Company is not adequately insured. For example, a
catastrophic spill could exceed OSG’s insurance coverage and have a material
adverse effect on its operations. In addition, OSG may not be able to procure
adequate insurance coverage at commercially reasonable rates in the future, and
OSG cannot guarantee that any particular claim will be paid. In the past, new
and stricter environmental regulations have led to higher costs for insurance
covering environmental damage or pollution, and new regulations could lead to
similar increases or even make this type of insurance unavailable. Furthermore,
even if insurance coverage is adequate to cover the Company’s losses, OSG may
not be able to timely obtain a replacement ship in the event of a loss. OSG may
also be subject to calls, or premiums, in amounts based not only on its own
claim records but also the claim records of all other members of the
P & I Associations through which OSG obtains insurance coverage for
tort liability. OSG’s payment of these calls could result in significant
expenses which would reduce its profits or cause losses.
Because
OSG conducts its business on a worldwide basis, OSG faces a number of
significant risks that could result in losses or higher costs
The
Company’s vessels operate all over the world, exposing it to many risks,
including:
|
•
|
changing
economic, political and social conditions in the countries where OSG does
business or where its vessels are registered or
flagged;
|
|
•
|
the
imposition of increased environmental and safety regulations by
international organizations, Classification Societies, flag states and
port states;
|
|
•
|
the
imposition of taxes by flag states, port states and jurisdictions in which
OSG or its subsidiaries are incorporated or where its vessels
operate;
|
|
•
|
currency
fluctuations;
|
|
•
|
pandemics
or epidemics which may result in a disruption of worldwide trade including
quarantines of certain areas;
|
|
•
|
terrorism,
piracy and war, including the possible outbreak of hostilities that could
reduce or otherwise affect the movement of oil from the Middle East;
and
|
|
•
|
expropriation
of its vessels.
|
As a
result of these risks, OSG may incur losses or higher costs, including those
incurred as a result of the impairment of its assets or a curtailment of its
operations.
Compliance
with environmental laws or regulations,
including those relating to the emission of greenhouse gases, may
adversely affect OSG’s business
The
Company’s operations are affected by extensive and changing international,
national and local environmental protection laws, regulations, treaties,
conventions and standards in force in international waters, the jurisdictional
waters of the countries in which OSG’s vessels operate, as well as the countries
of its vessels’ registration. Many of these requirements are designed to reduce
the risk of oil spills and other pollution and to decrease emission of
greenhouse gases, and OSG’s compliance with these requirements can be
costly.
These
requirements can affect the resale value or useful lives of the Company’s
vessels, require a reduction in carrying capacity, ship modifications or
operational changes or restrictions, lead to decreased availability of insurance
coverage for environmental matters or result in the denial of access to certain
jurisdictional waters or ports, or detention in, certain ports. Under local,
national and foreign laws, as well as international treaties and conventions,
OSG could incur material liabilities, including cleanup obligations, in the
event that there is a release of petroleum or other hazardous substances from
its vessels or otherwise in connection with its operations. OSG could also
become subject to personal injury or property damage claims relating to the
release of or exposure to hazardous materials associated with its current or
historic operations. Violations of or liabilities under environmental
requirements also can result in substantial penalties, fines and other
sanctions, including in certain instances, seizure or detention of the Company’s
vessels.
|
28
|
Overseas
Shipholding Group, Inc.
|
OSG could
incur significant costs, including cleanup costs, fines, penalties, third-party
claims and natural resource damages, as the result of an oil spill or other
liabilities under environmental laws. The Company is subject to the oversight of
several government agencies, including the U.S. Coast Guard, the Environmental
Protection Agency and the Maritime Administration of the U.S. Department of
Transportation. OPA 90 affects all vessel owners shipping oil or hazardous
material to, from or within the United States. OPA 90 allows for potentially
unlimited liability without regard to fault for owners, operators and bareboat
charterers of vessels for oil pollution in U.S. waters. Similarly, the
International Convention on Civil Liability for Oil Pollution Damage, 1969, as
amended, which has been adopted by most countries outside of the United States,
imposes liability for oil pollution in international waters. OPA 90 expressly
permits individual states to impose their own liability regimes with regard to
hazardous materials and oil pollution incidents occurring within their
boundaries. Coastal states in the United States have enacted pollution
prevention liability and response laws, many providing for unlimited
liability.
OPA 90
provides for the scheduled phase out of all non double hull vessels that carry
oil in bulk in U.S. waters. IMO and the European Union also have adopted
separate phase out schedules applicable to single hull vessels operating in
international and EU waters. These regulations will reduce the demand for single
hull vessels, force the remaining single hull vessels into less desirable
trading routes, increase the number of ships trading in routes open to single
hull vessels and could increase demands for further restrictions in the
remaining jurisdictions that permit the operation of these vessels. As a result,
single hull vessels are likely to be chartered less frequently and at lower
rates.
In
addition, in complying with OPA, IMO regulations, EU directives and other
existing laws and regulations and those that may be adopted, shipowners may
incur significant additional costs in meeting new maintenance and inspection
requirements, in developing contingency arrangements for potential spills and in
obtaining insurance coverage. Government regulation of vessels, particularly in
the areas of safety and environmental requirements, can be expected to become
more strict in the future and require the Company to incur significant capital
expenditures on its vessels to keep them in compliance, or even to scrap or sell
certain vessels altogether. As a result of accidents such as the November 2002
oil spill from the Prestige, a 26 year old single hull tanker unrelated to
the Company, OSG believes that regulation of the shipping industry will continue
to become more stringent and more expensive for the Company and its competitors.
In recent years, the IMO and EU have both accelerated their existing non double
hull phase out schedules in response to highly publicized oil spills and other
shipping incidents involving companies unrelated to OSG. Future accidents can be
expected in the industry, and such accidents or other events could be expected
to result in the adoption of even stricter laws and regulations, which could
limit the Company’s operations or its ability to do business and which could
have a material adverse effect on OSG’s business and financial results. Furthermore,
OSG anticipates that the IMO, EU, U.S. or other countries where we operate might
enact climate control legislation or other regulatory initiatives that could
restrict emissions of greenhouse gases. Such actions could result in significant
financial and operational impacts on our business. See the discussion of
“Environmental and Security Matters Relating to Bulk Shipping”
above.
The
market value of OSG’s vessels, which in 2008 reached historically high levels,
may be depressed at a time and in the event that it sells a vessel
Vessel
values have generally experienced high volatility and values in recent years
have been at or near historically high levels. The fair market value of the
Company’s vessels can be expected to fluctuate, depending on general economic
and market conditions affecting the tanker industry and competition from other
shipping companies, types and sizes of vessels and other modes of
transportation. The global economic recession that commenced in 2008 has
resulted in a decrease in vessel values. In addition, although OSG has a modern
fleet, as vessels grow older, they generally decline in value. These factors
will affect the value of the Company’s vessels at the time of any vessel sale.
If for any reason, OSG sells a vessel at a time when prices have fallen, the
sale may be at less than the vessel’s carrying amount on its financial
statements, with the result that the Company would also incur a loss on the sale
and a reduction in earnings and surplus.
Company
specific risk factors:
The
Company’s business would be adversely affected if it failed to comply with the
Jones Act provisions on coastwise trade, or if these provisions were repealed
and if changes in international trade agreements were to occur.
The
Company is subject to the Jones Act and other federal laws that restrict
maritime transportation between points in the U.S. (known as marine cabotage
services or coastwise trade) to vessels built and registered in the U.S. and
owned and manned by U.S. citizens. The Company is responsible for monitoring the
foreign ownership of its common stock and other interests to insure compliance
with the Jones Act. If the Company does not comply with these restrictions, it
would be prohibited from operating its vessels in U.S. coastwise trade, and
under certain circumstances would be deemed to have undertaken an unapproved
foreign transfer, resulting in severe penalties, including permanent loss of
U.S. coastwise trading rights for the Company’s vessels, fines or forfeiture of
the vessels.
|
2009
Annual Report
|
29
|
In order
to ensure compliance with Jones Act citizenship requirements, and in accordance
with the certificate of incorporation and by-laws of the Company, the Board of
Directors of the Company adopted a requirement in July 1976 that at least 77%
(the “Minimum Percentage”) of the Company’s common stock must be held by U.S.
citizens. On April 16, 2008, the Company announced that U.S. ownership of
our common stock at the close of business on April 15, 2008 had declined to
the minimum percentage of 77%. While the percentage of U.S. citizenship
ownership of the Company’s outstanding common stock fluctuates daily, the
highest it has been since April 15, 2008 has been approximately 3% above
the Minimum Percentage. Any purported transfer of common stock in violation of
these ownership provisions will be ineffective to transfer the shares of common
stock or any voting, dividend or other rights associated with them. The
existence and enforcement of this U.S. citizen ownership requirement could have
an adverse impact on the liquidity or market value of our common stock in the
event that U.S. citizens were unable to transfer shares of our common stock to
non-U.S. citizens. Furthermore, under certain circumstances this ownership
requirement could discourage, delay or prevent a change in control of the
Company.
Additionally,
the Jones Act restrictions on the provision of maritime cabotage services are
subject to exceptions under certain international trade agreements, including
the General Agreement on Trade in Services and the North American Free Trade
Agreement. If maritime cabotage services were included in the General Agreement
on Trade in Services, the North American Free Trade Agreement or other
international trade agreements, or if the restrictions contained in the Jones
Act were otherwise repealed or altered, the transportation of maritime cargo
between U.S. ports could be opened to international-flag or international-
manufactured vessels. On two occasions during 2005, the U.S. Secretary of
Homeland Security, at the direction of the President of the U.S., issued limited
waivers of the Jones Act for the transportation of petroleum and petroleum
products as a result of the extraordinary circumstances created by Hurricane
Katrina and Hurricane Rita on Gulf Coast refineries and petroleum product
pipelines. During the past several years, interest groups have lobbied Congress
to repeal the Jones Act to facilitate international flag competition for trades
and cargoes currently reserved for U.S. Flag vessels under the Jones Act and
cargo preference laws. The Company believes that continued efforts will be made
to modify or repeal the Jones Act and cargo preference laws currently benefiting
U.S. Flag vessels. Because international vessels may have lower construction
costs, wage rates and operating costs, this could significantly increase
competition in the coastwise trade, which could have a material adverse effect
on the Company’s business, results of operations and financial
condition.
OSG’s
financial condition would be materially adversely affected if the shipping
income of OSG’s foreign subsidiaries becomes subject to current taxation in the
U.S.
As a
result of changes made by the 2004 Act, the Company does not report in taxable
income on a current basis the undistributed shipping income earned by its
international flag vessels, which in recent years represented substantially all
of the Company’s pre-tax income. These changes in the 2004 Act were made to make
U.S. controlled shipping companies competitive with foreign-controlled shipping
companies, which are generally incorporated in jurisdictions in which they
either do not pay income taxes or pay minimal income taxes.
In his
State of the Union address on January 27, 2010, President Obama stated that
“it’s time to finally slash the tax breaks for companies that ship our jobs
overseas and give those tax breaks for companies that create jobs in the United
States of America”. An increasing number of Congressmen and Senators have
announced support for ending such tax breaks. While the Company believes that
the changes made in the 2004 Act with respect to foreign shipping income do not
“ship jobs overseas,” and, in fact, have enabled the Company to expand its U.S.
Flag fleet and create jobs in the U.S., Congress may decide to repeal the
changes made in the 2004 Act with respect to taxation of foreign shipping
income. Such repeal, either directly or indirectly by limiting or reducing
benefits received under the 2004 Act, would have a materially adverse affect on
the Company’s business and financial results.
The
Company’s substantial debt and charter in commitments could adversely affect its
financial condition
OSG has
substantial debt and debt service requirements. At December 31, 2009, the
Company’s consolidated total debt was $1.8 billion and its unused borrowing
capacity under revolving credit facilities was $1.0 billion and its charter in
commitments were $2.0 billion.
The
amount of the Company’s debt could have important consequences. For example, it
could:
|
•
|
increase
OSG’s vulnerability to general adverse economic and industry
conditions;
|
|
•
|
limit
OSG’s ability to fund future capital expenditures, working capital and
other general corporate
requirements;
|
|
•
|
require
the Company to dedicate a substantial portion of its cash flow from
operations to make interest and principal payments on its
debt;
|
|
30
|
Overseas
Shipholding Group, Inc.
|
|
•
|
limit
OSG’s flexibility in planning for, or reacting to, changes in its business
and the shipping industry;
|
|
•
|
place
OSG at a competitive disadvantage compared with competitors that have less
debt or charter-in commitments including by causing OSG to have a lower
credit rating; and
|
|
•
|
limit
OSG’s ability to borrow additional funds, even when necessary to maintain
adequate liquidity.
|
When
OSG’s credit facilities mature, it may not be able to refinance or replace
them
The
global economic downturn that started in 2008 has adversely affected the
availability and terms of debt and equity capital. When OSG’s indebtedness
matures, the Company may need to refinance it and may not be able to do so on
favorable terms or at all. If OSG is able to refinance maturing indebtedness,
the terms of any refinancing or alternate credit arrangements may contain terms
and covenants that restrict OSG’s financial and operating
flexibility.
The
Company is highly dependent upon volatile spot market charter rates
OSG
depends on spot charters for a significant portion of its revenues. In 2009,
2008 and 2007, OSG derived approximately 49%, 65% and 60%, respectively, of its
TCE revenues in the spot market. Although chartering a significant portion of
OSG’s vessels on the spot market affords it greater opportunity to increase
income from operations when rates rise, dependence on the spot market could
result in earnings volatility. A significant decrease in OSG’s spot market TCE
revenues could adversely affect its profit or result in cash
losses.
OSG
may not be able to renew time charters when they expire or enter into new time
charters for newbuilds
There can
be no assurance that any of the Company’s existing time charters will be renewed
or that it will be successful in entering into new time charters on certain of
the newbuilds that will be delivered to the Company or if renewed or entered
into, that they will be at favorable rates. If, upon expiration of the existing
time charters or delivery of newbuilds, OSG is unable to obtain time charters or
voyage charters at desirable rates, the Company’s profitability may be adversely
affected.
Delays
or cost overruns in building new vessels (including the failure to deliver new
vessels), in the scheduled shipyard maintenance of the Company’s vessels, or in
rebuilding or conversion of the Company’s vessels could adversely affect OSG’s
results of operations
Building
new vessels, scheduled shipyard maintenance or rebuilding or conversion of
vessels are subject to risks of delay (including the failure to deliver new
vessels) or cost overruns caused by one or more of the following:
|
•
|
financial
difficulties of the shipyard building or repairing a vessel, including
bankruptcy;
|
|
•
|
unforeseen
quality or engineering problems;
|
|
•
|
work
stoppages;
|
|
•
|
weather
interference;
|
|
•
|
unanticipated
cost increases;
|
|
•
|
delays
in receipt of necessary materials or
equipment;
|
|
▪
|
changes
to design specifications; and
|
|
•
|
inability
to obtain the requisite permits, approvals or certifications from the U.S.
Coast Guard or international foreign flag state authorities and the
applicable classification society upon completion of
work.
|
|
2009
Annual Report
|
31
|
Significant
delays, cost overruns and failure to deliver new vessels could materially
increase the Company’s expected contract commitments, which would have an
adverse effect on the Company’s revenues, borrowing capacity and results of
operations. Furthermore, delays would result in vessels being out-of-service for
extended periods of time, and therefore not earning revenue, which could have a
material adverse effect on OSG’s financial condition and results of operations.
The Company’s remedies for losses resulting from shipyards’ failure to comply
with their contractual commitments may be limited by the relevant contracts,
including by liquidated damages provisions, such as those that limit the amount
of monetary damages that may be claimed or that limit the Company’s right to
cancellation of the building contract. While purchase price payments for
newbuild vessels made prior to vessel delivery to international shipyards
historically have been supported by guarantees from financial institutions, such
as banks or insurance companies, such payments to U.S. shipyards historically
have been supported by liens on the work in progress, including steel and
equipment used for constructing the vessel, and not by guarantees from financial
institutions. If an international shipyard fails to deliver a contracted
newbuild vessel for which there is a guarantee, the Company may claim against
the guarantee, substantially reducing the risk that the Company will suffer a
loss of its investment. If a U.S. shipyard fails to deliver a contracted vessel,
the Company’s investment may be supported only by the Company’s liens on the
work in progress, which may result in a loss of part or all of the Company’s
investment.
Termination
of the contracts with Bender Shipbuilding & Repair Co., Inc.’s
(“Bender”) has, and may continue to, adversely affect OSG
In
March 2009, OSG and Bender terminated the construction agreements pursuant
to which Bender was building six ATBs and two tugs for OSG. These
agreements were terminated because of Bender’s lack of performance under such
agreements and its lack of liquidity and poor financial condition. OSG is
completing construction of two of the six ATBs at alternative yards and intends
to finish building the two tugs.
In
June 2009, certain creditors of Bender filed an involuntary Chapter 7
bankruptcy petition against Bender claiming that Bender was insolvent and
raising questions about Bender’s pre-petition transfer of assets, specifically
transfers of the vessels to OSG in connection with the termination of contracts
of OSG with Bender. Bender subsequently converted the involuntary
proceeding into a voluntary Chapter 11 reorganization. As creditors of
Bender have raised questions regarding OSG’s termination agreement transaction
it is likely that the transaction will be reviewed by authorized
parties-in-interest in the bankruptcy and possibly challenged. OSG
believes that the termination transaction was valid and for fair consideration,
and that it has strong and meritorious defenses in the event of a challenge but
no assurance can be given that the bankruptcy court will agree. However,
if the bankruptcy court were to sustain a challenge to the transaction, OSG
could be required to pay Bender additional sums for the partially completed ATBs
and tugs and related equipment that were transferred to OSG in connection with
the termination agreement transaction. In such case, the payment of
additional amounts would have an adverse effect on OSG. No assurance can
be given that OSG’s positions with respect to the termination agreement
transaction will be upheld.
Termination
or change in the nature of OSG’s relationship with any of the pools in which it
participates could adversely affect its business
All of
the Company’s VLCCs participate in the Tankers International pool. At
December 31, 2009, all of OSG’s Aframaxes participate in the Aframax
International pool other than those that are engaged in lightering. Five of its
crude Panamaxes and three of its Panamax Product Carriers participate directly
in Panamax International. Participation in these pools enhances the financial
performance of the Company’s vessels as a result of the higher vessel
utilization. Any participant in any of these pools has the right to withdraw
upon notice in accordance with the relevant pool agreement. The Company cannot
predict whether the pools in which its vessels operate will continue to exist in
the future. In addition, in 2008 the EU published guidelines on the application
of the EU antitrust rules to traditional agreements for maritime services. While
the Company believes that all the pools it participates in comply with EU rules,
there has been limited administrative and judicial interpretation of the rules.
Restrictive interpretations of the guidelines could adversely affect the ability
to commercially market the respective types of vessels in pools.
OSG
may not be able to grow its fleet
One part
of OSG’s strategy is to continue to grow its fleet on an opportunistic basis.
The Company’s ability to grow its fleets will depend upon a number of factors,
many of which the Company cannot control. These factors include OSG’s ability
to:
|
•
|
identify
acquisition candidates and joint venture
opportunities;
|
|
•
|
replace
expiring charters-in at comparable
rates;
|
|
•
|
identify
suitable charter-in opportunities;
|
|
32
|
Overseas
Shipholding Group, Inc.
|
|
•
|
consummate
acquisitions or joint ventures;
|
|
•
|
integrate
any acquired vessels or businesses successfully with its existing
operations;
|
|
•
|
hire
and train qualified personnel; and
|
|
•
|
obtain
required financing.
|
OSG’s
strategy of growing its business in part through acquisitions is capital
intensive, time consuming and subject to a number of inherent risks
Part of
OSG’s business strategy is to opportunistically acquire complementary businesses
or vessels such as the Company’s acquisitions of Stelmar Shipping Ltd. in
January 2005 and Maritrans Inc. in November 2006. If the Company fails to
develop and integrate any acquired businesses or vessels effectively, its
earnings may be adversely affected. Further, if a portion of the purchase price
of a business is attributable to goodwill and if the acquired business does not
perform up to expectations at the time of the acquisition some or all of the
goodwill may be written off, adversely affecting OSG’s earnings. In addition,
the Company’s management team will need to devote substantial time and attention
to the integration of the acquired businesses or vessels, which could distract
them from their other duties and responsibilities.
Operating
costs and capital expenses will increase as the Company’s vessels
age
In
general, capital expenditures and other costs necessary for maintaining a vessel
in good operating condition increase as the age of the vessel increases.
Accordingly, it is likely that the operating costs of OSG’s older vessels will
increase. In addition, changes in governmental regulations and compliance with
Classification Society standards may require OSG to make additional expenditures
for new equipment. In order to add such equipment, OSG may be required to take
its vessels out of service. There can be no assurance that market conditions
will justify such expenditures or enable OSG to operate its older vessels
profitably during the remainder of their economic lives.
OSG’s
purchase of second hand vessels carries risks associated with the quality of
those vessels
OSG’s
expansion strategy includes the opportunistic acquisition of quality second hand
vessels either directly or through corporate acquisitions. Second hand vessels
typically do not carry warranties with respect to their condition, whereas
warranties are generally available for newbuildings. While the Company generally
inspects all second hand vessels prior to purchase, such inspections would
normally not provide OSG with as much knowledge about vessel condition as the
Company would possess if the vessels had been built for it.
Certain
potential customers will not use vessels older than a specified age, even if
they have been recently rebuilt
All of
our existing ATBs were originally constructed more than 25 years ago. While
all of these tug-barge units were rebuilt and double-hulled since 1998 and are
“in-class,” meaning the vessel has been certified by a classification society as
being built and maintained in accordance with the rules of that classification
society and complies with the applicable rules and regulations of the vessel’s
country of registry and applicable international conventions, some potential
customers have stated that they will not charter vessels that are more than
20 years old, even if they have been rebuilt. Although there has to date
been no material difference in time charter rates earned by a vessel of a
specified age and a rebuilt vessel of the same age measured from the date of
rebuilding, no assurance can be given that customers will continue to view
rebuilt vessels as comparable to newbuild vessels. If more customers
differentiate between rebuilt and newbuild vessels, time charter rates for our
rebuilt ATBs will likely be adversely affected or they may not be
employable.
In
the highly competitive international market, OSG may not be able to effectively
compete for charters with companies with greater resources
The
Company’s vessels are employed in a highly competitive market. Competition
arises from other vessel owners, including major oil companies, which may have
substantially greater resources than OSG does. Competition for the
transportation of crude oil and other petroleum products depends on price,
location, size, age, condition, and the acceptability of the vessel operator to
the charterer. The Company believes that because ownership of the world tanker
fleet is highly fragmented, no single vessel owner is able to influence charter
rates. To the extent OSG enters into new geographic regions or provides new
services, it may not be able to compete profitably. New markets may involve
competitive factors that differ from those of the Company’s current markets, and
the competitors in those markets may have greater financial strength and capital
resources than OSG does.
|
2009
Annual Report
|
33
|
Trading
and complementary hedging activities in Forward Freight Agreements (“FFAs”)
subject the Company to trading risks and the Company may suffer trading losses
that reduce earnings
Due to
shipping market volatility, success in this industry requires constant
adjustment of the balance between chartering out vessels for long periods of
time and trading them on a spot basis. The Company seeks to manage and mitigate
that risk through trading and complementary hedging activities in forward
freight agreements, or FFAs. However, there is no assurance that the Company
will be able at all times to successfully protect itself from volatility in the
shipping market. The Company may not successfully mitigate its risks, leaving it
exposed to unprofitable contracts and may suffer trading losses that reduce
earnings and surplus.
The
Company is subject to certain credit risks with respect to its counterparties on
contracts and failure of such counterparties to meet their obligations could
cause the Company to suffer losses on such contracts, decreasing revenues and
earnings
The
Company charters its vessels to other parties, who pay the Company a daily rate
of hire. The Company also enters into COAs and Voyage Charters. As OSG increases
the portion of its revenues from time charters, it increases its reliance on the
ability of time charterers to pay charter hire, especially when spot market
rates are less than previously agreed upon time charter rates. Historically, the
Company has not experienced any material problem collecting charter hire but the
global economic recession that commenced in 2008 may affect charterers more
severely than the prior recessions that have occurred since the Company’s
establishment more than 40 years ago. The Company also time charters or
bareboat charters some of its vessels from other parties and its continued use
and operation of such vessels depends on the vessel owners’ compliance with the
terms of the time charter or bareboat charter. Additionally, the
Company enters into derivative contracts (FFAs, bunker swaps, interest rate
swaps and foreign currency contracts). All of these contracts subject the
Company to counterparty credit risk. As a result, the Company is subject to
credit risks at various levels, including with charterers or cargo interests. If
the counterparties fail to meet their obligations, the Company could suffer
losses on such contracts which would decrease revenues and
earnings.
As
the Company expands its business, it will need to improve its operations and
financial systems, and recruit additional staff and crew; if it cannot improve
these systems or recruit suitable employees, it may not effectively control its
operations
The
Company’s current operating and financial systems may not be adequate as it
implements its plan to expand, and its attempts to improve these systems may be
ineffective. If the Company is unable to operate its financial and operations
systems effectively or to recruit suitable employees for its vessels and offices
as it expands its operations, it may be unable to effectively control and manage
substantially larger operations. Although it is impossible to predict what
errors might occur as the result of inadequate controls, it is the case that it
is harder to oversee a sizable operation and, accordingly, more likely that
errors will occur as operations grow and that additional management
infrastructure and systems will be required to attempt to avoid such
errors.
OSG’s
ability to obtain business from U.S. government agencies may be adversely
affected by a determination by the Military Sealift Command (MSC) that OSG is
not presently responsible for a single contract.
OSG
Product Tankers, LLC (“Product Tankers”), which is an indirect OSG
subsidiary, participated in a Request for Proposals issued by the MSC, an agency
of the United States Department of the Navy, to time charter two Jones Act
compliant product carriers to the MSC. On June 25, 2007, the U.S. Maritime
Administration of the Department of Transportation (“MarAd”), acting as lead
federal agency under the Federal Acquisition Regulation (“FAR”), entered into a
compliance agreement with OSG in lieu of suspending or debarring OSG from
business with the U.S. Government based on the December 2006 guilty plea by OSG
to violations related to the handling of bilge water and oily mixtures from the
engine rooms on certain of its international flag vessels. Notwithstanding that
compliance agreement, on July 6, 2007, the MSC found that Product Tankers
was not “responsible,” pursuant to the FAR, for the particular procurement based
on the same violations by OSG’s international flag vessels and, therefore, was
ineligible to time charter the vessels to the MSC. MSC’s non-responsibility
determination was upheld by the United States Court of Federal Claims, which
ruled that the MSC was not bound by the MarAd’s decision as lead federal agency
and that the MSC decision was not arbitrary and capricious.
Although
the MSC decision specifically addresses only the single contract, it may have an
adverse effect on OSG’s ability to obtain business from the U.S. government. For
the past three years, OSG did not do any material business with the MSC and,
accordingly, did not generate any shipping revenues from the MSC. Historically,
OSG has not sought to generate significant revenues from conducting business
with the MSC or other agencies and departments within the U.S. government, nor
does OSG intend to in the future. The only business OSG currently conducts with
the U.S. government is the participation by two of its vessels in the Maritime
Security Program (“MSP”), which is intended to support the operation of up to 60
U.S. Flag vessels in the foreign commerce of the U.S. to make available a fleet
of privately owned vessels to the Department of Defense during times of war or
national emergency. Payments are made under the MSP to vessel operators,
including OSG, to help offset the high cost of employing a U.S. crew. MarAd, the
agency which decided not to suspend or debar OSG, administers the MSP. To date,
the MSC decision has not had an adverse effect on OSG’s ability to obtain
business from commercial customers.
|
34
|
Overseas
Shipholding Group, Inc.
|
Compliance
with the environmental compliance plan agreed to with the U.S. Department of
Justice imposes a more rigorous standard on OSG’s technical management of its
vessels, which may adversely affect its business
In
connection with the comprehensive settlement of the investigation by the U.S.
Department of Justice of the Company’s handling of waste oils and maintenance of
books and records relating thereto, the Company agreed to implement and fund an
environmental compliance plan, which contains detailed rules, programs and
procedures that the Company must follow for a three year period from March 2007
to ensure full compliance with environmental laws and regulations. The Company
has implemented these rules, programs and procedures and does not believe that
they will adversely affect its ability to technically manage its vessels in a
competitive manner. However, because the environmental compliance plan is a
condition of the Company’s three year probation, violations of certain of these
rules and procedures, while not necessarily a violation of environmental laws
and regulations, could result in sanctions and have an adverse affect on the
Company’s business.
OSG’s
vessels call on ports located in countries that are subject to restrictions
imposed by the U.S. government, which could negatively affect the trading price
of the Company’s common stock
From time
to time, vessels in OSG’s fleet call on ports located in countries subject to
sanctions and embargoes imposed by the U.S. government and countries identified
by the U.S. government as state sponsors of terrorism, such as Iran. Although
these sanctions and embargoes do not prevent OSG’s vessels from making calls to
ports in these countries, potential investors could view such port calls
negatively, which could adversely affect the Company’s reputation and the market
for its common stock.
OSG
depends on its key personnel and may have difficulty attracting and retaining
skilled employees
OSG’s
success depends to a significant extent upon the abilities and efforts of its
key personnel. The loss of the services of any of the Company’s key personnel or
its inability to attract and retain qualified personnel in the future could have
a material adverse effect on OSG’s business, financial condition and operating
results.
The
Company may face unexpected drydock costs for its vessels
Vessels
must be drydocked periodically. The cost of repairs and renewals required at
each drydock are difficult to predict with certainty and can be substantial. The
Company’s insurance does not cover these costs. In addition, vessels may have to
be drydocked in the event of accidents or other unforeseen damage. OSG’s
insurance may not cover all of these costs. Large drydocking expenses could
significantly decrease the Company’s profits.
Maritime
claimants could arrest OSG’s vessels, which could interrupt its cash
flow
Crew
members, suppliers of goods and services to a vessel, shippers of cargo and
other parties may be entitled to a maritime lien against that vessel for
unsatisfied debts, claims or damages. In many jurisdictions, a maritime lien
holder may enforce its lien by arresting a vessel through foreclosure
proceedings. The arrest or attachment of one or more of the Company’s vessels
could interrupt OSG’s cash flow and require it to pay a significant amount of
money to have the arrest lifted. In addition, in some jurisdictions, such as
South Africa, under the “sister ship” theory of liability, a claimant may arrest
both the vessel that is subject to the claimant’s maritime lien and any
“associated” vessel, which is any vessel owned or controlled by the same owner.
Claimants could try to assert “sister ship” liability against one vessel in the
Company’s fleet for claims relating to another vessel in its fleet.
|
2009
Annual Report
|
35
|
ITEM
1B. UNRESOLVED STAFF COMMENTS
None.
ITEM 2. PROPERTIES
Vessels:
At
December 31, 2009, the Company owned or operated (including newbuilds) an
aggregate of 129 vessels. See tables presented under Item 1. Additional
information about the Company’s fleet is set forth on the Company’s website,
www.osg.com.
ITEM
3. LEGAL PROCEEDINGS
The
Company is a party, as plaintiff or defendant, to various suits in the ordinary
course of business for monetary relief arising principally from personal
injuries, collision or other casualty and to claims arising under charter
parties. All such personal injury, collision or other casualty claims against
the Company are fully covered by insurance (subject to deductibles not material
in amount). Each of the claims involves an amount which, in the opinion of
management, is not material to the Company’s financial position, results of
operations and cash flows.
ITEM
4. SUBMISSION OF MATTERS TO A VOTE OF SECURITY HOLDERS
None.
|
36
|
Overseas
Shipholding Group, Inc.
|
Executive Officers of the Registrant
|
Name
|
Age
|
Position
Held
|
Has Served as Such Since
|
|||
|
Morten
Arntzen
|
54
|
President
and Chief Executive Officer
|
January
2004
|
|||
|
Myles
R. Itkin
|
62
|
Executive
Vice President, Chief
Financial Officer and Treasurer
|
June
2006
June
1995
|
|||
|
Mats
H. Berglund
|
47
|
Senior
Vice President and Head of International Crude Transportation Strategic
Business Unit
|
September
2005
|
|||
|
Robert
E. Johnston
|
62
|
Senior
Vice President and Head
of U.S. Strategic Business Unit
|
October
1998
January
2009
|
|||
|
Ian
T. Blackley
|
55
|
Senior
Vice President, Head
of International Shipping and Managing
Director and Chief Operating Officer, OSG Ship Management (UK)
Ltd.
|
May
2009
January
2009
September
2005
|
|||
|
George
Dienis
|
57
|
Managing
Director and Chief Operating Officer, OSG Ship Management (GR)
Ltd.
|
January
2005
|
|||
|
James
I. Edelson
|
53
|
General
Counsel and Secretary
|
January
2005
March
2005
|
|||
|
Robert
R. Mozdean
|
56
|
Head
of Worldwide Human Resources
|
August
2005
|
|||
|
Lois
K. Zabrocky
|
40
|
Senior
Vice President and Head
of International Product Carrier Strategic Business Unit
|
June
2008
September
2005
|
|||
|
Marc
La Monte
|
45
|
Head
of Gas Strategic Business Unit
|
September
2008
|
|||
|
Janice
K. Smith
|
|
48
|
|
Chief
Risk Officer
|
|
February
2010
|
The term
of office of each executive officer continues until the first meeting of the
Board of Directors of the Company immediately following the next annual meeting
of its stockholders, to be held on June 2, 2010, and until the election and
qualification of his successor. There is no family relationship between the
executive officers.
Mr. Itkin
served as Senior Vice President for at least five years prior to his appointment
as Executive Vice President. Mr. Berglund was an officer of Stena Rederi AB of
Sweden, a company which supports and coordinates the shipping activities of
Stena AB, one of the largest privately-held shipping companies in the world,
serving as President from January 2003 to August 2005. Mr. Johnston served as
Chief Commercial Officer of the Company for at least five years prior to
becoming Head of Shipping Operations in September 2005 and served in that
capacity until his appointment as Head of U.S. Flag Strategic Business Unit in
January 2009. Mr. Blackley was employed by the Company in numerous positions,
including Assistant Treasurer and Vice President, Treasury of OSG Ship
Management, Inc. for at least five years prior to becoming Chief Operating
Officer of OSG Ship Management (UK) Ltd. For at least five years prior to
becoming Head of Worldwide Human Resources for the Company, Mr. Mozdean served
as Vice President of Human Resources and Legal Affairs at the Dannon Company,
Inc., a leading producer of yogurt products in the United States. Ms. Zabrocky
worked for the Company in various management capacities relating to chartering
and other commercial functions for at least five years prior to her appointment
as Head of the Company’s International Product Carrier Strategic Business Unit
in September 2005. Mr. LaMonte worked for the Company in various management
capacities relating to chartering and vessel sales and purchases for at least
five years prior to becoming Head of Gas Strategic Business Unit in September
2008. Ms. Smith served as Deputy General Counsel of the Company since July 2007.
For at least three years prior to joining the Company, Ms. Smith was a corporate
partner at Proskauer Rose LLP, where her practice focused on advising clients on
a variety of corporate finance transactions.
|
2009
Annual Report
|
37
|
PART
II
ITEM
5. MARKET FOR REGISTRANT’S COMMON EQUITY, RELATED STOCKHOLDER MATTERS AND ISSUER
PURCHASES OF EQUITY SECURITIES
|
(a)
|
The
Company’s common stock is listed for trading on the New York Stock
Exchange under the trading symbol OSG. The range of high and low closing
sales prices of the Company’s common stock as reported on the New York
Stock Exchange for each of the quarters during the last two years are set
forth below.
|
|
2009
|
High
|
Low
|
||||||
|
(In
dollars)
|
||||||||
|
First
Quarter
|
46.18 | 21.02 | ||||||
|
Second
Quarter
|
43.29 | 23.94 | ||||||
|
Third
Quarter
|
41.10 | 29.70 | ||||||
|
Fourth
Quarter
|
46.02 | 35.59 | ||||||
|
2008
|
High
|
Low
|
||||||
|
First
Quarter
|
75.89 | 52.74 | ||||||
|
Second
Quarter
|
87.79 | 69.40 | ||||||
|
Third
Quarter
|
84.25 | 50.72 | ||||||
|
Fourth
Quarter
|
59.47 | 29.92 | ||||||
|
(b)
|
On
February 22, 2010, there were 342 stockholders of record of the Company’s
common stock.
|
|
(c)
|
In
June 2008, OSG increased its annual dividend by 40% to $1.75 per share
from $1.25 per share of common stock. Subsequent thereto, the Company paid
six regular quarterly dividends of $0.4375 per share of common stock.
Prior to the above change, the Company paid regular quarterly dividends of
$0.3125 per share of common stock subsequent to June 2007, regular
quarterly dividends of $0.25 per share of common stock between April 2006
and June 2007 and $0.175 per share of common stock prior to April 2006.
The payment of cash dividends in the future will depend upon the Company’s
operating results, cash flow, working capital requirements and other
factors deemed pertinent by the Company’s Board of
Directors.
|
STOCKHOLDER
RETURN PERFORMANCE PRESENTATION
Set forth
below is a line graph for the five years ended December 31, 2009 comparing the
yearly percentage change in the cumulative total stockholder return on the
Company’s common stock against the cumulative return of the published Standard
and Poor’s 500 index, a peer group index consisting of Frontline Ltd., Teekay
Corporation, General Maritime Corporation, Kirby Corporation, Seacor Holdings
Inc., Tsakos Energy Navigation Limited and the Company referred to as the peer
group index. The companies in this peer group index consist of those
corporations used for determining vesting of performance share units for the
Company’s senior management whose stock has been publicly traded in the United
States for at least five years. The Company believes that this peer group index
is relevant for comparative purposes.
|
38
|
Overseas
Shipholding Group, Inc.
|
STOCK
PERFORMANCE GRAPH
COMPARISON
OF FIVE YEAR CUMULATIVE TOTAL RETURN*
THE
COMPANY, S&P 500 INDEX, PEER GROUP INDEX
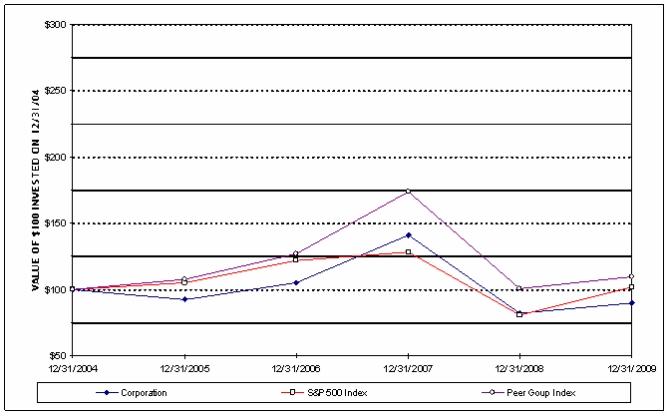
|
*
|
Assumes
that the value of the investment in the Company’s common stock and each
index was $100 on December 31, 2004 and that all dividends were
reinvested.
|
During
June 2006, the Board approved a repurchase program, authorizing $300,000,000 to
be expended on the repurchase of common stock. On April 24, 2007, the OSG’s
Board of Directors authorized, and the Company agreed to purchase all of the
outstanding shares of the Company’s common stock held by Archer- Daniels-Midland
Company (“ADM”), or 5,093,391 shares, at $65.42 per share. In addition, on April
24, 2007, the Board of Directors authorized a new share repurchase program of
$200,000,000, which replaced the prior $300,000,000 share repurchase program.
The Company completed the 2007 repurchase program in the second quarter of 2008.
On June 9, 2008, a new share purchase program of $250,000,000 was authorized by
the Board of Directors. Total shares repurchased to date under all of the above
authorities, aggregates approximately $826,465,000, or 13,062,100
shares.
|
2009
Annual Report
|
39
|
ITEM
6. SELECTED FINANCIAL DATA
The
following unaudited selected consolidated financial data for the years ended
December 31, 2009, 2008 and 2007, and at December 31, 2009 and 2008, are derived
from the audited consolidated financial statements of the Company set forth in
Item 8, which have been audited by PricewaterhouseCoopers (2009) and Ernst &
Young LLP (2008 and 2007), independent registered public accounting firms. The
unaudited selected consolidated financial data for the years ended December 31,
2006 and 2005, and at December 31, 2007, 2006 and 2005, are derived from audited
consolidated financial statements of the Company not appearing in this Annual
Report, which have been audited by Ernst & Young LLP.
|
In thousands, except per share amounts
|
2009
|
2008
|
2007
|
2006
|
2005
|
|||||||||||||||
|
Shipping
revenues
|
$ | 1,093,618 | $ | 1,704,697 | $ | 1,129,305 | $ | 1,047,403 | $ | 1,000,303 | ||||||||||
|
Income
from vessel operations
|
77,130 | 345,186 | 207,572 | 378,544 | 474,939 | |||||||||||||||
|
Income
before federal income taxes
|
34,450 | 271,182 | 217,186 | 384,473 | 463,719 | |||||||||||||||
|
Net
income attributable to Overseas Shipholding Group, Inc.
|
70,170 | 317,665 | 211,310 | 392,660 | 464,829 | |||||||||||||||
|
Depreciation
and amortization
|
172,404 | 189,163 | 185,499 | 141,940 | 152,311 | |||||||||||||||
|
Net
cash provided by operating activities
|
218,121 | 376,337 | 167,624 | 445,975 | 435,147 | |||||||||||||||
|
Total
vessels, deferred drydock and other property, at net book amount (a)
|
3,000,768 | 2,818,060 | 2,797,023 | 2,583,370 | 2,344,553 | |||||||||||||||
|
Total
assets
|
4,208,441 | 3,890,061 | 4,158,917 | 4,230,669 | 3,348,680 | |||||||||||||||
|
Debt—long-term
debt and capital lease obligations (exclusive of short-term debt and
current portions) (b)
|
1,813,289 | 1,396,135 | 1,531,334 | 1,306,947 | 965,655 | |||||||||||||||
|
Reserve
for deferred federal income taxes—noncurrent
|
205,295 | 196,815 | 230,924 | 234,269 | 113,255 | |||||||||||||||
|
Total
equity (c)
|
1,867,855 | 1,824,633 | 1,950,495 | 2,207,311 | 1,876,028 | |||||||||||||||
|
Debt/total
capitalization(c)
|
49.3 | % | 43.3 | % | 44.0 | % | 37.2 | % | 34.0 | % | ||||||||||
|
Per
share amounts:
|
||||||||||||||||||||
|
Basic
net income attributable to Overseas Shipholding Group,
Inc.
|
2.61 | 10.71 | 6.19 | 9.94 | 11.78 | |||||||||||||||
|
Diluted
net income attributable to Overseas Shipholding Group,
Inc.
|
2.61 | 10.65 | 6.16 | 9.92 | 11.77 | |||||||||||||||
|
Overseas
Shipholding Group, Inc.’s equity
|
69.55 | 64.07 | 58.47 | 56.27 | 47.56 | |||||||||||||||
|
Cash
dividends paid
|
1.75 | 1.50 | 1.125 | 0.925 | 0.70 | |||||||||||||||
|
Average
shares outstanding for basic earnings per share
|
26,864 | 29,648 | 34,136 | 39,515 | 39,444 | |||||||||||||||
|
Average
shares outstanding for diluted earnings per share
|
26,869 | 29,814 | 34,327 | 39,586 | 39,506 | |||||||||||||||
|
Other
data:
|
||||||||||||||||||||
|
Time
charter equivalent revenues (d)
|
952,621 | 1,545,385 | 1,039,211 | 992,817 | 961,662 | |||||||||||||||
|
EBITDA
(e)
|
251,002 | 530,273 | 476,332 | 595,065 | 705,519 | |||||||||||||||
|
(a)
|
Includes
vessels held for sale of $53,975 in
2008.
|
|
(b)
|
Amounts
do not include debt of affiliated companies in which the Company
participates.
|
|
(c)
|
Amounts
have been restated to include noncontrolling interest as part of total
equity and total capitalization. The Company adopted accounting guidance
in 2009 that required the classification of noncontrolling interest as a
component of equity.
|
|
(d)
|
Reconciliations
of time charter equivalent revenues to shipping revenues as reflected in
the consolidated statements of operations
follow:
|
|
In
thousands
|
2009
|
2008
|
2007
|
2006
|
2005
|
|||||||||||||||
|
Time
charter equivalent revenues
|
$ | 952,621 | $ | 1,545,385 | $ | 1,039,211 | $ | 992,817 | $ | 961,662 | ||||||||||
|
Add:
Voyage expenses
|
140,997 | 159,312 | 90,094 | 54,586 | 38,641 | |||||||||||||||
|
Shipping
revenues
|
$ | 1,093,618 | $ | 1,704,697 | $ | 1,129,305 | $ | 1,047,403 | $ | 1,000,303 | ||||||||||
|
40
|
Overseas
Shipholding Group, Inc.
|
Consistent
with general practice in the shipping industry, the Company uses time charter
equivalent revenues, which represents shipping revenues less voyage expenses, as
a measure to compare revenue generated from a voyage charter to revenue
generated from a time charter. Time charter equivalent revenues, a non-GAAP
measure, provides additional meaningful information in conjunction with shipping
revenues, the most directly comparable GAAP measure, because it assists Company
management in making decisions regarding the deployment and use of its vessels
and in evaluating their financial performance.
|
(e)
|
EBITDA
represents operating earnings excluding net income/(loss) attributable to
the noncontrolling interest, which is before interest expense and income
taxes, plus other income and depreciation and amortization expense. EBITDA
is presented to provide investors with meaningful additional information
that management uses to monitor ongoing operating results and evaluate
trends over comparative periods. EBITDA should not be considered a
substitute for net income/(loss) attributable to the Company or cash flow
from operating activities prepared in accordance with accounting
principles generally accepted in the United States or as a measure of
profitability or liquidity. While EBITDA is frequently used as a measure
of operating results and performance, it is not necessarily comparable to
other similarly titled captions of other companies due to differences in
methods of calculation.
|
The
following table reconciles net income/(loss) attributable to the Company, as
reflected in the consolidated statements of operations, to EBITDA:
|
In thousands
|
2009
|
2008
|
2007
|
2006
|
2005
|
|||||||||||||||
|
Net
income attributable to Overseas Shipholding Group, Inc.
|
$ | 70,170 | $ | 317,665 | $ | 211,310 | $ | 392,660 | $ | 464,829 | ||||||||||
|
Provision/(credit)
for income taxes
|
(36,697 | ) | (34,004 | ) | 4,827 | (8,187 | ) | (1,110 | ) | |||||||||||
|
Interest
expense
|
45,125 | 57,449 | 74,696 | 68,652 | 89,489 | |||||||||||||||
|
Depreciation
and amortization
|
172,404 | 189,163 | 185,499 | 141,940 | 152,311 | |||||||||||||||
|
EBITDA
|
$ | 251,002 | $ | 530,273 | $ | 476,332 | $ | 595,065 | $ | 705,519 | ||||||||||
ITEM
7. MANAGEMENT’S DISCUSSION AND ANALYSIS OF FINANCIAL CONDITION AND RESULTS OF
OPERATIONS
UGENERAL
The
Company is one of the largest independent bulk shipping companies in the world.
The Company’s operating fleet as of December 31, 2009 consisted of 106 vessels
aggregating 10.9 million dwt and 864,800 cbm, including 47 vessels that have
been chartered-in under operating leases. In addition to its operating fleet of
106 vessels, charters-in for eight vessels are scheduled to commence upon
delivery of the vessels between 2010 and 2011 and 15 newbuilds are scheduled for
delivery between 2010 and 2011, bringing the total operating and newbuild fleet
to 129 vessels.
U2009
DEVELOPMENTS
Completion
of tender offer for outstanding common units of OSG America L.P.
On
November 5, 2009, OSG initiated a tender offer for the 6,999,565 outstanding
publicly held common units of OSG America L.P., a Delaware limited partnership
formed by the Company, for $10.25 in cash per unit. At the time of the tender
offer, the Company effectively owned 77.1% of OSG America L.P. The number of
common units ( “Units”) validly tendered in the initial offering period
satisfied the non−waivable condition that more than 4,003,166 Units be validly
tendered, such that OSG owned more than 80% of the outstanding Units. OSG
exercised its right pursuant to Section 15.01 of the amended and restated
limited partnership agreement of the partnership to purchase all of the
remaining Units that were not tendered in the Offer and acquired the remaining
outstanding Units on December 17, 2009. As a result, the Company became the
owner of 100% of OSG America L.P. The Company financed the purchase price of
$71,792,000 through funds drawn under its $1.8 billion credit
facility.
UACQUISITION OF HEIDMAR
LIGHTERING
In April
2007, OSG acquired the Heidmar Lightering business from a subsidiary of Morgan
Stanley Capital Group Inc. for cash of approximately $41 million. The
operation provided crude oil lightering services to refiners, oil companies and
trading companies primarily in the U.S. Gulf with a fleet of four International
Flag Aframaxes and two U.S. Flag workboats. The business manages a portfolio of
one-to-three year fixed rate cargo contracts. Under the agreement, OSG acquired
the lightering fleet, which was time chartered-in, including a 50% residual
interest in two specialized lightering Aframaxes. The operating results of the
Heidmar Lightering business have been included in the Company’s financial
statements commencing April 1, 2007.
|
2009
Annual Report
|
41
|
OPERATIONS
The
Company’s revenues are highly sensitive to patterns of supply and demand for
vessels of the size and design configurations owned and operated by the Company
and the trades in which those vessels operate. Rates for the transportation of
crude oil and refined petroleum products from which the Company earns a
substantial majority of its revenue are determined by market forces such as the
supply and demand for oil, the distance that cargoes must be transported, and
the number of vessels expected to be available at the time such cargoes need to
be transported. The demand for oil shipments is significantly affected by the
state of the global economy and level of OPEC’s exports. The number of vessels
is affected by newbuilding deliveries and by the removal of existing vessels
from service, principally because of scrappings or conversions. The Company’s
revenues are also affected by the mix of charters between spot (Voyage Charter)
and long-term (Time or Bareboat Charter). Because shipping revenues and voyage
expenses are significantly affected by the mix between voyage charters and time
charters, the Company manages its vessels based on TCE revenues. Management
makes economic decisions based on anticipated TCE rates and evaluates financial
performance based on TCE rates achieved.
Overview
Average
freight rates in 2009 for VLCCs, Suezmaxes, Aframaxes, Panamaxes and Product
Carriers were significantly below their 2008 levels as lower product demand in
OECD countries led to a decline in OPEC production of approximately 2.5 million
barrels per day (“b/d”), significantly reducing tonne-mile demand. An increase
in the size of the tanker fleet further exacerbated the supply and demand
balance, causing year-over-year rates to decline by 60% in the Panamax tanker
sector and 76% in the VLCC sector.
The
slowdown in global economic activity that began in the fourth quarter of 2008
continued throughout 2009 and resulted in a decline in global oil demand
relative to 2008 levels of 1.5%, or 1.3 million b/d. The decline in demand was
centered in OECD countries, with demand dropping by 4.4%, or two million b/d
from 2008. U.S oil demand declined from 19.5 million b/d in 2008 to 18.7 million
b/d in 2009 while demand in Europe and Japan went from 15.3 million b/d and 4.8
million b/d in 2008 to 14.5 million b/d and 4.3 million b/d respectively in
2009. Somewhat offsetting this decline was an increase in demand in non-OECD
countries of 2.0%, or 790,000 b/d as demand growth in Asia (including China) of
890,000 b/d and of 140,000 b/d in the Middle East was offset by a reduction of
270,000 b/d in oil demand in the Former Soviet Union (FSU).
Lower oil
demand in OECD countries in 2009 adversely impacted refinery utilization levels
in the U.S., Europe and Japan. Refinery utilization levels in the U.S. averaged
approximately 82.7%, the lowest level of the decade. Utilization levels in both
Europe and Japan fell to less than 80% in 2009 compared with over 80% in 2008.
The decrease in OECD oil demand resulted in a decline in oil import
requirements, particularly from Middle East OPEC member countries, the major
suppliers of long-haul crude oil to both eastern and western destinations. As a
consequence, crude oil tonne-mile demand in 2009 declined from 2008 levels, the
first such annual decline since 2003.
China was
one key long-haul destination to experience an increase in crude oil tonne-mile
demand, which benefited from a strong government fiscal stimulus program and new
refining capacity that came online in 2009. Together, these factors
stimulated an increase in seaborne crude oil movements to China of approximately
19% compared with 2008.
Tanker
rates during 2009, especially during the last half of the year, were buoyed by
the usage of tankers as floating storage for both crude oil and clean products.
The contango in middle distillate and crude oil prices combined with lower
tanker rates overall made it economical to utilize tankers (including newly
built VLCCs, Suezmaxes, LR1s and LR2s) to hold inventory. Approximately 118
tankers were used globally to store clean products and 18 VLCCs were used to
hold crude oil during the fourth quarter of 2009. However, the number of tankers
used to store products declined in January 2010 as demand for middle distillates
increased due to cold weather in the Northern Hemisphere, pushing tanker rates
up and making it less attractive to use tankers as floating
storage.
|
42
|
Overseas
Shipholding Group, Inc.
|
World oil
demand in the fourth quarter of 2009 was 85.9 million b/d, a 0.6% increase from
85.4 million b/d in the fourth quarter of 2008, representing the first
year-over-year quarterly increase in demand since the second quarter of 2008. A
demand decline in OECD areas of 2.9% was more than offset by an increase of
approximately 10.4% in Asia, led by a 16.4% increase in China.
Crude
tanker rates in all segments during the fourth quarter of 2009 were
approximately 70% below rates in the comparable 2008 period while Product
Carrier rates were down approximately 80%. Lower refinery utilization rates and
high inventory levels (including products held in floating storage) adversely
impacted trans-Atlantic movements and limited product arbitrage opportunities.
Product Carrier freight rates in Asia were also negatively affected by a decline
in intra-Asian product movements.
Crude
tanker newbuilding prices, which reached record high levels during the third
quarter of 2008, have declined steadily from that point. By the end of 2009,
newbuilding prices were down approximately 40% from their highs.
Extremely
depressed tanker freight rates that reduced owners’ cash flows and tight credit
resulted in approximately 40 tanker newbuilding orders being cancelled in 2009.
The number of newbuilding tanker orders actually placed in 2009 was the lowest
of the decade, totaling less than 70 vessels, or about 14% of the 500 average
ordered during the period from 2000 through 2008. Additional factors that
discouraged new speculative orders in 2009 and could cause further cancellations
or postponements include ongoing economic uncertainty, debt covenant violations
by both tanker owners and shipyards and the cancellation and deferral of
capital-intensive upstream production development projects and downstream
refining projects.
The net
increase in tanker fleet size in 2009 was approximately 6% as the number of new
tankers delivered exceeded the number of single hull vessels scrapped. Increases
occurred in all tanker vessel categories, ranging from an increase of
approximately 4.5% in VLCC tonnage to an increase of 8.5% in Product Carrier
tonnage. The total tanker orderbook at the end of 2009 represented 31% of the
total fleet based on deadweight tons (“dwt”), down from 44% at the end of
2008.
The
tables below show the daily TCE rates that prevailed in markets in which the
Company's vessels operated for the periods indicated. It is important to note
that the spot market is quoted in Worldscale rates. The conversion of Worldscale
rates to the following TCE rates required the Company to make certain
assumptions as to brokerage commissions, port time, port costs, speed and fuel
consumption, all of which will vary in actual usage. In each case, the rates may
differ from the actual TCE rates achieved by the Company in the period indicated
because of the timing and length of voyages, waiting time and the portion of
revenue generated from long-term charters. For example, TCE rates for VLCCs are
reflected in the earnings of the Company approximately one month after such
rates are reflected in the tables below, calculated on the basis of the fixture
dates.
International
Flag VLCCs
|
Spot Market TCE Rates
VLCCs in the Arabian Gulf*
|
||||||||||||||||||||||||||||
|
Q1-2009
|
Q2-2009
|
Q3-2009
|
Q4-2009
|
2009
|
2008
|
2007
|
||||||||||||||||||||||
|
Average
|
$ | 40,400 | $ | 13,300 | $ | 7,200 | $ | 17,000 | $ | 19,500 | $ | 81,100 | $ | 46,300 | ||||||||||||||
|
High
|
$ | 80,700 | $ | 39,500 | $ | 40,500 | $ | 48,700 | $ | 80,700 | $ | 250,000 | $ | 283,500 | ||||||||||||||
|
Low
|
$ | 15,500 | $ | (4,500 | ) | $ | (5,800 | ) | $ | 0 | $ | (5,800 | ) | $ | 7,200 | $ | 6,800 | |||||||||||
* Based
on 60% Arabian Gulf to eastern destinations and 40% Arabian Gulf to western
destinations
Rates for
VLCCs trading out of the Arabian Gulf averaged $19,500 per day during 2009, a
decrease of 76% from the 2008 average. This decline was largely due to a 1.8
million b/d decrease in Middle East OPEC production and a 200,000 b/d reduction
in West African OPEC production relative to 2008. This 2.1 million b/d decline
in long-haul crude OPEC production correlates closely with the overall decline
in 2009 OECD oil demand of two million b/d. The 4.5% increase in the size of the
fleet, combined with the decline in tonne-mile demand, weighed heavily on rates
during 2009.
Rates for
VLCCs in the first quarter of 2009 averaged 52% less than rates in the first
quarter of 2008 as a reduction in Middle East crude oil movements to both
eastern and western destinations coincided with an increase in VLCC
tonnage.
In the
second quarter, rates fell 88% below those in the second quarter of 2008. A
reduction in oil demand in OECD countries coupled with lower refining margins
led to cuts in discretionary refinery throughput levels throughout the world,
except in China. Tanker deliveries in the first six months of 2009 far exceeded
conversions and deletions, resulting in an increase in the fleet at the same
time that tonne-mile demand continued to decline.
|
2009
Annual Report
|
43
|
Third
quarter rates averaged $7,200 per day, the lowest quarterly level in 2009 and
significantly lower than rates during the same period in 2008. Similar to the
first half of 2009, the lower rates reflected a reduction in long-haul OPEC
crude oil movements in conjunction with a net increase in available tonnage.
Tankers operated at negative TCE rates during part of the quarter due to the
limited availability of cargoes and high bunker costs as some owners sought to
reposition tankers to more favorable locations.
Fourth
quarter rates declined approximately 69% compared with the fourth quarter of
2008, but still improved by almost 140% from the third quarter of 2009. Fourth
quarter 2009 world oil demand increased by 520,000 b/d relative to the fourth
quarter of 2008 and 600,000 b/d compared with the third quarter of
2009.
OPEC
production in the fourth quarter of 2009 averaged 29.0 million b/d, the highest
level of the year and approximately 450,000 b/d above the first half of the year
and 200,000 b/d above the third quarter, but still about 1.5 million b/d below
the fourth quarter of 2008.
Refinery
utilization rates in the fourth quarter of 2009 were significantly below those
during the same timeframe of 2008. Refinery utilization rates in the U.S.,
Europe and Japan averaged 81%, 76% and 72%, respectively, compared with 85%, 84%
and 87%, respectively, in the fourth quarter of 2008. Lower refining runs
reduced seaborne import requirements and adversely affected tonne-mile
demand.
China’s
fourth quarter refinery runs reached a record of 8.1 million b/d as new and
expanded refining capacity in China allowed throughput levels to rise by more
than one million b/d compared with the fourth quarter of 2008. The increase in
refining capacity led to a significant increase in imported crude oil sourced
from both West Africa and the Middle East, favorably impacting tonne-mile demand
in the fourth quarter as well as for the entire year.
The use
of VLCCs for floating storage provided some support for tanker rates during the
fourth quarter of 2009. There were about 29 VLCCs being used for storage during
this period, including 11 newly built VLCCs that stored clean products. Tonnage
used for floating storage purposes represented about 5.6% of the total VLCC
trading fleet at the end of 2009.
The world
VLCC fleet stood at 536 tankers (160.6 million dwt) at December 31, 2009.
The VLCC fleet currently includes 90 single hull tankers, of which approximately
two-thirds are trading, with the remainder being utilized for FPSO / FSO
purposes. The year-end 2009 VLCC orderbook totaled 194 vessels
(60.3 million dwt) representing 37.5% of the existing VLCC fleet, based on
deadweight tons, significantly below the year-end 2008 orderbook level of 254
vessels (78.7 million dwt).
International
Flag Suezmaxes
|
Spot Market TCE Rates
Suezmaxes in the Atlantic*
|
||||||||||||||||||||||||||||
|
Q1-2009
|
Q2-2009
|
Q3-2009
|
Q4-2009
|
2009
|
2008
|
2007
|
||||||||||||||||||||||
|
Average
|
$ | 37,500 | $ | 17,700 | $ | 9,500 | $ | 19,200 | $ | 21,000 | $ | 59,800 | $ | 41,100 | ||||||||||||||
|
High
|
$ | 49,200 | $ | 35,000 | $ | 19,000 | $ | 29,100 | $ | 49,200 | $ | 140,000 | $ | 110,000 | ||||||||||||||
|
Low
|
$ | 21,000 | $ | 6,000 | $ | 2,000 | $ | 10,500 | $ | 2,000 | $ | 18,400 | $ | 13,100 | ||||||||||||||
|
*
|
2009 and 2008
rates based on West Africa to the U.S. Gulf Coast: 2007 rates based on
West Africa to the U.S. East Coast
|
Average
rates for Suezmax tankers in 2009 were down 65% from 2008 because of many of the
same conditions that adversely affected the VLCC market. Weaker rates also
reflected a decline of approximately 130,000 b/d in Nigerian crude oil output, a
key source of light sweet crude oil typically transported across the Atlantic on
Suezmax tankers. Lower refinery utilization levels at U.S. East Coast refineries
contributed to a decline in seaborne import requirements for light sweet crudes.
An increase in Brazilian production resulted in a pickup in crude oil movements
from Brazil to the U.S. as well as from Brazil to other South American countries
that benefited Suezmax employment to some extent. Concurrent with reduced
overall demand, the Suezmax tanker fleet experienced a net increase in tonnage
of 7.7% during 2009, exacerbating the Suezmax supply and demand
balance.
|
44
|
Overseas
Shipholding Group,
Inc.
|
Rates
during the first quarter of 2009 averaged $37,500 per day, approximately 21%
lower than the first quarter of 2008. West African OPEC members, Angola and
Nigeria, were approximately 80% compliant with their production quotas by the
end of March, which brought their combined production in the first quarter down
approximately 420,000 b/d relative to the first quarter of 2008. This drop in
output resulted in a decrease in Suezmax tonnage requirements.
Rates in
the second quarter of 2009 averaged $17,700 per day, 76% below rates in the
second quarter of 2008, negatively affected by a declaration of force majeure by
oil companies operating in Nigeria. Specifically, Shell Oil
Company, Chevron and ENI were forced to shut in production due to infrastructure
damaged from attacks by insurgents. A decrease in North African OPEC crude oil
production of approximately 330,000 b/d in the second quarter compared with the
same year ago period also adversely impacted Suezmax tonne-mile
demand.
Nigerian
production fell to approximately 1.68 million b/d in July 2009, the lowest level
in the past 20 years, contributing to an overall decrease in production of
approximately 190,000 b/d in the third quarter of 2009 compared with the third
quarter of 2008. This decline, coupled with a decline in OPEC North African
production of approximately 260,000 b/d, resulted in third quarter Suezmax rates
reaching their low point of the year.
Fourth
quarter rates averaged $19,200 per day, approximately 64% below those in the
fourth quarter of 2008, but above those in the third quarter of 2009. The
increase in rates relative to the third quarter reflected a 200,000 b/d increase
in Nigerian production, bolstered by an increase in December production to its
highest level in over 20 months. The increase in production resulted from an
indefinite ceasefire reached between the Nigerian government and insurgents.
Production in Nigeria could continue to increase from current levels should the
ceasefire be maintained.
The
employment of approximately 20 newly built Suezmax tankers as floating storage
for clean products also benefited rates in this sector to some
extent.
The world
Suezmax fleet totaled 392 tankers (60.0 million dwt) at December 31,
2009 of which single hull tankers represented 8% of the fleet, based on
deadweight tons. The year-end 2009 Suezmax orderbook totaled 150 vessels (23.4
million dwt) representing 39% of the existing Suezmax fleet, based on deadweight
tons, down from 186 vessels (29.1 million dwt), or 52.3% of the fleet at
year-end 2008.
International
Flag Aframaxes
|
Spot Market TCE Rates
Aframaxes in the Caribbean*
|
||||||||||||||||||||||||||||
|
Q1-2009
|
Q2-2009
|
Q3-2009
|
Q4-2009
|
2009
|
2008
|
2007
|
||||||||||||||||||||||
|
Average
|
$ | 24,200 | $ | 9,200 | $ | 3,500 | $ | 11,700 | $ | 12,200 | $ | 42,900 | $ | 29,900 | ||||||||||||||
|
High
|
$ | 73,000 | $ | 17,500 | $ | 8,500 | $ | 31,000 | $ | 73,000 | $ | 95,000 | $ | 108,600 | ||||||||||||||
|
Low
|
$ | 8,700 | $ | 3,400 | $ | 1,000 | $ | 2,200 | $ | 1,000 | $ | 5,200 | $ | 8,400 | ||||||||||||||
* Based
on Caribbean to the U.S. Gulf and Atlantic Coasts
Rates for
Aframaxes operating in the Caribbean averaged $12,200 per day during 2009, a
decline of 72% compared with 2008. Lower 2009 rates were largely due to the
knock-on effect of weaker rates in the larger tanker markets, lower crude oil
production levels in both Mexico and the North Sea and a reduction in fuel oil
demand as lower cost natural gas continued to displace fuel oil for power
generation in Europe and North America. In addition, the Aframax fleet grew by
5.9% during 2009.
Rates for
Aframaxes operating in the Caribbean during the first quarter of 2009 averaged
$24,200 per day, a decrease of 33% from the first quarter of 2008. First quarter
rates were adversely affected by production declines in key Aframax loading
areas and a lack of ballast activity as regional rate differentials presented
very few arbitrage opportunities for owners. North Sea and Mexican crude oil
production in the first quarter declined approximately 240,000 b/d compared with
the first quarter of 2008.
Lower
Mexican crude oil production in the second quarter of 2009 compared with 2008
adversely impacted freight rates. In addition, production declines in the North
Sea in the second quarter were exacerbated by more extensive than usual
maintenance activities. Demand for crude oil by both U.S. and European refiners
fell sharply from 2008 and refinery runs decreased on both sides of the Atlantic
in the face of falling product demand.
|
2009
Annual Report
|
45
|
Aframax
employment and freight rates in the third quarter were adversely impacted by
higher- than-normal planned refinery maintenance activities. North Sea
production declined approximately 280,000 b/d compared with the third quarter of
2008 due to extensive maintenance activity in addition to normal field declines.
Crude oil exports from the Baltic Sea were curtailed by maintenance work on the
Russian pipeline system. The diminished quantity of cargoes available from both
the Baltic and North Sea regions forced tankers to seek employment
elsewhere.
Fourth
quarter rates averaged $11,700 per day, 70% below the fourth quarter of 2008.
The increased size of the fleet combined with lower refinery runs in the U.S.
and Europe, and continued reduced production levels in both the North Sea and
Mexico, adversely impacted rates. These negative factors were mitigated to some
extent as some Aframax tankers found employment as floating storage for clean
products.
The world
Aframax fleet totaled 833 vessels (87.5 million dwt) as of
December 31, 2009, including 55 single hull tankers representing 6% of the
fleet, based on deadweight tons. The Aframax orderbook stood at 160 vessels
(17.5 million dwt) at December 31, 2009, representing 20.1% of the
existing Aframax fleet, based on deadweight tons.
International
Flag Panamaxes
|
Spot Market TCE Rates
Panamaxes—Crude and Residual Oils*
|
||||||||||||||||||||||||||||
|
Q1-2009
|
Q2-2009
|
Q3-2009
|
Q4-2009
|
2009
|
2008
|
2007
|
||||||||||||||||||||||
|
Average
|
$ | 21,300 | $ | 13,900 | $ | 8,500 | $ | 8,700 | $ | 13,100 | $ | 32,400 | $ | 26,100 | ||||||||||||||
|
High
|
$ | 38,000 | $ | 23,000 | $ | 20,000 | $ | 20,500 | $ | 38,000 | $ | 53,800 | $ | 49,000 | ||||||||||||||
|
Low
|
$ | 5,000 | $ | 3,700 | $ | 0 | $ | 0 | $ | 0 | $ | 14,300 | $ | 7,600 | ||||||||||||||
* Based
on 50% Caribbean to the U.S. Gulf and Atlantic Coasts and 50% Ecuador to the
U.S. West Coast
Rates for
Panamaxes that move crude and residual oils averaged $13,100 per day during
2009, which was approximately 60% below average 2008 rates. The decline in rates
was primarily due to a decrease in fuel oil exports from the U.S. Gulf Coast to
South America, a decrease in the quantity of South American crude oil
transported to U.S. West Coast refineries and to a reversal in the direction of
crude oil flows through the Trans-Panama pipeline.
Rates
averaged $21,300 per day during the first quarter of 2009, 25% below the first
quarter of 2008. The lower rates were primarily due to the decline in fuel oil
exports from the U.S. and the reduced quantity of crude oil moved on Panamax
tankers from South America as discussed above.
Refinery
utilization levels on the U.S. West Coast declined from 86.8% in the second
quarter of 2008 to 77.1% in the second quarter of 2009. This reduced second
quarter 2009 crude oil import requirements and adversely affected the
Ecuador-to-U.S. West Coast crude oil trade.
During
the third quarter, changing supply patterns caused by the reversal in direction
of crude oil flow through the Trans-Panama pipeline adversely affected Panamax
tanker rates. The reversal in crude flows to an east-to-west direction allowed
oil from South America and West Africa to flow through the pipeline into newly
expanded storage facilities on the west coast of Panama, reducing the demand for
Panamax tankers that ship crude oil from Ecuador to U.S. West Coast refineries.
In addition, many of the cargoes that used to move directly from Ecuador to U.S.
West Coast refineries (a 21 day voyage) are now being delivered to storage
facilities in Panama (5 day voyage), where larger size tankers are then used to
ship the oil to its ultimate destination.
Fourth
quarter rates were 70% below those in the fourth quarter of 2008 as fuel oil
shipments from the U.S. to South American countries decreased and oil trade
activity within the Caribbean Basin remained sluggish.
The world
Panamax fleet at December 31, 2009 stood at 427 vessels
(29.8 million dwt) including 46 single hull vessels representing 10%
of the current fleet based on deadweight tons. The orderbook of 94 vessels (6.6
million dwt) at December 31, 2009 represents 22.3% of the existing fleet based
on dead weight tons. This is down from the December 31, 2008 orderbook of 136
vessels (9.6 million dwt) that represented 33.8% of the Panamax fleet,
based on deadweight tons.
|
46
|
Overseas
Shipholding Group,
Inc.
|
International
Flag Handysize Product Carriers
|
Spot Market TCE Rates
Handysize Product Carriers*
|
||||||||||||||||||||||||||||
|
Q1-2009
|
Q2-2009
|
Q3-2009
|
Q4-2009
|
2009
|
2008
|
2007
|
||||||||||||||||||||||
|
Average
|
$ | 11,000 | $ | 6,800 | $ | 3,000 | $ | 2,700 | $ | 5,900 | $ | 20,800 | $ | 21,000 | ||||||||||||||
|
High
|
$ | 18,200 | $ | 15,500 | $ | 7,100 | $ | 8,400 | $ | 18,200 | $ | 35,800 | $ | 39,000 | ||||||||||||||
|
Low
|
$ | 3,000 | $ | 1,500 | $ | 0 | $ | 0 | $ | 0 | $ | 7,700 | $ | 6,700 | ||||||||||||||
* Based
on 60% trans-Atlantic and 40% Caribbean to the U.S. Atlantic Coast
Rates for
Handysize Product Carriers operating in the Caribbean and trans-Atlantic trades
averaged $5,900 per day in 2009, 72% below 2008 rates. The lower rates in 2009
reflected an increase in tonnage, a reduction in trans-Atlantic movements as
refining levels in both the U.S. and Europe fell in response to weakening
product demand, a reduction in intra-Asian product movements and lower middle
distillate demand that sharply reduced arbitrage opportunities.
Rates in
the first quarter of 2009 averaged $11,000 per day compared with $17,300
per day in the same year ago period. Weaker rates reflected a net increase in
tonnage and a decline in worldwide oil demand. Narrower refining margins in
Europe and Asia resulted in cuts in discretionary runs, curtailing product
movements in both of these regions. Outages at South Korean and Taipei crackers
and diminished demand for petrochemicals resulted in a decrease in naphtha
movements to Asia, further contributing to weaker rates.
Rates
averaged $6,800 per day in the second quarter, down from $28,300 in the second
quarter of 2008. A 5% decline in worldwide middle distillate demand led to a
cutback in refining runs and significantly limited arbitrage
opportunities. Lower refinery utilization rates in Europe, which
resulted in less gasoline being produced, in conjunction with more than adequate
U.S. gasoline inventories, curtailed trans-Atlantic gasoline
movements.
Rates in
the third quarter averaged $3,000 per day compared with $23,300 per day in the
comparable 2008 period. Relatively weak U.S. demand for gasoline during the
summer months when demand is usually seasonally strong resulted in a decline in
import requirements. Decreased demand for petrochemicals in Asia relative to a
year ago resulted in a slowdown in the Middle East-to-Asia petrochemical trade
as well as a reduction in intra-Asian product trades. Existing weak demand just
as a large number of newbuildings entered the market placed a considerable
amount of downward pressure on Product Carrier rates.
The
lowest quarterly average rate for Product Carriers in 2009, of less than $3,000
per day, occurred in the fourth quarter as OECD demand levels remained weak
relative to a year ago and refinery utilization rates in all OECD areas
continued to fall. In addition, there was a drawdown in U.S. middle distillate
inventories from 171 million barrels to 159 million barrels during the fourth
quarter, further reducing import requirements and tonne-mile demand. The
continued increase in the size of the fleet even as demand remained weak,
maintained significant downward pressure on rates.
The world
Handysize fleet reached 1,550 vessels (66.0 million dwt) at
December 31, 2009, including 209 single hull tankers that comprised 12% of
the total Handysize fleet, based on deadweight tons. The orderbook at year-end
2009 stood at 346 vessels (16.1 million dwt) representing 24.4% of the existing
orderbook. This was down from the December 31, 2008 orderbook of 484
vessels (22.4 million dwt), equivalent to 36.8% of the Handysize fleet,
based on deadweight tons.
U.S.
Flag Jones Act Product Carriers and Articulated Tug Barges (“ATBs”)
|
Average Spot Market TCE Rates
|
||||||||||||||||||||||||||||
|
Q1-2009
|
Q2-2009
|
Q3-2009
|
Q4-2009
|
2009
|
2008
|
2007
|
||||||||||||||||||||||
|
45,000
dwt Tankers
|
$ | 46,600 | $ | 31,900 | $ | 33,100 | $ | 34,900 | $ | 36,650 | $ | 45,025 | $ | 56,100 | ||||||||||||||
|
30,000
dwt ATBs
|
$ | 30,500 | $ | 22,200 | $ | 23,000 | $ | 23,800 | $ | 24,850 | $ | 27,100 | $ | 36,400 | ||||||||||||||
Jones Act
Product Carrier and ATB rates in 2009 were approximately 19% and 8%
respectively, below 2008 levels. The lower rates primarily reflected a reduction
in U.S. oil demand and lower refinery utilization levels that reduced volumes
available for seaborne transport.
|
2009
Annual Report
|
47
|
In
response to weaker demand levels and lower refining margins, U.S. Gulf Coast
refinery utilization rates in the first quarter fell to 81.4% from 83.7% in the
first quarter of 2008. This development limited the quantity of products
available for seaborne movements from the Gulf Coast region and resulted in an
increase in waiting time, adversely impacting rates. As a result, first quarter
2009 rates for Jones Act Product Carriers and ATBs were down 9% and 3%,
respectively, compared with the same timeframe in 2008.
Jones Act
Product Carrier rates in the second quarter were 18% below those in the second
quarter of 2008 while ATB rates were 4% higher. Weak U.S. oil demand and the
entry of six vessels into the product spot market that had previously been
employed in the grain trade were the principal factors that weighed on spot
rates. ATB rates in the second quarter of 2009 were slightly higher than those
in the second quarter of 2008 largely due to a significant decrease in the price
of diesel fuel, which is the primary fuel used to power ATBs.
Rates for
Jones Act Product Carriers and ATBs during the third quarter were approximately
17% and 4% below their respective third quarter 2008 rates. The decline in rates
continued to reflect weaker demand for products in 2009 that resulted in reduced
spot tanker requirements and longer waiting times for cargoes. However, tanker
and ATB freight rates during the third quarter of 2009 were somewhat buoyed by
an increase in maintenance activities at Irving Oil’s New Brunswick refinery in
Canada, which resulted in a reduction in exports of gasoline and middle
distillates from that facility to U.S. East Coast markets. This increased the
demand for oil products derived from U.S. Gulf Coast refineries and shipped on
Jones Act vessels to East Coast markets.
Fourth
quarter rates for Jones Act Product Carrier and ATBs were 32% and 25%,
respectively, below fourth quarter 2008 rates. Lower refining levels at U.S.
Gulf Coast refineries and a drawdown in middle distillate inventory levels,
especially along the U.S. East Coast reduced product seaborne movements on Jones
Act vessels.
As of
December 31, 2009, the total Jones Act Product Carrier fleet of tankers,
ATBs and ITBs (“Integrated Tug Barges”) consisted of 66 vessels, a decline of
two vessels during the fourth quarter of 2009. Three vessels entered the fleet
while five vessels were scrapped or reflagged. There were seven vessels in layup
at the end of the fourth quarter of 2009 due to a lack of cargoes.
The Jones
Act Product Carrier orderbook for deliveries scheduled through 2013 consisted of
16 tankers and barges in the 160,000 to 420,000 barrel size range. These
additions will be partially offset by the deletion of seven tankers that will
reach their OPA-90 phase out dates during the same period.
The
Delaware Bay lightering business transported an average of 208,000 b/d during
2009, a 14% decline from 2008 levels. The decline in annual lightering volumes
reflected a reduction in U.S. East Coast refinery utilization levels and the
winding down of Valero’s Delaware City and Sunoco’s Eagle Point refinery
operations.
The
Delaware Bay lightering business transported an average of 194,000 b/d during
the first quarter, which was approximately 27% below the first quarter level of
2008. The smaller amount lightered was due to a reduction in refinery runs at
East Coast refineries as U.S oil demand continued to falter.
A decline
in U.S. East Coast refinery utilization rates from 81% in the second quarter of
2008 to 71% in the second quarter of 2009 resulted in a 27 % decrease in
lightering volumes, which fell from 275,000 b/d in the second quarter of 2008 to
200,000 b/d in the second quarter of 2009.
The
Delaware Bay lightering business transported an average of 230,000 b/d during
the third quarter of 2009, down 3% from the third quarter of 2008, but the
highest volume lightered in 2009. This comparatively strong
performance could be largely attributed to low water levels at one customer’s
refinery that necessitated additional lightering.
Fourth
quarter 2009 lightering volumes declined by approximately 22% to 206,000 b/d
compared with the same period a year ago. Both the Eagle Point and Delaware City
refineries shut their crude units during this timeframe, reducing lightering
requirements.
UOutlook
Many
economists now agree that economic recovery is underway in many countries and
that growth in world GDP will occur in 2010. Consequently, 2010 world oil demand
is forecast to reach 86.3 million b/d, an increase of approximately 1.7%, or 1.4
million b/d, over 2009 levels. The forecast for an increase in demand for 2010
follows two consecutive years of falling world oil demand, with 2009 demand
having decreased by 1.5% and 2008 demand having decreased by 0.3%.
|
48
|
Overseas
Shipholding Group, Inc.
|
While
world oil demand is expected to increase by 1.8% in 2010, non-OPEC production is
forecast to increase by only 0.5% from 2009 levels. Production declines that are
forecast to occur in the North Sea and Mexico are likely to be offset by
increased production in the Former Soviet Union and Brazil. Therefore, OPEC will
likely be called upon to increase production to meet projected 2010 oil demand
growth, which should result in an expansion in long-haul crude oil
movements.
The
largest increase in oil demand in 2010 is forecast to occur in non-OECD Asia
with growth of 4.0%, or 740,000 b/d. Refinery capacity in Asia is expected to
increase by approximately one million b/d in 2010, which will increase demand
for crude oil. This incremental demand will be partly met by crude oil from
Siberia that will be shipped through the new port of Kozmino on the Russian
Pacific Coast. It is anticipated that Asian countries will import incremental
quantities of West African light sweet crude oil as they continue to move toward
tighter sulfur specifications and will continue to increase quantities of Middle
East crudes as well. Increased seaborne shipments from these areas will boost
2010 tonne-mile demand in Asia over 2009 levels.
The sharp
drop in oil demand in OECD countries in 2008 and 2009 that adversely affected
refining margins resulted in discretionary refinery run cuts in the U.S., Europe
and Japan. Refiners in these regions are adjusting to the overcapacity situation
by closing units and refineries. It is estimated that approximately 1.4 million
b/d of refining capacity was shut down in 2009, including closures announced by
Valero and Sunoco in the U.S., Shell in Canada , Nippon in Japan and Total and
Petroplus in Europe. Some of the units could restart if sold, or if refining
margins improve significantly from current levels.
The world
tanker fleet should remain fairly stable in 2010 due to the phasing out of
single hull tankers as the 2010 IMO deadline for single-hull tankers is reached
and as more countries choose to ban the use of single hull tankers in their
waters ahead of the IMO phase-out timetable. Overall fleet growth in 2010 is,
therefore, expected to be minimal. The world fleet of VLCCs is forecast to
shrink for the first time in seven years as more single hull VLCCs are scrapped
than new vessels delivered.
It is
unlikely that all vessels reported in the current orderbook will be delivered as
scheduled. Tanker cancelations and delivery deferrals are forecast to occur in
each tanker category and some tankers will be converted into the dry bulk
market. This will enhance tanker utilization rates in 2010 and 2011
timeframes.
The
confluence of demand growth, especially in Asia, favorable changes in seaborne
trade patterns and minimal, if any, growth in tonnage supply, should support
freight rates in 2010. However, it will probably take more than one year to
reverse the supply and demand imbalance that occurred in 2009 when tonne-mile
demand declined as tonnage supply increased. It is, therefore, anticipated that
2010 rates could remain under pressure. The tanker market remains highly
sensitive to severe weather, geopolitical and economic events that can create
inefficiencies, market imbalances and temporary shortages and thus, impact rates
within a shorter timeframe.
UCRITICAL ACCOUNTING
POLICIES
The
Company’s consolidated financial statements are prepared in accordance with
accounting principles generally accepted in the United States, which require the
Company to make estimates in the application of its accounting policies based on
the best assumptions, judgments, and opinions of management. Following is a
discussion of the accounting policies that involve a higher degree of judgment
and the methods of their application. For a description of all of the Company’s
material accounting policies, see Note A to the Company’s consolidated financial
statements set forth in Item 8.
Revenue
Recognition
The
Company generates a majority of its revenue from voyage charters, including
vessels in pools that predominantly perform voyage charters. Within the shipping
industry, there are two methods used to account for voyage charter revenue: (1)
ratably over the estimated length of each voyage and (2) completed voyage. The
recognition of voyage revenues ratably over the estimated length of each voyage
is the most prevalent method of accounting for voyage revenues and the method
used by OSG. Under each method, voyages may be calculated on either a
load-to-load or discharge-to-discharge basis. In applying its revenue
recognition method, management believes that the discharge-to-discharge basis of
calculating voyages more accurately estimates voyage results than the
load-to-load basis. Since, at the time of discharge, management generally knows
the next load port and expected discharge port, the discharge-to-discharge
calculation of voyage revenues can be estimated with a greater degree of
accuracy. OSG does not begin recognizing voyage revenue until a Charter has been
agreed to by both the Company and the customer, even if the vessel has
discharged its cargo and is sailing to the anticipated load port on its next
voyage.
|
2009
Annual Report
|
49
|
Revenues
from time charters and bareboat charters are accounted for as operating leases
and are thus recognized ratably over the rental periods of such charters, as
service is performed. The Company does not recognize time charter revenues
during periods that vessels are off hire. Certain of these charters provide for
profit sharing between the Company and the charterer when rates earned exceed a
base rate defined in the agreements. The Company only recognizes profit sharing
when there is no longer any risk that any amounts accruable can be recaptured.
If such agreements provide that profit sharing be determined annually on the
anniversary of delivery of the vessels onto the charters, the Company’s share,
if any, would not be recognized until the charter anniversary date.
For the
Company’s vessels operating in commercial pools, revenues and voyage expenses
are pooled and allocated to each pool’s participants on a time charter
equivalent basis in accordance with an agreed-upon formula. The pools may enter
into contracts that earn either voyage charter revenue or time charter revenue.
Each of the pools follows the same revenue recognition principles, as applied by
the Company, in determining shipping revenues and voyage expenses, including
recognizing revenue only after a Charter has been agreed to by both the pool and
the customer, even if the vessel has discharged its cargo and is sailing to the
anticipated load port on its next voyage.
Vessel
Lives
The
carrying value of each of the Company’s vessels represents its original cost at
the time it was delivered or purchased less depreciation calculated using an
estimated useful life of 25 years (except for Floating Storage and Offloading
service vessels (“FSO”) and LNG Carriers for which an estimated useful lives of
30 and 35 years, respectively, are used) from the date such vessel was
originally delivered from the shipyard or 20 years from the date the Company’s
ATBs were rebuilt. Effective January 1, 2008, the Company effected a change in
estimate related to the estimated scrap rate for substantially all of its
vessels from $150 per lightweight ton to $300 per lightweight ton The Company’s
assumptions used in the determination of estimated salvage value took into
account then current scrap prices, which were in excess of $700 per lightweight
ton, the historic pattern of scrap rates over the four years ended December 31,
2007, which ranged from $250 to over $500 per lightweight ton, estimated changes
in future market demand for scrap steel and estimated future demand for
vessels.
As of
December 31, 2007, the average age for OSG’s owned international flag fleet
sectors ranged from 4.3 years to 9.2 years. The industry standard for
determining the economic life-span for tankers is 25 years. The steel scrap
price forecast to determine vessel salvage value was therefore based on economic
assumptions and conditions that were expected to exist over a forward looking 15
to 20 year timeframe from December 31, 2007 given the current age of the
Company’s fleet. The strength of the world’s economic growth will vary during
this timeframe from periods of global recession and low commodity price levels
to periods of varied economic growth where steel prices will be determined by
industrial production, financing and credit availability for projects and
government sponsored infrastructure investments throughout the world. Management
reviewed steel plate prices in Asia and in North America from January 2000
through December of 2007 that showed a more than doubling of steel plate prices
in both areas within this timeframe. Actual scrap prices were consistently
priced at over $300 per lightweight ton from January 2004 through June 2008.
Scrap values declined below $300 per lightweight ton towards the end of 2008,
due to turmoil in the financial markets, which caused a general decline in
vessel values. The scrap market also experienced a period with very little
activity in 2008 as scrappers were unable to obtain letters of credit, which
caused further downward pressure on prices. The weak freight markets during 2009
resulted in owners scrapping more vessels, and scrapping them earlier in their
lives. The Company expects scrapping levels to remain high during 2010,
considering owners’ rate expectations and the phase out of single hull tankers
in 2010, and therefore considers it likely that scrap prices will remain low
over this period with downward pressure from current levels possible. Management
also took into consideration that commodity prices have historically increased
over extended time horizons and believes that it is reasonable to forecast that
steel scrap prices will increase over time as economic activity increases from
today’s level. Management believes that $300 per lightweight ton is a reasonable
estimate of future scrap prices, taking into consideration the cyclicality of
the nature of future demand for scrap steel. Although management believes that
the assumptions used to determine the scrap rate are reasonable and appropriate,
such assumptions are highly subjective, in part, because of the cyclicality of
the nature of future demand for scrap steel.
|
50
|
Overseas
Shipholding Group,
Inc.
|
The
Company has evaluated the impact of the revisions to MARPOL Regulation 13G that
became effective April 5, 2005 and the EU regulations that went into force on
October 21, 2003 on the economic lives assigned to the tankers in the Company’s
International Flag fleet. The International Flag tanker fleet comprises mainly
double hull vessels. The revised regulations do not require any double sided
International Flag tankers to be removed from service prior to attaining 25
years of age. The revised Regulation 13G allows the flag state to permit the
continued operation of the Company’s double sided tankers beyond 2010. Because
such regulations do not explicitly permit double sided tankers to continue
trading beyond 2010, their operation beyond 2010 is not assured. OSG considered
the need to reduce the estimated remaining useful lives of its double sided
International Flag tankers because of the EU regulations and the revised and
accelerated phase-out schedule agreed to by IMO in December 2003. These
regulations do not prevent any of these vessels from trading prior to reaching
25 years of age. Accordingly, it was not deemed necessary to reduce the
estimated remaining useful lives of any of OSG’s double sided International Flag
tankers. If the economic lives assigned to the tankers prove to be too long
because of new regulations or other future events, higher depreciation expense
and impairment losses could result in future periods related to a reduction in
the useful lives of any affected vessels.
The U.S.
has not yet adopted the Hong Kong International Convention for the Safe and
Environmentally Sound Recycling of Ships (the “Convention”). While the U.S.
Environmental Protection Agency (“EPA”) and the U.S. Maritime Administration
(“MarAd”) discuss the implications and potential adoption of this Convention,
scrapping U.S. Flag vessels could become subject to additional requirements,
which could negatively impact sales prices obtainable in the markets or require
companies, such as OSG, to incur additional costs in order to sell, for further
trading, or scrap U.S. Flag vessels. Currently, management believes that $300
per lightweight ton is a reasonable estimate of scrap prices for its U.S. Flag
vessels.
Vessel
Impairment
The
carrying values of the Company’s vessels may not represent their fair market
value at any point in time since the market prices of second-hand vessels tend
to fluctuate with changes in charter rates and the cost of newbuildings.
Historically, both charter rates and vessel values tend to be cyclical. The
Company records impairment losses only when events occur that cause the Company
to believe that future cash flows for any individual vessel will be less than
its carrying value. The carrying amounts of vessels held and used by the Company
are reviewed for potential impairment whenever events or changes in
circumstances indicate that the carrying amount of a particular vessel may not
be fully recoverable. In such instances, an impairment charge would be
recognized if the estimate of the undiscounted future cash flows expected to
result from the use of the vessel and its eventual disposition is less than the
vessel’s carrying amount. This assessment is made at the individual vessel level
as separately identifiable cash flow information for each vessel is
available.
In
developing estimates of future cash flows, the Company must make assumptions
about future charter rates, ship operating expenses, and the estimated remaining
useful lives of the vessels. These assumptions are based on historical trends as
well as future expectations. Although management believes that the assumptions
used to evaluate potential impairment are reasonable and appropriate, such
assumptions are highly subjective.
During
2008, the Company decided not to have two older U.S. Flag vessels (one Product
Carrier and one ATB) undergo scheduled drydockings, which were required to
continue operating such vessels. These vessels therefore ceased operating during
the fourth quarter of 2008 and were placed in lay-up pending the sale of such
vessels. Accordingly the Company recorded a charge of $32,597,000 to write down
the carrying amount of these vessels to their estimated net fair value as of
December 31, 2008.
In early
2009, OSG began negotiations with Bender Shipbuilding & Repair Co., Inc.
(“Bender”) to terminate the construction agreements covering the six ATBs and
two tug boats associated with its U.S. Flag expansion plans due to repeated
delays in vessel delivery dates from the original contract delivery dates,
Bender’s request for substantial price increases on all contracted vessels and
OSG’s concern about Bender’s ability to complete the ATBs and tug boats within
contract terms, including
Bender's lack of performance under such agreements and its financial condition.
The Company reviewed the six ATBs and two tugboats for impairment based on the
information known to it as of December 31, 2008. Accordingly, OSG recorded
impairment charges of $105,111,000 in the fourth quarter of 2008 related to four
of such ATBs.
|
2009
Annual Report
|
51
|
During
the third quarter of 2009, events and circumstances indicated that the four
single-hulled U.S. Flag Product Carriers, which have limited remaining lives due
to OPA regulations that mandate their retirement between 2012 and 2013, and one
1977-built double-hulled U.S. Flag Product Carrier, which has a less-efficient
gas turbine engine, might be impaired. In September, the charterer of one of the
four single-hulled U.S. Flag Product Carriers informed OSG that they would not
be renewing the time charter upon its expiry in January 2010, which caused the
Company to evaluate the vessel’s future employment possibilities in light of its
approaching May 2010 drydocking. Also in September, two customers that are
currently utilizing the 1977-built double-hulled U.S. Flag Product Carrier
according to contracts of affreightment to perform lightering services in
Delaware Bay, announced restructurings of their refinery operations, which could
reduce lightering volumes, causing the Company to evaluate the possibility of
removing the vessel from lightering service prior to its required June 2010
drydocking. These facts, combined with continued weak market conditions, caused
the Company to review all five vessels, which had an aggregate net book value of
$45,602,000 as of September 30, 2009, for impairment. The estimates of the
undiscounted future cash flows for the 1977-built double-hulled vessel and one
of its single-hulled vessels did not support recovery of such vessels’ carrying
value. Accordingly, the Company recorded an impairment charge of $12,500,000 to
write down their carrying values to their estimated net fair values as of
September 30, 2009, using estimates of discounted future cash flows for each of
the vessels. The estimates of undiscounted cash flows for each of the remaining
three single-hulled vessels indicated that their carrying amounts were
recoverable. Because of the continued weakness in the U.S. Flag markets, the
Company reviewed all five vessels for further impairment at December 31, 2009,
based on the information known to it as of December 31, 2009, in a manner
consistent with the analysis performed at end of the preceding quarter.
Management concluded that no further impairment charges were required.
Nonetheless, it is possible that the estimate of undiscounted cash flows may
change in the future, including the Company’s estimate of salvage values as a
result of future rulings of, or interpretations by, EPA or MarAd, resulting in
the need to write down one or more of the five Product Carriers.
The
Company does not believe that the low market TCE rates for its International
Flag tankers achieved during the nine months ended December 31, 2009 represents
a triggering event for the review of the International Flag fleet for
impairment. Nevertheless, in December 2009, the Company reviewed a
representative sample of newbuildings and older tankers operating in the Crude
and Products segments for potential impairment. The Company concluded that the
future revenue streams expected to be earned by such vessels over their
remaining operating lives would be sufficient to recover their carrying
values.
Goodwill
and Intangible Assets
The
Company allocates the cost of acquired companies to the identifiable tangible
and intangible assets and liabilities acquired, with the remaining amount being
classified as goodwill. Certain intangible assets, such as customer
relationships, are being amortized. Future operating performance will be
affected by the amortization of intangible assets and potential impairment
charges related to goodwill. Accordingly, the allocation of purchase price to
intangible assets and goodwill may significantly affect our future operating
results. Goodwill and indefinite lived assets are not amortized, but reviewed
for impairment. The allocation of the purchase price of acquired companies
requires management to make significant estimates and assumptions, including
estimates of future cash flows expected to be generated by the acquired assets
and the appropriate discount rate to value these cash flows.
The
Company tests the goodwill in each of its reporting units for impairment at
least annually, or more frequently if impairment indicators arise by comparing
the estimated fair value of each operating segment with its net book value. In
the fourth quarter of 2008, the economic downturn resulted in a number of
market-related events that were expected to negatively impact the Company’s U.
S. Flag operations in the near and medium-term. Lower demand for refined
petroleum products in North America resulted in a number of major refining
companies reducing capacity throughout the Gulf of Mexico. The reduction in
planned refining expansion projects reduced future volumes of clean products
that had been forecast to move on Jones Act tankers. Recessionary forces also
resulted in unfavorable changes in trading patterns, as refiners shifted to
higher margin low sulfur diesel for export, resulting in an adverse impact on
tonne-mile demand in the Jones Act market and associated rates. As a result of
this deterioration in the forward supply/demand balance of the Jones Act market
and the reduction in the Company’s U.S. Flag newbuilding program, the Company
reduced its estimates of future cash flows to measure fair value and,
accordingly, recorded an impairment charge of $62,874,000, representing the full
value of the goodwill related to the U.S. Flag reportable segment in the fourth
quarter ended December 31, 2008. OSG derives the fair value of each of its
reporting units primarily based on discounted cash flow models. The process of
evaluating the potential impairment of goodwill and intangible assets is highly
subjective and requires significant judgment with respect to estimates of future
cash flows expected to be generated and the appropriate discount rate to value
these cash flows. The discounted cash flow models incorporate revenue
assumptions based on actual existing contracts and historical utilization rates
for vessels not under contract. The related costs and expenses are consistent
with the Company’s historical levels to support revenue growth. The weighted
average cost of capital reflects the risks associated with the underlying cash
flows taking into consideration both the industry and general economic
conditions at the time of testing.
Market
Value of Marketable Securities
The
Company’s holdings in marketable securities are classified as available-for-sale
and, therefore, carried on the balance sheet at fair value (determined using
period-end sales prices on U.S. or foreign stock exchanges) with changes in
carrying value recorded in accumulated other comprehensive income/(loss) until
the investments are sold. Accordingly, these changes in value are not reflected
in the Company’s statements of operations. If, however, the Company determines
that a material decline in fair value below the Company’s cost basis is other
than temporary, the Company would record a noncash impairment loss in the
statement of operations in the period in which that determination is made. As a
matter of policy, the Company evaluates all material declines in fair value for
impairment whenever the fair value of a stock has been below its cost basis for
six consecutive months. In the period in which a material decline in fair value
is determined to be other than temporary, the carrying value of that security
would be written down to its fair value at the end of such period, thereby
establishing a new cost basis.
|
52
|
Overseas
Shipholding Group,
Inc.
|
During
2009, the decrease in the market value of its marketable securities was
considered other-than-temporary and resulted in an impairment charge to earnings
of $5,151,000, which charge previously had been included in accumulated other
comprehensive income/(loss). At December 31, 2009, the fair value of the
Company’s marketable securities had declined below its newly established cost
basis of $1,037,000. This decline has been recorded in accumulated other
comprehensive income/(loss) because the decline in value was not considered to
be other-than-temporary since the market value of the securities had been below
its cost basis for six consecutive months.
Drydocking
Within
the shipping industry, there are two methods that are used to account for dry
dockings: (1) capitalize drydocking costs as incurred (deferral method) and
amortize such costs over the period to the next scheduled drydocking, and (2)
expense drydocking costs as incurred. Since drydocking cycles typically extend
over two and a half years or longer, management believes that the deferral
method provides a better matching of revenues and expenses than the
expense-as-incurred method.
Deferred
Tax Assets and Valuation Allowance
The
carrying value of the Company’s deferred tax assets is based on the assumption
that the Company will generate sufficient taxable income in the future to permit
the Company to take deductions. Each quarter, management evaluates the
realizability of the deferred tax assets and assesses the need for a valuation
allowance. Any increase in the valuation allowance against deferred tax assets
will result in additional income tax expense in the Company’s statement of
operations. During 2008, the Company established a valuation allowance of
$48,031,000 against the deferred tax assets resulting from the write-down of
vessels in the fourth quarter of 2008 and from net operating loss carryforwards
arising in 2008. The valuation allowance was established because the Company
could not determine that it was more likely than not that the full amount of the
deferred tax asset would be realized through the generation of taxable income in
the future. The valuation allowance was recorded as a reduction in the federal
income tax credit in the accompanying consolidated statement of operations for
the year ended December 31, 2008. On November 6, 2009, the President of the U.S.
signed the Worker, Homeownership, and Business Assistance Act of 2009. This law
included a provision allowing taxpayers to elect an increased carryback for net
operating losses incurred in either 2008 or 2009. As a result of this change in
the law, the write-down of certain vessels taken in 2008, which losses were 2009
events for tax purposes, was included in a net operating loss carryback against
earnings generated in 2004. The valuation allowance associated with these
deferred tax assets aggregating $21,624,000 was accordingly reversed since
realization was probable. The Company also established a valuation allowance of
$6,413,000 against deferred tax assets originating in 2009 for the same reasons
stated above for 2008.
|
2009
Annual Report
|
53
|
Pension
Benefits
The
Company has recorded pension benefit costs based on complex valuations developed
by its actuarial consultants. These valuations are based on key estimates and
assumptions, including those related to the discount rates used and the rates
expected to be earned on investments of plan assets. OSG is required to consider
market conditions in selecting a discount rate that is representative of the
rates of return currently available on high-quality fixed income investments. A
higher discount rate would result in a lower benefit obligation and a lower rate
would result in a higher benefit obligation. The expected rate of return on plan
assets is management’s best estimate of expected returns. A decrease in the
expected rate of return will increase net periodic benefit costs and an increase
in the expected rate of return will decrease benefit costs.
In
connection with the acquisition of Maritrans in November 2006, the Company
assumed the obligations under the noncontributory defined benefit pension plan
that covered eligible employees of Maritrans (“the Maritrans Plan”). The Company
froze the benefits payable under the Maritrans Plan as of December 31, 2006. The
selection of a discount rate for the Maritrans Plan for all reporting periods
between 2006 and December 31, 2008, was based on the assumption that the plan
would be terminated and all eligible participants would receive insurance
company annuities when all necessary approvals are obtained. The Company,
however, has not been able to secure such insurance annuities, which appears to
be at least partially attributable to the complexity of the Maritrans Plan.
Accordingly, at December 31, 2009, the Company used a discount rate of 5.50%
which it believes to be appropriate for ongoing plans with a long duration, such
as the Maritrans Plan. Certain of the Company’s foreign subsidiaries have
pension plans that, in the aggregate, are not significant to the Company’s
financial position.
Newly
Issued Accounting Standards
See Note
A to the Company’s consolidated financial statements set forth in Item
8.
|
54
|
Overseas
Shipholding Group,
Inc.
|
INCOME
FROM VESSEL OPERATIONS
During
2009, TCE revenues decreased by $592,764,000, or 38%, to $952,621,000 from
$1,545,385,000 in 2008, mainly due to a significant decrease in the daily TCE
rates earned by all of the Company’s international flag vessel classes, as well
as a 1,809 day decrease in revenue days. During 2009, approximately
49% of the Company’s TCE revenues were derived from spot earnings, compared with
65% in 2008 and 60% in 2007. In 2009, approximately 51% of TCE revenues were
generated from fixed earnings, which comprise time or bareboat charters (“term”)
and synthetic time charters (which represent earnings for certain vessels
operating in pools that have been converted to synthetic time charters through
hedging with FFAs and bunker swaps that qualify as cash flow hedges). Fixed
earnings represented 35% of the Company’s TCE revenues in 2008 and 40% in 2007.
During 2008, TCE revenues increased by $506,174,000, or 49%, to $1,545,385,000
from $1,039,211,000 in 2007, principally because of a 4,090 day increase in
revenue days and a significant increase in the daily TCE rates earned by the
Company’s VLCCs, and, to a lesser extent, Aframaxes.
OSG
operates most of its crude oil tankers in commercial pooling arrangements
(“Pools”). The Pools’ cargo commitments make them attractive, but such cargo
commitments limit the Pools’ ability to support any significant portfolio of
time charters. Accordingly, OSG enters into forward freight agreements (“FFAs”)
and bunker swaps seeking to create synthetic time charters. The results of
derivative positions that qualify for hedge accounting treatment and that are
effective, are reflected in TCE revenues in the periods to which such hedges
relate. The Company achieved average TCE rates for VLCCs of $41,959 per day for
3,342 days and $73,632 per day for 1,795 days covered by such effective hedges
for 2009 and 2008, respectively. The December 31, 2009 mark-to-market for
derivative positions through 2010 that qualify for hedge accounting treatment,
which are considered to be effective, are recorded in accumulated other
comprehensive income/(loss) (equity). The actual results of these hedge
positions will be reflected in the Company’s earnings in the period (January
2010) to which the positions relate. The results of derivative positions that do
not qualify for hedge accounting treatment are reflected in other
income/(expense) and resulted in income of $1,672,000 in 2009 and expense of
$33,774,000 in 2008.
Reliance
on the spot market contributes to fluctuations in the Company’s revenue, cash
flow, and net income, but affords the Company greater opportunity to increase
income from vessel operations when rates rise. On the other hand, time and
bareboat charters provide the Company with a predictable level of
revenues.
During
2009, income from vessel operations decreased by $268,056,000, or 78%, to
$77,130,000 from $345,186,000 in 2008. During 2008, income from vessel
operations increased by $137,614,000, or 66%, to $345,186,000 from $207,572,000
in 2007. See Note F to the consolidated financial statements set forth in Item 8
for additional information on the Company’s segments, including equity in income
of affiliated companies and reconciliations of (i) time charter equivalent
revenues to shipping revenues and (ii) income from vessel operations for the
segments to income before federal income taxes, including net income
attributable to noncontrolling interest, as reported in the consolidated
statements of operations. Information with respect to the Company’s
proportionate share of revenue days for vessels operating in companies accounted
for using the equity method is shown below in the discussion of “Equity in
Income of Affiliated Companies.”
|
International
Crude Tankers (dollars in thousands)
|
2009
|
2008
|
2007
|
|||||||||
|
TCE
revenues
|
$ | 488,021 | $ | 1,003,331 | $ | 569,264 | ||||||
|
Vessel
expenses
|
(104,052 | ) | (117,815 | ) | (88,766 | ) | ||||||
|
Charter
hire expenses
|
(230,123 | ) | (303,215 | ) | (178,646 | ) | ||||||
|
Depreciation
and amortization
|
(72,654 | ) | (73,934 | ) | (75,040 | ) | ||||||
|
Income
from vessel operations (a)
|
$ | 81,192 | $ | 508,367 | $ | 226,812 | ||||||
|
Average
daily TCE rate
|
$ | 26,307 | $ | 52,344 | $ | 34,352 | ||||||
|
Average
number of owned vessels (b)
|
24.8 | 25.4 | 26.0 | |||||||||
|
Average
number of vessels chartered-in under operating leases
|
27.0 | 27.8 | 20.6 | |||||||||
|
Number
of revenue days (c)
|
18,550 | 19,167 | 16,572 | |||||||||
|
Number
of ship-operating days: (d)
|
||||||||||||
|
Owned
vessels
|
9,039 | 9,286 | 9,490 | |||||||||
|
Vessels
bareboat chartered-in under operating leases
|
2,246 | 2,265 | 1,487 | |||||||||
|
Vessels
time chartered-in under operating leases
|
6,679 | 7,090 | 5,446 | |||||||||
|
Vessels
spot chartered-in under operating leases
|
921 | 819 | 604 | |||||||||
|
(a)
|
Income
from vessel operations by segment is before general and administrative
expenses, severance and relocation costs, shipyard contract termination
costs and gain/(loss) on disposal of vessels and impairment charges
(vessel and goodwill).
|
|
(b)
|
The
average is calculated to reflect the addition and disposal of vessels
during the year.
|
|
(c)
|
Revenue
days represent ship-operating days less days that vessels were not
available for employment due to repairs, drydock or lay-up. Revenue days
are weighted to reflect the Company’s interest in chartered in
vessels.
|
|
2009
Annual Report
|
55
|
|
(d)
|
Ship-operating
days represent calendar days.
|
The
following table provides a breakdown of TCE rates achieved for the years ended
December 31, 2009, 2008 and 2007 between spot and fixed earnings and the related
revenue days. The Company has entered into FFAs and related bunker swaps as
hedges against the volatility of earnings from operating the Company’s VLCCs and
Aframaxes in the spot market. These derivative instruments seek to create
synthetic time charters because their intended impact is to create a level of
fixed TCE earnings, which because of basis risk may vary (possibly
substantially) from the targeted rate. From the perspective of a vessel owner,
such as the Company, the results of these synthetic time charters are intended
to be substantially equivalent to results from time chartering vessels in the
physical market. The impact of these derivatives, which qualify for hedge
accounting treatment, are reported together with time charters entered in the
physical market, under “Fixed Earnings.” The information in these tables is
based, in part, on information provided by the pools or commercial joint
ventures in which the segment’s vessels participate.
|
2009
|
2008
|
2007
|
||||||||||||||||||||||
|
Spot
Earnings
|
Fixed
Earnings
|
Spot
Earnings
|
Fixed
Earnings
|
Spot
Earnings
|
Fixed
Earnings
|
|||||||||||||||||||
|
VLCCs:
|
||||||||||||||||||||||||
|
Average
rate
|
$ | 33,511 | $ | 41,959 | $ | 92,351 | $ | 73,632 | $ | 43,179 | $ | 44,887 | ||||||||||||
|
Revenue
days
|
1,866 | 3,342 | 4,044 | 1,795 | 5,497 | 193 | ||||||||||||||||||
|
Suezmaxes:
|
||||||||||||||||||||||||
|
Average
rate
|
$ | 26,174 | $ | — | $ | 49,550 | $ | — | $ | 38,324 | $ | — | ||||||||||||
|
Revenue
days
|
864 | — | 772 | — | 27 | — | ||||||||||||||||||
|
Aframaxes:
|
||||||||||||||||||||||||
|
Average
rate
|
$ | 20,037 | $ | 32,868 | $ | 38,432 | $ | 31,765 | $ | 30,036 | $ | 30,516 | ||||||||||||
|
Revenue
days
|
7,244 | 1,009 | 6,237 | 1,451 | 4,843 | 1,524 | ||||||||||||||||||
|
Panamaxes:
|
||||||||||||||||||||||||
|
Average
rate
|
$ | 18,983 | $ | 25,424 | $ | 36,311 | $ | 26,687 | $ | 32,268 | $ | 26,076 | ||||||||||||
|
Revenue
days
|
2,257 | 1,604 | 2,386 | 1,778 | 1,795 | 1,982 | ||||||||||||||||||
During
2009, TCE revenues for the International Crude Tankers segment decreased by
$515,310,000, or 51%, to $488,021,000 from $1,003,331,000 in 2008. This decrease
in TCE revenues resulted primarily from a significant decrease in daily TCE
rates earned on all classes of tankers across the crude fleet and, to a lesser
extent, a decrease of 617 revenue days. The decrease in revenue days reflects
the sale in January 2009 of one VLCC and the commencement of conversion of a
ULCC to an FSO, as well as a reduction in chartered-in VLCCs and
Panamaxes. These decreases were partially offset by increased days
attributable to the OSG Lightering business during 2009.
Vessel
expenses decreased by $13,763,000 to $104,052,000 in 2009 from $117,815,000 in
2008. In the fourth quarter of 2009, the Company recorded a reserve of
$3,357,000 for a probable assessment in 2010 (based on the 2009 pension plan
valuation) by the MNOPF. The MNOPF is a multi-employer pension plan covering
British crew members that served as officers onboard OSG’s vessels (as well as
vessels of other owners) in prior years. Although the Company has not been an
active member of the plan for a number of years, because the plan is
underfunded, additional assessments are possible in future years. This remaining
change in vessel expenses was principally attributable to a decrease in average
daily vessel expenses of $1,303 per day. The decrease is primarily due to the
timing of delivery of stores and spares, lower insurance premiums and reductions
in repairs and the renegotiation of fixed rate technical management agreements
between the Company and DHT Maritime, Inc., formerly Double Hull Tankers, Inc.
(“DHT”), on seven tankers, effective January 17, 2009. Under the
renegotiated agreements, DHT is responsible for all vessel
expenses. Charter hire expenses decreased by $73,092,000 to
$230,123,000 in 2009 from $303,215,000 in 2008. This decrease was principally as
a result of lower profit share due to owners reflecting lower TCE rates achieved
on the VLCC and Aframax fleets, and a 431 day reduction in bareboat and time
chartered-in days. Additionally, OSG Lightering was able to fill its
spot charter-in requirements at lower rates in 2009 compared with 2008 due to
the significant reduction in Aframax rates.
During
2008, TCE revenues for the International Crude Tankers segment increased by
$434,067,000, or 76%, to $1,003,331,000 from $569,264,000 in 2007. This increase
in TCE revenues resulted primarily from a significant increase in daily TCE
rates earned by the VLCCs and, to a lesser extent, the Aframaxes, and an
increase of 2,595 revenue days. The increase in revenue days reflects the
Company’s expansion into Suezmaxes late in 2007 adding 745 revenue days during
2008, as well as the fact that the Crude Tankers segment includes the operating
results of the OSG Lightering business from April 1, 2007, the effective date of
the transaction. Out-of-service days in 2008 for drydocking and repairs
decreased by 164 days compared with 2007.
|
56
|
Overseas
Shipholding Group,
Inc.
|
Vessel
expenses increased by $29,049,000 to $117,815,000 in 2008 from $88,766,000 in
the prior year reflecting a net increase of 574 owned and bareboat chartered-in
days. This increase was principally attributable to the commencement of bareboat
charters-in on two Suezmaxes in December 2007 and January 2008 and two Aframaxes
in the fourth quarter of 2008. The above increase in days was partially offset
by the sale of the Pacific Ruby in May 2008. Average daily expenses increased by
$1,632 per day, principally as a result of increases in crew costs, repairs and
insurance premiums. Charter hire expenses increased by $124,569,000 to
$303,215,000 in 2008 from $178,646,000 in 2007. This increase was principally as
a result of (i) the bareboat charters-in discussed above and additional
chartered-in vessels, primarily in the Aframax and Panamax fleets, (ii)
additional profit sharing due to the owners of chartered-in VLCCs, and to a
lesser extent, Aframax tonnage because of the increase in TCE rates earned
during 2008 compared with 2007, and (iii) the acquisition of the Heidmar
lightering business.
|
International Product Carriers (dollars in thousands)
|
2009
|
2008
|
2007
|
|||||||||
|
TCE
revenues
|
$ | 225,059 | $ | 298,132 | $ | 243,451 | ||||||
|
Vessel
expenses
|
(80,899 | ) | (93,111 | ) | (83,348 | ) | ||||||
|
Charter
hire expenses
|
(105,813 | ) | (79,648 | ) | (51,147 | ) | ||||||
|
Depreciation
and amortization
|
(41,508 | ) | (55,796 | ) | (51,287 | ) | ||||||
|
Income
from vessel operations
|
$ | (3,161 | ) | $ | 69,577 | $ | 57,669 | |||||
|
Average
daily TCE rate
|
$ | 17,976 | $ | 22,803 | $ | 20,454 | ||||||
|
Average
number of owned vessels
|
13.4 | 15.3 | 16.4 | |||||||||
|
Average
number of vessels chartered-in under operating leases
|
21.9 | 21.4 | 17.3 | |||||||||
|
Number
of revenue days
|
12,521 | 13,074 | 11,903 | |||||||||
|
Number
of ship-operating days:
|
||||||||||||
|
Owned
vessels
|
4,903 | 5,598 | 5,994 | |||||||||
|
Vessels
bareboat chartered-in under operating leases
|
4,819 | 5,900 | 5,021 | |||||||||
|
Vessels
time chartered-in under operating leases
|
3,161 | 1,917 | 1,297 | |||||||||
The
following table provides a breakdown of TCE rates achieved for the years ended
December 31, 2009, 2008 and 2007 between spot and fixed earnings and the related
revenue days. The information is based, in part, on information provided by the
commercial joint ventures in which certain of the segment’s vessels
participate.
|
2009
|
2008
|
2007
|
||||||||||||||||||||||
|
Spot
Earnings
|
Fixed
Earnings
|
Spot
Earnings
|
Fixed
Earnings
|
Spot
Earnings
|
Fixed
Earnings
|
|||||||||||||||||||
|
Panamax
Product Carriers:
|
||||||||||||||||||||||||
|
Average
rate
|
$ | 17,227 | $ | 19,094 | $ | 39,189 | $ | 18,653 | $ | 28,352 | $ | 19,471 | ||||||||||||
|
Revenue
days
|
1,378 | 282 | 785 | 730 | 316 | 730 | ||||||||||||||||||
|
Handysize
Product Carriers:
|
||||||||||||||||||||||||
|
Average
rate
|
$ | 15,867 | $ | 20,148 | $ | 26,718 | $ | 19,851 | $ | 28,167 | $ | 18,761 | ||||||||||||
|
Revenue
days
|
4,879 | 5,542 | 4,025 | 7,534 | 2,775 | 8,082 | ||||||||||||||||||
During
2009, TCE revenues for the International Product Carrier segment decreased by
$73,073,000, or 25%, to $225,059,000 from $298,132,000 in 2008. This decrease in
TCE revenues principally resulted from a decrease in the average rates earned on
the Handysize Product Carriers and Panamax Product Carriers operating in the
spot market. Revenue days have also decreased by 554
days. By the end of August 2009, all 13 of the segment’s older,
single-hulled Handysize Product Carriers had redelivered to the owners at the
expiry of their respective charters. These redeliveries were
partially offset by an increase in chartered-in modern Handysize Product
Carriers, one Aframax Product Carrier (LR2), which operated in the International
Product Carrier segment for 2009, and a net increase in chartered-in Panamax
Product Carriers.
Vessel
expenses decreased by $12,212,000 to $80,899,000 in 2009 from $93,111,000 in the
prior year reflecting a 1,776 day decrease in owned and bareboat chartered-in
days. This decrease results from the changes in the operating fleet discussed
above. Charter hire expenses increased by $26,165,000 to $105,813,000
in 2009 from $79,648,000 in 2008 due to the increase in time chartered-in modern
Handysize Product Carriers, the sale and charter back of two newbuild Panamax
Product Carriers since the third quarter of 2008, and the inclusion of the
LR2. These increases were partially offset by the expiration of
bareboat charters on the older Handysize Product Carriers discussed above.
Depreciation and amortization decreased by $14,288,000 to $41,508,000 from
$55,796,000 in 2008 principally due to the expiration of the bareboat charters
on the older Handysize Product Carriers.
|
2009
Annual Report
|
57
|
During
2008, TCE revenues for the International Product Carrier segment increased by
$54,681,000, or 22%, to $298,132,000 from $243,451,000 in 2007. This increase in
TCE revenues resulted from an increase in the average rates earned, primarily by
the Panamax Product Carriers, as well as a 1,171 day increase in revenue days.
The increase in revenue days was attributable to (i) the delivery of four time
chartered-in Handysize Product Carriers subsequent to January 1, 2007, (ii) the
delivery of four bareboat chartered-in Handysize Product Carriers subsequent to
January 1, 2008, and (iii) the acquisition of two Panamax Product Carriers, the
Overseas Luzon and Overseas Visayas, during the third quarter of 2007. These
increases are partially offset by the sale of one Handysize Product Carrier in
each of the second quarter of 2007 and 2008, and the expiry of the bareboat
charters on two Handysize Product Carriers subsequent to June 30,
2008.
Vessel
expenses increased by $9,763,000 to $93,111,000 in 2008 from $83,348,000 in the
prior year reflecting a net 483 day increase in owned and bareboat chartered-in
days. This increase results from the changes in the operating fleet discussed
above. In addition, average daily vessel expenses increased by $531 per day,
principally as a result of increases in crew costs and insurance premiums.
Charter hire expenses increased by $28,501,000 to $79,648,000 in 2008 from
$51,147,000 in 2007 due to the increase in chartered-in Handysize Product
Carriers discussed above. Depreciation and amortization increased by $4,509,000
to $55,796,000 from $51,287,000 in 2007 principally due to the acquisition of
the Overseas Luzon and Overseas Visayas as well as the impact of accelerated
drydock amortization on older Handysize Product Carriers. A number of Handysize
Product Carriers that drydocked in 2007, for the first time following the
acquisition of Stelmar, are operating on bareboat charters that expire in mid
2009, thus shortening the period over which such drydock costs are amortized.
This increase was partially offset by the sale of the Overseas Aquamar and
Overseas Almar and the sale and leaseback transactions discussed
above.
In 2005,
the Company reflagged three Handysize Product Carriers (the Overseas Ambermar,
the Overseas Maremar and the Overseas Luxmar) under the U.S. Flag and entered
them in the U.S. Maritime Security Program (the “Program”). In September 2008,
the Overseas Ambermar exited the program and was reflagged under the Marshall
Islands Flag. Through 2008, each of the vessel owning companies
received approximately $2,600,000 per year. Such subsidy, which was
increased to $2,900,000 in 2009, is intended to offset the increased cost
incurred by such vessels from operating under the U.S. Flag. Since these vessels
trade primarily in the international market, they continue to be reflected in
the International Product Carrier segment.
|
Other International (dollars in thousands)
|
2009
|
2008
|
2007
|
|||||||||
|
TCE
revenues
|
$ | 7,848 | $ | 22,102 | $ | 23,676 | ||||||
|
Vessel
expenses
|
(2,643 | ) | (3,204 | ) | (875 | ) | ||||||
|
Charter
hire expenses
|
— | (7,627 | ) | (12,735 | ) | |||||||
|
Depreciation
and amortization
|
(6,628 | ) | (6,557 | ) | (6,272 | ) | ||||||
|
Income
from vessel operations
|
$ | (1,423 | ) | $ | 4,714 | $ | 3,794 | |||||
|
Average
daily TCE rate
|
$ | 21,500 | $ | 27,942 | $ | 30,610 | ||||||
|
Average
number of owned vessels
|
1.0 | 1.0 | 0.2 | |||||||||
|
Average
number of vessels chartered-in under operating leases
|
— | 1.2 | 2.0 | |||||||||
|
Number
of revenue days
|
365 | 791 | 773 | |||||||||
|
Number
of ship-operating days:
|
||||||||||||
|
Owned
vessels
|
365 | 366 | 65 | |||||||||
|
Vessels
time chartered-in under operating leases
|
— | 425 | 729 | |||||||||
As of
December 31, 2009, the Company operated one Other International Flag vessel, a
Pure Car Carrier. During the third quarter of 2008, the time charters-in of two
International Flag Dry Bulk Carriers and related purchase options for such
vessels were sold. All three vessels were employed on long-term
charters.
|
U.S. Segment (dollars in thousands)
|
2009
|
2008
|
2007
|
|||||||||
|
TCE
revenues
|
$ | 231,693 | $ | 221,820 | $ | 202,820 | ||||||
|
Vessel
expenses
|
(96,358 | ) | (100,423 | ) | (94,958 | ) | ||||||
|
Charter
hire expenses
|
(60,296 | ) | (39,318 | ) | (15,588 | ) | ||||||
|
Depreciation
and amortization
|
(51,614 | ) | (52,876 | ) | (52,900 | ) | ||||||
|
Income
from vessel operations
|
$ | 23,425 | $ | 29,203 | $ | 39,374 | ||||||
|
Average
daily TCE rate
|
$ | 35,849 | $ | 33,222 | $ | 31,836 | ||||||
|
Average
number of owned vessels
|
15.0 | 16.4 | 18.6 | |||||||||
|
Average
number of vessels chartered-in under operating leases
|
6.4 | 4.0 | 2.0 | |||||||||
|
Number
of revenue days
|
6,463 | 6,677 | 6,371 | |||||||||
|
Number
of ship-operating days:
|
||||||||||||
|
Owned
vessels
|
5,479 | 6,003 | 6,784 | |||||||||
|
Vessels
bareboat chartered-in under operating leases
|
2,350 | 1,466 | 741 | |||||||||
|
58
|
Overseas
Shipholding Group, Inc.
|
In
late-June 2008, the Company purchased two Product Carriers, the Overseas New
Orleans and Overseas Philadelphia, which had previously been operating on
bareboat charters-in that were classified as capital leases.
TCE
revenues increased by $9,873,000, or 4%, to $231,693,000 in 2009 from
$221,820,000 in 2008. The increase was the result of an increase in the average
rates earned during the period. This increase in rates reflects the
delivery of five additional bareboat chartered-in Jones Act Product Carriers
subsequent to mid April 2008, four of which immediately commenced time
charters. In addition, the Overseas Cascade, which is owned by OSG,
delivered in December and operated briefly in 2009 in the Delaware Bay
lightering trade. The related increase in revenue attributable to these new
Jones Act Product Carriers was substantially offset by an increase in lay-up
days of 945 in the current year and the removal from service of two vessels in
the fourth quarter of 2008 pending their sale, which occurred in 2009. During
2009, there were 364 fewer out-of-service days as a result of drydock and repair
days.
Vessel
expenses decreased by $4,065,000 to $96,358,000 in 2009 from $100,423,000 in
2008. This decrease was principally attributable to the lay-up of four vessels
for significant portions of 2009, and the removal from service of the Overseas
Integrity and M 300 in the fourth quarter of 2008. Charter hire
expenses increased $20,978,000 to $60,296,000 in 2009 from $39,318,000 in 2008
principally due to the delivery of four Jones Act Product Carriers referred to
above, which are bareboat chartered-in. Depreciation and amortization
decreased by $1,262,000 to $51,614,000 in 2009 from $52,876,000 in 2008
primarily due to the Overseas Integrity and M 300 being classified as held for
sale during the fourth quarter of 2008. Depreciation ceased on these
vessels when they were classified as held for sale, in accordance with
applicable accounting guidance.
TCE
revenues increased by $19,000,000, or 9%, to $221,820,000 in 2008 from
$202,820,000 in 2007. The increase reflects a 306 day increase in the number of
revenue days, primarily as a result of 361 fewer out-of-service days during the
current year. The fleet took delivery of the first five vessels in a series of
twelve Jones Act Product Carriers to be constructed by Aker Philadelphia
Shipyard. In addition, the OSG 243, an ATB that has been converted from single
hull to double hull delivered in late-April 2008. These increases were offset by
the transfer of the Pure Car Carrier, Overseas Joyce, to Marshall Islands Flag
during the fourth quarter of 2007 and the removal from service of the Integrity
and M300 in the fourth quarter of 2008 pending their sale. The Company also sold
its remaining single hull barge in the second quarter of 2008.
Vessel
expenses increased by $5,465,000 to $100,423,000 in 2008 from $94,958,000 in
2007. This increase was principally attributable to an increase of operating
days for Product Carriers that offset a decline in operating days for ATBs.
These offsetting changes resulted in higher daily vessel expenses for the U.S.
segment since Product Carriers are inherently more expensive to operate than
ATBs. Charter hire expenses increased $23,730,000 to $39,318,000 in 2008 from
$15,588,000 in 2007 principally due to the delivery of the Aker vessels
discussed above.
General
and Administrative Expenses
During
2009, general and administrative expenses decreased by $22,951,000 to
$121,112,000 from $144,063,000 in 2008 principally because of the
following:
|
·
|
a
decrease in compensation and benefits paid to shore-based staff of
$14,602,000, primarily driven by lower incentive
compensation;
|
|
·
|
reduced
travel and entertainment costs of
$2,526,000;
|
|
·
|
favorable
changes in foreign exchange rates and the impact of foreign currency
contracts that reduced currency losses by $1,657,000;
and
|
|
·
|
lower
other discretionary costs of
$4,577,000.
|
These
decreases were offset by an increase in legal and consulting costs of
approximately $1,327,000 attributable to advisory fees associated with the
resolution of commercial disputes with Aker in December 2009 and approximately
$6,309,000 of costs incurred in connection with the tender for all of the
outstanding publicly held common units of OSG America L.P. completed in December
2009.
During
2008, general and administrative expenses increased by $16,852,000 to
$144,063,000 from $127,211,000 in 2007 principally because of the
following:
|
·
|
an
increase in compensation and benefits paid to shore-based staff of
$11,082,000, including $3,155,000 related to non cash stock
compensation;
|
|
2009
Annual Report
|
59
|
|
·
|
higher
legal and consulting costs of $10,162,000;
and
|
|
·
|
unfavorable
changes in foreign exchange rates that resulted in losses of
$1,518,000.
|
|
|
These
increases were partially offset by:
|
|
·
|
a
reduction in travel and a general reduction in overhead costs aggregating
$3,155,000; and
|
|
·
|
a
decrease in legal fees incurred in connection with investigations by the
U.S. Department of Justice, of approximately
$2,358,000.
|
EQUITY IN
INCOME OF AFFILIATED COMPANIES
During
2009, equity in income of affiliated companies decreased by $11,519,000 to
$773,000 from $12,292,000 in 2008. The decrease was the result of the Company’s
share of costs incurred in 2009 by the FSO joint venture (as described below)
and lower earnings from the LNG joint venture resulting from the impact of
interest rate swaps that principally commenced subsequent to June 30,
2008.
As a
result of delays in the completion of the conversion of the TI Asia to an FSO,
the joint venture chartered-in the TI Oceania, a ULCC wholly-owned by the
Company, as a temporary replacement unit. Charter hire received by MOQ from
early August was offset by liquidated damages payable by the joint venture to
MOQ under the service contract. The FSO Asia completed conversion in November
2009 and costs incurred subsequent thereto have been reflected in profit and
loss. The FSO Asia experienced mechanical problems that delayed commencement of
its charter until January 4, 2010. The conversion of the TI Africa to an FSO
also experienced delays, which resulted in additional costs, including
liquidating damages commencing in late September 2009. Because of the delays in
completion of conversion of both FSOs, the joint venture recorded charges
aggregating $6,546,000 attributable to the ineffectiveness of interest rate
swaps that are being accounted as cash flow hedges. For more information with
respect to the conversion of the two ULCCs to FSOs see below in the discussion
of “Liquidity and Sources of Capital.”
During
2008, equity in income of affiliated companies increased by $3,416,000 to
$12,292,000 from $8,876,000 in 2007. The increase in equity income was primarily
due to the delivery of four LNG Carriers between November 2007 and February 2008
to a joint venture in which the Company has a 49.9% interest. After a ballast
voyage to the Middle East, the cost of which was expensed in accordance with
current accounting rules, each vessel commenced 25-year time charters. This
increase was partially offset due to the Company selling its remaining
13,351,500 shares of DHT in the first six months of 2007. Such sales reduced the
Company’s interest in DHT first to 29.2% in January 2007 and then to 0.0% in
June 2007, from 44.5% as of December 31, 2006.
Results
for 2008 also include OSG’s share, approximately $1,600,000, of a severance
arrangement recorded by a company that is accounted for using the equity method
as well as the Company’s share of the results of the joint venture that was
converting the first of two ULCCs to FSOs at December 31, 2008. The 2008 results
of this joint venture consisted principally of project management
costs.
Additionally,
the Company has a 37.5% interest in ATC, a company that operates U.S. Flag
tankers to transport Alaskan crude oil for BP. ATC earns additional income (in
the form of incentive hire paid by BP) based on meeting certain predetermined
performance standards. Such income is included in the U.S. segment.
The
following table summarizes the Company’s interest in its vessel owning equity
method investments, excluding ATC, and OSG’s proportionate share of the revenue
days for the respective vessels. Revenue days are adjusted for OSG’s percentage
ownership in order to state the revenue days on a basis comparable to that of a
wholly-owned vessel. The ownership percentages reflected below are the Company’s
actual ownership percentages as of December 31 of each year.
|
60
|
Overseas
Shipholding Group,
Inc.
|
|
2009
|
2008
|
2007
|
||||||||||||||||||||||
|
Revenue
Days
|
% of
Ownership
|
Revenue
Days
|
% of
Ownership
|
Revenue
Days
|
% of
Ownership
|
|||||||||||||||||||
|
VLCCs
operating on long-term charters
|
— | 0.0 | % | — | 0.0 | % | 151 | 0.0 | % | |||||||||||||||
|
Aframaxes
operating on long-term charters
|
— | 0.0 | % | — | 0.0 | % | 204 | 0.0 | % | |||||||||||||||
|
LNG
Carriers operating on long-term charters
|
729 | 49.9 | % | 681 | 49.9 | % | 31 | 49.9 | % | |||||||||||||||
|
ULCC
operating as temporary FSO
|
81 | 50.0 | % | — | 0.0 | % | — | 0.0 | % | |||||||||||||||
|
Total
|
810 | 681 | 386 | |||||||||||||||||||||
INTEREST
EXPENSE
The
components of interest expense are as follows:
|
In thousands for the year ended December 31,
|
2009
|
2008
|
2007
|
|||||||||
|
Interest
before impact of swaps and capitalized interest
|
$ | 44,661 | $ | 78,666 | $ | 97,291 | ||||||
|
Impact
of swaps
|
11,223 | 2,584 | (31 | ) | ||||||||
|
Capitalized
interest
|
(10,759 | ) | (23,801 | ) | (22,564 | ) | ||||||
|
Interest
expense
|
$ | 45,125 | $ | 57,449 | $ | 74,696 | ||||||
The
Company’s redemption of the $176,115,000 outstanding balance of its 8.25% Senior
Notes in May 2008, using funds borrowed under the long-term revolving credit
facility that were swapped into fixed rates at a weighted average of
approximately 3.3%, locked in a reduction in interest expense of approximately
$7,000,000 per annum through March 2013.
Interest
expense decreased by $12,324,000 to $45,125,000 in 2009 from $57,449,000 in 2008
as a result of the redemption of the 8.25% Senior Notes described above and a
decrease in the average rate paid on floating rate debt of about 240 basis
points to 1.5% from 3.9% in 2008. These decreases were partially offset by an
increase in the average amount of debt outstanding of $32,000,000, higher
expenses on the interest rate swaps resulting from the decline in LIBOR rates
for 2009 compared with 2008 and a reduction in interest
capitalized.
Interest
expense decreased by $17,247,000 to $57,449,000 in 2008 from $74,696,000 in 2007
as a result of the redemption of the 8.25% Senior Notes described above, a
decrease in the average rate paid on floating rate debt of about 200 basis
points to 3.9% from 5.9% in 2007 and an increase in the amount of interest
capitalized compared with 2007. These decreases were partially offset by an
increase in the average amount of debt outstanding of $58,000,000 and the
$2,150,000 write off of the unamortized balance of deferred finance charges with
respect to the 8.25% Senior Notes.
PROVISION/(CREDIT)
FOR FEDERAL INCOME TAXES
The
income tax provision for 2007 and the credits for 2009 and 2008 are based on the
pre-tax results of the Company’s U.S. subsidiaries, adjusted to include non
shipping income of the Company’s foreign subsidiaries. The tax credit for 2009
reflects the carryback of approximately $42,200,000 of 2009 tax losses against
earnings generated in 2004. On November 6, 2009, the President of the U.S.
signed the Worker, Homeownership, and Business Assistance Act of 2009. This law
included a provision allowing taxpayers to elect an increased carryback for net
operating losses incurred in either 2008 or 2009. In addition, OSG also
recognized a charge of approximately $3,700,000 attributable to the net increase
in deferred tax liabilities in 2009. This increase was net of a benefit
aggregating approximately $4,700,000 attributable to a reduction in deferred tax
liabilities recognized upon dissolution for tax purposes of the partnership, OSG
America L.P., in 2009. The tax credit for 2008 reflects the carryback of
approximately $4,000,000 of 2008 tax losses against the non shipping income of
the Company’s foreign subsidiaries generated in 2007. In addition, the vessel
write-downs recorded in 2008 gave rise to the reversal of previously established
deferred tax liabilities aggregating approximately $26,300,000.
On
October 22, 2004, the President of the U.S. signed into law the American Jobs
Creation Act of 2004. The Jobs Creation Act reinstated tax deferral for OSG’s
foreign shipping income for years beginning after December 31, 2004. Effective
January 1, 2005, the earnings from shipping operations of the Company’s foreign
subsidiaries are not subject to U.S. income taxation as long as such earnings
are not repatriated to the U.S. Because the Company intends to permanently
reinvest these earnings in foreign operations, no provision for U.S. income
taxes on such earnings of its foreign shipping subsidiaries is required after
December 31, 2004.
|
2009
Annual Report
|
61
|
In
September 2006, the Company made an election under the Jobs Creation Act,
effective for years commencing with 2005, to have qualifying U.S. Flag
operations taxed under a new tonnage tax regime rather than under the usual U.S.
corporate income tax regime. As a result of that election, OSG’s taxable income
for U.S. income tax purposes with respect to the eligible U.S. Flag vessels will
not include income from qualifying shipping activities in U.S. foreign trade
(i.e., transportation between the U.S. and foreign ports or between foreign
ports).
EBITDA
EBITDA
represents operating earnings excluding net income/(loss) attributable to the
noncontrolling interest, which is before interest expense and income taxes, plus
other income and depreciation and amortization expense. EBITDA is presented to
provide investors with meaningful additional information that management uses to
monitor ongoing operating results and evaluate trends over comparative periods.
EBITDA should not be considered a substitute for net income/(loss) attributable
to the Company or cash flow from operating activities prepared in accordance
with accounting principles generally accepted in the United States or as a
measure of profitability or liquidity. While EBITDA is frequently used as a
measure of operating results and performance, it is not necessarily comparable
to other similarly titled captions of other companies due to differences in
methods of calculation. The following table reconciles net income, as reflected
in the consolidated statements of operations, to EBITDA (in
thousands):
|
In thousands for the year ended December 31,
|
2009
|
2008
|
2007
|
|||||||||
|
Net
income attributable to Overseas Shipholding Group, Inc.
|
$ | 70,170 | $ | 317,665 | $ | 211,310 | ||||||
|
Provision/(credit)
for income taxes
|
(36,697 | ) | (34,004 | ) | 4,827 | |||||||
|
Interest
expense
|
45,125 | 57,449 | 74,696 | |||||||||
|
Depreciation
and amortization
|
172,404 | 189,163 | 185,499 | |||||||||
|
EBITDA
|
$ | 251,002 | $ | 530,273 | $ | 476,332 | ||||||
EFFECTS
OF INFLATION
The
Company does not believe that inflation has had or is likely, in the foreseeable
future, to have a significant impact on vessel operating expenses, drydocking
expenses and general and administrative expenses.
LIQUIDITY
AND SOURCES OF CAPITAL
Working
capital at December 31, 2009 was approximately $634,000,000 compared with
$483,000,000 at December 31, 2008 and $591,000,000 at December 31, 2007. Current
assets are highly liquid, consisting principally of cash, interest-bearing
deposits and receivables. In addition, the Company maintains a Capital
Construction Fund with a market value of approximately $41,000,000 at December
31, 2009. The Company expects to use the balance in the Capital Construction
Fund during 2010 to fund remaining payments towards the construction contracts
for two U.S. Flag ATBs.
Net cash
provided by operating activities approximated $218,000,000 in 2009 compared with
$376,000,000 in 2008 and $168,000,000 in 2007. Current financial resources,
together with cash anticipated to be generated from operations, are expected to
be adequate to meet requirements in the next year.
The
Company’s reliance on the spot market contributes to fluctuations in cash flows
from operating activities historically as a result of the exposure to highly
cyclical tanker rates and more recently as a result of the impact of the
downturn in the world economy on worldwide oil demand, as described in more
detail under Operations earlier in Item 7. Any decrease in the average TCE rates
earned by the Company’s vessels in periods subsequent to December 31, 2009,
compared with the actual TCE rates achieved during 2009, will have a negative
comparative impact on the amount of cash provided by operating activities. The
Company enters into forward freight agreements to hedge a portion of the results
of its VLCC fleet, recognizing that such contracts have basis risk. Most of
these contracts are exchange-based, which significantly reduces counterparty
risk. At the current rate levels, the Company believes that results for the
first quarter of 2010 of the International Crude Tankers segment will continue
to benefit from these hedge positions.
In order
to increase liquidity, the Company periodically evaluates transactions which may
result in either the sale or the sale and leaseback of certain vessels in its
fleet. The Company continues to monitor and evaluate the timing of repurchases
of stock under its share buy back program. Because of weakness in the financial
and credit markets there is greater focus on maintaining cash balances. The
Company continually reviews the amount of its regular quarterly dividend to
determine whether it is sustainable at current levels as part of its strategy to
provide growth in returns to stockholders while maintaining a strong balance
sheet. Future dividends, similar to the stock repurchase program, will be
evaluated as part of managing the balance sheet and cash.
|
62
|
Overseas
Shipholding Group,
Inc.
|
In
December 2009, the Company completed its purchase of all of the outstanding
publicly held Units of OSG America L.P., a master limited partnership (“MLP”),
for $10.25 in cash per unit. The Company financed the purchase price of
$71,792,000 through funds drawn under its $1.8 billion credit facility. The
Company had completed an initial public offering of OSG America L.P. in November
2007, issuing 7,500,000 Units priced at $19.00 per unit. The MLP traded on the
New York Stock Exchange under the ticker “OSP”. That transaction generated
approximately $129,300,000 in proceeds to OSG, which the Company used to pay
down debt in the fourth quarter of 2007.
As a
result of the acquisition of all remaining outstanding publicly held Units of
OSG America L.P. and its delisting from the New York Stock Exchange, the Company
amended such subsidiary’s $200 million five-year senior secured revolving credit
agreement, entered into in November 2007, to include another domestic subsidiary
as an additional borrower. There were no other significant changes to the terms
of the facility and the facility’s pricing was maintained unchanged. Borrowings
under this facility bear interest at a rate based on LIBOR. The facility may be
extended by 24 months subject to approval by the lenders.
In August
2009, the Company entered into a $389,000,000, 12-year secured facility with the
Export-Import Bank of China. Borrowings under the facility will be used toward
financing three VLCCs and two Aframaxes constructed in China. Borrowings under
the facility bear interest at a rate based on LIBOR. In September 2009, the
Company borrowed $299,156,000 under this facility. As of December 31, 2009, the
Company maintained $7,945,000 of cash contractually restricted to meet a
loan-to-value covenant contained in the agreement.
During
2008, the Company repurchased principal amounts of $7,540,000 of its 8.75%
Debentures due in 2013 and its 7.5% Notes due in 2024 and recognized a net gain
of approximately $331,000. In May 2008, OSG redeemed at a premium its
outstanding 8.25% Senior Notes due March 2013 with an aggregate principal amount
of $176,115,000 and recognized a loss of $7,265,000, equal to the premium paid,
in other income/(expense). The Company borrowed the full amount for the purchase
under its long-term revolving credit facility. In addition, the Company entered
into floating-to-fixed interest rate swaps at a weighted average rate of
approximately 3.3% covering the full amount borrowed enabling it to lock-in a
reduction in interest expense of approximately $7,000,000 per annum through
March 2013.
During
the second quarter of 2008, the Company repatriated approximately $545,000,000
in cash from its foreign subsidiaries principally to repay a portion of its
outstanding long-term revolving credit debt.
In August
2008, the Company amended floating rate term loans covering seven vessels. The
amendment provided additional borrowing capacity of approximately $100,000,000
(“New Loan”), adding two vessels currently under construction to the secured
facility. The New Loan bears interest at a rate based on LIBOR and amortizes
over ten years commencing upon delivery of each of the two vessels.
The
Company entered into a $1.8 billion seven-year unsecured revolving credit
agreement in 2006 with a group of banks (except that after five years the
maximum amount the Company may borrow under the credit agreement is reduced by
$150 million and after six years such amount is further reduced by an additional
$150 million). Borrowings under this facility bear interest at a rate based on
LIBOR.
The
indentures pursuant to which the Company’s senior unsecured notes were issued
require the Company to secure the senior unsecured notes equally and comparably
with any other unsecured indebtedness in the event OSG is required to secure
such debt.
In
addition to the secured facilities described above, as of December 31, 2009, OSG
had $1,800,000,000 of long-term unsecured credit availability and $200,000,000
of long-term secured credit availability, of which approximately $983,000,000
had been borrowed and an additional $1,640,000 had been used for letters of
credit. The Company’s two long-term revolving credit facilities mature as
follows: $150,000,000 (2011), $350,000,000 (2012) and $1,500,000,000 (2013). The
current financial resources available under the unsecured facilities are
significant and remain a stable source of funds for the Company especially in
the current weak financial and tight credit markets. The availability under the
unsecured credit facility plus cash on hand and cash expected to be generated
from operations should be sufficient to allow the Company to meet both its
operating and capital requirements for vessels under construction in the short
and medium term.
|
2009
Annual Report
|
63
|
In
January 2010, Standard & Poor’s downgraded its rating for OSG’s senior
unsecured debt by one notch from BB to BB- and changed its outlook from negative
to stable. In the second quarter of 2009, Moody’s reduced its rating for OSG’s
senior unsecured debt down by one notch to Ba2. Moody’s attached a stable
outlook to their rating. Standard and Poor’s rating is now one notch
below that of Moody’s. Further increases in debt, either from share repurchases,
acquisitions or additional charter-in commitments could result in additional
downgrades as could a protracted downturn in freight rates. A downgrade does not
impact any of the existing financial covenants contained in the Company’s debt
agreements nor does it increase the Company’s current cost of
funds.
The
Company was in compliance with all of the financial covenants contained in the
Company’s debt agreements as of December 31, 2009 and projects continued
compliance over the next twelve months. Certain of the Company’s debt agreements
contain loan-to-value clauses, which could require OSG to post additional
collateral or prepay a portion of the outstanding borrowings should the value of
the vessels securing borrowings under each of such agreements decrease below
their current valuations.
The
financing agreements impose operating restrictions and establish minimum
financial covenants. Failure to comply with any of the covenants in the
financing agreements could result in a default under those agreements and under
other agreements containing cross-default provisions. A default would permit
lenders to accelerate the maturity of the debt under these agreements and to
foreclose upon any collateral securing that debt. Under those circumstances, the
Company might not have sufficient funds or other resources to satisfy its
obligations.
Off-Balance
Sheet Arrangements
As of
December 31, 2009, the affiliated companies in which OSG held an equity interest
had total bank debt outstanding of $1,197,553,000 of which $872,944,000 was
nonrecourse to the Company.
In
February 2008, MOQ awarded two service contracts to a joint venture between OSG
and Euronav NV for terms of approximately eight years, ending in the second half
of 2017, to provide to MOQ two vessels, the FSO Asia and the FSO Africa,
respectively, to perform Floating, Storage and Offloading (“FSO”) services in
the Al Shaheen field off shore Qatar after each vessel has been converted to an
FSO. The Company has a 50% interest in this joint venture. The first ULCC, the
TI Asia, which was wholly owned by Euronav NV, was sold to the joint venture in
October 2008 for approximately $200,000,000. The second ULCC, the TI Africa,
which was wholly owned by OSG, was sold to the joint venture in January 2009 for
approximately $200,000,000. The joint venture financed the purchase of the
vessels through long-term secured bank financing and partner loans. The joint
venture entered into a $500,000,000 credit facility secured by the service
contracts to partially finance the acquisition of the two ULCCs and the cost of
conversion. Approximately $325,000,000 was outstanding under this facility on
December 31, 2009, with the outstanding amount of this facility being subject to
acceleration, in whole or in part, on termination of one or both of such service
contracts. In connection with the secured bank financing, the partners severally
issued 50% guaranties. The joint venture has entered into floating-to-fixed
interest rate swaps with major financial institutions that are being accounted
for as cash flow hedges. The interest rate swaps, covering notional amounts
aggregating $480,000,000, pay fixed rates of 3.9% and receive floating rates
based on LIBOR. These agreements commenced in the third quarter of 2009 and have
maturity dates ranging from July to September 2017.
After
experiencing construction delays, the FSO Asia delivered to MOQ on January 4,
2010, and commenced a commissioning period of 120 days. The conversion of the TI
Africa to an FSO also experienced construction delays and its conversion is
ongoing. On January 21, 2010, MOQ notified the joint venture partners that it
was canceling the service contract for the FSO Africa due to the delayed
delivery. The joint venture partners contest MOQ’s right to terminate the
contract.
As a
result of the cancellation of the service contract of the FSO Africa, the joint
venture partners were required to post $143,000,000 in cash collateral in
consideration of the banks agreeing to waive, for a period currently ending in
the second quarter of 2010, the acceleration of amounts outstanding under the
facility related to the FSO Africa, which aggregated to $143,000,000. If the
debt attributable to the FSO Africa is accelerated or the terms of the loan
significantly modified, the joint venture will be required to de-designate the
interest rate swap related to that tranche of the debt outstanding and will
recognize a loss in the first quarter of 2010 on the basis that the forecasted
transaction would no longer be deemed probable of occurring. Based on the
interest rate swap fair value at December 31, 2009, the Company’s share of such
loss would be $3,400,000.
|
64
|
Overseas
Shipholding Group,
Inc.
|
In
November 2004, the Company formed a joint venture with Qatar Gas Transport
Company Limited (Nakilat) whereby companies in which OSG holds a 49.9% interest
ordered four 216,000 cbm LNG Carriers. Upon delivery in 2007 and 2008, these
vessels commenced 25-year time charters to Qatar Liquefied Gas Company Limited
(II). The aggregate construction cost for such newbuildings of $918,026,000 was
financed by the joint venture through long-term bank financing that is
nonrecourse to the partners and partner contributions. The joint venture has
entered into floating-to-fixed interest rate swaps with a group of major
financial institutions that are being accounted for as cash flow hedges. The
interest rate swaps cover notional amounts aggregating approximately
$847,381,000 at December 31, 2009, pursuant to which it will pay fixed rates of
approximately 4.9% and receive a floating rate based on LIBOR. These agreements
have maturity dates ranging from July to November 2022.
Aggregate
Contractual Obligations
A summary
of the Company’s long-term contractual obligations as of December 31, 2009
follows:
|
In thousands
|
2010
|
2011
|
2012
|
2013
|
2014
|
Beyond
2015
|
Total
|
|||||||||||||||||||||
|
Debt (1)
|
$ | 85,756 | $ | 88,235 | $ | 124,508 | $ | 1,120,018 | $ | 93,088 | $ | 678,635 | $ | 2,190,240 | ||||||||||||||
|
Operating lease
obligations (chartered-in vessels) (2)
|
365,833 | 346,442 | 293,383 | 243,088 | 227,058 | 488,361 | 1,964,165 | |||||||||||||||||||||
|
Construction
contracts and vessel purchase agreements (3)
|
363,423 | 158,861 | — | — | — | — | 522,284 | |||||||||||||||||||||
|
Operating
lease obligations (office space)
|
5,014 | 4,915 | 4,425 | 4,248 | 3,433 | 18,031 | 40,066 | |||||||||||||||||||||
|
Advances to joint
ventures (4)
|
95,000 | — | — | — | — | — | 95,000 | |||||||||||||||||||||
|
Total
|
$ | 915,026 | $ | 598,453 | $ | 422,316 | $ | 1,367,354 | $ | 323,579 | $ | 1,185,027 | $ | 4,811,755 | ||||||||||||||
|
(1)
|
Amounts
shown include contractual interest obligations. The interest obligations
for floating rate debt of $1,553,472 as of December 31, 2009, have been
estimated based on the fixed rates stated in related floating-to-fixed
interest rate swaps, where applicable, or the LIBOR rate at December 31,
2009 of 0.25%. The Company is a party to floating-to-fixed interest rate
swaps covering notional amounts aggregating approximately $452,772 at
December 31, 2009 that effectively convert the Company’s interest rate
exposure from a floating rate based on LIBOR to an average fixed rate of
4.0%.
|
|
(2)
|
As
of December 31, 2009, the Company had charter-in commitments for 55
vessels on leases that are, or will be, accounted for as operating leases.
Certain of these leases provide the Company with various renewal and
purchase options.
|
|
(3)
|
Represents
remaining commitments under (i) agreements to acquire vessels and (ii)
shipyard construction contracts or estimates thereof, excluding
capitalized interest and other construction
costs.
|
|
(4)
|
The
Company expects to be required to contribute a minimum of approximately
$20,000,000 to a joint venture, representing its share of increases in the
costs of converting the two ULCCs into FSOs. Because the final cost of
conversion has not been agreed with the shipyard, the Company could be
required to make advances in excess of such amount. In
addition, in January 2010, the Company contributed approximately
$75,000,000 to the same joint venture, representing its share of cash
collateral posted in connection with related bank financing, as more fully
discussed above.
|
In
addition to the above long-term contractual obligations the Company has certain
obligations for its domestic shore-based employees as of December 31, 2009,
related to pension and other post retirement benefit plans as
follows:
|
In thousands
|
2010
|
2011
|
2012
|
2013
|
2014
|
|||||||||||||||
|
Supplemental
pension plan obligations (1)
|
$ | 63 | $ | 56 | $ | 39 | $ | 32 | $ | 26 | ||||||||||
|
Defined
benefit pension plan contributions (2)
|
2,925 | 1,625 | 1,625 | 1,625 | 1,625 | |||||||||||||||
|
Postretirement
health care plan obligations (3)
|
194 | 195 | 210 | 223 | 241 | |||||||||||||||
|
(1)
|
Obligations
are included herein only if the retirement of a covered individual is
known as of December 31, 2009.
|
|
(2)
|
Represents
estimated contributions under the Maritrans Inc. defined benefit
retirement plan.
|
|
2009
Annual Report
|
65
|
|
(3)
|
Amounts
are estimated based on the 2009 cost taking the assumed health care cost
trend rate for 2010 to 2014 into consideration. See Note P to the
consolidated financial statements set forth in Item 8. Because of the
subjective nature of the assumptions made, actual premiums paid in future
years may differ significantly from the estimated
amounts.
|
OSG has
used interest rate swaps to convert a portion of its debt from a floating rate
to a fixed rate based on management’s interest rate outlook at various times.
These agreements contain no leverage features and have various final maturity
dates from February 2010 to August 2014.
OSG
expects to finance any vessel commitments from working capital, the Capital
Construction Fund, cash anticipated to be generated from operations, existing
long-term credit facilities, and additional long-term debt, as required. The
amounts of working capital and cash generated from operations that may, in the
future, be utilized to finance vessel commitments are dependent on the rates at
which the Company can charter its vessels. Such charter rates are
volatile.
RISK
MANAGEMENT
The
Company is exposed to market risk from changes in interest rates, which could
impact its results of operations and financial condition. The Company manages
this exposure to market risk through its regular operating and financing
activities and, when deemed appropriate, through the use of derivative financial
instruments. The Company manages its ratio of fixed-to-floating rate debt with
the objective of achieving a mix that reflects management’s interest rate
outlook at various times. To manage this mix in a cost-effective manner, the
Company, from time-to-time, enters into interest rate swap agreements, in which
it agrees to exchange various combinations of fixed and variable interest rates
based on agreed upon notional amounts. The Company uses such derivative
financial instruments as risk management tools and not for speculative or
trading purposes. In addition, derivative financial instruments are entered into
with a diversified group of major financial institutions in order to manage
exposure to nonperformance on such instruments by the
counterparties.
The
Company seeks to reduce its exposure to fluctuations in foreign exchange rates
through the use of foreign currency forward contracts and through the purchase
of bulk quantities of currencies at rates that management considers favorable.
For these contracts, which qualify as cash flow hedges for accounting purposes,
hedge effectiveness is assessed based on changes in foreign exchange spot rates
with the change in fair value of the effective portions being recorded in
accumulated other comprehensive income/(loss). As of December 31, 2009, the
Company has recorded a liability of approximately $492,000 related to the fair
values of these contracts. The Company has entered into contracts which settle
monthly between January and August 2010 and cover approximately £1,000,000 and
€2,000,000 per month.
OSG’s
management regularly reviews the strategic decision with respect to the
appropriate ratio of spot charter revenues to fixed rate charter revenues taking
into account its expectations about spot and time charter forward rates.
Decisions to modify fixed rate coverage are implemented in either the physical
markets through changes in time charters or in the FFA markets, thus managing
the desired strategic position while maintaining flexibility of ship
availability to customers. OSG enters into Forward Freight Agreements and bunker
swaps with an objective of economically hedging risk. The Company enters into
FFAs and bunker swaps as economic hedges, some of which qualify as cash flow
hedges for accounting purposes, seeking to reduce its exposure to changes in the
spot market rates earned by some of its vessels in the normal course of its
shipping business. By using FFAs and bunker swaps, OSG manages the financial
risk associated with fluctuating market conditions. FFAs and bunker swaps
generally cover periods ranging from one month to one year and involve contracts
entered into at various rates with the intention of offsetting the variability
of the TCE earnings from certain of the pools in which it participates. FFAs and
bunker swaps are executed either over-the-counter, between two parties, or
through NOS ASA, a Norwegian clearing house or, LCH, London Clearing House. NOS
ASA and LCH require the posting of collateral by all participants. The use of a
clearing house reduces the Company’s exposure to counterparty credit risk. The
effective portion of the changes in fair value of these positions are recorded
in accumulated other comprehensive income/(loss). These contracts settled
between January 2009 and December 2009.
The
Company’s VLCCs are deployed and earn revenue through commercial pools that
operate on multiple routes on voyages of varying durations, which differs from
the standard routes associated with the related hedging instruments. Therefore,
the FFA and bunker hedges that qualify as cash flow hedges for accounting
purposes have basis risk. The TCE rates for the pools are computed from the
results of actual voyages performed during the period whereas the rates used for
settling FFA and bunker hedges are calculated as simple averages of the daily
rates for standard routes reported with each daily rate weighted equally. High
volatility tends to weaken the statistical relationship between pool performance
and the FFA market results.
|
66
|
Overseas
Shipholding Group,
Inc.
|
The
second half of 2008 experienced extremely high volatility both in freight rates
and bunker prices. Tankers International pool’s VLCC earnings do not fluctuate
as much as TD-3 since the pool’s cargo system with longer Arabian Gulf to
Western destination and West Africa to Eastern destination combination voyages
smoothes out the pool’s earnings. The historical difference in volatility
between TD-3 and Tankers International pool’s earnings has been analyzed and the
volume of the hedge position optimized to maximize correlation. For the fourth
quarter of 2009, the synthetic TCE rate achieved for VLCCs was approximately
$42,419 per day. In addition, the Company’s derivative positions seek to achieve
synthetic time charters for 310 days for VLCCs for the month of January 2010.
However, due to the above mentioned basis risk, price volatility and other
factors, the actual TCE rates achieved for synthetic time charters may differ,
possibly substantially, from expected rates.
The
shipping industry’s functional currency is the U.S. dollar. All of the Company’s
revenues and most of its operating costs are in U.S. dollars.
INTEREST
RATE SENSITIVITY
The
following tables provide information about the Company’s derivative financial
instruments and other financial instruments that are sensitive to changes in
interest rates. For debt obligations, the tables present principal cash flows
and related weighted average interest rates by expected maturity dates. For
interest rate swaps, the tables present notional amounts and weighted average
interest rates by contractual maturity dates. Notional amounts are used to
calculate the contractual cash flows to be exchanged under the
contracts.
Principal
(Notional) Amount (dollars in millions) by Expected Maturity and Average
Interest (Swap) Rate
|
At December 31, 2009
|
2010
|
2011
|
2012
|
2013
|
2014
|
Beyond
2014
|
Total
|
Fair Value at
Dec. 31,
2009
|
||||||||||||||||||||||||
|
Liabilities
|
||||||||||||||||||||||||||||||||
|
Long-term
debt, including current portion:
|
||||||||||||||||||||||||||||||||
|
Fixed
rate
|
$ | 6.2 | $ | 6.4 | $ | 6.6 | $ | 94.8 | $ | 33.0 | $ | 146.0 | $ | 293.1 | $ | 272.8 | ||||||||||||||||
|
Average
interest rate
|
5.5 | % | 5.5 | % | 5.5 | % | 8.1 | % | 5.6 | % | 7.5 | % | ||||||||||||||||||||
|
Variable
rate
|
$ | 27.0 | $ | 30.8 | $ | 70.1 | $ | 993.1 | $ | 40.1 | $ | 392.3 | $ | 1,553.5 | $ | 1,488.1 | ||||||||||||||||
|
Average
spread over LIBOR
|
0.9 | % | 1.1 | % | 1.1 | % | 0.7 | % | 1.4 | % | 1.5 | % | ||||||||||||||||||||
|
Interest
Rate Swaps
|
||||||||||||||||||||||||||||||||
|
Pay
fixed/receive variable*
|
$ | 50.9 | $ | 90.9 | $ | 120.9 | $ | 184.3 | $ | 5.6 | — | $ | 452.8 | $ | 15.3 | |||||||||||||||||
|
Average
pay rate
|
3.2 | % | 3.3 | % | 3.5 | % | 3.3 | % | 3.2 | % | — | |||||||||||||||||||||
|
At December 31, 2008
|
2009
|
2010
|
2011
|
2012
|
2013
|
Beyond
2013
|
Total
|
Fair Value at
Dec. 31,
2008
|
||||||||||||||||||||||||
|
Liabilities
|
||||||||||||||||||||||||||||||||
|
Long-term
debt and capital lease obligations, including current
portion:
|
||||||||||||||||||||||||||||||||
|
Fixed
rate
|
$ | 7.1 | $ | 6.2 | $ | 6.4 | $ | 6.6 | $ | 94.8 | $ | 179.0 | $ | 300.2 | $ | 217.1 | ||||||||||||||||
|
Average
interest rate
|
5.8 | % | 5.5 | % | 5.5 | % | 5.5 | % | 8.1 | % | 7.1 | % | ||||||||||||||||||||
|
Variable
rate
|
$ | 20.2 | $ | 23.5 | $ | 26.9 | $ | 71.9 | $ | 775.9 | $ | 205.0 | $ | 1,123.3 | $ | 1,034.9 | ||||||||||||||||
|
Average
spread over LIBOR
|
0.5 | % | 0.5 | % | 0.6 | % | 0.6 | % | 0.7 | % | 0.5 | % | ||||||||||||||||||||
|
Interest
Rate Swaps
|
||||||||||||||||||||||||||||||||
|
Pay
fixed/receive variable*
|
$ | 0.9 | $ | 50.9 | $ | 90.9 | $ | 120.9 | $ | 184.3 | $ | 5.6 | $ | 453.7 | $ | (22.1 | ) | |||||||||||||||
|
Average
pay rate
|
3.2 | % | 3.2 | % | 3.3 | % | 3.5 | % | 3.3 | % | 3.2 | % | ||||||||||||||||||||
* LIBOR
As of
December 31, 2009, the Company had two long-term revolving credit facilities
under which borrowings bear interest at a rate based on LIBOR, plus the
applicable margin, as stated in each agreement.
ITEM
7A. QUANTITATIVE AND QUALITATIVE DISCLOSURES ABOUT MARKET RISK
See Item
7.
|
2009
Annual Report
|
67
|
ITEM
8.
FINANCIAL
STATEMENTS AND SUPPLEMENTARY DATA
TABLE
OF CONTENTS
|
Years
ended December 31, 2009, 2008 and 2007
|
Page
|
|
Consolidated
Balance Sheets at December 31, 2009 and 2008
|
69
|
|
Consolidated
Statements of Operations for the Years Ended December 31, 2009, 2008 and
2007
|
70
|
|
Consolidated
Statements of Cash Flows for the Years Ended December 31, 2009, 2008 and
2007
|
71
|
|
Consolidated
Statements of Changes in Equity for the Years Ended December 31, 2009, 2008 and
2007
|
72
|
|
Notes
to Consolidated Financial Statements
|
73
|
|
Reports
of Independent Registered Public Accounting Firms
|
104
|
|
68
|
Overseas
Shipholding Group,
Inc.
|
OVERSEAS
SHIPHOLDING GROUP, INC. AND SUBSIDIARIES
CONSOLIDATED
BALANCE SHEETS
AT
DECEMBER 31
DOLLARS
IN THOUSANDS
|
2009
|
2008
|
|||||||
|
ASSETS
|
||||||||
|
Current
Assets:
|
||||||||
|
Cash
and cash equivalents
|
$ | 474,690 | $ | 343,609 | ||||
|
Short–term
investments
|
50,000 | — | ||||||
|
Voyage
receivables, including unbilled of $113,694 and $170,403
|
146,311 | 219,500 | ||||||
|
Federal
income taxes recoverable
|
72,415 | 30,366 | ||||||
|
Other
receivables
|
27,725 | 34,407 | ||||||
|
Inventories
|
8,110 | 6,627 | ||||||
|
Prepaid
expenses and other current assets
|
38,115 | 43,780 | ||||||
|
Total
Current Assets
|
817,366 | 678,289 | ||||||
|
Capital
Construction Fund
|
40,698 | 48,681 | ||||||
|
Restricted
Cash
|
7,945 | — | ||||||
|
Vessels
and other property, less accumulated depreciation
|
2,942,233 | 2,683,147 | ||||||
|
Vessels
under capital leases, less accumulated amortization
|
— | 1,101 | ||||||
|
Vessels
held for sale
|
— | 53,975 | ||||||
|
Deferred
drydock expenditures, net
|
58,535 | 79,837 | ||||||
|
Total
Vessels, Deferred Drydock and Other Property
|
3,000,768 | 2,818,060 | ||||||
|
Investments
in Affiliated Companies
|
189,315 | 98,620 | ||||||
|
Intangible
Assets, less accumulated amortization
|
99,088 | 106,585 | ||||||
|
Goodwill
|
9,589 | 9,589 | ||||||
|
Other
Assets
|
43,672 | 130,237 | ||||||
|
Total
Assets
|
$ | 4,208,441 | $ | 3,890,061 | ||||
|
LIABILITIES
AND EQUITY
|
||||||||
|
Current
Liabilities:
|
||||||||
|
Accounts
payable, accrued expenses and other current liabilities
|
$ | 149,891 | $ | 167,615 | ||||
|
Current
installments of long-term debt
|
33,202 | 26,231 | ||||||
|
Current
obligations under capital leases
|
— | 1,092 | ||||||
|
Total
Current Liabilities
|
183,093 | 194,938 | ||||||
|
Long-term
Debt
|
1,813,289 | 1,396,135 | ||||||
|
Deferred
Gain on Sale and Leaseback of Vessels
|
82,500 | 143,948 | ||||||
|
Deferred
Federal Income Taxes ($205,295 and $196,815) and Other
Liabilities
|
261,704 | 330,407 | ||||||
|
Total
Liabilities
|
2,340,586 | 2,065,428 | ||||||
|
Equity:
|
||||||||
|
Common
stock ($1 par value; 120,000,000 shares authorized; 40,790,759 shares
issued)
|
40,791 | 40,791 | ||||||
|
Paid-in
additional capital
|
262,117 | 224,522 | ||||||
|
Retained
earnings
|
2,465,949 | 2,442,907 | ||||||
| 2,768,857 | 2,708,220 | |||||||
|
Cost
of treasury stock (13,933,435 and 13,898,541 shares)
|
840,238 | 838,994 | ||||||
| 1,928,619 | 1,869,226 | |||||||
|
Accumulated
other comprehensive income/(loss)
|
(60,764 | ) | (146,359 | ) | ||||
|
Overseas
Shipholding Group, Inc.’s Equity
|
1,867,855 | 1,722,867 | ||||||
|
Noncontrolling
Interest
|
— | 101,766 | ||||||
|
Total
Equity
|
1,867,855 | 1,824,633 | ||||||
|
Total
Liabilities and Equity
|
$ | 4,208,441 | $ | 3,890,061 | ||||
See notes
to consolidated financial statements.
|
2009
Annual Report
|
69
|
OVERSEAS
SHIPHOLDING GROUP, INC. AND SUBSIDIARIES
CONSOLIDATED
STATEMENTS OF OPERATIONS
FOR
THE YEARS ENDED DECEMBER 31
DOLLARS
IN THOUSANDS, EXCEPT PER SHARE AMOUNTS
|
2009
|
2008
|
2007
|
||||||||||
|
Shipping
Revenues:
|
||||||||||||
|
Pool
revenues, including $101,914 in 2009, $160,972 in 2008 and $86,631in 2007
received from companies accounted for by the
equity method
|
$ | 398,321 | $ | 906,291 | $ | 500,300 | ||||||
|
Time
and bareboat charter revenues
|
325,590 | 366,629 | 361,431 | |||||||||
|
Voyage
charter revenues
|
369,707 | 431,777 | 267,574 | |||||||||
| 1,093,618 | 1,704,697 | 1,129,305 | ||||||||||
|
Operating
Expenses:
|
||||||||||||
|
Voyage
expenses
|
140,997 | 159,312 | 90,094 | |||||||||
|
Vessel
expenses
|
283,952 | 314,553 | 267,947 | |||||||||
|
Charter
hire expenses, including $41,121 in 2007 paid to a company accounted for
by the equity method
|
396,232 | 429,808 | 258,116 | |||||||||
|
Depreciation
and amortization
|
172,404 | 189,163 | 185,499 | |||||||||
|
General
and administrative
|
121,112 | 144,063 | 127,211 | |||||||||
|
Severance
and relocation costs
|
2,317 | — | — | |||||||||
|
Shipyard
contract termination costs
|
26,960 | — | — | |||||||||
|
Goodwill
impairment charge
|
— | 62,874 | — | |||||||||
|
(Gain)/loss
on disposal of vessels, net of impairments
|
(127,486 | ) | 59,738 | (7,134 | ) | |||||||
|
Total
Operating Expenses
|
1,016,488 | 1,359,511 | 921,733 | |||||||||
|
Income
from Vessel Operations
|
77,130 | 345,186 | 207,572 | |||||||||
|
Equity
in Income of Affiliated Companies
|
773 | 12,292 | 8,876 | |||||||||
|
Operating
Income
|
77,903 | 357,478 | 216,448 | |||||||||
|
Other
Income/(Expense)
|
1,672 | (28,847 | ) | 75,434 | ||||||||
| 79,575 | 328,631 | 291,882 | ||||||||||
|
Interest
Expense
|
(45,125 | ) | (57,449 | ) | (74,696 | ) | ||||||
|
Income
before Federal Income Taxes
|
34,450 | 271,182 | 217,186 | |||||||||
|
Credit/(Provision)
for Federal Income Taxes
|
36,697 | 34,004 | (4,827 | ) | ||||||||
|
Net
Income
|
71,147 | 305,186 | 212,359 | |||||||||
|
Less:
Net (Income)/Loss Attributable to the Noncontrolling
Interest
|
(977 | ) | 12,479 | (1,049 | ) | |||||||
|
Net
Income Attributable to Overseas Shipholding Group, Inc.
|
$ | 70,170 | $ | 317,665 | $ | 211,310 | ||||||
|
Weighted
Average Number of Common Shares Outstanding:
|
||||||||||||
|
Basic
|
26,863,958 | 29,648,230 | 34,135,672 | |||||||||
|
Diluted
|
26,869,427 | 29,814,221 | 34,326,741 | |||||||||
|
Per
Share Amounts:
|
||||||||||||
|
Basic
net income attributable to Overseas Shipholding Group, Inc. common
stockholders
|
$ | 2.61 | $ | 10.71 | $ | 6.19 | ||||||
|
Diluted
net income attributable to Overseas Shipholding Group, Inc. common
stockholders
|
$ | 2.61 | $ | 10.65 | $ | 6.16 | ||||||
|
Cash
dividends declared
|
$ | 1.75 | $ | 1.50 | $ | 1.13 | ||||||
See notes
to consolidated financial statements.
|
70
|
Overseas
Shipholding Group, Inc.
|
OVERSEAS
SHIPHOLDING GROUP, INC. AND SUBSIDIARIES
CONSOLIDATED
STATEMENTS OF CASH FLOWS
FOR
THE YEARS ENDED DECEMBER 31
DOLLARS
IN THOUSANDS
|
2009
|
2008
|
2007
|
||||||||||
|
Cash
Flows from Operating Activities:
|
||||||||||||
|
Net
income
|
$ | 71,147 | $ | 305,186 | $ | 212,359 | ||||||
|
Items
included in net income not affecting cash
flows:
|
||||||||||||
|
Depreciation
and amortization
|
172,404 | 189,163 | 185,499 | |||||||||
|
Goodwill
impairment charge
|
— | 62,874 | — | |||||||||
|
Loss
on write-down of vessels
|
12,500 | 137,708 | — | |||||||||
|
Amortization
of deferred gain on sale and leasebacks
|
(44,946 | ) | (47,971 | ) | (47,303 | ) | ||||||
|
Compensation
relating to restricted stock and
|
||||||||||||
|
stock
option grants
|
14,214 | 12,674 | 9,519 | |||||||||
|
Provision/(credit)
for deferred federal income taxes
|
3,698 | (26,136 | ) | (1,081 | ) | |||||||
|
Unrealized
(gains)/losses on forward freight agreements and bunker
swaps
|
(460 | ) | (2,137 | ) | 2,010 | |||||||
|
Undistributed
earnings of affiliated companies
|
18,445 | (6,445 | ) | 5,110 | ||||||||
|
Other—net
|
15,593 | 12,628 | (1,899 | ) | ||||||||
|
Items
included in net income related to investing and financing
activities:
|
||||||||||||
|
(Gain)/loss
on sale or write-down of securities and other
investments—net
|
3,287 | 1,284 | (41,173 | ) | ||||||||
|
Gain
on disposal of vessels – net
|
(139,986 | ) | (77,970 | ) | (7,134 | ) | ||||||
|
Payments
for drydocking
|
(30,125 | ) | (53,560 | ) | (69,892 | ) | ||||||
|
Changes
in operating assets and liabilities:
|
||||||||||||
|
Decrease/(increase)
in receivables
|
84,821 | (16,043 | ) | (50,039 | ) | |||||||
|
Net
change in prepaid items and accounts payable, accrued expenses and other
current liabilities
|
37,529 | (114,918 | ) | (28,352 | ) | |||||||
|
Net
cash provided by operating activities
|
218,121 | 376,337 | 167,624 | |||||||||
|
Cash
Flows from Investing Activities:
|
||||||||||||
|
Short-term
investments
|
(50,000 | ) | — | — | ||||||||
|
Purchases
of marketable securities
|
— | (15,112 | ) | — | ||||||||
|
Proceeds
from sale of marketable securities
|
159 | 7,208 | — | |||||||||
|
Expenditures
for vessels
|
(595,086 | ) | (608,271 | ) | (545,078 | ) | ||||||
|
Withdrawals
from Capital Construction Fund
|
8,265 | 105,700 | 175,950 | |||||||||
|
Proceeds
from disposal of vessels
|
300,894 | 461,872 | 224,019 | |||||||||
|
Acquisition
of Heidmar Lightering, net of cash acquired of $2,600
|
— | — | (38,471 | ) | ||||||||
|
Expenditures
for other property
|
(4,247 | ) | (10,809 | ) | (15,864 | ) | ||||||
|
Investments
in and advances to affiliated companies
|
(107,690 | ) | (37,871 | ) | (31,083 | ) | ||||||
|
Proceeds
from disposal of investments in affiliated companies
|
— | — | 194,706 | |||||||||
|
Distributions
from affiliated companies
|
93,203 | 20,148 | — | |||||||||
|
Shipyard
contract termination payments
|
(20,452 | ) | — | — | ||||||||
|
Other—net
|
2,188 | 113 | 926 | |||||||||
|
Net
cash used in investing activities
|
(372,766 | ) | (77,022 | ) | (34,895 | ) | ||||||
|
Cash
Flows from Financing Activities:
|
||||||||||||
|
Net
proceeds from sale of OSG America L.P. units
|
— | — | 129,256 | |||||||||
|
Purchase
of OSG America L.P. units
|
(71,792 | ) | (2,802 | ) | — | |||||||
|
Increase
in restricted cash
|
(7,945 | ) | — | — | ||||||||
|
Purchases
of treasury stock
|
(1,514 | ) | (258,747 | ) | (551,001 | ) | ||||||
|
Issuance
of debt, net of issuance costs
|
558,156 | 77,812 | 261,000 | |||||||||
|
Payments
on debt and obligations under capital leases
|
(135,136 | ) | (220,165 | ) | (37,238 | ) | ||||||
|
Cash
dividends paid
|
(47,128 | ) | (44,856 | ) | (38,038 | ) | ||||||
|
Issuance
of common stock upon exercise of stock options
|
580 | 970 | 566 | |||||||||
|
Distributions
from subsidiaries to noncontrolling interest owners
|
(7,880 | ) | (9,660 | ) | — | |||||||
|
Other—net
|
(1,615 | ) | (678 | ) | (1,612 | ) | ||||||
|
Net
cash provided by/(used in) financing activities
|
285,726 | (458,126 | ) | (237,067 | ) | |||||||
|
Net
increase/(decrease) in cash and cash equivalents
|
131,081 | (158,811 | ) | (104,338 | ) | |||||||
|
Cash
and cash equivalents at beginning of year
|
343,609 | 502,420 | 606,758 | |||||||||
|
Cash
and cash equivalents at end of year
|
$ | 474,690 | $ | 343,609 | $ | 502,420 | ||||||
See notes
to consolidated financial statements.
|
2009
Annual Report
|
71
|
OVERSEAS
SHIPHOLDING GROUP, INC. AND SUBSIDIARIES
CONSOLIDATED
STATEMENTS OF CHANGES IN EQUITY
DOLLARS
IN THOUSANDS
|
Overseas Shipholding Group, Inc. Stockholders
|
||||||||||||||||||||||||||||||||||||
|
Total
|
||||||||||||||||||||||||||||||||||||
|
Common
|
Paid-in
Additional
|
Retained
|
Treasury Stock
|
Accumulated Other
Comprehensive
|
Overseas Shipholding Group,
Inc.
|
Noncontrolling
|
||||||||||||||||||||||||||||||
|
Stock*
|
Capital
|
Earnings
|
Shares
|
Amount
|
Loss
|
Stockholders
|
Interest
|
Total
|
||||||||||||||||||||||||||||
|
Balance
at December 31, 2006
|
$ | 40,791 | $ | 202,712 | $ | 1,996,826 | 1,565,559 | $ | (34,522 | ) | $ | 1,504 | $ | 2,207,311 |
$
|
─
|
$ | 2,207,311 | ||||||||||||||||||
|
Net
Income
|
211,310 | 211,310 | 1,049 | 212,359 | ||||||||||||||||||||||||||||||||
|
Other
Comprehensive Income/(Loss), net of taxes:
|
||||||||||||||||||||||||||||||||||||
|
Effect
of Derivative Instruments
|
(17,947 | ) | (17,947 | ) | (17,947 | ) | ||||||||||||||||||||||||||||||
|
Effect
of Pension and Other Postretirement Benefit Plans
|
(1,530 | ) | (1,530 | ) | (1,530 | ) | ||||||||||||||||||||||||||||||
|
Comprehensive
Income
|
191,833 | 1,049 | 192,882 | |||||||||||||||||||||||||||||||||
|
Cash
Dividends Declared
|
(38,038 | ) | (38,038 | ) | (38,0383 | ) | ||||||||||||||||||||||||||||||
|
Compensation
Related to Options Granted
|
3,595 | 3,595 | 3,595 | |||||||||||||||||||||||||||||||||
|
Issuance
of Restricted Stock Awards
|
(1,662 | ) | (134,441 | ) | 1,662 | — | — | |||||||||||||||||||||||||||||
|
Amortization
of Restricted Stock Awards
|
5,924 | 5,924 | 5,926 | |||||||||||||||||||||||||||||||||
|
Options
Exercised and Employee Stock Purchase Plan
|
413 | (11,987 | ) | 153 | 566 | 566 | ||||||||||||||||||||||||||||||
|
Purchases
of Treasury Stock
|
8,278,489 | (551,001 | ) | (551,001 | ) | (551,001 | ) | |||||||||||||||||||||||||||||
|
Sale
of OSG America L.P. Units
|
131,421 | 131,421 | ||||||||||||||||||||||||||||||||||
|
Loss
on Public Offering of OSG America L.P. Units
|
(2,165 | ) | (2,165 | ) | (2,165 | ) | ||||||||||||||||||||||||||||||
|
Balance
at December 31, 2007
|
40,791 | 208,817 | 2,170,098 | 9,697,620 | (583,708 | ) | (17,973 | ) | 1,818,025 | 132,470 | 1,950,495 | |||||||||||||||||||||||||
|
Net
Income
|
317,665 | 317,665 | (12,479 | ) | 305,186 | |||||||||||||||||||||||||||||||
|
Other
Comprehensive Income/(Loss), net of taxes
|
||||||||||||||||||||||||||||||||||||
|
Net
change in Unrealized Holding Losses on Available-for-Sale
Securities *
|
(3,969 | ) | (3,969 | ) | (3,969 | ) | ||||||||||||||||||||||||||||||
|
Effect
of Derivative Instruments
|
(117,756 | ) | (117,756 | ) | (117,756 | ) | ||||||||||||||||||||||||||||||
|
Effect
of Pension and Other Postretirement Benefit Plans
|
(6,661 | ) | (6,661 | ) | (6,661 | ) | ||||||||||||||||||||||||||||||
|
Comprehensive
Income
|
189,279 | (12,479 | ) | 176,800 | ||||||||||||||||||||||||||||||||
|
Cash
Dividends Declared
|
(44,856 | ) | (44,856 | ) | (44,856 | ) | ||||||||||||||||||||||||||||||
|
Compensation
Related to Options Granted
|
5,057 | 5,057 | 5,057 | |||||||||||||||||||||||||||||||||
|
Issuance
of Restricted Stock Awards
|
(3,070 | ) | (268,135 | ) | 3,070 | — | — | |||||||||||||||||||||||||||||
|
Amortization
of Restricted Stock Awards
|
7,617 | 7,617 | 7,617 | |||||||||||||||||||||||||||||||||
|
Options
Exercised and Employee Stock Purchase Plan
|
579 | (30,711 | ) | 391 | 970 | 970 | ||||||||||||||||||||||||||||||
|
Purchases
of Treasury Stock
|
4,499,767 | (258,747 | ) | (258,747 | ) | (258,747 | ) | |||||||||||||||||||||||||||||
|
Purchase
of OSG America L.P. Units
|
(2,802 | ) | (2,802 | ) | ||||||||||||||||||||||||||||||||
|
Gain
on Purchase of OSG America L.P. Units
|
5,705 | 5,705 | (5,705 | ) |
─
|
|||||||||||||||||||||||||||||||
|
Increase
in Loss on Public Offering of OSG America L.P. Units
|
(183 | ) | (183 | ) | (57 | ) | (240 | ) | ||||||||||||||||||||||||||||
|
Distributions
from Subsidiary to Noncontrolling Interest Owners
|
(9,660 | ) | (9,660 | ) | ||||||||||||||||||||||||||||||||
|
Balance
at December 31, 2008
|
40,791 | 224,522 | 2,442,907 | 13,898,541 | (838,994 | ) | (146,359 | ) | 1,722,867 | 101,766 | 1,824,633 | |||||||||||||||||||||||||
|
Net
Income
|
70,170 | 70,170 | 977 | 71,147 | ||||||||||||||||||||||||||||||||
|
Other
Comprehensive Income/(Loss), net of taxes
|
||||||||||||||||||||||||||||||||||||
|
Net
change in Unrealized Holding Losses on Available-for-Sale
Securities *
|
3,585 | 3,585 | 3,585 | |||||||||||||||||||||||||||||||||
|
Effect
of Derivative Instruments
|
77,802 | 77,802 | 77,802 | |||||||||||||||||||||||||||||||||
|
Effect
of Pension and Other Postretirement Benefit Plans
|
4,208 | 4,208 | 4,208 | |||||||||||||||||||||||||||||||||
|
Comprehensive
Income
|
155,765 | 977 | 156,742 | |||||||||||||||||||||||||||||||||
|
Cash
Dividends Declared
|
(47,128 | ) | (47,128 | ) | (47,128 | ) | ||||||||||||||||||||||||||||||
|
Compensation
Related to Options Granted
|
5,440 | 5,440 | 5,440 | |||||||||||||||||||||||||||||||||
|
Amortization
of Restricted Stock Awards
|
8,774 | 8,774 | 8,774 | |||||||||||||||||||||||||||||||||
|
Options
Exercised and Employee Stock Purchase Plan
|
310 | (21,296 | ) | 270 | 580 | 580 | ||||||||||||||||||||||||||||||
|
Purchases
of Treasury Stock
|
56,190 | (1,514 | ) | (1,514 | ) | (1,514 | ) | |||||||||||||||||||||||||||||
|
Purchase
of OSG America L.P. Units
|
(71,792 | ) | (71,792 | ) | ||||||||||||||||||||||||||||||||
|
Gain
on Purchase of OSG America L.P. Units
|
23,071 | 23,071 | (23,071 | ) |
─
|
|||||||||||||||||||||||||||||||
|
Distributions
from Subsidiary to Noncontrolling Interest Owners
|
(7,880 | ) | (7,880 | ) | ||||||||||||||||||||||||||||||||
|
Balance
at December 31, 2009
|
$ | 40,791 | $ | 262,117 | $ | 2,465,949 | 13,933,435 | $ | (840,238 | ) | $ | (60,764 | ) | $ | 1,867,855 | $ | — | $ | 1,867,855 | |||||||||||||||||
*For 2009 and 2008,
net of realized losses included in net income of $5,151 and $1,303,
respectively.
See
notes to consolidated financial statements.
|
72
|
Overseas
Shipholding Group,
Inc.
|
Overseas
Shipholding Group, Inc. and Subsidiaries
Notes
to Consolidated Financial Statements
NOTE
A—SUMMARY OF SIGNIFICANT ACCOUNTING
POLICIES:
|
1.
|
Basis of presentation and
description of business—The consolidated financial statements
include the accounts of Overseas Shipholding Group, Inc., a Delaware
corporation, and its majority- owned subsidiaries (the “Company” or
“OSG”). For the three years ended December 31, 2009, all subsidiaries were
wholly owned, with the exception of OSG America L.P., which became a
wholly owned subsidiary of the Company in December 2009 (see Note E). All
significant intercompany balances and transactions have been eliminated in
consolidation. Investments in 50% or less owned affiliated companies, in
which the Company exercises significant influence, are accounted for by
the equity method.
|
The
Company owns and operates a fleet of oceangoing vessels engaged in the
transportation of liquid and dry bulk cargoes in the international market and
the U.S. Flag trades.
The 2008
and 2007 financial information has been recast to reflect the adoption of an
accounting pronouncement, which changed the presentation of noncontrolling
interest. Certain other amounts in the consolidated statements of cash flows for
the years ended December 31, 2008 and 2007 have been reclassified to conform to
the 2009 presentation.
The
Company evaluated events and transactions occurring after the balance sheet date
and through the day the financial statements were issued.
|
2.
|
Cash and cash
equivalents—Interest-bearing deposits that are highly liquid
investments and have a maturity of three months or less when purchased are
included in cash and cash
equivalents.
|
|
3.
|
Marketable
securities—The Company’s investments in marketable securities are
classified as available-for-sale and are carried at fair value. The
Company utilizes the first-in, first-out method to determine the cost of
marketable securities sold or the amount reclassified out of accumulated
other comprehensive income/(loss) into earnings. Net unrealized gains or
losses are reported as a component of accumulated other comprehensive
income/(loss) within equity. If a material decline in the fair value below
the Company’s cost basis is determined to be other than temporary, a
noncash impairment loss is recorded in the statement of operations in the
period in which that determination is made. As a matter of policy, the
Company evaluates all material declines in fair value for impairment
whenever the fair value of a security has been below its cost basis for
more than six consecutive months. In the period in which a decline in fair
value is determined to be other than temporary, the carrying value of that
security is written down to its fair value at the end of such period,
thereby establishing a new cost
basis.
|
|
4.
|
Inventories—Inventories,
which consists principally of fuel, are stated at cost determined on a
first-in, first-out basis.
|
|
5.
|
Vessels, deferred drydocking
expenditures and other property—Vessels are recorded at cost and
are depreciated to their estimated salvage value on the straight-line
basis over the lives of the vessels, which are generally 25 years. Each
vessel’s salvage value is equal to the product of its lightweight tonnage
and an estimated scrap rate. Accumulated depreciation was $636,799,000 and
$602,403,000 at December 31, 2009 and 2008,
respectively.
|
Other
property, including buildings and leasehold improvements, are recorded at cost
and amortized substantially on the straight-line basis over the shorter of the
terms of the leases or the estimated useful lives of the assets, which range
from three to 35 years.
Interest
costs are capitalized to vessels during the period that vessels are under
construction. Interest capitalized aggregated $10,759,000 in 2009, $23,801,000
in 2008 and $22,564,000 in 2007.
Expenditures
incurred during a drydocking are deferred and amortized on the straight-line
basis over the period until the next scheduled drydocking, generally two and a
half to five years. The Company only includes in deferred drydocking costs those
direct costs that are incurred as part of the drydocking to meet regulatory
requirements, or are expenditures that add economic life to the vessel, increase
the vessel’s earnings capacity or improve the vessel’s efficiency. Direct costs
include shipyard costs as well as the costs of placing the vessel in the
shipyard. Expenditures for normal maintenance and repairs, whether incurred as
part of the drydocking or not, are expensed as incurred.
|
2009
Annual Report
|
73
|
|
6.
|
Vessels under capital
leases—The Company chartered-in two U.S. Flag vessels and one
International Flag Handysize Product Carrier that it accounted for as
capital leases. In June 2008, the Company purchased the two U.S. Flag
vessels. Amortization of capital leases has been computed by the
straight-line method over five years ending in 2009 for the Handysize
Product Carrier and 22 years for the U.S. Flag vessels, representing the
terms of the leases. Accumulated amortization was $7,217,000 at December
31, 2008.
|
|
7.
|
Impairment of long-lived
assets—The carrying amounts of long-lived assets held and used by
the Company are reviewed for potential impairment whenever events or
changes in circumstances indicate that the carrying amount of a particular
asset may not be fully recoverable. In such instances, an impairment
charge would be recognized if the estimate of the undiscounted future cash
flows expected to result from the use of the asset and its eventual
disposition is less than the asset’s carrying amount. This assessment is
made at the individual vessel level since separately identifiable cash
flow information for each vessel is available. The amount of an impairment
charge, if any, would be determined using discounted cash
flows.
|
|
8.
|
Goodwill and intangible
assets—Goodwill and indefinite lived intangible assets acquired in
a business combination are not amortized but are reviewed for impairment
annually or more frequently if impairment indicators arise. Intangible
assets with estimable useful lives are amortized over their estimated
useful lives. The Company’s intangible assets consist primarily of
long-term customer relationships as part of the purchase of Maritrans,
Inc, and charter-in contracts acquired as part of the purchase of the
Heidmar Lightering business. The long-term customer relationships are
being amortized on a straight-line basis over 20 years and the charter-in
contracts are being amortized on a straight-line basis over approximately
four years. Accumulated amortization was $22,743,000 and $15,247,000 at
December 31, 2009 and 2008, respectively. Amortization amounted to
$7,496,000 in 2009, $7,499,000 in 2008 and $7,359,000 in 2007.
Amortization of intangible assets for the five years subsequent to
December 31, 2009 is expected to approximate $7,500,000 in 2010,
$6,200,000 in 2011 and $5,200,000 in 2012, 2013 and
2014.
|
The
Company tests the goodwill in each of its reporting units for impairment at
least annually, or more frequently if impairment indicators arise by comparing
the estimated fair value of each operating segment with its net book value. The
Company performed its annual goodwill impairment testing in the second quarter
of 2009. This evaluation did not result in an impairment charge being recognized
in 2009.
|
9.
|
Deferred finance
charges—Finance charges incurred in the arrangement of debt are
deferred and amortized to interest expense on the straight-line basis over
the life of the related debt. Deferred finance charges of $10,594,000 and
$10,952,000 are included in other assets at December 31, 2009 and 2008,
respectively. Amortization amounted to $1,984,000 in 2009, $4,625,000 in
2008 and $2,387,000 in 2007.
|
|
10.
|
Revenue and expense
recognition—Revenues from time charters and bareboat charters are
accounted for as operating leases and are thus recognized ratably over the
rental periods of such charters, as service is performed. Voyage revenues
and expenses are recognized ratably over the estimated length of each
voyage and, therefore, are allocated between reporting periods based on
the relative transit time in each period. The impact of recognizing voyage
expenses ratably over the length of each voyage is not materially
different on a quarterly and annual basis from a method of recognizing
such costs as incurred. OSG does not begin recognizing voyage revenue
until a Charter has been agreed to by both the Company and the customer,
even if the vessel has discharged its cargo and is sailing to the
anticipated load port on its next
voyage.
|
Under
voyage charters, expenses such as fuel, port charges, canal tolls, cargo
handling operations and brokerage commissions are paid by the Company whereas,
under time and bareboat charters, such voyage costs are paid by the Company’s
customers.
For the
Company’s vessels operating in pools, revenues and voyage expenses are pooled
and allocated to each pool’s participants on a time charter equivalent basis in
accordance with an agreed-upon formula.
|
11.
|
Derivatives—Accounting
standards require the Company to recognize all derivatives on the balance
sheet at fair value. Derivatives that are not effective hedges must be
adjusted to fair value through earnings. If the derivative is an effective
hedge, depending on the nature of the hedge, a change in the fair value of
the derivative is either offset against the change in fair value of the
hedged item (fair value hedge), or recognized in other comprehensive
income/(loss) and reclassified into earnings in the same period or periods
during which the hedge transaction affects earnings (cash flow hedge). The
ineffective portion (that is, the change in fair value of the derivative
that does not offset the change in fair value of the hedged item) of an
effective hedge and the full amount of the change in fair value of
derivative instruments that do not qualify for hedge accounting are
immediately recognized in earnings.
|
|
74
|
Overseas
Shipholding Group, Inc.
|
At
December 31, 2009, no ineffectiveness gains or losses have been recorded in
earnings relative to interest rate swaps entered into by the Company or its
subsidiaries that qualify as hedges. Any gain or loss realized upon the early
termination of an interest rate swap is recognized as an adjustment of interest
expense over the shorter of the remaining term of the swap or the hedged
debt.
|
12.
|
Use of estimates—The
preparation of financial statements in conformity with accounting
principles generally accepted in the United States requires management to
make estimates and assumptions that affect the amounts reported in the
financial statements and accompanying notes. Actual results could differ
from those estimates.
|
|
13.
|
Issuance of shares or units by
subsidiaries—The Company accounts for gains or losses from the
issuance of shares or units by its subsidiaries as an adjustment to
equity.
|
|
14.
|
Newly issued accounting
standards—In May 2009, the Financial Accounting Standards Board
established principles and requirements for disclosure of events that
occur after the balance sheet date but before financial statements are
issued or are available to be issued. This statement introduces the
concept of when financial statements are considered issued or are
available to be issued. The statement is effective for interim or annual
financial periods ending after June 15, 2009, and shall be applied
prospectively. The adoption of this statement did not have an impact on
the Company’s consolidated financial
statements.
|
In June
2009, the Financial Accounting Standards Board amended the consolidation
guidance for variable-interest entities (“VIEs”). The amended guidance requires
companies to qualitatively assess the determination of the primary beneficiary
of a VIE based on whether the entity (1) has the power to direct the activities
of the VIE that most significantly impact the entity’s economic performance and
(2) has the obligation to absorb losses of the entity that could potentially be
significant to the VIE or the right to receive benefits from the entity that
could potentially be significant to the VIE. It also requires additional
disclosures for any enterprise that holds a variable interest in a VIE. The new
accounting and disclosure requirements become effective for the Company on
January 1, 2010. The Company evaluated its participation in the Commercial Pools
in which it participates and concluded that certain pools are not VIEs and, for
those that met the criteria of a VIE, the Company concluded that it was not the
primary beneficiary. The Company also evaluated its participation in joint
ventures and concluded that those joint ventures are VIEs but that the Company
is not the primary beneficiary.
NOTE
B—EARNINGS PER COMMON SHARE:
The
computation of basic earnings per share is based on the weighted average number
of common shares outstanding during the period. The computation of diluted
earnings per share assumes the exercise of all dilutive stock options and
restricted stock units using the treasury stock method. The components of the
calculation of basic earnings per share and diluted earnings per share are as
follows:
|
Dollars
in thousands for the year ended December 31,
|
2009
|
2008
|
2007
|
|||||||||
|
Net
income attributable to Overseas Shipholding Group, Inc.
|
$ | 70,170 | $ | 317,665 | $ | 211,310 | ||||||
|
Common
shares outstanding, basic:
|
||||||||||||
|
Weighted
average shares outstanding, basic
|
26,863,958 | 29,648,230 | 34,135,672 | |||||||||
|
Common
shares outstanding, diluted:
|
||||||||||||
|
Weighted
average shares outstanding, basic
|
26,863,958 | 29,648,230 | 34,135,672 | |||||||||
|
Dilutive
equity awards
|
5,469 | 165,991 | 191,069 | |||||||||
|
Weighted
average shares outstanding, diluted
|
26,869,427 | 29,814,221 | 34,326,741 | |||||||||
Awards of
1,603,340, shares of common stock for 2009 were not included in the computation
of diluted earnings per share because inclusion of these awards would be
anti-dilutive. The anti-dilutive effects of equity awards that were excluded
from the calculation of diluted earnings per share for 2008 and 2007 were not
material.
|
2009
Annual Report
|
75
|
Accounting
guidance provides that unvested share-based payment awards that contain
non-forfeitable rights to dividends are participating securities and shall be
included in the computation of earnings per share pursuant to the two-class
method. The adoption of
this guidance did not have a material impact on the Company’s consolidated
financial statements.
NOTE
C—ACQUISITIONS:
Heidmar
Lightering
In April
2007, OSG acquired the Heidmar Lightering business from a subsidiary of Morgan
Stanley Capital Group Inc. for cash of approximately $41 million. The operation,
a fleet of four International Flag Aframaxes and two U.S. Flag workboats, at the
time of the acquisition, provides crude oil lightering services to refiners, oil
companies and trading companies primarily in the U.S. Gulf. The business managed
a portfolio of one-to-three year fixed rate cargo contracts. Under the
agreement, OSG acquired the lightering fleet, which was time chartered-in,
including a 50% residual interest in two specialized lightering Aframaxes. The
operating results of the Heidmar Lightering business have been included in the
Company’s financial statements commencing April 1, 2007.
NOTE
D – GOODWILL
Goodwill
activity for the years ended December 31, 2008 and 2009 is summarized as
follows:
|
In thousands for the years ended December 31, 2009 and 2008
|
Crude
Segment
|
U.S. Flag
Segment
|
Total
|
|||||||||
|
Balance
at January 1, 2008
|
||||||||||||
|
Goodwill
|
$ | 9,589 | $ | 62,874 | $ | 72,463 | ||||||
|
Accumulated
impairment losses
|
— | — | — | |||||||||
|
Impairment
losses in 2008
|
— | (62,874 | ) | (62,874 | ) | |||||||
|
Balance
at December 31, 2008 and 2009
|
||||||||||||
|
Goodwill
|
9,589 | 62,874 | 72,463 | |||||||||
|
Accumulated
impairment losses
|
— | (62,874 | ) | (62,874 | ) | |||||||
| $ | 9,589 | $ | — | $ | 9,589 | |||||||
Considering
the decline in stock price of OSG America L.P. and the general weakening of the
economic outlook and the decline in the financial and banking sectors, the
Company performed an impairment test as of September 30, 2008, an annual
impairment test as of October 1, 2008, and an impairment test as of December 31,
2008. In the fourth quarter of 2008, the economic downturn resulted in a number
of market-related events that were expected to negatively impact the Company’s
U.S. Flag operations in the near and medium-term. Lower demand for refined
petroleum products in North America resulted in a number of major refining
companies reducing capital expenditures and deferring and/or eliminating
projects that would have increased production capacity throughout the Gulf of
Mexico. The reduction in planned refining expansion projects reduced future
volumes of clean products that had been forecast to move on Jones Act tankers.
Recessionary forces were also expected to result in unfavorable changes in
trading patterns, as refiners shifted to higher margin low sulfur diesel for
export, resulting in an adverse impact on tonne-mile demand in the Jones Act
market and associated rates. As a result of this deterioration in the forward
supply/demand balance of the Jones Act market and the reduction in the Company’s
U.S. Flag newbuilding program, the Company reduced its estimates of future cash
flows to measure fair value and, accordingly, recorded an impairment charge of
$62,874,000 representing the full value of the goodwill related to the U.S. Flag
reportable segment in the fourth quarter ended December 31, 2008.
|
76
|
Overseas
Shipholding Group, Inc.
|
NOTE
E—PUBLIC OFFERING OF OSG AMERICA L.P. AND REPURCHASE OF COMMON
UNITS:
Initial
Public Offering
On
November 8, 2007, a subsidiary of the Company, OSG America L.P., a master
limited partnership (“MLP”), completed its initial public offering of 7,500,000
common units, representing a 24.5% limited partner interest, at a price of
$19.00 per unit. As a result, the Company recorded a $2,165,000 decrease to
equity, which represents the difference between the net sale proceeds from the
issuance of units in the initial public offering and the Company’s consolidated
basis in the noncontrolling interest in OSG America L.P.
The
proceeds received from the public offering and the Company’s use of those
proceeds are summarized as follows (in thousands):
|
Proceeds
received:
|
||||
|
Sale
of 7,500,000 common units at $19.00 per unit
|
$ | 142,500 | ||
|
Use
of proceeds from sale of common units:
|
||||
|
Underwriting
and structuring fees
|
$ | 9,975 | ||
|
Professional
fees and other offering expenses to third parties
|
3,269 | |||
|
Repayment
of obligations to OSG
|
129,256 | |||
|
Total
assets acquired
|
$ | 142,500 | ||
Immediately
after the public offering, OSG America LLC, a wholly owned subsidiary of OSG,
owned a 2% general partner interest and was the sole general partner of the
partnership.
Repurchase
of Common Units
On
November 5, 2009, OSG initiated a tender offer for the 6,999,565 outstanding
publicly held common units of OSG America L.P. for $10.25 in cash per unit. At
the time of the tender offer, the Company effectively owned 77.1% of OSG America
L.P. The number of common units (“Units”) validly tendered in the initial
offering period satisfied the non−waivable condition that more than 4,003,166
Units be validly tendered, such that OSG owned more than 80% of the outstanding
Units, OSG exercised its right pursuant to Section 15.01 of the amended and
restated limited partnership agreement of the partnership to purchase all of the
remaining Units that were not tendered in the Offer and acquired the remaining
outstanding Units on December 17, 2009. The Company financed the purchase price
of $71,792,000 through funds drawn under its $1.8 billion credit
facility.
NOTE
F—BUSINESS AND SEGMENT REPORTING:
The
Company is engaged primarily in the ocean transportation of crude oil and
petroleum products in both the international market and the U.S. Flag trades
through the ownership and operation of a diversified fleet of bulk cargo
vessels. The shipping industry has many distinct market segments based, in large
part, on the size and design configuration of vessels required and, in some
cases, on the flag of registry. Rates in each market segment are determined by a
variety of factors affecting the supply and demand for vessels to move cargoes
in the trades for which they are suited. Bulk vessels are not bound to specific
ports or schedules and therefore can respond to market opportunities by moving
between trades and geographical areas. The Company charters its vessels to
commercial shippers and U.S. and foreign governments and governmental agencies
primarily on voyage charters and on time charters.
The
Company has three reportable segments: International Crude Tankers,
International Product Carriers and U.S. vessels. Segment results are evaluated
based on income from vessel operations before general and administrative
expenses, severance and relocation costs, shipyard contract termination costs,
gain/(loss) on disposal of vessels and impairment charges (vessel and goodwill).
The accounting policies followed by the reportable segments are the same as
those followed in the preparation of the Company’s consolidated financial
statements.
|
2009
Annual Report
|
77
|
Information
about the Company’s reportable segments as of and for the three years ended
December 31, 2009 follows:
|
International
|
||||||||||||||||||||
|
In thousands
|
Crude
Tankers
|
Product
Carriers
|
Other
|
U.S.
|
Totals
|
|||||||||||||||
|
2009
|
||||||||||||||||||||
|
Shipping
revenues
|
$ | 552,164 | $ | 272,641 | $ | 7,848 | $ | 260,965 | $ | 1,093,618 | ||||||||||
|
Time
charter equivalent revenues
|
488,021 | 225,059 | 7,848 | 231,693 | 952,621 | |||||||||||||||
|
Depreciation
and amortization
|
72,654 | 41,508 | 6,628 | 51,614 | 172,404 | |||||||||||||||
|
Shipyard
contract termination costs
|
— | — | — | (26,960 | ) | (26,960 | ) | |||||||||||||
|
Gain
on disposal of vessels
|
143,476 | (2,854 | ) | — | (636 | ) | 139,986 | |||||||||||||
|
Loss
on write-down of vessels
|
— | — | — | 12,500 | 12,500 | |||||||||||||||
|
Income
from vessel operations
|
81,192 | (3,161 | ) | (1,423 | ) | 23,425 | 100,033 | |||||||||||||
|
Equity
in income of affiliated companies
|
(10,412 | ) | — | 6,852 | 4,333 | 773 | ||||||||||||||
|
Investments
in affiliated companies at December 31, 2009
|
122,944 | 900 | 61,102 | 4,369 | 189,315 | |||||||||||||||
|
Total
assets at December 31, 2009
|
1,756,928 | 760,065 | 70,276 | 929,570 | 3,516,839 | |||||||||||||||
|
Expenditures
for vessels
|
206,344 | 169,018 | — | 219,724 | 595,086 | |||||||||||||||
|
Payments
for drydockings
|
12,490 | 9,882 | — | 7,753 | 30,125 | |||||||||||||||
|
2008
|
||||||||||||||||||||
|
Shipping
revenues
|
1,074,417 | 341,302 | 22,850 | 266,128 | 1,704,697 | |||||||||||||||
|
Time
charter equivalent revenues
|
1,003,331 | 298,132 | 22,102 | 221,820 | 1,545,385 | |||||||||||||||
|
Depreciation
and amortization
|
73,934 | 55,796 | 6,557 | 52,876 | 189,163 | |||||||||||||||
|
Gain
on disposal of vessels
|
11,899 | 9,931 | 55,395 | 745 | 77,970 | |||||||||||||||
|
Loss
on write-down of vessels
|
— | — | — | 137,708 | 137,708 | |||||||||||||||
|
Goodwill
impairment charge
|
— | — | — | 62,874 | 62,874 | |||||||||||||||
|
Income
from vessel operations
|
508,367 | 69,577 | 4,714 | 29,203 | 611,861 | |||||||||||||||
|
Equity
in income of affiliated companies
|
(2,094 | ) | — | 9,042 | 5,344 | 12,292 | ||||||||||||||
|
Investments
in affiliated companies at December 31, 2008
|
87,989 | 900 | 4,349 | 5,382 | 98,620 | |||||||||||||||
|
Total
assets at December 31, 2008
|
1,793,045 | 753,380 | 14,414 | 776,746 | 3,337,585 | |||||||||||||||
|
Expenditures
for vessels
|
325,768 | 119,461 | (9,411 | ) | 172,453 | 608,271 | ||||||||||||||
|
Payments
for drydockings
|
15,945 | 15,951 | 117 | 21,547 | 53,560 | |||||||||||||||
|
2007
|
||||||||||||||||||||
|
Shipping
revenues
|
600,182 | 267,112 | 24,879 | 237,132 | 1,129,305 | |||||||||||||||
|
Time
charter equivalent revenues
|
569,264 | 243,451 | 23,676 | 202,820 | 1,039,211 | |||||||||||||||
|
Depreciation
and amortization
|
75,040 | 51,287 | 6,272 | 52,900 | 185,499 | |||||||||||||||
|
Gain
on disposal of vessels
|
(197 | ) | 5,625 | 3 | 1,703 | 7,134 | ||||||||||||||
|
Income
from vessel operations
|
226,812 | 57,669 | 3,794 | 39,374 | 327,649 | |||||||||||||||
|
Equity
in income of affiliated companies
|
3,634 | — | (502 | ) | 5,744 | 8,876 | ||||||||||||||
|
Investments
in affiliated companies at December 31, 2007
|
26,696 | 900 | 98,528 | 5,782 | 131,905 | |||||||||||||||
|
Total
assets at December 31, 2007
|
1,615,718 | 806,249 | 120,418 | 844,705 | 3,387,090 | |||||||||||||||
|
Expenditures
for vessels
|
158,295 | 195,456 | 11,933 | 179,394 | 545,078 | |||||||||||||||
|
Payments
for drydockings
|
20,955 | 31,818 | — | 17,119 | 69,892 | |||||||||||||||
The
Handysize Product Carriers that were reflagged under the U.S. Flag have been
included in the International Product Carrier segment since these vessels
continue to trade primarily in the international market. The joint venture with
four LNG Carriers is included in Other International along with two Capesize Dry
Bulk Carriers (prior to the sale of the underlying time charter-in contracts and
purchase options for such vessels in August 2008) and one Pure Car
Carrier.
Reconciliations
of time charter equivalent revenues of the segments to shipping revenues as
reported in the consolidated statements of operations follow:
|
In
thousands for the year ended December 31,
|
2009
|
2008
|
2007
|
|||||||||
|
Time
charter equivalent revenues
|
$ | 952,621 | $ | 1,545,385 | $ | 1,039,211 | ||||||
|
Add:
Voyage expenses
|
140,997 | 159,312 | 90,094 | |||||||||
|
Shipping
revenues
|
$ | 1,093,618 | $ | 1,704,697 | $ | 1,129,305 | ||||||
|
78
|
Overseas
Shipholding Group, Inc.
|
Consistent
with general practice in the shipping industry, the Company uses time charter
equivalent revenues, which represents shipping revenues less voyage expenses, as
a measure to compare revenue generated from a voyage charter to revenue
generated from a time charter. Time charter equivalent revenues, a non-GAAP
measure, provides additional meaningful information in conjunction with shipping
revenues, the most directly comparable GAAP measure, because it assists Company
management in making decisions regarding the deployment and use of its vessels
and in evaluating their financial performance.
Reconciliations
of income from vessel operations of the segments to income before federal income
taxes, including net income attributable to noncontrolling interest, as reported
in the consolidated statements of operations follow:
|
In
thousands for the year ended December 31,
|
2009
|
2008
|
2007
|
|||||||||
|
Total
income from vessel operations of all segments
|
$ | 100,033 | $ | 611,861 | $ | 327,649 | ||||||
|
General
and administrative expenses
|
(121,112 | ) | (144,063 | ) | (127,211 | ) | ||||||
|
Severance
and relocation costs
|
(2,317 | ) | — | — | ||||||||
|
Shipyard
contract termination costs
|
(26,960 | ) | — | — | ||||||||
|
Gain
on disposal of vessels, net of impairments
|
127,486 | (59,738 | ) | 7,134 | ||||||||
|
Goodwill
impairment charge
|
— | (62,874 | ) | — | ||||||||
|
Consolidated
income from vessel operations
|
77,130 | 345,186 | 207,572 | |||||||||
|
Equity
in income of affiliated companies
|
773 | 12,292 | 8,876 | |||||||||
|
Other
income/(expense)
|
1,672 | (28,847 | ) | 75,434 | ||||||||
|
Interest
expense
|
(45,125 | ) | (57,449 | ) | (74,696 | ) | ||||||
|
Income
before federal income taxes
|
$ | 34,450 | $ | 271,182 | $ | 217,186 | ||||||
Reconciliations
of total assets of the segments to amounts included in the consolidated balance
sheets follow:
|
In
thousands at December 31,
|
2009
|
2008
|
2007
|
|||||||||
|
Total
assets of all segments
|
$ | 3,516,839 | $ | 3,337,585 | $ | 3,387,090 | ||||||
|
Corporate
cash and securities, including Capital Construction Fund and restricted
cash
|
573,333 | 392,290 | 653,594 | |||||||||
|
Other
unallocated amounts
|
118,269 | 160,186 | 118,233 | |||||||||
|
Consolidated
total assets
|
$ | 4,208,441 | $ | 3,890,061 | $ | 4,158,917 | ||||||
Certain
additional information about the Company’s operations for the three years ended
December 31, 2009 follows:
|
In thousands
|
Consolidated
|
International Flag
|
U.S. Flag
|
|||||||||
|
2009
|
||||||||||||
|
Shipping
revenues
|
$ | 1,093,618 | $ | 832,653 | $ | 260,965 | ||||||
|
Total
vessels, deferred drydock and other property at December 31,
2009
|
3,000,768 | 2,199,873 | 800,895 | |||||||||
|
2008
|
||||||||||||
|
Shipping
revenues
|
1,704,697 | 1,438,569 | 266,128 | |||||||||
|
Total
vessels, deferred drydock and other property at December 31,
2008
|
2,818,060 | 2,181,660 | 636,400 | |||||||||
|
2007
|
||||||||||||
|
Shipping
revenues
|
1,129,305 | 892,173 | 237,132 | |||||||||
|
Total
vessels, deferred drydock and other property at December 31,
2007
|
2,797,023 | 2,029,236 | 767,787 | |||||||||
|
2009
Annual Report
|
79
|
NOTE
G—VESSELS, DEFERRED DRYDOCK AND OTHER PROPERTY:
Vessels
and other property consist of the following:
|
In thousands at December
31,
|
2009
|
2008
|
||||||
|
Vessels,
at cost
|
$ | 2,683,792 | $ | 2,564,674 | ||||
|
Construction
in progress
|
859,307 | 618,472 | ||||||
|
Other
property, at cost
|
73,591 | 70,395 | ||||||
| 3,616,690 | 3,253,541 | |||||||
|
Accumulated
depreciation and amortization
|
(674,457 | ) | (570,394 | ) | ||||
| $ | 2,942,233 | $ | 2,683,147 | |||||
As of
December 31, 2009, the Company had remaining commitments for vessels to be
wholly owned by the Company of $522,284,000 on non-cancelable contracts for the
construction or purchase of 14 vessels (three VLCCs, four Panamax Product
Carriers, four Handysize Product Carriers, one U.S. Flag Handysize Product
Carrier and two ATBs). These vessels are scheduled for delivery between 2010 and
2011.
In early
2009, OSG began negotiations with Bender Shipbuilding & Repair Co., Inc.
(“Bender”) to terminate the construction agreements covering the six ATBs and
two tug boats associated with its U.S. Flag expansion plans due to repeated
delays in vessel delivery dates from the original contract delivery dates,
Bender’s request for substantial price increases on all contracted vessels and
OSG’s concern about Bender’s ability to complete the ATBs and tug boats within
contract terms, including
Bender’s lack of performance under such agreements and its financial condition.
The Company took an impairment charge of $105,111,000 in the fourth quarter of
2008 related to four of such ATBs.
On March
13, 2009, the Company entered into a termination agreement with Bender. Under
the terms of the agreement, Bender agreed to transfer ownership of the
unfinished vessels (and all related components and equipment) to OSG in their
current state of completion in consideration for which OSG would, among other
things (1) pay and/or reimburse Bender for the costs associated with positioning
the units for transportation to the alternative shipyards and certain other
material and labor costs related to construction of the units, (2) assume
certain specified obligations related to construction of the units and (3)
render a payment of $14,000,000 to a third party for the release of priority
liens on the vessels being transferred to the Company. During the fourth quarter
of 2009, the Company reduced its estimate of the amounts payable above that will
be charged to expense by $114,000. The amounts referred to in (1), (2) and (3)
above are estimated to approximate $47,000,000 of which $26,960,000 was charged
to expense during 2009. The Company intends to complete two of the six ATBs and
the two tug boats at alternative shipyards.
During
the first quarter of 2009, the Company delivered one of its 2000-built VLCCs to
the buyer pursuant to a forward sales agreement entered in 2007. Accordingly,
OSG recognized a gain on the sale of $76,654,000 in the first quarter of 2009.
Such vessel was classified as held for sale in the consolidated balance sheet as
of December 31, 2008. A ULCC, the TI Africa, which was wholly-owned by OSG, was
sold in January 2009 to a joint venture in which the Company has a 50% interest
for conversion to an FSO for approximately $200,000,000. The Company recorded a
gain of $106,686,000, of which $53,343,000 was recognized in the first quarter
of 2009 with the balance deferred to be amortized over the remaining life of the
vessel. The gain recognized on the transaction was equal to 50% of the excess of
the sales price over the carrying amount of the vessel. In addition, OSG sold
and chartered back one International Flag Panamax Product Carrier.
During
the second quarter of 2009, the Company also sold three vessels and a barge: two
International Flag Panamaxes for which the charterer had previously exercised
purchase options and one U.S. Flag Tanker and one U.S. Flag barge, both of which
had been classified as held for sale.
During
the second quarter of 2009, the Company changed its plans to sell a U.S. Flag
tug boat previously classified as held for sale, as described below. The tug
boat was used as a replacement for certain other tug boats scheduled to drydock.
The impact of this change in classification on the statements of operations for
the year ended December 31, 2009 was not material.
During
the third quarter of 2009, the Company recorded impairment charges aggregating
$12,500,000 to write down the carrying amount of two U.S. Flag vessels, an older
double-hulled tanker with an inefficient gas turbine engine and one of its four
single-hulled vessels, which have limited remaining useful lives, to their
estimated fair values as of September 30, 2009.
|
80
|
Overseas
Shipholding Group, Inc.
|
During
2008, OSG sold five vessels, one International Flag Aframax, one International
Flag Handysize Product Carrier, its remaining single hull U.S. Flag barge and
the underlying time charter-in contracts and purchase options for its two
remaining International Flag Dry Bulk Carriers. In addition, the Company sold
and chartered back two International Flag Aframaxes and one International Flag
Panamax Product Carrier.
During
the third quarter of 2008, the Company decided not to have two older U.S. Flag
vessels (one Product Carrier and one ATB) undergo scheduled drydockings, which
were required to continue operating such vessels. These vessels therefore ceased
operating during the fourth quarter of 2008 and were placed in lay-up pending
the planned sale of such vessels. Accordingly, the Company recorded charges of
$32,597,000, including $8,754,000 in the fourth quarter of 2008, to write down
the carrying amount of these vessels to their estimated fair value as of
December 31, 2008. These vessels were classified as held for sale at December
31, 2008.
During
2007, the Company sold two U.S. Flag Handysize Product Carriers, which had been
redeployed to transport grain, its one remaining U.S. Flag Dry Bulk Carrier and
one International Flag Handysize Product Carrier. In addition, the Company sold
and chartered back two other International Flag Handysize Product
Carriers.
Drydocking
activity for the three years ended December 31, 2009 is summarized as
follows:
|
In thousands for the year ended December
31,
|
2009
|
2008
|
2007
|
|||||||||
|
Balance
at January 1
|
$ | 79,837 | $ | 81,619 | $ | 50,774 | ||||||
|
Payments
for drydocking
|
30,125 | 53,560 | 69,892 | |||||||||
|
Sub-total
|
109,962 | 135,179 | 120,666 | |||||||||
|
Drydock
amortization
|
(43,669 | ) | (53,026 | ) | (34,652 | ) | ||||||
|
Amounts
recognized upon sale of vessels and non-cash adjustments
|
(7,758 | ) | (2,316 | ) | (4,395 | ) | ||||||
|
Balance
at December 31
|
$ | 58,535 | $ | 79,837 | $ | 81,619 | ||||||
NOTE
H—EQUITY METHOD INVESTMENTS:
Investments
in affiliated companies include joint ventures accounted for using the equity
method. As of December 31, 2009, the Company had a 50% interest in two joint
ventures. One joint venture operates four LNG Carriers. The other joint venture
is converting two ULCCs to FSOs, one of which commenced service on January 4,
2010. In addition, the Company has a 37.5% interest in Alaska Tanker
Company, LLC that manages vessels carrying Alaskan crude for BP.
Floating
Storage and Offloading Service Vessels (“FSO”)
In
February 2008, Maersk Oil Qatar AS (“MOQ”) awarded two service contracts to a
joint venture between OSG and Euronav NV for terms of approximately eight years
ending in 2017. The service contracts provide for two ULCCs to be converted to
FSOs. The first ULCC, the TI Asia, which was wholly owned by Euronav NV, was
sold to the joint venture in October 2008 for approximately $200,000,000. The
second ULCC, the TI Africa, which was wholly owned by OSG, was sold to the joint
venture in January 2009. Conversion of both vessels to FSOs has been delayed. .
The FSO Asia completed conversion in November 2009 and costs incurred subsequent
thereto have been reflected in profit and loss. The FSO Asia experienced
mechanical problems that delayed commencement of its charter until January 4,
2010. The service contract for the FSO Africa (formerly named the TI Africa)
required that its conversion to an FSO be completed and it begins providing FSO
services to MOQ by January 19, 2010 (the “Africa Cancellation Date”). On January
21, 2010, MOQ issued a notice of cancellation to the joint venture partners
concerning the FSO Africa service contract due to the delayed delivery. The
joint venture partners contest MOQ’s right to terminate the contract. The
conversion of the FSO Africa is continuing. Commercial discussions between the
joint venture partners and MOQ are ongoing, but no assurance can be given
concerning the outcome of these discussions. The Company reviewed the FSO Africa
for impairment based upon the information that was known to it as of December
31, 2009. This evaluation did not result in an impairment charge being
recognized as of December 31, 2009
The
service contracts provide for the payment of liquidated damages by the joint
ventures to MOQ for delays in delivery of the FSOs. Such liquidated damagers
were expensed by the joint venture as incurred.
|
2009
Annual Report
|
81
|
The joint
venture financed the purchase of the vessels through long-term secured bank
financing and partner loans. The joint venture has entered into a $500,000,000
secured credit facility to partially finance the acquisition of the two ULCCs
and the cost of the conversion. In connection with the secured bank financing,
the partners severally issued guaranties. As of December 31, 2009, the carrying
value of the Company’s guaranty, which is included in other liabilities in the
accompanying balance sheet, was $583,000. As a result of the cancellation of the
service contract of the FSO Africa, the joint venture partners were required to
post $143,000,000 in cash collateral in consideration of the banks agreeing to
waive, for a period currently ending in the second quarter of 2010, the
acceleration of amounts outstanding under the facility related to the FSO
Africa, which aggregated $143,000,000. The joint venture has entered into
floating-to-fixed interest rate swaps with major financial institutions that are
being accounted for as cash flow hedges. The interest rate swaps, covering
notional amounts aggregating $480,000,000, pay fixed rates of 3.9% and receive
floating rates based on LIBOR. These agreements commenced in the third quarter
of 2009 and have maturity dates ranging from July to September 2017. Because of
delays in the completion of conversion and commencement of the service contracts
for the FSO Asia and FSO Africa, the joint venture recognized a charge of
approximately $6,546,000 related to the ineffective portion of the hedges. As of
December 31, 2009, the joint venture has recorded a liability of $14,340,000 for
the effective portion of the fair value of these swaps. The Company’s share of
such amount is included in accumulated other comprehensive loss in the
accompanying balance sheet. If the debt attributable to the FSO Africa is
accelerated or the terms of the loan are significantly modified, the joint
venture will be required to de-designate the interest rate swap related to that
tranche of the debt outstanding and will recognize a loss in the first quarter
of 2010 on the basis that the forecasted transaction would no longer be deemed
probable of occurring. Based on the interest rate swap fair value at December
31, 2009, the Company’s portion of such loss would be $3,400,000.
As a
result of delays in the completion of the conversion of the TI Asia to an FSO,
the joint venture chartered-in the TI Oceania, a ULCC wholly-owned by the
Company, as a temporary replacement unit. The Company recognized its share of
the earnings related to this transaction with the joint venture. Charter hire
payable by the joint venture aggregated $9,780,000 in 2009. Fifty percent of
such amount, or $4,890,000, has been eliminated from equity in income of
affiliated companies and shipping revenues in the accompanying statement of
operations.
VLCC
Joint Ventures
In
January 2007, the company acquired a 49.99% interest in a company, which was
constructing two VLCCs, for approximately $24,100,000. In May 2008, the Company
and its joint venture partner entered into an agreement terminating the joint
venture arrangement. Under the agreement, the joint venture distributed 100% of
the stock of one of the two joint venture subsidiaries, which was constructing a
VLCC to be delivered in 2010, to the Company. The stock of the other joint
venture subsidiary was distributed to the Company’s joint venture
partner.
DHT
Maritime, Inc.
In
October 2005, OSG sold seven tankers (three VLCCs and four Aframaxes) to DHT
Maritime, Inc., formerly Double Hull Tankers, Inc. (“DHT”) in connection with
DHT’s initial public offering. In consideration, the Company received
$412,580,000 in cash and 14,000,000 shares in DHT, representing a 46.7% equity
stake in the new tanker concern. In November 2005, the Company sold 648,500
shares of DHT, pursuant to the exercise of the over-allotment option granted to
the underwriters of DHT’s initial public offering, and received net cash
proceeds of $7,315,000. During 2007, the Company sold the remaining 13,351,500
shares of DHT and received net cash proceeds of $194,706,000. Such sales reduced
the Company’s interest in DHT to 0.0% as of June 30, 2007 from 44.5% as of
December 31, 2006. OSG has time chartered the vessels back from DHT for initial
periods of five to six and one-half years with various renewal options of up to
an additional five to eight years, depending on the vessel. The charters provide
for profit sharing with DHT when the aggregate TCE revenues earned by the
vessels exceed the aggregate basic charter hire defined in the agreement. Under
related agreements, a subsidiary of the Company technically manages these
vessels for DHT. In late 2008, the basic charter-hire agreements were extended
for periods of twelve or eighteen months depending on the vessel. Concurrently,
the technical management agreements were renegotiated on market terms effective
January 17, 2009.
LNG
Joint Venture
In November 2004, the Company formed a
joint venture with Qatar Gas Transport Company Limited (Nakilat) whereby
companies in which OSG holds a 49.9% interest ordered four 216,200 cbm LNG
Carriers. Upon delivery in late 2007 and early 2008, these vessels commenced
25-year time charters to Qatar Liquefied Gas Company Limited (II). The aggregate
construction cost for such newbuildings of $918,026,000 was financed by the
joint venture through long-term bank financing that is nonrecourse to the
partners and partner contributions. The joint venture has entered into
floating-to-fixed interest rate swaps with a group of major financial
institutions that are being accounted for as cash flow hedges. The interest rate
swaps cover notional amounts aggregating $847,381,000 at December 31, 2009,
pursuant to which it will pay fixed rates of approximately 4.9% and receive a
floating rate based on LIBOR. These agreements have maturity dates ranging from
July to November 2022. As of December 31, 2009, the joint venture has recorded a
liability of $67,620,000 for the effective portion of the fair value of these
swaps. The Company’s share of such amount is included in accumulated other
comprehensive loss in the accompanying balance sheet.
|
82
|
Overseas
Shipholding Group, Inc.
|
Alaska
Tanker Company
In the
first quarter of 1999, OSG, BP, and Keystone Shipping Company formed Alaska
Tanker Company, LLC (“ATC”) to manage the vessels carrying Alaskan crude oil for
BP. ATC provides marine transportation services in the environmentally sensitive
Alaskan crude oil trade. Each member in ATC is entitled to receive its
respective share of any incentive charter hire payable by BP to
ATC.
A
condensed summary of the combined assets and liabilities of the equity method
investments follows:
|
In thousands at December
31,
|
2009
|
2008
|
||||||
|
Current
assets
|
$ | 124,783 | $ | 133,190 | ||||
|
Vessels,
net
|
1,686,142 | 1,240,863 | ||||||
|
Other
assets
|
18,270 | 19,648 | ||||||
|
Total
assets
|
$ | 1,829,195 | $ | 1,393,701 | ||||
|
Current
liabilities
|
$ | 199,661 | $ | 75,369 | ||||
|
Long-term
debt and other non-current liabilities
|
1,588,261 | 1,381,523 | ||||||
|
Equity/(deficiency)
|
41,273 | (63,191 | ) | |||||
|
Total
liabilities and equity/(deficiency)
|
$ | 1,829,195 | $ | 1,393,701 | ||||
As of
December 31, 2009, the affiliated companies in which OSG held an equity interest
had total bank debt outstanding of $1,197,553,000 of which $872,944,000 was
nonrecourse to the Company. The Company’s percentage interest in the equity
method investments with bank debt approximates 50%.
A
condensed summary of the results of operations of the equity method investments
follows:
|
In thousands for the year ended December
31,
|
2009
|
2008
|
2007
|
|||||||||
|
Shipping
revenues
|
$ | 235,509 | $ | 241,774 | $ | 189,311 | ||||||
|
Ship
operating expenses
|
(180,391 | ) | (171,892 | ) | (152,114 | ) | ||||||
|
Income
from vessel operations
|
55,118 | 69,882 | 37,197 | |||||||||
|
Other
income/(expense)
|
(634 | ) | 2,010 | 1,846 | ||||||||
|
Interest
expense*
|
(58,964 | ) | (40,817 | ) | (10,098 | ) | ||||||
|
Net
income/(loss)
|
$ | (4,480 | ) | $ | 31,075 | $ | 28,945 | |||||
|
*
|
Interest
is net of amounts capitalized in connection with vessel construction of
$5,707 (2009), $2,738 (2008) and $34,495
(2007).
|
NOTE
I— FAIR VALUE OF FINANCIAL INSTRUMENTS, DERIVATIVES AND FAIR VALUE
DISCLOSURES:
The
following methods and assumptions were used to estimate the fair value of each
class of financial instrument.
Cash and cash equivalents—The
carrying amounts reported in the consolidated balance sheet for interest-bearing
deposits approximate their fair value.
Short-term investments—The
carrying amounts reported in the consolidated balance sheet for short-term
investments, which consist of interest-bearing time deposits approximate their
fair value.
Restricted cash—The carrying
amounts reported in the consolidated balance sheet for restricted cash, which
consists of interest-bearing deposits approximate their fair value.
Debt, including capital lease
obligations—The fair values of the Company’s debt are estimated using
discounted cash flow analyses, based on the rates currently available for debt
with similar terms and remaining maturities.
|
2009
Annual Report
|
83
|
Forward freight agreements and
bunker swaps—The fair values of forward freight agreements and bunker
swaps are the estimated amounts that the Company would receive or pay to
terminate the agreements at the reporting date, which include an adjustment for
the counterparty or the Company’s credit risk, as appropriate.
Interest rate swaps—The fair
values of interest rate swaps is the estimated amount that the Company would
receive or pay to terminate the swaps at the reporting date, which include an
adjustment for the counterparty or the Company’s credit risk, as
appropriate.
Foreign Currency
Contracts—The fair values of foreign currency contracts is the estimated
amount that the Company would receive or pay to terminate the contract at the
reporting date, which include an adjustment for the counterparty or the
Company’s credit risk, as appropriate.
The
estimated fair values of the Company’s financial instruments at December 31,
2009 and 2008, other than derivatives, follow:
|
In thousands
|
Carrying
Amount
2009
|
Fair Value
2009
|
Carrying
Amount
2008
|
Fair value
2008
|
||||||||||||
|
Financial
assets (liabilities)
|
||||||||||||||||
|
Cash
and cash equivalents
|
$ | 474,690 | $ | 474,690 | $ | 343,609 | $ | 343,609 | ||||||||
|
Short-term
investments
|
50,000 | 50,000 | — | — | ||||||||||||
|
Restricted
cash
|
7,945 | 7,945 | — | — | ||||||||||||
|
Capital
Construction Fund
|
40,698 | 40,698 | 48,681 | 48,681 | ||||||||||||
|
Debt
|
(1,846,491 | ) | (1,760,868 | ) | (1,423,458 | ) | (1,251,987 | ) | ||||||||
Derivatives
The
Company is exposed to certain risks relating to its ongoing business operations.
The risks, managed by using derivative instruments, are volatility with respect
to short-term charter rates, interest rates and foreign currency exchange
rates.
Spot
Market Rate Volatility Risk
The
Company enters into Forward Freight Agreements (“FFAs”) and bunker swaps with an
objective to utilize them as (i) economic hedging instruments, some of which
qualify as cash flow hedges for accounting purposes, that reduce its exposure to
changes in the spot market rates earned by some of its vessels or protect the
Company against future increases in bunker prices in the normal course of its
shipping business; and prior to June 30, 2008, (ii) for trading purposes to take
advantage of short term fluctuations in the market. The FFAs and bunker swaps
involve contracts to provide a fixed number of theoretical voyages at fixed
rates, which generally range from one month to one year and settle monthly based
on a published index. At December 31, 2009, the Company did not have any FFAs or
bunker swaps that qualified for hedge accounting, which settled after such
date.
Interest
Rate Risk
The
Company uses interest rate swaps for the management of interest rate risk
exposure. The interest rate swaps effectively convert a portion of the Company’s
debt from a floating to a fixed rate and are designated and qualify as cash flow
hedges. The Company is a party to floating-to-fixed interest rate swaps with
various major financial institutions covering notional amounts aggregating
approximately $452,772,000 at December 31, 2009 pursuant to which it pays fixed
rates ranging from 2.9% to 4.7% and receives floating rates based on the London
interbank offered rate (“LIBOR”) (approximately 0.25% at December 31, 2009).
These agreements contain no leverage features and have various final maturity
dates ranging from February 2010 to August 2014.
|
84
|
Overseas
Shipholding Group, Inc.
|
Foreign
Exchange Risk
The
Company seeks to reduce its exposure to fluctuations in foreign exchange rates
related to recurring monthly foreign currency denominated general and
administrative expenses through the use of foreign currency forward contracts
and through the purchase of bulk quantities of currencies at rates which
management considers favorable. At December 31, 2009, the notional amounts of
the foreign currency forward contracts aggregated approximately £8,000,000 and
€15,000,000 settling monthly through August 2010 and such contracts qualify as
cash flow hedges.
Tabular
disclosure of derivatives location
At March
31, 2009, the Company changed its presentation of the derivative instruments on
the balance sheet to correspond with additional disclosure requirements that
became effective in 2009.
Derivatives
are recorded in the balance sheet on a net basis by counterparty when a legal
right of setoff exists. The following tables present information with respect to
the fair values of derivatives reflected in the balance sheet on a gross basis
by transaction. The tables also present information with respect to gains and
losses on derivative positions reflected in the statement of operations or in
the balance sheet, as a component of accumulated other comprehensive
loss.
|
2009
Annual Report
|
85
|
Fair
Values of Derivative Instruments:
|
Asset Derivatives
|
Liability Derivatives
|
|||||||||
|
In thousands at December 31,
2009
|
Balance Sheet Location
|
Amount
|
Balance Sheet Location
|
Amount
|
||||||
|
Derivatives
designated as hedging instruments:
|
||||||||||
|
FFAs
and bunker swaps:
|
||||||||||
|
Current
portion
|
Prepaid
expenses and other current assets
|
$ | — |
Accounts
payable, accrued expenses and other current liabilities
|
$ | — | ||||
|
Accounts
payable, accrued expenses and other current liabilities
|
— |
Prepaid
expenses and other current assets
|
— | |||||||
|
Interest
rate swaps:
|
||||||||||
|
Current
portion
|
Other
receivables
|
— |
Accounts
payable, accrued expenses and other current liabilities
|
(10,847 | ) | |||||
|
Long-term
portion
|
Other
assets
|
— |
Deferred
federal income taxes and other liabilities
|
(4,484 | ) | |||||
|
Foreign
currency
contracts:
|
||||||||||
|
Current
portion
|
Prepaid
expenses and other current assets
|
─
|
Accounts
payable, accrued expenses and other current liabilities
|
(492 | ) | |||||
|
Total derivatives
designated as hedging instruments
|
$ |
─
|
$ | (15,823 | ) | |||||
|
Derivatives
not designated as hedging instruments:
|
||||||||||
|
FFAs
and bunker swaps:
|
||||||||||
|
Current
portion
|
Prepaid
expenses and other current assets
|
$ | 394 |
Accounts
payable, accrued expenses and other current liabilities
|
$ | (457 | ) | |||
|
Accounts
payable, accrued expenses and other current liabilities
|
— |
Prepaid
expenses and other current assets
|
(11 | ) | ||||||
|
Long-term
portion
|
Other
assets
|
— |
Deferred
federal income taxes and other liabilities
|
— | ||||||
|
Deferred
federal income taxes and other liabilities
|
— | — | ||||||||
|
Total
derivatives not designated as hedging instruments
|
$ | 394 | $ | (468 | ) | |||||
|
Total
derivatives
|
$ | 394 | $ | (16,291 | ) | |||||
|
86
|
Overseas
Shipholding Group, Inc.
|
The
effect of cash flow hedging relationships on the balance sheet as of December
31, 2009 and the statement of operations for the year ended December 31, 2009
are as follows:
|
Balance Sheet
|
Statement of Operations
|
||||||||||||||
|
Effective Portion
|
|||||||||||||||
|
Gain/(Loss) In or Reclassified from Accumulated Other
Comprehensive Loss
|
Ineffective Portion
|
||||||||||||||
|
In thousands
|
Amount
|
Location
|
Amount
|
Location
|
Amount of
Gain/(Loss)
|
||||||||||
|
FFAs
and bunker swaps
|
$ | 1,150 |
Shipping
revenues
|
$ | 47,425 |
Shipping
revenues
|
$ | (534 | ) | ||||||
|
Interest
rate swaps
|
(53,307 | ) |
Interest
expense
|
(10,585 | ) |
Interest
expense
|
— | ||||||||
|
Foreign
currency contracts
|
(492 | ) |
General and
administrative expenses
|
788 |
General
and administrative expenses
|
19 | |||||||||
|
Total
|
$ | (52,649 | ) | $ | 37,628 | $ | (515 | ) | |||||||
The
effect of the gain/(loss) recognized on derivatives not designated as hedging
instruments on the statements of operations for the year ended December 31, 2009
is as follows:
|
In
thousands
|
Location
|
Year ended December 31,
2009
|
|||
|
FFAs
and bunker swaps
|
Other
income
|
$ | 1,672 | ||
Credit-Risk-Related
Contingent Features
Certain
of the Company’s derivative instruments contain provisions that require the
Company’s long-term, senior, unsecured debt credit rating to remain above
specified thresholds stated in each agreement. If the Company’s debt credit
rating were to fall below such thresholds, the counterparties to the derivative
instruments could request immediate settlement of the derivative instruments
that are in net liability positions. The aggregate fair value of all derivative
instruments with such credit-risk-related contingent features that are in a net
liability position on December 31, 2009, is $466,000 against which the Company
has not been required to post any collateral. If the credit-risk-related
contingent features underlying these agreements had been triggered on December
31, 2009, the Company could have been required to settle the derivative
liability in accordance with the provisions in the related agreements. The
Company estimates that such settlement amounts would approximate the fair value
of these derivatives.
Fair
Value Disclosures
The
following table presents the fair values, which are pre tax, for assets and
liabilities measured on a recurring basis (excluding investments in affiliated
companies) as of December 31, 2009 (in thousands):
|
Description
|
Fair Value
|
Level 1:
Quoted prices in active
markets for identical
assets or liabilities
|
Level 2:
Significant other
observable inputs
|
|||||||||
|
Assets/(Liabilities):
|
||||||||||||
|
Available-for-sale
marketable securities
|
$ | 652 | $ | 652 | $ | — | ||||||
|
Derivative
Assets
|
$ | 383 | $ | 383 | (1) | $ | — | |||||
|
Derivative Liabilities
|
$ | (16,280 | ) | $ | ( 457 | )(1) | $ | (15,823 | )(2) | |||
1 Forward
Freight Agreements and Bunker Swaps
2 Standard
interest rate swaps (liability of $15,331) and foreign currency contracts
(liability of $492)
|
2009
Annual Report
|
87
|
The
following table summarizes the fair values of items measured at fair value on a
nonrecurring basis for the year ended December 31, 2009 (in
thousands):
|
Description
|
Level 3:
Significant
unobservable inputs
|
Fair Value
|
Total Losses
|
|||||||||
|
Assets:
|
||||||||||||
|
U.S.
Flag impairment—Vessels held for use
|
$ | 7,672 | (3) | $ | 7,672 | $ | (12,500 | ) | ||||
|
3
|
A
pre-tax impairment charge of $12,500 was recorded related to the U.S. Flag
segment as of September 30, 2009. The fair value measurement used to
determine the impairment as of September 30, 2009 was based upon the
income approach, which utilized cash flow projections consistent with the
most recent projections of the Company, and a discount rate equivalent to
a market participant’s weighted average cost of
capital.
|
Cash
Collateral Disclosures
The
Company does not offset fair value amounts recognized for derivatives for the
right to reclaim cash collateral or the obligation to return cash collateral.
The amounts of collateral to be posted are defined in the terms of respective
master agreements executed with counterparties or exchanges and are required
when agreed upon threshold limits are exceeded. The following table summarizes
the amounts received as collateral related to derivative fair value
positions:
|
In thousands at December 31,
2009
|
||||
|
Obligation
to return cash collateral (1)
|
$ | (261 | ) | |
|
1
|
The
obligations to return cash collateral are reflected in accounts payable,
accrued expenses and other current liabilities on the balance
sheet.
|
As of
December 31, 2009, the Company had no outstanding amounts paid as collateral
related to derivative fair value positions.
NOTE
J—ACCOUNTS PAYABLE, ACCRUED EXPENSES AND OTHER CURRENT LIABILITIES:
Accounts
payable, accrued expenses and other current liabilities follows:
|
In thousands at December
31,
|
2009
|
2008
|
||||||
|
Accounts
payable
|
$ | 32,591 | $ | 5,996 | ||||
|
Payroll
and benefits
|
20,303 | 13,344 | ||||||
|
Interest
|
9,823 | 7,823 | ||||||
|
Due
to owners on chartered in vessels
|
5,147 | 27,602 | ||||||
|
Accrued
drydock and repair costs
|
14,229 | 28,422 | ||||||
|
Amounts
held in escrow
|
— | 12,855 | ||||||
|
Accrued
shipyard contract termination costs
|
5,402 | — | ||||||
|
Charter
revenues received in advance
|
28,072 | 20,484 | ||||||
|
Insurance
|
5,029 | 8,922 | ||||||
|
FFA
settlements
|
9 | 4,200 | ||||||
|
Current
portion of derivative liabilities
|
11,797 | — | ||||||
|
Other
|
17,489 | 37,967 | ||||||
| $ | 149,891 | $ | 167,615 | |||||
|
88
|
Overseas
Shipholding Group, Inc.
|
NOTE
K—DEBT:
Debt
consists of the following:
|
In thousands at December
31,
|
2009
|
2008
|
||||||
|
Unsecured
revolving credit facilities
|
$ | 953,000 | $ | 749,000 | ||||
|
Secured
revolving credit facilities
|
30,000 | 45,000 | ||||||
|
7.50%
notes due 2024
|
146,000 | 146,000 | ||||||
|
8.75%
debentures due 2013, net of unamortized discount of $50 and
$62
|
74,485 | 74,473 | ||||||
|
Floating
rate secured term loans, due through 2023
|
599,260 | 329,322 | ||||||
|
Fixed
rate secured term loans, due through 2014
|
43,746 | 78,571 | ||||||
| 1,846,491 | 1,422,366 | |||||||
|
Less
current portion
|
33,202 | 26,231 | ||||||
|
Long-term
portion
|
$ | 1,813,289 | $ | 1,396,135 | ||||
The
weighted average effective interest rate for debt outstanding at December 31,
2009 and 2008 was 3.0% and 3.4%, respectively. Such rates take into
consideration related interest rate swaps.
The
Company entered into a $1.8 billion seven-year unsecured revolving credit
agreement in 2006 with a group of banks (except that after five years the
maximum amount the Company may borrow under the credit agreement is reduced by
$150 million and after six years such amount is further reduced by an additional
$150 million). Borrowings under this facility bear interest at a rate based on
LIBOR.
In August
2009, the Company entered into a $389,000,000, 12-year secured facility with the
Export-Import Bank of China. Borrowings under the facility will be used toward
financing three VLCCs and two Aframaxes constructed in China. Borrowings under
the facility bear interest at a rate based on LIBOR. In September 2009, the
Company borrowed $299,156,000 under this facility. As of December 31, 2009, the
Company maintained $7,945,000 of cash contractually restricted to meet a
loan-to-value covenant contained in the agreement.
As a
result of the acquisition of all remaining outstanding publicly held Units of
OSG America L.P. and its delisting from the New York Stock Exchange, the Company
amended such subsidiary’s $200 million five-year senior secured revolving credit
agreement, entered into in November 2007, to include another domestic subsidiary
as an additional borrower. There were no other significant changes to the terms
of the facility and the facility’s pricing was maintained unchanged. Borrowings
under this facility bear interest at a rate based on LIBOR. The facility may be
extended by 24 months subject to approval by the lenders.
In 2008,
the Company repurchased principal amounts of $7,540,000 of its 8.75% debentures
due in 2013 and its 7.5% notes due in 2024 and recognized a net gain of
approximately $331,000. In May 2008, the Company redeemed, at a premium, its
outstanding 8.25% Senior Notes due March 2013 with a principal amount of
$176,115,000 and recognized a loss of $7,265,000, equal to the premium paid, in
other income/(expense). In addition, the Company wrote off as additional
interest expense, the balance of the unamortized deferred debt expense of
approximately $2,150,000.
In August
2008, the Company amended floating rate secured term loans covering seven
vessels. The amendment provided additional borrowing capacity of approximately
$100,000,000 (“New Loan”), adding two vessels currently under construction to
the secured facility. The New Loan bears interest at a rate based on LIBOR and
amortizes over ten years commencing upon delivery of each of the two
vessels.
At
December 31, 2009, the Company had unused long-term unsecured credit
availability of approximately $1,015,000,000, which reflects $1,640,000 of
letters of credit issued principally in connection with collateral requirements
for derivative transactions.
Agreements
related to long-term debt provide for prepayment privileges (in certain
instances with penalties), limitations on the amount of total borrowings and
secured debt, and acceleration of payment under certain circumstances, including
failure to satisfy certain financial covenants.
|
2009
Annual Report
|
89
|
As of
December 31, 2009, approximately 40.8% of the net book value of the Company’s
vessels is pledged as collateral under certain debt agreements.
The
aggregate annual principal payments required to be made on debt are as
follows:
|
In
thousands at December 31, 2009
|
||||
|
2010
|
$ | 33,202 | ||
|
2011
|
37,223 | |||
|
2012
|
76,759 | |||
|
2013
|
1,087,852 | |||
|
2014
|
73,183 | |||
|
Thereafter
|
538,272 | |||
| $ | 1,846,491 | |||
Interest
paid, excluding capitalized interest, amounted to $43,125,000 in 2009,
$66,464,000 in 2008 and $69,344,000 in 2007.
NOTE
L—TAXES:
From
January 1, 1987 through December 31, 2004, earnings of the foreign shipping
companies (exclusive of foreign joint ventures in which the Company has a less
than 50% interest) have been subject to U.S. income taxation in the year earned
and may therefore be distributed to the U.S. parent without further tax. Income
of foreign shipping companies earned from January 1, 1976 through December 31,
1986 (“Deferred Income”) was excluded from U.S. income taxation to the extent
that such income was reinvested in foreign shipping operations. Foreign shipping
income earned before 1976 is not subject to tax unless distributed to the U.S.
parent. A determination of the amount of qualified investments in foreign
shipping operations, as defined, is made at the end of each year and such amount
is compared with the corresponding amount at December 31, 1986. If, during any
determination period, there is a reduction of qualified investments in foreign
shipping operations, Deferred Income, limited to the amount of such reduction,
would become subject to tax.
On
October 22, 2004, the President of the U.S. signed into law the American Jobs
Creation Act of 2004. The Jobs Creation Act reinstated tax deferral for OSG’s
foreign shipping income for years beginning after December 31, 2004. Effective
January 1, 2005, the earnings from shipping operations of the Company’s
foreign subsidiaries are not subject to U.S. income taxation as long as such
earnings are not repatriated to the U.S. The Company intends to permanently
reinvest these earnings, as well as the undistributed income of its foreign
companies accumulated through December 31, 1986, in foreign operations.
Accordingly, no provision for U.S. income taxes on the shipping income of its
foreign subsidiaries was required in the three years ended December 31, 2009 and
no provision for U.S. income taxes on the undistributed income of the foreign
shipping companies accumulated through December 31, 1986 was required at
December 31, 2009. Further, no provision for U.S. income taxes on the Company’s
share of the undistributed earnings of the less than 50%-owned foreign shipping
joint ventures was required as of December 31, 2009, because the Company intends
to indefinitely reinvest such earnings ($85,000,000 at December 31, 2009). The
unrecognized deferred U.S. income taxes attributable thereto approximated
$30,000,000.
As of
December 31, 2009, undistributed earnings on which U.S. income taxes have not
been provided aggregated approximately $2,400,000,000, including $119,000,000
earned prior to 1976; the unrecognized deferred U.S. income tax attributable to
such undistributed earnings approximated $840,000,000.
As
discussed above, earnings of OSG’s foreign shipping subsidiaries from January 1,
1987 through December 31, 2004, were subject to U.S. income taxes and,
therefore, may be distributed to the U.S. parent without further tax. In 2008,
the Company repatriated approximately $545,000,000 of such previously taxed
earnings, representing the full balance of its undistributed previously taxed
earnings.
Pursuant
to the Merchant Marine Act of 1936, as amended, the Company is a party to an
agreement that permits annual deposits, related to taxable income of certain of
its domestic subsidiaries, into a Capital Construction Fund. Payments of federal
income taxes on such deposits and earnings thereon are deferred until, and if,
such funds are withdrawn for nonqualified purposes or termination of the
agreement; however, if withdrawn for qualified purposes (acquisition of U.S.
Flag vessels or retirement of debt on U.S. Flag vessels), such funds remain
tax-deferred and the federal income tax basis of any such vessel is reduced by
the amount of such withdrawals. Under its agreement, the Company is expected to
use the fund to acquire or construct U.S. Flag vessels. Monies can remain
tax-deferred in the fund for a maximum of 25 years (commencing January 1, 1987
for deposits prior thereto).
|
90
|
Overseas
Shipholding Group, Inc.
|
The
significant components of the Company’s deferred tax liabilities and assets
follow:
|
In thousands at December
31,
|
2009
|
2008
|
||||||
|
Deferred
tax liabilities:
|
||||||||
|
Excess
of book over tax basis of depreciable or amortizable
assets—net
|
$ | 193,632 | $ | 181,055 | ||||
|
Tax
benefits related to the Capital Construction Fund
|
14,244 | 17,038 | ||||||
|
Costs
capitalized and amortized for book, expensed for tax
|
9,020 | 9,367 | ||||||
|
Other—net
|
5,456 | 9,272 | ||||||
|
Total
deferred tax liabilities
|
222,352 | 216,732 | ||||||
|
Deferred
tax assets:
|
||||||||
|
Vessel
impairment charges
|
642 | 20,289 | ||||||
|
Net
operating loss carryforward
|
27,742 | 27,742 | ||||||
|
Employee
Compensation and Benefit Plans
|
14,898 | 8,785 | ||||||
|
Other
comprehensive income
|
6,598 | 11,132 | ||||||
|
Total
deferred tax assets
|
49,880 | 67,948 | ||||||
|
Valuation
allowance
|
32,823 | 48,031 | ||||||
|
Net
deferred tax assets
|
17,057 | 19,917 | ||||||
|
Net
deferred tax liabilities
|
205,295 | 196,815 | ||||||
|
Current
portion of net deferred tax liabilities
|
— | — | ||||||
|
Long-term
portion of net deferred tax liabilities
|
$ | 205,295 | $ | 196,815 | ||||
During
2008, the Company established a valuation allowance of $48,031,000 against the
deferred tax assets resulting from the write-down of certain U.S. Flag vessels
in the fourth quarter of 2008 and net operating loss carryforwards arising in
2008. The valuation allowance was established because the Company could not
determine that it was more likely than not that the full amount of the deferred
tax asset would be realized through the generation of taxable income in the
future. The valuation allowance was recorded as a reduction in the federal
income tax benefit in the accompanying consolidated statement of operations for
the year ended December 31, 2008. On November 6, 2009, the President of the U.S.
signed the Worker, Homeownership, and Business Assistance Act of 2009. This law
included a provision allowing taxpayers to elect an increased carryback for net
operating losses incurred in either 2008 or 2009. As a result of this change in
the law, the write-down of certain vessels taken in 2008, which losses were 2009
events for tax purposes, was included in a net operating loss carryback against
earnings generated in 2004. The valuation allowance associated with these
deferred tax assets aggregating $21,624,000 was accordingly reversed since
realization was probable. The Company also established a valuation allowance of
$6,413,000 against deferred tax assets originating in 2009 for the same reasons
stated above for 2008.
The
components of income before federal income taxes, adjusted for noncontrolling
interest, follow:
|
In thousands for the year ended December
31,
|
2009
|
2008
|
2007
|
|||||||||
|
Foreign
|
$ | 170,207 | $ | 593,025 | $ | 296,807 | ||||||
|
Domestic
|
(135,757 | ) | (309,364 | ) | (80,670 | ) | ||||||
| $ | 34,450 | $ | 283,661 | $ | 216,137 | |||||||
Substantially
all of the above foreign income resulted from the operations of companies that
were not subject to income taxes in their countries of
incorporation.
The
adjustments for noncontrolling interest relate only to domestic
income.
The
components of the (provision)/credits for federal income taxes
follow:
|
In thousands for the year ended December
31,
|
2009
|
2008
|
2007
|
|||||||||
|
Current
|
$ | 40,395 | $ | 7,868 | $ | (5,908 | ) | |||||
|
Deferred
|
(3,698 | ) | 26,136 | 1,081 | ||||||||
| $ | 36,697 | $ | 34,004 | $ | (4,827 | ) | ||||||
|
2009
Annual Report
|
91
|
Reconciliations
of the actual federal income tax rate attributable to pretax income and the U.S.
statutory income tax rate follow:
|
For the year ended December
31,
|
2009
|
2008
|
2007
|
|||||||||
|
Actual
federal income tax provision/(credit) rate
|
(106.5 | )% | (12.3 | )% | 2.1 | % | ||||||
|
Adjustments due to:
|
||||||||||||
|
Goodwill impairment charge
|
— | (6.0 | )% | — | ||||||||
|
Income not subject to U.S. income
taxes
|
97.3 | % | 68.0 | % | 32.9 | % | ||||||
|
Basis adjustment recognized on liquidation of OSG
America L.P.
|
(13.6 | )% | — | — | ||||||||
|
Other
|
13.6 | % | 2.2 | % | — | |||||||
|
Valuation allowance
|
44.2 | % | (16.9 | )% | — | |||||||
|
U.S. statutory income tax provision
rate
|
35.0 | % | 35.0 | % | 35.0 | % | ||||||
The
following is a roll-forward of the Company’s unrecognized tax benefits for 2009
and 2008:
|
In thousands
|
2009
|
2008
|
||||||
|
Balance
of unrecognized tax benefits as of January 1,
|
$ | 7,546 | $ | 5,424 | ||||
|
Increases
for positions taken in prior years
|
226 | 2,775 | ||||||
|
Increases
for positions related to the current year
|
1,234 | — | ||||||
|
Amounts
of decreases related to settlements
|
(2,094 | ) | — | |||||
|
Reductions
due to lapse of statutes of limitations
|
(1,620 | ) | (653 | ) | ||||
|
Balance
of unrecognized tax benefits as of December 31,
|
$ | 5,292 | $ | 7,546 | ||||
The
Company does not presently anticipate such uncertain tax positions will
significantly increase or decrease in the next 12 months; however actual
developments could differ from those currently expected. The Company is
generally no longer subject to federal, state and local income tax examinations
by tax authorities for years prior to 2005.
OSG
records interest on unrecognized tax benefits in its provision for income taxes.
The interest and penalties on unrecognized tax benefits are included in the
roll-forward schedule above and were approximately $1,303,000 in 2009 and
$1,811,000 in 2008.
NOTE
M—CAPITAL STOCK AND STOCK COMPENSATION:
In June
2008, the Company’s Board of Directors authorized the repurchase of up to
$250,000,000 of the Company’s common stock from time-to-time. Such purchases of
the Company’s common stock will be made at the Company’s discretion and take
into account such factors as price and prevailing market conditions. As of
December 31, 2009, the Company had repurchased 3,798,200 shares of its common
stock under the 2008 program. On April 24, 2007, the Board authorized, and the
Company agreed to purchase all of the outstanding shares held by Archer-
Daniels-Midland Company, or 5,093,391 shares, at $65.42 per share. The above
purchase, in addition to the total shares previously repurchased under the June
2006 authority, aggregated 6,451,491 shares. In addition, in April 2007, the
Company’s Board of Directors authorized a share repurchase program of
$200,000,000, which replaced a prior $300,000,000 share repurchase program
authorized in June 2006. The Company completed the 2007 share repurchase program
in the second quarter of 2008 and had repurchased 2,812,385 shares of its common
stock under such program.
The
Company granted a total of 33,840 (2009), 15,228 (2008) and 12,000 (2007)
restricted stock units during the three years ended December 31, 2009, to
certain of its non-employee directors. Each restricted stock unit represents a
contingent right to receive one share of common stock upon the non-executive
director’s termination of service as a board member. Restricted stock units
granted subsequent to 2007 vest ratably over a four-year period, which period
may be accelerated provided that the director has served until the earlier of
(a) the first anniversary of the grant date or (b) the next annual meeting of
the Company’s stockholders. Restricted stock units granted prior to 2008 vested
upon the earlier of the first anniversary of the date of grant or the next
annual meeting of the stockholders. The restricted stock units have no voting
rights and may not be transferred or otherwise disposed of while the
non-employee director is a director. The non-employee director is entitled to
dividends in the form of additional restricted stock units at the same time
dividends are paid on the Company’s common stock in an amount equal to the
result obtained by dividing (i) the product of (x) the amount of units owned by
the non-employee director on the record date for the dividend times (y) the
dividend per share by (ii) the closing price of a share of the Company’s common
stock on the payment date, which restricted units vest immediately on the
payment date for the dividend. At the date of the awards the fair market value
of the Company’s stock was $35.46 (2009), $78.80 (2008) and $79.16 (2007) per
share during the three years ended December 31, 2009.
|
92
|
Overseas
Shipholding Group, Inc.
|
The
Company awarded a total of 272,515 (2008) and 143,351 (2007) shares during the
three years ended December 31, 2009, of restricted common stock at no cost to
certain of its employees, including senior officers. Restrictions limit the sale
or transfer of these shares until they vest, which occurs over a four or
five-year period. During the restriction period, the shares will have voting
rights and cash dividends will be paid if declared. The weighted average fair
values of the restricted stock issued during the three years ended December 31,
2009, were $51.29 (2008) and $56.42 (2007) per share.
In 2007,
the Company granted a total of 278,083 performance related restricted stock
units and performance related options covering 146,270 shares to certain of its
employees, including senior officers. Each performance stock unit represents a
contingent right to receive one share of common stock if certain market related
performance goals are met and the covered employees are continuously employed
through the end of the period over which the performance goals are measured. The
performance stock units have no voting rights and may not be transferred or
otherwise disposed of until they vest. In certain instances, cash dividends, if
declared, will be held uninvested and without interest and paid in cash if and
when such performance stock units vest. The weighted average grant-date market
prices of the performance stock units awarded during 2007 was $56.46 per share.
The estimated weighted average grant-date fair value of performance stock units
awarded during 2007 was $20.41 per share. The weighted average exercise price of
the performance options awarded during 2007 was $63.44 per share (the market
price at date of grant). The estimated weighted average grant-date fair value of
performance options awarded during 2007 was $17.23 per share. On December 31,
2009, a total of 195,407 performance related restricted stock units were
forfeited since the related market related performance goal was not met. No
performance related restricted stock units vested during the three years ended
December 31, 2009, since the related market related performance goals were not
met.
Compensation
expense is recognized over the vesting period, contingent or otherwise,
applicable to each grant, using the straight-line method. Compensation expense
as a result of all of these grants of restricted stock and restricted stock
units was $8,774,000 in 2009, $7,617,000 in 2008 and $5,924,000 in
2007.
Activity
with respect to restricted common stock and restricted stock units is summarized
as follows:
|
Nonvested
Shares Outstanding at December 31, 2006
|
148,035 | |||
|
Granted
|
433,434 | |||
|
Vested
($35.70 to $62.32 per share)
|
(53,814 | ) | ||
|
Forfeited
|
(14,601 | ) | ||
|
Nonvested
Shares Outstanding at December 31, 2007
|
513,054 | |||
|
Granted
|
287,582 | |||
|
Vested
($35.70 to $79.16 per share)
|
(82,494 | ) | ||
|
Forfeited
|
(11,938 | ) | ||
|
Nonvested
Shares Outstanding at December 31, 2008
|
706,204 | |||
|
Granted
|
33,840 | |||
|
Vested
($40.95 to $78.80 per share)
|
(142,931 | ) | ||
|
Forfeited
|
(234,884 | ) | ||
|
Nonvested
Shares Outstanding at December 31, 2009
|
362,229 |
The
Company’s 2004 Stock Incentive Plan, as amended (the “2004 Plan”), which was
approved by shareholders in June 2008, enables the Company to grant stock- based
awards, including stock options, stock appreciation rights, restricted stock and
performance awards to employees, consultants and non-employee directors. Options
covering 1,310,869 shares are outstanding with exercise prices ranging from
$40.95 to $64.92 per share (the market prices at dates of grant). A total of
959,404 shares of the Company’s stock may be issued or used as the basis for
awards under the 2004 Plan as of December 31, 2009. No further stock options may
be granted under the Company’s 1998 stock option plan and the 1999 non-employee
director stock option plan.
Options
covering 102,112 shares are outstanding under the 1998 stock option plan with
exercise prices ranging from $18.16 to $35.70 per share (the market prices at
dates of grant). Options granted under the 1998 stock option plan vest and
become exercisable over a three-year period and expire ten years from the date
of grant.
Options
covering 61,000 shares are outstanding under the 1999 non-employee director
stock option plan with exercise prices ranging from $16.35 to $44.47 per share
(the market prices at dates of grant). The plan provided for the grant of an
initial option for 7,500 shares and an annual option for 1,000 shares thereafter
to each non-employee director at an exercise price equal to market value at the
date of the grant. Initial options vest and become exercisable over a three-year
period; annual options vest and become exercisable one year from the date of the
grant. All options expire ten years from the date of grant.
|
2009
Annual Report
|
93
|
Stock
option activity under all plans is summarized as follows:
|
Options
Outstanding at December 31, 2006
|
399,967 | |||
|
Granted
|
492,661 | |||
|
Forfeited
|
(8,482 | ) | ||
|
Exercised
($13.31 to $52.40 per share)
|
(4,600 | ) | ||
|
Options
Outstanding at December 31, 2007
|
879,546 | |||
|
Granted
|
670,038 | |||
|
Forfeited
|
(3,398 | ) | ||
|
Exercised
($13.31 to $49.05 per share)
|
(18,022 | ) | ||
|
Options
Outstanding at December 31, 2008
|
1,528,164 | |||
|
Granted
|
— | |||
|
Forfeited
|
(50,883 | ) | ||
|
Exercised
($13.81 per share)
|
(3,300 | ) | ||
|
Options
Outstanding at December 31, 2009
|
1,473,981 | |||
|
Options
Exercisable at December 31, 2009
|
751,369 |
The
weighted average remaining contractual life of the outstanding stock options at
December 31, 2009 was 7.2 years. The range of exercise prices of the stock
options outstanding at December 31, 2009 was $16.35 to $64.92 per share. The
weighted average exercise prices of the stock options outstanding at December
31, 2009 and 2008 were $50.98 per share, respectively. The aggregate intrinsic
values of the options outstanding and exercisable at December 31, 2009 were
$3,038,000 and $2,249,000, respectively.
There
were no options granted in 2009. The fair values of the options granted other
than performance related options were estimated on the dates of grant using the
Black-Scholes option pricing model with the following weighted average
assumptions for 2008 and 2007: risk free interest rates of 2.4% and 4.7%,
dividend yields of 3.4% and 1.8%, expected stock price volatility factors of .35
and .31 and expected lives of 6.0 years. The weighted average grant-date fair
values of options other than performance related options granted in 2008 and
2007 were $13.01 and $17.96, respectively. The total intrinsic value of options
exercised amounted to $87,000 in 2009, $425,000 in 2008 and $168,000 in
2007.
The
Black-Scholes option valuation model was developed for use in estimating the
fair value of traded options that have no vesting restrictions and are fully
transferable. In addition, option valuation models require the input of highly
subjective assumptions, including the expected stock price volatility. Since the
Company’s stock options have characteristics significantly different from those
of traded options, and because changes in the subjective input assumptions can
materially affect the fair value estimate, in management’s opinion, the existing
models do not necessarily provide a reliable single measure of the fair value of
its stock options.
The
performance related grants in 2007 were valued using assumptions similar to
those described above for the risk free interest rates, dividend yields and
stock price volatility within a Monte Carlo pricing model that takes into
account the market related performance goals described in the
grants.
As of
December 31, 2009, there was $15,902,000 of unrecognized compensation cost
related to nonvested share-based compensation arrangements. That cost is
expected to be recognized over a weighted average period of 2.0
years.
|
94
|
Overseas
Shipholding Group, Inc.
|
NOTE
N—ACCUMULATED OTHER COMPREHENSIVE INCOME/(LOSS):
The
components of accumulated other comprehensive income/(loss), net of related
taxes, in the consolidated balance sheets follow:
|
In thousands at December
31,
|
2009
|
2008
|
||||||
|
Unrealized
losses on available-for-sale securities
|
$ | (384 | ) | $ | (3,969 | ) | ||
|
Unrealized
losses on derivative instruments
|
(52,649 | ) | (130,451 | ) | ||||
|
Items
not yet recognized as a component of net periodic benefit cost (pension
and other postretirement benefit plans)
|
(7,731 | ) | (11,939 | ) | ||||
| $ | (60,764 | ) | $ | (146,359 | ) | |||
At
December 31, 2009, the Company expects that it will reclassify $33,133,000 of
net losses on derivative instruments from accumulated other comprehensive
income/(loss) to earnings during the next twelve months related to the effective
portions of qualifying FFA and foreign currency transactions that will affect
earnings for 2010 and due to the payment of variable rate interest associated
with floating rate debt.
The
components of the change in the accumulated unrealized loss on derivative
instruments, net of related taxes follow:
|
In thousands for the year ended December
31,
|
2009
|
2008
|
||||||
|
Reclassification
adjustments for amounts included in net income, net:
|
||||||||
|
Interest
expense
|
$ | 9,309 | $ | 2,294 | ||||
|
Shipping
revenues
|
(41,445 | ) | 40,020 | |||||
|
Change
in unrealized impact of derivative instruments
|
109,938 | (160,070 | ) | |||||
| $ | 77,802 | $ | (117,756 | ) | ||||
The
income tax expense/(benefit) allocated to each component of other comprehensive
income/(loss) follows:
|
In thousands for the year ended December
31,
|
2009
|
2008
|
2007
|
|||||||||
|
Unrealized
losses on derivative instruments
|
$ | 1,151 | $ | (3,226 | ) | $ | (2,413 | ) | ||||
|
Pension
liabilities
|
2,532 | (3,646 | ) | (527 | ) | |||||||
|
Reclassification
adjustments included in net income:
|
||||||||||||
|
General
and administrative expenses
|
112 | 87 | 58 | |||||||||
|
Losses
on derivative instruments
|
1,913 | 290 | 516 | |||||||||
| $ | 5,708 | $ | (6,495 | ) | $ | (2,366 | ) | |||||
NOTE
O—LEASES:
|
1.
|
Charters-in:
|
As of
December 31, 2009, the Company had commitments to charter-in 55 vessels. All of
the charter-ins are, or will be, accounted for as operating leases, of which 24
are bareboat charters and 31 are time charters. The future minimum commitments
and related number of operating days under these operating leases are as
follows:
|
2009
Annual Report
|
95
|
Bareboat
Charters-in:
|
Dollars in thousands at December 31, 2009
|
Amount
|
Operating Days
|
||||||
|
2010
|
$ | 149,932 | 7,963 | |||||
|
2011
|
154,368 | 7,980 | ||||||
|
2012
|
156,685 | 8,052 | ||||||
|
2013
|
156,526 | 8,030 | ||||||
|
2014
|
146,666 | 6,465 | ||||||
|
Thereafter
|
288,707 | 14,714 | ||||||
|
Net
minimum lease payments
|
$ | 1,052,884 | 53,204 | |||||
Time
Charters-in:
|
Dollars in thousands at December 31, 2009
|
Amount
|
Operating Days
|
||||||
|
2010
|
$ | 215,901 | 10,454 | |||||
|
2011
|
192,074 | 9,054 | ||||||
|
2012
|
136,698 | 6,507 | ||||||
|
2013
|
86,562 | 4,907 | ||||||
|
2014
|
80,392 | 4,743 | ||||||
|
Thereafter
|
199,654 | 11,763 | ||||||
|
Net
minimum lease payments
|
$ | 911,281 | 47,428 | |||||
The
future minimum commitments for time charters-in have been reduced to reflect
estimated days that the vessels will not be available for employment due to
drydock.
Certain
of these charters also provide the Company with renewal and purchase
options.
On
December 11, 2009, the Company entered into an agreement with American Shipping
Company ASA (“AMSC”) and Aker Philadelphia Shipyard ASA (“APSI), and
certain of their affiliates and other related parties (collectively
“Aker”). In connection with such agreement, OSG agreed to purchase two U.S. Flag
Handysize Product Carriers (Overseas Cascade and Hull 015 TBN Overseas Chinook).
These vessels were previously subject to bareboat charters-in, with terms of ten
years commencing upon each vessel’s delivery. In addition, the agreement
provides that if certain conditions are satisfied by Aker, the charter-in terms
of the other ten Product Carriers constructed by, or to be constructed by, APSI
will be extended to a period of ten years from December 11, 2009. These
conditions had not been met as of December 31, 2009.
During
2009, the Company sold and chartered back one International Flag Panamax Product
Carrier, which bareboat charter is classified as an operating lease. The
aggregate gain on the transaction of approximately $1,018,000 was deferred and
is being amortized over the approximately twelve year term of the lease as a
reduction of charter hire expenses. The lease provides the Company with certain
purchase options.
During
the third quarter of 2009, the Company terminated the time charter-in of a VLCC
as a result of the vessel owner's breach of the underlying charter party
agreement. Accordingly, the Company recognized the remaining unamortized balance
of the gain, $16,617,000, which was deferred on the sale and charter back of
such vessel in 2006. This gain was reduced by a reserve of $2,744,000
established against certain receivables due from the vessel owner. The time
charter-in was originally scheduled to end in September 2013.
During
2008, the Company sold and chartered back two International Flag Aframaxes and
two International Flag Product Carriers. Such charters are classified as
operating leases. The gain on the transactions of approximately $9,979,000 was
deferred and is being amortized over the term of each of the charters (ranging
from seven and one half years to twelve years) as a reduction of charter hire
expense.
In
February 2007, the Company sold and chartered back two of its Handysize Product
Carriers, which bareboat charters are classified as operating leases. The
aggregate gain on the transaction of approximately $10,773,000 was deferred and
is being amortized over the seven and one-half year terms of the leases as a
reduction of charter hire expenses. In the third quarter of 2007, the Company
entered into agreements to purchase and then sell and charter back, on a
bareboat basis, two Suezmaxes from DHT. OSG took delivery of the first of the
two Suezmaxes late in 2007 and of the other in the first quarter of 2008. The
Company did not recognize any gain or loss on the sale of these vessels. The
charters, which are for terms of seven and ten years, are classified as
operating leases.
|
96
|
Overseas
Shipholding Group, Inc.
|
2. Charters-out:
The
future minimum revenues, before reduction for brokerage commissions, expected to
be received on noncancelable time charters and the related revenue days (revenue
days represent calendar days, less days that vessels are not available for
employment due to repairs, drydock or lay-up) are as follows:
|
Dollars in thousands at December 31, 2009
|
Amount
|
Revenue Days
|
||||||
|
2010
|
$ | 263,285 | 7,969 | |||||
|
2011
|
215,701 | 4,892 | ||||||
|
2012
|
143,582 | 2,778 | ||||||
|
2013
|
99,193 | 1,711 | ||||||
|
2014
|
76,532 | 1,234 | ||||||
|
Thereafter
|
15,650 | 212 | ||||||
|
Net
minimum lease payments
|
$ | 813,943 | 18,796 | |||||
Future
minimum revenues do not include the Company’s share of time charters entered
into by the pools in which it participates. Revenues from a time charter are not
generally received when a vessel is off-hire, including time required for normal
periodic maintenance of the vessel. In arriving at the minimum future charter
revenues, an estimated time off-hire to perform periodic maintenance on each
vessel has been deducted, although there is no assurance that such estimate will
be reflective of the actual off-hire in the future.
|
3.
|
Office
space:
|
The
future minimum commitments under lease obligations for office space are as
follows:
|
In thousands at December 31, 2009
|
||||
|
2010
|
$ | 5,014 | ||
|
2011
|
4,915 | |||
|
2012
|
4,425 | |||
|
2013
|
4,248 | |||
|
2014
|
3,433 | |||
|
Thereafter
|
18,031 | |||
|
Net
minimum lease payments
|
$ | 40,066 | ||
The
rental expense for office space, which is included in general and administrative
expenses in the consolidated statements of operations, amounted to $5,737,000 in
2009, $5,531,000 in 2008 and, $5,043,000 in 2007.
NOTE
P—PENSION AND OTHER POSTRETIREMENT BENEFIT PLANS:
In
connection with the acquisition of Maritrans, the Company assumed the
obligations under the defined benefit retirement plan of Maritrans Inc. (“the
Maritrans Plan”). As of December 31, 2006, the Company froze the benefits under
the Maritrans Plan. At December 31, 2009, the Maritrans Plan is the only
domestic defined benefit pension plan in existence. The Maritrans Plan was
noncontributory and covered substantially all shore-based employees and
substantially all of the seagoing supervisors who were supervisors in 1984, or
who were hired in, or promoted into, supervisory roles between 1984 and 1998 for
that period of time. Beginning in 1999, the seagoing supervisors’ retirement
benefits are provided through contributions to an industry-wide, multi-employer
union sponsored pension plan. Upon retirement, those seagoing supervisors are
entitled to retirement benefits from the Maritrans Plan for service periods
between 1984 and 1998 and from the multi-employer union sponsored plan for other
covered periods. Retirement benefits are based primarily on years of service and
average compensation for the five consecutive plan years that produce the
highest results.
The
Company also provides certain postretirement health care and life insurance
benefits to qualifying domestic retirees and their eligible dependents. The
health care plan is contributory, and the life insurance plan is
noncontributory. In general, postretirement medical coverage is provided to
employees hired prior to January 1, 2005 who retire and have met minimum age and
service requirements under a formula related to total years of service. The
Company no longer provides prescription drug coverage to its retirees or their
beneficiaries, other than licensed deck officers, who reach age 65 after 2005.
Generally, the resulting savings under the retiree medical plan will be shared
equally by the Company and those employees and their beneficiaries currently
over age 65 and will be shared in proportion to the current cost-sharing
provisions for those employees and their beneficiaries not yet age 65. The
Company does not currently fund these benefit arrangements and has the right to
amend or terminate the health care benefits at any time.
|
2009
Annual Report
|
97
|
Certain
of the Company’s foreign subsidiaries have pension plans that, in the aggregate,
are not significant to the Company’s consolidated financial
position.
Included
in accumulated other comprehensive income/(loss) at December 31, 2009 are the
following amounts that have not yet been recognized in net periodic cost:
unrecognized transition obligation of $65,000 ($42,000 net of tax), unrecognized
prior service costs of $1,565,000 ($1,175,000 net of tax) and unrecognized
actuarial losses $9,491,000 ($6,518,000 net of tax). The transition obligation,
prior service credit and actuarial loss included in accumulated other
comprehensive income/(loss) and expected to be recognized in net periodic cost
during the year ended December 31, 2010 is $20,000 ($13,000 net of tax),
$164,000 ($101,000 net of tax), and $239,000 ($163,000 net of tax),
respectively. Information with respect to the domestic plans for which the
Company uses a December 31 measurement date, follow:
|
Pension benefits
|
Other benefits
|
|||||||||||||||
|
In thousands
|
2009
|
2008
|
2009
|
2008
|
||||||||||||
|
Change
in benefit obligation:
|
||||||||||||||||
|
Benefit
obligation at beginning of year
|
$ | 45,756 | $ | 44,476 | $ | 4,076 | $ | 3,740 | ||||||||
|
Cost
of benefits earned (service cost)
|
— | — | 205 | 147 | ||||||||||||
|
Interest
cost on benefit obligation
|
2,235 | 2,262 | 223 | 227 | ||||||||||||
|
Amendments
|
— | — | — | — | ||||||||||||
|
Actuarial
losses/(gains)
|
(4,399 | ) | 833 | 1,130 | 106 | |||||||||||
|
Benefits
paid
|
(2,730 | ) | (1,815 | ) | (149 | ) | (144 | ) | ||||||||
|
Benefit
obligation at year end
|
40,862 | 45,756 | 5,485 | 4,076 | ||||||||||||
|
Change
in plan assets:
|
||||||||||||||||
|
Fair
value of plan assets at beginning of year
|
22,540 | 31,714 | — | — | ||||||||||||
|
Actual
return on plan assets
|
5,602 | (8,118 | ) | — | — | |||||||||||
|
Employer
contributions
|
1,265 | 683 | — | — | ||||||||||||
|
Benefits
paid
|
(2,655 | ) | (1,739 | ) | — | — | ||||||||||
|
Fair
value of plan assets at year end
|
26,752 | 22,540 | — | — | ||||||||||||
|
Funded
status at December 31 (unfunded)
|
$ | (14,110 | ) | $ | (23,216 | ) | $ | (5,485 | ) | $ | (4,076 | ) | ||||
The
accumulated benefit obligation for the Company’s defined benefit pension plans
described above was $40,862,000 and $45,756,000 at December 31, 2009 and 2008,
respectively.
Information
for domestic pension plans with accumulated benefit obligations in excess of
plan assets follows:
|
In thousands at December
31,
|
2009
|
2008
|
||||||
|
Projected
benefit obligation
|
$ | 40,862 | $ | 45,756 | ||||
|
Accumulated
benefit obligation
|
40,862 | 45,756 | ||||||
|
Fair
value of plan assets
|
26,752 | 22,540 | ||||||
|
Pension
benefits
|
Other
benefits
|
|||||||||||||||||||||||
|
In thousands for the year ended December
31,
|
2009
|
2008
|
2007
|
2009
|
2008
|
2007
|
||||||||||||||||||
|
Components
of expense:
|
||||||||||||||||||||||||
|
Cost
of benefits earned
|
$ | — | $ | — | $ | — | $ | 205 | $ | 147 | $ | 90 | ||||||||||||
|
Interest
cost on benefit obligation
|
2,235 | 2,262 | 2,279 | 223 | 227 | 206 | ||||||||||||||||||
|
Expected
return on plan assets
|
(1,451 | ) | (2,086 | ) | (2,047 | ) | — | — | — | |||||||||||||||
|
Amortization
of prior-service costs
|
— | — | — | (240 | ) | (240 | ) | (240 | ) | |||||||||||||||
|
Amortization
of transition obligation
|
— | — | — | 20 | 20 | 20 | ||||||||||||||||||
|
Recognized
net actuarial loss
|
375 | 18 | 14 | 22 | 35 | 12 | ||||||||||||||||||
|
Net
periodic benefit cost
|
$ | 1,159 | $ | 194 | $ | 246 | $ | 230 | $ | 189 | $ | 88 | ||||||||||||
|
98
|
Overseas
Shipholding Group, Inc.
|
The
weighted-average assumptions used to determine benefit obligations
follow:
|
Pension benefits
|
Other benefits
|
|||||||||||||||
|
At December 31,
|
2009
|
2008
|
2009
|
2008
|
||||||||||||
|
Discount
rate
|
5.5 | % | 5.0 | % | 5.5 | % | 5.75 | % | ||||||||
|
Rate of future compensation
increases
|
— | — | — | — | ||||||||||||
The
weighted-average assumptions used to determine net periodic benefit cost
follow:
|
Pension benefits
|
Other benefits
|
|||||||||||||||||||||||
|
For the year ended December
31,
|
2009
|
2008
|
2007
|
2009
|
2008
|
2007
|
||||||||||||||||||
|
Discount
rate
|
5.00 | % | 5.25 | % | 5.25 | % | — | 6.0 | % | 6.4 | % | |||||||||||||
|
Expected
(long-term) return on plan assets
|
6.75 | % | 6.75 | % | 6.75 | % | — | — | — | |||||||||||||||
|
Rate of future compensation
increases
|
— | — | — | — | — | — | ||||||||||||||||||
The
assumed health care cost trend rate for measuring the benefit obligation
included in Other Benefits above is an increase of 9% for 2011 over the actual
2010 rates, with the rate of increase declining steadily thereafter by 1% per
annum to an ultimate trend rate of 5% per annum in 2014. Assumed health care
cost trend rates have a significant effect on the amounts reported for the
health care plans. A 1% change in assumed health care cost trend rates would
have the following effects:
|
In thousands
|
1% increase
|
1% decrease
|
||||||
|
Effect
on total of service and interest cost components in 2009
|
$ | 72 | $ | (57 | ) | |||
|
Effect on postretirement benefit obligation as of
December 31, 2009
|
$ | 804 | $ | (640 | ) | |||
Expected
benefit payments are as follows:
|
In thousands
|
Pension benefits
|
Other benefits
|
||||||
|
2010
|
1,968 | 194 | ||||||
|
2011
|
1,997 | 195 | ||||||
|
2012
|
2,108 | 210 | ||||||
|
2013
|
2,106 | 223 | ||||||
|
2014
|
2,186 | 241 | ||||||
|
Years 2015—2019
|
12,651 | 1,420 | ||||||
| $ | 23,016 | $ | 2,483 | |||||
The
expected long-term rate of return on plan assets is based on the current and
expected asset allocations. Additionally, the long-term rate of return is based
on historical returns, investment strategy, inflation expectations and other
economic factors. The expected long-term rate of return is then applied to the
market value of plan assets.
The fair
values of the Company’s pension plan assets at December 31, 2009, by asset
category are as follows:
|
Description
|
Fair Value
|
Level 1:
Quoted prices in active
markets for identical
assets or liabilities
|
||||||
|
Cash
and cash equivalents
|
$ | 911 | $ | 911 | ||||
|
Equity
securities:
|
— | — | ||||||
|
U.S.
companies
|
12,581 | 12,581 | ||||||
|
International
companies
|
4,933 | 4,933 | ||||||
|
Mutual
funds (1)
|
3,270 | 3,270 | ||||||
|
U.S.
Treasury securities
|
1,452 | 1,452 | ||||||
|
Mortgage-backed securities
|
3,605 | 3,605 | ||||||
|
Total
|
$ | 26,752 | $ | 26,752 | ||||
(1) The
mutual fund investments are invested in intermediate term bonds.
|
2009
Annual Report
|
99
|
The
Maritrans Plan has historically utilized a strategic asset allocation investment
strategy that maintains a targeted allocation of 65% equity and 35% fixed
income. The allocation is rebalanced periodically after considering anticipated
benefit payments. The Company intends to reduce the targeted allocation of 65%
equity to 60% with a corresponding allocation of 5% to more liquid alternative
investments.
The
Company contributed $1,265,000 and $683,000 to the Maritrans Plan in 2009 and
2008, respectively. The Company did not make a material contribution to the
Maritrans Plan for 2007. The Company expects that its required contribution in
2010 to the Maritrans Plan will be approximately $2,925,000.
The
Company also has a 401(k) employee savings plan covering all eligible employees.
Contributions are limited to amounts allowable for income tax purposes.
Commencing in 2006, employer contributions include both employer contributions
made regardless of employee contributions and matching contributions to the
plan. All contributions to the plan are at the discretion of the
Company.
Certain
subsidiaries make contributions to jointly managed (Company and union)
multi-employer pension plans covering seagoing personnel. The Employee
Retirement Income Security Act of 1974 requires employers who are contributors
to U.S. multi- employer plans to continue funding their allocable share of each
plan’s unfunded vested benefits in the event of withdrawal from or termination
of such plans. Based on information received from the trustees of such plans,
the Company believes that any withdrawal liability as of December 31, 2009 is
not material. Certain other seagoing personnel of U.S. Flag vessels are covered
under a defined contribution plan, the cost of which is funded as accrued. The
costs of these plans were not material during the three years ended December 31,
2009.
NOTE
Q—OTHER INCOME/(EXPENSE):
Other
income consists of:
|
In thousands for the year ended December
31,
|
2009
|
2008
|
2007
|
|||||||||
|
Investment
income:
|
||||||||||||
|
Interest
|
$ | 3,092 | $ | 13,087 | $ | 35,980 | ||||||
|
Dividends
|
31 | 1 | 9 | |||||||||
|
Gains/(losses) on sale of securities and other
investments and write-down of securities
|
(3,287 | ) | (1,284 | ) | 41,173 | |||||||
| (164 | ) | 11,804 | 77,162 | |||||||||
|
Loss
on repurchases of debt
|
— | (6,934 | ) | — | ||||||||
|
Loss
on derivative transactions
|
1,672 | (33,774 | ) | (2,746 | ) | |||||||
|
Miscellaneous—net
|
164 | 57 | 1,018 | |||||||||
| $ | 1,672 | $ | (28,847 | ) | $ | 75,434 | ||||||
Proceeds
from sales of available-for-sale securities were $159,000 (2009) and $7,342,000
(2008). Gross realized gains on such sales that were included in income before
federal income taxes in each of the respective periods were $144,000 (2008).
Gross realized losses on such sales were $253,000 (2009) and $1,428,000
(2008).
Based on
a number of factors, including the magnitude of the drop in market value below
the Company’s cost basis and the length of time that the decline had been
sustained, management concluded that the decline in fair value of certain
securities with aggregate cost basis of $6,188,000 in 2009, were
other-than-temporary. Accordingly, during 2009, the Company recorded an
impairment loss aggregating $5,151,000 in the accompanying consolidated
statement of operations.
NOTE
R—AGREEMENTS WITH EXECUTIVE OFFICERS AND SEVERANCE AND RELOCATION
COSTS:
The
Company entered into an agreement effective February 1, 2009 in connection with
the resignation of one of its senior officers. The agreement provides for
payments aggregating approximately $1,200,000 to be made to such senior officer
in accordance with the Company’s amended and restated Severance Protection Plan,
which was effective December 31, 2008. The Company recognized this expense in
the first quarter of 2009. In addition, in the first quarter of 2009, the
Company completed a review of staffing requirements for its U.S. Flag business.
In connection therewith, six employees were terminated and certain employees
were relocated from the New York headquarters office to the Tampa office. In
connection with such staff reductions, the Company recorded $514,000 in
severance costs and $748,000 in relocation costs in 2009.
|
100
|
Overseas
Shipholding Group, Inc.
|
On
February 15, 2007, OSG and its chief executive officer entered into two letter
agreements. One letter agreement amended the employment letter agreement dated
as of January 19, 2004, to extend the time period from January 19, 2007 to
January 19, 2012 for certain protection in the event of termination of
employment without cause or for good reason. The other agreement amended the
change of control agreement dated as of January 19, 2004, to extend its term to
end on the earliest to occur of three events, one of which is a fixed date,
which the letter agreement extended from January 19, 2007 to January 19,
2012.
NOTE
S—RELATED PARTY TRANSACTIONS:
Effective
April 1, 2008, OSG entered into time charter agreements with a subsidiary, OSG
America L.P. for the charter-out of the Liberty/M 300 and the OSG
Constitution/OSG 400 at fixed daily rates. The agreement assigned the charter
contracts on these two ATBs to OSG America L.P. The terms of each of the
charters end simultaneously with the completion of each unit’s lightering
service, which was in December 2008 for the Liberty/M 300 and was expected to
occur in 2009 for the OSG Constitution/OSG 400. On October 10, 2008, OSG
converted the time charter agreement on the OSG Constitution/OSG 400 to a
bareboat charter agreement. In addition, also effective April 1, 2008, the
Company entered into time charter agreements with OSG America L.P. to charter-in
five vessels, three of which were employed by OSG America L.P. in the spot
market (two ATBs, the OSG Columbia/OSG 242 and the OSG Independence/OSG 243, and
one Product Carrier, the Overseas New Orleans) and two Product Carriers (the
Overseas Philadelphia and Overseas Puget Sound) upon the completion of their
current time charters in 2009. The charter-in of the Overseas Philadelphia did
not start because its then current charter was extended. All five of these
charter-in agreements were at fixed daily rates for terms commencing either on
April 1, 2008 or upon the expiry of such vessel’s then current charter and
ending on or about December 31, 2009. See Note E. At the time
of the agreement, management believed that the fixed daily rates in the above
charter-in agreements were at rates that approximated market rates.
NOTE
T—SUPPLEMENTAL SCHEDULE OF NONCASH INVESTING ACTIVITIES:
In May
2008, the Company and its joint venture partner entered into an agreement
terminating a joint venture that was constructing two VLCCs.
|
Value
of assets received
|
$ | 30,437,000 | ||
|
Cost
of investment in joint venture
|
(30,437,000 | ) |
In
October 2008, Euronav NV sold the TI Asia to a joint venture between the Company
and Euronav NV in exchange for cash and advances aggregating $150,000,000. The
Company’s share of such advances was settled through its sale of the TI Africa
to the joint venture in the first quarter of 2009.
|
Investment
in Affiliated Companies
|
$ | 75,000,000 | ||
|
Liability
to Euronav NV
|
(75,000,000 | ) |
In
January 2009, OSG sold the TI Africa to a joint venture between the Company and
Euronav NV in exchange for cash of $50,000,000 and advances of $150,000,000.
Euronav’s share of such advances ($75,000,000) was settled through its sale of
the TI Asia to the joint venture as described above.
|
Investment
in Affiliated Companies
|
$ | 74,595,000 | ||
|
Liability
to Euronav NV
|
75,000,000 | |||
|
Carrying
Amount of Vessel and Deferred Drydock Expenditures
|
(96,252,000 | ) | ||
|
Gain
on Disposal of Vessel
|
(53,343,000 | ) |
|
2009
Annual Report
|
101
|
NOTE
U—2009 AND 2008 QUARTERLY RESULTS OF OPERATIONS (UNAUDITED):
|
Results of Operations for Quarter
Ended
(in thousands, except per share
amounts)
|
March 31,
|
June 30,
|
Sept. 30,
|
Dec. 31,
|
||||||||||||
|
2009
|
||||||||||||||||
|
Shipping
revenues
|
$ | 324,804 | $ | 282,656 | $ | 243,576 | $ | 242,582 | ||||||||
|
Gain/(loss)
on disposal of vessels, net of impairments
|
129,863 | (2,568 | ) | 830 | (639 | ) | ||||||||||
|
Income
from vessel operations
|
128,545 | 799 | (16,199 | ) | (36,015 | ) | ||||||||||
|
Net
income
|
123,262 | (7,821 | ) | (21,929 | ) | (22,365 | ) | |||||||||
|
Net
income attributable to Overseas Shipholding Group, Inc.
|
121,750 | (8,794 | ) | (19,624 | ) | (23,162 | ) | |||||||||
|
Basic
net income per share
|
$ | 4.53 | $ | (0.33 | ) | $ | (0.73 | ) | $ | (0.86 | ) | |||||
|
Diluted
net income per share
|
$ | 4.53 | $ | (0.33 | ) | $ | (0.73 | ) | $ | (0.86 | ) | |||||
|
2008
|
||||||||||||||||
|
Shipping
revenues
|
$ | 410,676 | $ | 428,224 | $ | 472,672 | $ | 393,125 | ||||||||
|
Gain/(loss)
on disposal of vessels, net of impairments
|
5 | 23,686 | 31,517 | (114,946 | ) | |||||||||||
|
Income
from vessel operations
|
127,423 | 146,823 | 192,719 | (121,779 | ) | |||||||||||
|
Net
income
|
113,358 | 88,047 | 195,560 | (91,779 | ) | |||||||||||
|
Net
income attributable to Overseas Shipholding Group, Inc.
|
112,435 | 86,935 | 197,840 | (79,545 | ) | |||||||||||
|
Basic
net income per share
|
$ | 3.61 | $ | 2.84 | $ | 6.74 | $ | (2.89 | ) | |||||||
|
Diluted
net income per share
|
$ | 3.60 | $ | 2.81 | $ | 6.69 | $ | (2.89 | ) | |||||||
The
results for the quarter ended December 31, 2008, include $113,865,000 in
write-downs for four ATBs under construction and two older U.S. Flag vessels
that were held for sale at year end and a $62,874,000 impairment charge related
to goodwill in the U.S. segment.
NOTE
V—LEGAL MATTERS:
On
December 19, 2006, the Company and the U.S. Department of Justice reached a
comprehensive settlement regarding violations concerning the Company’s handling
of waste oils and maintenance of books and records relating thereto stemming
from an investigation that began in 2003. Under the settlement, the Company
agreed to plead guilty to a total of 33 counts, one of which concerned the
improper discharge of oil in 2002 and the remainder of which concerned
record-keeping violations, including making false statements, obstruction and
conspiracy related to such record-keeping violations. The settlement also
provided that the Company pay a fine in the amount of $27.8 million and pay $9.2
million to designated environmental community service programs, all of which was
paid in 2007, and agree to an environmental compliance program, which commenced
during the third quarter of 2007 and is substantially the same as the Company’s
existing environmental management programs.
The
Company incurred costs of approximately $3,023,000 in 2007 in connection with
these investigations. Such costs have been included in general and
administrative expenses in the accompanying consolidated statements of
operations.
|
102
|
Overseas
Shipholding Group, Inc.
|
0BReport of Independent Registered
Public Accounting Firm
To the Board of Directors
and Shareholders of Overseas Shipholding Group, Inc.:
In our
opinion, the accompanying consolidated balance sheet and the related
consolidated statements of operations, cash flows, and changes in equity present
fairly, in all material respects, the financial position of Overseas Shipholding
Group, Inc. and its subsidiaries at December 31, 2009, and the results of
their operations
and their cash flows for the period ended December 31, 2009 in conformity with
accounting principles generally accepted in the United States of
America. Also in our opinion, the Company maintained, in all material
respects, effective internal control over financial reporting as of December 31,
2009, based on criteria established in Internal Control - Integrated
Framework issued by the Committee of Sponsoring Organizations of the
Treadway Commission (COSO). The Company's management is responsible
for these financial statements, for maintaining effective internal control over
financial reporting and for its assessment of the effectiveness of internal
control over financial reporting, included in the accompanying Management's
Report on Internal Control over Financial Reporting. Our
responsibility is to express opinions on these financial statements and on the
Company's internal control over financial reporting based on our integrated
audit. We conducted our audit in accordance with the standards of the
Public Company Accounting Oversight Board (United States). Those
standards require that we plan and perform the audit to obtain reasonable
assurance about whether the financial statements are free of material
misstatement and whether effective internal control over financial reporting was
maintained in all material respects. Our audit of the financial
statements included examining, on a test basis, evidence supporting the amounts
and disclosures in the financial statements, assessing the accounting principles
used and significant estimates made by management, and evaluating the overall
financial statement presentation. Our audit of internal control over
financial reporting included obtaining an understanding of internal control over
financial reporting, assessing the risk that a material weakness exists, and
testing and evaluating the design and operating effectiveness of internal
control based on the assessed risk. Our audit also included
performing such other procedures as we considered necessary in the
circumstances. We believe that our audit provide a reasonable basis for our
opinions.
We also
have audited the adjustments to the 2008 and 2007 financial statements to
retrospectively apply change in accounting for the presentation of
noncontrolling interest, as described in Note A - Summary of Significant
Accounting Policies. In our opinion, such adjustments are appropriate and have
been properly applied. We are not engaged to audit, or apply any procedures to
the 2008 or 2007 financial statements of the Company other than with respect to
the adjustments and, accordingly, we do not express an opinion or any other form
of assurance on the 2008 or 2007 financial statements taken as a
whole.
A
company’s internal control over financial reporting is a process designed to
provide reasonable assurance regarding the reliability of financial reporting
and the preparation of financial statements for external purposes in accordance
with generally accepted accounting principles. A company’s internal
control over financial reporting includes those policies and procedures that
(i) pertain to the maintenance of records that, in reasonable detail,
accurately and fairly reflect the transactions and dispositions of the assets of
the company; (ii) provide reasonable assurance that transactions are
recorded as necessary to permit preparation of financial statements in
accordance with generally accepted accounting principles, and that receipts and
expenditures of the company are being made only in accordance with
authorizations of management and directors of the company; and
(iii) provide reasonable assurance regarding prevention or timely detection
of unauthorized acquisition, use, or disposition of the company’s assets that
could have a material effect on the financial statements.
Because
of its inherent limitations, internal control over financial reporting may not
prevent or detect misstatements. Also, projections of any evaluation
of effectiveness to future periods are subject to the risk that controls may
become inadequate because of changes in conditions, or that the degree of
compliance with the policies or procedures may deteriorate.
/s/
PricewaterhouseCoopers LLP
New York,
New York
March 1,
2010
|
2009
Annual Report
|
103
|
REPORT
OF INDEPENDENT REGISTERED PUBLIC ACCOUNTING FIRM
To the
Stockholders
Overseas
Shipholding Group, Inc.
We have
audited the accompanying consolidated balance sheet of Overseas Shipholding
Group, Inc. and subsidiaries as of December 31, 2008, and the related
consolidated statements of operations, cash flows, and changes in equity for
each of the two years in the period ended December 31, 2008. These
financial statements are the responsibility of the Company's management. Our
responsibility is to express an opinion on these financial statements based on
our audits.
We
conducted our audits in accordance with the standards of the Public Company
Accounting Oversight Board (United States). Those standards require that we plan
and perform the audit to obtain reasonable assurance about whether the financial
statements are free of material misstatement. An audit includes examining, on a
test basis, evidence supporting the amounts and disclosures in the financial
statements. An audit also includes assessing the accounting principles used and
significant estimates made by management, as well as evaluating the overall
financial statement presentation. We believe that our audits provide a
reasonable basis for our opinion.
In our
opinion, the financial statements referred to above present fairly, in all
material respects, the consolidated financial position of Overseas Shipholding
Group, Inc. and subsidiaries at December 31, 2008, and the
consolidated results of their operations and their cash flows for each of the
two years in the period ended December 31, 2008, in conformity with U.S.
generally accepted accounting principles.
/s/ Ernst
& Young
New York,
New York
February 26,
2009
|
104
|
Overseas
Shipholding Group, Inc.
|
MANAGEMENT’S
REPORT ON INTERNAL CONTROLS
OVER
FINANCIAL REPORTING
To the
Stockholders
Overseas
Shipholding Group, Inc.
In
accordance with Rule 13a-15(f) of the Securities Exchange Act of 1934, the
management of Overseas Shipholding Group, Inc. and its subsidiaries (the
“Company”) is responsible for the establishment and maintenance of adequate
internal controls over financial reporting for the Company. Internal control
over financial reporting is a process designed to provide reasonable assurance
regarding the reliability of financial reporting and the preparation of
financial statements for external purposes in accordance with generally accepted
accounting principles. The Company’s system of internal control over financial
reporting includes those policies and procedures that (i) pertain to the
maintenance of records that, in reasonable detail, accurately and fairly reflect
the transactions and dispositions of the assets of the Company; (ii) provide
reasonable assurance that transactions are recorded as necessary to permit
preparation of financial statements in accordance with generally accepted
accounting principles, and that receipts and expenditures of the Company are
being made only in accordance with authorizations of management and directors of
the Company; and (iii) provide reasonable assurance regarding prevention or
timely detection of unauthorized acquisition, use, or disposition of the
Company’s assets that could have a material effect on the financial statements.
Management has performed an assessment of the effectiveness of the Company’s
internal controls over financial reporting as of December 31, 2009 based on the
provisions of Internal Control—Integrated Framework issued by the Committee of
Sponsoring Organizations of the Treadway Commission (“COSO”). Based on our
assessment, management determined that the Company’s internal controls over
financial reporting was effective as of December 31, 2009 based on the criteria
in Internal Control—Integrated Framework issued by COSO.
PricewaterhouseCoopers
LLP, the Company’s independent registered public accounting firm, who audited
the 2009 financial statements included in the Annual Report, has audited and
reported on the effectiveness of the Company’s internal controls over financial
reporting as of December 31, 2009 as stated in their report which appears
elsewhere in this Annual Report.
February
26, 2010
|
OVERSEAS
SHIPHOLDING GROUP, INC.
|
||
|
By:
|
/s/
Morten
Arntzen
|
|
|
Morten
Arntzen
|
||
|
President,
|
||
|
Chief
Executive Officer
|
||
|
By:
|
/s/
Myles
R. Itkin
|
|
|
Myles
R. Itkin
|
||
|
Executive
Vice President,
|
||
|
Chief
Financial Officer and Treasurer
|
||
|
2009
Annual Report
|
105
|
ITEM
9. CHANGES IN AND DISAGREEMENTS WITH ACCOUNTANTS ON ACCOUNTING AND FINANCIAL
DISCLOSURE
None.
ITEM
9A. CONTROLS AND PROCEDURES
|
(a)
|
Evaluation
of disclosure controls and
procedures.
|
As of the
end of the period covered by this Annual Report on Form 10-K, an evaluation was
performed under the supervision and with the participation of the Company’s
management, including the Chief Executive Officer (“CEO”) and Chief Financial
Officer (“CFO”), of the effectiveness of the design and operation of the
Company’s disclosure controls and procedures pursuant to Rules 13a-15(e)
and 15d-15(e) under the Securities Exchange Act of 1934 (the “Exchange Act”).
Based on that evaluation, the Company’s management, including the CEO and CFO,
concluded that the Company’s current disclosure controls and procedures are
effective to ensure that information required to be disclosed by the Company in
the reports the Company files or submits under the Exchange Act is (i) recorded,
processed, summarized and reported, within the time periods specified in the
Securities and Exchange Commission’s rules and forms and (ii) accumulated and
communicated to the Company’s management, including the CEO and CFO, as
appropriate to allow timely decisions regarding required disclosure. There have
been no changes in the Company’s internal controls over financial reporting
during the quarter ended December 31, 2009 that have materially affected, or are
reasonably likely to materially affect, the Company’s internal control over
financial reporting
|
(b)
|
Management’s
report on internal controls over financial
reporting.
|
Management’s
report on internal controls over financial reporting, which appears elsewhere in
this Annual Report, is incorporated herein by reference.
ITEM
9B. OTHER INFORMATION
None.
|
106
|
Overseas
Shipholding Group, Inc.
|
PART
III
ITEM
10. DIRECTORS, EXECUTIVE OFFICERS AND CORPORATE GOVERNANCE
See Item
14 below. Information with respect to executive officers of the Company is
included at the end of Part I. The Company has adopted a code of ethics that
applies to all of its directors, officers (including its principal executive
officer, principal financial officer, principal accounting officer, controller
and any person performing similar functions) and employees. The Company makes
its code of ethics available free of charge through its internet website,
www.osg.com.
ITEM
11. EXECUTIVE COMPENSATION
See Item
14 below.
ITEM
12. SECURITY OWNERSHIP OF CERTAIN BENEFICIAL OWNERS AND MANAGEMENT AND RELATED
STOCKHOLDER MATTERS
The
following table provides information as of December 31, 2009 with respect to the
Company’s equity (stock) compensation plans, all of which have been approved by
the Company’s shareholders:
|
Plan Category
|
Number of securities to
be issued upon exercise
of outstanding options,
warrants and rights
(a)
|
Weighted-average
exercise price of
outstanding options,
warrants and rights
(b)
|
Number of securities
remaining available for
future issuance under
equity compensation
plans (excluding
securities reflected in
column (a))
(c)
|
|||||||||
|
Equity compensation plans approved by security
holders
|
1,473,982 | $ | 50.98 | 1,011,852 | * | |||||||
|
*
|
Consists
of 959,404 shares eligible to be granted under the Company’s 2004 stock
incentive plan and 52,448 shares eligible to be purchased pursuant to the
Company’s 2000 Employee Stock Purchase
Plan.
|
See also
Item 14 below.
ITEM
13. CERTAIN RELATIONSHIPS AND RELATED TRANSACTIONS, AND DIRECTOR
INDEPENDENCE
See Item
14 below.
ITEM
14. PRINCIPAL ACCOUNTANT FEES AND SERVICES
Except
for the table in Item 12 above, the information called for under Items 10, 11,
12, 13 and 14 is incorporated by reference from the definitive Proxy Statement
to be filed by the Company in connection with its 2010 Annual Meeting of
Stockholders.
|
2009
Annual Report
|
107
|
PART
IV
ITEM
15. EXHIBITS, FINANCIAL STATEMENT SCHEDULES
|
(a)(1)
|
The
following consolidated financial statements of the Company are filed in
response to Item 8.
|
|
Consolidated
Balance Sheets at December 31, 2009 and 2008.
|
|
|
Consolidated
Statements of Operations for the Years Ended December 31, 2009, 2008 and
2007.
|
|
|
Consolidated
Statements of Cash Flows for the Years Ended December 31, 2009, 2008 and
2007.
|
|
|
Consolidated
Statements of Changes in Equity for the Years Ended December 31, 2009,
2008 and 2007.
|
|
|
Notes
to Consolidated Financial Statements.
|
|
|
Reports
of Independent Registered Public Accounting Firms.
|
|
|
(a)(2)
|
Schedules
of the Company have been omitted since they are not applicable or are not
required.
|
|
(a)(3)
|
The
following exhibits are included in response to Item
15(c):
|
|
3(i)
|
Certificate
of Incorporation of the registrant, as amended to date (filed as Exhibit
3(i) to the registrant’s Quarterly Report on Form 10-Q for quarter ended
June 30, 2006 and incorporated herein by reference).
|
|
3(ii)
|
Amended
and Restated Bylaws of the Registrant (filed as Exhibit 3.1 to the
registrant’s Current Report on Form 8-K dated April 12, 2006 and
incorporated herein by reference).
|
|
4(a)(1)
|
Form
of Indenture dated as of December 1, 1993 between the registrant and The
Chase Manhattan Bank (National Association) providing for the issuance of
debt securities by the registrant from time to time (filed as Exhibit
4(b)(1) to the registrant’s Quarterly Report on Form 10-Q for the quarter
ended March 31, 2004 and incorporated herein by
reference).
|
|
4(a)(2)
|
Resolutions
dated December 2, 1993 fixing the terms of two series of debt securities
issued by the registrant under the Indenture (filed as Exhibit 4(b)(2) to
the registrant’s Quarterly Report on Form 10-Q for the quarter ended March
31, 2004 and incorporated herein by reference).
|
|
4(a)(3)
|
Form
of 83/4%
Debentures due December 1, 2013 of the registrant (filed as Exhibit
4(b)(3) to the registrant’s Quarterly Report on Form 10-Q for the quarter
ended March 31, 2004 and incorporated herein by
reference).
|
|
4(b)(1)
|
Indenture
dated as of March 7, 2003 between the registrant and Wilmington Trust
Company, as trustee, providing for the issuance of debt securities of the
registrant from time to time (filed as Exhibit 4(e)(1) to the registrant’s
Registration Statement on Form S-4 filed May 5, 2003 and incorporated
herein by reference). Such Indenture is hereby modified, effective as of
January 13, 2004, by deleting all references therein to “Wilmington Trust
Company”, “March 7, 2003” and any specific day, month and/or year and
substituting therefore blank spaces.
|
|
4(b)(2)
|
Form
of Debt Security of the registrant (filed as Exhibit 4.4 to the
registrant’s Registration Statement on Form S-3 filed January 13, 2004 and
incorporated herein by reference).
|
|
4(c)(1)
|
Credit
Agreement dated as February 9, 2006, among the registrant, OSG Bulk Ships,
Inc., OSG International, Inc., various lenders, DnB NOR Bank ASA, New York
Branch (“DnB”), as administrative agent, HSBC Securities (USA) Inc.
(“HSBC”), as documentation agent, Citigroup Global Markets Limited
(“Citigroup”) and Nordea Bank Finland, Plc, New York branch (“Nordea”), as
bookrunners, and Citigroup, DnB, HSBC and Nordea as lead arrangers (filed
as Exhibit 4(e)(6) to the registrant’s Annual Report on Form 10-K for 2005
and incorporated herein by
reference).
|
|
108
|
Overseas
Shipholding Group, Inc.
|
|
4(c)(2)
|
Second
Pooled Assignment and Amendment dated as of May 10, 2006 (filed as Exhibit
4.1 to Registrant’s Current Report on Form 8-K dated May 10, 2006 and
incorporated herein by reference).
NOTE:
The Exhibits filed herewith do not include other instruments authorizing
long-term debt of the registrant and its subsidiaries, where the amounts
authorized thereunder do not exceed 10% of total assets of the registrant
and its subsidiaries on a consolidated basis. The registrant agrees to
furnish a copy of each such instrument to the Commission upon
request.
|
|
10(i)(a)
|
Exchange
Agreement dated December 9, 1969 (including exhibits thereto) between the
registrant and various parties relating to the formation of the registrant
(the form of which was filed as Exhibit 2(3) to Registration Statement No.
2-34124 and incorporated herein by reference).
|
|
10(i)(b)
|
Form
of Additional Exchange Agreement referred to in Section 2.02 of Exhibit
10(i)(a) hereto (filed as Exhibit 2(4) to Registration Statement No.
2-34124 and incorporated herein by reference).
|
|
10(i)(c)
|
Time
Charter Party relating to the Overseas Ann dated October 6, 2005 between
DHT Ann VLCC Corp. and Ann Tanker Corporation (filed as Exhibit 10.3.1 to
Double Hull Tankers, Inc.’s Registration Statement on Form F-1
(Registration No. 333-128460) and incorporated herein by reference), as
amended by Amendment No. 1 dated January 15, 2009 (filed as Exhibit
10(i)(c) to the registrant’s Annual Report on Form 10-K for 2008 and
incorporated herein by reference).
|
|
10(i)(d)
|
Time
Charter Party relating to the Overseas Chris dated October 6, 2005 between
DHT Chris VLCC Corp. and Chris Tanker Corporation (filed as Exhibit 10.3.2
to Double Hull Tankers, Inc.’s Registration Statement on Form F-1
(Registration No. 333-128460) and incorporated herein by reference, as
amended by Amendment No. 1 dated January 15, 2009 (filed as Exhibit
10(i)(d) to the registrant’s Annual Report on Form 10-K for 2008 and
incorporated herein by reference).
|
|
10(i)(e)
|
Time
Charter Party relating to the Regal Unity dated October 6, 2005 between
DHT Regal Unity VLCC Corp. and Regal Unity Tanker Corporation (filed as
Exhibit 10.3.3 to Double Hull Tankers, Inc.’s Registration Statement on
Form F-1 (Registration No. 333-128460) and incorporated herein by
reference), as amended by Amendment No. 1 dated January 15, 2009 (filed as
Exhibit 10(i)(e) to the registrant’s Annual Report on Form 10-K for 2008
and incorporated herein by reference).
|
|
10(i)(f)
|
Time
Charter Party relating to the Overseas Cathy dated October 6, 2005 between
DHT Cathy Aframax Corp. and Cathy Tanker Corporation (filed as Exhibit
10.3.4 to Double Hull Tankers, Inc.’s Registration Statement on Form F-1
(Registration No. 333-128460) and incorporated herein by reference), as
amended by Amendment No. 1 dated January 15, 2009 (filed as Exhibit
10(i)(f) to the registrant’s Annual Report on Form 10-K for 2008 and
incorporated herein by reference).
|
|
10(i)(g)
|
Time
Charter Party relating to the Overseas Sophie dated October 6, 2005
between DHT Sophie Aframax Corp. and Sophie Tanker Corporation (filed as
Exhibit 10.3.5 to Double Hull Tankers, Inc.’s Registration Statement on
Form F-1 (Registration No. 333-128460) and incorporated herein by
reference), as amended by Amendment No. 1 dated January 15, 2009 (filed as
Exhibit 10(i)(g) to the registrant’s Annual Report on Form 10-K for 2008
and incorporated herein by reference).
|
|
10(i)(h)
|
Time
Charter Party relating to the Rebecca dated October 6, 2005 between
Rebecca Aframax Corp. and Rebecca Tanker Corporation (filed as Exhibit
10.3.6 to Double Hull Tankers, Inc.’s Registration Statement on Form F-1
(Registration No. 333-128460) and incorporated herein by reference), as
amended by Amendment No. 1 dated January 15, 2009 (filed as Exhibit
10(i)(h) to the registrant’s Annual Report on Form 10-K for 2008 and
incorporated herein by reference).
|
|
10(i)(i)
|
Time
Charter Party relating to the Ania dated October 6, 2005 between DHT Ania
Aframax Corp. and Ania Aframax Corporation (filed as Exhibit 10.3.7 to
Double Hull Tankers, Inc.’s Registration Statement on Form F-1
(Registration No. 333-128460) and incorporated herein by reference), as
amended by Amendment No. 1 dated January 15, 2009 (filed as Exhibit
10(i)(i) to the registrant’s Annual Report on Form 10-K for 2008 and
incorporated herein by reference).
|
|
2009
Annual Report
|
109
|
|
10(i)(j)
|
Charter
Framework Agreement dated October 6, 2005 between Double Hull Tankers,
Inc., OSG International, Inc. and each of the Owners and Charterers named
therein (filed as Exhibit 10.5 to Double Hull Tankers, Inc.’s Registration
Statement on Form F-1 (Registration No. 333-128460) and incorporated
herein by reference).
|
|
*10(iii)(a)
|
Supplemental
Executive Savings Plan of the registrant dated as of December 22, 2005, as
amended by Amendment One effective as of January 1, 2006 (filed as Exhibit
10(iii)(a) to the registrant’s Annual Report on Form 10-K for 2008 and
incorporated herein by reference).
|
|
*10(iii)(b)
|
1998
Stock Option Plan adopted for employees of the registrant and its
affiliates (filed as Exhibit 10 to the registrant’s Quarterly Report on
Form 10-Q for the quarter ended March 31, 1998 and incorporated herein by
reference).
|
|
*10(iii)(c)
|
Amendment
to the 1998 Stock Option Plan adopted for employees of the registrant and
its affiliates (filed as Exhibit 10 to the registrant’s Quarterly Report
on Form 10-Q for the quarter ended June 30, 2000 and incorporated herein
by reference).
|
|
*10(iii)(d)
|
1999
Non-Employee Director Stock Option Plan of the registrant (filed as
Exhibit 10(e)(4) to the registrant’s Annual Report on Form 10-K for 1998
and incorporated herein by reference), as amended by Amendment No. 1 dated
May 31, 2004 (filed as Exhibit 10 to the registrant’s Quarterly Report on
Form 10-Q for the quarter ended June 30, 2004 and incorporated herein by
reference).
|
|
*10(iii)(e)
|
Agreement
dated January 19, 2004 with an executive officer (filed as Exhibit
10(iii)(v) to the registrant’s Annual Report on Form 10-K for 2003 and
incorporated herein by reference), as amended by (i) a letter agreement
dated February 15, 2007 (filed as Exhibit 10.1 to the registrant’s Current
Report on Form 8-K dated February 15, 2007 and incorporated herein by
reference), (ii) a letter agreement dated February 15, 2007 (filed as
Exhibit 10.2 to the registrant’s Current Report on Form 8-K dated February
15, 2007 and incorporated herein by reference) and (iii) a letter
agreement dated December 31, 2008 (filed as Exhibit 10.1 to the
registrant’s Current Report on Form 8-K dated December 31, 2008 and
incorporated herein by reference).
|
|
*10(iii)(f)
|
Amended
and Restated Change of Control Agreement dated as of December 31,
2008 with an executive officer (filed as Exhibit 10.3 to the
registrant’s Current Report on Form 8-K dated December 31, 2008
and incorporated herein by reference).
|
|
*10(iii)(g)
|
Form
of Director and Officer Indemnity Agreement for the directors and officers
of the registrant (filed as Exhibit 10 to the registrant’s Quarterly
Report on Form 10-Q for the quarter ended March 31, 2004 and
incorporated herein by reference).
|
|
*10(iii)(h)
|
2004
Stock Incentive Plan of the registrant as amended and restated as of
June 10, 2008 (filed with the SEC on April 29, 2008 as
Appendix A to the registrant’s Proxy Statement and incorporated
herein by reference), as amended by Amendment No. One dated
December 30, 2008 (filed as Exhibit 10.8 to the registrant’s
Current Report on Form 8-K dated December 31, 2008 and
incorporated herein by reference).
|
|
*10(iii)(i)
|
Form
of Amended and Restated Change of Control Protection Agreement dated as of
December 31, 2008 with each of three executive officers (filed as
Exhibit 10.4 to the registrant’s Current Report on Form 8-K
dated December 31, 2008 and incorporated herein by
reference).
|
|
*10(iii)(j)
|
Form
of Amended and Restated Change of Control Agreement dated as of
December 31, 2008 with an executive officer (filed as Exhibit
10(iii)(j) to the registrant’s Annual Report on Form 10-K for 2008 and
incorporated herein by reference).
|
|
*10(iii)(k)
|
Severance
Protection Plan of the registrant effective January 1, 2006 as
amended and restated as of December 31, 2008 (filed as
Exhibit 10.5 to the registrant’s Current Report on Form 8-K
dated December 31, 2008 and incorporated herein by
reference).
|
|
*10(iii)(l)
|
Notice
of Eligibility effective as of January 27, 2006 in favor of an
executive officer (filed as Exhibit 10.2 to the registrant’s Current
Report on Form 8-K dated January 27, 2006 and incorporated
herein by reference).
|
|
*10(iii)(m)
|
Notice
of Eligibility effective as of January 27, 2006 in favor of an
executive officer (filed as Exhibit 10.3 to the registrant’s Current
Report on Form 8-K dated January 27, 2006 and incorporated
herein by reference).
|
|
110
|
Overseas
Shipholding Group, Inc.
|
|
*10(iii)(n)
|
Notice
of Eligibility effective as of January 30, 2006 in favor of an
executive officer (filed as Exhibit 10(iii)(x) to the registrant’s
Annual Report on Form 10-K for 2007 and incorporated herein by
reference).
|
|
*10(iii)(o)
|
Notice
of eligibility effective as of December 31, 2008 in favor of an
executive officer (filed as Exhibit 10(iii)(o) to the registrant’s Annual
Report on Form 10-K for 2008 and incorporated herein by
reference).
|
|
*10(iii)(p)
|
Form
of Restricted Stock Award (filed as Exhibit 10.1 to the registrant’s
Current Report on Form 8-K dated January 17, 2007 and
incorporated herein by reference).
|
|
*10(iii)(q)
|
Form
of Qualified Stock Option Agreement (filed as Exhibit 10.2 to the
registrant’s Current Report on Form 8-K dated January 17, 2007
and incorporated herein by reference).
|
|
*10(iii)(r)
|
Restricted
Stock Award dated as of February 15, 2007 between registrant and an
executive officer (filed as Exhibit 10.3 to the registrant’s Current
Report on Form 8-K dated February 15, 2007 and incorporated
herein by reference).
|
|
*10(iii)(s)
|
Nonqualified
Stock Option Agreement dated as of February 15, 2007 between
registrant and an executive officer (filed as Exhibit 10.4 to the
registrant’s Current Report on Form 8-K dated February 15, 2007
and incorporated herein by reference).
|
|
*10(iii)(t)
|
Restricted
Stock Unit Award dated as of February 15, 2007 between registrant and
an executive officer (filed as Exhibit 10.5 to the registrant’s
Current Report on Form 8-K dated February 15, 2007 and
incorporated herein by reference), as amended by a letter agreement dated
December 31, 2008 (filed as Exhibit 10.2 to the registrant’s
Current Report on Form 8-K dated December 31, 2008 and
incorporated herein by reference).
|
|
*10(iii)(u)
|
Nonqualified
Stock Option Agreement dated as of February 15, 2007 between
registrant and an executive officer (filed as Exhibit 10.6 to the
registrant’s Current Report on Form 8-K dated February 15, 2007
and incorporated herein by reference).
|
|
*10(iii)(v)
|
Form
of Restricted Stock Unit (filed as Exhibit 10.1 to the registrant’s
Current Report on Form 8-K dated June 5, 2007 and incorporated
herein by reference).
|
|
*10(iii)(w)
|
Agreement
dated June 29, 2005 with an executive officer (filed as Exhibit 10 to the
registrant’s Current Report on Form 8-K dated July 6, 2005 and
incorporated herein by reference).
|
|
*10(iii)(x)
|
Enhanced
Severance Plan for Employees Level 21-23 effective as of January 1, 2009
(filed as Exhibit 10(iii)(z) to the registrant’s Annual Report on
Form 10-K for 2008 and incorporated herein by
reference).
|
|
*10(iii)(y)
|
Executive
Performance Incentive Plan dated June 1, 2004 (filed with the SEC on April
28, 2004 as Appendix B to the registrant’s Proxy Statement and
incorporated herein by reference), as amended by Amendment No. 1 dated as
of June 10, 2008 (filed as Exhibit 99 to the registrant’s Current Report
on Form 8-K dated June 10, 2008 and incorporated herein by
reference).
|
|
10(iii)(2)
|
Stock
Ownership Guidelines for Senior Management Employees Level 21 and Above
(filed as Exhibit 99.1 to the registrant’s Current Report on Form 8-K
dated January 19, 2010 and incorporated herein by
reference).
|
|
10(iii)(aa)
|
Incentive
Compensation Recoupment Policy for Executive Officers (filed as Exhibit
99.2 to the registrant’s Current Report on Form 8-K dated January 19, 2010
and incorporated herein by reference).
|
|
10(iii)(bb)
|
Form
of Performance Award (filed as Exhibit 10.1 to the registrant’s Current
Report on Form 8-K dated February 23, 2010 and incorporated herein by
reference).
|
|
**21
|
List
of subsidiaries of the registrant.
|
|
**23.1
|
Consent
of Independent Registered Public Accounting Firm of the
registrant.
|
|
2009
Annual Report
|
111
|
|
**23.2
|
Consent
of Independent Registered Public Accounting Firm of the
registrant.
|
|
**31.1
|
Certification
of Chief Executive Officer pursuant to Rule 13a-14(a) and 15d-14(a), as
amended.
|
|
**31.2
|
Certification
of Chief Financial Officer pursuant to Rule 13a-14(a) and 15d-14(a),
as amended.
|
|
**32
|
Certification
of Chief Executive Officer and Chief Financial Officer pursuant to 18
U.S.C. Section 1350, as adopted pursuant to Section 906 of the
Sarbanes-Oxley Act of 2002.
|
|
(1)
|
The
Exhibits marked with one asterisk (*) are a management contract or a
compensatory plan or arrangement required to be filed as an
exhibit.
|
|
(2)
|
The
Exhibits which have not previously been filed or listed are marked with
two asterisks (**).
|
|
112
|
Overseas
Shipholding Group, Inc.
|
SIGNATURES
Pursuant
to the requirements of Section 13 or 15(d) of the Securities Exchange Act of
1934, the Registrant has duly caused this report to be signed on its behalf by
the undersigned, thereunto duly authorized.
Date:
February 26, 2010
|
OVERSEAS
SHIPHOLDING GROUP, INC.
|
||
|
By:
|
/s/
Myles
R. Itkin
|
|
|
Myles
R. Itkin
|
||
|
Executive
Vice President,
|
||
|
Chief
Financial Officer and Treasurer
|
||
Pursuant
to the requirements of the Securities Exchange Act of 1934, this report has been
signed below by the following persons on behalf of the Registrant and in the
capacities and on the dates indicated. Each of such persons appoints Morten
Arntzen and Myles R. Itkin, and each of them, as his agents and
attorneys-in-fact, in his name, place and stead in all capacities, to sign and
file with the SEC any amendments to this report and any exhibits and other
documents in connection therewith, hereby ratifying and confirming all that such
attorneys-in-fact or either of them may lawfully do or cause to be done by
virtue of this power of attorney.
|
Name
|
Date
|
|
|
/s/
Morten
Arntzen
|
February
26, 2010
|
|
|
Morten
Arntzen, Principal
|
||
|
Executive
Officer and Director
|
||
|
/s/
Myles
R. Itkin
|
February
26, 2010
|
|
|
Myles
R. Itkin, Principal
|
||
|
Financial
Officer and
|
||
|
Principal
Accounting Officer
|
||
|
/s/
G. Allen
Andreas, III
|
February
26, 2010
|
|
|
G.
Allen Andreas, III, Director
|
||
|
/s/
Alan
R. Batkin
|
February
26, 2010
|
|
|
Alan
R. Batkin, Director
|
||
|
/s/
Thomas
B. Coleman
|
February
26, 2010
|
|
|
Thomas
B. Coleman, Director
|
||
|
/s/
Charles
A. Fribourg
|
February
26, 2010
|
|
|
Charles
A. Fribourg, Director
|
||
|
/s/
Stanley
Komaroff
|
February
26, 2010
|
|
|
Stanley
Komaroff, Director
|
||
|
/s/
Solomon
N. Merkin
|
February
26, 2010
|
|
|
Solomon
N. Merkin, Director
|
||
|
/s/
Joel
I. Picket
|
February
26, 2010
|
|
|
Joel
I. Picket, Director
|
|
2009
Annual Report
|
113
|
|
Name
|
Date
|
|
|
/s/
Ariel
Recanati
|
February
26, 2010
|
|
|
Ariel
Recanati, Director
|
||
|
/s/
Oudi
Recanati
|
February
26, 2010
|
|
|
Oudi
Recanati, Director
|
||
|
/s/
Thomas
F. Robards
|
February
26, 2010
|
|
|
Thomas
F. Robards, Director
|
||
|
/s/
Jean-paul
vettier
|
February
26, 2010
|
|
|
Jean-Paul
Vettier, Director
|
||
|
/s/
Michael
J. Zimmerman
|
February
26, 2010
|
|
|
Michael
J. Zimmerman, Director
|
|
114
|
Overseas
Shipholding Group, Inc.
|
EXHIBIT
INDEX
|
(a)(1)
|
The
following consolidated financial statements of the Company are filed in
response to Item 8.
|
|
Consolidated
Balance Sheets at December 31, 2009 and 2008.
|
|
|
Consolidated
Statements of Operations for the Years Ended December 31, 2009, 2008 and
2007.
|
|
|
Consolidated
Statements of Cash Flows for the Years Ended December 31, 2009, 2008 and
2007.
|
|
|
Consolidated
Statements of Changes in Equity for the Years Ended December 31, 2009,
2008 and 2007.
|
|
|
Notes
to Consolidated Financial Statements.
|
|
|
Reports
of Independent Registered Public Accounting Firms.
|
|
|
(a)(2)
|
Schedules
of the Company have been omitted since they are not applicable or are not
required.
|
|
(a)(3)
|
The
following exhibits are included in response to Item
15(c):
|
|
3(i)
|
Certificate
of Incorporation of the registrant, as amended to date (filed as Exhibit
3(i) to the registrant’s Quarterly Report on Form 10-Q for quarter ended
June 30, 2006 and incorporated herein by reference).
|
|
3(ii)
|
Amended
and Restated Bylaws of the Registrant (filed as Exhibit 3.1 to the
registrant’s Current Report on Form 8-K dated April 12, 2006 and
incorporated herein by reference).
|
|
4(a)(1)
|
Form
of Indenture dated as of December 1, 1993 between the registrant and The
Chase Manhattan Bank (National Association) providing for the issuance of
debt securities by the registrant from time to time (filed as Exhibit
4(b)(1) to the registrant’s Quarterly Report on Form 10-Q for the quarter
ended March 31, 2004 and incorporated herein by
reference).
|
|
4(a)(2)
|
Resolutions
dated December 2, 1993 fixing the terms of two series of debt securities
issued by the registrant under the Indenture (filed as Exhibit 4(b)(2) to
the registrant’s Quarterly Report on Form 10-Q for the quarter ended March
31, 2004 and incorporated herein by reference).
|
|
4(a)(3)
|
Form
of 83/4%
Debentures due December 1, 2013 of the registrant (filed as Exhibit
4(b)(3) to the registrant’s Quarterly Report on Form 10-Q for the quarter
ended March 31, 2004 and incorporated herein by
reference).
|
|
4(b)(1)
|
Indenture
dated as of March 7, 2003 between the registrant and Wilmington Trust
Company, as trustee, providing for the issuance of debt securities of the
registrant from time to time (filed as Exhibit 4(e)(1) to the registrant’s
Registration Statement on Form S-4 filed May 5, 2003 and incorporated
herein by reference). Such Indenture is hereby modified, effective as of
January 13, 2004, by deleting all references therein to “Wilmington Trust
Company”, “March 7, 2003” and any specific day, month and/or year and
substituting therefore blank spaces.
|
|
4(b)(2)
|
Form
of Debt Security of the registrant (filed as Exhibit 4.4 to the
registrant’s Registration Statement on Form S-3 filed January 13, 2004 and
incorporated herein by reference).
|
|
4(c)(1)
|
Credit
Agreement dated as February 9, 2006, among the registrant, OSG Bulk Ships,
Inc., OSG International, Inc., various lenders, DnB NOR Bank ASA, New York
Branch (“DnB”), as administrative agent, HSBC Securities (USA) Inc.
(“HSBC”), as documentation agent, Citigroup Global Markets Limited
(“Citigroup”) and Nordea Bank Finland, Plc, New York branch (“Nordea”), as
bookrunners, and Citigroup, DnB, HSBC and Nordea as lead arrangers (filed
as Exhibit 4(e)(6) to the registrant’s Annual Report on Form 10-K for 2005
and incorporated herein by
reference).
|
|
2009
Annual Report
|
115
|
|
4(c)(2)
|
Second
Pooled Assignment and Amendment dated as of May 10, 2006 (filed as Exhibit
4.1 to Registrant’s Current Report on Form 8-K dated May 10, 2006 and
incorporated herein by reference).
NOTE:
The Exhibits filed herewith do not include other instruments authorizing
long-term debt of the registrant and its subsidiaries, where the amounts
authorized thereunder do not exceed 10% of total assets of the registrant
and its subsidiaries on a consolidated basis. The registrant agrees to
furnish a copy of each such instrument to the Commission upon
request.
|
|
10(i)(a)
|
Exchange
Agreement dated December 9, 1969 (including exhibits thereto) between the
registrant and various parties relating to the formation of the registrant
(the form of which was filed as Exhibit 2(3) to Registration Statement No.
2-34124 and incorporated herein by reference).
|
|
10(i)(b)
|
Form
of Additional Exchange Agreement referred to in Section 2.02 of Exhibit
10(i)(a) hereto (filed as Exhibit 2(4) to Registration Statement No.
2-34124 and incorporated herein by reference).
|
|
10(i)(c)
|
Time
Charter Party relating to the Overseas Ann dated October 6, 2005 between
DHT Ann VLCC Corp. and Ann Tanker Corporation (filed as Exhibit 10.3.1 to
Double Hull Tankers, Inc.’s Registration Statement on Form F-1
(Registration No. 333-128460) and incorporated herein by reference), as
amended by Amendment No. 1 dated January 15, 2009 (filed as Exhibit
10(i)(c) to the registrant’s Annual Report on Form 10-K for 2008 and
incorporated herein by reference).
|
|
10(i)(d)
|
Time
Charter Party relating to the Overseas Chris dated October 6, 2005 between
DHT Chris VLCC Corp. and Chris Tanker Corporation (filed as Exhibit 10.3.2
to Double Hull Tankers, Inc.’s Registration Statement on Form F-1
(Registration No. 333-128460) and incorporated herein by reference, as
amended by Amendment No. 1 dated January 15, 2009 (filed as Exhibit
10(i)(d) to the registrant’s Annual Report on Form 10-K for 2008 and
incorporated herein by reference).
|
|
10(i)(e)
|
Time
Charter Party relating to the Regal Unity dated October 6, 2005 between
DHT Regal Unity VLCC Corp. and Regal Unity Tanker Corporation (filed as
Exhibit 10.3.3 to Double Hull Tankers, Inc.’s Registration Statement on
Form F-1 (Registration No. 333-128460) and incorporated herein by
reference), as amended by Amendment No. 1 dated January 15, 2009 (filed as
Exhibit 10(i)(e) to the registrant’s Annual Report on Form 10-K for 2008
and incorporated herein by reference).
|
|
10(i)(f)
|
Time
Charter Party relating to the Overseas Cathy dated October 6, 2005 between
DHT Cathy Aframax Corp. and Cathy Tanker Corporation (filed as Exhibit
10.3.4 to Double Hull Tankers, Inc.’s Registration Statement on Form F-1
(Registration No. 333-128460) and incorporated herein by reference), as
amended by Amendment No. 1 dated January 15, 2009 (filed as Exhibit
10(i)(f) to the registrant’s Annual Report on Form 10-K for 2008 and
incorporated herein by reference).
|
|
10(i)(g)
|
Time
Charter Party relating to the Overseas Sophie dated October 6, 2005
between DHT Sophie Aframax Corp. and Sophie Tanker Corporation (filed as
Exhibit 10.3.5 to Double Hull Tankers, Inc.’s Registration Statement on
Form F-1 (Registration No. 333-128460) and incorporated herein by
reference), as amended by Amendment No. 1 dated January 15, 2009 (filed as
Exhibit 10(i)(g) to the registrant’s Annual Report on Form 10-K for 2008
and incorporated herein by reference).
|
|
10(i)(h)
|
Time
Charter Party relating to the Rebecca dated October 6, 2005 between
Rebecca Aframax Corp. and Rebecca Tanker Corporation (filed as Exhibit
10.3.6 to Double Hull Tankers, Inc.’s Registration Statement on Form F-1
(Registration No. 333-128460) and incorporated herein by reference), as
amended by Amendment No. 1 dated January 15, 2009 (filed as Exhibit
10(i)(h) to the registrant’s Annual Report on Form 10-K for 2008 and
incorporated herein by reference).
|
|
10(i)(i)
|
Time
Charter Party relating to the Ania dated October 6, 2005 between DHT Ania
Aframax Corp. and Ania Aframax Corporation (filed as Exhibit 10.3.7 to
Double Hull Tankers, Inc.’s Registration Statement on Form F-1
(Registration No. 333-128460) and incorporated herein by reference), as
amended by Amendment No. 1 dated January 15, 2009 (filed as Exhibit
10(i)(i) to the registrant’s Annual Report on Form 10-K for 2008 and
incorporated herein by reference).
|
|
116
|
Overseas
Shipholding Group, Inc.
|
|
10(i)(j)
|
Charter
Framework Agreement dated October 6, 2005 between Double Hull Tankers,
Inc., OSG International, Inc. and each of the Owners and Charterers named
therein (filed as Exhibit 10.5 to Double Hull Tankers, Inc.’s Registration
Statement on Form F-1 (Registration No. 333-128460) and incorporated
herein by reference).
|
|
*10(iii)(a)
|
Supplemental
Executive Savings Plan of the registrant dated as of December 22, 2005, as
amended by Amendment One effective as of January 1, 2006 (filed as Exhibit
10(iii)(a) to the registrant’s Annual Report on Form 10-K for 2008 and
incorporated herein by reference).
|
|
*10(iii)(b)
|
1998
Stock Option Plan adopted for employees of the registrant and its
affiliates (filed as Exhibit 10 to the registrant’s Quarterly Report on
Form 10-Q for the quarter ended March 31, 1998 and incorporated herein by
reference).
|
|
*10(iii)(c)
|
Amendment
to the 1998 Stock Option Plan adopted for employees of the registrant and
its affiliates (filed as Exhibit 10 to the registrant’s Quarterly Report
on Form 10-Q for the quarter ended June 30, 2000 and incorporated herein
by reference).
|
|
*10(iii)(d)
|
1999
Non-Employee Director Stock Option Plan of the registrant (filed as
Exhibit 10(e)(4) to the registrant’s Annual Report on Form 10-K for 1998
and incorporated herein by reference), as amended by Amendment No. 1 dated
May 31, 2004 (filed as Exhibit 10 to the registrant’s Quarterly Report on
Form 10-Q for the quarter ended June 30, 2004 and incorporated herein by
reference).
|
|
*10(iii)(e)
|
Agreement
dated January 19, 2004 with an executive officer (filed as Exhibit
10(iii)(v) to the registrant’s Annual Report on Form 10-K for 2003 and
incorporated herein by reference), as amended by (i) a letter agreement
dated February 15, 2007 (filed as Exhibit 10.1 to the registrant’s Current
Report on Form 8-K dated February 15, 2007 and incorporated herein by
reference), (ii) a letter agreement dated February 15, 2007 (filed as
Exhibit 10.2 to the registrant’s Current Report on Form 8-K dated February
15, 2007 and incorporated herein by reference) and (iii) a letter
agreement dated December 31, 2008 (filed as Exhibit 10.1 to the
registrant’s Current Report on Form 8-K dated December 31, 2008 and
incorporated herein by reference).
|
|
*10(iii)(f)
|
Amended
and Restated Change of Control Agreement dated as of December 31,
2008 with an executive officer (filed as Exhibit 10.3 to the
registrant’s Current Report on Form 8-K dated December 31, 2008
and incorporated herein by reference).
|
|
*10(iii)(g)
|
Form
of Director and Officer Indemnity Agreement for the directors and officers
of the registrant (filed as Exhibit 10 to the registrant’s Quarterly
Report on Form 10-Q for the quarter ended March 31, 2004 and
incorporated herein by reference).
|
|
*10(iii)(h)
|
2004
Stock Incentive Plan of the registrant as amended and restated as of
June 10, 2008 (filed with the SEC on April 29, 2008 as
Appendix A to the registrant’s Proxy Statement and incorporated
herein by reference), as amended by Amendment No. One dated
December 30, 2008 (filed as Exhibit 10.8 to the registrant’s
Current Report on Form 8-K dated December 31, 2008 and
incorporated herein by reference).
|
|
*10(iii)(i)
|
Form
of Amended and Restated Change of Control Protection Agreement dated as of
December 31, 2008 with each of three executive officers (filed as
Exhibit 10.4 to the registrant’s Current Report on Form 8-K
dated December 31, 2008 and incorporated herein by
reference).
|
|
*10(iii)(j)
|
Form
of Amended and Restated Change of Control Agreement dated as of
December 31, 2008 with an executive officer (filed as Exhibit
10(iii)(j) to the registrant’s Annual Report on Form 10-K for 2008 and
incorporated herein by reference).
|
|
*10(iii)(k)
|
Severance
Protection Plan of the registrant effective January 1, 2006 as
amended and restated as of December 31, 2008 (filed as
Exhibit 10.5 to the registrant’s Current Report on Form 8-K
dated December 31, 2008 and incorporated herein by
reference).
|
|
*10(iii)(l)
|
Notice
of Eligibility effective as of January 27, 2006 in favor of an
executive officer (filed as Exhibit 10.2 to the registrant’s Current
Report on Form 8-K dated January 27, 2006 and incorporated
herein by reference).
|
|
*10(iii)(m)
|
Notice
of Eligibility effective as of January 27, 2006 in favor of an
executive officer (filed as Exhibit 10.3 to the registrant’s Current
Report on Form 8-K dated January 27, 2006 and incorporated
herein by reference).
|
|
2009
Annual Report
|
117
|
|
*10(iii)(n)
|
Notice
of Eligibility effective as of January 30, 2006 in favor of an
executive officer (filed as Exhibit 10(iii)(x) to the registrant’s
Annual Report on Form 10-K for 2007 and incorporated herein by
reference).
|
|
*10(iii)(o)
|
Notice
of eligibility effective as of December 31, 2008 in favor of an
executive officer (filed as Exhibit 10(iii)(o) to the registrant’s Annual
Report on Form 10-K for 2008 and incorporated herein by
reference).
|
|
*10(iii)(p)
|
Form
of Restricted Stock Award (filed as Exhibit 10.1 to the registrant’s
Current Report on Form 8-K dated January 17, 2007 and
incorporated herein by reference).
|
|
*10(iii)(q)
|
Form
of Qualified Stock Option Agreement (filed as Exhibit 10.2 to the
registrant’s Current Report on Form 8-K dated January 17, 2007
and incorporated herein by reference).
|
|
*10(iii)(r)
|
Restricted
Stock Award dated as of February 15, 2007 between registrant and an
executive officer (filed as Exhibit 10.3 to the registrant’s Current
Report on Form 8-K dated February 15, 2007 and incorporated
herein by reference).
|
|
*10(iii)(s)
|
Nonqualified
Stock Option Agreement dated as of February 15, 2007 between
registrant and an executive officer (filed as Exhibit 10.4 to the
registrant’s Current Report on Form 8-K dated February 15, 2007
and incorporated herein by reference).
|
|
*10(iii)(t)
|
Restricted
Stock Unit Award dated as of February 15, 2007 between registrant and
an executive officer (filed as Exhibit 10.5 to the registrant’s
Current Report on Form 8-K dated February 15, 2007 and
incorporated herein by reference), as amended by a letter agreement dated
December 31, 2008 (filed as Exhibit 10.2 to the registrant’s
Current Report on Form 8-K dated December 31, 2008 and
incorporated herein by reference).
|
|
*10(iii)(u)
|
Nonqualified
Stock Option Agreement dated as of February 15, 2007 between
registrant and an executive officer (filed as Exhibit 10.6 to the
registrant’s Current Report on Form 8-K dated February 15, 2007
and incorporated herein by reference).
|
|
*10(iii)(v)
|
Form
of Restricted Stock Unit (filed as Exhibit 10.1 to the registrant’s
Current Report on Form 8-K dated June 5, 2007 and incorporated
herein by reference).
|
|
*10(iii)(w)
|
Agreement
dated June 29, 2005 with an executive officer (filed as Exhibit 10 to the
registrant’s Current Report on Form 8-K dated July 6, 2005 and
incorporated herein by reference).
|
|
*10(iii)(x)
|
Enhanced
Severance Plan for Employees Level 21-23 effective as of January 1, 2009
(filed as Exhibit 10(iii)(z) to the registrant’s Annual Report on
Form 10-K for 2008 and incorporated herein by
reference).
|
|
*10(iii)(y)
|
Executive
Performance Incentive Plan dated June 1, 2004 (filed with the SEC on April
28, 2004 as Appendix B to the registrant’s Proxy Statement and
incorporated herein by reference), as amended by Amendment No. 1 dated as
of June 10, 2008 (filed as Exhibit 99 to the registrant’s Current Report
on Form 8-K dated June 10, 2008 and incorporated herein by
reference).
|
|
10(iii)(2)
|
Stock
Ownership Guidelines for Senior Management Employees Level 21 and Above
(filed as Exhibit 99.1 to the registrant’s Current Report on Form 8-K
dated January 19, 2010 and incorporated herein by
reference).
|
|
10(iii)(aa)
|
Incentive
Compensation Recoupment Policy for Executive Officers (filed as Exhibit
99.2 to the registrant’s Current Report on Form 8-K dated January 19, 2010
and incorporated herein by reference).
|
|
10(iii)(bb)
|
Form
of Performance Award (filed as Exhibit 10.1 to the registrant’s Current
Report on Form 8-K dated February 23, 2010 and incorporated herein by
reference).
|
|
**21
|
List
of subsidiaries of the registrant.
|
|
**23.1
|
Consent
of Independent Registered Public Accounting Firm of the
registrant.
|
|
118
|
Overseas
Shipholding Group, Inc.
|
|
**23.2
|
Consent
of Independent Registered Public Accounting Firm of the
registrant.
|
|
**31.1
|
Certification
of Chief Executive Officer pursuant to Rule 13a-14(a) and 15d-14(a), as
amended.
|
|
**31.2
|
Certification
of Chief Financial Officer pursuant to Rule 13a-14(a) and 15d-14(a),
as amended.
|
|
**32
|
Certification
of Chief Executive Officer and Chief Financial Officer pursuant to 18
U.S.C. Section 1350, as adopted pursuant to Section 906 of the
Sarbanes-Oxley Act of 2002.
|
|
(1)
|
The
Exhibits marked with one asterisk (*) are a management contract or a
compensatory plan or arrangement required to be filed as an
exhibit.
|
|
(2)
|
The
Exhibits which have not previously been filed or listed are marked with
two asterisks (**).
|
|
2009
Annual Report
|
119
|