Attached files
| file | filename |
|---|---|
| 8-K - 8-K - Dine Brands Global, Inc. | a11-7206_18k.htm |
| EX-99.2 - EX-99.2 - Dine Brands Global, Inc. | a11-7206_1ex99d2.htm |
| EX-99.1 - EX-99.1 - Dine Brands Global, Inc. | a11-7206_1ex99d1.htm |
Exhibit 99.3
|
|
Modeling Assumptions for the Sale of Company-Operated Applebee’s Restaurants |
|
|
Forward-Looking Information Statements contained in this presentation may constitute forward-looking statements within the meaning of the Private Securities Litigation Reform Act of 1995. These statements involve known and unknown risks, uncertainties and other factors, which may cause actual results to be materially different from those expressed or implied in such statements. These factors include, but are not limited to: the effect of general economic conditions; the Company’s substantial indebtedness; risk of future impairment charges; the Company’s results in any given period differing from guidance provided to the public; the highly competitive nature of the restaurant business, the Company’s business strategy failing to achieve anticipated results; risks associated with the restaurant industry; shortages or interruptions in the supply or delivery of food; changing health or dietary preferences; harm to our brands’ reputation; litigation; environmental liability; liability relating to employees; failure to comply with applicable laws and regulations; failure to effectively implement restaurant development plans; concentration of Applebee’s franchised restaurants in a limited number of franchisees; credit risk from IHOP franchisees operating under our previous business model; termination or non-renewal of franchise agreements; franchisees breaching their franchise agreements; inability of franchisees to fund capital expenditures; and other factors discussed from time to time in the Company’s Form 10-Q, Form 10-K and in the Company’s other filings with the Securities and Exchange Commission. The forward-looking statements contained in this release are made as of the date hereof and the Company assumes no obligation to update or supplement any forward-looking statements. |
|
|
Applebee’s Transition to More Highly Franchised Business Model The sale of company-operated Applebee’s restaurants furthers DineEquity’s strategic objective of transitioning Applebee’s into a more highly franchised restaurant system over time. The Company believes a more heavily franchised business model requires less capital investment and reduces the volatility of its cash flow performance. Additionally, cash proceeds and the transfer of lease obligations associated with the sale of Company restaurants has been and will continue to be primarily utilized to reduce the Company’s total debt. Since the acquisition of Applebee’s International in November 2007, DineEquity has completed the sale of 258 company-operated restaurants in line with its strategy to transition Applebee’s into a more highly franchised system. This, along with other debt reduction activities, has enabled us to reduce total debt by nearly $513 million as of February 25, 2011. DineEquity intends to continue its strategy to opportunistically sell company-operated Applebee’s restaurants over time and further reduce its total debt levels. As of March 3, 2011, Applebee’s has approximately 220 restaurants that remain for sale, excluding approximately 23 Company restaurants that will be kept as a test market in Kansas City, Missouri. As the credit markets improve and the economy strengthens, DineEquity believes this will create more opportunities to attract buyers of our highly valuable company-operated Applebee’s. The improving same-restaurant sales and EBITDA performance at these restaurants should enhance the Company’s ability to achieve the valuations that meet its expectations and create value for shareholders. The further sale of company-operated Applebee’s restaurants will be driven by the Company’s ability to find quality franchise operators who have access to capital and a willingness to enter into transactions at valuations that meet its expectations. DineEquity has the financial flexibility to be a patient seller and the timing of transactions will continue to be highly variable. |
|
|
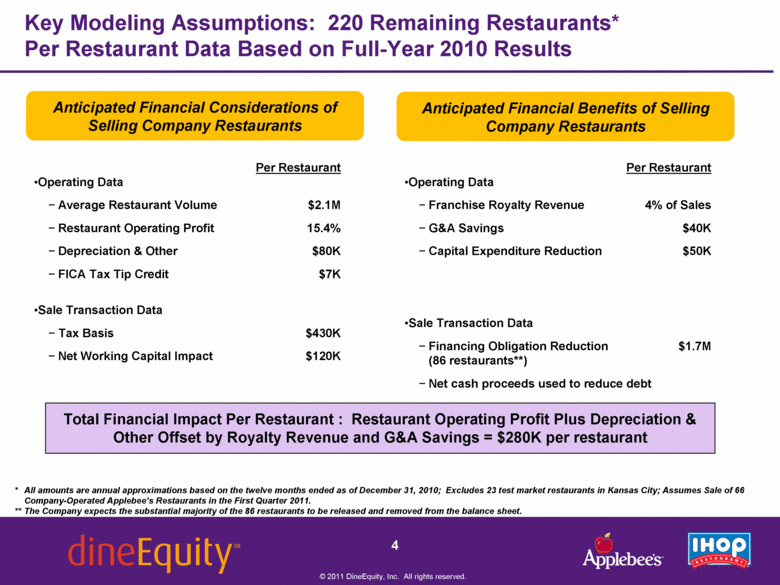
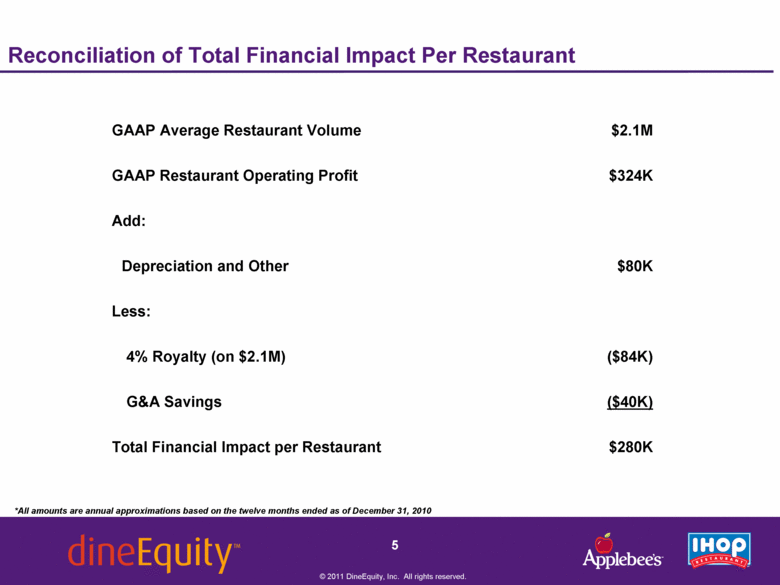
Key Modeling Assumptions: 220 Remaining Restaurants* Per Restaurant Data Based on Full-Year 2010 Results * All amounts are annual approximations based on the twelve months ended as of December 31, 2010; Excludes 23 test market restaurants in Kansas City; Assumes Sale of 66 Company-Operated Applebee’s Restaurants in the First Quarter 2011. ** The Company expects the substantial majority of the 86 restaurants to be released and removed from the balance sheet. Per Restaurant Operating Data Average Restaurant Volume $2.1M Restaurant Operating Profit 15.4% Depreciation & Other $80K FICA Tax Tip Credit $7K Sale Transaction Data Tax Basis $430K Net Working Capital Impact $120K Anticipated Financial Benefits of Selling Company Restaurants Anticipated Financial Considerations of Selling Company Restaurants Total Financial Impact Per Restaurant : Restaurant Operating Profit Plus Depreciation & Other Offset by Royalty Revenue and G&A Savings = $280K per restaurant Per Restaurant Operating Data Franchise Royalty Revenue 4% of Sales G&A Savings $40K Capital Expenditure Reduction $50K Sale Transaction Data Financing Obligation Reduction $1.7M (86 restaurants**) Net cash proceeds used to reduce debt |
|
|
Reconciliation of Total Financial Impact Per Restaurant GAAP Average Restaurant Volume $2.1M GAAP Restaurant Operating Profit $324K Add: Depreciation and Other $80K Less: 4% Royalty (on $2.1M) ($84K) G&A Savings ($40K) Total Financial Impact per Restaurant $280K *All amounts are annual approximations based on the twelve months ended as of December 31, 2010 |
|
|
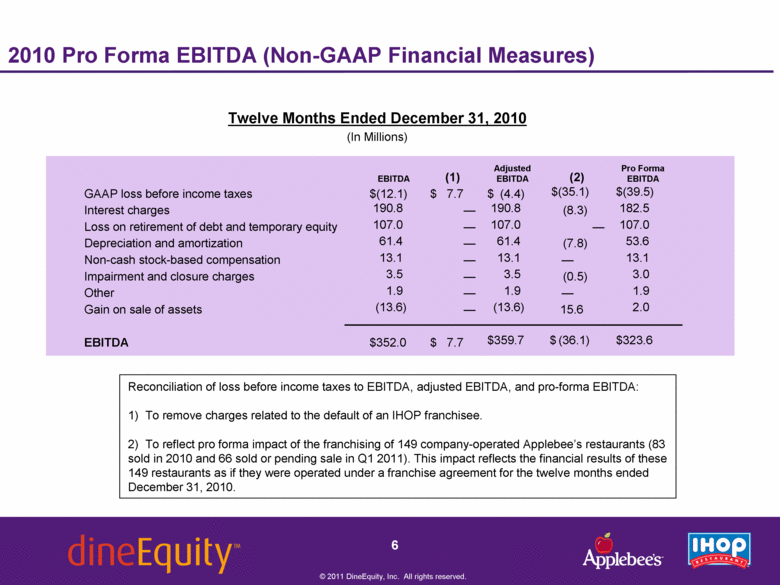
2010 Pro Forma EBITDA (Non-GAAP Financial Measures) Twelve Months Ended December 31, 2010 (In Millions) EBITDA (1) Adjusted EBITDA (2) Pro Forma EBITDA GAAP loss before income taxes $ (12.1) $ 7.7 $ (4.4) $ (35.1) $ (39.5) Interest charges 190.8 — 190.8 (8.3) 182.5 Loss on retirement of debt and temporary equity 107.0 — 107.0 — 107.0 Depreciation and amortization 61.4 — 61.4 (7.8) 53.6 Non-cash stock-based compensation 13.1 — 13.1 — 13.1 Impairment and closure charges 3.5 — 3.5 (0.5) 3.0 Other 1.9 — 1.9 — 1.9 Gain on sale of assets (13.6) — (13.6) 15.6 2.0 EBITDA $ 352.0 $ 7.7 $ 359.7 $ (36.1) $ 323.6 Reconciliation of loss before income taxes to EBITDA, adjusted EBITDA, and pro-forma EBITDA: 1) To remove charges related to the default of an IHOP franchisee. 2) To reflect pro forma impact of the franchising of 149 company-operated Applebee’s restaurants (83 sold in 2010 and 66 sold or pending sale in Q1 2011). This impact reflects the financial results of these 149 restaurants as if they were operated under a franchise agreement for the twelve months ended December 31, 2010. |
|
|
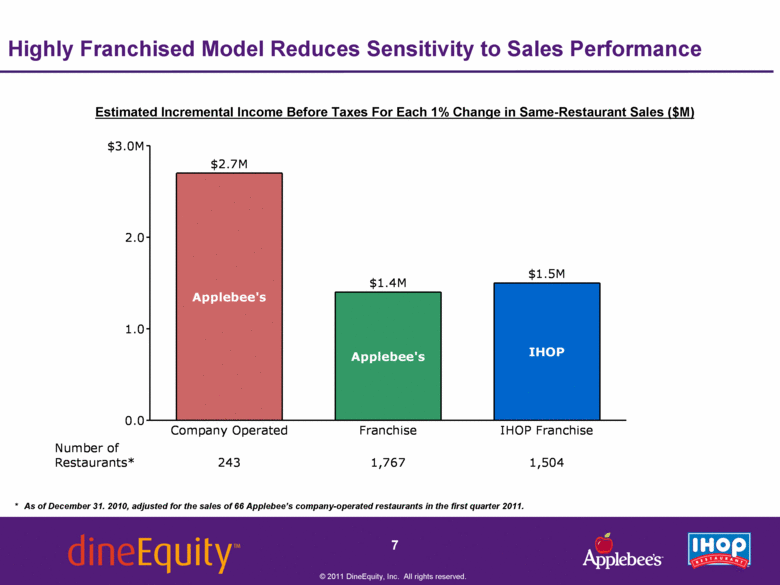
Highly Franchised Model Reduces Sensitivity to Sales Performance Estimated Incremental Income Before Taxes For Each 1% Change in Same-Restaurant Sales ($M) * As of December 31. 2010, adjusted for the sales of 66 Applebee’s company-operated restaurants in the first quarter 2011. 0.0 1.0 2.0 $3.0M Company Operated Applebee's $2.7M Franchise Applebee's $1.4M IHOP Franchise IHOP $1.5M 243 1,767 1,504 Number of Restaurants* |

