Attached files
| file | filename |
|---|---|
| 8-K - FORM 8-K - VERIFONE SYSTEMS, INC. | d8k.htm |
 Financial Results for the
Quarter Ended January 31,
2011
Exhibit 99.1 |
 Forward-Looking Statements
Today’s
discussion
may
include
“forward-looking
statements”
within
the
meaning
of
the
Private
Securities
Litigation
Reform
Act
of
1995.
Such
statements relate to future events and expectations and involve known
and unknown risks and uncertainties. VeriFone’s actual results or
actions may differ materially from those projected in the forward-looking
statements. For a summary of the specific risk factors that could cause
results to differ materially from those expressed in the forward-looking
statements, please refer to VeriFone’s filings with the Securities and
Exchange Commission, including its annual report on Form 10-K and
quarterly reports on Form 10-Q. VeriFone is under no obligation to, and
expressly disclaims any obligation to, update or alter its
forward-looking statements, whether as a result of new information,
future events, changes in assumptions or otherwise.
2
2 |
 Important Information
In connection with the proposed Hypercom transaction, VeriFone has filed with
the Securities and Exchange Commission (“SEC”) a registration statement on
Form S-4 that includes a proxy statement/prospectus relating to the proposed
transaction. Investors are urged to read the form S-4 and proxy
statement/prospectus (and all amendments and supplements thereto) and any
other relevant documents filed with the SEC because they contain important
information about VeriFone, Hypercom and the proposed transaction. You can
obtain copies of the S-4 and proxy statement/prospectus, as well as
VeriFone’s other filings, free of charge at the website maintained by the SEC
at www.sec.gov. In addition, you may obtain documents filed with
the SEC by VeriFone free of charge by visiting our website (www.verifone.com) or by
directing a request in writing to: VeriFone, Attention: Investor Relations, 2099
Gateway Place, Suite 600, San Jose, CA 95110, by phone to (408) 232-7979
or by e-mail to ir@verifone.com. You may obtain documents filed with the
SEC by Hypercom free of charge at Hypercom’s website
(www.hypercom.com) or by directing a request in writing to Hypercom
Corporation, Attention: Investor Relations, 8888 East Raintree Drive, Suite 300, Scottsdale,
Arizona 85260, by phone to (480) 642-5000, or by e-mail to stsujita@hypercom.com. 3
3 |
 Non-GAAP Financial Measures
With respect to any Non-GAAP financial measures presented in the
information, reconciliations of Non-GAAP to GAAP financial measures
may be found in VeriFone’s quarterly earnings release as filed with the
Securities and Exchange Commission. Management uses Non-GAAP
financial measures only in addition to and in conjunction with results
presented in accordance with GAAP. Management believes that these
Non-GAAP financial measures help it to evaluate VeriFone’s
performance and to compare VeriFone’s current results with those for
prior periods as well as with the results of peer companies. These Non-
GAAP financial measures contain limitations and should be considered
as a supplement to, and not as a substitute for, or superior to,
disclosures made in accordance with GAAP.
4
4 |
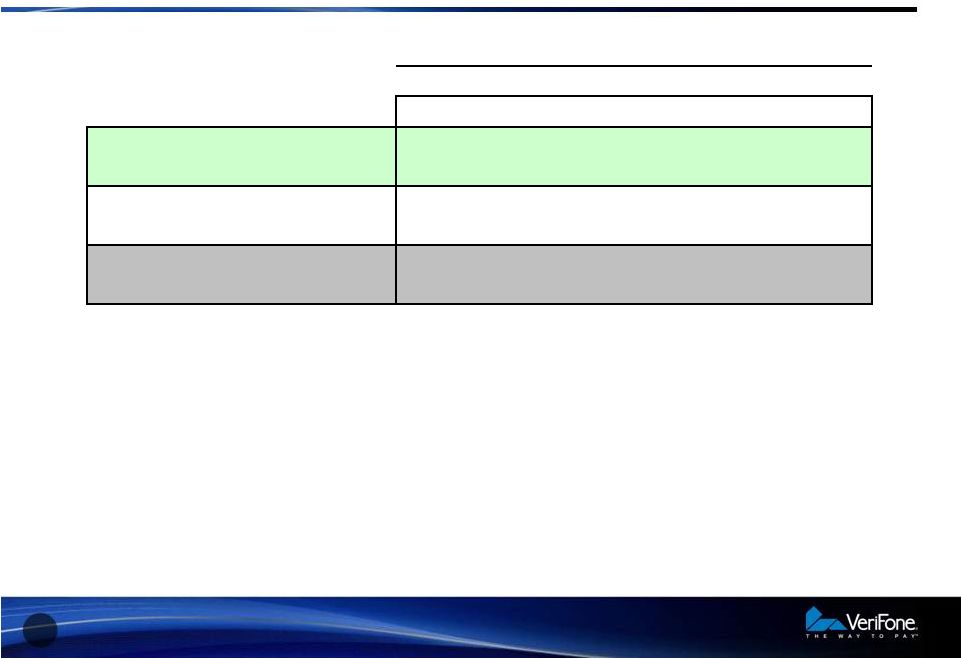
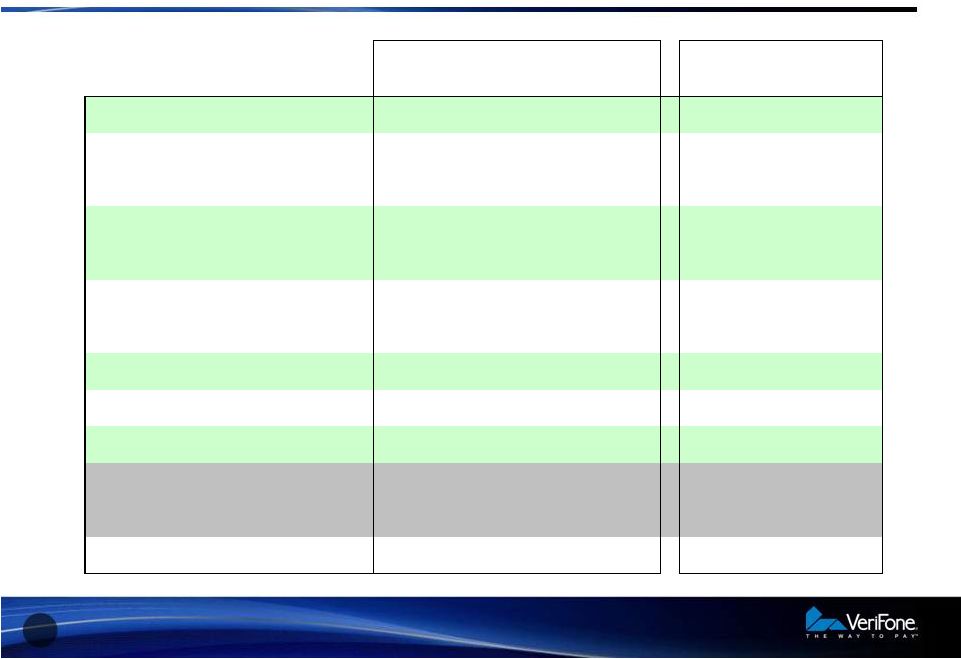 Non-GAAP Profit & Loss Overview
5
5
($ in thousands, except EPS)
Q110
Q410
Q111
% SEQ
Inc(Dec)
% YoY
Inc(Dec)
Revenue
223,400
276,000
283,940
2.9%
27.1%
Gross Margin
87,631
110,262
116,944
6.1%
33.5%
Gross Margin %
39.2%
40.0%
41.2%
Operating Expense
51,911
61,697
63,990
3.7%
23.3%
Operating Expense %
23.2%
22.4%
22.5%
Operating Profit
35,720
48,565
52,954
9.0%
48.2%
Operating Margin %
16.0%
17.6%
18.6%
Net Interest and Other
(4,451)
(3,388)
(3,529)
4.2%
-20.7%
Pre-tax Profit
31,269
45,177
49,425
9.4%
58.1%
Taxes
8,755
9,035
9,885
9.4%
12.9%
Net Income
22,514
36,142
39,540
9.4%
75.6%
Net Income %
10.1%
13.1%
13.9%
EPS
0.26
0.40
0.43
7.5%
65.4%
Q111 |
 6
6
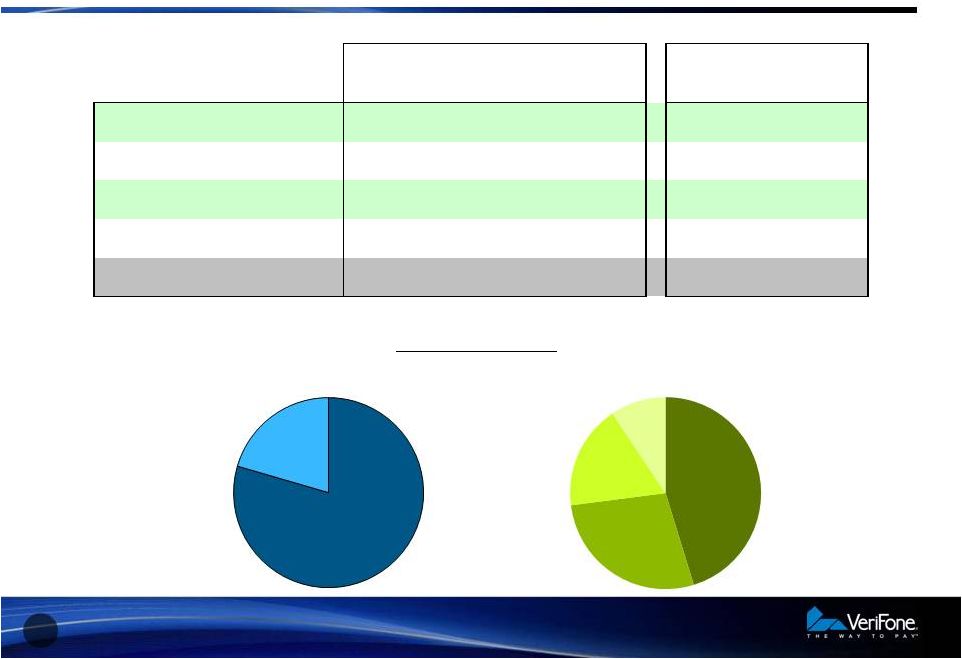
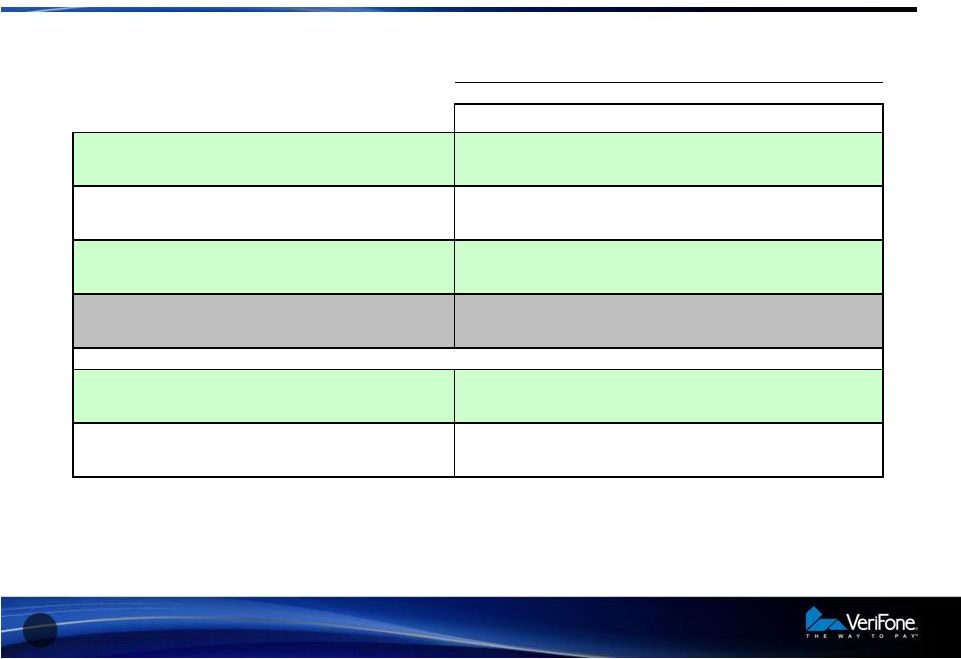
Non-GAAP Revenue Profile
Services
20.5%
System
Solutions
79.5%
Q111 Revenue
LAC
17.7%
NA
45.2%
Asia
9.4%
Europe
27.7%
($ in thousands)
Q110
Q410
Q111
% SEQ
Inc(Dec)
% YoY
Inc(Dec)
North America
89,613
122,139
128,479
5.2%
43.4%
Europe
69,374
70,165
78,707
12.2%
13.5%
Latin America
40,623
53,887
50,131
-7.0%
23.4%
Asia
23,790
29,809
26,623
-10.7%
11.9%
Total
223,400
276,000
283,940
2.9%
27.1%
Q111 |
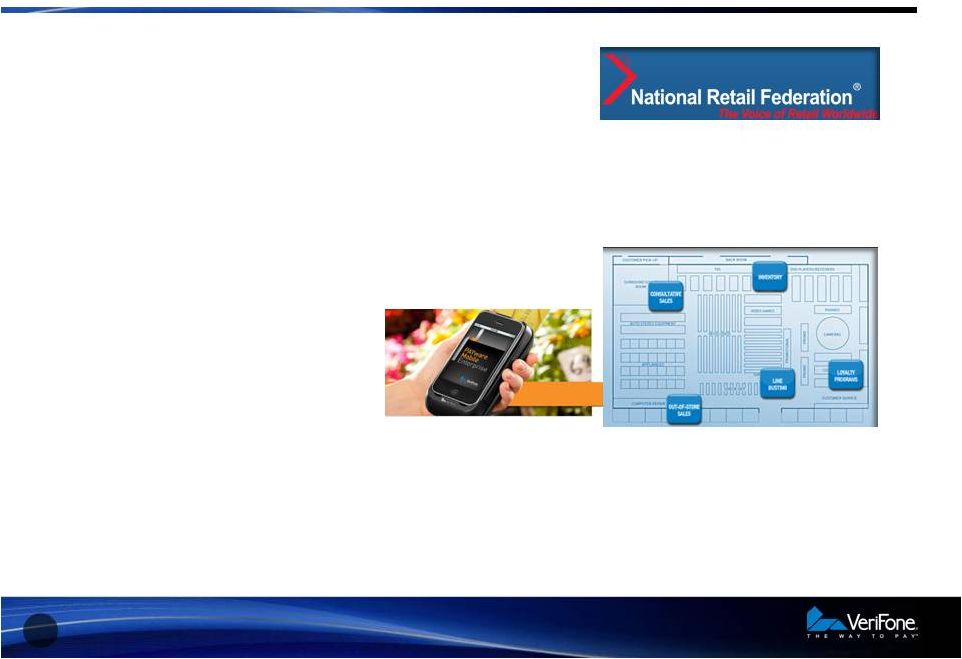 PAYware
Mobile Enterprise •
Selected as Top 5 New Technology for
2011 by National Retail Federation
•
Securely Enables Multiple New Mobile Services for Large Retailers
–
Roaming POS
–
Personal Shopping
–
Out of Store Sales
–
Inventory Control
–
Loyalty Programs
•
PCI-Approved Mobile Solution Incorporating End-to-End Encryption
and Tokenization for Use with Smart Mobile Devices
7
7 |
 Financial Results and
Guidance
8
8 |
 Non-GAAP Gross Margin Review
9
9
Q110
Q410
Q111
System Solutions
39.0%
38.7%
40.1%
Services
40.5%
46.0%
45.3%
Total
39.2%
40.0%
41.2%
% of Revenue |
 Non-GAAP Operating Expenses
10
10
Q110
Q410
Q111
Research and Development
7.2%
7.1%
7.3%
Sales and Marketing
8.3%
8.7%
8.8%
G&A
7.7%
6.6%
6.4%
Total
23.2%
22.4%
22.5%
Non-GAAP Operating Expenses as
Reported ($M)
51.9
61.7
64.0
Non-GAAP Operating Expenses,
Constant Currency ($M)
52.2
62.3
64.0
% of Revenue |
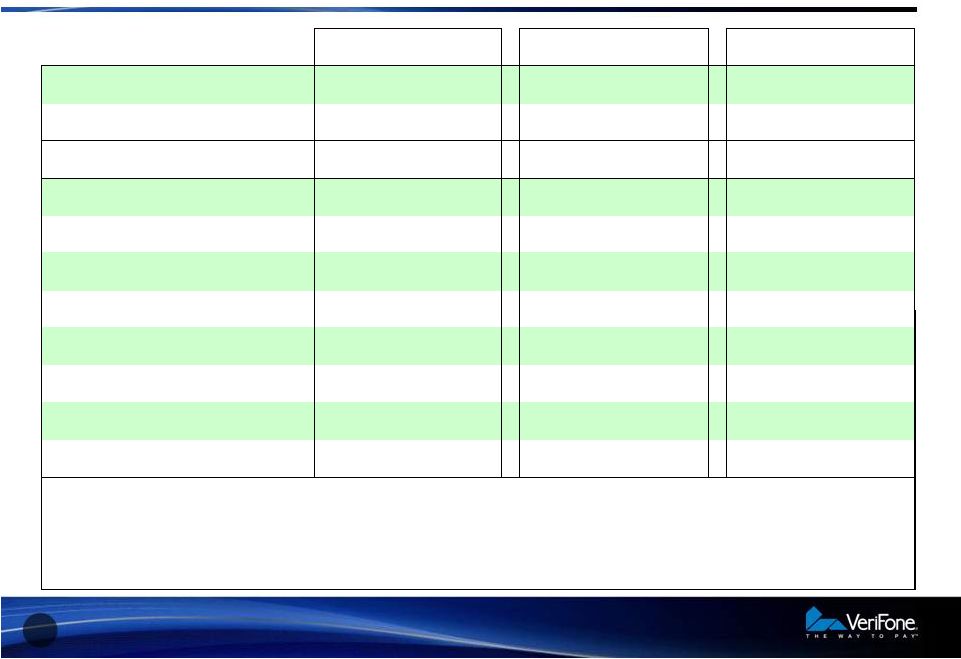 Cash
Flow and Balance Sheet 11
11
($ in thousands, except Days)
$
$
$
Cash Flow from Operations before
Changes in Working Capital
34,324
51,716
50,800
Cash Flow from Operations
55,316
54,038
30,409
Key Balance Sheet Items:
Cash
374,617
445,137
479,167
Accounts Receivables, net
152,471
64
132,988
46
164,830
54
Accounts Receivables Reserves
(3,813)
(5,862)
(5,771)
Inventories, net
94,496
63
111,901
61
112,084
60
Inventories Reserves
(29,485)
(23,257)
(27,294)
Accounts Payable
88,194
58
64,016
35
77,596
42
Deferred Revenue, net
66,366
77,607
78,494
Note: Accounts Receivable Days Sales Outstanding is
calculated based on Gross Accounts Receivable Net of Reserve for Product
Returns. Days in Inventory is calculated as Average Net Inventory divided by
Total Cost of Goods Sold. Days in Accounts Payable is calculated as Accounts
Payable divided by Total Cost of Goods Sold. Q111
Days
Q110
Days
Q410
Days |
 Guidance
•
For the second quarter ending April 30, 2011, VeriFone expects net
revenues to be between $280 million and $284 million. Non-GAAP
net income per share is projected to be in the range of $0.42 to
$0.43.
•
For the full year of fiscal 2011, VeriFone expects net revenues to be
between $1,150 million and $1,160 million. Non-GAAP net income
per share is projected to be in the range of $1.75 to $1.80 for the
same time period.
12
12 |
 13
13
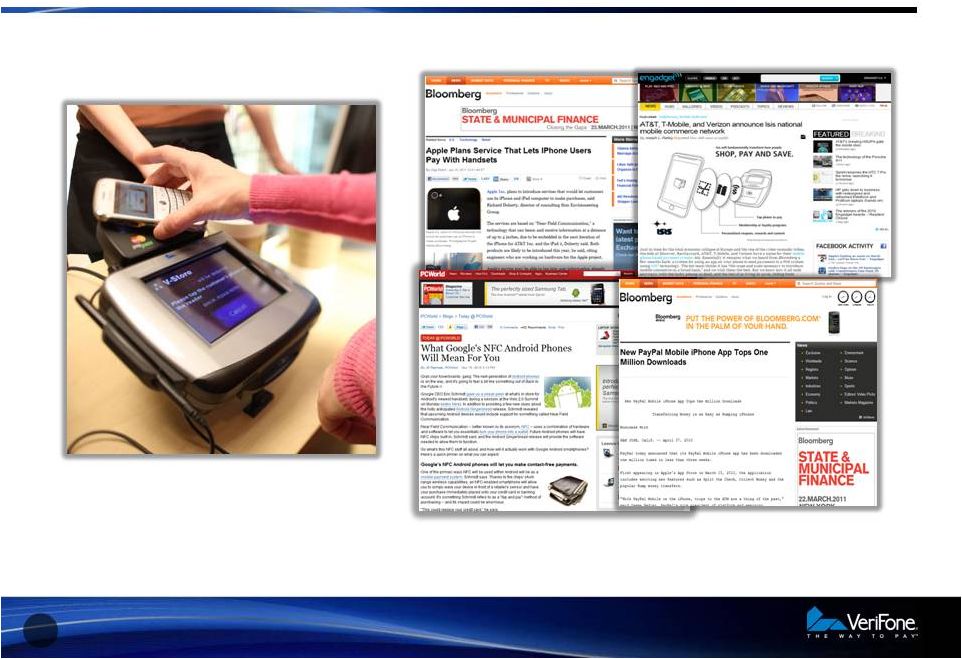
NFC Enabled Mobile Commerce Gaining Momentum |
 Fundamental Rules for the Success of Mobile Commerce
1.
The point of sale becomes the hub of systems complexity
2.
Consumers
must
see
“real
value”
from
these
new
ways
to
pay
3.
Retailers will not tolerate special purpose lanes for smart-phone shoppers
4.
Mobile commerce must be ubiquitous to be successful
5.
Plastic cards won’t disappear any time soon
6.
Security must be ironclad
14
14 |
 15
15
Financial Results for the
Quarter Ended January 31,
2011 |
VERIFONE SYSTEMS, INC. AND SUBSIDIARIES
RECONCILIATIONS OF CERTAIN NON-GAAP FINANCIAL MEASURES
(IN THOUSANDS, EXCEPT PER SHARE DATA AND PERCENTAGES)
(UNAUDITED)
| Three Months Ended January 31, | ||||||||
| 2011 | 2010 | |||||||
| GAAP Net revenues - System Solutions |
$ | 225,707 | $ | 188,014 | ||||
| Amortization of step-down in deferred revenue on acquisition |
— | — | ||||||
| Non-GAAP Net revenues - System Solutions |
$ | 225,707 | $ | 188,014 | ||||
| GAAP Net revenues - Services |
$ | 58,058 | $ | 35,386 | ||||
| Amortization of step-down in deferred revenue on acquisition |
175 | — | ||||||
| Non-GAAP Net revenues - Services |
$ | 58,233 | $ | 35,386 | ||||
| GAAP Net revenues |
$ | 283,765 | $ | 223,400 | ||||
| Amortization of step-down in deferred revenue on acquisition |
175 | — | ||||||
| Non-GAAP Net revenues |
$ | 283,940 | $ | 223,400 | ||||
| GAAP Cost of net revenues - System Solutions |
$ | 140,140 | $ | 120,085 | ||||
| Stock-based compensation |
(351 | ) | (340 | ) | ||||
| Acquisition related and Restructuring costs |
(26 | ) | (134 | ) | ||||
| Amortization of purchased intangible assets |
(4,636 | ) | (4,893 | ) | ||||
| Non-GAAP Cost of net revenues - System Solutions |
$ | 135,127 | $ | 114,718 | ||||
| GAAP Cost of net revenues - Services |
$ | 32,134 | $ | 21,409 | ||||
| Stock-based compensation |
(47 | ) | (54 | ) | ||||
| Acquisition related and Restructuring costs |
5 | (95 | ) | |||||
| Amortization of purchased intangible assets |
(223 | ) | (209 | ) | ||||
| Non-GAAP Cost of net revenues - Services |
$ | 31,869 | $ | 21,051 | ||||
| GAAP Gross profit - System Solutions |
$ | 85,567 | $ | 67,929 | ||||
| Amortization of step-down in deferred revenue on acquisition |
— | — | ||||||
| Stock-based compensation |
351 | 340 | ||||||
| Acquisition related and Restructuring costs |
26 | 134 | ||||||
| Amortization of purchased intangible assets |
4,636 | 4,893 | ||||||
| Non-GAAP Gross profit - System Solutions |
$ | 90,580 | $ | 73,296 | ||||
| GAAP System Solutions gross margins |
37.9 | % | 36.1 | % | ||||
| Amortization of step-down in deferred revenue on acquisition as a % of System Solutions net revenues |
0.0 | % | 0.0 | % | ||||
| Stock-based compensation as a % of System Solutions net revenues |
0.2 | % | 0.2 | % | ||||
| Acquisition related and Restructuring costs as a % of System Solutions net revenues |
0.0 | % | 0.1 | % | ||||
| Amortization of purchased intangible assets as a % of System Solutions net revenues |
2.1 | % | 2.6 | % | ||||
| Non-GAAP System Solutions gross margins |
40.1 | % | 39.0 | % | ||||
| GAAP Gross profit - Services |
$ | 25,924 | $ | 13,977 | ||||
| Amortization of step-down in deferred revenue on acquisition |
175 | — | ||||||
| Stock-based compensation |
47 | 54 | ||||||
| Acquisition related and Restructuring costs |
(5 | ) | 95 | |||||
| Amortization of purchased intangible assets |
223 | 209 | ||||||
| Non-GAAP Gross profit - Services |
$ | 26,364 | $ | 14,335 | ||||
VERIFONE SYSTEMS, INC. AND SUBSIDIARIES
RECONCILIATIONS OF CERTAIN NON-GAAP FINANCIAL MEASURES
(IN THOUSANDS, EXCEPT PER SHARE DATA AND PERCENTAGES)
(UNAUDITED)
| Three Months Ended January 31, | ||||||||
| 2011 | 2010 | |||||||
| GAAP Services gross margins |
44.7 | % | 39.5 | % | ||||
| Amortization of step-down in deferred revenue on acquisition as a % of Services net revenues |
0.3 | % | 0.0 | % | ||||
| Stock-based compensation as a % of Services net revenues |
0.1 | % | 0.2 | % | ||||
| Acquisition related and Restructuring costs as a % of Services net revenues |
0.0 | % | 0.3 | % | ||||
| Amortization of purchased intangible assets as a % of Services net revenues |
0.4 | % | 0.6 | % | ||||
| Non-GAAP Services gross margins |
45.3 | % | 40.5 | % | ||||
| GAAP Gross profit |
$ | 111,491 | $ | 81,906 | ||||
| Amortization of step-down in deferred revenue on acquisition |
175 | — | ||||||
| Stock-based compensation |
398 | 394 | ||||||
| Acquisition related and Restructuring costs |
21 | 229 | ||||||
| Amortization of purchased intangible assets |
4,859 | 5,102 | ||||||
| Non-GAAP Gross profit |
$ | 116,944 | $ | 87,631 | ||||
| GAAP Gross margins |
39.3 | % | 36.7 | % | ||||
| Amortization of step-down in deferred revenue on acquisition as a % of net revenues |
0.1 | % | 0.0 | % | ||||
| Stock-based compensation as a % of net revenues |
0.1 | % | 0.2 | % | ||||
| Acquisition related and Restructuring costs as a % of net revenues |
0.0 | % | 0.1 | % | ||||
| Amortization of purchased intangible assets as a % of net revenues |
1.7 | % | 2.3 | % | ||||
| Non-GAAP Gross margins |
41.2 | % | 39.2 | % | ||||
| GAAP Research and development |
$ | 21,642 | $ | 17,100 | ||||
| Stock-based compensation |
(876 | ) | (937 | ) | ||||
| Acquisition related and Restructuring costs |
(4 | ) | — | |||||
| Non-GAAP Research and development |
$ | 20,762 | $ | 16,163 | ||||
| GAAP Sales and marketing |
$ | 28,306 | $ | 20,475 | ||||
| Stock-based compensation |
(3,030 | ) | (1,825 | ) | ||||
| Acquisition related and Restructuring costs |
(167 | ) | — | |||||
| Non-GAAP Sales and marketing |
$ | 25,109 | $ | 18,650 | ||||
| GAAP General and administrative and amortization of purchased intangible assets |
$ | 26,332 | $ | 24,973 | ||||
| Stock-based compensation |
(3,138 | ) | (1,527 | ) | ||||
| Other charges - SOX remediation |
— | (1,094 | ) | |||||
| Acquisition related and Restructuring costs |
(2,759 | ) | (762 | ) | ||||
| Amortization of purchased intangible assets |
(2,316 | ) | (4,492 | ) | ||||
| Non-GAAP General and administrative |
$ | 18,119 | $ | 17,098 | ||||
VERIFONE SYSTEMS, INC. AND SUBSIDIARIES
RECONCILIATIONS OF CERTAIN NON-GAAP FINANCIAL MEASURES
(IN THOUSANDS, EXCEPT PER SHARE DATA AND PERCENTAGES)
(UNAUDITED)
| Three Months Ended January 31, | ||||||||
| 2011 | 2010 | |||||||
| GAAP Operating expenses |
$ | 76,280 | $ | 62,548 | ||||
| Stock-based compensation |
(7,044 | ) | (4,289 | ) | ||||
| Other charges - SOX remediation |
— | (1,094 | ) | |||||
| Acquisition related and Restructuring costs |
(2,930 | ) | (762 | ) | ||||
| Amortization of purchased intangible assets |
(2,316 | ) | (4,492 | ) | ||||
| Non-GAAP Operating expenses |
$ | 63,990 | $ | 51,911 | ||||
| GAAP Operating income |
$ | 35,211 | $ | 19,358 | ||||
| Amortization of step-down in deferred revenue on acquisition |
175 | — | ||||||
| Stock-based compensation |
7,442 | 4,683 | ||||||
| Other charges - SOX remediation |
— | 1,094 | ||||||
| Acquisition related and Restructuring costs |
2,951 | 991 | ||||||
| Amortization of purchased intangible assets |
7,175 | 9,594 | ||||||
| Non-GAAP Operating income |
$ | 52,954 | $ | 35,720 | ||||
| GAAP Operating margin |
12.4 | % | 8.7 | % | ||||
| Amortization of step-down in deferred revenue on acquisition as a % of net revenues |
0.1 | % | 0.0 | % | ||||
| Stock-based compensation as a % of net revenues |
2.6 | % | 2.1 | % | ||||
| Other charges - SOX remediation as a % of net revenues |
0.0 | % | 0.5 | % | ||||
| Acquisition related and Restructuring costs as a % of net revenues |
1.0 | % | 0.4 | % | ||||
| Amortization of purchased intangible assets as a % of net revenues |
2.5 | % | 4.3 | % | ||||
| Non-GAAP Operating margin |
18.6 | % | 16.0 | % | ||||
| GAAP Interest expense |
$ | (7,570 | ) | $ | (7,254 | ) | ||
| Acquisition related interest charges |
466 | 414 | ||||||
| Non-cash interest expense |
3,819 | 3,571 | ||||||
| Non-GAAP Interest expense |
$ | (3,285 | ) | $ | (3,269 | ) | ||
| GAAP Interest income |
$ | 283 | $ | 296 | ||||
| Non-GAAP Interest income |
$ | 283 | $ | 296 | ||||
| GAAP Other income (expense), net |
$ | 1,651 | $ | (1,760 | ) | |||
| Other charges - acquisitions related and other |
(2,178 | ) | 343 | |||||
| Gain on debt extinguishment |
— | (61 | ) | |||||
| Non-GAAP Other expense, net |
$ | (527 | ) | $ | (1,478 | ) | ||
VERIFONE SYSTEMS, INC. AND SUBSIDIARIES
RECONCILIATIONS OF CERTAIN NON-GAAP FINANCIAL MEASURES
(IN THOUSANDS, EXCEPT PER SHARE DATA AND PERCENTAGES)
(UNAUDITED)
| Three Months Ended January 31, | ||||||||
| 2011 | 2010 | |||||||
| Non-GAAP Income before income taxes |
$ | 49,425 | $ | 31,269 | ||||
| GAAP Provision for (benefit from) income taxes |
$ | (2,456 | ) | $ | 19 | |||
| Income tax effect of non-GAAP exclusions |
12,341 | 8,736 | ||||||
| Non-GAAP Provision for income taxes (1) |
$ | 9,885 | $ | 8,755 | ||||
| Non-GAAP Income tax rate (1) |
20 | % | 28 | % | ||||
| GAAP Net income |
$ | 32,031 | $ | 10,621 | ||||
| Amortization of step-down in deferred revenue on acquisition |
175 | — | ||||||
| Stock-based compensation |
7,442 | 4,683 | ||||||
| Other charges - SOX remediation, acquisitions related and other |
(1,712 | ) | 1,851 | |||||
| Acquisition related and Restructuring costs |
2,951 | 991 | ||||||
| Amortization of purchased intangible assets |
7,175 | 9,594 | ||||||
| Non-cash interest expense |
3,819 | 3,571 | ||||||
| Gain on debt extinguishment |
— | (61 | ) | |||||
| Income tax effect of non-GAAP exclusions |
(12,341 | ) | (8,736 | ) | ||||
| Total Non-GAAP Net income |
$ | 39,540 | $ | 22,514 | ||||
| Non-GAAP Net income per share: |
||||||||
| Basic |
$ | 0.45 | $ | 0.27 | ||||
| Diluted |
$ | 0.43 | $ | 0.26 | ||||
| Weighted average shares used in computing Non-GAAP net income per share: |
||||||||
| Basic |
87,090 | 84,690 | ||||||
| Diluted |
91,321 | 86,610 | ||||||
| GAAP Net income as a % of net revenues |
11.3 | % | 4.8 | % | ||||
| Amortization of step-down in deferred revenue on acquisition as a % of net revenues |
0.1 | % | 0.0 | % | ||||
| Stock-based compensation as a % of net revenues |
2.6 | % | 2.1 | % | ||||
| Other charges - SOX remediation, acquisitions related and other as a % of net revenues |
-0.6 | % | 0.8 | % | ||||
| Acquisition related and Restructuring costs as a % of net revenues |
1.0 | % | 0.4 | % | ||||
| Amortization of purchased intangible assets as a % of net revenues |
2.5 | % | 4.3 | % | ||||
| Non-cash interest expense as a % of net revenues |
1.3 | % | 1.6 | % | ||||
| Gain on debt extinguishment as a % of net revenues |
0.0 | % | 0.0 | % | ||||
| Income tax effect of non-GAAP exclusions as a % of net revenues |
-4.3 | % | -3.9 | % | ||||
| Total Non-GAAP Net income as a % of non-GAAP net revenues |
13.9 | % | 10.1 | % | ||||
| (1) | The Non-GAAP tax rate used in our Non-GAAP reconciliation was changed beginning the fiscal third quarter 2010 from 28% to 20%. |