Attached files
| file | filename |
|---|---|
| 8-K - FORM 8-K - SELECT MEDICAL HOLDINGS CORP | c13310e8vk.htm |
Exhibit 99.1
| J.P. Morgan Global High Yield & Leveraged Finance ConferenceFebruary 28, 2011 |

| Disclosure This presentation may contain forward-looking statements based on current management expectations. Numerous factors, including those related to market conditions and those detailed from time-to-time in the Company's filings with the Securities and Exchange Commission, may cause results to differ materially from those anticipated in the forward-looking statements. Many of the factors that will determine the Company's future results are beyond the ability of the Company to control or predict. These statements are subject to risks and uncertainties and, therefore, actual results may differ materially. Readers should not place undue reliance on forward-looking statements, which reflect management's views only as of the date hereof. The Company undertakes no obligation to revise or update any forward-looking statements, or to make any other forward-looking statements, whether as a result of new information, future events or otherwise. All references to "Select" used throughout this presentation refer to Select Medical Holdings Corporation and its subsidiaries. |
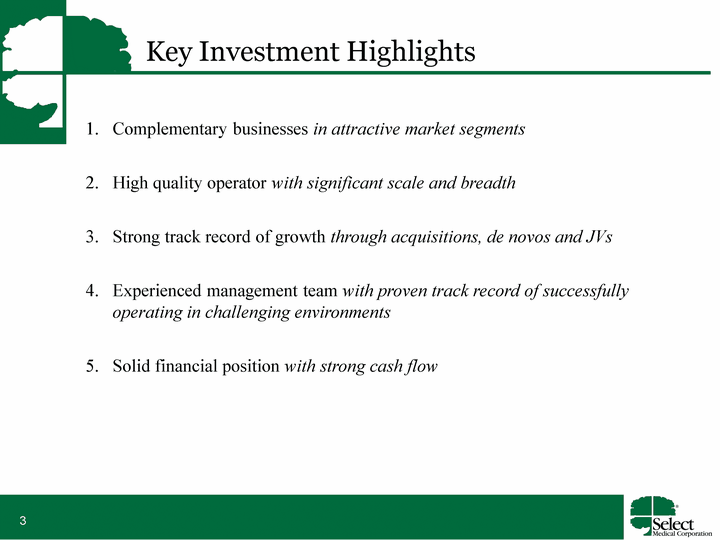
| Key Investment Highlights Complementary businesses in attractive market segmentsHigh quality operator with significant scale and breadth Strong track record of growth through acquisitions, de novos and JVsExperienced management team with proven track record of successfully operating in challenging environmentsSolid financial position with strong cash flow |
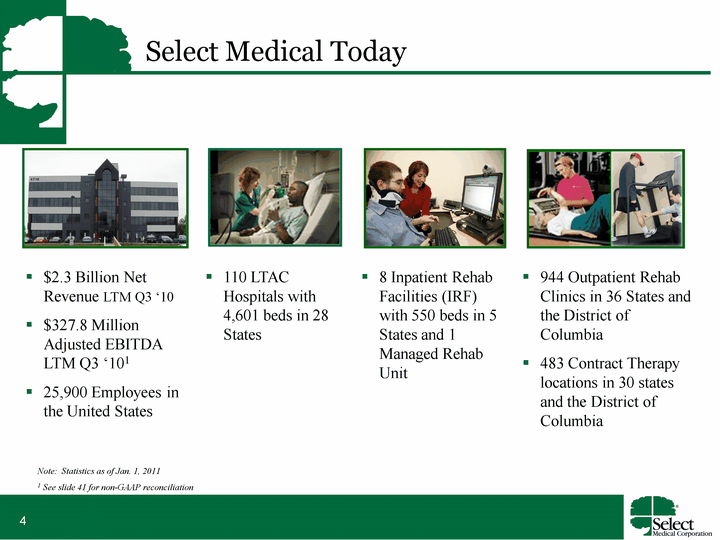
| Select Medical Today 110 LTAC Hospitals with 4,601 beds in 28 States 944 Outpatient Rehab Clinics in 36 States and the District of Columbia483 Contract Therapy locations in 30 states and the District of Columbia $2.3 Billion Net Revenue LTM Q3 '10$327.8 Million Adjusted EBITDA LTM Q3 '10125,900 Employees in the United States 8 Inpatient Rehab Facilities (IRF) with 550 beds in 5 States and 1 Managed Rehab Unit Note: Statistics as of Jan. 1, 20111 See slide 41 for non-GAAP reconciliation |
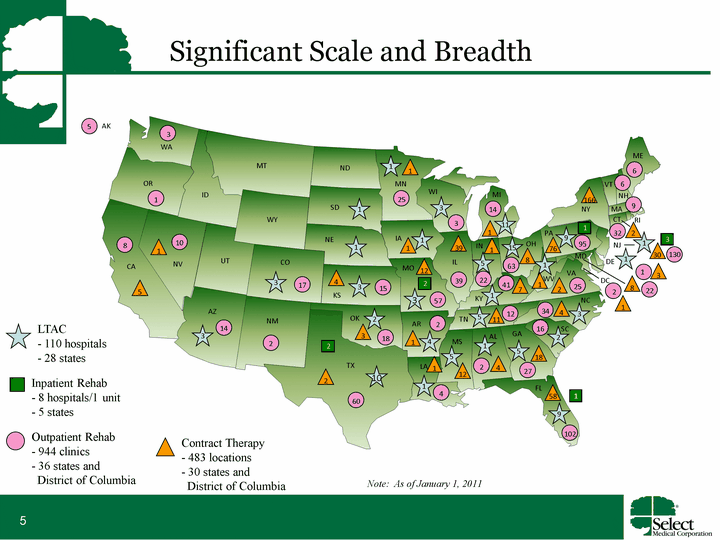
| Contract Therapy 483 locations 30 states and District of Columbia Note: As of January 1, 2011 Outpatient Rehab 944 clinics 36 states and District of Columbia LTAC 110 hospitals 28 states Inpatient Rehab 8 hospitals/1 unit 5 states Significant Scale and Breadth WA OR CA MT ID NV AZ WY UT CO NM TX ND SD NE KS OK MN LA AR IA WI MI MS IN FL GA SC NC TN KY OH PA VT ME NH NJ AL IL VA WV DE NH MA CT NY MO 1 3 4 3 1 9 5 5 1 3 1 5 3 1 1 3 15 2 9 5 10 1 3 3 102 58 76 95 1 39 14 30 1 12 18 27 8 73 MD DC 2 22 8 166 4 2 5 34 2 60 1 11 14 11 5 AK 17 63 22 41 15 4 6 9 25 57 8 10 6 2 18 1 16 12 25 3 3 1 4 2 39 2 1 3 ME 4 1 2 2 3 7 1 1 12 RI 2 32 1 1 1 1 2 1 1 130 1 |
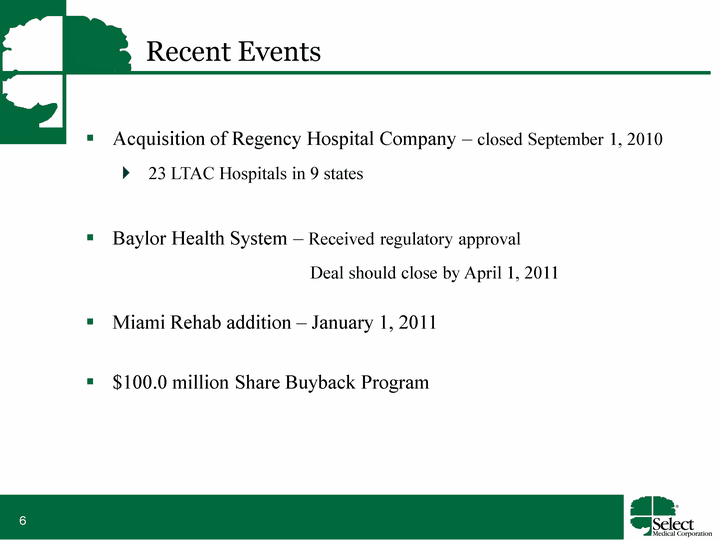
| Recent Events Acquisition of Regency Hospital Company - closed September 1, 201023 LTAC Hospitals in 9 statesBaylor Health System - Received regulatory approval Deal should close by April 1, 2011 $100.0 million Share Buyback Program Miami Rehab addition - January 1, 2011 |
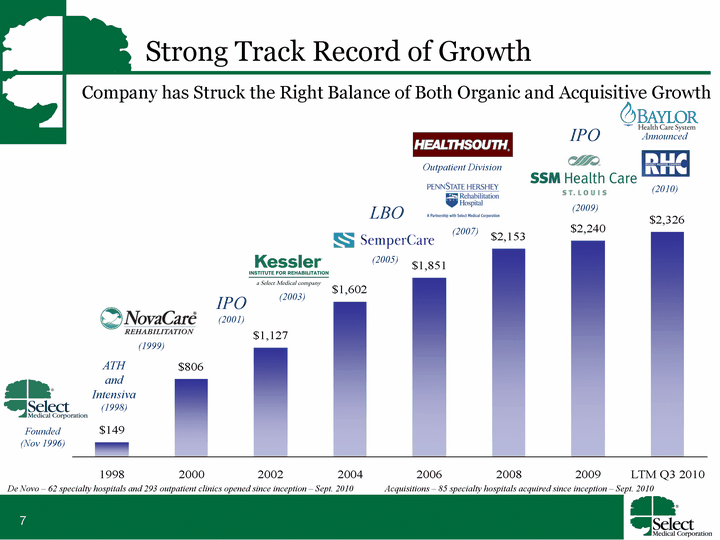
| 1998 2000 2002 2004 2006 2008 2009 LTM Q3 2010 149 806 1127 1602 1851 2153 2240 2326 (2003) (1999) Strong Track Record of Growth Company has Struck the Right Balance of Both Organic and Acquisitive Growth De Novo - 62 specialty hospitals and 293 outpatient clinics opened since inception - Sept. 2010 Acquisitions - 85 specialty hospitals acquired since inception - Sept. 2010 ATHandIntensiva(1998) LBO Outpatient Division IPO (2001) Founded (Nov 1996) (2005) IPO (2009) (2010) (2007) Announced |

| Business Strategy |
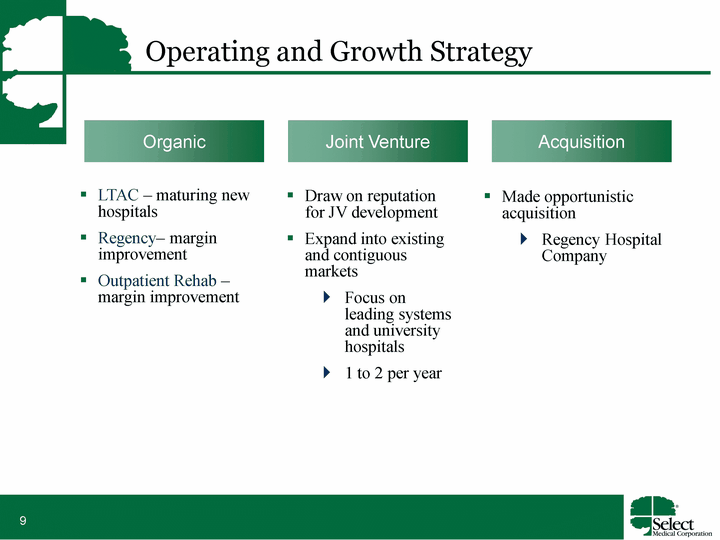
| Operating and Growth Strategy Organic Joint Venture Acquisition LTAC - maturing new hospitalsRegency- margin improvementOutpatient Rehab - margin improvement Draw on reputation for JV developmentExpand into existing and contiguous marketsFocus on leading systems and university hospitals1 to 2 per year Made opportunistic acquisitionRegency Hospital Company |

| Operating Segments Specialty HospitalsLTACHsInpatient RehabilitationOutpatient RehabilitationOutpatient Rehab ClinicsContract Therapy |
| Specialty HospitalsLTACH |
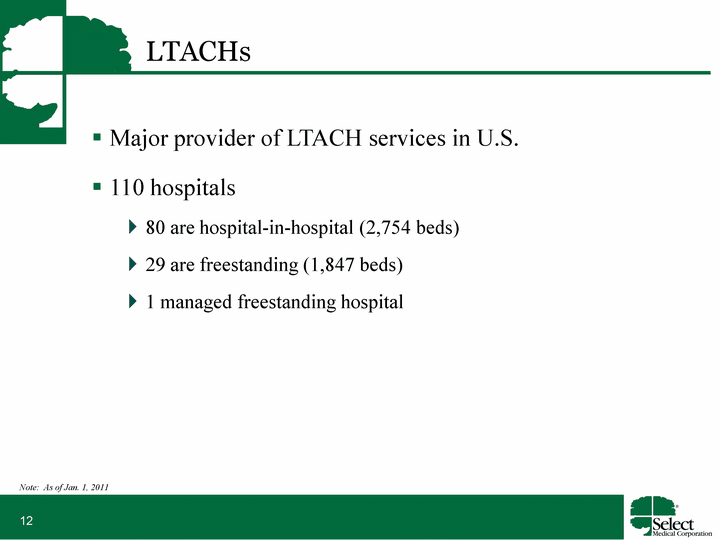
| Major provider of LTACH services in U.S. 110 hospitals80 are hospital-in-hospital (2,754 beds)29 are freestanding (1,847 beds)1 managed freestanding hospital LTACHs Note: As of Jan. 1, 2011 |
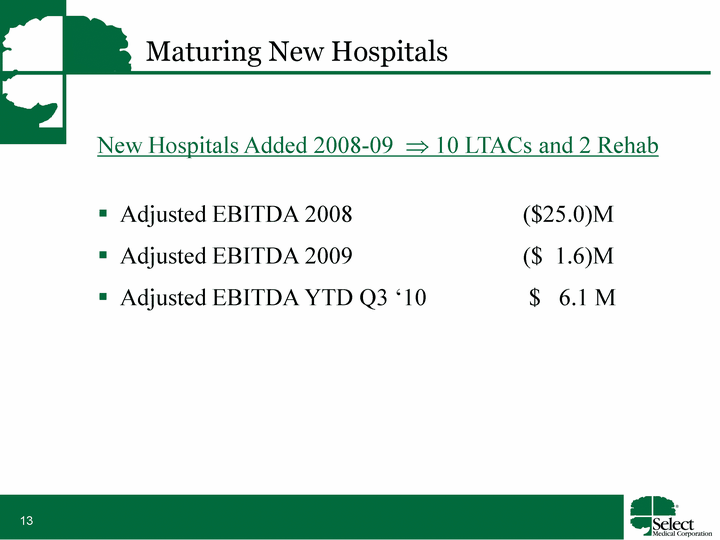
| Maturing New Hospitals New Hospitals Added 2008-09 ? 10 LTACs and 2 Rehab Adjusted EBITDA 2008 ($25.0)MAdjusted EBITDA 2009 ($ 1.6)MAdjusted EBITDA YTD Q3 '10 $ 6.1 M |
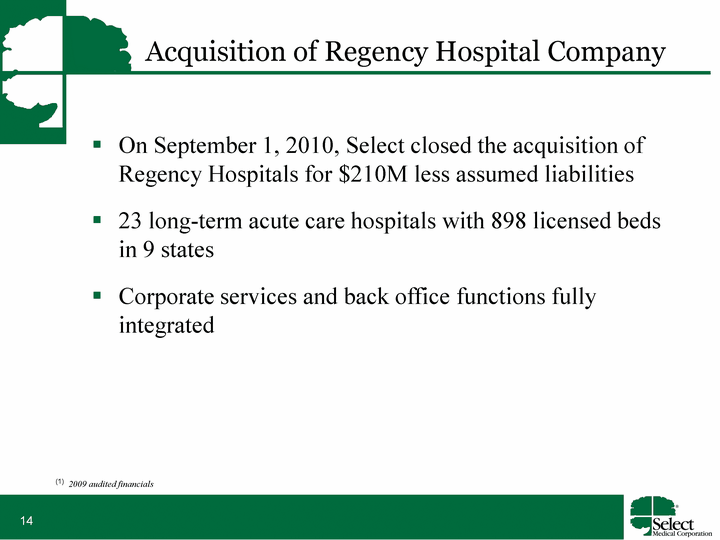
| Acquisition of Regency Hospital Company On September 1, 2010, Select closed the acquisition of Regency Hospitals for $210M less assumed liabilities23 long-term acute care hospitals with 898 licensed beds in 9 statesCorporate services and back office functions fully integrated (1) 2009 audited financials |
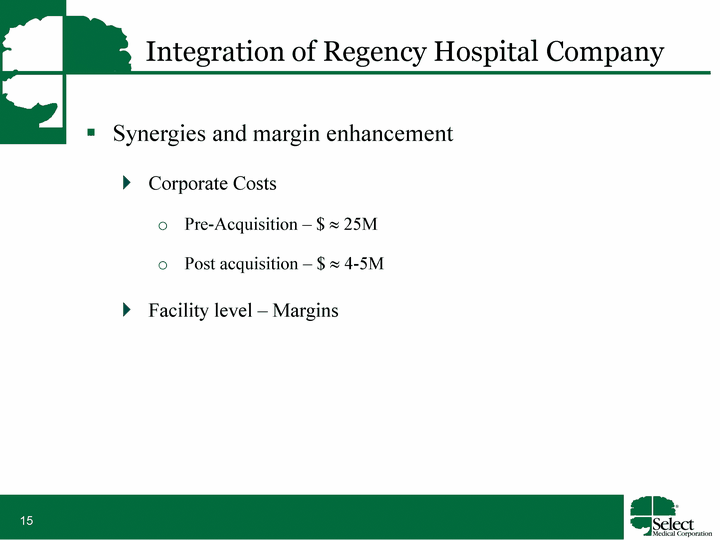
| Integration of Regency Hospital Company Synergies and margin enhancementCorporate CostsPre-Acquisition - $ ? 25MPost acquisition - $ ? 4-5MFacility level - Margins |
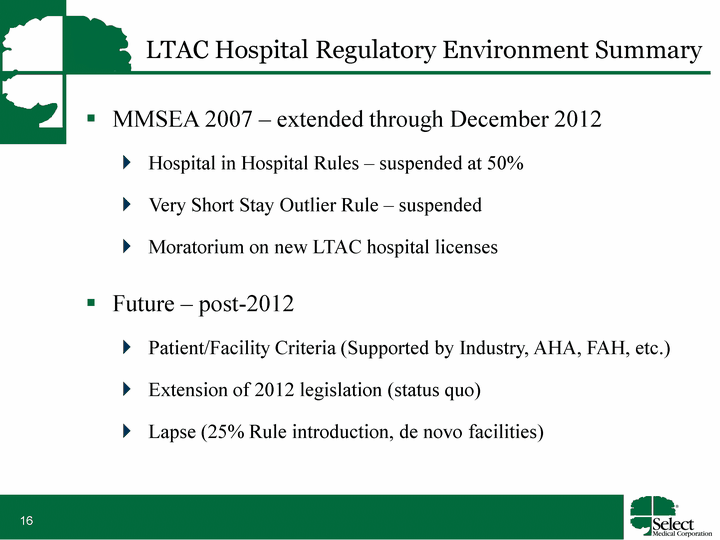
| LTAC Hospital Regulatory Environment Summary MMSEA 2007 - extended through December 2012Hospital in Hospital Rules - suspended at 50%Very Short Stay Outlier Rule - suspendedMoratorium on new LTAC hospital licensesFuture - post-2012Patient/Facility Criteria (Supported by Industry, AHA, FAH, etc.)Extension of 2012 legislation (status quo)Lapse (25% Rule introduction, de novo facilities) |
| Specialty HospitalsInpatient Rehabilitation |
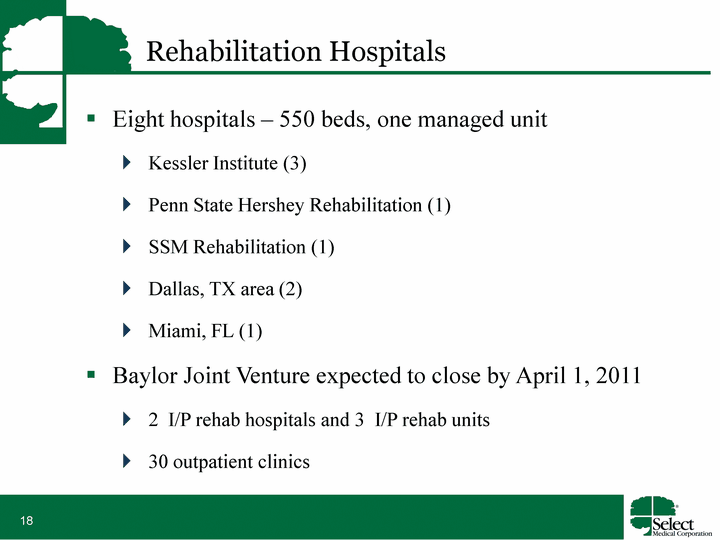
| Rehabilitation Hospitals Eight hospitals - 550 beds, one managed unitKessler Institute (3)Penn State Hershey Rehabilitation (1)SSM Rehabilitation (1)Dallas, TX area (2)Miami, FL (1)Baylor Joint Venture expected to close by April 1, 20112 I/P rehab hospitals and 3 I/P rehab units30 outpatient clinics |
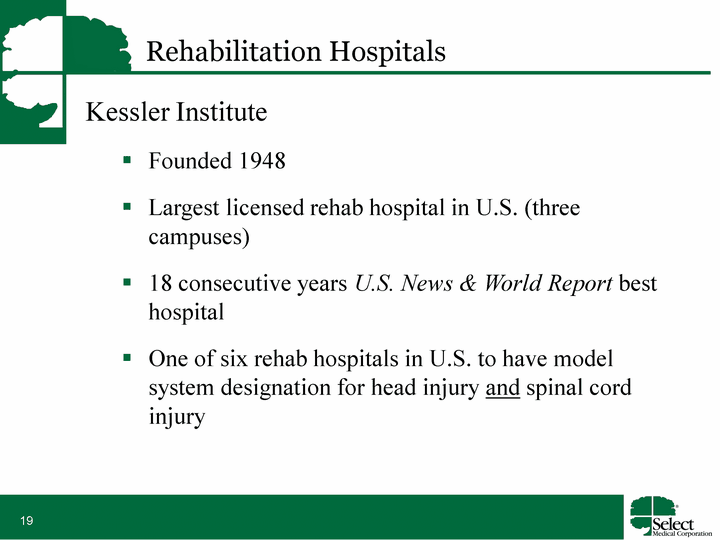
| Rehabilitation Hospitals Kessler InstituteFounded 1948Largest licensed rehab hospital in U.S. (three campuses)18 consecutive years U.S. News & World Report best hospitalOne of six rehab hospitals in U.S. to have model system designation for head injury and spinal cord injury |
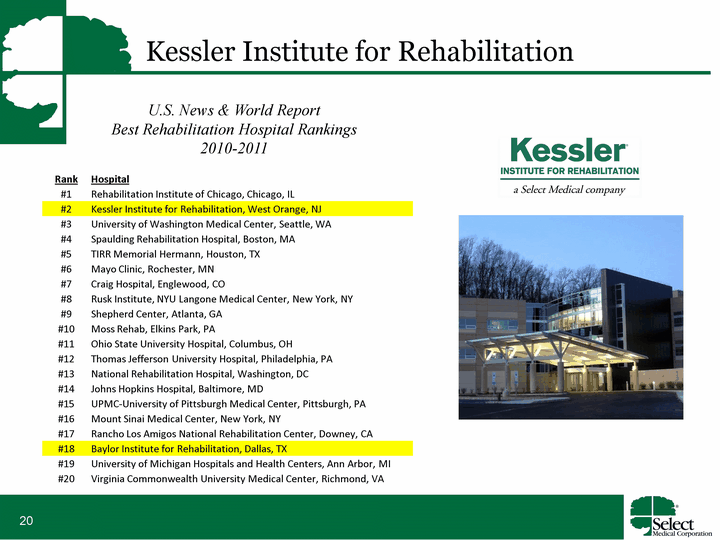
| Kessler Institute for Rehabilitation Rank Hospital #1 Rehabilitation Institute of Chicago, Chicago, IL #2 Kessler Institute for Rehabilitation, West Orange, NJ #3 University of Washington Medical Center, Seattle, WA #4 Spaulding Rehabilitation Hospital, Boston, MA #5 TIRR Memorial Hermann, Houston, TX #6 Mayo Clinic, Rochester, MN #7 Craig Hospital, Englewood, CO #8 Rusk Institute, NYU Langone Medical Center, New York, NY #9 Shepherd Center, Atlanta, GA #10 Moss Rehab, Elkins Park, PA #11 Ohio State University Hospital, Columbus, OH #12 Thomas Jefferson University Hospital, Philadelphia, PA #13 National Rehabilitation Hospital, Washington, DC #14 Johns Hopkins Hospital, Baltimore, MD #15 UPMC-University of Pittsburgh Medical Center, Pittsburgh, PA #16 Mount Sinai Medical Center, New York, NY #17 Rancho Los Amigos National Rehabilitation Center, Downey, CA #18 Baylor Institute for Rehabilitation, Dallas, TX #19 University of Michigan Hospitals and Health Centers, Ann Arbor, MI #20 Virginia Commonwealth University Medical Center, Richmond, VA U.S. News & World ReportBest Rehabilitation Hospital Rankings2010-2011 |
| Inpatient Rehab Facility JV Strategy |
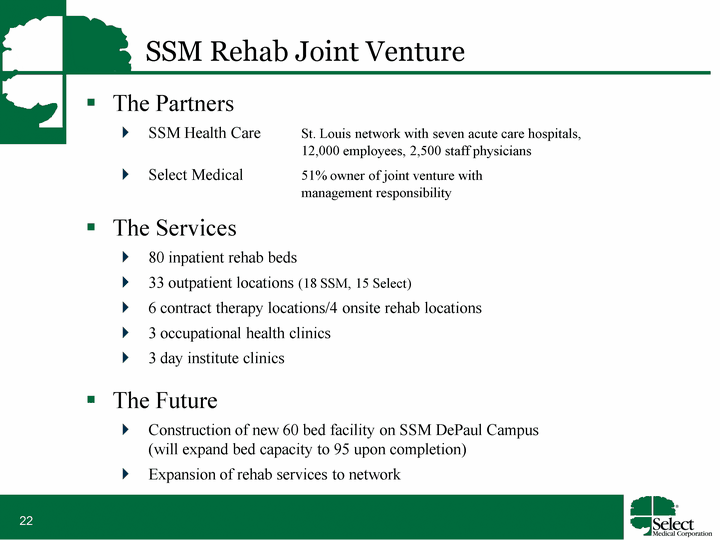
| SSM Rehab Joint Venture The PartnersSSM Health Care St. Louis network with seven acute care hospitals, 12,000 employees, 2,500 staff physiciansSelect Medical 51% owner of joint venture with management responsibilityThe Services80 inpatient rehab beds33 outpatient locations (18 SSM, 15 Select)6 contract therapy locations/4 onsite rehab locations3 occupational health clinics3 day institute clinicsThe FutureConstruction of new 60 bed facility on SSM DePaul Campus (will expand bed capacity to 95 upon completion)Expansion of rehab services to network |
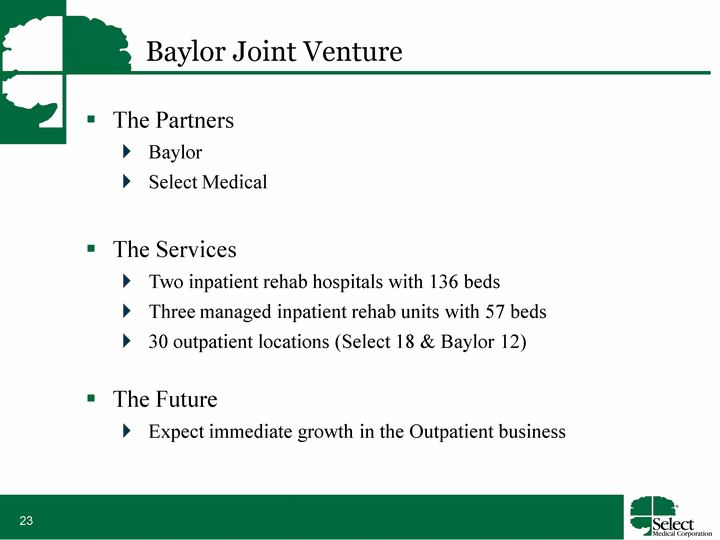
| Baylor Joint Venture The PartnersBaylor Select Medical The ServicesTwo inpatient rehab hospitals with 136 bedsThree managed inpatient rehab units with 57 beds30 outpatient locations (Select 18 & Baylor 12)The FutureExpect immediate growth in the Outpatient business |
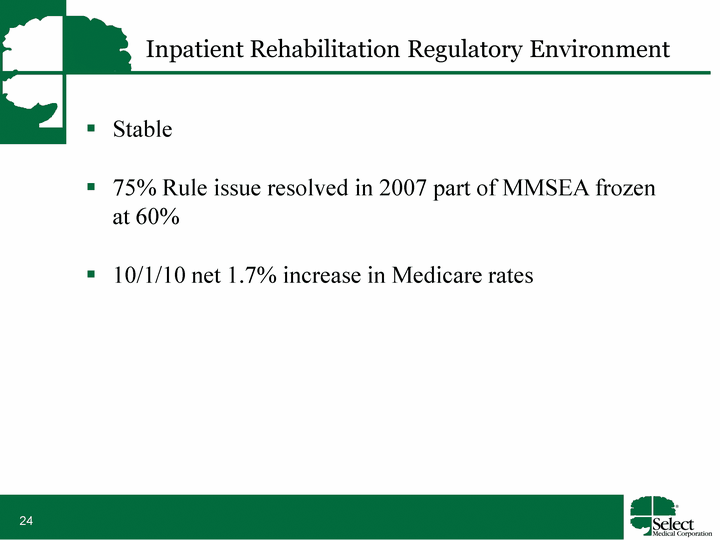
| Inpatient Rehabilitation Regulatory Environment Stable75% Rule issue resolved in 2007 part of MMSEA frozen at 60%10/1/10 net 1.7% increase in Medicare rates |
| Outpatient Rehabilitation SegmentOutpatient Rehab Clinics |
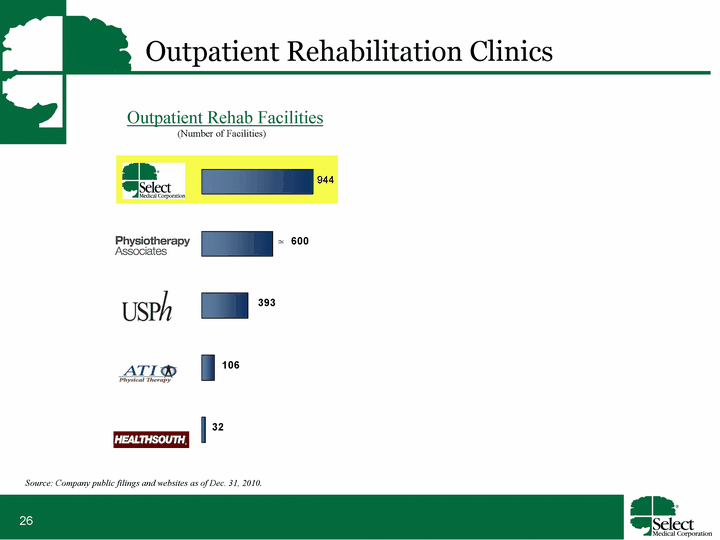
| Outpatient Rehabilitation Clinics Outpatient Rehab Facilities (Number of Facilities) ^ 944 Source: Company public filings and websites as of Dec. 31, 2010. |
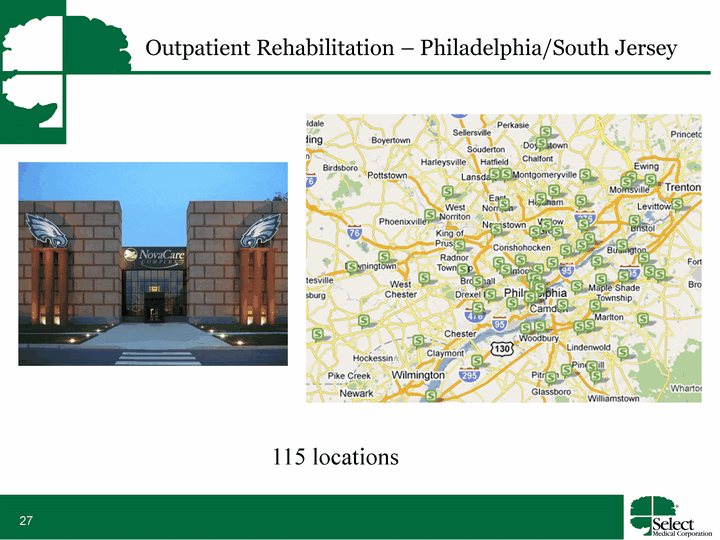
| Outpatient Rehabilitation - Philadelphia/South Jersey 115 locations |
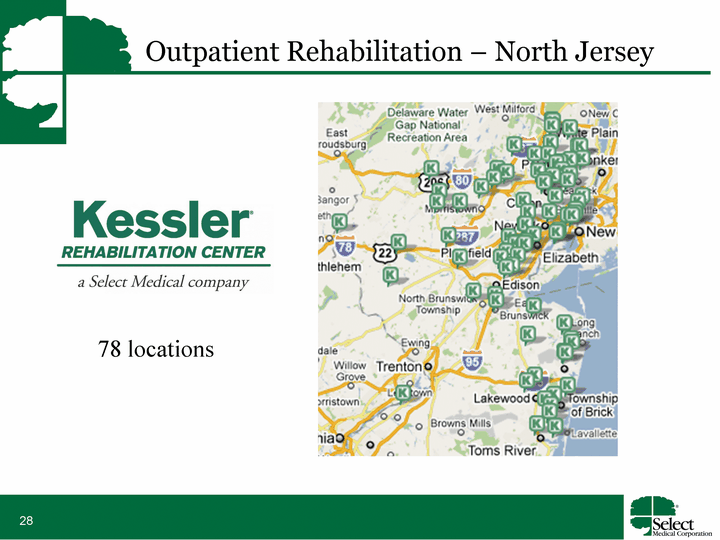
| Outpatient Rehabilitation - North Jersey 78 locations |
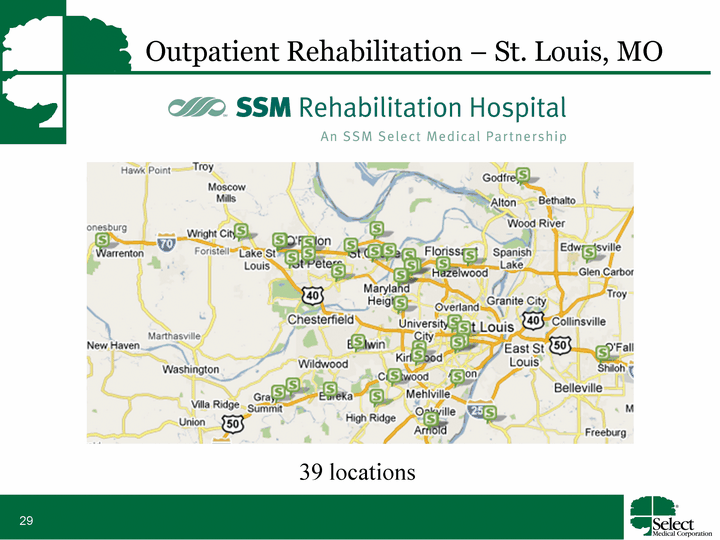
| Outpatient Rehabilitation - St. Louis, MO 39 locations |
| Outpatient Margin Opportunity Continue to expand former HealthSouth clinics' EBITDA margins2008 EBITDA margin differential - greater than 7%2009 EBITDA margin differential - greater than 5%Former HealthSouth clinics' revenue - ^ $200MJoint Venture outpatient opportunities |

| Outpatient Rehabilitation Regulatory Environment Commercial - StableMedicareMPPR changes to therapy payments (effective Jan. 2011)25% reductions to practice expense component for 2nd and subsequent codesContract Therapy rates |
| Outpatient Rehabilitation SegmentContract Therapy |
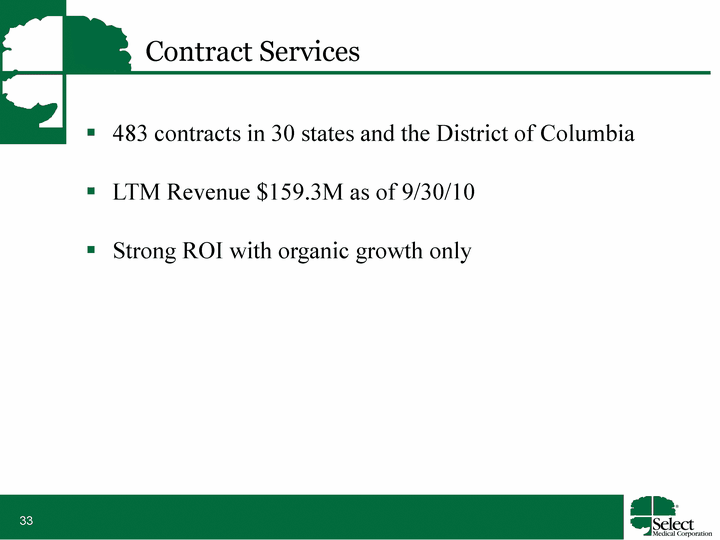
| Contract Services 483 contracts in 30 states and the District of ColumbiaLTM Revenue $159.3M as of 9/30/10Strong ROI with organic growth only |

| Financial Overview |
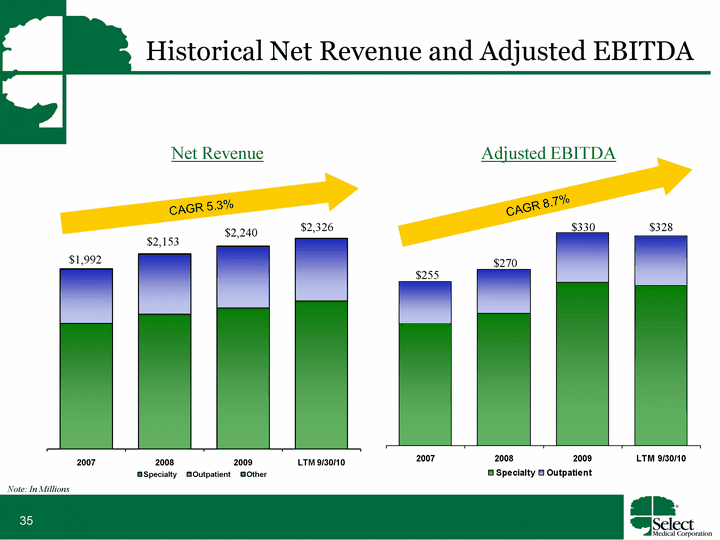
| (CHART) EBITDA Specialty Outpatient 2007 217 75 2008 236 77 2009 290 89 LTM 9/30/10 285 87 $2,240 $2,153 $1,992 Historical Net Revenue and Adjusted EBITDA Note: In Millions CAGR 5.3% CAGR 8.7% $330 $270 $255 $328 $2,326 Net Revenue Adjusted EBITDA |
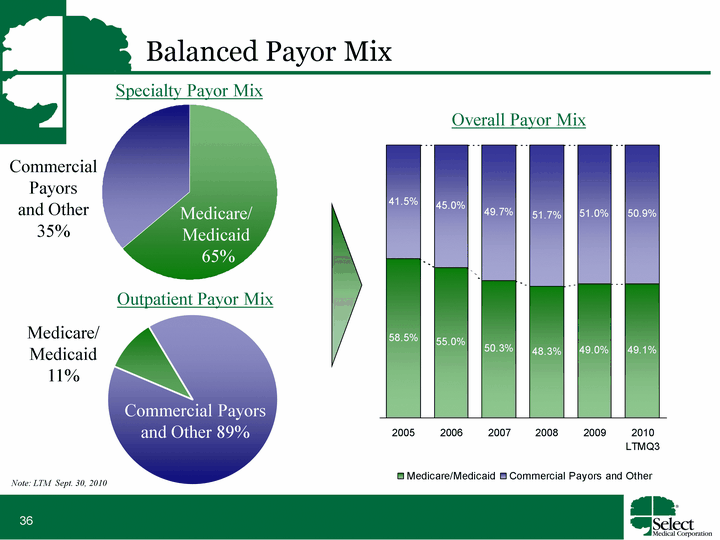
| Balanced Payor Mix Specialty Payor Mix Outpatient Payor Mix Overall Payor Mix Commercial Payors and Other 89% Medicare/ Medicaid11% Commercial & Other Medicare East 36 64 West Medicare/Medicaid 65% Commercial Payors and Other 35% 2005 2006 2007 2008 2009 2010 LTMQ3 Medicare/Medicaid 0.585 0.55 0.503 0.483 0.49 0.491 Commercial Payors and Other 0.415 0.45 0.497 0.517 0.51 0.509 Note: LTM Sept. 30, 2010 |
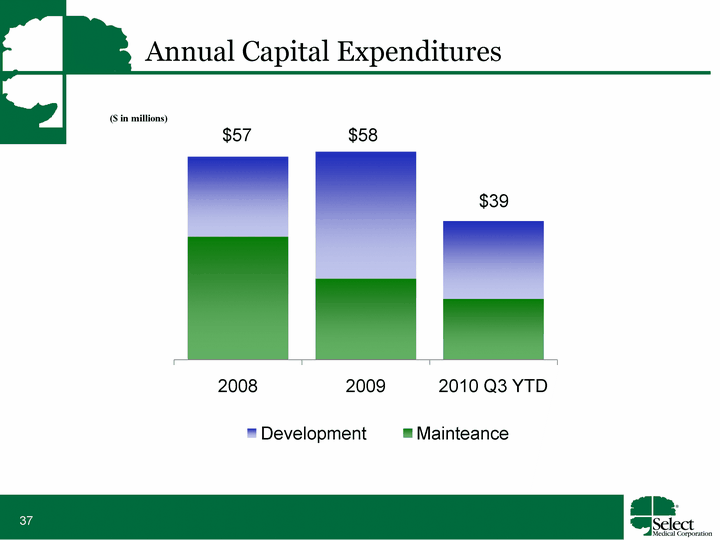
| (CHART) Annual Capital Expenditures $57 |
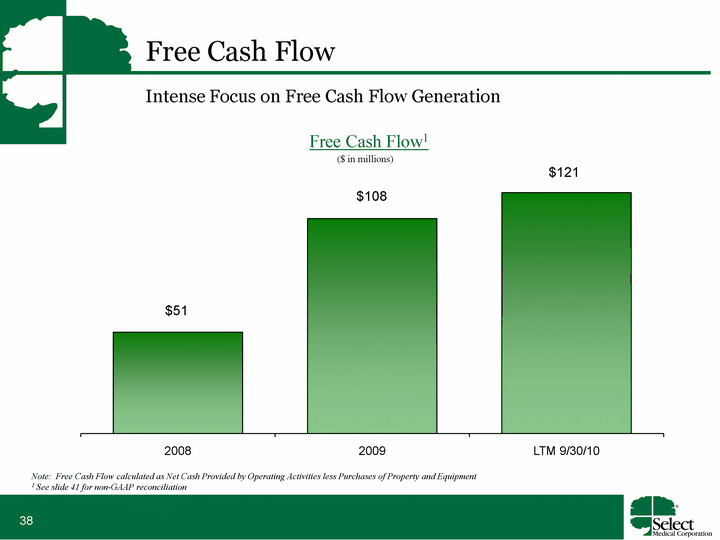
| Free Cash Flow (CHART) Free Cash Flow1 Note: Free Cash Flow calculated as Net Cash Provided by Operating Activities less Purchases of Property and Equipment 1 See slide 41 for non-GAAP reconciliation Intense Focus on Free Cash Flow Generation ($ in millions) |
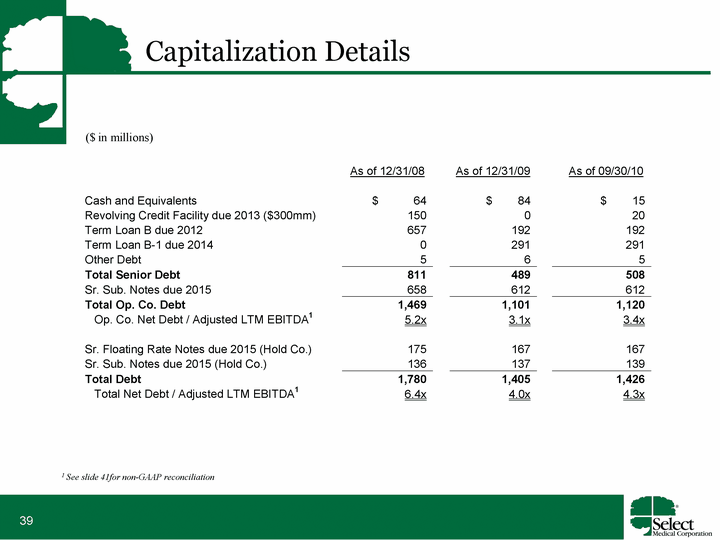
| Capitalization Details ($ in millions) 1 See slide 41for non-GAAP reconciliation |

| Appendix: Additional Materials |
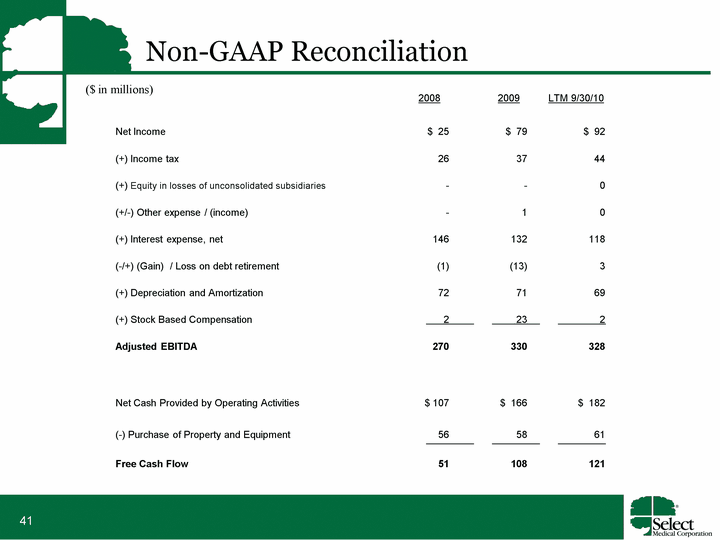
| 2008 2009 LTM 9/30/10 Net Income $ 25 $ 79 $ 92 (+) Income tax 26 37 44 (+) Equity in losses of unconsolidated subsidiaries - - 0 (+/-) Other expense / (income) - 1 0 (+) Interest expense, net 146 132 118 (-/+) (Gain) / Loss on debt retirement (1) (13) 3 (+) Depreciation and Amortization 72 71 69 (+) Stock Based Compensation 2 23 2 Adjusted EBITDA 270 330 328 Net Cash Provided by Operating Activities $ 107 $ 166 $ 182 (-) Purchase of Property and Equipment 56 58 61 Free Cash Flow 51 108 121 Non-GAAP Reconciliation ($ in millions) |