Attached files
 Armstrong World Industries
Investor Presentation
Fourth Quarter 2010
February 28, 2011
Exhibit 99.3 |
 2
Safe
Harbor
Statement
This presentation contains “forward-looking statements”
related to Armstrong
World Industries, Inc.’s, future financial performance. Our results could
differ materially from the results discussed in these forward-looking
statements due to known and unknown risks and uncertainties. A more
detailed discussion of the risks and uncertainties that may affect our
ability to achieve the projected performance is included in the “Risk
Factors” and “Management’s Discussion
and Analysis”
sections of our recent reports on Forms 10-K and 10-Q filed with
the SEC. We undertake no obligation to update any forward-looking statement
beyond what is required by applicable securities law.
In addition, we will be referring to non-GAAP financial measures within the
meaning of SEC Regulation G. A reconciliation of the differences
between these
measures with the most directly comparable financial measures calculated in
accordance with GAAP is available on the Investor Relations page
of our
website at www.armstrong.com.
|
 3
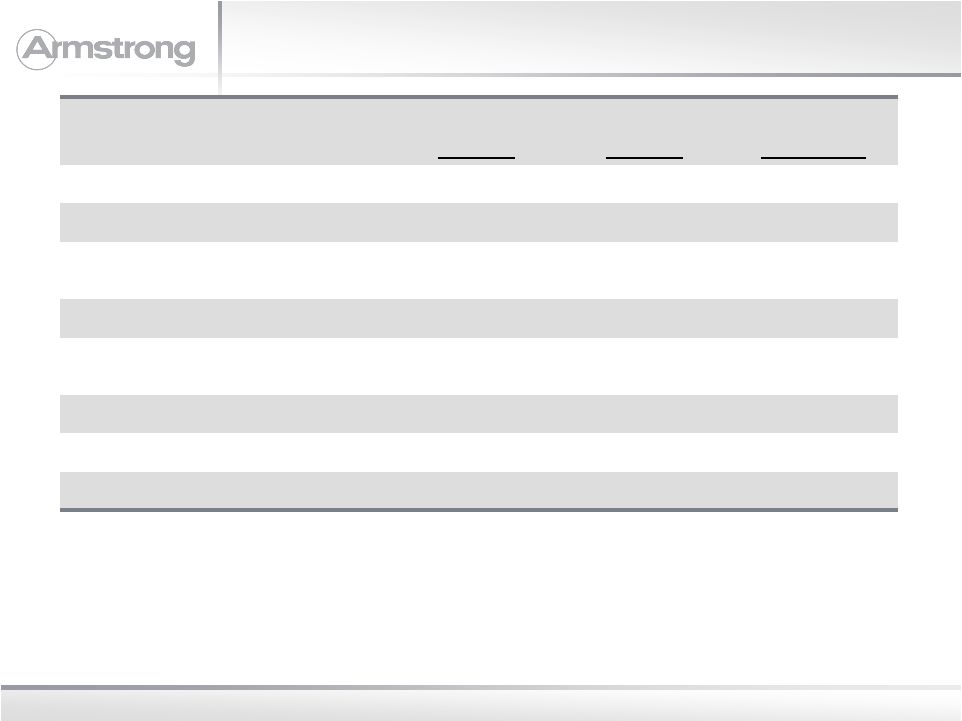
Key Metrics –
Fourth Quarter 2010 Adjusted
(1)
Financial Overview
(1)
Figures exclude non-recurring items such as charges for cost reduction
initiatives, restructuring, etc. Figures also exclude the impact of foreign exchange
movements.
(2)
As reported Net Sales: $643 million in 2010 and $653 million in
2009.
(3)
As reported Operating Loss: ($30 million) in 2010 and ($2 million) in
2009. (4)
As reported EPS: ($0.36) in 2010 and ($0.07) in
2009. (5)
Earnings per share reflect an adjusted tax rate of 42% for both 2010 and
2009. (6)
Total
cash
as
of
December
31,
2010
of
$316
million
was
comprised
of
$36
million
in
domestic
cash
and
$280
million
in
foreign
cash.
Total
cash
as
of
December 31, 2009 of $570 million was comprised of $328 million in domestic cash
and $241 million in foreign cash. Total debt was $875 million in 2010
and $473 million in 2009.
All figures in $ millions unless otherwise noted. Figures may not add due to
rounding. 2010
Actual
2009
Actual
Variance
Net Sales
(2)
$652
$657
(0.7%)
Operating Income
(3)
19
26
(27.6%)
% of Sales
2.9%
3.9%
(100 bps)
EBITDA
47
54
(14.0%)
% of Sales
7.1%
8.2%
(110 bps)
Earnings Per Share
(4), (5)
$0.11
$0.23
($0.12)
Free Cash Flow
43
53
(10)
Net (Cash) Debt
(6)
559
(97)
656 |
 4
Q4 2010 –
Adjusted Operating Income to
Reported Net Income
Financial Overview
All figures in $ millions unless otherwise noted. Figures may not add due to
rounding. (1)
Figures exclude non-recurring items such as charges for cost reduction
initiatives, restructuring, etc. Figures also exclude the impact of foreign
exchange movements.
2010
2009
V
Operating Income –
Adjusted
(1)
$19
$26
($7)
Foreign Exchange Movements
1
(1)
2
Cost Reduction Initiatives
(22)
(9)
(13)
Asset Impairments
(22)
(18)
(4)
Restructuring
(7)
-
(7)
Executive Transition
(1)
-
(1)
Gain from Settlement of Note
Receivable
2
-
2
Operating Income –
As Reported
($30)
($2)
($28)
Interest (Expense) Income
(8)
(3)
(5)
EBT
($38)
($5)
($33)
Tax (Expense) Benefit
17
1
16
Net Income
($21)
($4)
($17) |
 5
Q4 Sales and Adjusted Operating Income
(1)
by
Segment –
2010 vs. 2009
Financial Overview
All figures in $ millions unless otherwise noted. Figures may not add due to
rounding. (1)
Figures exclude non-recurring items such as charges for cost reduction
initiatives, restructuring, etc. Figures also exclude the impact of foreign
exchange movements. |
 6
Adjusted Operating Income
(1)
Bridge –
Q4 2010 versus Prior Year
Financial Overview
All figures in $ millions unless otherwise noted. Figures may not add due to
rounding. (1)
Figures exclude non-recurring items such as charges for cost reduction
initiatives, restructuring, etc. Figures also exclude the impact of foreign
exchange movements. |
 7
Free Cash Flow –
Fourth Quarter 2010
versus Prior Year
Financial Overview
All figures in $ millions unless otherwise noted. Figures may not add due to
rounding. |
 8
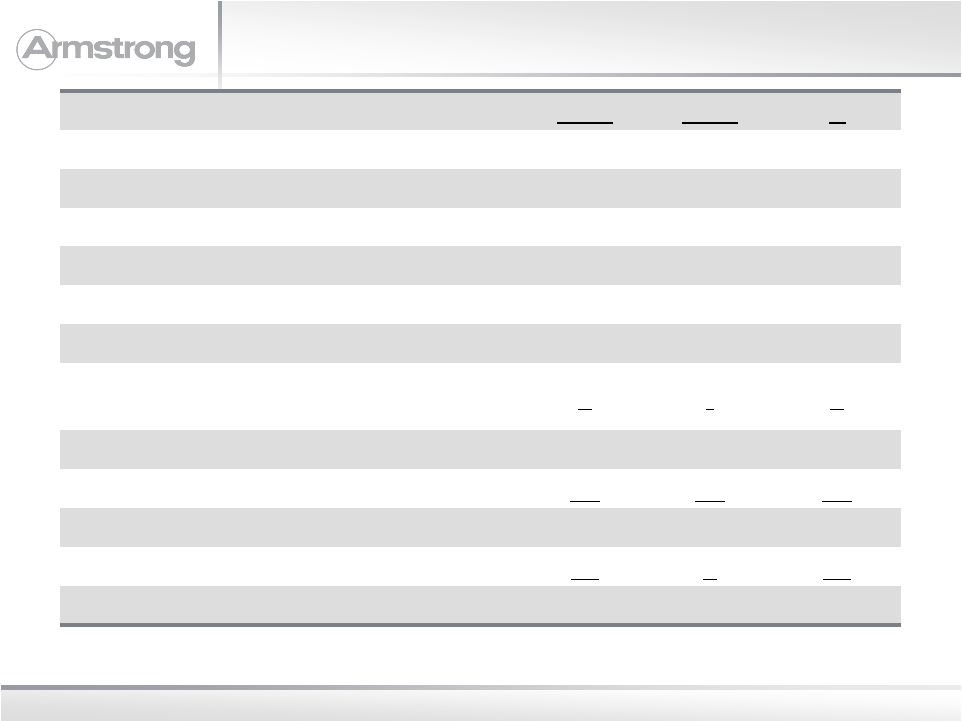
Key Metrics –
Full Year 2010 Adjusted
(1)
Financial Overview
All figures in $ millions unless otherwise noted. Figures may not add due to
rounding. (1)
Figures exclude non-recurring items such as charges for cost reduction
initiatives, restructuring, etc. Figures also exclude the impact of foreign
exchange movements.
(2)
As reported Net Sales: $2,766 million in 2010 and $2,780 million in
2009. (3)
As reported Operating Income: $81 million in 2010 and $91 million in
2009. (4)
As reported EPS: $0.19 in 2010 and $1.36 in 2009.
(5)
Earnings per share reflect an adjusted tax rate of 42% for both 2010 and
2009. (6)
Total cash in 2010 of $316 million was comprised of $36 million in domestic cash
and $280 million in foreign cash. Total cash in 2009 of $570 million
was
comprised
of:
$328
million
in
domestic
cash
and
$241
million
in
foreign
cash.
Total
debt
was
$875
million
in
2010
and
$473
million
in
2009.
2010
Actual
2009
Actual
Variance
Net Sales
(2)
$2,833
$2,853
(0.7%)
Operating Income
(3)
188
157
20.2%
% of Sales
6.6%
5.5%
110 bps
EBITDA
303
296
2.4%
% of Sales
10.7%
10.4%
30 bps
Earning Per Share
(4), (5)
$1.72
$1.44
$0.28
Free Cash Flow
180
211
(31)
Net (Cash) Debt
(6)
559
(97)
656 |
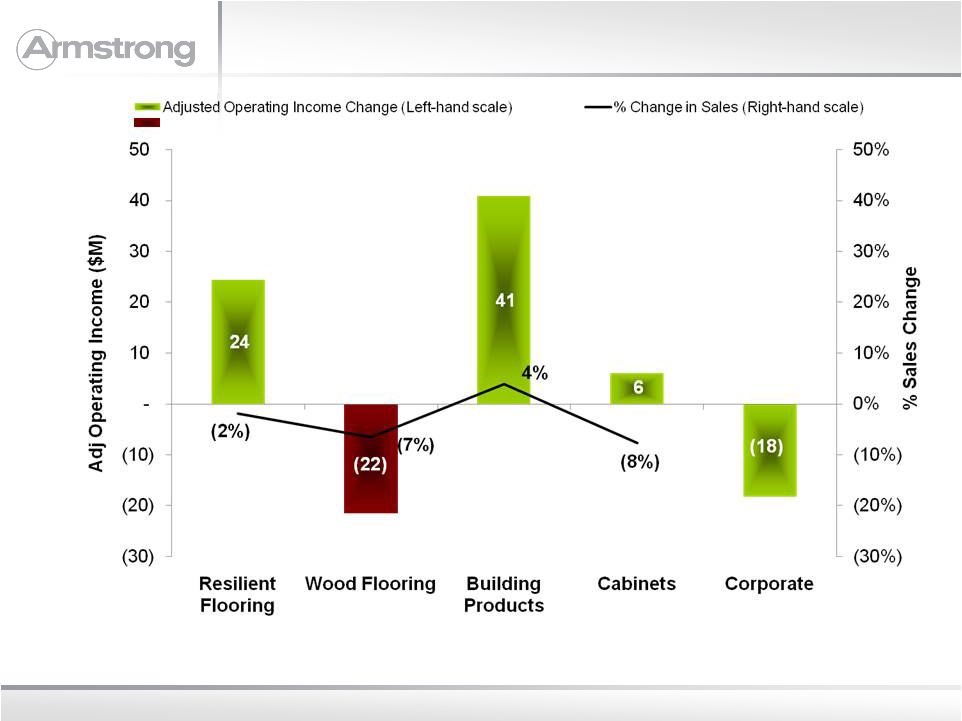 9
Full Year Sales and Adjusted Operating
Income
(1)
by Segment –
2010 vs. 2009
Financial Overview
All figures in $ millions unless otherwise noted. Figures may not add due to
rounding. (1)
Figures exclude non-recurring items such as charges for cost reduction
initiatives, restructuring, etc. Figures also exclude the impact of foreign
exchange movements. |
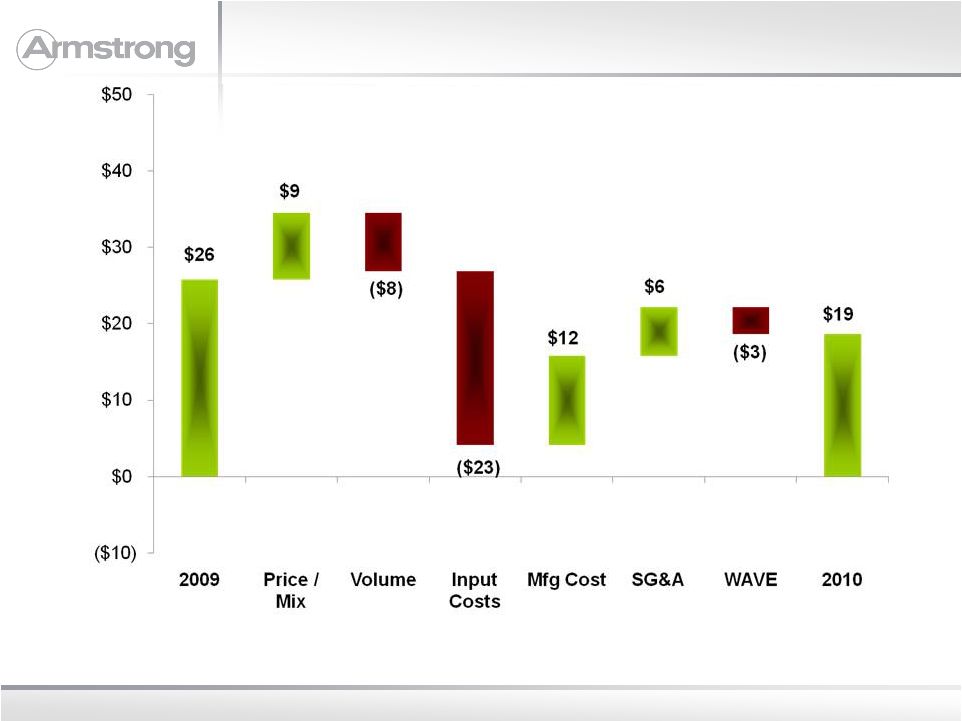
 10
Adjusted Operating Income
(1)
Bridge –
Full Year 2010 versus Prior Year
Financial Overview
All figures in $ millions unless otherwise noted. Figures may not add due to
rounding. (1)
Figures exclude non-recurring items such as charges for cost reduction
initiatives, restructuring, etc. Figures also exclude the impact of foreign
exchange movements. |
 11
Free Cash Flow –
Full Year 2010 versus Prior Year
Financial Overview
All figures in $ millions unless otherwise noted. Figures may not add due to
rounding. |
 12
Capital Structure as of December 31, 2010
Financial Overview
All figures in $ millions unless otherwise noted. Figures may not add due to
rounding. CASH
Balance ($M)
US Cash
$36
International Cash
280
(1)
TOTAL Cash
$316
DEBT
Balance ($M)
Interest Rate
Maturity
Revolver ($250M)
$25
(1)
3.28%
(2)
2015
A/R Securitization ($100M)
-
1.20%
2013
Term Loan A / B
250 / 550
3.28% / 5.00%
(2)
2015 / 2017
Industrial Development Bond / Other
50
~2.00%
>2025
TOTAL Debt
$875
Net Debt
$559
(1)
In January 2011, a significant amount of international cash was repatriated with
the proceeds used to pay off the revolver. (2)
Term Loan A and the revolver interest rates are LIBOR + 3% and Term Loan B interest
rate is LIBOR + 3.5% with a 1.5% floor. |
 13
$150 Million Savings Program
Financial Overview
All figures in $ millions unless otherwise noted. Figures may not add due to
rounding. $150M savings from manufacturing and SG&A, net of
inflation. Will use procurement savings to mitigate strong inflationary
pressure. |
 14
AWI -
Return on Invested Capital (ROIC)
Financial Overview
All figures in $ millions unless otherwise noted. Figures may not add due to
rounding. Near term goal is to return at least our cost of capital by 2013,
with domestic housing starts ~ 1 million units.
|
 15
Key Metrics
(1)
–
Guidance 2011
Financial Overview
All figures in $ millions unless otherwise noted.
2011
Estimate Range
2010
Variance
Net Sales
2,800
to
3,000
2,766
1%
to
8%
Operating Income
(2)
255
to
305
189
35%
to
62%
EBITDA
360
to
410
303
19%
to
35%
Earnings Per Share
(3),(4)
$2.04
to
$2.53
$1.73
18%
to
47%
Free Cash Flow
70
to
120
180
(61%)
to
(33%)
(1)
Figures exclude non-recurring items such as charges for cost reduction
initiatives, restructuring, etc. (2)
As reported Operating Income: $225 -
275 million in 2011 and $81 million 2010.
(3)
Earnings per share reflect an adjusted tax rate of 42% for both 2011 and
2010. (4)
As reported earnings per share: $1.85 -
$2.34 in 2011 and $0.19 in 2010. |
 16
2011 Financial Outlook
Financial Overview
Raw Material & Energy Inflation
$35 -
$45 million increase
Manufacturing Productivity
Gross Margin +100 to +200 bps vs. 2010
U.S. Pension Credit
~$25 million, down ~$25 million vs. 2010
60% manufacturing, 40% SG&A
Earnings from WAVE
$5 -
$10 million vs. 2010
Cash Taxes/ETR
~$15 million. Adjusted ETR of 42%
Q1
Sales $640 –
$705 million
EBITDA $72 –
$88 million
Capital Spending
~$180-$200 million
Exclusions from EBITDA
~$18 -
27 million associated with already
announced actions |
 Appendix |
 18
Full Year 2010 –
Adjusted Operating Income to
Reported Net Income
Financial Overview Appendix
All figures in $ millions unless otherwise noted. Figures may not add due to
rounding. 2010
2009
V
Operating Income –
Adjusted
(1)
$188
$157
$31
Foreign Exchange Movements
2
-
2
Laminate Duty Refund
7
-
7
Cost Reduction Initiatives
(50)
(16)
(34)
Asset Impairments
(31)
(18)
(13)
Restructuring
(22)
-
(22)
Executive Transition
(15)
-
(15)
Gain on Settlement of Note Receivable
2
-
2
Accelerated Vesting
-
(32)
32
Operating Income –
As Reported
$81
$91
($10)
Interest (Expense) Income
(14)
(16)
2
EBT
$67
$75
($8)
Tax (Expense) Benefit
(56)
3
(59)
Net Income
$11
$78
($67)
(1)
Figures exclude non-recurring items such as charges for cost reduction
initiatives, restructuring, etc. Figures also exclude the impact of foreign
exchange movements. |
 19
Normalized Operating Income to Free Cash Flow
Financial Overview Appendix
All figures in $ millions unless otherwise noted.
2011
Estimate Range
Adjusted Operating Income
255
to
305
D&A
105
Adjusted EBITDA
360
to
410
Changes in Working Capital
10
to
30
Capex
(180)
to
(200)
Pension Credit
(25)
Interest Expense
(50)
Cash Taxes
(15)
Other, including cash payments for
restructuring and one-time items
(30)
Free Cash Flow
70
to
120 |
 20
Consolidated Results
Financial Overview Appendix
All figures in $ millions unless otherwise noted. Figures may not add due to
rounding. Fourth Quarter
2010
Reported
Comparability
(1)
Adjustments
FX
(2)
Adj
2010
Adjusted
2009
Reported
Comparability
(1)
Adjustments
FX
(2)
Adj
2009
Adjusted
Net Sales
643
-
9
652
653
-
4
657
Operating Income
(30)
50
(1)
19
(2)
27
-
26
EPS
($0.36)
$0.48
($0.01)
$0.11
($0.07)
$0.30
$ -
$0.23
Full Year 2010
2010
Reported
Comparability
(1)
Adjustments
FX
(2)
Adj
2010
Adjusted
2009
Reported
Comparability
(1)
Adjustments
FX
(2)
Adj
2009
Adjusted
Net Sales
2,766
-
66
2,833
2,780
-
73
2,853
Operating Income
81
108
(2)
188
91
65
1
157
EPS
$0.19
$1.55
($0.02)
$1.72
$1.36
$0.07
$0.01
$1.44
(1)
See earnings press release and 10-K for additional detail on comparability
adjustments (2)
Eliminates impact of foreign exchange movements |
 21
Segment Operating Income (Loss)
Financial Overview Appendix
All figures in $ millions unless otherwise noted. Figures may not add due to
rounding. (1)
Eliminates impact of foreign exchange movements and non-recurring items; see
earnings press release and 10-K for additional detail. Fourth
Quarter 2010
Reported
Comparability
(1)
Adjustments
2010
Adjusted
2009
Reported
Comparability
(1)
Adjustments
2009
Adjusted
Resilient Flooring
(2)
3
1
(7)
2
(4)
Wood Flooring
(32)
28
(4)
(10)
20
10
Building Products
16
16
32
24
-
24
Cabinets
(1)
-
(1)
(8)
5
(3)
Unallocated Corporate
(Expense) Income
(12)
(3)
(9)
-
-
-
Full Year 2010
2010
Reported
Comparability
(1)
Adjustments
2010
Adjusted
2009
Reported
Comparability
(1)
Adjustments
2009
Adjusted
Resilient Flooring
13
18
31
-
6
7
Wood Flooring
(46)
39
(7)
(6)
20
14
Building Products
171
27
198
156
1
157
Cabinets
(6)
-
(6)
(18)
6
(12)
Unallocated Corporate
(Expense) Income
(51)
23
(28)
(41)
32
(9) |
 22
Cash Flow
Financial Overview Appendix
All figures in $ millions unless otherwise noted. Figures may not add due to
rounding. Fourth Quarter
Full Year
($-millions)
2010
2009
2010
2009
Net Cash From Operations
49
82
190
260
Plus / (Minus) Net Cash from Investing
(37)
(29)
(41)
(41)
Add back / (subtract):
Restricted Cash
30
-
30
-
Divestitures
1
-
1
(8)
Equals Free Cash Flow
43
53
180
211 |