UNITED STATES
SECURITIES AND EXCHANGE COMMISSION
Washington, D.C. 20549
FORM 10-K
(Mark One)
| |
|
|
| þ |
|
ANNUAL REPORT PURSUANT TO SECTION 13 OR 15(d) OF THE SECURITIES EXCHANGE ACT OF 1934 |
For the fiscal year ended December 31, 2009
OR
| |
|
|
| o |
|
TRANSITION REPORT PURSUANT TO SECTION 13 OR 15(d) OF THE SECURITIES EXCHANGE ACT OF 1934 |
For the transition period from to
ARMSTRONG WORLD INDUSTRIES, INC.
(Exact name of registrant as specified in its charter)
| |
|
|
|
|
| Pennsylvania
|
|
1-2116
|
|
23-0366390 |
|
|
|
|
|
|
| (State or other jurisdiction of
|
|
Commission file
|
|
(I.R.S. Employer |
| incorporation or organization)
|
|
number
|
|
Identification No.) |
| |
|
|
| P. O. Box 3001, Lancaster, Pennsylvania
|
|
17604 |
|
|
|
|
| (Address of principal executive offices)
|
|
(Zip Code) |
Registrant’s telephone number, including area code (717) 397-0611
Securities registered pursuant to Section 12(b) of the Act: None
Securities registered pursuant to Section 12(g) of the Act:
Title of each class
Common Stock ($0.01 par value)
Indicate by check mark if the registrant is a well-known seasoned issuer, as defined in Rule 405 of
the Securities Act.
Yes þ No o
Indicate by check mark if the registrant is not required to file reports pursuant to Section 13 or
Section 15(d) of the Act.
Yes o No þ
Indicate by check mark whether the registrant (1) has filed all reports required to be filed by
Section 13 or 15(d) of the Securities Exchange Act of 1934 during the preceding 12 months, and (2)
has been subject to such filing requirements for the past 90 days.
Yes þ No o
Indicate by check mark whether the registrant has submitted electronically and posted on its
corporate Web site, if any, every Interactive Data File required to be submitted and posted
pursuant to Rule 405 of Regulation S-T (§232.405 of this chapter) during the preceding 12 months
(or for such shorter time period that the registrant was required to submit and post such files).
Yes o No o
Indicate by check mark if disclosure of delinquent filers pursuant to Item 405 of Regulation S-K is
not contained herein, and will not be contained, to the best of registrant’s knowledge, in
definitive proxy or information statements incorporated by reference in Part III of this Form 10-K
or any amendment to this Form 10-K. o
Indicate by check mark whether the registrant is a large accelerated filer, an accelerated filer, a
non-accelerated filer, or a smaller reporting company. See the definitions of “large accelerated
filer,” “accelerated filer” and “smaller reporting company” in Rule 12b-2 of the Exchange Act
(Check one):
| |
|
|
|
|
|
|
| Large accelerated filer o
|
|
Accelerated filer þ
|
|
Non-accelerated filer o
|
|
Smaller reporting company o |
Indicate by check mark whether the registrant is a shell company (as defined in Rule 12b-2 of the
Act).
Yes o No þ
Indicate by check mark whether the registrant has filed all documents and reports required to be
filed by Section 12, 13 or 15(d) of the Securities Exchange Act of 1934 subsequent to the
distribution of securities under a plan confirmed by a court.
Yes þ No o
The aggregate market value of the Common Stock of Armstrong World Industries, Inc. held by
non-affiliates based on the closing price ($16.49 per share) on the New York Stock Exchange
(trading symbol AWI) on June 30, 2009 was approximately $324 million. As of February 18, 2010, the
number of shares outstanding of registrant’s Common Stock was 57,446,003.
Documents Incorporated by Reference
Certain sections of Armstrong World Industries, Inc.’s definitive Proxy Statement for use in
connection with its 2010 annual meeting of stockholders, to be filed subsequently, are incorporated
by reference into Part III of this Form 10-K Report where indicated.
2
Uncertainties Affecting Forward-Looking Statements
Our disclosures here and in other public documents and comments contain forward-looking statements
within the meaning of the Private Securities Litigation Reform Act. Those statements provide our
future expectations or forecasts, and can be identified by our use of words such as “anticipate,”
“estimate,” “expect,” “project,” “intend,” “plan,” “believe,” “outlook,” etc. in discussions of
future operating or financial performance or the outcome of contingencies such as liabilities or
legal proceedings.
Any of our forward-looking statements may turn out to be wrong. Actual results may differ
materially from our expected results. Forward-looking statements involve risks and uncertainties
because they relate to events and depend on circumstances that may or may not occur in the future.
We undertake no obligation to update any forward-looking statement beyond what is required under
applicable securities law.
Risks and uncertainties that affect our business, operations and financial condition should be
taken into account in evaluating any investment decision involving Armstrong. It is not possible
to predict or identify all factors that could cause actual results to differ materially from
expected and historical results. The discussion in the “Risk Factors” section within Item 1A is a
summary of what we currently believe to be our most significant risk factors. Related disclosures
in subsequent 10-K, 10-Q and 8-K reports should also be consulted.
4
PART I
Armstrong World Industries, Inc. (“AWI” or “the Company”) is a Pennsylvania corporation
incorporated in 1891. We are a leading global producer of flooring products and ceiling systems
for use primarily in the construction and renovation of residential, commercial and institutional
buildings. Through our United States (“U.S.”) operations and U.S. and international subsidiaries,
we design, manufacture and sell flooring products (primarily resilient and wood) and ceiling
systems (primarily mineral fiber, fiberglass and metal) around the world. We also design,
manufacture and sell kitchen and bathroom cabinets in the U.S.
Our business strategy focuses on product innovation, product quality and customer service. In
addition to price, these factors are the primary determinants of market share gain or loss in our
business. Our objective is to ensure that anyone buying a hard surface floor or ceiling can find
an Armstrong product that meets his or her needs. Our cabinet strategy is more focused — on stock
cabinets in select geographic markets. In these segments, we have the same objectives: high
quality, good customer service and products that meet our customers’ needs. Our markets are very
competitive, which limits our pricing flexibility. This requires that we increase our productivity
each year — both in our plants and in our administration of the businesses.
We maintain a website at http://www.armstrong.com. Information contained on our website is not
incorporated into this document. Annual reports on Form 10-K, quarterly reports on Form 10-Q,
current reports on Form 8-K, all amendments to those reports and other information about us are
available free of charge through this website as soon as reasonably practicable after the reports
are electronically filed with the Securities and Exchange Commission (“SEC”). These materials are
also available from the SEC’s website at www.sec.gov.
In December 2000, AWI filed a voluntary petition for relief under Chapter 11 of the U.S. Bankruptcy
Code in order to use the court-supervised reorganization process to achieve a resolution of our
asbestos liability. In October 2006, AWI’s plan of reorganization (“POR”) became effective, and
AWI emerged from Chapter 11. See Note 1 to the Consolidated Financial Statements for additional
information about AWI’s Chapter 11 case.
In August 2009, Armor TPG Holdings LLC (“TPG”) and the Armstrong World Industries, Inc. Asbestos
Personal Injury Settlement Trust (“Asbestos PI Trust”) entered into an agreement whereby TPG
purchased 7,000,000 shares of the Company’s common stock from the Asbestos PI Trust, and acquired
an economic interest in an additional 1,039,777 shares from the Asbestos PI Trust. The Asbestos PI
Trust and TPG together hold more than 60% of AWI’s outstanding shares and have entered into a
shareholders’ agreement pursuant to which the Asbestos PI Trust and TPG have agreed to vote their
shares together on certain matters.
5
Reportable Segments
Resilient Flooring — produces and sources a broad range of floor coverings primarily for homes and
commercial and institutional buildings. Manufactured products in this segment include vinyl sheet,
vinyl tile and linoleum flooring. In addition, our Resilient Flooring segment sources and sells
laminate flooring products, ceramic tile products, adhesives, installation and maintenance
materials and accessories. Resilient Flooring products are offered in a wide variety of types,
designs, and colors. We sell these products worldwide to wholesalers, large home centers,
retailers, contractors and to the manufactured homes industry.
Wood Flooring — produces and sources wood flooring products for use in new residential construction
and renovation, with some commercial applications in stores, restaurants and high-end offices. The
product offering includes pre-finished solid and engineered wood floors in various wood species,
and related accessories. Virtually all of our Wood Flooring sales are in North America. Our Wood
Flooring products are generally sold to independent wholesale flooring distributors and large home
centers. Our products are principally sold under the brand names Bruce®, Hartco®, Robbins®,
Timberland®, Armstrong®, HomerWood® and Capella®.
Building Products — produces suspended mineral fiber, soft fiber and metal ceiling systems for use
in commercial, institutional, and residential settings. In addition, our Building Products segment
sources complementary ceiling products. Our products, which are sold worldwide, are available in
numerous colors, performance characteristics and designs, and offer attributes such as acoustical
control, rated fire protection and aesthetic appeal. Commercial ceiling materials and accessories
are sold to ceiling systems contractors and to resale distributors. Residential ceiling products
are sold in North America primarily to wholesalers and retailers (including large home centers).
Suspension system (grid) products manufactured by Worthington Armstrong Venture (“WAVE”) are sold
by both Armstrong and our WAVE joint venture.
Cabinets — produces kitchen and bathroom cabinetry and related products, which are used primarily
in the U.S. residential new construction and renovation markets. Through our system of
Company-owned and independent distribution centers and through direct sales to builders, our
Cabinets segment provides design, fabrication and installation services to single and multi-family
homebuilders, remodelers and consumers under the Armstrong® brand name. All of Cabinets’ sales
are in the U.S.
Unallocated Corporate — includes assets, liabilities, income and expenses that have not been
allocated to the business units. Balance sheet items classified as Unallocated Corporate are
primarily income tax related accounts, cash and cash equivalents, the Armstrong brand name, the
U.S. prepaid pension cost/liability and long-term debt. Expenses for our corporate departments and
certain benefit plans are allocated to the reportable segments based on known metrics, such as
specific activity, time reporting, headcount, square-footage or net sales. The remaining items,
which cannot be attributed to the reportable segments without a high degree of generalization, are
reported in Unallocated Corporate.
6
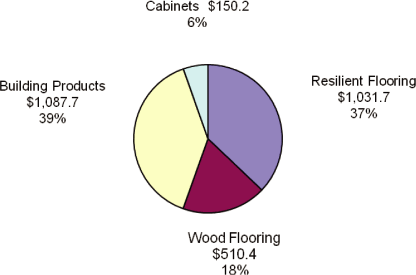
The following chart illustrates the breakdown of our consolidated net sales of $2.8 billion for the
year ended December 31, 2009 by segment:
2009 Consolidated Net Sales by Segment
(in millions)
See Note 3 to the Consolidated Financial Statements and Item 7 Management’s Discussion and Analysis
of Financial Condition and Results of Operations of this Form 10-K for additional financial
information on our reportable segments.
Markets
The major markets in which we compete are:
North American Residential. Approximately 40% of our total consolidated net sales are for North
American residential use. Our Resilient Flooring, Wood Flooring, Building Products and Cabinets
segments sell products for use in the home. Homeowners have a multitude of finishing solution
options for every room in their house. For flooring, they can choose from our vinyl and wood
products, for which we are North America’s largest provider, or from our laminate and ceramic
products. We compete directly with other domestic and international suppliers of these products.
Our flooring products also compete with carpet, which we do not offer. Our ceiling products
compete against mineral fiber and fiberglass products from other manufacturers, as well as drywall.
In the kitchen and bath areas, we compete with thousands of other cabinet manufacturers that
include large diversified corporations as well as small local craftsmen.
7
Our products are used in new home construction and existing home renovation work. Industry
estimates are that existing home renovation (also known as replacement / remodel) work represents
approximately two-thirds of the total North American residential market opportunity. Key U.S.
statistics that indicate market opportunity include existing home sales (a key indicator for
renovation opportunity), housing starts, housing completions, interest rates and consumer
confidence. For our Resilient Flooring and Wood Flooring products, we believe there is some
longer-term correlation between these statistics and our revenue after reflecting a lag period
between change in construction activity and our operating results of several months. However, we
believe that consumers’ preferences for product type, style, color, availability and affordability
also significantly affect our revenue. Further, changes in inventory levels and product focus at
national home centers, which are our largest customers, can also significantly affect our revenue.
Sales of our ceiling products for residential use appear to follow the trend of existing home
sales, with a several month lag period between the change in existing home sales and our related
operating results.
North American Commercial. Approximately 30% of our total consolidated net sales are for North
American commercial use. Many of our products, primarily ceilings and Resilient Flooring, are used
in commercial and institutional buildings. Our revenue opportunities come from new construction as
well as renovation of existing buildings. Renovation work is estimated to represent approximately
three-fourths of the total North American commercial market opportunity. Most of our revenue comes
from four major segments of commercial building — office, education, retail and healthcare. We
monitor U.S. construction starts (an indicator of U.S. monthly construction activity that provides
us a reasonable indication of upcoming opportunity) and follow new projects. We have found that
our revenue from new construction can lag behind construction starts by as much as one year. We
also monitor office vacancy rates, gross domestic product (“GDP”) and general employment levels,
which can indicate movement in renovation and new construction opportunities. We believe that
these statistics, taking into account the time-lag effect, provide a reasonable indication of our
future revenue opportunity from commercial renovation and new construction.
Outside of North America. The geographies outside of North America account for about 30% of our
total consolidated net sales. Most of our revenues generated outside of North America are in
Europe and are commercial in nature. For the countries in which we have significant revenue, we
monitor various national statistics (such as GDP) as well as known new projects. Revenues come
primarily from new construction and renovation work.
The following table provides an estimate of our segments’ 2009 net sales, by major markets.
| |
|
|
|
|
|
|
|
|
|
|
|
|
|
|
|
|
| |
|
North |
|
|
North |
|
|
Outside of |
|
|
|
|
| (Estimated percentages of |
|
American |
|
|
American |
|
|
North |
|
|
|
|
| individual segment’s sales) |
|
Residential |
|
|
Commercial |
|
|
America |
|
|
Total |
|
Resilient Flooring |
|
|
35 |
% |
|
|
30 |
% |
|
|
35 |
% |
|
|
100 |
% |
Wood Flooring |
|
|
95 |
% |
|
|
5 |
% |
|
|
— |
|
|
|
100 |
% |
Building Products |
|
|
10 |
% |
|
|
50 |
% |
|
|
40 |
% |
|
|
100 |
% |
Cabinets |
|
|
90 |
% |
|
|
10 |
% |
|
|
— |
|
|
|
100 |
% |
8
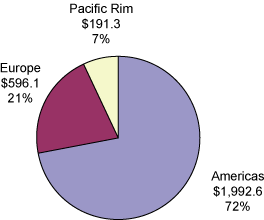
Geographic Areas
We sell our products in more than 80 countries. Approximately 70% of our 2009 revenue was derived
from sales in the Americas, the vast majority of which came in the United States and Canada. The
following chart illustrates the breakdown of our consolidated net sales of $2.8 billion for the
year ended December 31, 2009 by region, based on where the sale was made:
2009 Consolidated Net Sales by Geography
(in millions)
See Note 3 to the Consolidated Financial Statements and Item 7. Management’s Discussion and
Analysis of Financial Condition and Results of Operations of this Form 10-K for additional
financial information by geographic areas.
Customers
We use our reputation, capabilities, service and brand recognition to develop long-standing
relationships with our customers. We principally sell products through building materials
distributors, who re-sell our products to retailers, builders, contractors, installers and others.
In the commercial sector, we also sell to several contractors and to subcontractors’ alliances. In
the North American retail channel, which sells to end-users in the residential and light commercial
segments, we have important relationships with national home centers such as The Home Depot, Inc.
and Lowe’s Companies, Inc. In the North American residential sector, we have important
relationships with major home builders and buying groups.
9
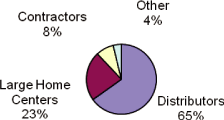
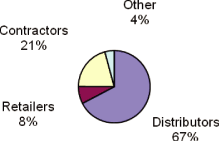
The following charts illustrate the estimated breakdown of our 2009 consolidated net sales
geographically by distribution channel:
2009 Americas Sales by Customer Type
2009 Non-Americas Sales by Customer Type
No customer accounted for 10% or more of our total consolidated net sales during any of the last
three years.
Product Array and Impact on Performance
Each of our businesses offers a wide assortment of products that are differentiated by style/design
and by performance attributes. Pricing for products within the assortment varies. Changes in the
relative quantity of products purchased at the different price points can impact year-to-year
comparisons of net sales and operating income. Where significant, we discuss the impact of these
relative changes as “product mix,” “customer mix” or “geographic mix” in Item 7.
Management’s Discussion and Analysis of Financial Condition and Results of Operations of this Form
10-K.
10
Competition
There is strong competition in all of our businesses. Principal attributes of competition include
product performance, product styling, service and price. Competition in North America comes from
both domestic and international manufacturers. Additionally, some of our products compete with
alternative products or finishing solutions. Our resilient, laminate and wood flooring products
compete with carpet products, and our ceiling products compete with drywall and exposed structure
(also known as open plenum). There is excess industry capacity for certain products in some
geographies, which tends to increase price competition. The following companies are our primary
competitors:
Flooring segments — Amtico International, Inc., Beaulieu International Group, N.V., Boa-Franc,
Inc., Congoleum Corporation, Faus, Inc., Forbo Holding AG, Gerflor Group, Interface, Inc., IVC
Group, Krono Holding AG, Mannington Mills, Inc., Metroflor Corporation, Mullican Flooring, L.P.,
Mohawk Industries, Inc., Pfleiderer AG, Shaw Industries, Inc., Somerset Hardwood Flooring, Tarkett
AG and Wilsonart International.
Building Products — CertainTeed, Chicago Metallic Corporation, Georgia-Pacific Corporation, Knauf
AMF GmbH & Co. KG, Lafarge SA, Odenwald Faserplattenwerk GmbH, Rockfon A/S, Saint-Gobain and USG
Corporation.
Cabinets — American Woodmark Corporation, Fortune Brands, Inc. and Masco Corporation.
Raw Materials
Raw materials essential to our businesses are purchased worldwide in the ordinary course of
business from numerous suppliers. The principal raw materials used in each business include the
following:
| |
|
|
| Business |
|
Principal Raw Materials |
|
|
|
Resilient Flooring
|
|
Polyvinylchloride (“PVC”) resins and films,
plasticizers, backings, limestone, pigments, linseed
oil, inks and stabilizers |
|
|
|
Wood Flooring
|
|
Hardwood lumber, veneer, coatings and stains |
|
|
|
Building Products
|
|
Mineral fibers, perlite, waste paper, clays, starches
and steel used in the production of metal ceilings and
for our WAVE joint venture’s manufacturing of ceiling
grid |
|
|
|
Cabinets
|
|
Lumber, veneer, plywood, particleboard and components,
such as doors and hardware |
We also purchase significant amounts of packaging materials and consume substantial amounts of
energy, such as electricity and natural gas, and water.
In general, adequate supplies of raw materials are available to all of our businesses. However,
availability can change for a number of reasons, including environmental conditions, laws and
regulations, shifts in demand by other industries competing for the same materials, transportation
disruptions and/or business decisions made by, or events that affect, our suppliers. There is no
assurance that a significant shortage of raw materials will not occur.
Prices for certain high usage raw materials can fluctuate dramatically. Cost increases for these
materials can have a significant adverse impact on our manufacturing costs. Given the
competitiveness of our markets, we may not be able to recover the increased manufacturing costs
through increasing selling prices to our customers.
11
Sourced Products
Some of the products that we sell are sourced from third parties. Our primary sourced products
include various flooring products (laminate, wood, vinyl sheet and tile and ceramic), specialized
ceiling products, and installation-related products and accessories for some of our manufactured
products. We purchase some of our sourced products from suppliers that are located outside of the
U.S., primarily from Asia and Europe. Sales of sourced products represented approximately 10% to
15% of our total consolidated revenue in 2009, 2008, and 2007.
In general, we believe we have adequate supplies of sourced products. However, we cannot guarantee
that a significant shortage will not occur.
Hedging
We use derivative financial instruments to hedge the following exposures: sourced product purchases
denominated in foreign currency, cross-currency intercompany loans, interest rate risk, and energy.
We use derivative financial instruments as risk management tools, not for speculative trading
purposes. See Item 7A Quantitative and Qualitative Disclosures About Market Risk and Note 19 to
the Consolidated Financial Statements of this Form 10-K for more information.
Patent and Intellectual Property Rights
Patent protection is important to our business in the U.S. and other markets. Our competitive
position has been enhanced by U.S. and foreign patents on products and processes developed or
perfected within Armstrong or obtained through acquisitions and licenses. In addition, we benefit
from our trade secrets for certain products and processes.
Patent protection extends for varying periods according to the date of patent filing or grant and
the legal term of a patent in the various countries where patent protection is obtained. The
actual protection afforded by a patent, which can vary from country to country, depends upon the
type of patent, the scope of its coverage, and the availability of legal remedies. Although we
consider that, in the aggregate, our patents, licenses and trade secrets constitute a valuable
asset of material importance to our business, we do not regard any of our businesses as being
materially dependent upon any single patent or trade secret, or any group of related patents or
trade secrets.
Certain of our trademarks, including without limitation,

,Armstrong
®, Allwood™, Alterna™,
Arborcrest™, Arteffects
®, Axiom
®, Bruce
®, Calibra™, Capella
®, Caruth™, Capz™,
Ceramaguard
®, Cirrus
®, Corlon
®, Coronet™, Cortega
®, CushionStep™, Designer
Solarian
®, DLW™, Dune™, Excelon
®, Fine Fissured™, Fundamentals
® , Grand Illusions™,
Hartco
®, HomerWood
®, Infusions
®, Luxe Plank™, Medintech
®, Medintone
®, Mesa™, Metalworks™,
Natural Creations
®, Natural Inspirations
®, Nature’s Gallery
®, Optima
®, Park Avenue™, Robbins
®,
Rhinofloor
®, Sahara™, Scala
®, Second Look
®, Solarian
®, SoundScapes
®, SoundSoak
®,
StrataMax
®,
Techzone™, Timberland
®, T. Morton™, ToughGuard
®, Town&Country™, Ultima
®,
Waverly™, and Woodworks
® are important to our business because of their significant brand
name recognition. Trademark protection continues in some countries as long as the mark is used,
and continues in other countries as long as the mark is registered. Registrations are generally
for fixed, but renewable, terms.
Employees
As of December 31, 2009, we had approximately 10,800 full-time and part-time employees worldwide,
with approximately 7,300 employees located in the United States. Approximately 6,900 of the 10,800
are production and maintenance employees, of whom approximately 4,900 are located in the U.S.
Approximately 64% of the production and maintenance employees in the U.S. are represented by labor
unions. This percentage includes all production and maintenance employees at our plants and
warehouses where labor unions exist. Outside the U.S., most of our production employees are
covered by either industry-sponsored and/or state-sponsored collective bargaining mechanisms.
12
During the first quarter of 2010, we announced the shutdown of finished goods production at two
Wood Flooring plants and the restarting of certain operations at a previously idled Wood Flooring
plant. We expect a net reduction in our employee headcount as a result of these actions of
approximately 200 employees by the end of the second quarter of 2010.
Research & Development
Research and development (“R&D”) activities are important and necessary in helping us improve our
products’ competitiveness. Principal R&D functions include the development and improvement of
products and manufacturing processes. We spent $38.0 million in 2009, $38.8 million in 2008 and
$44.0 million in 2007 on R&D activities worldwide.
Environmental Matters
Most of our manufacturing and certain of our research facilities are affected by various federal,
state and local environmental requirements relating to the discharge of materials or the protection
of the environment. We make expenditures necessary for compliance with applicable environmental
requirements at each of our operating facilities.
We are actively involved in proceedings under the Comprehensive Environmental Response,
Compensation and Liability Act (“CERCLA”), and similar state “Superfund” laws at three off-site
locations. We have also been investigating and/or remediating environmental contamination
allegedly resulting from past industrial activity at four domestic and five international current
or former plant sites. Certain of AWI’s environmental liabilities were discharged through its
Chapter 11 case while others were not. Those environmental obligations that AWI has with respect
to property that it owns or operates or for which a non-debtor subsidiary is liable were unaffected
by the Chapter 11 case. Therefore, AWI and its subsidiaries retain ongoing environmental
compliance obligations at such properties.
Liabilities of $6.3 million and $6.5 million at December 31, 2009 and December 31, 2008,
respectively, were for environmental liabilities that we consider probable and for which a
reasonable estimate of the probable liability could be made. See Note 30 to the Consolidated
Financial Statements of this Form 10-K for more information.
13
As noted in the introductory section titled “Uncertainties Affecting Forward-Looking Statements,”
our business, operations and financial condition are subject to various risks. These risks should
be taken into account in evaluating any investment decision involving Armstrong. It is not
possible to predict or identify all factors that could cause actual results to differ materially
from expected and historical results. The following discussion is a summary of what we believe to
be our most significant risk factors. These and other factors could cause our actual results to
differ materially from those in forward-looking statements made in this report.
We try to reduce both the likelihood that these risks will affect our businesses and their
potential impact. However, no matter how accurate our foresight, how well we evaluate risks, and
how effective we are at mitigating them, it is still possible that one of these problems or some
other issue could have serious consequences for us, up to and including a materially adverse
effect. See related discussions in this document and our other SEC filings for more details and
subsequent disclosures.
Our business is dependent on construction activity. Downturns in construction activity and global
economic conditions, such as weak consumer confidence and weak credit markets, adversely affect our
business and our profitability.
Our businesses have greater sales opportunities when construction activity is strong and,
conversely, have fewer opportunities when such activity declines. Construction activity tends to
increase when economies are strong, interest rates are favorable, government spending is strong,
and consumers are confident. When the economy is weak and access to credit is limited, customers,
distributors and suppliers are at heightened risk of defaulting on their obligations. Since most
of our sales are in the U.S., its economy is the most important for our business, but conditions in
Europe, Canada and Asia also are significant. A prolonged economic downturn would exacerbate the
adverse effect on our business, profitability, and the carrying value of assets.
We require a significant amount of liquidity to fund our operations.
Our liquidity needs vary throughout the year. There are no significant debt maturities until 2011
and 2013 under our existing senior credit facility. We believe that cash on hand and generated
from operations will be adequate to address our foreseeable liquidity needs. If future operating
performance declines significantly, we cannot assure that our business will generate sufficient
cash flow from operations to fund our needs or to remain in compliance with our debt covenants.
Our markets are highly competitive. Competition can reduce demand for our products or cause us to
lower prices. Failure to compete effectively by meeting consumer preferences and/or maintaining
market share would adversely affect our results.
Our customers consider our products’ performance, product styling, customer service and price when
deciding whether to purchase our products. Shifting consumer preference in our highly competitive
markets, e.g. from residential vinyl products to other flooring products, styling preferences or
inability to offer new competitive performance features could hurt our sales. For certain products
there is excess industry capacity in several geographic markets, which tends to increase price
competition, as does competition from overseas competitors with lower cost structures.
If the availability of raw materials and energy decreases, or the costs increase, and we are unable
to pass along increased costs, our operating results could be adversely affected.
The cost and availability of raw materials, packaging materials, energy and sourced products are
critical to our operations. For example, we use substantial quantities of natural gas,
petroleum-based raw materials, hardwood lumber and mineral fiber in our manufacturing operations.
The cost of some items has been volatile in recent years and availability sometimes has been tight.
We source some materials
from a limited number of suppliers, which, among other things, increases the risk of
unavailability. Limited availability could cause us to reformulate products or to limit our
production. The impact of increased costs is greatest where our ability to pass along increased
costs through price increases on our products is limited, whether due to competitive pressures or
other factors.
14
Reduction in sales to key customers could have a material adverse effect on our revenues and
profits.
Some of our businesses are dependent on a few key customers such as The Home Depot, Inc. and Lowe’s
Companies, Inc. The loss of sales to one of these major customers, or changes in our business
relationship with them, could hurt both our revenues and profits.
Changes in the political, regulatory and business environments of our international markets,
including changes in trade regulations and currency exchange fluctuations, could have an adverse
effect on our business.
A significant portion of our products move in international trade, particularly among the U.S.,
Canada, Europe and Asia. Also, approximately 30% of our annual revenues are from operations
outside the U.S. Our international trade is subject to currency exchange fluctuations, trade
regulations, import duties, logistics costs and delays and other related risks. Our international
operations are also subject to variable tax rates, credit risks in emerging markets, political
risks, uncertain legal systems, potential restrictions on repatriating profits to the U.S., and
loss of sales to local competitors following currency devaluations in countries where we import
products for sale.
Capital investments and restructuring actions may not achieve expected savings in our operating
costs.
We look for ways to make our operations more efficient and effective. We reduce, move and expand
our plants and operations as needed. Each action generally involves substantial planning and
capital investment. We can err in planning and executing our actions, which could hurt our
customer service and cause unplanned costs.
Labor disputes or work stoppages could hurt production and reduce sales and profits.
Most of our manufacturing employees are represented by unions and are covered by collective
bargaining or similar agreements that must be periodically renegotiated. Although we anticipate
that we will reach new contracts as current ones expire, our negotiations may result in a
significant increase in our costs. Failure to reach new contracts could lead to work stoppages,
which could hurt production, revenues, profits and customer relations.
Adverse judgments in regulatory actions, product claims and other litigation could be costly.
Insurance coverage may not be available or adequate in all circumstances.
While we strive to ensure that our products comply with applicable government regulatory standards
and internal requirements, and that our products perform effectively and safely, customers from
time to time could claim that our products do not meet contractual requirements, and users could
claim to be harmed by use or misuse of our products. This could give rise to breach of contract,
warranty or recall claims, or claims for negligence, product liability, strict liability, personal
injury or property damage. The building materials industry has been subject to claims relating to
silicates, mold, PCBs, PVC, formaldehyde, toxic fumes, fire-retardant properties and other issues,
as well as for incidents of catastrophic loss, such as building fires. Product liability insurance
coverage may not be available or adequate in all circumstances. In addition, claims may arise
related to patent infringement, environmental liabilities, distributor terminations, commercial
contracts, antitrust or competition law, employment law and employee benefits issues, and other
regulatory matters. While we have in place processes and policies to mitigate these risks and to
investigate and address such claims as they arise, we cannot predict the costs to defend or resolve
such claims. We are subject to regulatory requirements regarding protection of the environment.
Current and future environmental laws and regulations, including those proposed concerning climate
change, could increase our cost of compliance, cost of energy, or otherwise materially adversely
affect our business, results of operations and financial condition.
15
Our principal shareholders could significantly influence our business and our affairs.
The Armstrong World Industries, Inc. Asbestos Personal Injury Settlement Trust (“Asbestos PI
Trust”), formed in 2006 as part of AWI’s emergence from bankruptcy, and Armor TPG Holdings LLC
(“TPG”) together hold more than 60% of the Company’s outstanding shares and have entered into a
shareholders’ agreement pursuant to which the Asbestos PI Trust and TPG have agreed to vote their
shares together on certain matters. Such a large percentage of ownership could result in below
average equity market liquidity and affect matters which require approval by our shareholders.
|
|
|
| ITEM 1B. |
|
UNRESOLVED STAFF COMMENTS |
None.
16
Our world headquarters are in Lancaster, Pennsylvania. We own a 100-acre, multi-building campus
comprising the site of our corporate headquarters, most operational headquarters, our U.S. R&D
operations and marketing, and customer service headquarters. Altogether our headquarters’
operations occupy approximately one million square feet of floor space.
We produce and market Armstrong products and services throughout the world, operating 36
manufacturing plants in nine countries as of December 31, 2009. Three of our plants are leased and
the remaining 33 are owned. We have 22 plants located throughout the United States. In addition,
we have an interest through our WAVE joint venture in eight additional plants in six countries.
| |
|
|
|
|
|
|
| Business Segment |
|
Number of Plants |
|
Location of Principal Facilities |
|
|
|
|
|
|
|
Resilient Flooring
|
|
|
12 |
|
|
U.S. (California, Illinois,
Mississippi, Oklahoma,
Pennsylvania), Australia,
Germany, Sweden and the U.K. |
|
|
|
|
|
|
|
Wood Flooring
|
|
|
10 |
|
|
U.S. (Arkansas, Kentucky,
Missouri, North Carolina,
Pennsylvania, Tennessee, Texas,
West Virginia) |
|
|
|
|
|
|
|
Building Products
|
|
|
13 |
|
|
U.S. (Florida, Georgia, Oregon,
Pennsylvania), China, France,
Germany and the U.K. |
|
|
|
|
|
|
|
Cabinets
|
|
|
1 |
|
|
U.S. (Pennsylvania) |
During the first quarter of 2010, we announced the shutdown of finished goods production at two
Wood Flooring plants and the restarting of certain operations at a previously idled Wood Flooring
plant.
Sales and administrative offices are leased and/or owned worldwide, and leased facilities are
utilized to supplement our owned warehousing facilities.
Production capacity and the extent of utilization of our facilities are difficult to quantify with
certainty. In any one facility, utilization of our capacity varies periodically depending upon
demand for the product that is being manufactured. We believe our facilities are adequate and
suitable to support the business. Additional incremental investments in plant facilities are made
as appropriate to balance capacity with anticipated demand, improve quality and service, and reduce
costs.
|
|
|
| ITEM 3. |
|
LEGAL PROCEEDINGS |
See Note 30 to the Consolidated Financial Statements, which is incorporated herein by reference,
for a full description of our legal proceedings.
|
|
|
| ITEM 4. |
|
SUBMISSION OF MATTERS TO A VOTE OF SECURITY HOLDERS |
No matters were submitted to a vote of stockholders during the fourth quarter of 2009.
17
|
|
|
| ITEM 4A. |
|
EXECUTIVE OFFICERS OF THE COMPANY |
Executive Officer Information
The following information is current as of February 26, 2010. Each executive officer serves a
one-year term until reelected or until his earlier death, resignation, retirement or removal.
Michael D. Lockhart
Age 60 — Chairman of the Board and President since March 2001; Chairman of the Board, President and
Chief Executive Officer since December 2002; Chairman and Chief Executive Officer of the Company’s
former holding company from August 2000 — December 2007. Mr. Lockhart previously served as Chairman
and Chief Executive Officer of General Signal, a diversified manufacturer, headquartered in
Stamford, Connecticut from September 1995 until it was acquired in October 1998. He joined General
Signal as President and Chief Operating Officer in September 1994. From 1981 until 1994, Mr.
Lockhart worked for General Electric in various executive capacities in the GE Credit Corporation
(now GE Capital), GE Transportation Systems and GE Aircraft Engines. Mr. Lockhart is a member of
the Board of Directors of the Norfolk Southern Corporation and a member of the Business Council for
the Booth School of Business at the University of Chicago. Pursuant to a separation agreement
effective February 28, 2010, between Mr. Lockhart and the Company, Mr. Lockhart will step down as
Chief Executive Officer and President of the Company and Chairman and member of the Board of
Directors. Terms of the separation agreement are set forth in the Current Report on Form 8-K dated
February 10, 2010. James J. O’Connor, currently Lead Director, will serve as non-executive
Chairman of the Board after Mr. Lockhart’s departure.
Thomas B. Mangas
Age 42 — Senior Vice President and Chief Financial Officer since February 2010. Previously, Vice
President and Chief Financial Officer of Beauty & Grooming Business of the Procter & Gamble Company
(“P&G”). He previously served as General Manager and Chief Financial Officer of the Fabric Care
Global Business Unit of P&G from 2005 — 2008 and Director and Chief Financial Officer of P&G
Tüketim Mallari A.S. from 2003 — 2005.
Stephen F. McNamara
Age 43 — Vice President and Controller since July 2008. Previously, Director, Internal Audit,
November 2005 — July 2008; Assistant Controller, October 2001 — November 2005; Manager of External
Reporting, May 1999 — October 2001. Prior to that he was Assistant Controller with Hunt
Corporation (a former international art and office supply company).
Jeffrey D. Nickel
Age 47 — Senior Vice President, Secretary and General Counsel since August 2008. Previously Senior
Vice President and General Counsel since July 2008; previously Deputy General Counsel — Business
and Commercial Law, September 2001 — July 2008. Prior to that he worked for Dow Corning
Corporation (specialty chemical company), December 1992 — September 2001, his last title being
senior attorney.
Frank J. Ready
Age 48 — Executive Vice President and Chief Executive Officer, Flooring Products North America and
Floor Asia since January 2010. Previously Executive Vice President and Chief Executive Officer
North American Flooring Products from April 2008 — January 2010. Previously, President and Chief
Executive Officer, North American Flooring Operations, June 2004 — April 2008. Previously Senior
Vice President, Sales and Marketing, July 2003 — June 2004; Senior Vice President, Operations,
December 2002 — July 2003; Senior Vice President, Marketing, June 2000 — December 2002.
18
PART II
|
|
|
| ITEM 5. |
|
MARKET FOR THE REGISTRANT’S COMMON EQUITY, RELATED STOCKHOLDER MATTERS AND ISSUER
PURCHASES OF EQUITY SECURITIES |
AWI’s common shares trade on the New York Stock Exchange under the ticker symbol “AWI”. As of
February 18, 2010, there were approximately 500 holders of record of AWI’s Common Stock.
| |
|
|
|
|
|
|
|
|
|
|
|
|
|
|
|
|
|
|
|
|
| |
|
First |
|
|
Second |
|
|
Third |
|
|
Fourth |
|
|
Total Year |
|
2009 |
|
|
|
|
|
|
|
|
|
|
|
|
|
|
|
|
|
|
|
|
Price range of common stock—high |
|
$ |
23.74 |
|
|
$ |
21.80 |
|
|
$ |
35.50 |
|
|
$ |
45.45 |
|
|
$ |
45.45 |
|
Price range of common stock—low |
|
$ |
9.42 |
|
|
$ |
10.55 |
|
|
$ |
15.05 |
|
|
$ |
33.14 |
|
|
$ |
9.42 |
|
|
|
|
|
|
|
|
|
|
|
|
|
|
|
|
|
|
|
|
|
|
2008 |
|
|
|
|
|
|
|
|
|
|
|
|
|
|
|
|
|
|
|
|
Price range of common stock—high |
|
$ |
40.98 |
|
|
$ |
39.44 |
|
|
$ |
40.19 |
|
|
$ |
28.94 |
|
|
$ |
40.98 |
|
Price range of common stock—low |
|
$ |
26.25 |
|
|
$ |
28.92 |
|
|
$ |
27.10 |
|
|
$ |
13.79 |
|
|
$ |
13.79 |
|
The above figures represent the high and low intra-day sale prices for our common stock as reported
by the New York Stock Exchange.
On February 25, 2008, our Board of Directors declared a special cash dividend of $4.50 per common
share, payable on March 31, 2008, to shareholders of record on March 11, 2008. This special cash
dividend resulted in an aggregate cash payment to our shareholders of $256.4 million. There were
no dividends declared during 2009.
Issuer Purchases of Equity Securities
| |
|
|
|
|
|
|
|
|
|
|
|
|
|
|
|
|
| |
|
|
|
|
|
|
|
|
|
Total Number of |
|
|
Maximum |
|
| |
|
|
|
|
|
|
|
|
|
Shares |
|
|
Number of |
|
| |
|
|
|
|
|
|
|
|
|
Purchased as |
|
|
Shares that may |
|
| |
|
|
|
|
|
|
|
|
|
Part of Publicly |
|
|
yet be |
|
| |
|
Total Number |
|
|
Average Price |
|
|
Announced |
|
|
Purchased under |
|
| |
|
of Shares |
|
|
Paid per |
|
|
Plans or |
|
|
the Plans or |
|
| Period |
|
Purchased |
|
|
Share1 |
|
|
Programs2 |
|
|
Programs |
|
October 2009 |
|
|
— |
|
|
|
— |
|
|
|
— |
|
|
|
— |
|
November 2009 |
|
|
1,531 |
|
|
$ |
44.13 |
|
|
|
— |
|
|
|
— |
|
December 2009 |
|
|
— |
|
|
|
— |
|
|
|
— |
|
|
|
— |
|
|
|
|
|
|
|
|
|
|
|
|
|
|
|
|
|
Total |
|
|
1,531 |
|
|
|
|
|
|
|
N/A |
|
|
|
N/A |
|
| |
|
|
| 1 |
|
Shares reacquired through the withholding of shares to pay employee tax obligations
upon the vesting of restricted shares previously granted under the 2006 Long Term Incentive Plan. |
| |
| 2 |
|
The Company does not have a share buy-back program. |
19
|
|
|
| ITEM 6. |
|
SELECTED FINANCIAL DATA |
| |
|
|
|
|
|
|
|
|
|
|
|
|
|
|
|
|
|
|
|
|
|
|
|
|
|
| |
|
Successor Company |
|
|
|
Predecessor Company |
|
| |
|
|
|
|
|
|
|
|
|
|
|
|
|
Three |
|
|
|
Nine |
|
|
|
|
| |
|
|
|
|
|
|
|
|
|
|
|
|
|
Months |
|
|
|
Months |
|
|
|
|
| |
|
|
|
|
|
|
|
|
|
|
|
|
|
Ended |
|
|
|
Ended |
|
|
|
|
| |
|
Year |
|
|
Year |
|
|
Year |
|
|
December |
|
|
|
September |
|
|
Year |
|
| (Dollars in millions except for per-share data) |
|
2009 |
|
|
2008 |
|
|
2007 |
|
|
31, 2006 |
|
|
|
30, 2006(1) |
|
|
2005 |
|
Income statement data |
|
|
|
|
|
|
|
|
|
|
|
|
|
|
|
|
|
|
|
|
|
|
|
|
|
Net sales |
|
$ |
2,780.0 |
|
|
$ |
3,393.0 |
|
|
$ |
3,549.7 |
|
|
$ |
817.3 |
|
|
|
$ |
2,608.6 |
|
|
$ |
3,326.6 |
|
Cost of goods sold |
|
|
2,159.0 |
|
|
|
2,632.0 |
|
|
|
2,687.5 |
|
|
|
660.9 |
|
|
|
|
2,030.2 |
|
|
|
2,654.0 |
|
Selling, general and administrative expenses |
|
|
552.4 |
|
|
|
579.9 |
|
|
|
611.3 |
|
|
|
143.5 |
|
|
|
|
415.5 |
|
|
|
587.8 |
|
Intangible asset impairment |
|
|
18.0 |
|
|
|
25.4 |
|
|
|
— |
|
|
|
— |
|
|
|
|
— |
|
|
|
— |
|
Restructuring charges, net |
|
|
— |
|
|
|
0.8 |
|
|
|
0.2 |
|
|
|
1.7 |
|
|
|
|
10.0 |
|
|
|
23.0 |
|
Equity (earnings) from joint ventures |
|
|
(40.0 |
) |
|
|
(56.0 |
) |
|
|
(46.0 |
) |
|
|
(5.3 |
) |
|
|
|
(41.4 |
) |
|
|
(39.3 |
) |
|
|
|
|
|
|
|
|
|
|
|
|
|
|
|
|
|
|
|
|
Operating income |
|
|
90.6 |
|
|
|
210.9 |
|
|
|
296.7 |
|
|
|
16.5 |
|
|
|
|
194.3 |
|
|
|
101.1 |
|
Interest expense |
|
|
17.7 |
|
|
|
30.8 |
|
|
|
55.0 |
|
|
|
13.4 |
|
|
|
|
5.2 |
|
|
|
7.7 |
|
Other non-operating expense |
|
|
0.9 |
|
|
|
1.3 |
|
|
|
1.4 |
|
|
|
0.3 |
|
|
|
|
1.0 |
|
|
|
1.5 |
|
Other non-operating (income) |
|
|
(3.2 |
) |
|
|
(10.6 |
) |
|
|
(18.2 |
) |
|
|
(4.3 |
) |
|
|
|
(7.2 |
) |
|
|
(11.8 |
) |
Chapter 11 reorganization (income), net |
|
|
— |
|
|
|
— |
|
|
|
(0.7 |
) |
|
|
— |
|
|
|
|
(1,955.5 |
) |
|
|
(1.2 |
) |
Income tax (benefit) expense |
|
|
(2.5 |
) |
|
|
109.0 |
|
|
|
106.4 |
|
|
|
3.8 |
|
|
|
|
726.6 |
|
|
|
(1.2 |
) |
|
|
|
|
|
|
|
|
|
|
|
|
|
|
|
|
|
|
|
|
Earnings from continuing operations |
|
|
77.7 |
|
|
|
80.4 |
|
|
|
152.8 |
|
|
|
3.3 |
|
|
|
|
1,424.2 |
|
|
|
106.1 |
|
Per common share — basic (a) |
|
$ |
1.36 |
|
|
$ |
1.41 |
|
|
$ |
2.69 |
|
|
$ |
0.06 |
|
|
|
|
n/a |
|
|
|
n/a |
|
Per common share — diluted (a) |
|
$ |
1.36 |
|
|
$ |
1.41 |
|
|
$ |
2.69 |
|
|
$ |
0.06 |
|
|
|
|
n/a |
|
|
|
n/a |
|
Earnings (loss) from discontinued operations |
|
|
— |
|
|
|
0.6 |
|
|
|
(7.5 |
) |
|
|
(1.1 |
) |
|
|
|
(68.4 |
) |
|
|
5.0 |
|
|
|
|
|
|
|
|
|
|
|
|
|
|
|
|
|
|
|
|
|
Net earnings |
|
$ |
77.7 |
|
|
$ |
81.0 |
|
|
$ |
145.3 |
|
|
$ |
2.2 |
|
|
|
$ |
1,355.8 |
|
|
$ |
111.1 |
|
Per common share — basic (a) |
|
$ |
1.36 |
|
|
$ |
1.42 |
|
|
$ |
2.56 |
|
|
$ |
0.04 |
|
|
|
|
n/a |
|
|
|
n/a |
|
Per common share — diluted (a) |
|
$ |
1.36 |
|
|
$ |
1.42 |
|
|
$ |
2.56 |
|
|
$ |
0.04 |
|
|
|
|
n/a |
|
|
|
n/a |
|
Dividends declared per share of common stock |
|
|
— |
|
|
$ |
4.50 |
|
|
|
— |
|
|
|
— |
|
|
|
|
— |
|
|
|
— |
|
Average number of common shares outstanding
(in millions) |
|
|
57.4 |
|
|
|
57.1 |
|
|
|
56.6 |
|
|
|
55.0 |
|
|
|
|
n/a |
|
|
|
n/a |
|
Average number of employees |
|
|
11,400 |
|
|
|
12,500 |
|
|
|
13,500 |
|
|
|
14,500 |
|
|
|
|
14,700 |
|
|
|
14,900 |
|
|
|
|
|
|
|
|
|
|
|
|
|
|
|
|
|
|
|
|
|
|
|
|
|
|
|
Balance sheet data (end of period) |
|
|
|
|
|
|
|
|
|
|
|
|
|
|
|
|
|
|
|
|
|
|
|
|
|
Working capital |
|
$ |
974.3 |
|
|
$ |
876.1 |
|
|
$ |
1,003.7 |
|
|
$ |
854.6 |
|
|
|
|
|
|
|
$ |
1,128.0 |
|
Total assets |
|
|
3,302.6 |
|
|
|
3,351.8 |
|
|
|
4,639.4 |
|
|
|
4,152.7 |
|
|
|
|
|
|
|
|
4,602.1 |
|
Liabilities subject to compromise |
|
|
— |
|
|
|
— |
|
|
|
— |
|
|
|
1.3 |
|
|
|
|
|
|
|
|
4,869.4 |
|
Net long-term debt (b) |
|
|
432.5 |
|
|
|
454.8 |
|
|
|
485.8 |
|
|
|
801.5 |
|
|
|
|
|
|
|
|
21.5 |
|
Total equity (deficit) |
|
|
1,907.9 |
|
|
|
1,751.3 |
|
|
|
2,444.1 |
|
|
|
2,172.1 |
|
|
|
|
|
|
|
|
(1,312.0 |
) |
| |
|
|
| (1) |
|
Reflects the effects of the Plan of Reorganization and fresh-start reporting. AWI and its
subsidiaries adopted fresh-start reporting upon AWI emerging from Chapter 11. Consequently, the
impact of emergence, including the gain on settlement of liabilities subject to compromise and the
gain on fresh-start reporting, is reflected in the Predecessor Company for the nine months ended
September 30, 2006 and the results of operations beginning October 1, 2006 are reflected within the
Successor Company. |
| |
| Notes: |
| |
| (a) |
|
See definition of basic and diluted earnings per share in Note 2 to the Consolidated
Financial Statements. The common stock of the Predecessor Company was not publicly traded. |
| |
| (b) |
|
Net long-term debt excludes debt subject to compromise for 2005. |
Certain prior year amounts have been reclassified to conform to the current year presentation.
20
|
|
|
| ITEM 7. |
|
MANAGEMENT’S DISCUSSION AND ANALYSIS OF FINANCIAL CONDITION AND RESULTS
OF OPERATIONS |
Armstrong World Industries, Inc. (“AWI”) is a Pennsylvania corporation incorporated in 1891. When
we refer to “we”, “our” and “us” in this report, we are referring to AWI and its subsidiaries.
This discussion should be read in conjunction with the financial statements and the accompanying
notes included elsewhere in this Form 10-K. This discussion contains forward-looking statements
based on our current expectations, which are inherently subject to risks and uncertainties. Actual
results and the timing of certain events may differ significantly from those referred to in such
forward-looking statements. We undertake no obligation beyond what is required under applicable
securities law to publicly update or revise any forward-looking statement to reflect current or
future events or circumstances, including those set forth in the section entitled “Uncertainties
Affecting Forward-Looking Statements” and elsewhere in this Form 10-K.
Financial performance metrics excluding the translation effect of changes in foreign exchange rates
are not in compliance with U.S. generally accepted accounting principles (“GAAP”). We believe that
this information improves the comparability of business performance by excluding the impact of
changes in foreign exchange rates when translating comparable foreign currency amounts. We
calculate the translation effect of foreign exchange rates by applying constant foreign exchange
rates to the equivalent periods’ reported foreign currency amounts. We believe that this non-GAAP
metric provides a clearer picture of our operating performance. Furthermore, management evaluates
the performance of the businesses excluding the effects of foreign exchange rates.
We maintain a website at http://www.armstrong.com. Information contained on our website is not
incorporated into this document. Annual reports on Form 10-K, quarterly reports on Form 10-Q,
current reports on Form 8-K, all amendments to those reports and other information about us are
available free of charge through this website as soon as reasonably practicable after the reports
are electronically filed with the Securities and Exchange Commission (“SEC”). These materials are
also available from the SEC’s website at www.sec.gov.
OVERVIEW
We are a leading global producer of flooring products and ceiling systems for use primarily in the
construction and renovation of residential, commercial and institutional buildings. Through our
United States (“U.S.”) operations and U.S. and international subsidiaries, we design, manufacture
and sell flooring products (primarily resilient and wood) and ceiling systems (primarily mineral
fiber, fiberglass and metal) around the world. We also design, manufacture and sell kitchen and
bathroom cabinets in the U.S. As of December 31, 2009 we operated 36 manufacturing plants in nine
countries, including 22 plants located throughout the U.S. In response to economic conditions
during 2009, we idled a Resilient Flooring plant in Canada, a Wood Flooring plant in Mississippi
and a Building Products plant in Alabama, and we closed a Cabinets plant in Nebraska and a
previously idled Wood Flooring plant in Tennessee.
Through Worthington Armstrong Venture (“WAVE”), our joint venture with Worthington Industries,
Inc., we also have an interest in eight additional plants in six countries that produce suspension
system (grid) products for our ceiling systems.
We report our financial results through the following segments: Resilient Flooring, Wood Flooring,
Building Products, Cabinets and Unallocated Corporate. See “Results of Operations” and “Reportable
Segment Results” for additional financial information on our consolidated company and our segments.
21
Management’s Discussion and Analysis of Financial Condition and Results of Operations
(dollar amounts in millions)
Our consolidated net sales for 2009 were $2.8 billion, approximately 18% less than consolidated net
sales in 2008. Operating income was $90.6 million in 2009, as compared to $210.9 million in 2008.
The decline in sales was primarily due to lower volume in residential and commercial markets around
the world. The margin impact from sales volume declines offset the combined benefit from input cost
deflation, reduced manufacturing costs and lower selling, general and administrative (“SG&A”)
expenses. In addition, operating income was reduced by a $31.6 million non-cash charge from
accelerated vesting of stock-based compensation due to a transaction between Armor TPG Holdings LLC
(“TPG”) and the Armstrong World Industries, Inc. Asbestos Personal Injury Settlement Trust
(“Asbestos PI Trust”). See Note 23 to the Consolidated Financial Statements.
| |
• |
|
Resilient Flooring sales declined across geographic regions on lower volumes. Despite
lower sales, operating income improved compared to the prior year due to input cost
deflation, lower manufacturing and SG&A expenses and fewer expenses related to cost
reduction actions. |
| |
• |
|
Wood Flooring sales continued to decline due to weak domestic residential housing
markets. Operating loss was greater than the prior year as the margin impact of lower
volumes more than offset raw material deflation, lower manufacturing costs and reduced SG&A
expenses. Both years included significant intangible asset impairment charges. |
| |
• |
|
Building Products sales declined due to lower activity in global commercial construction
markets. Operating income also declined as the margin impact of lower volumes more than
offset lower manufacturing costs and reduced SG&A expenses. |
| |
• |
|
Cabinets sales and operating income declined primarily due to weak domestic residential
housing markets. A reduction in manufacturing expense was offset by charges related to a
plant closure. |
| |
• |
|
Corporate Unallocated expense increased $38.3 million primarily due to a $31.6 million
non-cash charge from accelerated vesting of stock-based compensation due to a transaction
between TPG and the Asbestos PI Trust. |
Factors Affecting Revenues
For an estimate of our segments’ 2009 net sales by major markets, see “Markets” in Item 1. Business
of this Form 10-K.
Markets. We compete in building material markets around the world. The majority of our sales are
in North America and Europe. During 2009, these markets experienced the following:
| |
• |
|
According to the U.S. Census Bureau, in 2009, housing starts of 0.55 million units in
the U.S. residential market declined 38.7% compared to 2008. Housing completions in the
U.S. decreased by 29.2% in 2009 with approximately 0.80 million units completed. The
National Association of Realtors indicated that sales of existing homes increased 5.5% to
5.16 million units in 2009 from a level of 4.89 million in 2008. |
| |
| |
|
|
According to the U.S. Census Bureau, U.S. retail sales through building materials, garden
equipment and supply stores (an indicator of home renovation activity) decreased 11.3% in
2009 compared 2008. |
| |
• |
|
According to the U.S. Census Bureau the rate of growth in the North American key
commercial market, in nominal dollar terms, was -14.7% in 2009. Construction activity in
the office, healthcare, and retail segments decreased 19.5%, 0.5%, and 31.3% respectively,
while activity in the education segment was up 0.3%. In the fourth quarter accelerating
rates of decline across these segments caused an overall rate of decline of 22.1%. |
22
Management’s Discussion and Analysis of Financial Condition and Results of Operations
(dollar amounts in millions)
| |
• |
|
Markets in European countries experienced broad declines. The declines were particularly
acute in Eastern European markets. |
| |
• |
|
Activity in Pacific Rim markets was generally slow. |
Quality and Customer Service Issues. Our quality and customer service are critical components of
our total value proposition. In 2009, we experienced no significant quality or customer service
issues.
Pricing Initiatives. We periodically modify prices in response to changes in costs for raw
materials and energy, and to market conditions and the competitive environment. In certain cases,
realized price increases are less than the announced price increases because of competitive
reactions and changing market conditions. We did not introduce any significant pricing actions in
2009. We estimate prior year pricing actions increased our total consolidated net sales in 2009 by
approximately $33 million when compared to 2008.
Mix. Each of our businesses offers a wide assortment of products that are differentiated by
style/design and by performance attributes. Pricing for products within the assortment varies.
Changes in the relative quantity of products purchased at the different price points can affect
year-to-year comparisons of net sales and operating income. Compared to 2008, we estimate mix
changes increased our total consolidated net sales in 2009 by approximately $6 million.
Factors Affecting Operating Costs
Operating Expenses. Our operating expenses are comprised of direct production costs (principally
raw materials, labor and energy), manufacturing overhead costs, freight, costs to purchase sourced
products and SG&A expenses.
Our largest individual raw material expenditures are for lumber and veneers, PVC resins and
plasticizers. Natural gas is also a significant input cost. Fluctuations in the prices of these
inputs are generally beyond our control and have a direct impact on our financial results. In 2009
these input costs were approximately $62 million lower than in 2008.
Stock-based Compensation. In August 2009 TPG and the Asbestos PI Trust entered into an agreement
whereby TPG purchased 7,000,000 shares of AWI common stock from the Asbestos PI Trust and acquired
an economic interest in an additional 1,039,777 shares from the Asbestos PI Trust. The Asbestos PI
Trust and TPG together hold more than 60% of AWI’s outstanding shares and have entered into a
shareholders’ agreement pursuant to which the Asbestos PI Trust and TPG have agreed to vote their
shares together on certain matters. Please refer to the shareholder’s agreement incorporated by
reference in this Form 10-K as Exhibit 99.2. Under the terms of the 2006 Long-Term Incentive Plan,
a change in control occurred, causing the accelerated vesting of all unvested stock-based
compensation issued to employees and directors. The non-cash charge to earnings related to this
accelerated vesting was $31.6 million and was recorded in the third quarter of 2009 in SG&A
expenses.
Intangible Asset Impairments. During the fourth quarters of 2009 and 2008 we recorded non-cash
impairment charges of $18.0 million and $25.4 million, respectively, to reduce the carrying amount
of our Wood Flooring trademarks to their estimated fair value. The fair value in both years was
negatively affected by lower expected future cash flows due to the decline in the U.S. residential
housing market. The initial fair value for these intangible assets was determined in 2006 as part
of fresh start reporting. See Note 11 to the Consolidated Financial Statements for more
information.
Cost Reduction Initiatives. During 2009 we recorded $12.7 million of charges primarily related to
the closure of our Auburn, Nebraska Cabinets facility, organizational and manufacturing changes for
our European Resilient Flooring business, and the closure of a previously idled Wood Flooring
plant.
During 2008 we recorded $20.0 million of charges (severance of $17.7 million and accelerated
depreciation of $2.3 million) primarily related to organizational and manufacturing changes for our
23
Management’s Discussion and Analysis of Financial Condition and Results of Operations
(dollar amounts in millions)
European Resilient Flooring business and the termination costs for certain corporate employees.
The European organizational changes were due to the decision to consolidate and outsource several
SG&A functions. The manufacturing changes primarily related to the decision to cease production of
automotive carpeting and other specialized textile flooring products. These charges were recorded
as part of cost of goods sold ($7.3 million) and SG&A expense ($12.7 million).
On-going Cost Improvements. In addition to the above-mentioned cost reduction initiatives, we have
an ongoing focus on continually improving our cost structure. As a result of these cost reduction
initiatives and our on-going improvement efforts, we have realized significant reductions in our
manufacturing conversion costs. Additional charges may be incurred in future periods for further
cost reduction actions.
See also “Results of Operations” for further discussion of other significant items affecting
operating costs.
Factors Affecting Cash Flow
Typically, we generate cash in our operating activities. The amount of cash generated in a period
is dependent on a number of factors, including the amount of operating profit generated, changes in
the amount of working capital (such as inventory, receivables and payables) required to operate our
businesses, and investments in property, plant & equipment and computer software (“PP&E”).
During 2009 cash and cash equivalents increased by $214.5 million. Net cash from operating
activities of $260.2 million and distributions from WAVE of $53.5 million were partially offset by
capital expenditures of $105.1 million. During 2008, cash and cash equivalents decreased by $159.3
million, with net cash from operating activities of $214.2 million offset by a special cash
dividend of $256.4 million, and capital expenditures of $95.0 million.
Employees
As of December 31, 2009, we had approximately 10,800 full-time and part-time employees worldwide.
This compares to approximately 12,200 employees as of December 31, 2008. The decline related
primarily to reductions in the manufacturing workforce as a result of significant sales volume
declines.
During the first quarter of 2010, we announced the shutdown of finished goods production at two
Wood Flooring plants and the restarting of certain operations at a previously idled Wood Flooring
plant. We expect a net reduction in our employee headcount as a result of these actions of
approximately 200 employees by the end of 2010.
During 2009, we negotiated five collective bargaining agreements and none of our locations
experienced work stoppages. Throughout 2010, collective bargaining agreements covering
approximately 800 employees at three plants are scheduled to expire.
CRITICAL ACCOUNTING ESTIMATES
In preparing our consolidated financial statements in accordance with U.S. generally accepted
accounting principles (“GAAP”), we are required to make certain estimates and assumptions that
affect the reported amounts of assets and liabilities and disclosure of contingent assets and
liabilities at the date of the financial statements, and the reported amounts of revenues and
expenses during the reporting period. We evaluate our estimates and assumptions on an on-going
basis, using relevant internal and external information. We believe that our estimates and
assumptions are reasonable. However, actual results may differ from what was estimated and could
have a significant impact on the financial statements.
We have identified the following as our critical accounting estimates. We have discussed these
critical accounting estimates with our Audit Committee.
Fresh-Start Reporting and Reorganization Value — As part of our emergence from bankruptcy
on October 2, 2006, we implemented fresh-start reporting. Our assets, liabilities and equity were
adjusted to fair value. In this regard, our Consolidated Financial Statements for periods
subsequent to October 2, 2006 reflect a new basis of accounting and are not comparable to our
historical consolidated financial statements for periods prior to October 2, 2006.
24
Management’s Discussion and Analysis of Financial Condition and Results of Operations
(dollar amounts in millions)
The adoption of fresh-start reporting had a material effect on our Consolidated Financial
Statements and was based on assumptions that employed a high degree of judgment. See Note 1 to the
Consolidated Financial Statements for further information relative to our reorganization.
U.S. Pension Credit and Postretirement Benefit Costs — We maintain pension and
postretirement plans throughout the world, with the most significant plans located in the U.S. Our
defined benefit pension and postretirement benefit costs are developed from actuarial valuations.
These valuations are calculated using a number of assumptions. Each assumption represents
management’s best estimate of the future. The assumptions that have the most significant impact on
reported results are the discount rate, the estimated long-term return on plan assets and the
estimated inflation in health care costs. These assumptions are generally updated annually.
The discount rate is used to determine retirement plan liabilities and to determine the interest
cost component of net periodic pension and postretirement cost. Management utilizes the Hewitt
above median yield curve, which is a hypothetical AA yield curve comprised of a series of
annualized individual discount rates, as the primary basis for determining the discount rate. As
of December 31, 2009 and 2008, we assumed a discount rate of 5.60% for the U.S. defined benefit
pension plans. As of December 31, 2009, we assumed a discount rate of 5.30% compared with a
discount rate of 5.60% as of December 31, 2008 for the U.S. postretirement plans. The effects of
the change in discount rate will be amortized into earnings as described below. A one-quarter
percentage point decrease in the discount rates for the U.S. pension and postretirement plans would
decrease 2010 operating income by $4.3 million. A one-quarter percentage point increase in the
discount rates would increase 2010 operating income by $3.7 million.
We have two U.S. defined benefit pension plans, a qualified funded plan and a nonqualified unfunded
plan. For the qualified funded plan, the expected long-term return on plan assets represents a
long-term view of the future estimated investment return on plan assets. This estimate is
determined based on the target allocation of plan assets among asset classes and input from
investment professionals on the expected performance of the asset classes over 10 to 20 years.
Historical asset returns are monitored and considered when we develop our expected long-term return
on plan assets. An incremental component is added for the expected return from active management
based both on the plan’s experience and on historical information obtained from the plan’s
investment consultants. These forecasted gross returns are reduced by estimated management fees
and expenses, yielding a long-term rate of return of 8% per annum. The expected asset return
assumption is based upon a long-term view; therefore, we do not expect to see frequent changes from
year to year based on positive or negative actual performance in a single year. Over the 10 year
period ended December 31, 2009, the annualized return was approximately 6.2% compared to an average
expected return of 8.4%. The actual return on plan assets achieved for 2009 was 16.3%. The
difference between the actual and expected rate of return on plan assets will be amortized into
earnings as described below.
Although our qualified funded plan was underfunded on a GAAP basis as of December 31, 2008, it
returned to an overfunded position as of December 31, 2009. In both years, the plan remained
overfunded for purposes of calculating required contributions. We do not expect the decrease in
plan assets in 2008 to lead to significant pension funding contributions over the next few years.
The expected long-term return on plan assets used in determining our 2009 U.S. pension credit was
8%. We have also assumed a return on plan assets during 2010 of 8%. The 2010 expected return on
assets was calculated in a manner consistent with 2009. A one-quarter percentage point increase or
decrease in this assumption would increase or decrease 2010 operating income by approximately $5.2
million.
Contributions to the unfunded plan were $3.3 million in 2009 and were made on a monthly basis to
fund benefit payments. We estimate the 2010 contributions will be approximately $3.3 million. See
Note 17 to the Consolidated Financial Statements for more information.
25
Management’s Discussion and Analysis of Financial Condition and Results of Operations
(dollar amounts in millions)
The estimated inflation in health care costs represents a long-term view (5-10 years) of the
expected inflation in our postretirement health care costs. We separately estimate expected health
care cost increases for pre-65 retirees and post-65 retirees due to the influence of Medicare
coverage at age 65, as illustrated below:
| |
|
|
|
|
|
|
|
|
|
|
|
|
|
|
|
|
|
|
|
|
|
|
|
|
| |
|
Assumptions |
|
|
Actual |
|
| |
|
Post 65 |
|
|
Pre 65 |
|
|
Overall |
|
|
Post 65 |
|
|
Pre 65 |
|
|
Overall |
|
|
|
|
|
|
|
|
|
|
|
|
|
|
|
|
|
|
|
|
|
|
|
|
|
|
2008 |
|
|
11.0 |
% |
|
|
10.5 |
% |
|
|
10.8 |
% |
|
|
(5 |
)% |
|
|
12 |
% |
|
|
0 |
% |
|
|
|
|
|
|
|
|
|
|
|
|
|
|
|
|
|
|
|
|
|
|
|
|
|
2009 |
|
|
10.0 |
% |
|
|
9.5 |
% |
|
|
9.8 |
% |
|
|
(7 |
)% |
|
|
(1 |
)% |
|
|
(5 |
)% |
|
|
|
|
|
|
|
|
|
|
|
|
|
|
|
|
|
|
|
|
|
|
|
|
|
2010 |
|
|
9.0 |
% |
|
|
8.5 |
% |
|
|
8.8 |
% |
|
|
|
|
|
|
|
|
|
|
|
|
Actual health care costs were lower than expected in 2009, primarily due to favorable claims
experience. The difference between the actual and expected health care costs is amortized into
earnings as described below. As of December 31, 2009, health care cost increases are estimated to
decrease by one percentage point per year until 2014, after which they are estimated to be constant
at 5%. A one percentage point increase in the assumed health care cost trend rate would reduce
2010 operating income by $1.2 million, while a one percentage point decrease in the assumed health
care cost trend rate would increase 2010 operating income by $1.2 million. See Note 17 to the
Consolidated Financial Statements for more information.
Actual results that differ from our various pension and postretirement plan estimates are captured
as actuarial gains/losses. When certain thresholds are met, the gains and losses are amortized
into future earnings over the expected remaining service period of plan participants, which is
approximately nine years. Changes in assumptions could have significant effects on earnings in
future years.
Impairments of Long-Lived Tangible and Intangible Assets — In connection with our adoption
of fresh-start reporting upon emerging from Chapter 11 in 2006, all long-lived tangible and
intangible assets were adjusted to fair value. Our indefinite-lived intangibles are primarily
trademarks and brand names, which are integral to our corporate identity and expected to contribute
indefinitely to our corporate cash flows. Accordingly, they have been assigned an indefinite life.
We conduct our annual impairment test for non-amortizable intangible assets during the fourth
quarter, although we conduct interim impairment tests if events or circumstances indicate the asset
might be impaired. We conduct impairment tests for tangible assets and amortizable intangible
assets when indicators of impairment exist, such as operating losses and/or negative cash flows.
If an indication of impairment exists, we compare the carrying amount of the asset group to the
estimated undiscounted future cash flows expected to be generated by the assets. The estimate of
an asset group’s fair value is based on discounted future cash flows expected to be generated by
the asset group, or based on management’s estimated exit price assuming the assets could be sold in
an orderly transaction between market participants or estimated salvage value if no sale is
assumed. If the fair value is less than the carrying value of the asset group, we record an
impairment charge equal to the difference between the fair value and carrying value of the asset
group.
The principal assumptions utilized in our impairment tests for tangible and definite-lived
intangible assets include discount rate and operating profit adjusted for depreciation and
amortization. The principal assumptions utilized in our impairment tests for indefinite-lived
intangible assets include revenue growth rate, discount rate and royalty rate. Revenue growth rate
and operating profit assumptions are consistent with those utilized in our operating plan and
strategic planning process. The discount rate assumption is calculated based upon an estimated
weighted average cost of equity which reflects the overall level of inherent risk and the rate of
return a market participant would expect to achieve. Methodologies used for valuing our tangible
and intangible assets did not change from prior periods.
26
Management’s Discussion and Analysis of Financial Condition and Results of Operations
(dollar amounts in millions)
The cash flow estimates used in applying our impairment tests are based on management’s analysis of
information available at the time of the impairment test. Actual cash flows lower than the
estimate could lead to significant future impairments. If subsequent testing indicates that new
fair values have declined, the carrying values would be reduced and our future statements of income
would be affected.
During the fourth quarters of 2009 and 2008, we recorded non-cash impairment charges of $18.0
million and $25.4 million, respectively, to reduce the carrying amount of our Wood Flooring
trademarks to their estimated fair value based on the results of our annual impairment test. The
fair value in both years was negatively affected by lower expected future cash flows due to the
decline in the U.S. residential housing market. The initial fair value for these intangible assets
was determined in 2006 as part of fresh start reporting. The remaining carrying value of the Wood
Flooring trademarks at December 31, 2009 was $64.6 million. Material uncertainties that could lead
to future material impairment charges for Wood Flooring intangible assets include significant
declines in residential U.S. housing starts and renovation activity below our expectations. We have
assumed depressed market activity in 2010 but anticipate market recovery starting in 2011.
During 2009 we tested the tangible assets and amortizable intangible assets of several asset groups
within our Building Products Americas, Building Products Europe, Resilient Flooring Americas,
Resilient Flooring Europe, and Cabinets reporting units for impairment due to negative earnings,
negative cash flows or other indicators of impairment. Based upon the impairment testing, the
carrying value of the tangible assets for each of these asset groups was determined to be
recoverable (except as discussed below); the related undiscounted cash flows and/or fair value
significantly exceeded the carrying value of assets.
The European Resilient Flooring business had operating losses and negative cash flows during 2009.
We have assumed further short-term declines in this market in 2010 but anticipate future recovery
starting in 2011. Based on our on-going evaluation of strategic alternatives for our European
flooring business, we reevaluated our asset groups within the European Resilient Flooring reporting
unit. Accordingly, during the fourth quarter of 2009 we recorded a $3.0 million impairment charge
on tangible assets, primarily machinery and equipment, for one of the asset groups within our
European Resilient Flooring reporting unit. The fair values of land and buildings were determined
by management estimates of market prices and independent valuations of the land and buildings based
on observable market data. This data includes recent sales and leases of comparable properties
with similar characteristics within the same local real estate market. The fair values of
machinery and equipment were determined by management based on estimated sales and salvage value,
which are unobservable inputs. The remaining carrying value of tangible assets within the European
Resilient Flooring business was $102.2 million as of December 31, 2009, with land and buildings
representing the significant majority. Material uncertainties that could lead to a future material
impairment charge include the level of European commercial construction and renovation activity.
We cannot predict the occurrence of certain events that might lead to material impairment charges
in the future. Such events may include, but are not limited to, the impact of economic
environments, particularly related to the commercial and residential construction industries,
material adverse changes in relationships with significant customers, or strategic decisions made
in response to economic and competitive conditions.
See Notes 3 and 11 to the Consolidated Financial Statements for further information.
Sales-related Accruals — We provide direct customer and end-user warranties for our
products. These warranties cover manufacturing defects that would prevent the product from
performing in line with its intended and marketed use. The terms of these warranties vary by
product line and generally provide for the repair or replacement of the defective product. We
collect and analyze warranty claims data with a focus on the historical amount of claims, the
products involved, the amount of time between the warranty claims and the products’ respective
sales, and the amount of current sales.
27
Management’s Discussion and Analysis of Financial Condition and Results of Operations
(dollar amounts in millions)
We also maintain numerous customer relationships that incorporate sales incentive programs
(primarily volume rebates and promotions). The rebates vary by customer and usually include tiered
incentives based on the level of customers’ purchases. Certain promotional allowances are also
tied to customer purchase volumes. We estimate the amount of expected annual sales during the
course of the year and use the projected sales amount to estimate the cost of the incentive
programs. For sales incentive programs that are on the same calendar basis as our fiscal calendar,
actual sales information is used in the year-end accruals.
While historical results have not differed materially from our estimated accruals, future
experience related to these accruals could differ significantly from the estimated amounts during
the year. If this occurs, we would adjust our accruals accordingly. Our sales-related accruals
totaled $54.4 million and $64.5 million as of December 31, 2009 and 2008, respectively. We record
the costs of these accruals as a reduction of gross sales.
Income Taxes — Our effective tax rate is primarily determined based on our pre-tax income
and the statutory income tax rates in the jurisdictions in which we operate. The effective tax
rate also reflects the tax impacts of items treated differently for tax purposes than for financial
reporting purposes. Some of these differences are permanent, such as expenses that are not
deductible in our tax returns, and some differences are temporary, reversing over time, such as
depreciation expense. These temporary differences create deferred income tax assets and
liabilities. Deferred tax assets are also recorded for operating loss, capital loss and tax credit
carryforwards.
Deferred income tax assets and liabilities are recognized by applying enacted tax rates to
temporary differences that exist as of the balance sheet date. We record valuation allowances to
reduce our deferred income tax assets if it is more likely than not that some portion or all of the
deferred income tax assets will not be realized. As of December 31, 2009, we have recorded
valuation allowances totaling $155.4 million for various federal, state and foreign net operating
loss, capital loss and foreign tax credit carryforwards. While we have considered future taxable
income in assessing the need for the valuation allowances based on our best available projections,
if these estimates and assumptions change in the future or if actual results differ from our
projections, we may be required to adjust our valuation allowances accordingly. Such adjustment
could be material to our Consolidated Financial Statements.
As further described in Note 15 to the Consolidated Financial Statements, our Consolidated Balance
Sheet as of December 31, 2009 includes net deferred income tax assets of $572.5 million. Included
in these amounts are deferred federal and state income tax assets of $173.1 million and $62.2
million, respectively, relating to federal and state net operating loss carryforwards. These net
operating losses arose primarily as a result of the amounts paid to the Asbestos PI Trust in 2006.
We have concluded that all but $22.3 million of these income tax benefits are more likely than not
to be realized in the future.
Inherent in determining our effective tax rate are judgments regarding business plans and
expectations about future operations. These judgments include the amount and geographic mix of
future taxable income, limitations on usage of net operating loss carryforwards after emergence
from bankruptcy, potential tax law changes, the impact of ongoing or potential tax audits, earnings
repatriation plans and other future tax consequences.
We establish reserves for tax positions that management believes are supportable, but are
potentially subject to challenge by the applicable taxing authorities. We review these tax
uncertainties in light of the changing facts and circumstances and adjust them when warranted. We
have several tax audits in process in various jurisdictions.
28
Management’s Discussion and Analysis of Financial Condition and Results of Operations
(dollar amounts in millions)
ACCOUNTING PRONOUNCEMENTS EFFECTIVE IN FUTURE PERIODS
In June 2009 the Financial Accounting Standards Board (“FASB”) issued new guidance, which is now
part of Accounting Standards Codification (“ASC”) 810, “Consolidations”, which amends the
consolidation guidance applicable to variable interest entities. These provisions of ASC 810 are
effective as of the beginning of the first fiscal year that begins after November 15, 2009. We do
not expect a material impact on our financial statements from the adoption of this guidance.
In January 2010 the FASB issued new guidance, which is now part of ASC 810, “Consolidations”. The
revised scope of the decrease-in-ownership provisions clarifies that transfers of a subsidiary that
constitute a business or nonprofit activity to an equity-method investee or joint venture and
transfers of groups of assets that constitute a business or nonprofit activity in exchange for a
noncontrolling interest in an entity, including an equity-method investee or joint venture, are
within the scope of ASC 810 rather than being within the scope of guidance applicable to
equity-method investees and joint ventures or nonmonetary exchanges. These provisions of ASC 810
are effective upon issuance. There was no material impact on our financial statements from the
adoption of this guidance in January 2010.
In January 2010 the FASB issued new guidance, which is now part of ASC 820, “Fair Value
Measurements and Disclosures”. The new guidance requires disclosures of the amounts of assets and
liabilities transferred into and out of Levels 1 and 2, along with a description of the reasons for
the transfers. The new guidance also requires additional disclosures related to activity presented
for Level 3 measurements. These provisions of ASC 820 are effective for interim and annual
reporting periods beginning after December 15, 2009, except for the additional disclosures related
to activities for Level 3 measurements which are required for fiscal years beginning after December
15, 2010 and interim periods within those years. We do not expect any impact on our financial
statements from the adoption of this guidance.
29
Management’s Discussion and Analysis of Financial Condition and Results of Operations
(dollar amounts in millions)
RESULTS OF OPERATIONS
Unless otherwise indicated, net sales in these results of operations are reported based upon the
location where the sale was made. Certain prior year amounts have been reclassified to conform to
the current year presentation. Please refer to Note 3 to the Consolidated Financial Statements for
a reconciliation of segment operating income to consolidated earnings from continuing operations
before income taxes.
2009 COMPARED TO 2008
CONSOLIDATED RESULTS
| |
|
|
|
|
|
|
|
|
|
|
|
|
|
|
|
|
| |
|
|
|
|
|
|
|
|
|
Change is (Unfavorable) |
|
| |
|
|
|
|
|
|
|
|
|
|
|
|
|
Excluding |
|
| |
|
|
|
|
|
|
|
|
|
|
|
|
|
Effects of |
|
| |
|
|
|
|
|
|
|
|
|
|
|
|
|
Foreign |
|
| |
|
|
|
|
|
|
|
|
|
As |
|
|
Exchange |
|
| |
|
2009 |
|
|
2008 |
|
|
Reported |
|
|
Rates(1) |
|
Net sales: |
|
|
|
|
|
|
|
|
|
|
|
|
|
|
|
|
Americas |
|
$ |
1,995.6 |
|
|
$ |
2,384.4 |
|
|
|
(16.3 |
)% |
|
|
(15.9 |
)% |
Europe |
|
|
626.0 |
|
|
|
826.0 |
|
|
|
(24.2 |
)% |
|
|
(16.8 |
)% |
Pacific Rim |
|
|
158.4 |
|
|
|
182.6 |
|
|
|
(13.3 |
)% |
|
|
(7.7 |
)% |
|
|
|
|
|
|
|
|
|
|
|
|
|
|
|
Total consolidated net sales |
|
$ |
2,780.0 |
|
|
$ |
3,393.0 |
|
|
|
(18.1 |
)% |
|
|
(15.6 |
)% |
Cost of goods sold |
|
|
2,159.0 |
|
|
|
2,632.0 |
|
|
|
|
|
|
|
|
|
SG&A expenses |
|
|
552.4 |
|
|
|
579.9 |
|
|
|
|
|
|
|
|
|
Intangible asset impairment |
|
|
18.0 |
|
|
|
25.4 |
|
|
|
|
|
|
|
|
|
Restructuring charges, net |
|
|
— |
|
|
|
0.8 |
|
|
|
|
|
|
|
|
|
Equity earnings from joint ventures |
|
|
(40.0 |
) |
|
|
(56.0 |
) |
|
|
|
|
|
|
|
|
|
|
|
|
|
|
|
|
|
|
|
|
|
|
|
Operating income |
|
$ |
90.6 |
|
|
$ |
210.9 |
|
|
|
(57.0 |
)% |
|
|
(55.7 |
)% |
Interest expense |
|
|
17.7 |
|
|
|
30.8 |
|
|
|
|
|
|
|
|
|
Other non-operating expense |
|
|
0.9 |
|
|
|
1.3 |
|
|
|
|
|
|
|
|
|
Other non-operating (income) |
|
|
(3.2 |
) |
|
|
(10.6 |
) |
|
|
|
|
|
|
|
|
Income tax (benefit) expense |
|
|
(2.5 |
) |
|
|
109.0 |
|
|
|
|
|
|
|
|
|
(Gain) from discontinued operations |
|
|
— |
|
|
|
(0.6 |
) |
|
|
|
|
|
|
|
|
|
|
|
|
|
|
|
|
|
|
|
|
|
|
|
Net earnings |
|
$ |
77.7 |
|
|
$ |
81.0 |
|
|
|
|
|
|
|
|
|
|
|
|
|
|
|
|
|
|
|
|
|
|
|
|
| |
|
|
| (1) |
|
Excludes unfavorable foreign exchange rate effect in translation of $110.9
million on consolidated net sales and $8.4 million on operating income |
Consolidated net sales, excluding the translation effect of changes in foreign exchange rates,
declined approximately 16% as significant volume declines more than offset very modest improvements
in price realization (as described previously in “Pricing Initiatives”).
Net sales in the Americas decreased approximately 16% as volume declined in all segments.
Excluding the translation effect of changes in foreign exchange rates, net sales in the European
markets decreased by approximately 17%. Lower volume for Building Products was partially offset by
modestly improved product mix, while Resilient Flooring sales declined on lower volume.
Excluding the translation effect of changes in foreign exchange rates, net sales in the Pacific Rim
decreased approximately 8% on lower volumes.
30
Management’s Discussion and Analysis of Financial Condition and Results of Operations
(dollar amounts in millions)
2009 and 2008 operating expenses were impacted by several significant items. The significant items
which impacted cost of goods sold (“COGS”), SG&A expenses and restructuring charges include:
| |
|
|
|
|
|
|
|
|
|
|
|
|
| Increase / (Reduction) in Expenses |
|
| |
|
Where |
|
|
|
|
|
|
|
| Item |
|
Reported |
|
|
2009 |
|
|
2008 |
|
Cost reduction initiatives expenses (1) |
|
COGS |
|
$ |
12.8 |
|
|
$ |
7.3 |
|
Fixed asset impairment (2) |
|
COGS |
|
|
3.0 |
|
|
|
2.9 |
|
Cost reduction initiatives (income) expenses (1) |
|
SG&A |
|
|
(0.1 |
) |
|
|
12.7 |
|
Environmental insurance settlement (3) |
|
SG&A |
|
|
— |
|
|
|
(6.9 |
) |
Chapter 11 related post-emergence (income) (4) |
|
SG&A |
|
|
— |
|
|
|
(1.3 |
) |
Review of strategic alternatives (5) |
|
SG&A |
|
|
— |
|
|
|
1.2 |
|
Intangible asset impairment (6) |
|
Intangible asset
impairment |
|
|
18.0 |
|
|
|
25.4 |
|
Cost reduction initiatives expenses (7) |
|
Restructuring |
|
|
— |
|
|
|
0.8 |
|
Accelerated stock-based compensation expense (8) |
|
SG&A |
|
|
31.6 |
|
|
|
— |
|
| |
|
|
| (1) |
|
See “Factors Affecting Operating Costs” for a discussion of the cost reduction
initiatives. |
| |
| (2) |
|
In 2009 and 2008 we recorded fixed asset impairment charges related to certain European
Resilient Flooring assets. |
| |
| (3) |
|
In 2008, we received an insurance settlement related to an environmental matter. |
| |
| (4) |
|
Represents the reversal of a contingent liability that was no longer owed to creditors
after our final Chapter 11 distribution. |
| |
| (5) |
|
These expenses were incurred, primarily from advisors, in conducting our review of
strategic alternatives which concluded in 2008. |
| |
| (6) |
|
During the fourth quarters of 2009 and 2008, we recorded non-cash impairment charges
of our Wood Flooring trademarks. |
| |
| (7) |
|
Represents an increase to a previously recorded reserve for a noncancelable U.K.
operating lease which extends through 2017. |
| |
| (8) |
|
Represents non-cash charges related to accelerated vesting of stock-based compensation
issued to employees and directors. |
Cost of goods sold was 77.7% of net sales in 2009 compared to 77.6% of net sales in 2008.
Reduced input and manufacturing costs offset the decline in sales.
SG&A expenses in 2009 were $552.4 million, or 19.9% of net sales compared to $579.9 million, or
17.1% of net sales in 2008. The change in expense was primarily due to reduced spending in all
segments, partially offset by the $31.6 million accelerated stock-based compensation expense. The
increase in SG&A expenses as a percent of net sales is due to the significant decrease in net
sales.
Equity earnings, primarily from our WAVE joint venture, were $40.0 million in 2009, as compared to
$56.0 million in 2008. See Note 10 to the Consolidated Financial Statements for further
information.
Interest expense was $17.7 million in 2009, compared to $30.8 million in 2008. The reduction was
primarily due to a drop in interest rates and a reduction in the average bank credit facility
balance due to principal payments.
Income tax (benefit)/expense from continuing operations was $(2.5) million and $109.0 million in
2009 and 2008, respectively. The effective tax rate for 2009 was -3.3% as compared to a rate of
57.6% for 2008. The effective tax rate for 2009 was significantly lower than 2008 primarily due to
the recognition of tax benefits related to the settlement of the Internal Revenue Service audit
during July 2009.
31
Management’s Discussion and Analysis of Financial Condition and Results of Operations
(dollar amounts in millions)
REPORTABLE SEGMENT RESULTS
Resilient Flooring
| |
|
|
|
|
|
|
|
|
|
|
|
|
|
|
|
|
| |
|
|
|
|
|
|
|
|
|
Change is Favorable
(Unfavorable) |
|
| |
|
|
|
|
|
|
|
|
|
|
|
|
|
Excluding |
|
| |
|
|
|
|
|
|
|
|
|
|
|
|
|
Effects of |
|
| |
|
|
|
|
|
|
|
|
|
|
|
|
|
Foreign |
|
| |
|
|
|
|
|
|
|
|
|
As |
|
|
Exchange |
|
| |
|
2009 |
|
|
2008 |
|
|
Reported |
|
|
Rates(1) |
|
Net sales: |
|
|
|
|
|
|
|
|
|
|
|
|
|
|
|
|
Americas |
|
$ |
673.1 |
|
|
$ |
786.2 |
|
|
|
(14.4 |
)% |
|
|
(13.8 |
)% |
Europe |
|
|
294.3 |
|
|
|
355.1 |
|
|
|
(17.1 |
)% |
|
|
(9.3 |
)% |
Pacific Rim |
|
|
64.3 |
|
|
|
78.8 |
|
|
|
(18.4 |
)% |
|
|
(11.9 |
)% |
|
|
|
|
|
|
|
|
|
|
|
|
|
|
|
Total segment net sales |
|
$ |
1,031.7 |
|
|
$ |
1,220.1 |
|
|
|
(15.4 |
)% |
|
|
(12.5 |
)% |
Operating income (loss) |
|
$ |
0.1 |
|
|
$ |
(16.8 |
) |
|
Favorable |
|
|
Favorable |
|
| |
|
|
| (1) |
|
Excludes unfavorable foreign exchange rate effect in translation of $45.8
million on net sales and $1.3 million on operating income |
Net sales in the Americas declined $113.1 million due to volume declines on broad weakness in
residential and commercial markets. Modest price realization was offset by a less profitable
product mix.
Excluding the translation effect of changes in foreign exchange rates, net sales in European
markets declined $27.9 million due to lower volume.
Excluding the translation effect of changes in foreign exchange rates, net sales in the Pacific Rim
declined $7.9 million. Lower volume was partially offset by a better product mix.
Operating income increased as raw material deflation, lower freight costs, and reduced SG&A and
manufacturing expenses offset the margin impact of lower volume and less profitable product mix.
Operating income included European Resilient Flooring losses of $25.7 million for 2009 and $38.2
million for 2008. Both 2009 and 2008 results were affected by the items detailed in the following
table.
| |
|
|
|
|
|
|
|
|
| Increase / (Reduction) in Expenses |
|
| Item |
|
2009 |
|
|
2008 |
|
|
|
|
|
|
|
|
|
|
Cost reduction initiatives expenses (1) |
|
$ |
4.7 |
|
|
$ |
14.1 |
|
Fixed asset impairments (2) |
|
|
3.0 |
|
|
|
2.9 |
|
| |
|
|
| (1) |
|
See “Factors Affecting Operating Costs” for a discussion of the cost reduction
initiatives. |
| |
| (2) |
|
Fixed asset impairment charges related to certain European Resilient Flooring assets. |
Wood Flooring
| |
|
|
|
|
|
|
|
|
|
|
|
|
| |
|
|
|
|
|
|
|
|
|
Change is |
|
| |
|
2009 |
|
|
2008 |
|
|
(Unfavorable) |
|
Total segment net sales (1) |
|
$ |
510.4 |
|
|
$ |
624.6 |
|
|
|
(18.3 |
)% |
Operating (loss) |
|
$ |
(5.9 |
) |
|
$ |
(2.4 |
) |
|
Unfavorable |
|
| |
|
|
| (1) |
|
Virtually all Wood Flooring products are sold in the Americas, primarily
in the U.S. |
Net sales decreased by $114.2 million due to lower volume driven by continued declines in
domestic residential housing markets.
32
Management’s Discussion and Analysis of Financial Condition and Results of Operations
(dollar amounts in millions)
Operating loss increased by $3.5 million, primarily due to the margin impact of significantly lower
sales partially offset by reduced manufacturing, SG&A, and raw material costs. In addition, both
2009 and 2008 operating profit was affected by items as detailed in the following table.
| |
|
|
|
|
|
|
|
|
| Increase / (Reduction) in Expenses |
|
| Item |
|
2009 |
|
|
2008 |
|
|
|
|
|
|
|
|
|
|
Cost reduction initiatives expenses (1) |
|
$ |
1.9 |
|
|
|
— |
|
Intangible asset impairment (2) |
|
|
18.0 |
|
|
$ |
25.4 |
|
| |
|
|
| (1) |
|
See “Factors Affecting Operating Costs” for a discussion of the cost reduction
initiatives. |
| |
| (2) |
|
During the fourth quarters of 2009 and 2008, we recorded non-cash impairment charges to
reduce the carrying amount of our Wood Flooring trademarks to their estimated fair value
based on the results of our annual impairment test. |
Building Products
| |
|
|
|
|
|
|
|
|
|
|
|
|
|
|
|
|
| |
|
|
|
|
|
|
|
|
|
Change is (Unfavorable) |
|
| |
|
|
|
|
|
|
|
|
|
|
|
|
|
Excluding |
|
| |
|
|
|
|
|
|
|
|
|
|
|
|
|
Effects of |
|
| |
|
|
|
|
|
|
|
|
|
|
|
|
|
Foreign |
|
| |
|
|
|
|
|
|
|
|
|
As |
|
|
Exchange |
|
| |
|
2009 |
|
|
2008 |
|
|
Reported |
|
|
Rates(1) |
|
Net sales: |
|
|
|
|
|
|
|
|
|
|
|
|
|
|
|
|
Americas |
|
$ |
661.9 |
|
|
$ |
794.4 |
|
|
|
(16.7 |
)% |
|
|
(16.1 |
)% |
Europe |
|
|
331.7 |
|
|
|
470.9 |
|
|
|
(29.6 |
)% |
|
|
(22.4 |
)% |
Pacific Rim |
|
|
94.1 |
|
|
|
103.8 |
|
|
|
(9.3 |
)% |
|
|
(4.7 |
)% |
|
|
|
|
|
|
|
|
|
|
|
|
|
|
|
Total segment net sales |
|
$ |
1,087.7 |
|
|
$ |
1,369.1 |
|
|
|
(20.6 |
)% |
|
|
(17.2 |
)% |
Operating income |
|
$ |
155.9 |
|
|
$ |
239.7 |
|
|
|
(35.0 |
)% |
|
|
(32.7 |
)% |
| |
|
|
| (1) |
|
Excludes unfavorable foreign exchange rate effect in translation of $62.3
million on net sales and $9.1 million on operating income |
The Americas net sales decreased $132.5 million primarily due to volume declines related to
reduced commercial construction activity.
Excluding the translation effect of changes in foreign exchange rates, net sales in Europe declined
by $88.9 million due to significant volume declines in both Western and Eastern European markets
associated with reduced commercial construction activity.
Excluding the translation effect of changes in foreign exchange rates, net sales in the Pacific Rim
declined $4.4 million on volume declines across the region, partially offset by modest improvement
in product mix.
Operating income fell by $83.8 million. The combination of volume declines and lower earnings from
WAVE offset the benefits of reduced manufacturing and SG&A expenses, lower freight and modest price
realization.
33
Management’s Discussion and Analysis of Financial Condition and Results of Operations
(dollar amounts in millions)
Cabinets
| |
|
|
|
|
|
|
|
|
|
|
|
|
| |
|
|
|
|
|
|
|
|
|
Change is |
|
| |
|
2009 |
|
|
2008 |
|
|
(Unfavorable) |
|
Total segment net sales (1) |
|
$ |
150.2 |
|
|
$ |
179.2 |
|
|
|
(16.2 |
)% |
Operating (loss) |
|
$ |
(18.3 |
) |
|
$ |
(6.7 |
) |
|
Unfavorable |
|
| |
|
|
| (1) |
|
All Cabinet products are sold in the U.S. |
Net sales declined $29.0 million due to lower volume driven by continued declines in
residential housing markets.
Operating loss increased $11.6 million primarily due to the margin impact from lower sales,
partially offset by lower manufacturing costs. In addition, 2009 operating profit was affected by
the item as detailed in the following table.
| |
|
|
|
|
|
|
|
|
| Increase / (Reduction) in Expenses |
|
| Item |
|
2009 |
|
|
2008 |
|
| |
Cost reduction initiatives expense(1) |
|
$ |
6.1 |
|
|
|
— |
|
| |
|
|
| (1) |
|
Costs due to Auburn plant closure. |
Unallocated Corporate
Unallocated corporate expense of $41.2 million in 2009 increased from $2.9 million in 2008. The
increase was primarily due to accelerated stock-based compensation expense related to a change in
control event which resulted in a non-cash charge of $31.6 million and a lower U.S. pension credit.
In addition, 2009 and 2008 were affected by previously described items as detailed in the following
table.
| |
|
|
|
|
|
|
|
|
| Increase / (Reduction) in Expenses |
|
| Item |
|
2009 |
|
|
2008 |
|
|
|
|
|
|
|
|
|
|
Cost reduction initiatives expenses (1) |
|
|
— |
|
|
$ |
6.7 |
|
Environmental insurance settlement (2) |
|
|
— |
|
|
|
(6.9 |
) |
Chapter 11 related post-emergence expenses (3) |
|
|
— |
|
|
|
(1.3 |
) |
Review of strategic alternatives (4) |
|
|
— |
|
|
|
1.2 |
|
Accelerated stock-based compensation expense (5) |
|
$ |
31.6 |
|
|
|
— |
|
| |
|
|
| (1) |
|
Represents costs for corporate severances, partially offset by related reductions in
stock-based compensation expense, and restructuring costs. |
| |
| (2) |
|
Represents gain from an insurance settlement related to an environmental matter. |
| |
| (3) |
|
Represents the reversal of a contingent liability that was no longer owed to creditors
after our final Chapter 11 distribution. |
| |
| (4) |
|
These expenses were incurred, primarily from advisors, in conducting our review of
strategic alternatives which concluded during 2008. |
| |
| (5) |
|
Represents non-cash charges related to accelerated vesting of stock-based compensation
issued to employees and directors. |
34
Management’s Discussion and Analysis of Financial Condition and Results of Operations
(dollar amounts in millions)
FINANCIAL CONDITION AND LIQUIDITY
Cash Flow
As shown on the Consolidated Statements of Cash Flows, our cash and cash equivalents balance
increased by $214.5 million for 2009 compared to a decrease of $159.3 million in 2008.
Operating activities for 2009 provided $260.2 million of net cash, primarily due to cash earnings
and a decrease in inventories across all business units of $105.9 million due to lower current and
projected sales activity. Operating activities in 2008 provided $214.2 million of net cash,
primarily due to cash earnings and distributions from WAVE of $61.0 million (which included a
special distribution of $5.5 million). These were partially offset by a reduction in accounts
payable and accrued expenses of $88.2 million, primarily due to lower activity and the payment of
incentive accruals during the first quarter of 2008.
Investing activities in 2009 used $41.0 million of cash primarily due to capital expenditures of
$105.1 million partially offset by distributions, classified as returns of investment, from WAVE of
$53.5 million. Investing activities in 2008 used $75.7 million of cash primarily due to capital
expenditures of $95.0 million, partially offset by a special distribution, classified as a return
of investment, from WAVE of $19.5 million.
In 2008 WAVE distributed to us a total of $80.5 million (including a special distribution of $25.0
million). We use the equity in earnings method to determine appropriate classification within our
Consolidated Statement of Cash Flows. During 2008 WAVE distributions exceeded our capital
contributions and our proportionate share of retained earnings. Accordingly, $19.5 million of the
2008 distributions were reflected as a return of investment in cash flows from investing
activities. Total WAVE distributions to us in 2009 were $53.5 million.
Financing activities in 2009 used $26.7 million of cash primarily due to scheduled debt repayments.
Financing activities in 2008 used $277.0 million primarily due to a special cash dividend of $256.4
million. See Liquidity discussion below.
Balance Sheet and Liquidity
Changes in significant balance sheet accounts and groups of accounts from December 31, 2008 to
December 31, 2009 are as follows:
| |
|
|
|
|
|
|
|
|
|
|
|
|
| |
|
December 31, |
|
|
December 31, |
|
|
Increase |
|
| |
|
2009 |
|
|
2008 |
|
|
(Decrease) |
|
Cash and cash equivalents |
|
$ |
569.5 |
|
|
$ |
355.0 |
|
|
$ |
214.5 |
|
Current assets, excluding
cash and cash equivalents |
|
|
762.1 |
|
|
|
906.5 |
|
|
|
(144.4 |
) |
|
|
|
|
|
|
|
|
|
|
Current assets |
|
$ |
1,331.6 |
|
|
$ |
1,261.5 |
|
|
$ |
70.1 |
|
|
|
|
|
|
|
|
|
|
|
The increase in cash and cash equivalents was previously described (see “Cash Flow”). The decrease
in current assets, excluding cash and cash equivalents, is primarily due to lower inventory levels
across all business units due to lower current and projected sales activity.
| |
|
|
|
|
|
|
|
|
|
|
|
|
| |
|
December 31, |
|
|
December 31, |
|
|
|
|
| |
|
2009 |
|
|
2008 |
|
|
Decrease |
|
Property, plant and
equipment, less accumulated
depreciation and amortization
(“PP&E”) |
|
$ |
929.2 |
|
|
$ |
954.2 |
|
|
$ |
(25.0 |
) |
The decrease in PP&E was primarily due to depreciation of $132.6 million and fixed asset
impairments of $3.0 million, partially offset by capital expenditures of $105.1 million and the
effects of foreign exchange.
35
Management’s Discussion and Analysis of Financial Condition and Results of Operations
(dollar amounts in millions)
| |
|
|
|
|
|
|
|
|
|
|
|
|
| |
|
December 31, |
|
|
December 31, |
|
|
|
|
| |
|
2009 |
|
|
2008 |
|
|
Increase |
|
Prepaid pension costs |
|
$ |
114.3 |
|
|
$ |
0.3 |
|
|
$ |
114.0 |
|
The increase in prepaid pension costs occurred primarily because our U.S. qualified pension plan,
which was underfunded at December 31, 2008, became overfunded in relation to its benefit obligation
as of December 31, 2009 primarily due to asset investment gains in 2009.
| |
|
|
|
|
|
|
|
|
|
|
|
|
| |
|
December 31, |
|
|
December 31, |
|
|
|
|
| |
|
2009 |
|
|
2008 |
|
|
Decrease |
|
Investment in joint venture |
|
$ |
194.6 |
|
|
$ |
208.2 |
|
|
$ |
(13.6 |
) |
The decrease in investments in affiliates was primarily due to distributions from WAVE of $53.5
million partially offset by equity earnings of $40.0 million.
| |
|
|
|
|
|
|
|
|
|
|
|
|
| |
|
December 31, |
|
|
December 31, |
|
|
|
|
| |
|
2009 |
|
|
2008 |
|
|
Decrease |
|
Current installments of long-term debt |
|
$ |
40.0 |
|
|
$ |
40.9 |
|
|
$ |
(0.9 |
) |
Long-term debt, less current installments |
|
|
432.5 |
|
|
|
454.8 |
|
|
|
(22.3 |
) |
|
|
|
|
|
|
|
|
|
|
Long-term debt |
|
$ |
472.5 |
|
|
$ |
495.7 |
|
|
$ |
(23.2 |
) |
|
|
|
|
|
|
|
|
|
|
The decrease in long-term debt was primarily due to scheduled debt repayments.
Liquidity
Our liquidity needs for operations vary throughout the year. We retain lines of credit to
facilitate our seasonal needs. On October 2, 2006, Armstrong executed a $1.1 billion senior credit
facility with Bank of America, N.A., JPMorgan Chase Bank, N.A. and Barclays Bank PLC. This
facility was made up of a $300 million revolving credit facility (with a $150 million sublimit for
letters of credit), a $300 million Term Loan A (due in October 2011), and a $500 million Term Loan
B (due in October 2013). There were no outstanding borrowings under the revolving credit facility,
but $41.8 million in letters of credit were outstanding as of December 31, 2009 and, as a result,
availability under the revolving credit facility was $258.2 million.
Letters of credit are issued to third party suppliers, insurance and financial institutions and
typically can only be drawn upon in the event of AWI’s failure to pay its obligations to the
beneficiary.
As of December 31, 2009, we had $569.5 million of cash and cash equivalents, $328.2 million in the
U.S. and $241.3 million in various foreign jurisdictions.
On February 25, 2008, we executed an amendment to our senior credit facility. This amendment (a)
permitted us to make “Special Distributions,” including dividends (such as the special cash
dividend described below) or other distributions (whether in cash, securities or other property) of
up to an aggregate of $500 million at any time prior to February 28, 2009 (this permission in the
amendment expired on February 28, 2009), (b) requires that we maintain minimum domestic liquidity
of at least $100 million as of March 31, June 30, September 30 and December 31 of each year, which
may be a combination of cash and cash equivalents and undrawn commitments under our revolving
credit facility and (c) increased interest rates by 0.25% for the revolving credit facility and
Term Loan A. As of December 31, 2009 our domestic liquidity was $586.4 million.
In addition to the minimum domestic liquidity covenant, our credit facility contains two other
financial covenants: minimum Interest Coverage of 3.00 to 1.00 and maximum Indebtedness to EBITDA
of 3.75 to
1.00. Please refer to the credit facility filed with this Form 10-K as Exhibits 10.7 and 10.8. As
of December 31, 2009 our consolidated interest coverage ratio was 15.2 to 1.00 and our indebtedness
to EBITDA was 1.76 to 1.00. Management believes that based on current financial projections any
default under these covenants is unlikely for the foreseeable future. As of December 31, 2009,
fully borrowing
36
Management’s Discussion and Analysis of Financial Condition and Results of Operations
(dollar amounts in millions)
under our revolving credit facility, provided we maintain minimum domestic
liquidity of $100 million, would not violate these covenants.
No mandatory prepayments are required under the senior credit facility unless (a) our Indebtedness
to EBITDA ratio is greater than 2.5 to 1.0, or (b) debt ratings from S&P are lower than BB
(stable), or (c) debt ratings from Moody’s are lower than Ba2 (stable) based on our year end
compliance certification. If required, the prepayment amount would be 50% of Consolidated Excess
Cash Flow (as defined in the credit facility, filed with this 10-K as Exhibits 10.7 and 10.8).
Mandatory prepayments have not occurred since the inception of the agreement. Our current debt
rating from S&P is BB (stable) and from Moody’s is Ba2 (stable).
On February 25, 2008, our Board of Directors declared a special cash dividend of $4.50 per common
share, payable on March 31, 2008, to shareholders of record on March 11, 2008. This special cash
dividend resulted in an aggregate payment to our shareholders of $256.4 million. The Board will
continue to evaluate the return of cash to shareholders based on factors including actual and
forecasted operating results, the outlook for global economies and credit markets, and our current
and forecasted capital requirements.
As of December 31, 2009, our foreign subsidiaries had available lines of credit totaling $24.9
million, of which $1.0 million was used and $2.2 million was available only for letters of credit
and guarantees, leaving $21.7 million of unused lines of credit available for foreign borrowings.
However, these lines of credit are uncommitted, and poor operating results or credit concerns at
the related foreign subsidiaries could result in the lines being withdrawn by the lenders. We have
been able to maintain and, as needed, replace credit facilities to support our foreign operations.
In October 2007 we received $178.7 million of federal income tax refunds. Upon receipt of the
refunds, AWI recorded a liability of $144.6 million in the fourth quarter of 2007 pending Internal
Revenue Service (“IRS”) review. During the second quarter of 2009, the IRS concluded its
examination for the 2005 and 2006 tax years and approved the above refunds. Under the Internal
Revenue Code, the refunds were subject to further review and approval by the Joint Committee on
Taxation of the U.S. Congress (“Joint Committee”). In July 2009, we were notified by the IRS that
the Joint Committee had approved our refunds. See Note 15 to the Consolidated Financial
Statements.
We believe that cash on hand and generated from operations, together with lines of credit and the
availability under the $300 million revolving credit facility, will be adequate to address our
foreseeable liquidity needs based on current expectations of our business operations and scheduled
payments of debt obligations.
37
Management’s Discussion and Analysis of Financial Condition and Results of Operations
(dollar amounts in millions)
2008 COMPARED TO 2007
CONSOLIDATED RESULTS
| |
|
|
|
|
|
|
|
|
|
|
|
|
|
|
|
|
| |
|
|
|
|
|
|
|
|
|
Change is Favorable/
(Unfavorable) |
|
| |
|
|
|
|
|
|
|
|
|
|
|
|
|
Excluding |
|
| |
|
|
|
|
|
|
|
|
|
|
|
|
|
Effects of |
|
| |
|
|
|
|
|
|
|
|
|
|
|
|
|
Foreign |
|
| |
|
|
|
|
|
|
|
|
|
As |
|
|
Exchange |
|
| |
|
2008 |
|
|
2007 |
|
|
Reported |
|
|
Rates(1) |
|
Net sales: |
|
|
|
|
|
|
|
|
|
|
|
|
|
|
|
|
Americas |
|
$ |
2,384.4 |
|
|
$ |
2,614.7 |
|
|
|
(8.8 |
)% |
|
|
(9.1 |
)% |
Europe |
|
|
826.0 |
|
|
|
774.4 |
|
|
|
6.7 |
% |
|
|
0.7 |
% |
Pacific Rim |
|
|
182.6 |
|
|
|
160.6 |
|
|
|
13.7 |
% |
|
|
10.5 |
% |
|
|
|
|
|
|
|
|
|
|
|
|
|
|
|
Total consolidated net sales |
|
$ |
3,393.0 |
|
|
$ |
3,549.7 |
|
|
|
(4.4 |
)% |
|
|
(6.0 |
)% |
Cost of goods sold |
|
|
2,632.0 |
|
|
|
2,687.5 |
|
|
|
|
|
|
|
|
|
SG&A expense |
|
|
579.9 |
|
|
|
611.3 |
|
|
|
|
|
|
|
|
|
Intangible asset impairment |
|
|
25.4 |
|
|
|
— |
|
|
|
|
|
|
|
|
|
Restructuring charges, net |
|
|
0.8 |
|
|
|
0.2 |
|
|
|
|
|
|
|
|
|
Equity earnings from joint ventures |
|
|
(56.0 |
) |
|
|
(46.0 |
) |
|
|
|
|
|
|
|
|
|
|
|
|
|
|
|
|
|
|
|
|
|
|
|
Operating income |
|
$ |
210.9 |
|
|
$ |
296.7 |
|
|
|
(28.9 |
)% |
|
|
(29.7 |
)% |
Interest expense |
|
|
30.8 |
|
|
|
55.0 |
|
|
|
|
|
|
|
|
|
Other non-operating expense |
|
|
1.3 |
|
|
|
1.4 |
|
|
|
|
|
|
|
|
|
Other non-operating (income) |
|
|
(10.6 |
) |
|
|
(18.2 |
) |
|
|
|
|
|
|
|
|
Chapter 11 reorganization (income), net |
|
|
— |
|
|
|
(0.7 |
) |
|
|
|
|
|
|
|
|
Income tax expense |
|
|
109.0 |
|
|
|
106.4 |
|
|
|
|
|
|
|
|
|
(Gain) loss from discontinued operations |
|
|
(0.6 |
) |
|
|
7.5 |
|
|
|
|
|
|
|
|
|
|
|
|
|
|
|
|
|
|
|
|
|
|
|
|
Net earnings |
|
$ |
81.0 |
|
|
$ |
145.3 |
|
|
|
|
|
|
|
|
|
|
|
|
|
|
|
|
|
|
|
|
|
|
|
|
| |
|
|
| (1) |
|
Excludes favorable foreign exchange rate effect in translation of $56.7 million
on consolidated net sales and $2.9 million on operating income |
Consolidated net sales, excluding the translation effect of changes in foreign exchange rates,
declined 6%. Volume declines more than offset improvements in price realization and an improved
mix of higher value products.
Net sales in the Americas decreased approximately 9% as volume declines across the segments offset
modest improvements in price realization and product mix in the Building Products and Resilient
Flooring segments.
Excluding the translation effect of changes in foreign exchange rates, net sales in the European
markets grew by $6 million. Both Building Products and Resilient Flooring had modest price
realization and improved product mix to offset lower volume.
Excluding the translation effect of changes in foreign exchange rates, net sales in the Pacific Rim
increased $18 million primarily due to volume growth.
38
Management’s Discussion and Analysis of Financial Condition and Results of Operations
(dollar amounts in millions)
2008 and 2007 operating expenses were impacted by several significant items. The significant items
which impacted cost of goods sold (“COGS”), SG&A expenses and restructuring charges include:
| |
|
|
|
|
|
|
|
|
|
|
|
|
| Increase / (Reduction) in Expenses |
|
| |
|
Where |
|
|
|
|
|
|
|
| Item |
|
Reported |
|
|
2008 |
|
|
2007 |
|
Change in depreciation and amortization (1) |
|
COGS |
|
$ |
7.9 |
|
|
$ |
2.1 |
|
Impact on hedging-related activity (1) |
|
COGS |
|
|
— |
|
|
|
(5.8 |
) |
Change in depreciation and amortization (1) |
|
SG&A |
|
|
1.5 |
|
|
|
0.6 |
|
Cost reduction initiatives expenses (2) |
|
COGS |
|
|
7.3 |
|
|
|
— |
|
Fixed asset impairment (3) |
|
COGS |
|
|
2.9 |
|
|
|
— |
|
Cost reduction initiatives expenses (2) |
|
SG&A |
|
|
12.7 |
|
|
|
— |
|
Insurance settlements (4) |
|
SG&A |
|
|
(6.9 |
) |
|
|
(5.0 |
) |
Environmental accrual (5) |
|
SG&A |
|
|
— |
|
|
|
1.1 |
|
Chapter 11 related post-emergence (income) expenses (6) |
|
SG&A |
|
|
(1.3 |
) |
|
|
7.1 |
|
Review of strategic alternatives (7) |
|
SG&A |
|
|
1.2 |
|
|
|
8.7 |
|
Intangible asset impairment (8) |
|
Intangible asset
impairment |
|
|
25.4 |
|
|
|
— |
|
Cost reduction initiatives expenses (2) |
|
Restructuring |
|
|
0.8 |
|
|
|
0.2 |
|
| |
|
|
| (1) |
|
Charges related to fresh-start reporting. |
| |
| (2) |
|
See “Factors Affecting Operating Costs” for a discussion of the cost reduction
initiatives impacting 2008. 2007 expenses related to the closure of a Building Products
plant in the Netherlands during 2005. |
| |
| (3) |
|
In 2008 we recorded a fixed asset impairment charge related to certain European
Resilient Flooring assets. |
| |
| (4) |
|
In 2008, we received an insurance settlement related to an environmental matter. In
2007, we received an insurance settlement related to a Cabinets warehouse fire. |
| |
| (5) |
|
We recorded an increase in the environmental accrual for a previously-owned property. |
| |
| (6) |
|
These costs represent professional and administrative fees incurred primarily to
resolve remaining claims related to AWI’s Chapter 11 Case and distribute proceeds to
creditors, and expenses incurred by Armstrong Holdings, Inc., our former publicly held
parent holding company, as it completed its plan of dissolution. In addition, 2008
includes the impact of the reversal of a contingent liability that was no longer owed to
creditors after our final Chapter 11 distribution was made. |
| |
| (7) |
|
These expenses were incurred, primarily from advisors, in conducting our review of
strategic alternatives which concluded during 2008. |
| |
| (8) |
|
During the fourth quarter of 2008, we recorded a non-cash impairment charge of $25.4
million to reduce the carrying amount of our Wood Flooring trademarks to their estimated
fair value based on the results of our annual impairment test. |
Cost of goods sold in 2008 was 77.6% of net sales, compared to 75.7% in 2007. The
year-to-year increase in the percentages is primarily due to lower sales to cover fixed costs. The
change in the percentages was also impacted by the items detailed in the above table.
SG&A expenses in 2008 were $579.9 million, or 17.1% of net sales compared to $611.3 million or
17.2% of net sales in 2007. The year-to-year change was primarily due to the factors detailed in
the above table offset by a significant decrease in unallocated corporate expense due to lower
incentive compensation costs. In addition, most businesses reduced spending in response to lower
sales volumes.
Interest expense was $30.8 million in 2008, compared to $55.0 million in 2007. The reduction was
primarily due to lower debt balances and lower interest rates in 2008 compared to 2007.
Income tax expense from continuing operations was $109.0 million and $106.4 million in 2008 and
2007, respectively. The effective tax rate for 2008 was 57.6% as compared to a rate of 41.0% for
2007. The effective tax rate for 2008 was higher than 2007 due to additional valuation allowances
on deferred state and foreign income tax assets and interest on uncertain tax positions. Partially
offsetting these items was the tax benefit in 2008 for the costs incurred in 2007 for the review of
strategic alternatives.
39
Management’s Discussion and Analysis of Financial Condition and Results of Operations
(dollar amounts in millions)
REPORTABLE SEGMENT RESULTS
Resilient Flooring
| |
|
|
|
|
|
|
|
|
|
|
|
|
|
|
|
|
| |
|
|
|
|
|
|
|
|
|
Change is Favorable/ |
|
| |
|
|
|
|
|
|
|
|
|
(Unfavorable) |
|
| |
|
|
|
|
|
|
|
|
|
|
|
|
|
Excluding |
|
| |
|
|
|
|
|
|
|
|
|
|
|
|
|
Effects of |
|
| |
|
|
|
|
|
|
|
|
|
|
|
|
|
Foreign |
|
| |
|
|
|
|
|
|
|
|
|
As |
|
|
Exchange |
|
| |
|
2008 |
|
|
2007 |
|
|
Reported |
|
|
Rates(1) |
|
Net sales: |
|
|
|
|
|
|
|
|
|
|
|
|
|
|
|
|
Americas |
|
$ |
786.2 |
|
|
$ |
826.4 |
|
|
|
(4.9 |
)% |
|
|
(5.2 |
)% |
Europe |
|
|
355.1 |
|
|
|
331.9 |
|
|
|
7.0 |
% |
|
|
(0.2 |
)% |
Pacific Rim |
|
|
78.8 |
|
|
|
72.5 |
|
|
|
8.7 |
% |
|
|
5.9 |
% |
|
|
|
|
|
|
|
|
|
|
|
|
|
|
|
Total segment net sales |
|
$ |
1,220.1 |
|
|
$ |
1,230.8 |
|
|
|
(0.9 |
)% |
|
|
(3.1 |
)% |
Operating (loss) income |
|
$ |
(16.8 |
) |
|
$ |
40.4 |
|
|
Unfavorable |
|
|
Unfavorable |
|
| |
|
|
| (1) |
|
Excludes favorable foreign exchange rate effect in translation of $28.4
million on net sales and $2.5 million on operating income |
Net sales in the Americas declined $40.2 million. Volume declines due to broad weakness in
residential markets and accelerating declines in commercial markets in the final two months of the
year partially offset price realization and product mix improvement.
Excluding the translation effect of changes in foreign exchange rates, net sales in European
markets were approximately flat as improved price and product mix offset lower volume.
Excluding the translation effect of changes in foreign exchange rates, net sales in the Pacific Rim
grew $4.4 million primarily due to improved product mix and modest price realization.
Operating income decreased significantly due to lower volume in the Americas and global raw
material inflation. In addition, both 2008 and 2007 operating profit were impacted by the
previously described items as detailed in the following table.
| |
|
|
|
|
|
|
|
|
| Increase / (Reduction) in Expenses |
|
| Item |
|
2008 |
|
|
2007 |
|
Change in depreciation and amortization (1) |
|
$ |
3.3 |
|
|
$ |
0.8 |
|
Impact on hedging-related activity (1) |
|
|
— |
|
|
|
(1.5 |
) |
Cost reduction initiatives expenses (2) |
|
|
14.1 |
|
|
|
— |
|
Fixed asset impairment (3) |
|
|
2.9 |
|
|
|
— |
|
Environmental accrual (4) |
|
|
— |
|
|
|
1.1 |
|
| |
|
|
| (1) |
|
Charges related to fresh-start reporting. |
| |
| (2) |
|
See “Factors Affecting Operating Costs” for a discussion of the cost reduction
initiatives. |
| |
| (3) |
|
In 2008 we recorded a fixed asset impairment charge related to certain European
Resilient Flooring assets. |
| |
| (4) |
|
We recorded an increase in the environmental accrual for a previously-owned property. |
40
Management’s Discussion and Analysis of Financial Condition and Results of Operations
(dollar amounts in millions)
Wood Flooring
| |
|
|
|
|
|
|
|
|
|
|
|
|
| |
|
|
|
|
|
|
|
|
|
Change is |
|
| |
|
2008 |
|
|
2007 |
|
|
(Unfavorable) |
|
Total segment net sales (1) |
|
$ |
624.6 |
|
|
$ |
791.6 |
|
|
|
(21.1 |
)% |
Operating (loss) income |
|
$ |
(2.4 |
) |
|
$ |
64.3 |
|
|
Unfavorable |
|
| |
|
|
| (1) |
|
Virtually all Wood Flooring products are sold in the Americas, primarily
in the U.S. |
Net sales decreased by $167.0 million due to lower volume driven by continued declines in
residential housing markets.
Operating income declined by $66.7 million, primarily due to significantly lower sales. Reduced
manufacturing and SG&A costs partially offset the decline in sales. In addition, 2008 operating
profit was impacted by previously described items as detailed in the following table.
| |
|
|
|
|
|
|
|
|
| Increase / (Reduction) in Expenses |
|
| Item |
|
2008 |
|
|
2007 |
|
Change in depreciation and amortization (1) |
|
$ |
1.0 |
|
|
$ |
0.2 |
|
Intangible asset impairment (2) |
|
|
25.4 |
|
|
|
— |
|
| |
|
|
| (1) |
|
Charges related to fresh-start reporting. |
| |
| (2) |
|
During the fourth quarter of 2008, we recorded a non-cash impairment charge of $25.4
million to reduce the carrying amount of our Wood Flooring trademarks to their estimated
fair value based on the results of our annual impairment test. |
Building Products
| |
|
|
|
|
|
|
|
|
|
|
|
|
|
|
|
|
| |
|
|
|
|
|
|
|
|
|
Change is Favorable |
|
| |
|
|
|
|
|
|
|
|
|
|
|
|
|
Excluding |
|
| |
|
|
|
|
|
|
|
|
|
|
|
|
|
Effects of |
|
| |
|
|
|
|
|
|
|
|
|
|
|
|
|
Foreign |
|
| |
|
|
|
|
|
|
|
|
|
As |
|
|
Exchange |
|
| |
|
2008 |
|
|
2007 |
|
|
Reported |
|
|
Rates(1) |
|
Net sales: |
|
|
|
|
|
|
|
|
|
|
|
|
|
|
|
|
Americas |
|
$ |
794.4 |
|
|
$ |
761.5 |
|
|
|
4.3 |
% |
|
|
4.0 |
% |
Europe |
|
|
470.9 |
|
|
|
442.5 |
|
|
|
6.4 |
% |
|
|
1.4 |
% |
Pacific Rim |
|
|
103.8 |
|
|
|
88.1 |
|
|
|
17.8 |
% |
|
|
14.4 |
% |
|
|
|
|
|
|
|
|
|
|
|
|
|
|
|
Total segment net sales |
|
$ |
1,369.1 |
|
|
$ |
1,292.1 |
|
|
|
6.0 |
% |
|
|
3.8 |
% |
Operating income |
|
$ |
239.7 |
|
|
$ |
221.4 |
|
|
|
8.3 |
% |
|
|
7.7 |
% |
| |
|
|
| (1) |
|
Excludes favorable foreign exchange rate effect in translation of $27.4
million on net sales and $1.2 million on operating income |
The Americas net sales increased $32.9 million. Price increases put in place to offset
inflationary pressure and an improved product mix offset volume declines that accelerated in the
fourth quarter. The improved product mix reflects a continued focus on developing and marketing
high value products which satisfy today’s design trends and higher acoustical performance needs.
Excluding the translation effect of changes in foreign exchange rates, net sales in Europe grew by
$6.4 million. The modest sales improvement was primarily due to improved price realization and
volume growth in the emerging markets of Eastern Europe over the first three quarters of the year.
These benefits offset growing volume declines in most Western European markets.
41
Management’s Discussion and Analysis of Financial Condition and Results of Operations
(dollar amounts in millions)
Excluding the translation effect of changes in foreign exchange rates, net sales in the Pacific Rim
grew $13.1 million on volume growth in Australia, China and India. The pace of growth in China and
India significantly slowed in the fourth quarter of the year.
Operating income grew by $18.3 million. Price realization, improved product mix and higher
earnings from WAVE more than offset inflation in input costs and volume declines. In addition,
2008 and 2007 operating profit were impacted by previously described items as detailed in the
following table.
| |
|
|
|
|
|
|
|
|
| Increase / (Reduction) in Expenses |
|
| Item |
|
2008 |
|
|
2007 |
|
Change in depreciation and amortization (1) |
|
$ |
4.2 |
|
|
$ |
1.1 |
|
Impact on hedging-related activity (1) |
|
|
— |
|
|
|
(4.3 |
) |
Cost reduction initiatives expenses (2) |
|
|
— |
|
|
|
0.2 |
|
| |
|
|
| (1) |
|
Charges related to fresh-start reporting. |
| |
| (2) |
|
These expenses relate to the closure of a Building Products plant in The Netherlands.
Production ceased at this plant in 2005. |
Cabinets
| |
|
|
|
|
|
|
|
|
|
|
|
|
| |
|
|
|
|
|
|
|
|
|
Change is |
|
| |
|
2008 |
|
|
2007 |
|
|
(Unfavorable) |
|
Total segment net sales (1) |
|
$ |
179.2 |
|
|
$ |
235.2 |
|
|
|
(23.8 |
)% |
Operating (loss) income |
|
$ |
(6.7 |
) |
|
$ |
10.5 |
|
|
Unfavorable |
|
| |
|
|
| (1) |
|
All Cabinet products are sold in the U.S. |
Net sales declined $56.0 million on significant volume declines related to further
deterioration in the U.S. housing markets.
Operating income was $17.2 million worse than the prior year, primarily due to the decline in
sales. In addition, 2007 operating profit was impacted by the previously described item as
detailed in the following table.
| |
|
|
|
|
|
|
|
|
| Increase / (Reduction) in Expenses |
|
| Item |
|
2008 |
|
|
2007 |
|
Insurance settlement (1) |
|
|
— |
|
|
$ |
(5.0 |
) |
| |
|
|
| (1) |
|
We received an insurance settlement related to a warehouse fire. |
42
Management’s Discussion and Analysis of Financial Condition and Results of Operations
(dollar amounts in millions)
Unallocated Corporate
Unallocated corporate expense of $2.9 million in 2008 decreased from $39.9 million in 2007. The
decrease was primarily due to lower incentive compensation expense and items detailed in the
following table.
| |
|
|
|
|
|
|
|
|
| Increase / (Reduction) in Expenses |
|
| Item |
|
2008 |
|
|
2007 |
|
Change in depreciation and amortization (1) |
|
$ |
0.9 |
|
|
$ |
0.6 |
|
Cost reduction initiatives expenses (2) |
|
|
6.7 |
|
|
|
— |
|
Environmental insurance settlement (3) |
|
|
(6.9 |
) |
|
|
— |
|
Chapter 11 related post-emergence expenses (4) |
|
|
(1.3 |
) |
|
|
7.1 |
|
Review of strategic alternatives (5) |
|
|
1.2 |
|
|
|
8.7 |
|
| |
|
|
| (1) |
|
Charges related to fresh-start reporting. |
| |
| (2) |
|
Represents costs for corporate severances, partially offset by related reductions in
stock-based compensation expense, and restructuring costs. |
| |
| (3) |
|
We received an insurance settlement related to an environmental matter. |
| |
| (4) |
|
These costs represent professional and administrative fees incurred primarily to
resolve remaining claims related to AWI’s Chapter 11 Case and distribute proceeds to
creditors, and expenses incurred by Armstrong Holdings, Inc., our former publicly held
parent holding company, as it completed its plan of dissolution. In addition, 2008
includes the impact of the reversal of a contingent liability that was no longer owed to
creditors after our final Chapter 11 distribution was made. |
| |
| (5) |
|
These expenses were incurred, primarily from advisors, in conducting our review of
strategic alternatives which concluded during 2008. |
CASH FLOW
As shown on the Consolidated Statements of Cash Flows, our cash and cash equivalents balance
decreased by $159.3 million in 2008 compared to an increase of $250.5 million in 2007.
Operating activities in 2008 provided $214.2 million of net cash, primarily due to cash earnings
and distributions from WAVE of $61.0 million (which includes a special distribution of $5.5
million). These were partially offset by a reduction in accounts payable and accrued expenses of
$88.2 million, primarily due to lower activity and the payment of incentive accruals during the
first quarter of 2008. Operating activities in 2007 provided $575.2 million of net cash, primarily
due to cash earnings, net U.S. federal income tax refunds of $209.1 million and distributions from
WAVE of $117.5 million (which includes special distributions of $50.0 million).
Investing activities in 2008 used $75.7 million of cash primarily due to capital expenditures of
$95.0 million, partially offset by a special distribution from WAVE of $19.5 million, which was
classified as a return of investment. Investing activities in 2007 used $36.7 million of cash
primarily due to capital expenditures of $102.6 million partially offset by proceeds received from
the divestiture of a business of $58.8 million.
Financing activities in 2008 used $277.0 million primarily due to a special cash dividend of $256.4
million. Financing activities used $305.4 million of cash in 2007 primarily due to voluntary
principal debt prepayments of $300 million.
OFF-BALANCE SHEET ARRANGEMENTS
No disclosures are required pursuant to Item 303(a)(4) of Regulation S-K.
43
Management’s Discussion and Analysis of Financial Condition and Results of Operations
(dollar amounts in millions)
CONTRACTUAL OBLIGATIONS
As part of our normal operations, we enter into numerous contractual obligations that require
specific payments during the term of the various agreements. The following table includes amounts
ongoing under contractual obligations existing as of December 31, 2009. Only known payments that
are dependent solely on the passage of time are included. Obligations under contracts that contain
minimum payment amounts are shown at the minimum payment amount. Contracts that have variable
payment structures without minimum payments are excluded. Purchase orders that are entered into in
the normal course of business are also excluded because they are generally cancelable and not
legally binding. Amounts are presented below based upon the currently scheduled payment terms.
Actual future payments may differ from the amounts presented below due to changes in payment terms
or events affecting the payments.
| |
|
|
|
|
|
|
|
|
|
|
|
|
|
|
|
|
|
|
|
|
|
|
|
|
|
|
|
|
| |
|
2010 |
|
|
2011 |
|
|
2012 |
|
|
2013 |
|
|
2014 |
|
|
Thereafter |
|
|
Total |
|
|
|
|
|
|
|
|
|
|
|
|
|
|
|
|
|
|
|
|
|
|
|
|
|
|
|
|
|
|
Long-term debt |
|
$ |
40.1 |
|
|
$ |
234.8 |
|
|
$ |
3.5 |
|
|
$ |
184.1 |
|
|
$ |
0.1 |
|
|
$ |
10.0 |
|
|
$ |
472.6 |
|
Scheduled interest payments (1) |
|
|
10.1 |
|
|
|
16.6 |
|
|
|
9.3 |
|
|
|
8.3 |
|
|
|
0.9 |
|
|
|
— |
|
|
|
45.2 |
|
Operating lease obligations (2) |
|
|
12.2 |
|
|
|
8.8 |
|
|
|
5.7 |
|
|
|
3.0 |
|
|
|
1.4 |
|
|
|
4.0 |
|
|
|
35.1 |
|
Unconditional purchase obligations (3) |
|
|
30.2 |
|
|
|
6.8 |
|
|
|
1.8 |
|
|
|
— |
|
|
|
— |
|
|
|
— |
|
|
|
38.8 |
|
Other long-term obligations (4), (5) |
|
|
1.7 |
|
|
|
0.8 |
|
|
|
— |
|
|
|
— |
|
|
|
— |
|
|
|
— |
|
|
|
2.5 |
|
|
|
|
|
|
|
|
|
|
|
|
|
|
|
|
|
|
|
|
|
|
|
Total contractual obligations |
|
$ |
94.3 |
|
|
$ |
267.8 |
|
|
$ |
20.3 |
|
|
$ |
195.4 |
|
|
$ |
2.4 |
|
|
$ |
14.0 |
|
|
$ |
594.2 |
|
|
|
|
|
|
|
|
|
|
|
|
|
|
|
|
|
|
|
|
|
|
|
| |
|
|
| (1) |
|
For debt with variable interest rates, we projected future interest payments based
on market based interest rate swap curves. |
| |
| (2) |
|
Lease obligations include the minimum payments due under existing agreements with
noncancelable lease terms in excess of one year. |
| |
| (3) |
|
Unconditional purchase obligations include (a) purchase contracts whereby we must
make guaranteed minimum payments of a specified amount regardless of how little material is
actually purchased (“take or pay” contracts) and (b) service agreements. Unconditional
purchase obligations exclude contracts entered into during the normal course of business that
are non-cancelable and have fixed per unit fees, but where the monthly commitment varies based
upon usage. Cellular phone contracts are an example. |
| |
| (4) |
|
Other long-term obligations include payments under severance agreements. |
| |
| (5) |
|
Other long-term obligations does not include $57.5 million of liabilities under ASC
740 “Income Taxes”. Due to the uncertainty relating to these positions, we are unable to
reasonably estimate the ultimate amount or timing of the settlement of these issues. See Note
15 to the Consolidated Financial Statements for more information. |
We have issued financial guarantees to assure payment on behalf of our subsidiaries in the event of
default on various debt and lease obligations in the table above. We have not issued any
guarantees on behalf of joint-venture or unrelated businesses.
We are party to supply agreements, some of which require the purchase of inventory remaining at the
supplier upon termination of the agreement. The last such agreement will expire in 2013. Had
these agreements terminated at December 31, 2009, Armstrong would have been obligated to purchase
approximately $10.7 million of inventory. Historically, due to production planning, we have not
had to purchase material amounts of product at the end of similar contracts. Accordingly, no
liability has been recorded for these guarantees.
As part of our executive compensation plan, certain current and former executives participate in a
split-dollar insurance program where we are responsible for remitting the premiums. Since 1998,
the program was closed to new participants. As of December 31, 2009, we carried a cash surrender
value asset of $9.6 million related to this program. Should we discontinue making premium
payments, the insured executives have the right to the entire policy cash surrender value. In
light of the Sarbanes-Oxley Act, we believe it is inappropriate to make the premium payments for
two of the executives participating in this
plan. As a result, we have required these two individuals to make the premium payments to continue
the policy.
44
Management’s Discussion and Analysis of Financial Condition and Results of Operations
(dollar amounts in millions)
We utilize lines of credit and other commercial commitments in order to ensure that adequate funds
are available to meet operating requirements. Letters of credit are issued to third party
suppliers, insurance and financial institutions and typically can only be drawn upon in the event
of our failure to pay our obligations to the beneficiary. This table summarizes the commitments we
have available for use as of December 31, 2009. Letters of credit are currently arranged through
our revolving credit facility.
| |
|
|
|
|
|
|
|
|
|
|
|
|
|
|
|
|
|
|
|
|
| |
|
Total |
|
|
Less |
|
|
|
|
|
|
|
|
|
|
| Other Commercial |
|
Amounts |
|
|
Than 1 |
|
|
1 - 3 |
|
|
4 - 5 |
|
|
Over 5 |
|
| Commitments |
|
Committed |
|
|
Year |
|
|
Years |
|
|
Years |
|
|
Years |
|
Letters of credit |
|
$ |
41.8 |
|
|
$ |
41.8 |
|
|
|
— |
|
|
|
— |
|
|
|
— |
|
In addition, we have lines of credit for certain international operations totaling $24.9 million,
of which $1.0 million was used and $2.2 million was only available for letters of credit and
guarantees, leaving $21.7 million available to ensure funds are available to meet operating
requirements.
In disposing of assets, AWI and some subsidiaries have entered into contracts that included various
indemnity provisions, covering such matters as taxes, environmental liabilities and asbestos and
other litigation. Some of these contracts have exposure limits, but many do not. Due to the
nature of the indemnities, it is not possible to estimate the potential maximum exposure under
these contracts. For contracts under which an indemnity claim has been received, a liability of
$5.4 million has been recorded as of December 31, 2009.
RELATED PARTIES
See Note 29 of the Consolidated Financial Statements for a discussion of our relationships with
WAVE and TPG.
Related party transactions with executives and outside directors are discussed in Item 13 — Certain
Relationships and Related Transactions, and Director Independence.
45
|
|
|
| ITEM 7A. |
|
QUANTITATIVE AND QUALITATIVE DISCLOSURES ABOUT MARKET RISK |
Market Risk
We are exposed to market risk from changes in foreign currency exchange rates, interest rates and
commodity prices that could impact our results of operations and financial condition. We use
forward swaps and option contracts to hedge currency, interest rate and commodity exposures.
Forward swap and option contracts are entered into for periods consistent with underlying exposure
and do not constitute positions independent of those exposures. We use derivative financial
instruments as risk management tools and not for speculative trading purposes. In addition,
derivative financial instruments are entered into with a diversified group of major financial
institutions in order to manage our exposure to potential nonperformance on such instruments. We
regularly monitor developments in the capital markets.
Counter Party Risk
We only enter into derivative transactions with established counterparties having a credit rating
of A or better. We monitor counterparty credit default swap levels and credit ratings on a regular
basis. All of our derivative transactions with counterparties are governed by master International
Swap Dealer Agreements with netting arrangements. These agreements can limit our exposure in
situations where we have gain and loss positions outstanding with a single counterparty. We
generally do not post nor receive cash collateral with any counterparty for our derivative
transactions. As of December 31, 2009 we had no cash collateral posted or received for any of our
derivative transactions. These agreements do not contain any credit contingent features other than
those contained in our bank credit facility. Exposure to individual counterparties is controlled,
and thus we consider the risk of counterparty default to be negligible.
Interest Rate Sensitivity
Armstrong is subject to interest rate variability on its Term Loan A, Term Loan B, revolving credit
facility and other borrowings. There were no borrowings under the revolving credit facility as of
December 31, 2009. A hypothetical increase of one-quarter percentage point in interest rates from
December 31, 2009 levels would increase 2010 interest expense by approximately $1.1 million.
During 2009 we had interest rate swaps in place. As of December 31, 2009 we did not have any
interest rate swaps outstanding.
The table below provides information about our long-term debt obligations as of December 31, 2009,
including payment requirements and related weighted-average interest rates by scheduled maturity
dates.
| |
|
|
|
|
|
|
|
|
|
|
|
|
|
|
|
|
|
|
|
|
|
|
|
|
|
|
|
|
| Scheduled maturity date |
|
|
|
|
|
|
|
|
|
|
|
|
|
|
|
|
|
|
|
|
|
After |
|
|
|
|
| ($ millions) |
|
2010 |
|
|
2011 |
|
|
2012 |
|
|
2013 |
|
|
2014 |
|
|
2015 |
|
|
Total |
|
As of December 31, 2009 |
|
|
|
|
|
|
|
|
|
|
|
|
|
|
|
|
|
|
|
|
|
|
|
|
|
|
|
|
Long-term debt: |
|
|
|
|
|
|
|
|
|
|
|
|
|
|
|
|
|
|
|
|
|
|
|
|
|
|
|
|
Fixed rate |
|
$ |
7.8 |
|
|
|
— |
|
|
|
— |
|
|
|
— |
|
|
$ |
0.1 |
|
|
|
— |
|
|
$ |
7.9 |
|
Avg. interest rate |
|
|
5.28 |
% |
|
|
— |
|
|
|
— |
|
|
|
— |
|
|
|
5.63 |
% |
|
|
— |
|
|
|
5.28 |
% |
|
|
|
|
|
|
|
|
|
|
|
|
|
|
|
|
|
|
|
|
|
|
Variable rate |
|
$ |
32.3 |
|
|
$ |
234.8 |
|
|
$ |
3.5 |
|
|
$ |
184.1 |
|
|
$ |
— |
|
|
$ |
10.0 |
|
|
$ |
464.7 |
|
Avg. interest rate |
|
|
1.80 |
% |
|
|
1.79 |
% |
|
|
1.98 |
% |
|
|
1.98 |
% |
|
|
— |
|
|
|
1.83 |
% |
|
|
1.87 |
% |
46
Management’s Discussion and Analysis of Financial Condition and Results of Operations
(dollar amounts in millions)
Exchange Rate Sensitivity
We manufacture and sell our products in a number of countries throughout the world and, as a
result, are exposed to movements in foreign currency exchange rates. To a large extent, our global
manufacturing and sales provide a natural hedge of foreign currency exchange rate movement. We use
foreign currency forward exchange contracts to reduce our remaining exposure. At December 31,
2009, our major foreign currency exposures are to the Euro, the Canadian dollar and the British
pound. A 10% strengthening of all currencies against the U.S. dollar compared to December 31, 2009
levels would increase our 2010 earnings before income taxes by approximately $2.5 million,
including the impact of current foreign currency forward exchange contracts.
We also use foreign currency forward exchange contracts to hedge exposures created by
cross-currency intercompany loans.
The table below details our outstanding currency instruments as of December 31, 2009.
| |
|
|
|
|
On balance sheet foreign exchange related derivatives
|
|
Maturing in |
|
| As of December 31, 2009 |
|
2010 |
|
Notional amounts (millions) |
|
$ |
95.0 |
|
(Liabilities) at fair value (millions) |
|
$ |
(4.1 |
) |
Natural Gas Price Sensitivity
We purchase natural gas for use in the manufacture of ceiling tiles and other products, as well as
to heat many of our facilities. As a result, we are exposed to movements in the price of natural
gas. We have a policy of reducing North American natural gas volatility through derivative
instruments, including forward swap contracts, purchased call options and zero-cost collars. A 10%
increase in North American natural gas prices compared to December 31, 2009 prices would increase
our 2010 expenses by approximately $0.4 million including the impact of current hedging contracts.
The table below provides information about our natural gas contracts as of December 31, 2009.
Notional amounts are in millions of British Thermal Units (“MMBtu”), while the contract price
ranges are shown as the price per MMBtu.
| |
|
|
|
|
|
|
|
|
|
|
|
|
| On balance sheet commodity related derivatives |
|
|
Maturing in: |
|
| As of December 31, 2009 |
|
|
2010 |
|
|
|
2011 |
|
|
|
Total |
|
Contract amounts (MMBtu) |
|
|
3,530,000 |
|
|
|
1,040,000 |
|
|
|
4,570,000 |
|
Contract price range ($/MMBtu) |
|
|
$5.78 - $8.66 |
|
|
|
$6.10 - $8.38 |
|
|
|
$5.78 - $8.66 |
|
(Liabilities) at fair value (millions) |
|
|
$(4.4) |
|
|
|
$(0.2) |
|
|
|
$(4.6) |
|
47
|
|
|
| ITEM 8. |
|
FINANCIAL STATEMENTS AND SUPPLEMENTARY DATA |
SUPPLEMENTARY DATA
| |
|
|
|
|
|
|
|
49 |
|
|
|
|
|
|
The following consolidated financial statements are filed as part of this Annual Report on Form
10-K: |
|
|
|
|
|
|
|
|
|
|
|
|
52 |
|
|
|
|
|
|
|
|
|
54 |
|
|
|
|
|
|
|
|
|
55 |
|
|
|
|
|
|
|
|
|
56 |
|
|
|
|
|
|
|
|
|
57 |
|
|
|
|
|
|
|
|
|
58 |
|
|
|
|
|
|
|
|
|
|
|
48
QUARTERLY FINANCIAL INFORMATION
ARMSTRONG WORLD INDUSTRIES, INC. AND SUBSIDIARIES (unaudited)
| |
|
|
|
|
|
|
|
|
|
|
|
|
|
|
|
|
| (millions except for per share data) |
|
First |
|
|
Second |
|
|
Third |
|
|
Fourth |
|
|
|
|
|
|
|
|
|
|
|
|
|
|
|
|
|
|
2009 |
|
|
|
|
|
|
|
|
|
|
|
|
|
|
|
|
Net sales |
|
$ |
668.3 |
|
|
$ |
705.7 |
|
|
$ |
753.0 |
|
|
$ |
653.0 |
|
Gross profit |
|
|
131.4 |
|
|
|
164.0 |
|
|
|
188.0 |
|
|
|
137.6 |
|
|
|
|
|
|
|
|
|
|
|
|
|
|
|
|
|
|
Net earnings (loss) from continuing operations |
|
|
(11.2 |
) |
|
|
28.3 |
|
|
|
64.4 |
|
|
|
(3.8 |
) |
Per share of common stock: |
|
|
|
|
|
|
|
|
|
|
|
|
|
|
|
|
Basic |
|
$ |
(0.20 |
) |
|
$ |
0.50 |
|
|
$ |
1.13 |
|
|
$ |
(0.07 |
) |
Diluted |
|
$ |
(0.20 |
) |
|
$ |
0.50 |
|
|
$ |
1.12 |
|
|
$ |
(0.07 |
) |
| |
Net earnings (loss) |
|
|
(11.2 |
) |
|
|
28.3 |
|
|
|
64.4 |
|
|
|
(3.8 |
) |
Per share of common stock: |
|
|
|
|
|
|
|
|
|
|
|
|
|
|
|
|
Basic |
|
$ |
(0.20 |
) |
|
$ |
0.50 |
|
|
$ |
1.13 |
|
|
$ |
(0.07 |
) |
Diluted |
|
$ |
(0.20 |
) |
|
$ |
0.50 |
|
|
$ |
1.12 |
|
|
$ |
(0.07 |
) |
| |
Price range of common stock—high |
|
$ |
23.74 |
|
|
$ |
21.80 |
|
|
$ |
35.50 |
|
|
$ |
45.45 |
|
Price range of common stock—low |
|
$ |
9.42 |
|
|
$ |
10.55 |
|
|
$ |
15.05 |
|
|
$ |
33.14 |
|
|
|
|
|
|
|
|
|
|
|
|
|
|
|
|
|
|
Dividends paid per share |
|
|
— |
|
|
|
— |
|
|
|
— |
|
|
|
— |
|
| |
|
|
|
|
|
|
|
|
|
|
|
|
|
|
|
|
| |
|
First |
|
|
Second |
|
|
Third |
|
|
Fourth |
|
|
|
|
|
|
|
|
|
|
|
|
|
|
|
|
|
|
2008 |
|
|
|
|
|
|
|
|
|
|
|
|
|
|
|
|
Net sales |
|
$ |
828.2 |
|
|
$ |
926.8 |
|
|
$ |
929.6 |
|
|
$ |
708.4 |
|
Gross profit |
|
|
185.9 |
|
|
|
225.2 |
|
|
|
211.7 |
|
|
|
138.2 |
|
|
|
|
|
|
|
|
|
|
|
|
|
|
|
|
|
|
Net earnings (loss) from continuing operations |
|
|
15.1 |
|
|
|
52.4 |
|
|
|
39.1 |
|
|
|
(26.2 |
) |
Per share of common stock: |
|
|
|
|
|
|
|
|
|
|
|
|
|
|
|
|
Basic |
|
$ |
0.27 |
|
|
$ |
0.92 |
|
|
$ |
0.69 |
|
|
$ |
(0.46 |
) |
Diluted |
|
$ |
0.26 |
|
|
$ |
0.92 |
|
|
$ |
0.68 |
|
|
$ |
(0.46 |
) |
| |
Net earnings (loss) |
|
|
15.2 |
|
|
|
52.4 |
|
|
|
38.9 |
|
|
|
(25.5 |
) |
Per share of common stock: |
|
|
|
|
|
|
|
|
|
|
|
|
|
|
|
|
Basic |
|
$ |
0.27 |
|
|
$ |
0.92 |
|
|
$ |
0.68 |
|
|
$ |
(0.45 |
) |
Diluted |
|
$ |
0.27 |
|
|
$ |
0.92 |
|
|
$ |
0.68 |
|
|
$ |
(0.45 |
) |
| |
Price range of common stock—high |
|
$ |
40.98 |
|
|
$ |
39.44 |
|
|
$ |
40.19 |
|
|
$ |
28.94 |
|
Price range of common stock—low |
|
$ |
26.25 |
|
|
$ |
28.92 |
|
|
$ |
27.10 |
|
|
$ |
13.79 |
|
|
|
|
|
|
|
|
|
|
|
|
|
|
|
|
|
|
Dividends paid per share |
|
$ |
4.50 |
|
|
|
— |
|
|
|
— |
|
|
|
— |
|
Note: The net sales and gross profit amounts reported above are reported on a continuing
operations basis. The sum of the quarterly earnings per share data may not equal the total year
amounts due to changes in the average shares outstanding and, for diluted data, the exclusion of
the antidilutive effect in certain quarters.
49
Fourth Quarter 2009 Compared With Fourth Quarter 2008
Net sales of $653.0 million in the fourth quarter of 2009 decreased from net sales of $708.4
million in the fourth quarter of 2008, a decrease of 7.8%. Excluding the favorable effects of
foreign exchange rates of $15.2 million, net sales decreased 10.2%. The decline was due to broad
market weakness which drove volume declines across all business units. Resilient Flooring net
sales decreased 7.2%, excluding the favorable effects of foreign exchange rates, primarily due to
lower volume in the North American markets. Wood Flooring net sales decreased by 3.1% primarily
due to lower volume driven by continued declines in residential housing markets. Building Products
net sales decreased by 15.6%, excluding the favorable effects of foreign exchange rates of $6.5
million due to market-related volume declines. Cabinet’s net sales decreased by 10.1% on volume
declines related to further deterioration in the U.S. housing markets. Net sales decreased 10% in
the Americas. Excluding the favorable effects of foreign exchange rates of $8.4 million, Europe
net sales decreased 12.8%. Excluding the favorable effects of foreign exchange rates of $3.8
million, Pacific Rim sales increased 5.8%.
2009 and 2008 operating expenses were impacted by several significant items. The significant items
which impacted COGS, and SG&A expenses include:
| |
|
|
|
|
|
|
|
|
|
|
|
|
| Increase / (Reduction) in Expenses |
|
| |
|
Where |
|
|
|
|
|
|
|
| Item |
|
Reported |
|
|
2009 |
|
|
2008 |
|
Cost reduction initiatives expenses(1) |
|
COGS |
|
$ |
6.8 |
|
|
$ |
4.8 |
|
Fixed asset impairment(2) |
|
COGS |
|
|
3.0 |
|
|
|
2.9 |
|
Cost reduction initiatives expenses(1) |
|
SG&A |
|
|
(0.6 |
) |
|
|
2.3 |
|
Environmental insurance settlement(3) |
|
SG&A |
|
|
— |
|
|
|
(6.9 |
) |
Intangible asset impairment(4) |
|
Intangible asset impairment |
|
|
18.0 |
|
|
|
25.4 |
|
| |
|
|
| (1) |
|
See “Factors Affecting Operating Costs” for a discussion of the cost reduction expenses. |
| |
| (2) |
|
Impairment charges related to certain European Resilient Flooring assets. |
| |
| (3) |
|
Gain from an insurance settlement related to an environmental matter. |
| |
| (4) |
|
During the fourth quarter of 2009 and 2008, we recorded non-cash impairment charges of
our Wood Flooring trademarks. |
For the fourth quarter of 2009, the cost of goods sold was 78.9% of net sales, compared to
80.5% in 2008. The 1.6 percentage point decrease was due to reduced input and manufacturing costs
more than offsetting the decline in sales. The change in the percentages was also impacted by the
items detailed in the above table.
SG&A expenses for the fourth quarter of 2009 were 20.1% of net sales, or $131.1 million, as
compared to 18.0% of net sales, or $127.2 million for the fourth quarter of 2008. The increase in
SG&A expenses as a percentage of net sales is primarily due lower sales. Both periods were
impacted by the items detailed in the above table.
Operating loss of $1.6 million in the fourth quarter of 2009 compared to $6.5 million in the fourth
quarter of 2008.
Income tax (benefit)/expense for the fourth quarter of 2009 was $(1.4) million on a pre-tax loss of
$5.2 million versus $14.6 million on pre-tax loss of $11.6 million in 2008. The effective tax rate
for the fourth quarter was impacted by a reduction in the amount of valuation allowances for state
deferred income tax assets.
50
MANAGEMENT’S REPORT ON INTERNAL CONTROL OVER FINANCIAL REPORTING
Our management is responsible for establishing and maintaining adequate internal control over
financial reporting, as such term is defined in Rules 13a-15(f) and 15d-15(f) under the Securities
Exchange Act of 1934, as amended. Our internal control over financial reporting was designed to
provide reasonable assurance to management and our Board of Directors regarding the reliability of
financial reporting and the fair presentation of our financial statements.
With the participation of our management, including our Chief Executive Officer and Chief Financial
Officer, we conducted an evaluation of the effectiveness of our internal control over financial
reporting based on the framework in Internal Control-Integrated Framework issued by the Committee
of Sponsoring Organizations of the Treadway Commission (COSO). Based on our evaluation, our
management concluded that our internal control over financial reporting was effective as of
December 31, 2009.
KPMG LLP, an independent registered public accounting firm, audited our internal control over
financial reporting as of December 31, 2009. Their audit report can be found on page 52.
| |
|
|
|
|
|
Michael D. Lockhart |
|
|
Chairman and Chief Executive Officer |
|
|
|
|
|
|
|
|
Thomas B. Mangas |
|
|
Senior Vice President and Chief Financial Officer |
|
|
|
|
|
|
|
|
Stephen F. McNamara |
|
|
Vice President and Corporate Controller |
|
|
|
|
|
February 26, 2010 |
|
|
51
Report of Independent Registered Public Accounting Firm
The Board of Directors and Shareholders
Armstrong World Industries, Inc.:
We have audited Armstrong World Industries, Inc. and subsidiaries’ (“the Company”) internal control
over financial reporting as of December 31, 2009, based on criteria established in Internal
Control-Integrated Framework issued by the Committee of Sponsoring Organizations of the Treadway
Commission (COSO). The Company’s management is responsible for maintaining effective internal
control over financial reporting and for its assessment of the effectiveness of internal control
over financial reporting, included in the accompanying Management’s Report on Internal Control over
Financial Reporting. Our responsibility is to express an opinion on the Company’s internal control
over financial reporting based on our audit.
We conducted our audit in accordance with the standards of the Public Company Accounting Oversight
Board (United States). Those standards require that we plan and perform the audit to obtain
reasonable assurance about whether effective internal control over financial reporting was
maintained in all material respects. Our audit included obtaining an understanding of internal
control over financial reporting, assessing the risk that a material weakness exists, and testing
and evaluating the design and operating effectiveness of internal control based on the assessed
risk. Our audit also included performing such other procedures as we considered necessary in the
circumstances. We believe that our audit provides a reasonable basis for our opinion.
A company’s internal control over financial reporting is a process designed to provide reasonable
assurance regarding the reliability of financial reporting and the preparation of financial
statements for external purposes in accordance with generally accepted accounting principles. A
company’s internal control over financial reporting includes those policies and procedures that (1)
pertain to the maintenance of records that, in reasonable detail, accurately and fairly reflect the
transactions and dispositions of the assets of the company; (2) provide reasonable assurance that
transactions are recorded as necessary to permit preparation of financial statements in accordance
with generally accepted accounting principles, and that receipts and expenditures of the company
are being made only in accordance with authorizations of management and directors of the company;
and (3) provide reasonable assurance regarding prevention or timely detection of unauthorized
acquisition, use, or disposition of the company’s assets that could have a material effect on the
financial statements.
Because of its inherent limitations, internal control over financial reporting may not prevent or
detect misstatements. Also, projections of any evaluation of effectiveness to future periods are
subject to the risk that controls may become inadequate because of changes in conditions, or that
the degree of compliance with the policies or procedures may deteriorate.
In our opinion, Armstrong World Industries, Inc. and subsidiaries maintained, in all material
respects, effective internal control over financial reporting as of December 31, 2009, based on
criteria established in Internal Control-Integrated Framework issued by the Committee of Sponsoring
Organizations of the Treadway Commission (COSO).
We also have audited, in accordance with the standards of the Public Company Accounting Oversight
Board (United States), the consolidated balance sheets of the Company as of December 31, 2009 and
2008, and the related consolidated statements of earnings, shareholders’ equity, and cash flows for
each of the years in the three-year period ended December 31, 2009, and our report dated February
26, 2010 expressed an unqualified opinion on those consolidated financial statements.
/s/ KPMG LLP
Philadelphia, Pennsylvania
February 26, 2010
52
Report of Independent Registered Public Accounting Firm
The Board of Directors and Shareholders
Armstrong World Industries, Inc.:
We have audited the accompanying consolidated balance sheets of Armstrong World Industries,
Inc. and subsidiaries (“the Company”) as of December 31, 2009 and 2008, and the related
consolidated statements of earnings, equity and cash flows for each of the years in the three-year
period ended December 31, 2009. In connection with our audits of the consolidated financial
statements, we also have audited the financial statement schedule as listed in the accompanying
index on page 111. These consolidated financial statements and financial statement schedule are the
responsibility of the Company’s management. Our responsibility is to express an opinion on these
consolidated financial statements and financial statement schedule based on our audits.
We conducted our audits in accordance with the standards of the Public Company Accounting Oversight
Board (United States). Those standards require that we plan and perform the audit to obtain
reasonable assurance about whether the financial statements are free of material misstatement. An
audit includes examining, on a test basis, evidence supporting the amounts and disclosures in the
financial statements. An audit also includes assessing the accounting principles used and
significant estimates made by management, as well as evaluating the overall financial statement
presentation. We believe that our audits provide a reasonable basis for our opinion.
In our opinion, the consolidated financial statements referred to above present fairly, in all
material respects, the financial position of Armstrong World Industries, Inc. and subsidiaries as
of December 31, 2009 and 2008, and the results of their operations and their cash flows for each of
the years in the three-year period ended December 31, 2009, in conformity with U.S. generally
accepted accounting principles. Also in our opinion, the related financial statement schedule, when
considered in relation to the basic consolidated financial statements taken as a whole, presents
fairly, in all material respects, the information set forth therein.
We also have audited, in accordance with the standards of the Public Company Accounting Oversight
Board (United States), the Company’s internal control over financial reporting as of December 31,
2009, based on criteria established in Internal Control-Integrated Framework issued by the
Committee of Sponsoring Organizations of the Treadway Commission (COSO), and our report dated
February 26, 2010 expressed an unqualified opinion on the effectiveness of the Company’s internal
control over financial reporting.
/s/ KPMG LLP
Philadelphia, Pennsylvania
February 26, 2010
53
Armstrong World Industries, Inc., and Subsidiaries
Consolidated Statements of Earnings
(amounts in millions, except per share data)
| |
|
|
|
|
|
|
|
|
|
|
|
|
| |
|
Years Ended December 31, |
|
| |
|
2009 |
|
|
2008 |
|
|
2007 |
|
|
|
|
|
|
|
|
|
|
|
|
|
|
Net sales |
|
$ |
2,780.0 |
|
|
$ |
3,393.0 |
|
|
$ |
3,549.7 |
|
Cost of goods sold |
|
|
2,159.0 |
|
|
|
2,632.0 |
|
|
|
2,687.5 |
|
|
|
|
|
|
|
|
|
|
|
Gross profit |
|
|
621.0 |
|
|
|
761.0 |
|
|
|
862.2 |
|
|
|
|
|
|
|
|
|
|
|
|
|
|
Selling, general and administrative expenses |
|
|
552.4 |
|
|
|
579.9 |
|
|
|
611.3 |
|
Intangible asset impairment |
|
|
18.0 |
|
|
|
25.4 |
|
|
|
— |
|
Restructuring charges, net |
|
|
— |
|
|
|
0.8 |
|
|
|
0.2 |
|
Equity earnings from joint ventures |
|
|
(40.0 |
) |
|
|
(56.0 |
) |
|
|
(46.0 |
) |
|
|
|
|
|
|
|
|
|
|
Operating income |
|
|
90.6 |
|
|
|
210.9 |
|
|
|
296.7 |
|
|
|
|
|
|
|
|
|
|
|
|
|
|
Interest expense |
|
|
17.7 |
|
|
|
30.8 |
|
|
|
55.0 |
|
Other non-operating expense |
|
|
0.9 |
|
|
|
1.3 |
|
|
|
1.4 |
|
Other non-operating (income) |
|
|
(3.2 |
) |
|
|
(10.6 |
) |
|
|
(18.2 |
) |
Chapter 11 reorganization (income), net |
|
|
— |
|
|
|
— |
|
|
|
(0.7 |
) |
|
|
|
|
|
|
|
|
|
|
| |
Earnings from continuing operations before income taxes |
|
|
75.2 |
|
|
|
189.4 |
|
|
|
259.2 |
|
Income tax (benefit) expense |
|
|
(2.5 |
) |
|
|
109.0 |
|
|
|
106.4 |
|
|
|
|
|
|
|
|
|
|
|
| |
Earnings from continuing operations |
|
|
77.7 |
|
|
|
80.4 |
|
|
|
152.8 |
|
Gain (loss) from discontinued operations, net of tax of $0.0, $0.4, and $0.3, respectively |
|
|
— |
|
|
|
0.6 |
|
|
|
(7.5 |
) |
|
|
|
|
|
|
|
|
|
|
| |
Net earnings |
|
$ |
77.7 |
|
|
$ |
81.0 |
|
|
$ |
145.3 |
|
|
|
|
|
|
|
|
|
|
|
|
|
|
|
|
|
|
|
|
|
|
|
|
Earnings per share of common stock, continuing operations: |
|
|
|
|
|
|
|
|
|
|
|
|
Basic |
|
$ |
1.36 |
|
|
$ |
1.41 |
|
|
$ |
2.69 |
|
Diluted |
|
$ |
1.36 |
|
|
$ |
1.41 |
|
|
$ |
2.69 |
|
|
|
|
|
|
|
|
|
|
|
|
|
|
Gain (loss) per share of common stock, discontinued operations: |
|
|
|
|
|
|
|
|
|
|
|
|
Basic |
|
$ |
— |
|
|
$ |
0.01 |
|
|
$ |
(0.13 |
) |
Diluted |
|
$ |
— |
|
|
$ |
0.01 |
|
|
$ |
(0.13 |
) |
|
|
|
|
|
|
|
|
|
|
|
|
|
Net earnings per share of common stock: |
|
|
|
|
|
|
|
|
|
|
|
|
Basic |
|
$ |
1.36 |
|
|
$ |
1.42 |
|
|
$ |
2.56 |
|
Diluted |
|
$ |
1.36 |
|
|
$ |
1.42 |
|
|
$ |
2.56 |
|
|
|
|
|
|
|
|
|
|
|
|
|
|
Average number of common shares outstanding: |
|
|
|
|
|
|
|
|
|
|
|
|
Basic |
|
|
56.8 |
|
|
|
56.4 |
|
|
|
56.1 |
|
Diluted |
|
|
57.0 |
|
|
|
56.4 |
|
|
|
56.1 |
|
See accompanying notes to consolidated financial statements beginning on page 58.
54
Armstrong World Industries, Inc., and Subsidiaries
Consolidated Balance Sheets
(amounts in millions, except share data)
| |
|
|
|
|
|
|
|
|
| |
|
December 31, |
|
|
December 31, |
|
| |
|
2009 |
|
|
2008 |
|
Assets |
|
|
|
|
|
|
|
|
Current assets: |
|
|
|
|
|
|
|
|
Cash and cash equivalents |
|
$ |
569.5 |
|
|
$ |
355.0 |
|
Accounts and notes receivable, net |
|
|
229.1 |
|
|
|
247.9 |
|
Inventories, net |
|
|
445.0 |
|
|
|
544.0 |
|
Deferred income taxes |
|
|
16.3 |
|
|
|
14.4 |
|
Income tax receivable |
|
|
16.5 |
|
|
|
22.0 |
|
Other current assets |
|
|
55.2 |
|
|
|
78.2 |
|
|
|
|
|
|
|
|
Total current assets |
|
|
1,331.6 |
|
|
|
1,261.5 |
|
|
|
|
|
|
|
|
|
|
Property, plant and equipment, less accumulated depreciation and amortization of $390.0 and $278.9, respectively |
|
|
929.2 |
|
|
|
954.2 |
|
|
|
|
|
|
|
|
|
|
Prepaid pension costs |
|
|
114.3 |
|
|
|
0.3 |
|
Investment in joint venture |
|
|
194.6 |
|
|
|
208.2 |
|
Intangible assets, net |
|
|
592.8 |
|
|
|
626.3 |
|
Deferred income taxes |
|
|
58.2 |
|
|
|
219.6 |
|
Other noncurrent assets |
|
|
81.9 |
|
|
|
81.7 |
|
|
|
|
|
|
|
|
Total assets |
|
$ |
3,302.6 |
|
|
$ |
3,351.8 |
|
|
|
|
|
|
|
|
|
|
|
|
|
|
|
|
|
Liabilities and Equity |
|
|
|
|
|
|
|
|
Current liabilities: |
|
|
|
|
|
|
|
|
Short-term debt |
|
$ |
0.1 |
|
|
$ |
1.3 |
|
Current installments of long-term debt |
|
|
40.0 |
|
|
|
40.9 |
|
Accounts payable and accrued expenses |
|
|
311.0 |
|
|
|
337.0 |
|
Income tax payable |
|
|
3.1 |
|
|
|
1.6 |
|
Deferred income taxes |
|
|
3.1 |
|
|
|
4.6 |
|
|
|
|
|
|
|
|
Total current liabilities |
|
|
357.3 |
|
|
|
385.4 |
|
|
|
|
|
|
|
|
|
|
Long-term debt, less current installments |
|
|
432.5 |
|
|
|
454.8 |
|
Postretirement and postemployment benefit liabilities |
|
|
306.0 |
|
|
|
312.8 |
|
Pension benefit liabilities |
|
|
223.5 |
|
|
|
211.4 |
|
Other long-term liabilities |
|
|
58.0 |
|
|
|
62.4 |
|
Income taxes payable |
|
|
9.2 |
|
|
|
164.7 |
|
Deferred income taxes |
|
|
8.2 |
|
|
|
9.0 |
|
|
|
|
|
|
|
|
Total noncurrent liabilities |
|
|
1,037.4 |
|
|
|
1,215.1 |
|
|
|
|
|
|
|
|
|
|
Shareholders’ equity: |
|
|
|
|
|
|
|
|
Common stock, $0.01 par value per share, authorized 200 million shares; issued 57,433,503 shares in 2009 and
57,049,495 shares in 2008 |
|
|
0.6 |
|
|
|
0.6 |
|
Capital in excess of par value |
|
|
2,052.1 |
|
|
|
2,024.7 |
|
Retained earnings |
|
|
144.4 |
|
|
|
66.7 |
|
Accumulated other comprehensive (loss) |
|
|
(297.8 |
) |
|
|
(348.8 |
) |
|
|
|
|
|
|
|
Total shareholders’ equity |
|
|
1,899.3 |
|
|
|
1,743.2 |
|
|
|
|
|
|
|
|
Non-controlling interest |
|
|
8.6 |
|
|
|
8.1 |
|
|
|
|
|
|
|
|
Total equity |
|
|
1,907.9 |
|
|
|
1,751.3 |
|
|
|
|
|
|
|
|
Total liabilities and equity |
|
$ |
3,302.6 |
|
|
$ |
3,351.8 |
|
|
|
|
|
|
|
|
See accompanying notes to consolidated financial statements beginning on page 58.
55
Armstrong World Industries, Inc., and Subsidiaries
Consolidated Statements of Equity
(amounts in millions)
| |
|
|
|
|
|
|
|
|
|
|
|
|
|
|
|
|
|
|
|
|
|
|
|
|
| |
|
Year 2009 |
|
| |
|
Total |
|
|
AWI Shareholders |
|
|
Non-Controlling Interest |
|
Non-Controlling Interest: |
|
|
|
|
|
|
|
|
|
|
|
|
|
|
|
|
|
|
|
|
|
|
|
|
Balance at beginning of year |
|
$ |
8.1 |
|
|
|
|
|
|
|
— |
|
|
|
|
|
|
$ |
8.1 |
|
|
|
|
|
|
|
|
|
|
|
|
|
|
|
|
|
|
|
|
|
|
|
|
|
|
|
Common stock: |
|
|
|
|
|
|
|
|
|
|
|
|
|
|
|
|
|
|
|
|
|
|
|
|
Balance at beginning of year and December 31 |
|
$ |
0.6 |
|
|
|
|
|
|
$ |
0.6 |
|
|
|
|
|
|
|
— |
|
|
|
|
|
|
|
|
|
|
|
|
|
|
|
|
|
|
|
|
|
|
|
|
|
|
|
|
Capital in excess of par value: |
|
|
|
|
|
|
|
|
|
|
|
|
|
|
|
|
|
|
|
|
|
|
|
|
Balance at beginning of year |
|
$ |
2,024.7 |
|
|
|
|
|
|
$ |
2,024.7 |
|
|
|
|
|
|
|
— |
|
|
|
|
|
Share-based employee compensation |
|
|
27.4 |
|
|
|
|
|
|
|
27.4 |
|
|
|
|
|
|
|
— |
|
|
|
|
|
|
|
|
|
|
|
|
|
|
|
|
|
|
|
|
|
|
|
|
|
|
|
|
Balance at December 31 |
|
$ |
2,052.1 |
|
|
|
|
|
|
$ |
2,052.1 |
|
|
|
|
|
|
|
— |
|
|
|
|
|
|
|
|
|
|
|
|
|
|
|
|
|
|
|
|
|
|
|
|
|
|
|
|
Retained earnings: |
|
|
|
|
|
|
|
|
|
|
|
|
|
|
|
|
|
|
|
|
|
|
|
|
Balance at beginning of year |
|
$ |
66.7 |
|
|
|
|
|
|
$ |
66.7 |
|
|
|
|
|
|
|
— |
|
|
|
|
|
Net earnings for period |
|
|
78.2 |
|
|
$ |
78.2 |
|
|
|
77.7 |
|
|
$ |
77.7 |
|
|
|
0.5 |
|
|
$ |
0.5 |
|
|
|
|
|
|
|
|
|
|
|
|
|
|
|
|
|
|
|
|
|
|
|
Balance at December 31 |
|
$ |
144.9 |
|
|
|
|
|
|
$ |
144.4 |
|
|
|
|
|
|
$ |
0.5 |
|
|
|
|
|
|
|
|
|
|
|
|
|
|
|
|
|
|
|
|
|
|
|
|
|
|
|
Accumulated other comprehensive income (loss): |
|
|
|
|
|
|
|
|
|
|
|
|
|
|
|
|
|
|
|
|
|
|
|
|
Balance at beginning of year |
|
$ |
(348.8 |
) |
|
|
|
|
|
$ |
(348.8 |
) |
|
|
|
|
|
|
— |
|
|
|
|
|
Foreign currency translation adjustments |
|
|
34.4 |
|
|
|
|
|
|
|
34.4 |
|
|
|
|
|
|
|
— |
|
|
|
|
|
Derivative (loss), net |
|
|
(2.2 |
) |
|
|
|
|
|
|
(2.2 |
) |
|
|
|
|
|
|
— |
|
|
|
|
|
Pension and postretirement adjustments |
|
|
18.8 |
|
|
|
|
|
|
|
18.8 |
|
|
|
|
|
|
|
— |
|
|
|
|
|
|
|
|
|
|
|
|
|
|
|
|
|
|
|
|
|
|
|
|
|
|
|
Total other comprehensive income |
|
|
51.0 |
|
|
|
51.0 |
|
|
|
51.0 |
|
|
|
51.0 |
|
|
|
— |
|
|
|
— |
|
|
|
|
|
|
|
|
|
|
|
|
|
|
|
|
|
|
|
|
Balance at December 31 |
|
$ |
(297.8 |
) |
|
|
|
|
|
$ |
(297.8 |
) |
|
|
|
|
|
|
— |
|
|
|
|
|
|
|
|
|
|
|
|
|
|
|
|
|
|
|
|
|
|
|
|
|
|
|
Comprehensive income |
|
|
|
|
|
$ |
129.2 |
|
|
|
|
|
|
$ |
128.7 |
|
|
|
|
|
|
$ |
0.5 |
|
|
|
|
|
|
|
|
|
|
|
|
|
|
|
|
|
|
|
|
|
|
|
Total equity |
|
$ |
1,907.9 |
|
|
|
|
|
|
$ |
1,899.3 |
|
|
|
|
|
|
$ |
8.6 |
|
|
|
|
|
|
|
|
|
|
|
|
|
|
|
|
|
|
|
|
|
|
|
|
|
|
|
| |
|
|
|
|
|
|
|
|
|
|
|
|
|
|
|
|
|
|
|
|
|
|
|
|
| |
|
Year 2008 |
|
| |
|
Total |
|
|
AWI Shareholders |
|
|
Non-Controlling Interest |
|
Non-Controlling Interest: |
|
|
|
|
|
|
|
|
|
|
|
|
|
|
|
|
|
|
|
|
|
|
|
|
Balance at beginning of year |
|
$ |
7.4 |
|
|
|
|
|
|
|
— |
|
|
|
|
|
|
$ |
7.4 |
|
|
|
|
|
|
|
|
|
|
|
|
|
|
|
|
|
|
|
|
|
|
|
|
|
|
|
Common stock: |
|
|
|
|
|
|
|
|
|
|
|
|
|
|
|
|
|
|
|
|
|
|
|
|
Balance at beginning of year and December 31 |
|
$ |
0.6 |
|
|
|
|
|
|
$ |
0.6 |
|
|
|
|
|
|
|
— |
|
|
|
|
|
|
|
|
|
|
|
|
|
|
|
|
|
|
|
|
|
|
|
|
|
|
|
|
Capital in excess of par value: |
|
|
|
|
|
|
|
|
|
|
|
|
|
|
|
|
|
|
|
|
|
|
|
|
Balance at beginning of year |
|
$ |
2,112.6 |
|
|
|
|
|
|
$ |
2,112.6 |
|
|
|
|
|
|
|
— |
|
|
|
|
|
Share-based employee compensation |
|
|
7.2 |
|
|
|
|
|
|
|
7.2 |
|
|
|
|
|
|
|
— |
|
|
|
|
|
Dividends in excess of retained earnings |
|
|
(95.1 |
) |
|
|
|
|
|
|
(95.1 |
) |
|
|
|
|
|
|
— |
|
|
|
|
|
|
|
|
|
|
|
|
|
|
|
|
|
|
|
|
|
|
|
|
|
|
|
|
Balance at December 31 |
|
$ |
2,024.7 |
|
|
|
|
|
|
$ |
2,024.7 |
|
|
|
|
|
|
|
— |
|
|
|
|
|
|
|
|
|
|
|
|
|
|
|
|
|
|
|
|
|
|
|
|
|
|
|
|
Retained earnings: |
|
|
|
|
|
|
|
|
|
|
|
|
|
|
|
|
|
|
|
|
|
|
|
|
Balance at beginning of year |
|
$ |
147.5 |
|
|
|
|
|
|
$ |
147.5 |
|
|
|
|
|
|
|
— |
|
|
|
|
|
Net earnings for period |
|
|
81.2 |
|
|
$ |
81.2 |
|
|
|
81.0 |
|
|
$ |
81.0 |
|
|
|
0.2 |
|
|
$ |
0.2 |
|
Dividends |
|
|
(161.8 |
) |
|
|
|
|
|
|
(161.8 |
) |
|
|
|
|
|
|
— |
|
|
|
|
|
|
|
|
|
|
|
|
|
|
|
|
|
|
|
|
|
|
|
|
|
|
|
Balance at December 31 |
|
$ |
66.9 |
|
|
|
|
|
|
$ |
66.7 |
|
|
|
|
|
|
$ |
0.2 |
|
|
|
|
|
|
|
|
|
|
|
|
|
|
|
|
|
|
|
|
|
|
|
|
|
|
|
Accumulated other comprehensive (loss) income: |
|
|
|
|
|
|
|
|
|
|
|
|
|
|
|
|
|
|
|
|
|
|
|
|
Balance at beginning of year |
|
$ |
176.0 |
|
|
|
|
|
|
$ |
176.0 |
|
|
|
|
|
|
|
— |
|
|
|
|
|
Foreign currency translation adjustments |
|
|
(42.2 |
) |
|
|
|
|
|
|
(42.7 |
) |
|
|
|
|
|
|
0.5 |
|
|
|
|
|
Derivative gain, net |
|
|
1.4 |
|
|
|
|
|
|
|
1.4 |
|
|
|
|
|
|
|
— |
|
|
|
|
|
Pension and postretirement adjustments |
|
|
(483.5 |
) |
|
|
|
|
|
|
(483.5 |
) |
|
|
|
|
|
|
— |
|
|
|
|
|
|
|
|
|
|
|
|
|
|
|
|
|
|
|
|
|
|
|
|
|
|
|
Total other comprehensive (loss) income |
|
|
(524.3 |
) |
|
|
(524.3 |
) |
|
|
(524.8 |
) |
|
|
(524.8 |
) |
|
|
0.5 |
|
|
|
0.5 |
|
|
|
|
|
|
|
|
|
|
|
|
|
|
|
|
|
|
|
|
Balance at December 31 |
|
$ |
(348.3 |
) |
|
|
|
|
|
$ |
(348.8 |
) |
|
|
|
|
|
|
0.5 |
|
|
|
|
|
|
|
|
|
|
|
|
|
|
|
|
|
|
|
|
|
|
|
|
|
|
|
Comprehensive (loss) income |
|
|
|
|
|
$ |
(443.1 |
) |
|
|
|
|
|
$ |
(443.8 |
) |
|
|
|
|
|
$ |
0.7 |
|
|
|
|
|
|
|
|
|
|
|
|
|
|
|
|
|
|
|
|
|
|
|
Total equity |
|
$ |
1,751.3 |
|
|
|
|
|
|
$ |
1,743.2 |
|
|
|
|
|
|
$ |
8.1 |
|
|
|
|
|
|
|
|
|
|
|
|
|
|
|
|
|
|
|
|
|
|
|
|
|
|
|
| |
|
|
|
|
|
|
|
|
|
|
|
|
|
|
|
|
|
|
|
|
|
|
|
|
| |
|
Year 2007 |
|
| |
|
Total |
|
|
AWI Shareholders |
|
|
Non-Controlling Interest |
|
Non-Controlling Interest: |
|
|
|
|
|
|
|
|
|
|
|
|
|
|
|
|
|
|
|
|
|
|
|
|
Balance at beginning of year |
|
$ |
7.6 |
|
|
|
|
|
|
|
|
|
|
|
|
|
|
$ |
7.6 |
|
|
|
|
|
|
|
|
|
|
|
|
|
|
|
|
|
|
|
|
|
|
|
|
|
|
Common stock: |
|
|
|
|
|
|
|
|
|
|
|
|
|
|
|
|
|
|
|
|
|
|
|
|
Balance at beginning of year and December 31 |
|
$ |
0.6 |
|
|
|
|
|
|
$ |
0.6 |
|
|
|
|
|
|
|
— |
|
|
|
|
|
|
|
|
|
|
|
|
|
|
|
|
|
|
|
|
|
|
|
|
|
|
|
|
Capital in excess of par value: |
|
|
|
|
|
|
|
|
|
|
|
|
|
|
|
|
|
|
|
|
|
|
|
|
Balance at beginning of year |
|
$ |
2,099.8 |
|
|
|
|
|
|
$ |
2,099.8 |
|
|
|
|
|
|
|
— |
|
|
|
|
|
Share-based employee compensation |
|
|
12.8 |
|
|
|
|
|
|
|
12.8 |
|
|
|
|
|
|
|
— |
|
|
|
|
|
|
|
|
|
|
|
|
|
|
|
|
|
|
|
|
|
|
|
|
|
|
|
|
Balance at December 31 |
|
$ |
2,112.6 |
|
|
|
|
|
|
$ |
2,112.6 |
|
|
|
|
|
|
|
— |
|
|
|
|
|
|
|
|
|
|
|
|
|
|
|
|
|
|
|
|
|
|
|
|
|
|
|
|
Retained earnings: |
|
|
|
|
|
|
|
|
|
|
|
|
|
|
|
|
|
|
|
|
|
|
|
|
Balance at beginning of year |
|
$ |
2.2 |
|
|
|
|
|
|
$ |
2.2 |
|
|
|
|
|
|
|
— |
|
|
|
|
|
Net earnings for period |
|
|
145.9 |
|
|
$ |
145.9 |
|
|
|
145.3 |
|
|
$ |
145.3 |
|
|
|
0.6 |
|
|
$ |
0.6 |
|
Dividends |
|
|
(1.3 |
) |
|
|
|
|
|
|
— |
|
|
|
|
|
|
|
(1.3 |
) |
|
|
|
|
|
|
|
|
|
|
|
|
|
|
|
|
|
|
|
|
|
|
|
|
|
|
Balance at December 31 |
|
$ |
146.8 |
|
|
|
|
|
|
$ |
147.5 |
|
|
|
|
|
|
$ |
(0.7 |
) |
|
|
|
|
|
|
|
|
|
|
|
|
|
|
|
|
|
|
|
|
|
|
|
|
|
|
Accumulated other comprehensive income: |
|
|
|
|
|
|
|
|
|
|
|
|
|
|
|
|
|
|
|
|
|
|
|
|
Balance at beginning of year |
|
$ |
61.9 |
|
|
|
|
|
|
$ |
61.9 |
|
|
|
|
|
|
|
— |
|
|
|
|
|
Foreign currency translation adjustments |
|
|
30.8 |
|
|
|
|
|
|
|
30.3 |
|
|
|
|
|
|
|
0.5 |
|
|
|
|
|
Derivative (loss), net |
|
|
(5.4 |
) |
|
|
|
|
|
|
(5.4 |
) |
|
|
|
|
|
|
— |
|
|
|
|
|
Pension and postretirement adjustments |
|
|
89.2 |
|
|
|
|
|
|
|
89.2 |
|
|
|
|
|
|
|
— |
|
|
|
|
|
|
|
|
|
|
|
|
|
|
|
|
|
|
|
|
|
|
|
|
|
|
|
Total other comprehensive income |
|
|
114.6 |
|
|
|
114.6 |
|
|
|
114.1 |
|
|
|
114.1 |
|
|
|
0.5 |
|
|
|
0.5 |
|
|
|
|
|
|
|
|
|
|
|
|
|
|
|
|
|
|
|
|
Balance at December 31 |
|
$ |
176.5 |
|
|
|
|
|
|
$ |
176.0 |
|
|
|
|
|
|
|
0.5 |
|
|
|
|
|
|
|
|
|
|
|
|
|
|
|
|
|
|
|
|
|
|
|
|
|
|
|
Comprehensive income |
|
|
|
|
|
$ |
260.5 |
|
|
|
|
|
|
$ |
259.4 |
|
|
|
|
|
|
$ |
1.1 |
|
|
|
|
|
|
|
|
|
|
|
|
|
|
|
|
|
|
|
|
|
|
|
Total equity |
|
$ |
2,444.1 |
|
|
|
|
|
|
$ |
2,436.7 |
|
|
|
|
|
|
$ |
7.4 |
|
|
|
|
|
|
|
|
|
|
|
|
|
|
|
|
|
|
|
|
|
|
|
|
|
|
|
See accompanying notes to consolidated financial statements beginning on page 58.
56
Armstrong World Industries, Inc., and Subsidiaries
Consolidated Statements of Cash Flows
(amounts in millions)
| |
|
|
|
|
|
|
|
|
|
|
|
|
| |
|
Year Ended December 31, |
|
| |
|
2009 |
|
|
2008 |
|
|
2007 |
|
Cash flows from operating activities: |
|
|
|
|
|
|
|
|
|
|
|
|
Net earnings |
|
$ |
77.7 |
|
|
$ |
81.0 |
|
|
$ |
145.3 |
|
Adjustments to reconcile net earnings to net cash provided by operating activities: |
|
|
|
|
|
|
|
|
|
|
|
|
Depreciation and amortization |
|
|
146.8 |
|
|
|
149.8 |
|
|
|
137.8 |
|
Asset impairments |
|
|
21.0 |
|
|
|
28.3 |
|
|
|
— |
|
Deferred income taxes |
|
|
135.6 |
|
|
|
74.0 |
|
|
|
79.6 |
|
Stock-based compensation |
|
|
38.2 |
|
|
|
7.5 |
|
|
|
12.7 |
|
Equity earnings from joint ventures, net |
|
|
(40.0 |
) |
|
|
(56.0 |
) |
|
|
(46.0 |
) |
Distributions from equity affiliates |
|
|
— |
|
|
|
61.0 |
|
|
|
117.5 |
|
U.S. pension credit |
|
|
(58.2 |
) |
|
|
(63.0 |
) |
|
|
(59.4 |
) |
Insurance proceeds — environmental recovery |
|
|
— |
|
|
|
10.0 |
|
|
|
— |
|
Changes in operating assets and liabilities: |
|
|
|
|
|
|
|
|
|
|
|
|
Receivables |
|
|
23.9 |
|
|
|
42.8 |
|
|
|
29.4 |
|
Inventories |
|
|
105.9 |
|
|
|
(16.1 |
) |
|
|
(12.7 |
) |
Other current assets |
|
|
7.0 |
|
|
|
(7.2 |
) |
|
|
(7.5 |
) |
Other noncurrent assets |
|
|
2.1 |
|
|
|
(2.6 |
) |
|
|
1.2 |
|
Accounts payable and accrued expenses |
|
|
(36.9 |
) |
|
|
(88.2 |
) |
|
|
0.9 |
|
Income taxes payable |
|
|
(147.0 |
) |
|
|
9.7 |
|
|
|
208.6 |
|
Other long-term liabilities |
|
|
(18.6 |
) |
|
|
(10.2 |
) |
|
|
(16.6 |
) |
Cash distributed under the POR |
|
|
— |
|
|
|
(3.1 |
) |
|
|
(14.5 |
) |
Other, net |
|
|
2.7 |
|
|
|
(3.5 |
) |
|
|
(1.1 |
) |
|
|
|
|
|
|
|
|
|
|
Net cash provided by operating activities |
|
|
260.2 |
|
|
|
214.2 |
|
|
|
575.2 |
|
|
|
|
|
|
|
|
|
|
|
|
|
|
|
|
|
|
|
|
|
|
|
|
Cash flows from investing activities: |
|
|
|
|
|
|
|
|
|
|
|
|
Purchases of property, plant and equipment and computer software |
|
|
(105.1 |
) |
|
|
(95.0 |
) |
|
|
(102.6 |
) |
Divestitures (acquisitions) |
|
|
8.0 |
|
|
|
(0.8 |
) |
|
|
58.8 |
|
Return of investment from equity affiliate |
|
|
53.5 |
|
|
|
19.5 |
|
|
|
— |
|
Acquisition of equity affiliate |
|
|
— |
|
|
|
— |
|
|
|
(5.2 |
) |
Proceeds from insurance |
|
|
1.3 |
|
|
|
— |
|
|
|
6.7 |
|
Proceeds from the sale of assets |
|
|
1.3 |
|
|
|
0.6 |
|
|
|
5.6 |
|
|
|
|
|
|
|
|
|
|
|
Net cash (used for) investing activities |
|
|
(41.0 |
) |
|
|
(75.7 |
) |
|
|
(36.7 |
) |
|
|
|
|
|
|
|
|
|
|
|
|
|
|
|
|
|
|
|
|
|
|
|
Cash flows from financing activities: |
|
|
|
|
|
|
|
|
|
|
|
|
(Decrease) in short-term debt, net |
|
|
(1.2 |
) |
|
|
(2.5 |
) |
|
|
— |
|
Issuance of long-term debt |
|
|
2.4 |
|
|
|
5.4 |
|
|
|
5.0 |
|
Payments of long-term debt |
|
|
(25.6 |
) |
|
|
(20.9 |
) |
|
|
(309.2 |
) |
Special dividend paid |
|
|
(1.3 |
) |
|
|
(256.4 |
) |
|
|
— |
|
Proceeds from exercise of stock options |
|
|
2.3 |
|
|
|
— |
|
|
|
— |
|
Advance payment for non-controlling interest |
|
|
(3.3 |
) |
|
|
— |
|
|
|
— |
|
Other, net |
|
|
— |
|
|
|
(2.6 |
) |
|
|
(1.2 |
) |
|
|
|
|
|
|
|
|
|
|
Net cash (used for) financing activities |
|
|
(26.7 |
) |
|
|
(277.0 |
) |
|
|
(305.4 |
) |
|
|
|
|
|
|
|
|
|
|
|
|
|
|
|
|
|
|
|
|
|
|
|
Effect of exchange rate changes on cash and cash equivalents |
|
|
22.0 |
|
|
|
(20.8 |
) |
|
|
17.4 |
|
|
|
|
|
|
|
|
|
|
|
Net increase (decrease) in cash and cash equivalents |
|
$ |
214.5 |
|
|
$ |
(159.3 |
) |
|
$ |
250.5 |
|
Cash and cash equivalents at beginning of period |
|
$ |
355.0 |
|
|
$ |
514.3 |
|
|
$ |
263.8 |
|
|
|
|
|
|
|
|
|
|
|
Cash and cash equivalents at end of period |
|
$ |
569.5 |
|
|
$ |
355.0 |
|
|
$ |
514.3 |
|
|
|
|
|
|
|
|
|
|
|
See accompanying notes to consolidated financial statements beginning on page 58.
57
Armstrong World Industries, Inc., and Subsidiaries
Notes to Consolidated Financial Statements
(dollar amounts in millions)
NOTE 1. BUSINESS AND CHAPTER 11 REORGANIZATION
Armstrong World Industries, Inc. (“AWI”) is a Pennsylvania corporation incorporated in 1891. When
we refer to “we”, “our” and “us” in this report, we are referring to AWI and its subsidiaries.
References in this report to “reorganized Armstrong” are to AWI as it was reorganized under the
plan of reorganization (“POR”) on October 2, 2006, and its subsidiaries collectively. We use the
term “AWI” when we are referring solely to Armstrong World Industries, Inc.
In December 2000, AWI filed a voluntary petition for relief (“the Filing”) under Chapter 11 of the
U.S. Bankruptcy Code (“the Bankruptcy Code”) in the United States Bankruptcy Court for the District
of Delaware (“the Bankruptcy Court”) in order to use the court-supervised reorganization process to
achieve a resolution of AWI’s asbestos-related liability. Also filing under Chapter 11 were two of
AWI’s wholly-owned subsidiaries, Nitram Liquidators, Inc. (“Nitram”) and Desseaux Corporation of
North America, Inc. (“Desseaux”).
On October 2, 2006, AWI’s POR became effective, and AWI emerged from Chapter 11. The POR excluded
AWI’s Nitram and Desseaux subsidiaries which pursued separate resolutions of their Chapter 11 cases
(as indicated below).
Resolution of Disputed Claims
All claims in AWI’s Chapter 11 case have been resolved and closed. In February 2008 AWI made a
final distribution to general unsecured creditors of AWI under the POR. Distributions were not
made for creditors who did not provide required information to AWI. Accordingly, AWI recognized a
gain of $0.7 million in the fourth quarter of 2008, which was classified within selling, general
and administrative (“SG&A”) expenses. The Bankruptcy Court closed AWI’s Chapter 11 case on
September 2, 2008. No further distributions will be made.
Asbestos PI Trust
On October 2, 2006, the Armstrong World Industries, Inc. Asbestos Personal Injury Settlement Trust
(“Asbestos PI Trust”) was created to address AWI’s personal injury (including wrongful death)
asbestos-related liability. All present and future asbestos-related personal injury claims against
AWI, including contribution claims of co-defendants, arising directly or indirectly out of AWI’s
pre-Filing use of, or other activities involving, asbestos are channeled to the Asbestos PI Trust.
Resolution of Nitram and Desseaux Cases
In December 2007, the Joint Amended Plan of Liquidation (the “Joint Plan”) for Nitram and Desseaux
became effective. Armstrong and its subsidiaries subordinated their claims to those of other
unsecured creditors under the Joint Plan and received no distribution from the bankruptcy estate in
this case. As a result of the Joint Plan becoming effective on December 28, 2007, we recorded a
$1.3 million gain from the discharge of liabilities subject to compromise in 2007. The gain was
recorded as a Chapter 11 Reorganization activity. Nitram and Desseaux were dissolved in 2008.
Accounting Impact
Accounting Standards Codification (“ASC”) 852 “Restructuring” (previously AICPA Statement of
Position 90-7, “Financial Reporting by Entities in Reorganization under the Bankruptcy Code”)
provides financial reporting guidance for entities that are reorganizing under the Bankruptcy Code.
This fresh start reporting guidance was implemented in the accompanying consolidated financial
statements.
ASC 852 requires separate reporting of all revenues, expenses, realized gains and losses, and
provision for losses related to the Filing as Chapter 11 reorganization costs, net. Accordingly,
we recorded a total of $0.7 million of income for Chapter 11 reorganization activities during 2007.
There was no Chapter 11 income or expense recorded in 2008 or 2009.
58
Armstrong World Industries, Inc., and Subsidiaries
Notes to Consolidated Financial Statements
(dollar amounts in millions)
For Chapter 11 related post-emergence activities AWI recorded $1.4 million and $2.0 million of
income for 2009 and 2008 respectively. These amounts included reversals of certain environmental
and other accruals set-up during settlement accounting and the recording of undistributed cash
partially off-set by professional fees. We incurred $7.1 million of professional fee expenses
during 2007. Pursuant to ASC 852, these expenses were reported as SG&A expenses.
Share Ownership
In August 2009 Armor TPG Holdings LLC (“TPG”) and the Asbestos PI Trust entered into agreements
whereby TPG purchased 7,000,000 shares of AWI common stock from the Asbestos PI Trust, and acquired
an economic interest in an additional 1,039,777 shares from the Asbestos PI Trust. The Asbestos PI
Trust and TPG together hold more than 60% of AWI’s outstanding shares and have entered into a
shareholders’ agreement pursuant to which the Asbestos PI Trust and TPG have agreed to vote their
shares together on certain matters.
NOTE 2. SUMMARY OF SIGNIFICANT ACCOUNTING POLICIES
Consolidation Policy. The consolidated financial statements and accompanying data in this
report include the accounts of AWI and its majority-owned subsidiaries. All significant
intercompany transactions have been eliminated from the consolidated financial statements.
Use of Estimates. These financial statements are prepared in accordance with U.S. generally
accepted accounting principles. The statements include management estimates and judgments, where
appropriate. Management utilizes estimates to record many items including asset values, allowances
for bad debts, inventory obsolescence and lower of cost or market charges, warranty, workers’
compensation, general liability and environmental claims and income taxes. When preparing an
estimate, management determines the amount based upon the consideration of relevant information.
Management may confer with outside parties, including outside counsel. Actual results may differ
from these estimates.
Reclassifications. Certain amounts in the prior year’s Consolidated Financial Statements
and related notes thereto have been recast to conform to the 2009 presentation.
Revenue Recognition. We recognize revenue from the sale of products when persuasive
evidence of an arrangement exists, title and risk of loss transfers to the customers, prices are
fixed and determinable, and it is reasonably assured the related accounts receivable is
collectible. Our sales terms primarily are FOB shipping point. We have some sales terms that are
FOB destination. Our products are sold with normal and customary return provisions. Sales
discounts are deducted immediately from the sales invoice. Provisions, which are recorded as a
reduction of revenue, are made for the estimated cost of rebates, promotional programs and
warranties. We defer recognizing revenue if special sales agreements, established at the time of
sale, warrant this treatment.
Sales Incentives. Sales incentives are reflected as a reduction of net sales.
Shipping and Handling Costs. Shipping and handling costs are reflected in cost of goods
sold.
Advertising Costs. We recognize advertising expenses as they are incurred.
Research and Development Costs. We recognize research and development costs as they are
incurred.
Pension and Postretirement Benefits. We have benefit plans that provide for pension,
medical and life insurance benefits to certain eligible employees when they retire from active
service. Generally, for plans that maintain plan assets, our practice is to fund the actuarially
determined current service costs and the amounts necessary to amortize prior service obligations
for the pension benefits over periods ranging up to 30 years, but not in excess of the funding
limitations.
59
Armstrong World Industries, Inc., and Subsidiaries
Notes to Consolidated Financial Statements
(dollar amounts in millions)
Taxes. The provision for income taxes has been determined using the asset and liability
approach of accounting for income taxes to reflect the expected future tax consequences of events
recognized in the financial statements. Deferred income tax assets and liabilities are recognized
by applying enacted tax rates to temporary differences that exist as of the balance sheet date
which result from differences in the timing of reported taxable income between tax and financial
reporting.
Taxes collected from customers and remitted to governmental authorities are reported on a net
basis.
Earnings per Common Share. Basic earnings per share is computed by dividing the earnings by
the weighted average number of shares of common stock outstanding during the period. Diluted
earnings per common share reflects the potential dilution of securities that could share in the
earnings.
Cash and Cash Equivalents. Cash and cash equivalents include cash on hand and short-term
investments that have maturities of three months or less when purchased.
Concentration of Credit. We principally sell products to customers in the building products
industries in various geographic regions. No one customer accounted for 10% or more of our total
consolidated net sales in the years 2009, 2008, and 2007.
There are no significant concentrations of credit risk other than with The Home Depot, Inc. and
Lowe’s Companies, Inc. who together represented approximately 24% and 20% of our net trade
receivables as of December 31, 2009 and 2008, respectively. We monitor the creditworthiness of our
customers and generally do not require collateral.
Receivables. We sell the vast majority of our products to select, pre-approved customers
using customary trade terms that allow for payment in the future. Customer trade receivables,
customer notes receivable and miscellaneous receivables (which include supply related rebates and
claims to be received, unpaid insurance claims from litigation and other), net of allowances for
doubtful accounts, customer credits and warranties are reported in accounts and notes receivable,
net. Notes receivable from divesting certain businesses are included in other current assets and
other non-current assets based upon the payment terms. Cash flows from the collection of
receivables are classified as operating cash flows on the consolidated statements of cash flows.
We establish credit worthiness prior to extending credit. We estimate the recoverability of
current and non-current receivables each period. This estimate is based upon triggering events and
new information in the period, which can include the review of any available financial statements
and forecasts, as well as discussions with legal counsel and the management of the debtor company.
As events occur which impact the collectability of the receivable, all or a portion of the
receivable is reserved. Account balances are charged off against the allowance when the potential
for recovery is considered remote. We do not have any off-balance-sheet credit exposure related to
our customers.
Inventories. Inventories are valued at the lower of cost or market. Inventories also
include certain samples used in ongoing sales and marketing activities. Cash flows from the sale
of inventory and the related cash receipts are classified as operating cash flows on the
Consolidated Statements of Cash Flows. See Note 7 for further information on our accounting for
inventories.
Property and Depreciation. Property, plant and equipment in place as of September 30, 2006
was set equal to fair value as of our emergence date and are currently stated at that value less
impairment charges and accumulated depreciation and amortization. Property, plant and equipment
acquired after our emergence date is stated at acquisition cost less impairment charges and
accumulated depreciation and amortization. Upon emergence from Chapter 11 in 2006, certain
tangible assets were assigned shortened useful lives, and most of these assets were fully
depreciated as of the fourth quarter of 2009.
Depreciation charges for financial reporting purposes are determined on a straight-line basis at
rates calculated to provide for the full depreciation of assets at the end of their useful lives.
Machinery and
60
Armstrong World Industries, Inc., and Subsidiaries
Notes to Consolidated Financial Statements
(dollar amounts in millions)
equipment includes manufacturing equipment (depreciated over 3 to 15 years), computer
equipment (3 to 5 years) and office furniture and equipment (5 to 7 years). Within manufacturing
equipment, assets that are subject to quick obsolescence or wear out quickly, such as tooling and
engraving equipment, are depreciated over shorter periods (3 to 7 years). Heavy production
equipment, such as conveyors and production presses, are depreciated over longer periods (15
years). Buildings are depreciated over 15 to 30 years, depending on factors such as type of
construction and use. Certain buildings existing at our emergence date are depreciated over
shorter periods. Computer software is depreciated over 3 to 7 years.
Property, plant and equipment are tested for impairment when indicators of impairment are present,
such as operating losses and/or negative cash flows. If an indication of impairment exists, we
compare the carrying amount of the asset group to the estimated undiscounted future cash flows
expected to be generated by the assets. The estimate of an asset group’s fair value is based on
discounted future cash flows expected to be generated by the asset group, or based on management’s
estimated exit price assuming the assets could be sold in an orderly transaction between market
participants, or estimated salvage value if no sale is assumed. If the fair value is less than the
carrying value of the asset group, we record an impairment charge equal to the difference between
the fair value and carrying value of the asset group. Impairments of assets related to our
manufacturing operations are recorded in cost of goods sold. When assets are disposed of or
retired, their costs and related depreciation are removed from the financial statements and any
resulting gains or losses normally are reflected in cost of goods sold or SG&A expenses.
Plant and equipment held under capital leases are stated at the present value of the minimum lease
payments. Plant and equipment held under capital leases and leasehold improvements are amortized
on a straight line basis over the life of the lease plus any specific option periods.
Asset Retirement Obligations. We recognize the fair value of obligations associated with
the retirement of tangible long-lived assets in the period in which they are incurred. Upon
initial recognition of a liability, the discounted cost is capitalized as part of the related
long-lived asset and depreciated over the corresponding asset’s useful life. Over time, accretion
of the liability is recognized as an operating expense to reflect the change in the liability’s
present value.
Intangible Assets. Effective with our emergence from Chapter 11 in 2006 and as part of
fresh-start reporting, goodwill was eliminated from our balance sheet and intangible assets were
revalued and identified. Intangible assets with determinable useful lives are amortized over their
respective estimated useful lives.
We periodically review significant definite-lived intangible assets for impairment when indicators
of impairment exist. We review our businesses for indicators of impairment such as operating
losses and/or negative cash flows. If an indication of impairment exists, we compare the carrying
amount of the asset group to the estimated undiscounted future cash flows expected to be generated
by the assets. The estimate of an asset group’s fair value is based on discounted future cash
flows expected to be generated by the asset group, or based on management’s estimated exit price
assuming the assets could be sold in an orderly transaction between market participants. If the
fair value is less than the carrying value of the asset group, we record an impairment charge equal
to the difference between the fair value and carrying value of the asset group.
Our indefinite-lived intangibles are primarily trademarks and brand names, which are integral to
our corporate identity and expected to contribute indefinitely to our corporate cash flows.
Accordingly, they have been assigned an indefinite life. We perform annual impairment tests during
the fourth quarter on these indefinite-lived intangibles. These assets undergo more frequent tests
if an indication of possible impairment exists.
The principal assumptions utilized in our impairment tests for definite-lived intangible assets
include operating profit adjusted for depreciation and amortization and discount rate. The
principal assumptions
61
Armstrong World Industries, Inc., and Subsidiaries
Notes to Consolidated Financial Statements
(dollar amounts in millions)
utilized in our impairment tests for indefinite-lived intangible assets
include revenue growth rate, discount rate and royalty rate. Revenue growth rate and operating
profit assumptions are consistent with those utilized in our operating plan and strategic planning
process. The discount rate assumption is calculated based upon an estimated weighted average cost
of equity which reflects the overall level of inherent risk and the rate of return a market
participant would expect to achieve. Methodologies used for valuing our intangible assets did not
change from prior periods.
See Note 11 for disclosure on intangible assets.
Foreign Currency Transactions. Assets and liabilities of our subsidiaries operating
outside the United States which account in a functional currency other than U.S. dollars are
translated using the period end exchange rate. Revenues and expenses are translated at exchange
rates effective during each month. Foreign currency translation gains or losses are included as a
component of accumulated other comprehensive (loss) within shareholders’ equity. Gains or losses
on foreign currency transactions are recognized through the statement of earnings.
Financial Instruments and Derivatives. From time to time, we use derivatives and other
financial instruments to offset the effect of currency, interest rate and commodity price
variability. See Notes 18 and 19 for further discussion.
Stock-based Employee Compensation. For awards with only service and performance conditions
that have a graded vesting schedule, we recognize compensation expense on a straight-line basis
over the vesting period for the entire award. See Note 23 for additional information on
stock-based employee compensation.
Recently Adopted Accounting Standards
We adopted no new accounting standards in 2007. In 2008 we adopted new guidance, which is now part
of ASC 715, “Compensation — Retirement Benefits” (previously Financial Accounting Standards Board
(“FASB”) Emerging Issues Task Force Issue No 06-10 “Accounting for Collateral Assignment
Split-Dollar Life Insurance Agreements”).
In September 2006 the FASB issued new guidance on fair value. The new guidance, which is now part
of ASC 820, “Fair Value Measurements and Disclosures” establishes a framework for measuring fair
value in generally accepted accounting principles and expands disclosures about fair value
measurements. ASC 820 was effective for fiscal years beginning after November 15, 2007. However
the effective date for certain non-financial assets and liabilities was deferred to fiscal years
beginning after November 15, 2008. There was no material impact from our initial adoption of the
provisions of the guidance in 2008, nor was there a material impact from our adoption of the
remaining portions of ASC 820 on January 1, 2009.
During 2009 we adopted new guidance, which is now part of ASC 805 “Business Combinations”, which
retains the underlying concept that all business combinations be accounted for at fair value. This
new guidance changes the methodology of applying this concept in that acquisition costs will
generally be expensed as incurred, non-controlling interests will be valued at fair value,
in-process research and development will be recorded at fair value as an indefinite-lived
intangible, restructuring costs associated with a business combination will generally be expensed
subsequent to the acquisition and changes in deferred income tax asset allowances after the
acquisition date generally will affect income tax expense. This pronouncement applies prospectively
to all business combinations whose acquisition dates are on or after the beginning of the first
annual period subsequent to December 15, 2008. Additionally, certain future adjustments to
deferred income tax valuation allowances and uncertain tax positions recognized upon our emergence
from bankruptcy will impact future earnings.
62
Armstrong World Industries, Inc., and Subsidiaries
Notes to Consolidated Financial Statements
(dollar amounts in millions)
During 2009 we adopted new guidance, which is now part of ASC 810, “Consolidation” which requires
the recognition of a non-controlling interest (formerly known as a “minority interest”) as equity
in the consolidated financial statements and separate from the parent’s equity. The amount of net
income attributable to the non-controlling interest is immaterial for the year ended December 31,
2009, and, therefore, is included in consolidated net income on the face of the income statement.
As a result of the adoption of this pronouncement on January 1, 2009, we recast our December 31,
2008 balance sheet to move $8.1 million from minority interest ($7.0 million within Liabilities)
and other comprehensive income ($1.1 million within Equity) to non-controlling interest (within
Equity). Also, we recast our December 31, 2007 balance sheet to move $7.4 million from minority
interest ($6.9 million within Liabilities) and other comprehensive income ($0.5 million within
Equity) to non-controlling interest (within Equity).
During 2009 we adopted new guidance, which is now part of ASC 323, “Investments-Equity Method and
Joint Ventures” which discusses the accounting for contingent consideration agreements of an equity
method investment and the requirement for the investor to recognize its share of any impairment
charges recorded by the investee. ASC 323 requires the investor to record share issuances by the
investee as if it has sold a portion of its investment with any resulting gain or loss being
reflected in earnings. There was no material impact from our adoption of ASC 323 on January 1,
2009.
During 2009 we adopted new guidance, which is now part of ASC 815, “Derivatives and Hedging”. The
new guidance enhances the disclosure requirements for derivative instruments and hedging activities
to provide users of financial statements with a better understanding of the objectives of a
company’s derivative use and the risks managed. The changes to the disclosure requirements
surrounding derivatives and hedging activities have been incorporated into the footnotes to the
financial statements. See Note 19 for our disclosures related to hedging activities.
Effective January 1, 2009 we adopted new guidance, which is now part of ASC 260, “Earnings Per
Share”. Under ASC 260, share-based payment awards (whether vested or unvested) that contain
nonforfeitable rights to dividends or dividend equivalents, whether paid or unpaid, are
participating securities and shall be included in the computation of earnings per share (“EPS”)
pursuant to the two-class method as described in ASC 260. All prior-period EPS data presented has
been adjusted retrospectively to conform to the provisions of ASC 260.
Effective January 1, 2009 we adopted new guidance, which is now part of ASC 715, “Compensation —
Retirement Benefits” which requires additional disclosures about plan assets in an employer’s
defined benefit pension or other postretirement plan. The objectives of the disclosures are to
provide users of financial statements with an understanding of the major categories of plan assets,
fair value measurements for plan assets, how investment decisions are made, and concentrations of
risk within the plan assets. See Note 17 for our disclosures related to retirement plan assets.
In May 2009 and February 2010, the FASB issued new guidance, which is now part of ASC 855, “Subsequent Events”. ASC
855 requires management to evaluate subsequent events through the date the financial statements
were issued or the date the financial statements were available to be issued. We have evaluated
subsequent events through the issuance of the Form 10-K.
In June 2009 the FASB issued new guidance, which is now part of ASC 105, “Generally Accepted
Accounting Principles”. ASC 105 has become the source of authoritative U.S. GAAP recognized by the
FASB to be applied by nongovernment entities. It also modifies the GAAP hierarchy to include only
two levels of GAAP; authoritative and non-authoritative. ASC 105 was effective for financial
statements issued for interim and annual periods ending after September 15, 2009. We adopted ASC
105 for the reporting of our 2009 third quarter results. The adoption had no impact on the
reporting of our financial position, results of operations, or cash flows.
63
Armstrong World Industries, Inc., and Subsidiaries
Notes to Consolidated Financial Statements
(dollar amounts in millions)
Recently Issued Accounting Standards
In June 2009 the FASB issued new guidance, which is now part of ASC 810, “Consolidations”, which
amends the consolidation guidance applicable to variable interest entities. These provisions of
ASC 810 are effective as of the beginning of the first fiscal year that begins after November 15,
2009. We do not expect a material impact on our financial statements from the adoption of this
guidance.
In January 2010 the FASB issued new guidance, which is now part of ASC 810, “Consolidations”. The
revised scope of the decrease-in-ownership provisions clarifies that transfers of a subsidiary that
constitute a business or nonprofit activity to an equity-method investee or joint venture and
transfers of groups of assets that constitute a business or nonprofit activity in exchange for a
noncontrolling interest in an entity, including an equity-method investee or joint venture, are
within the scope of ASC 810 rather than being within the scope of guidance applicable to
equity-method investees and joint ventures or nonmonetary exchanges. These provisions of ASC 810
are effective upon issuance. There was no material impact on our financial statements from the
adoption of this guidance in January 2010.
In January 2010 the FASB issued new guidance, which is now part of ASC 820, “Fair Value
Measurements and Disclosures”. The new guidance requires disclosures of the amounts of assets and
liabilities transferred into and out of Levels 1 and 2, along with a description of the reasons for
the transfers. The new guidance also requires additional disclosures related to activity presented
for Level 3 measurements. These provisions of ASC 820 are effective for interim and annual
reporting periods beginning after December 15, 2009, except for the additional disclosures related
to activities for Level 3 measurements which are required for fiscal years beginning after December
15, 2010 and interim periods within those years. We do not expect any impact on our financial
statements from the adoption of this guidance.
64
Armstrong World Industries, Inc., and Subsidiaries
Notes to Consolidated Financial Statements
(dollar amounts in millions)
NOTE 3. NATURE OF OPERATIONS
Resilient Flooring — produces and sources a broad range of floor coverings primarily for homes and
commercial and institutional buildings. Manufactured products in this segment include vinyl sheet,
vinyl tile and linoleum flooring. In addition, our Resilient Flooring segment sources and sells
laminate flooring products, ceramic tile products, adhesives, installation and maintenance
materials and accessories. Resilient Flooring products are offered in a wide variety of types,
designs, and colors. We sell these products worldwide to wholesalers, large home centers,
retailers, contractors and to the manufactured homes industry.
Wood Flooring — produces and sources wood flooring products for use in new residential
construction and renovation, with some commercial applications in stores, restaurants and high-end
offices. The product offering includes pre-finished solid and engineered wood floors in various
wood species, and related accessories. Virtually all of our Wood Flooring sales are in North
America. Our Wood Flooring products are generally sold to independent wholesale flooring
distributors and large home centers. Our products are principally sold under the brand names
Bruce®, Hartco®, Robbins®, Timberland®, Armstrong®, HomerWood® and
Capella®.
Building Products — produces suspended mineral fiber, soft fiber and metal ceiling systems for use
in commercial, institutional, and residential settings. In addition, our Building Products segment
sources complementary ceiling products. Our products, which are sold worldwide, are available in
numerous colors, performance characteristics and designs, and offer attributes such as acoustical
control, rated fire protection and aesthetic appeal. Commercial ceiling materials and accessories
are sold to ceiling systems contractors and to resale distributors. Residential ceiling products
are sold in North America primarily to wholesalers and retailers (including large home centers).
Suspension system (grid) products manufactured by Worthington Armstrong Venture (“WAVE”) are sold
by both Armstrong and our WAVE joint venture.
Cabinets — produces kitchen and bathroom cabinetry and related products, which are used primarily
in the U.S. residential new construction and renovation markets. Through our system of
Company-owned and independent distribution centers and through direct sales to builders, our
Cabinets segment provides design, fabrication and installation services to single and multi-family
homebuilders, remodelers and consumers under the Armstrong® brand name. All of Cabinets’ sales are
in the U.S.
Unallocated Corporate — includes assets, liabilities, income and expenses that have not been
allocated to the business units. Balance sheet items classified as Unallocated Corporate are
primarily income tax related accounts, cash and cash equivalents, the Armstrong brand name and the
U.S. prepaid pension cost/liability and long-term debt. Expenses for our corporate departments and
certain benefit plans are allocated to the reportable segments based on known metrics, such as
specific activity, time reporting, headcount, square-footage or net sales. The remaining items,
which cannot be attributed to the reportable segments without a high degree of generalization, are
reported in Unallocated Corporate.
65
Armstrong World Industries, Inc., and Subsidiaries
Notes to Consolidated Financial Statements
(dollar amounts in millions)
| |
|
|
|
|
|
|
|
|
|
|
|
|
|
|
|
|
|
|
|
|
|
|
|
|
| |
|
Resilient |
|
|
Wood |
|
|
Building |
|
|
|
|
|
|
Unallocated |
|
|
|
|
| For the year ended 2009 |
|
Flooring |
|
|
Flooring |
|
|
Products |
|
|
Cabinets |
|
|
Corporate |
|
|
Total |
|
Net sales to external customers |
|
$ |
1,031.7 |
|
|
$ |
510.4 |
|
|
$ |
1,087.7 |
|
|
$ |
150.2 |
|
|
|
— |
|
|
$ |
2,780.0 |
|
Equity (earnings) from joint ventures |
|
|
— |
|
|
|
— |
|
|
|
(40.0 |
) |
|
|
— |
|
|
|
— |
|
|
|
(40.0 |
) |
Segment operating income (loss)(1) |
|
|
0.1 |
|
|
|
(5.9 |
) |
|
|
155.9 |
|
|
|
(18.3 |
) |
|
|
(41.2 |
) |
|
|
90.6 |
|
Segment assets |
|
|
645.2 |
|
|
|
410.3 |
|
|
|
966.0 |
|
|
|
53.2 |
|
|
|
1,227.9 |
|
|
|
3,302.6 |
|
Depreciation and amortization |
|
|
45.2 |
|
|
|
14.9 |
|
|
|
61.5 |
|
|
|
7.2 |
|
|
|
18.0 |
|
|
|
146.8 |
|
Asset impairments |
|
|
3.0 |
|
|
|
18.0 |
|
|
|
— |
|
|
|
— |
|
|
|
— |
|
|
|
21.0 |
|
Investment in joint ventures |
|
|
0.1 |
|
|
|
— |
|
|
|
194.5 |
|
|
|
— |
|
|
|
— |
|
|
|
194.6 |
|
Capital additions |
|
|
50.5 |
|
|
|
10.3 |
|
|
|
31.8 |
|
|
|
2.5 |
|
|
|
10.0 |
|
|
|
105.1 |
|
| |
|
|
|
|
|
|
|
|
|
|
|
|
|
|
|
|
|
|
|
|
|
|
|
|
| |
|
Resilient |
|
|
Wood |
|
|
Building |
|
|
|
|
|
|
Unallocated |
|
|
|
|
| For the year ended 2008 |
|
Flooring |
|
|
Flooring |
|
|
Products |
|
|
Cabinets |
|
|
Corporate |
|
|
Total |
|
Net sales to external customers |
|
$ |
1,220.1 |
|
|
$ |
624.6 |
|
|
$ |
1,369.1 |
|
|
$ |
179.2 |
|
|
|
— |
|
|
$ |
3,393.0 |
|
Equity (earnings) from joint ventures |
|
|
— |
|
|
|
— |
|
|
|
(56.0 |
) |
|
|
— |
|
|
|
— |
|
|
|
(56.0 |
) |
Segment operating (loss) income(1) |
|
|
(16.8 |
) |
|
|
(2.4 |
) |
|
|
239.7 |
|
|
|
(6.7 |
) |
|
|
(2.9 |
) |
|
|
210.9 |
|
Restructuring charges, net of reversals |
|
|
— |
|
|
|
— |
|
|
|
— |
|
|
|
— |
|
|
|
0.8 |
|
|
|
0.8 |
|
Segment assets |
|
|
670.2 |
|
|
|
470.9 |
|
|
|
1,049.6 |
|
|
|
71.2 |
|
|
|
1,089.9 |
|
|
|
3,351.8 |
|
Depreciation and amortization |
|
|
49.8 |
|
|
|
12.6 |
|
|
|
64.8 |
|
|
|
2.4 |
|
|
|
20.2 |
|
|
|
149.8 |
|
Asset impairments |
|
|
2.9 |
|
|
|
25.4 |
|
|
|
— |
|
|
|
— |
|
|
|
— |
|
|
|
28.3 |
|
Investment in joint ventures |
|
|
0.1 |
|
|
|
— |
|
|
|
208.1 |
|
|
|
— |
|
|
|
— |
|
|
|
208.2 |
|
Capital additions |
|
|
26.4 |
|
|
|
11.8 |
|
|
|
41.1 |
|
|
|
3.7 |
|
|
|
12.0 |
|
|
|
95.0 |
|
| |
|
|
|
|
|
|
|
|
|
|
|
|
|
|
|
|
|
|
|
|
|
|
|
|
| |
|
Resilient |
|
|
Wood |
|
|
Building |
|
|
|
|
|
|
Unallocated |
|
|
|
|
| For the year ended 2007 |
|
Flooring |
|
|
Flooring |
|
|
Products |
|
|
Cabinets |
|
|
Corporate |
|
|
Total |
|
Net sales to external customers |
|
$ |
1,230.8 |
|
|
$ |
791.6 |
|
|
$ |
1,292.1 |
|
|
$ |
235.2 |
|
|
|
— |
|
|
$ |
3,549.7 |
|
Equity loss (earnings) from joint ventures |
|
|
— |
|
|
|
0.6 |
|
|
|
(46.6 |
) |
|
|
— |
|
|
|
— |
|
|
|
(46.0 |
) |
Segment operating income (loss)(1) |
|
|
40.4 |
|
|
|
64.3 |
|
|
|
221.4 |
|
|
|
10.5 |
|
|
|
(39.9 |
) |
|
|
296.7 |
|
Restructuring charges, net of reversals |
|
|
— |
|
|
|
— |
|
|
|
0.2 |
|
|
|
— |
|
|
|
— |
|
|
|
0.2 |
|
Segment assets |
|
|
734.8 |
|
|
|
509.7 |
|
|
|
1,129.2 |
|
|
|
82.5 |
|
|
|
2,183.2 |
|
|
|
4,639.4 |
|
Depreciation and amortization |
|
|
44.0 |
|
|
|
10.9 |
|
|
|
59.3 |
|
|
|
2.6 |
|
|
|
21.0 |
|
|
|
137.8 |
|
Investment in joint ventures |
|
|
0.1 |
|
|
|
— |
|
|
|
232.5 |
|
|
|
— |
|
|
|
— |
|
|
|
232.6 |
|
Capital additions |
|
|
29.9 |
|
|
|
17.8 |
|
|
|
37.7 |
|
|
|
4.4 |
|
|
|
11.8 |
|
|
|
101.6 |
|
The table above excludes amounts related to discontinued operations.
| |
|
|
| (1) |
|
Segment operating income (loss) is the measure of segment profit or loss
reviewed by the chief operating decision maker. The sum of the segments’ operating income (loss)
equals the total consolidated operating income as reported on our income statement. The following
reconciles our total consolidated operating income to earnings from continuing operations before
income taxes. These items are only measured and managed on a consolidated basis: |
| |
|
|
|
|
|
|
|
|
|
|
|
|
| |
|
2009 |
|
|
2008 |
|
|
2007 |
|
Segment operating income |
|
$ |
90.6 |
|
|
$ |
210.9 |
|
|
$ |
296.7 |
|
Interest expense |
|
|
17.7 |
|
|
|
30.8 |
|
|
|
55.0 |
|
Other non-operating expense |
|
|
0.9 |
|
|
|
1.3 |
|
|
|
1.4 |
|
Other non-operating (income) |
|
|
(3.2 |
) |
|
|
(10.6 |
) |
|
|
(18.2 |
) |
Chapter 11 reorganization (income), net |
|
|
— |
|
|
|
— |
|
|
|
(0.7 |
) |
|
|
|
|
|
|
|
|
|
|
Earnings from continuing operations
before income taxes |
|
$ |
75.2 |
|
|
$ |
189.4 |
|
|
$ |
259.2 |
|
|
|
|
|
|
|
|
|
|
|
Accounting policies of the segments are the same as those described in the summary of
significant accounting policies.
66
Armstrong World Industries, Inc., and Subsidiaries
Notes to Consolidated Financial Statements
(dollar amounts in millions)
The sales in the table below are allocated to geographic areas based upon the location of the
customer.
| |
|
|
|
|
|
|
|
|
|
|
|
|
| Geographic Areas Net trade sales |
|
2009 |
|
|
2008 |
|
|
2007 |
|
Americas: |
|
|
|
|
|
|
|
|
|
|
|
|
United States |
|
$ |
1,810.5 |
|
|
$ |
2,177.4 |
|
|
$ |
2,409.7 |
|
Canada |
|
|
152.0 |
|
|
|
166.0 |
|
|
|
167.1 |
|
Other Americas |
|
|
30.1 |
|
|
|
43.4 |
|
|
|
38.5 |
|
|
|
|
|
|
|
|
|
|
|
Total Americas |
|
$ |
1,992.6 |
|
|
$ |
2,386.8 |
|
|
$ |
2,615.3 |
|
|
|
|
|
|
|
|
|
|
|
|
|
|
|
|
|
|
|
|
|
|
|
|
Europe: |
|
|
|
|
|
|
|
|
|
|
|
|
Germany |
|
$ |
154.7 |
|
|
$ |
185.7 |
|
|
$ |
164.6 |
|
United Kingdom |
|
|
94.1 |
|
|
|
134.7 |
|
|
|
140.4 |
|
Other Europe |
|
|
347.3 |
|
|
|
464.1 |
|
|
|
422.2 |
|
|
|
|
|
|
|
|
|
|
|
Total Europe |
|
$ |
596.1 |
|
|
$ |
784.5 |
|
|
$ |
727.2 |
|
|
|
|
|
|
|
|
|
|
|
|
|
|
|
|
|
|
|
|
|
|
|
|
Total Pacific Rim |
|
$ |
191.3 |
|
|
$ |
221.7 |
|
|
$ |
207.2 |
|
|
|
|
|
|
|
|
|
|
|
|
|
|
|
|
|
|
|
|
|
|
|
|
Total net trade sales |
|
$ |
2,780.0 |
|
|
$ |
3,393.0 |
|
|
$ |
3,549.7 |
|
|
|
|
|
|
|
|
|
|
|
| |
|
|
|
|
|
|
|
|
| Property, plant and equipment, net at December 31 |
|
2009 |
|
|
2008 |
|
Americas: |
|
|
|
|
|
|
|
|
United States |
|
$ |
678.1 |
|
|
$ |
709.9 |
|
Other Americas |
|
|
14.1 |
|
|
|
14.7 |
|
|
|
|
|
|
|
|
Total Americas |
|
$ |
692.2 |
|
|
$ |
724.6 |
|
|
|
|
|
|
|
|
|
|
|
|
|
|
|
|
|
Europe: |
|
|
|
|
|
|
|
|
Germany |
|
$ |
123.1 |
|
|
$ |
112.0 |
|
Other Europe |
|
|
63.6 |
|
|
|
68.6 |
|
|
|
|
|
|
|
|
Total Europe |
|
$ |
186.7 |
|
|
$ |
180.6 |
|
|
|
|
|
|
|
|
|
|
|
|
|
|
|
|
|
Total Pacific Rim |
|
$ |
50.3 |
|
|
$ |
49.0 |
|
|
|
|
|
|
|
|
|
|
|
|
|
|
|
|
|
Total property, plant and equipment, net |
|
$ |
929.2 |
|
|
$ |
954.2 |
|
|
|
|
|
|
|
|
Impairment testing of our tangible assets occurs whenever events or changes in circumstances
indicate that the carrying amount of the assets may not be recoverable. The European Resilient
Flooring business had operating losses and negative cash flows during 2009. We have assumed
further short-term declines in this market in 2010 but anticipate future recovery starting in 2011.
During the fourth quarter of 2009, we recorded a $3.0 million impairment charge in cost of goods
sold for certain European Resilient Flooring tangible assets, primarily machinery and equipment.
The fair values were determined by management estimates of market prices and independent valuations
of the land and building assets based on observable market data. This data includes recent sales
and leases of comparable properties with similar characteristics within the same local real estate
market (considered Level 2 inputs in the fair value hierarchy as described in Note 17).
The Wood Flooring business recorded an operating loss of $5.9 million during 2009, primarily due to
an $18.0 million non-cash impairment charge. The Wood Flooring business had positive cash flows
for 2009. There were no indicators of impairment for the tangible assets of the Wood Flooring
business.
67
Armstrong World Industries, Inc., and Subsidiaries
Notes to Consolidated Financial Statements
(dollar amounts in millions)
The Cabinets business incurred operating losses in 2009 and 2008 but had positive cash flows in
both years. We concluded that an impairment indicator existed for the tangible assets during 2009.
However, the carrying amount of the tangible assets was determined to be recoverable as the
projected undiscounted cash flows exceeded the carrying value.
NOTE 4. ACQUISITIONS
As of December 31, 2009, we owned 80% of our Building Products Shanghai, China operations. During the fourth quarter of 2009, we made
deposits of $3.3 million to purchase the remaining 20% interest. During the first quarter of 2010, we
completed the acquisition of the remaining 20% interest.
In August 2007 we purchased the remaining 50% interest in Kunshan Holding Limited for $5.2 million,
at which time it became a wholly-owned subsidiary. The acquisition was accounted for under the
purchase method of accounting. In February 2008 we acquired the assets of Bowmans Australia Pty
Ltd. to complement our Australian Building Products business for total consideration of $0.8
million. The allocation of the purchase price to the fair value of tangible and identifiable
intangible assets acquired in each of these acquisitions has been completed.
NOTE 5. DISCONTINUED OPERATIONS
In May 2000 we completed the sale of all entities, assets and certain liabilities comprising our
Insulation Products segment. During the first quarter of 2008, we recorded a gain of $1.0 million
($0.6 million net of income tax) arising from the settlement of a legal dispute related to this
divestiture. These adjustments were classified as discontinued operations since the original
divestiture was reported as discontinued operations.
In March 2007 we entered into an agreement to sell Tapijtfabriek H. Desseaux N.V. and its
subsidiaries — the principal operating companies in our European Textile and Sports Flooring
business. These companies were first classified as discontinued operations at October 2, 2006 when
they met the required criteria. The sale transaction was completed in April 2007 and total
proceeds of $58.8 million were received during 2007. Certain post completion adjustments specified
in the agreement were disputed by the parties after the sale. The matter was referred to an
independent expert for a binding determination. In December 2008 a decision
was reached with all disputed items awarded in our favor. The disputed amount was recorded as a
receivable since April 2007 with the interest receivable recorded in December 2008 (included as
part of ‘Other current assets’). Full payment of $8.0 million was received in January 2009.
The purchaser filed an appeal to nullify the independent expert’s decision. An appeal hearing has been set
in May 2010. We expect to prevail in this matter.
Net sales, pre-tax loss and net loss from discontinued operations of Tapijtfabriek H. Desseaux N.V.
and its subsidiaries are as follows:
| |
|
|
|
|
| |
|
2007 |
|
Net sales |
|
$ |
59.8 |
|
|
|
|
|
|
|
|
|
|
Pre-tax loss from discontinued operations |
|
$ |
(1.4 |
) |
Loss on expected disposal of discontinued operations |
|
|
(5.8 |
) |
Income tax expense |
|
|
(0.3 |
) |
|
|
|
|
Net loss from discontinued operations |
|
$ |
(7.5 |
) |
|
|
|
|
There was no impact to earnings during 2009. In 2008, we incurred minor post completion expenses
which were offset by the interest accrual recorded in the fourth quarter of 2008.
68
Armstrong World Industries, Inc., and Subsidiaries
Notes to Consolidated Financial Statements
(dollar amounts in millions)
NOTE 6. ACCOUNTS AND NOTES RECEIVABLE
| |
|
|
|
|
|
|
|
|
| |
|
December 31, |
|
|
December 31, |
|
| |
|
2009 |
|
|
2008 |
|
Customer receivables |
|
$ |
269.3 |
|
|
$ |
287.1 |
|
Customer notes |
|
|
2.5 |
|
|
|
6.7 |
|
Miscellaneous receivables |
|
|
5.6 |
|
|
|
8.6 |
|
Less allowance for discounts and losses |
|
|
(48.3 |
) |
|
|
(54.5 |
) |
|
|
|
|
|
|
|
Net accounts and notes receivable |
|
$ |
229.1 |
|
|
$ |
247.9 |
|
|
|
|
|
|
|
|
The decrease in accounts and notes receivable is primarily due to lower sales in December 2009 than
in December 2008.
Generally, we sell our products to select, pre-approved customers whose businesses are affected by
changes in economic and market conditions. We consider these factors and the financial condition
of each customer when establishing our allowance for losses from doubtful accounts.
NOTE 7. INVENTORIES
| |
|
|
|
|
|
|
|
|
| |
|
December 31, |
|
|
December 31, |
|
| |
|
2009 |
|
|
2008 |
|
Finished goods |
|
$ |
281.0 |
|
|
$ |
371.2 |
|
Goods in process |
|
|
36.2 |
|
|
|
39.6 |
|
Raw materials and supplies |
|
|
134.4 |
|
|
|
152.7 |
|
Less LIFO and other reserves |
|
|
(6.6 |
) |
|
|
(19.5 |
) |
|
|
|
|
|
|
|
Total inventories, net |
|
$ |
445.0 |
|
|
$ |
544.0 |
|
|
|
|
|
|
|
|
Approximately 63% of our total inventory in both 2009 and 2008 was valued on a LIFO (last-in,
first-out) basis. Inventory values were lower than would have been reported on a total FIFO
(first-in, first-out) basis by $4.2 million and $8.9 million in 2009 and 2008, respectively.
The distinction between the use of different methods of inventory valuation is primarily based on
geographical locations and/or legal entities rather than types of inventory. The following table
summarizes the amount of inventory that is not accounted for under the LIFO method.
| |
|
|
|
|
|
|
|
|
| |
|
December 31, |
|
|
December 31, |
|
| |
|
2009 |
|
|
2008 |
|
International locations |
|
$ |
147.0 |
|
|
$ |
171.3 |
|
Cabinets |
|
|
13.7 |
|
|
|
22.3 |
|
Wood flooring |
|
|
0.6 |
|
|
|
1.3 |
|
Resilient flooring |
|
|
1.2 |
|
|
|
1.0 |
|
U.S. sourced products |
|
|
3.2 |
|
|
|
3.4 |
|
|
|
|
|
|
|
|
Total |
|
$ |
165.7 |
|
|
$ |
199.3 |
|
|
|
|
|
|
|
|
Substantially all of our international locations use the FIFO method of inventory valuation (or
other methods which closely approximate the FIFO method) primarily because either the LIFO method
is not permitted for local tax and/or statutory reporting purposes, or the entities were part of
various acquisitions that had adopted the FIFO method prior to our acquisition. In these
situations, a conversion to LIFO would be highly complex and involve excessive cost and effort to
achieve under local tax and/or statutory reporting requirements.
The sourced products represent certain finished goods sourced from third party manufacturers,
primarily from foreign suppliers.
69
Armstrong World Industries, Inc., and Subsidiaries
Notes to Consolidated Financial Statements
(dollar amounts in millions)
NOTE 8. OTHER CURRENT ASSETS
| |
|
|
|
|
|
|
|
|
| |
|
December 31, |
|
|
December 31, |
|
| |
|
2009 |
|
|
2008 |
|
Prepaid expenses |
|
$ |
36.0 |
|
|
$ |
34.5 |
|
Fair value of derivative assets |
|
|
0.2 |
|
|
|
11.7 |
|
Receivable related to discontinued operations |
|
|
— |
|
|
|
8.0 |
|
Assets held for sale |
|
|
7.8 |
|
|
|
7.8 |
|
Other |
|
|
11.2 |
|
|
|
16.2 |
|
|
|
|
|
|
|
|
Total other current assets |
|
$ |
55.2 |
|
|
$ |
78.2 |
|
|
|
|
|
|
|
|
The decrease in other current assets is primarily due to the decrease in the fair value of foreign
currency derivatives and the completion of the sale of Tapijtfabriek H. Desseaux N.V. (see Note 5).
NOTE 9. PROPERTY, PLANT AND EQUIPMENT
| |
|
|
|
|
|
|
|
|
| |
|
December 31, |
|
|
December 31, |
|
| |
|
2009 |
|
|
2008 |
|
Land |
|
$ |
131.5 |
|
|
$ |
129.0 |
|
Buildings |
|
|
303.8 |
|
|
|
296.5 |
|
Machinery and equipment |
|
|
787.5 |
|
|
|
722.8 |
|
Computer software |
|
|
30.6 |
|
|
|
36.2 |
|
Construction in progress |
|
|
65.8 |
|
|
|
48.6 |
|
Less accumulated depreciation and amortization |
|
|
(390.0 |
) |
|
|
(278.9 |
) |
|
|
|
|
|
|
|
Net property, plant and equipment |
|
$ |
929.2 |
|
|
$ |
954.2 |
|
|
|
|
|
|
|
|
See Note 2 for discussion of policies related to property and depreciation and asset retirement
obligations.
NOTE 10. EQUITY INVESTMENTS
Investments in joint venture of $194.6 million at December 31, 2009 reflected the equity interest
in our 50% investment in our WAVE joint venture.
The decrease in the investment in joint venture balance from December 31, 2008 of $13.6 million is
due to distributions from WAVE of $53.5 million, partially offset by our equity interest in WAVE’s
earnings. We use the equity in earnings method to determine the appropriate classification of
these distributions within our cash flow statement. During 2009 and 2008 WAVE distributed amounts
in excess of our capital contributions and proportionate share of retained earnings. Accordingly,
in 2009 the distributions were reflected as a return of investment in cash flows from investing
activity in our Consolidated Statement of Cash Flows. In 2008, $19.5 million of the distributions
were reflected as a return of investment in cash flows from investing activity, and the remaining
$61.0 million was recorded within cash flows from operating activities.
On August 20, 2007 we purchased the remaining 50% interest in Kunshan Holding Limited (“Kunshan”)
for $5.2 million, at which time it became a wholly-owned subsidiary. Our equity investment in
Kunshan at December 31, 2006 of $4.0 million along with our additional investments was reclassified
as part of the purchase accounting for the subsidiary.
| |
|
|
|
|
|
|
|
|
|
|
|
|
|
|
|
|
| Affiliate |
|
Income Statement Classification |
|
2009 |
|
|
2008 |
|
|
2007 |
|
WAVE |
|
Equity earnings from joint venture |
|
$ |
40.0 |
|
|
$ |
56.0 |
|
|
$ |
46.6 |
|
Kunshan |
|
Equity earnings from joint venture |
|
|
— |
|
|
|
— |
|
|
|
(0.6 |
) |
70
Armstrong World Industries, Inc., and Subsidiaries
Notes to Consolidated Financial Statements
(dollar amounts in millions)
We account for our WAVE joint venture using the equity method of accounting. Our recorded
investment in WAVE was higher than our 50% share of the carrying values reported in WAVE’s
consolidated financial statements by $206.6 million as of December 31, 2009 and $213.0 million as
of December 31, 2008. These differences are due to our adopting fresh-start reporting upon
emerging from Chapter 11, while WAVE’s consolidated financial statements do not reflect fresh-start
reporting. The differences are comprised of the following fair value adjustments to assets:
| |
|
|
|
|
|
|
|
|
| |
|
December 31, |
|
|
December 31, |
|
| |
|
2009 |
|
|
2008 |
|
Property, plant and equipment |
|
$ |
1.8 |
|
|
$ |
2.8 |
|
Other intangibles |
|
|
174.3 |
|
|
|
179.7 |
|
Goodwill |
|
|
30.5 |
|
|
|
30.5 |
|
|
|
|
|
|
|
|
Total |
|
$ |
206.6 |
|
|
$ |
213.0 |
|
|
|
|
|
|
|
|
Other intangibles include customer relationships, trademarks and developed technology. Customer
relationships are amortized over 20 years and developed technology is amortized over 15 years.
Trademarks have an indefinite life.
See Exhibit 99.1 for WAVE’s consolidated financial statements. Condensed financial data for WAVE
is summarized below:
| |
|
|
|
|
|
|
|
|
| |
|
December 31, |
|
|
December 31, |
|
| |
|
2009 |
|
|
2008 |
|
Current assets |
|
$ |
110.0 |
|
|
$ |
132.5 |
|
Non-current assets |
|
|
36.2 |
|
|
|
32.8 |
|
Current liabilities |
|
|
17.3 |
|
|
|
21.8 |
|
Other non-current liabilities |
|
|
154.6 |
|
|
|
156.6 |
|
| |
|
|
|
|
|
|
|
|
|
|
|
|
| |
|
2009 |
|
|
2008 |
|
|
2007 |
|
Net sales |
|
$ |
307.9 |
|
|
$ |
421.8 |
|
|
$ |
380.0 |
|
Gross profit |
|
|
118.9 |
|
|
|
160.2 |
|
|
|
134.9 |
|
Net earnings |
|
|
92.8 |
|
|
|
125.4 |
|
|
|
107.0 |
|
See discussion in Note 29 for additional information on this related party.
NOTE 11. INTANGIBLE ASSETS
During the fourth quarters of 2009 and 2008, we conducted our annual impairment testing of
non-amortizable intangible assets. We completed our impairment analysis and determined that the
carrying value of our Wood Flooring trademarks was in excess of the fair value. We determined the
fair value of these intangible assets by utilizing a relief from royalty analyses that incorporated
projections of revenue and cash flows. The initial fair value for these intangible assets was
determined in 2006 as part of fresh start reporting. The fair values were negatively affected by
lower expected future cash flows due to the decline in the U.S. residential housing market. Based
on the result of the analysis, we recorded non-cash impairment charges of $18.0 million in the
fourth quarter of 2009 and $25.4 million in the fourth quarter of 2008. See Note 2 for a
discussion of our accounting policy for intangible assets.
71
Armstrong World Industries, Inc., and Subsidiaries
Notes to Consolidated Financial Statements
(dollar amounts in millions)
The following table details amounts related to our intangible assets as of December 31, 2009 and
2008.
| |
|
|
|
|
|
|
|
|
|
|
|
|
|
|
|
|
|
|
|
|
| |
|
|
|
|
|
December 31, 2009 |
|
|
December 31, 2008 |
|
| |
|
|
|
|
|
Gross |
|
|
|
|
|
|
Gross |
|
|
|
|
| |
|
Estimated |
|
|
Carrying |
|
|
Accumulated |
|
|
Carrying |
|
|
Accumulated |
|
| |
|
Useful Life |
|
|
Amount |
|
|
Amortization |
|
|
Amount |
|
|
Amortization |
|
Amortizing intangible assets |
|
|
|
|
|
|
|
|
|
|
|
|
|
|
|
|
|
|
|
|
Customer relationships |
|
20 years |
|
$ |
171.0 |
|
|
$ |
27.7 |
|
|
$ |
171.4 |
|
|
$ |
19.2 |
|
Developed technology |
|
15 years |
|
|
80.9 |
|
|
|
17.5 |
|
|
|
81.0 |
|
|
|
12.0 |
|
Other |
|
Various |
|
|
10.8 |
|
|
|
0.5 |
|
|
|
9.5 |
|
|
|
0.3 |
|
|
|
|
|
|
|
|
|
|
|
|
|
|
|
|
|
|
Total |
|
|
|
|
|
$ |
262.7 |
|
|
$ |
45.7 |
|
|
$ |
261.9 |
|
|
$ |
31.5 |
|
|
|
|
|
|
|
|
|
|
|
|
|
|
|
|
|
|
|
|
|
|
|
|
|
|
|
|
|
|
|
|
|
|
|
|
|
|
|
Non-amortizing intangible assets |
|
|
|
|
|
|
|
|
|
|
|
|
|
|
|
|
|
|
|
|
Trademarks and brand names |
|
Indefinite |
|
|
375.8 |
|
|
|
|
|
|
|
395.9 |
|
|
|
|
|
|
|
|
|
|
|
|
|
|
|
|
|
|
|
|
|
|
|
|
|
|
|
|
|
|
|
|
|
|
|
|
|
|
|
|
|
|
|
|
|
Total other intangible assets |
|
|
|
|
|
$ |
638.5 |
|
|
|
|
|
|
$ |
657.8 |
|
|
|
|
|
|
|
|
|
|
|
|
|
|
|
|
|
|
|
|
|
|
|
|
| |
|
|
|
|
|
|
|
|
|
|
|
2009 |
|
|
|
2008 |
|
|
|
|
|
|
|
|
Amortization |
|
$ |
14.2 |
|
|
$ |
14.3 |
|
Intangible asset impairment |
|
|
18.0 |
|
|
|
25.4 |
|
|
|
|
|
|
|
|
Total amortization expense and impairment charges |
|
$ |
32.2 |
|
|
$ |
39.7 |
|
|
|
|
|
|
|
|
The annual amortization expense expected for the years 2010 through 2014 is $14.2 million in each
year.
NOTE 12. OTHER NON-CURRENT ASSETS
| |
|
|
|
|
|
|
|
|
| |
|
December 31, |
|
|
December 31, |
|
| |
|
2009 |
|
|
2008 |
|
Cash surrender value of Company owned life insurance policies |
|
$ |
56.5 |
|
|
$ |
53.5 |
|
Other |
|
|
25.4 |
|
|
|
28.2 |
|
|
|
|
|
|
|
|
Total other non-current assets |
|
$ |
81.9 |
|
|
$ |
81.7 |
|
|
|
|
|
|
|
|
NOTE 13. ACCOUNTS PAYABLE AND ACCRUED EXPENSES
| |
|
|
|
|
|
|
|
|
| |
|
December 31, |
|
|
December 31, |
|
| |
|
2009 |
|
|
2008 |
|
Payables, trade and other |
|
$ |
159.6 |
|
|
$ |
179.3 |
|
Employment costs |
|
|
107.2 |
|
|
|
107.1 |
|
Other |
|
|
44.2 |
|
|
|
50.6 |
|
|
|
|
|
|
|
|
Total accounts payable and accrued expenses |
|
$ |
311.0 |
|
|
$ |
337.0 |
|
|
|
|
|
|
|
|
The decrease in accounts payable and accrued expenses is primarily due to a reduction in production
activity in response to current market conditions.
72
Armstrong World Industries, Inc., and Subsidiaries
Notes to Consolidated Financial Statements
(dollar amounts in millions)
NOTE 14. SEVERANCE AND RELATED COSTS
In 2009 we recorded $17.5 million of severance and related expenses, primarily to reflect the
separation costs for approximately 1,000 employees, including executives and employees impacted by
the cessation of production at four manufacturing facilities. The charges were recorded in SG&A
expenses ($10.5 million) and cost of goods sold ($7.0 million).
In 2008 we recorded $7.4 million of severance and related expenses to reflect the termination costs
for certain corporate employees. We also recorded a reduction of our stock-based compensation
expense of $1.5 million in the first quarter of 2008 related to stock grants that were forfeited by
these employees. These costs were recorded as SG&A expenses.
During 2008 we recorded $14.1 million of severance and other related charges primarily related to
organizational and manufacturing changes for our European Resilient Flooring business. The
organizational changes related to the decision to consolidate and outsource several SG&A functions.
The manufacturing changes related primarily to the decision to cease production of automotive
carpeting and other specialized textile flooring products. These charges were recorded as part of
cost of goods sold ($7.3 million) and SG&A expenses ($6.8 million).
NOTE 15. INCOME TAXES
The tax effects of principal temporary differences between the carrying amounts of assets and
liabilities and their tax bases are summarized in the table below. Management believes it is more
likely than not that results of future operations will generate sufficient taxable income to
realize deferred tax assets, net of valuation allowances, including the remaining federal net
operating losses of $173.1 million principally resulting from payments to the Asbestos PI Trust in
2006 under the POR that may be carried forward for the remaining 17 years. In arriving at this
conclusion, we considered the profit before tax generated for the years 1996 through 2009, as well
as future reversals of existing taxable temporary differences and projections of future profit
before tax.
We have provided valuation allowances for certain deferred state and foreign income tax assets,
foreign tax credits and other basis adjustments of $155.4 million. We have $1,366.9 million of
state net operating loss (“NOL”) carryforwards with expirations between 2010 and 2029. In
addition, we have $431.4 million of foreign NOL carryforwards, of which $402.2 million are
available for carryforward indefinitely and $29.2 million expire between 2010 and 2016. We also
have alternative minimum tax credit carryforwards of $19.5 million which are available to reduce
future federal income taxes.
Our valuation allowances decreased from 2008 by a net amount of $53.3 million. This includes a
decrease of $49.0 million for foreign tax credits, a decrease of $11.4 million for capital loss
carryforwards, a decrease for certain deferred state income tax assets of $2.0 million, and an
increase for foreign tax loss carryforwards of $9.1 million. The valuation allowance for foreign
tax credits decreased by $31.3 million for the settlement of the Internal Revenue Service (“IRS”)
audit and decreased by $17.7 million for carryforward expirations. The valuation allowance for
capital losses decreased by $7.1 million for carryforward expirations, decreased by $7.6 million
for losses that were recharacterized as ordinary losses, and increased by $3.3 million for current
year losses. The decrease in the valuation allowance for certain deferred state income tax assets
of $2.0 million was primarily due to an increase in the amount of future reversals of existing
taxable temporary differences. The increase in the valuation allowance for foreign tax loss
carryforwards was primarily due to additional unbenefitted losses partially offset by carryforward
expirations that also reduced the related deferred income tax assets. We estimate we will need to
generate future taxable income of approximately $494.6 million for federal income tax purposes and
$1,183.7 million for state income tax purposes in order to fully realize the net deferred income
tax assets discussed above.
73
Armstrong World Industries, Inc., and Subsidiaries
Notes to Consolidated Financial Statements
(dollar amounts in millions)
| |
|
|
|
|
|
|
|
|
| |
|
December 31, |
|
|
December 31, |
|
| Deferred income tax assets (liabilities) |
|
2009 |
|
|
2008 |
|
Postretirement and postemployment benefits |
|
$ |
165.1 |
|
|
$ |
170.4 |
|
Pension benefit liabilities |
|
|
19.3 |
|
|
|
32.2 |
|
Net operating losses |
|
|
354.4 |
|
|
|
529.8 |
|
Foreign tax credit carryforwards |
|
|
88.6 |
|
|
|
70.7 |
|
Capital losses |
|
|
3.3 |
|
|
|
15.2 |
|
Other |
|
|
97.2 |
|
|
|
82.3 |
|
|
|
|
|
|
|
|
Total deferred income tax assets |
|
|
727.9 |
|
|
|
900.6 |
|
Valuation allowances |
|
|
(155.4 |
) |
|
|
(208.7 |
) |
|
|
|
|
|
|
|
Net deferred income tax assets |
|
|
572.5 |
|
|
|
691.9 |
|
|
|
|
|
|
|
|
Intangibles |
|
|
(275.8 |
) |
|
|
(289.7 |
) |
Accumulated depreciation |
|
|
(94.6 |
) |
|
|
(102.2 |
) |
Prepaid pension costs |
|
|
(28.3 |
) |
|
|
— |
|
Tax on unremitted earnings |
|
|
(87.0 |
) |
|
|
(48.7 |
) |
Inventories |
|
|
(18.3 |
) |
|
|
(18.9 |
) |
Other |
|
|
(5.3 |
) |
|
|
(12.0 |
) |
|
|
|
|
|
|
|
Total deferred income tax liabilities |
|
|
(509.3 |
) |
|
|
(471.5 |
) |
|
|
|
|
|
|
|
Net deferred income tax assets |
|
$ |
63.2 |
|
|
$ |
220.4 |
|
|
|
|
|
|
|
|
Deferred income taxes have been classified in the Consolidated
Balance Sheet as: |
|
|
|
|
|
|
|
|
Deferred income tax assets — current |
|
$ |
16.3 |
|
|
$ |
14.4 |
|
Deferred income tax assets — noncurrent |
|
|
58.2 |
|
|
|
219.6 |
|
Deferred income tax liabilities — current |
|
|
(3.1 |
) |
|
|
(4.6 |
) |
Deferred income tax liabilities — noncurrent |
|
|
(8.2 |
) |
|
|
(9.0 |
) |
|
|
|
|
|
|
|
Net deferred income tax assets |
|
$ |
63.2 |
|
|
$ |
220.4 |
|
|
|
|
|
|
|
|
| |
|
|
|
|
|
|
|
|
|
|
|
|
| Details of taxes |
|
2009 |
|
|
2008 |
|
|
2007 |
|
Earnings (loss) from continuing
operations before income taxes: |
|
|
|
|
|
|
|
|
|
|
|
|
Domestic |
|
$ |
75.5 |
|
|
$ |
171.0 |
|
|
$ |
221.4 |
|
Foreign |
|
|
(0.3 |
) |
|
|
18.4 |
|
|
|
42.1 |
|
Eliminations |
|
|
— |
|
|
|
— |
|
|
|
(4.3 |
) |
|
|
|
|
|
|
|
|
|
|
Total |
|
$ |
75.2 |
|
|
$ |
189.4 |
|
|
$ |
259.2 |
|
|
|
|
|
|
|
|
|
|
|
Income tax (benefit) provision: |
|
|
|
|
|
|
|
|
|
|
|
|
Current: |
|
|
|
|
|
|
|
|
|
|
|
|
Federal |
|
$ |
(153.4 |
) |
|
$ |
8.3 |
|
|
$ |
4.8 |
|
Foreign |
|
|
13.9 |
|
|
|
21.3 |
|
|
|
17.4 |
|
State |
|
|
1.4 |
|
|
|
5.4 |
|
|
|
4.6 |
|
|
|
|
|
|
|
|
|
|
|
Total current |
|
|
(138.1 |
) |
|
|
35.0 |
|
|
|
26.8 |
|
|
|
|
|
|
|
|
|
|
|
Deferred: |
|
|
|
|
|
|
|
|
|
|
|
|
Federal |
|
|
134.9 |
|
|
|
46.5 |
|
|
|
72.5 |
|
Foreign |
|
|
— |
|
|
|
(1.1 |
) |
|
|
1.5 |
|
State |
|
|
0.7 |
|
|
|
28.6 |
|
|
|
5.6 |
|
|
|
|
|
|
|
|
|
|
|
Total deferred |
|
|
135.6 |
|
|
|
74.0 |
|
|
|
79.6 |
|
|
|
|
|
|
|
|
|
|
|
Total income tax (benefit) expense |
|
$ |
(2.5 |
) |
|
$ |
109.0 |
|
|
$ |
106.4 |
|
|
|
|
|
|
|
|
|
|
|
At December 31, 2009, we had $111.5 million of book basis (including unremitted earnings) in excess
of tax basis in the shares of certain foreign subsidiaries for which no deferred income taxes have
been provided because we consider the underlying earnings to be permanently reinvested. This basis
difference could reverse through a sale of the subsidiaries, the receipt of dividends from the
subsidiaries,
74
Armstrong World Industries, Inc., and Subsidiaries
Notes to Consolidated Financial Statements
(dollar amounts in millions)
as well as various other events. It is not practical to calculate the residual income tax which
would result if these basis differences reversed due to the complexities of the tax law and the
hypothetical nature of the calculations. We do, however, estimate that approximately $1.1 million
in foreign withholding taxes would be payable if the underlying earnings were to be distributed.
| |
|
|
|
|
|
|
|
|
|
|
|
|
| Reconciliation to U.S. statutory tax rate |
|
2009 |
|
|
2008 |
|
|
2007 |
|
Continuing operations tax at statutory rate |
|
$ |
26.3 |
|
|
$ |
66.3 |
|
|
$ |
90.7 |
|
State income tax expense, net of federal benefit |
|
|
2.2 |
|
|
|
8.1 |
|
|
|
6.7 |
|
(Decrease)/increase in valuation allowances on
deferred state income tax assets |
|
|
(0.8 |
) |
|
|
13.9 |
|
|
|
— |
|
Increases in valuation allowances on deferred foreign
income tax assets |
|
|
17.3 |
|
|
|
14.2 |
|
|
|
6.0 |
|
Decrease in valuation allowance for foreign tax credits |
|
|
(31.3 |
) |
|
|
— |
|
|
|
— |
|
Tax on foreign and foreign-source income |
|
|
(3.7 |
) |
|
|
(0.9 |
) |
|
|
(1.7 |
) |
Interest on uncertain tax positions |
|
|
— |
|
|
|
5.9 |
|
|
|
1.8 |
|
Permanent book/tax differences |
|
|
4.7 |
|
|
|
(2.4 |
) |
|
|
— |
|
IRS audit settlement |
|
|
(12.9 |
) |
|
|
— |
|
|
|
— |
|
Recharacterization of stock loss |
|
|
(7.6 |
) |
|
|
— |
|
|
|
— |
|
| |
Tax on unremitted earnings |
|
|
3.3 |
|
|
|
3.9 |
|
|
|
2.9 |
|
|
|
|
|
|
|
|
|
|
|
| |
Tax (benefit) expense at effective rate |
|
$ |
(2.5 |
) |
|
$ |
109.0 |
|
|
$ |
106.4 |
|
|
|
|
|
|
|
|
|
|
|
The effective tax rate for the year ended December 31, 2007 includes a benefit of $5.0 million (net
of federal benefit) for legislative changes in New York and Texas and $1.0 million for the
reduction in the German income tax rate.
We have $57.5 million of Unrecognized Tax Benefits (“UTB”) as of December 31, 2009. Of this
amount, $22.7 million ($20.4 million, net of federal benefit), if recognized in future periods, would impact the
reported effective tax rate. The remaining amount of $34.8 million, if recognized in future
periods, would be fully reduced by additional valuation allowances.
In October 2007, we received $178.7 million in refunds for federal income taxes paid over the
preceding ten years. The refunds resulted from the carryback of a portion of net operating losses
created by the funding of the Asbestos PI Trust in October 2006. The refunds were subject to an
examination by the IRS. Upon receipt of the refunds in the fourth quarter of 2007, we recorded a
liability of $144.6 million pending completion of the IRS audit. We also recorded a non-current
deferred tax asset of $144.6 million for future tax benefits that would result from a disallowance
of the refunds. In addition, we had accrued $10.0 million of interest as of June 30, 2009, on this
unrecognized tax benefit as income tax expense.
The IRS completed its audit and in July 2009 notified us that the Joint Committee on Taxation of
the U.S. Congress had also issued its final approval of our refunds. Therefore, in the third
quarter of 2009, we recorded a decrease in the liability for previously unrecognized tax benefits
of $154.6 million. We also recorded a decrease in non-current deferred tax assets of $144.6
million for the reduction in future tax benefits from the settlement of this tax position. As a
result, we recorded an income tax benefit of $10.0 million in the third quarter of 2009 for the
settlement of this tax position.
Additionally, through the second quarter of 2009 we had accrued U.S. income taxes of approximately
$50 million for unremitted earnings of foreign subsidiaries that were not considered to be
permanently reinvested. Due to uncertainty regarding the net operating loss carryover discussed
above, we provided a valuation allowance of $31.3 million on the foreign tax credits that would be
available upon the remittance of these earnings to the U.S. With the settlement of the IRS audit
in July 2009, this uncertainty was eliminated. Therefore, in the third quarter of 2009, we removed
the valuation allowance on these foreign tax credits.
75
Armstrong World Industries, Inc., and Subsidiaries
Notes to Consolidated Financial Statements
(dollar amounts in millions)
It is reasonably possible that certain UTB’s may increase or decrease within the next twelve months
due to tax examination changes, settlement activities, expirations of statute of limitations, or
the impact on recognition and measurement considerations related to the results of published tax
cases or other similar activities. Over the next twelve months, we estimate that UTB’s may
decrease by $1.4 million due to statutes expiring and increase by $2.4 million due to uncertain tax
positions expected to be taken on tax returns.
We account for all interest and penalties on uncertain income tax positions as income tax expense.
We reported $1.4 million of interest and penalty exposure as accrued income tax in the Consolidated
Balance Sheet as of December 31, 2009. In addition, the reversal of $8.3 million of interest and
penalties previously accrued was recognized as an income tax benefit during 2009 primarily as a
result of the settlement of the IRS audit discussed above.
We have significant operations in over 25 countries and file income tax returns in approximately 85
tax jurisdictions, in some cases for multiple legal entities per jurisdiction. Generally, we have
open tax years subject to tax audit on average of between three years and six years. We have not
materially extended any open statutes of limitation for any significant location and have reviewed
and accrued for, where necessary, tax liabilities for open periods.
As discussed above, the IRS audit for the 2005 and 2006 tax years was completed during the third
quarter of 2009. The tax years 2007, 2008 and 2009 are subject to future potential tax
adjustments. All tax years prior to 2007 have been settled.
We also have examinations in progress in Germany and Canada. We have evaluated the need for tax
reserves for these audits.
We had the following activity for UTB’s for the years ended December 31, 2009, 2008 and 2007:
| |
|
|
|
|
|
|
|
|
|
|
|
|
| |
|
2009 |
|
|
2008 |
|
|
2007 |
|
Unrecognized tax benefits balance at
January 1 |
|
$ |
174.4 |
|
|
$ |
180.7 |
|
|
$ |
37.0 |
|
Gross change for current year positions |
|
|
6.1 |
|
|
|
0.8 |
|
|
|
1.4 |
|
Increases for prior period positions |
|
|
29.1 |
|
|
|
3.4 |
|
|
|
162.4 |
|
Decrease for prior period positions |
|
|
(149.8 |
) |
|
|
(8.0 |
) |
|
|
(19.7 |
) |
Decrease due to settlements and payments |
|
|
(1.9 |
) |
|
|
(0.9 |
) |
|
|
(0.1 |
) |
Decrease due to statute expirations |
|
|
(0.4 |
) |
|
|
(1.6 |
) |
|
|
(0.3 |
) |
|
|
|
|
|
|
|
|
|
|
Unrecognized tax benefits balance at
December 31 |
|
$ |
57.5 |
|
|
$ |
174.4 |
|
|
$ |
180.7 |
|
|
|
|
|
|
|
|
|
|
|
| |
|
|
|
|
|
|
|
|
|
|
|
|
| Other taxes |
|
2009 |
|
|
2008 |
|
|
2007 |
|
Payroll taxes |
|
$ |
69.7 |
|
|
$ |
75.7 |
|
|
$ |
77.2 |
|
Property, franchise and capital stock taxes |
|
|
16.0 |
|
|
|
15.4 |
|
|
|
18.3 |
|
76
Armstrong World Industries, Inc., and Subsidiaries
Notes to Consolidated Financial Statements
(dollar amounts in millions)
NOTE 16. DEBT
| |
|
|
|
|
|
|
|
|
|
|
|
|
|
|
|
|
| |
|
|
|
|
|
Average |
|
|
|
|
|
|
Average |
|
| |
|
|
|
|
|
year-end |
|
|
|
|
|
|
year-end |
|
| |
|
2009 |
|
|
interest rate |
|
|
2008 |
|
|
interest rate |
|
Term loan A due 2011 |
|
$ |
262.5 |
|
|
|
1.78 |
% |
|
$ |
281.3 |
|
|
|
2.01 |
% |
Term loan B due 2013 |
|
|
191.6 |
|
|
|
1.98 |
% |
|
|
193.5 |
|
|
|
2.26 |
% |
Foreign bank loans due 2010 |
|
|
0.1 |
|
|
|
1.00 |
% |
|
|
1.3 |
|
|
|
4.75 |
% |
Bank loans due through 2016 |
|
|
8.3 |
|
|
|
5.05 |
% |
|
|
10.8 |
|
|
|
6.02 |
% |
Industrial revenue bonds due 2025 |
|
|
10.0 |
|
|
|
1.83 |
% |
|
|
10.0 |
|
|
|
1.60 |
% |
Capital lease obligations due through 2018 |
|
|
0.1 |
|
|
|
4.37 |
% |
|
|
0.1 |
|
|
|
5.03 |
% |
|
|
|
|
|
|
|
|
|
|
|
|
|
Subtotal |
|
|
472.6 |
|
|
|
1.92 |
% |
|
|
497.0 |
|
|
|
2.19 |
% |
Less current portion and short-term debt |
|
|
40.1 |
|
|
|
2.47 |
% |
|
|
42.2 |
|
|
|
3.00 |
% |
|
|
|
|
|
|
|
|
|
|
|
|
|
Total long-term debt, less current portion |
|
$ |
432.5 |
|
|
|
1.87 |
% |
|
$ |
454.8 |
|
|
|
2.12 |
% |
|
|
|
|
|
|
|
|
|
|
|
|
|
On October 2, 2006, Armstrong executed a $1.1 billion senior credit facility arranged by Bank of
America Securities LLC, J.P. Morgan Securities, Inc., and Barclays Capital. This facility is made
up of a $300 million revolving credit facility (with a $150 million sublimit for letters of
credit), a $300 million Term Loan A, and a $500 million Term Loan B. This $1.1 billion senior
credit facility is secured by U.S. personal property (excluding land and buildings), the capital
stock of material U.S. subsidiaries, and a pledge of 65% of the stock of our material foreign
subsidiaries.
The senior credit facility includes three financial covenants which: do not permit the ratio of
consolidated earnings before interest, taxes, depreciation and amortization (“EBITDA”) to
consolidated interest expense to be less than 3.00 to 1.00; do not permit the ratio of consolidated
funded indebtedness to consolidated EBITDA (“Consolidated Leverage Ratio”) to be greater than 3.75
to 1.00; and require that the Company maintain minimum domestic liquidity of $100 million, as
defined by the credit agreement. We are in compliance with these covenants. As of December 31,
2009 our consolidated interest coverage ratio was 15.2 to 1.00, our indebtedness to EBITDA was 1.76
to 1.00 and our domestic liquidity was $586.4 million. We believe that default under these
covenants is unlikely. Fully borrowing under our revolving credit facility, provided we maintain
minimum domestic liquidity of $100 million, would not violate these covenants.
The Revolving Credit and Term Loan A portions are currently priced at a spread of 1.50% over LIBOR
and the Term Loan B portion is priced at 1.75% over LIBOR for its entire term. The Term Loan A and
Term Loan B were both fully drawn (net of scheduled and voluntary principal payments) and are
currently priced on a variable interest rate basis. The unpaid balances of Term Loan A ($262.5
million) and Term Loan B ($191.6 million) of the credit facility may be prepaid without penalty at
the maturity of their respective interest reset periods. Any amounts prepaid may not be
reborrowed.
No mandatory prepayments are required under the senior credit facility unless (a) our Indebtedness
to EBITDA ratio is greater than 2.5 to 1.0, or (b) debt ratings from S&P are lower than BB (stable),
or (c) debt ratings from Moody’s are lower than Ba2 (stable) based on our year end compliance
certification. If required, the prepayment amount would be 50% of Consolidated Excess Cash Flow as
defined by the credit agreement. Mandatory prepayments have not occurred since the inception of
the agreement. Our current debt rating from S&P is BB (stable) and from Moody’s is Ba2 (stable).
During the third quarter of 2009 we refunded the $10.0 million industrial revenue bonds that had
been scheduled to mature in August 2009. The new maturity date of the bonds is in July 2025.
Approximately $0.8 million of the remaining $18.5 million of debt as of December 31, 2009 was
secured with buildings and other assets. The credit lines at our foreign subsidiaries are subject
to immaterial annual commitment fees.
77
Armstrong World Industries, Inc., and Subsidiaries
Notes to Consolidated Financial Statements
(dollar amounts in millions)
As of December 31, 2008, approximately $2.2 million of the $22.2 million of total debt outstanding
was secured with buildings and other assets.
Scheduled payments of long-term debt:
| |
|
|
|
|
2010 |
|
$ |
40.1 |
|
2011 |
|
$ |
234.8 |
|
2012 |
|
$ |
3.5 |
|
2013 |
|
$ |
184.1 |
|
2014 |
|
$ |
0.1 |
|
2015 and later |
|
$ |
10.0 |
|
We utilize lines of credit and other commercial commitments in order to ensure that adequate funds
are available to meet operating requirements. On December 31, 2009, we had a $300 million
revolving credit facility with a $150 million sublimit for letters of credit, of which $41.8
million was outstanding. There were no outstanding borrowings under the revolving credit facility.
Availability under this facility totaled $258.2 million as of December 31, 2009. As of December
31, 2009, our foreign subsidiaries had available lines of credit totaling $24.9 million, of which
$1.0 million was used and $2.2 million was only available for letters of credit and guarantees,
leaving $21.7 million of unused lines of credit available for foreign borrowings.
On December 31, 2009, we had outstanding letters of credit totaling $42.5 million, of which $41.8
million was issued under the revolving credit facility and $0.7 million of international subsidiary
letters of credit were issued by other banks. Letters of credit are issued to third party
suppliers, insurance and financial institutions and typically can only be drawn upon in the event
of AWI’s failure to pay its obligations to the beneficiary.
NOTE 17. PENSION AND OTHER BENEFIT PROGRAMS
We have defined benefit pension plans and postretirement medical and insurance benefit plans
covering eligible employees worldwide. We also have defined-contribution pension plans for
eligible employees. Benefits from defined benefit pension plans, which cover most employees
worldwide, are based primarily on an employee’s compensation and years of service. We fund our
pension plans when appropriate. We fund postretirement benefits on a pay-as-you-go basis, with the
retiree paying a portion of the cost for health care benefits by means of deductibles and
contributions.
UNITED STATES PLANS
The following tables summarize the balance sheet impact of the pension and postretirement benefit
plans, as well as the related benefit obligations, assets, funded status and rate assumptions. The
pension benefits disclosures include both the Retirement Income Plan (RIP) and the Retirement
Benefit Equity Plan, which is a nonqualified, unfunded plan designed to provide pension benefits in
excess of the limits defined under Sections 415 and 401(a)(17) of the Internal Revenue Code.
78
Armstrong World Industries, Inc., and Subsidiaries
Notes to Consolidated Financial Statements
(dollar amounts in millions)
We use a December 31 measurement date for our U.S. defined benefit plans.
| |
|
|
|
|
|
|
|
|
| U.S. defined-benefit pension plans |
|
2009 |
|
|
2008 |
|
Change in benefit obligation: |
|
|
|
|
|
|
|
|
Benefit obligation as of beginning of period |
|
$ |
1,755.7 |
|
|
$ |
1,712.6 |
|
Service cost |
|
|
18.0 |
|
|
|
17.4 |
|
Interest cost |
|
|
96.0 |
|
|
|
97.8 |
|
Plan amendments |
|
|
12.9 |
|
|
|
3.4 |
|
Special termination benefits |
|
|
0.2 |
|
|
|
— |
|
Actuarial loss |
|
|
11.1 |
|
|
|
36.2 |
|
Benefits paid |
|
|
(113.8 |
) |
|
|
(111.7 |
) |
|
|
|
|
|
|
|
Benefit obligation as of end of period |
|
$ |
1,780.1 |
|
|
$ |
1,755.7 |
|
|
|
|
|
|
|
|
|
|
|
|
|
|
|
|
|
Change in plan assets: |
|
|
|
|
|
|
|
|
Fair value of plan assets as of beginning of period |
|
$ |
1,701.6 |
|
|
$ |
2,355.7 |
|
Actual return on plan assets — gain (loss) |
|
|
259.2 |
|
|
|
(545.6 |
) |
Employer contribution |
|
|
3.3 |
|
|
|
3.2 |
|
Benefits paid |
|
|
(113.8 |
) |
|
|
(111.7 |
) |
|
|
|
|
|
|
|
Fair value of plan assets as of end of period |
|
$ |
1,850.3 |
|
|
$ |
1,701.6 |
|
|
|
|
|
|
|
|
|
|
|
|
|
|
|
|
|
Funded status of the plans |
|
$ |
70.2 |
|
|
$ |
(54.1 |
) |
| |
|
|
|
|
|
|
|
|
| U.S. defined-benefit pension plans |
|
2009 |
|
|
2008 |
|
Weighted-average assumptions used to
determine benefit obligations
at end of period: |
|
|
|
|
|
|
|
|
Discount rate |
|
|
5.60 |
% |
|
|
5.60 |
% |
Rate of compensation increase |
|
|
4.00 |
% |
|
|
4.00 |
% |
| |
Weighted-average assumptions used to
determine net periodic benefit cost for
the period: |
|
|
|
|
|
|
|
|
Discount rate |
|
|
5.60 |
% |
|
|
5.85 |
% |
Expected return on plan assets |
|
|
8.00 |
% |
|
|
8.00 |
% |
Rate of compensation increase |
|
|
4.00 |
% |
|
|
4.00 |
% |
79
Armstrong World Industries, Inc., and Subsidiaries
Notes to Consolidated Financial Statements
(dollar amounts in millions)
| |
|
|
|
|
|
|
|
|
| U.S. defined-benefit retiree health and life insurance plans |
|
2009 |
|
|
2008 |
|
Change in benefit obligation: |
|
|
|
|
|
|
|
|
Benefit obligation as of beginning of period |
|
$ |
334.3 |
|
|
$ |
337.0 |
|
Service cost |
|
|
1.9 |
|
|
|
1.7 |
|
Interest cost |
|
|
16.7 |
|
|
|
18.9 |
|
Plan participants’ contributions |
|
|
6.0 |
|
|
|
6.2 |
|
Plan amendments |
|
|
0.1 |
|
|
|
— |
|
Effect of curtailment |
|
|
(0.2 |
) |
|
|
— |
|
Actuarial (gain) loss |
|
|
(3.9 |
) |
|
|
1.4 |
|
Benefits paid, gross |
|
|
(30.2 |
) |
|
|
(32.6 |
) |
Medicare subsidy receipts |
|
|
2.8 |
|
|
|
1.7 |
|
|
|
|
|
|
|
|
Benefit obligation as of end of period |
|
$ |
327.5 |
|
|
$ |
334.3 |
|
|
|
|
|
|
|
|
|
|
|
|
|
|
|
|
|
Change in plan assets: |
|
|
|
|
|
|
|
|
Fair value of plan assets as of beginning of period |
|
|
— |
|
|
|
— |
|
Employer contribution |
|
$ |
21.4 |
|
|
$ |
24.7 |
|
Plan participants’ contributions |
|
|
6.0 |
|
|
|
6.2 |
|
Benefits paid, gross |
|
|
(30.2 |
) |
|
|
(32.6 |
) |
Medicare subsidy receipts |
|
|
2.8 |
|
|
|
1.7 |
|
|
|
|
|
|
|
|
Fair value of plan assets as of end of period |
|
$ |
— |
|
|
$ |
— |
|
|
|
|
|
|
|
|
|
|
|
|
|
|
|
|
|
Funded status of the plans |
|
$ |
(327.5 |
) |
|
$ |
(334.3 |
) |
| |
|
|
|
|
|
|
|
|
| U.S. defined-benefit retiree health and life insurance plans |
|
2009 |
|
|
2008 |
|
Weighted-average discount rate used to
determine benefit obligations
at end of period |
|
|
5.30 |
% |
|
|
5.60 |
% |
Weighted-average discount rate used to
determine net periodic benefit cost for
the period |
|
|
5.60 |
% |
|
|
5.85 |
% |
Investment Policies
The RIP’s primary investment objective is to increase the ratio of RIP assets to liabilities by
maximizing the long-term return on investments while minimizing the likelihood of cash
contributions over the next 5-10 years. This is to be achieved by (a) investing primarily in
publicly-traded equities, (b) limiting return volatility by diversifying investments among
additional asset classes with differing expected rates of return and return correlations, and (c)
investing a portion of RIP assets in a bond portfolio whose duration is roughly equal to the
duration of RIP liabilities. Derivatives may be used either to implement investment positions
efficiently or to hedge risk but not to create investment leverage.
Each asset class utilized by the RIP has a defined asset allocation target and allowable range.
The table below shows the asset allocation target and the December 31, 2009 and 2008 position for
each asset class:
| |
|
|
|
|
|
|
|
|
|
|
|
|
| |
|
Target Weight at |
|
|
Position at December 31, |
|
| Asset Class |
|
December 31, 2009 |
|
|
2009 |
|
|
2008 |
|
Domestic equity |
|
|
40 |
% |
|
|
38 |
% |
|
|
30 |
% |
International equity |
|
|
22 |
% |
|
|
22 |
% |
|
|
17 |
% |
High yield bonds |
|
|
5 |
% |
|
|
6 |
% |
|
|
4 |
% |
Long duration bonds |
|
|
26 |
% |
|
|
30 |
% |
|
|
40 |
% |
Real estate |
|
|
7 |
% |
|
|
4 |
% |
|
|
7 |
% |
Other fixed income |
|
|
0 |
% |
|
|
0 |
% |
|
|
2 |
% |
80
Armstrong World Industries, Inc., and Subsidiaries
Notes to Consolidated Financial Statements
(dollar amounts in millions)
The difference between the target and actual positions as of December 31, 2008 was due to poor
performance of the equity investments, not an intentional shift in asset allocation. The portfolio
was rebalanced in 2009.
Pension plan assets are required to be reported and disclosed at fair value in the financial
statements. Fair value is defined as the exchange price that would be received for an asset or
paid to transfer a liability (an exit price) in the principal or most advantageous market for the
asset or liability in an orderly transaction between market participants on the measurement date.
Three levels of inputs may be used to measure fair value:
Level 1 — Quoted prices in active markets for identical assets or liabilities.
Level 2 — Observable inputs other than quoted prices included in Level 1, such as
quoted prices for similar assets and liabilities in active markets; quoted prices
for identical or similar assets and liabilities in markets that are not active; or
other inputs that are observable or can be corroborated by observable market data.
Level 3 — Unobservable inputs that are supported by little or no market activity
and that are significant to the fair value of the assets or liabilities. This
includes certain pricing models, discounted cash flow methodologies and similar
techniques that use significant unobservable inputs.
The asset’s fair value measurement level within the fair value hierarchy is based on the lowest
level of any input that is significant to the fair value measurement. Valuation techniques used
need to maximize the use of observable inputs and minimize the use of unobservable inputs.
The following table sets forth by level within the fair value hierarchy a summary of the RIP’s
assets measured at fair value on a recurring basis as of December 31, 2009:
| |
|
|
|
|
|
|
|
|
|
|
|
|
|
|
|
|
| Description |
|
Level 1 |
|
|
Level 2 |
|
|
Level 3 |
|
|
Total |
|
Long duration bonds |
|
|
— |
|
|
$ |
541.2 |
|
|
|
— |
|
|
$ |
541.2 |
|
Domestic equity |
|
$ |
683.4 |
|
|
|
2.9 |
|
|
|
— |
|
|
|
686.3 |
|
International equity |
|
|
145.2 |
|
|
|
260.6 |
|
|
|
— |
|
|
|
405.8 |
|
High yield bonds |
|
|
— |
|
|
|
98.1 |
|
|
|
— |
|
|
|
98.1 |
|
Real estate |
|
|
— |
|
|
|
— |
|
|
$ |
84.6 |
|
|
|
84.6 |
|
Other investments |
|
|
— |
|
|
|
— |
|
|
|
8.4 |
|
|
|
8.4 |
|
Money market investments |
|
|
24.9 |
|
|
|
— |
|
|
|
— |
|
|
|
24.9 |
|
Cash and other short
term investments |
|
|
1.0 |
|
|
|
— |
|
|
|
— |
|
|
|
1.0 |
|
|
|
|
|
|
|
|
|
|
|
|
|
|
Net assets |
|
$ |
854.5 |
|
|
$ |
902.8 |
|
|
$ |
93.0 |
|
|
$ |
1,850.3 |
|
|
|
|
|
|
|
|
|
|
|
|
|
|
81
Armstrong World Industries, Inc., and Subsidiaries
Notes to Consolidated Financial Statements
(dollar amounts in millions)
The table below sets forth a summary of changes in the fair value of the RIP’s level 3 assets for
the year ended December 31, 2009:
| |
|
|
|
|
|
|
|
|
|
|
|
|
|
|
|
|
| |
|
Level 3 Assets Gains and Losses for the Year Ended December 31, 2009 |
|
| |
|
|
|
|
|
|
|
|
|
Group |
|
|
|
|
| |
|
|
|
|
|
|
|
|
|
Insurance |
|
|
|
|
| |
|
|
|
|
|
Venture |
|
|
Annuity |
|
|
|
|
| |
|
Real Estate |
|
|
Capital |
|
|
Contract |
|
|
Total |
|
Balance, December 31, 2008 |
|
$ |
116.1 |
|
|
$ |
6.2 |
|
|
$ |
4.0 |
|
|
$ |
126.3 |
|
Realized (loss) gain |
|
|
(0.5 |
) |
|
|
0.2 |
|
|
|
0.1 |
|
|
|
(0.2 |
) |
Unrealized (loss) gain |
|
|
(30.8 |
) |
|
|
(1.9 |
) |
|
|
0.5 |
|
|
|
(32.2 |
) |
Purchases, (sales),
issuances, (settlements),
net |
|
|
(0.2 |
) |
|
|
(0.3 |
) |
|
|
(0.4 |
) |
|
|
(0.9 |
) |
|
|
|
|
|
|
|
|
|
|
|
|
|
Balance, December 31, 2009 |
|
$ |
84.6 |
|
|
$ |
4.2 |
|
|
$ |
4.2 |
|
|
$ |
93.0 |
|
|
|
|
|
|
|
|
|
|
|
|
|
|
Following is a description of the valuation methodologies used for assets measured at fair value.
There have been no changes in the methodologies used at December 31, 2009 and 2008.
Long Duration Bonds: Consists of investments in individual corporate bonds as well as investments
in registered investment funds and common and collective trust funds investing in fixed income
securities tailored to institutional investors. Certain corporate bonds are valued based on a
compilation of primarily observable market information or a broker quote in a non-active market.
There are no readily available market quotations for registered investment company funds or common
collective trust funds. The fair value is based on the underlying securities in the fund’s
portfolio which is typically the amount which the fund might reasonably expect to receive for the
security upon a current sale.
Domestic and International equity securities: Consists of investments in common and preferred
stocks as well as investments in registered investment funds investing in international equities
tailored to institutional investors. Common and preferred stocks are valued at the closing price
reported on the active market on which the individual securities are traded. There are no readily
available market quotations for registered investment company funds. The fair value is based on
the underlying securities in the fund’s portfolio which is typically the amount which the fund
might reasonably expect to receive for the security upon a current sale.
High Yield Bonds: Consists of investments in individual corporate bonds as well as an investment in
a registered investment fund investing in fixed income securities tailored to institutional
investors. Certain corporate bonds are valued at the closing price reported in the active market
in which the bond is traded. There are no readily available market quotations for registered
investment company funds. The fair value is based on the underlying securities in the fund’s
portfolio which is typically the amount which the fund might reasonably expect to receive for the
security upon a current sale.
Real Estate: The RIP’s real estate investments are comprised of both open-end and closed-end
funds. There are no readily available market quotations for these real estate funds. The fund’s
fair value is based on the underlying real estate assets held by the fund. Underlying real estate
assets are valued on the basis of a discounted cash flow approach, which includes the future rental
receipts, expenses and residual values as the highest and best use of the real estate from a market
participant view. Independent appraisals may also be used to determine fair value for the
underlying assets of these funds.
Other Investments: Consists of investments in a group insurance annuity contract and a limited
partnership. The fair value for the group insurance annuity contract was determined by discounting
the related cash flows based on current yields of similar instruments with comparable durations
considering the credit-worthiness of the issuer. For our investment in the limited partnership,
the majority of the partnership’s underlying securities are invested in publicly traded securities
which are valued at the
82
Armstrong World Industries, Inc., and Subsidiaries
Notes to Consolidated Financial Statements
(dollar amounts in millions)
closing price reported on the active market on which the individual securities are traded. The
remaining other investments within the partnership are valued based on available inputs, including
recent financing rounds, comparable company valuations, and other available data. The investment
in the limited partnership is non-redeemable until the expiration of the term of the agreement.
Money Market Investments: The money market investment consists of an institutional investor mutual
fund, valued at the fund’s net asset value (“NAV”) which is normally calculated at the close of
business daily.
Cash and Other Short Term Investments: Cash and short term investments consist primarily of cash
and cash equivalents and other payables and receivables (net). The carrying amounts of cash and
cash equivalents approximate fair value due to the short-term maturity of these instruments. Other
payables and receivables consist primarily of margin on account for a fund, accrued fees and
receivables related to investment positions liquidated for which proceeds had not been received at
December 31. The carrying amounts of payables and receivables approximate fair value due to the
short-term nature of these instruments.
The RIP has $698.3 million of investments in alternative investment funds which are reported at
fair value, and we have concluded that the net asset value reported by the underlying fund
approximates the fair value of the investment. These investments are redeemable at net asset value
under agreements with the underlying funds. However, it is possible that these redemption rights
may be restricted or eliminated by the funds in the future in accordance with the underlying fund
agreements. Due to the nature of the investments held by the funds, changes in market conditions
and the economic environment may significantly impact the net asset value of the funds and,
consequently, the fair value of the RIP’s interest in the funds. Furthermore, changes to the
liquidity provisions of the funds may significantly impact the fair value of the RIP’s interest in
the funds.
Basis of Rate-of-Return Assumption
Long-term asset class return assumptions are determined based on input from investment
professionals on the expected performance of the asset classes over 10 to 20 years. The forecasts
were averaged to come up with consensus passive return forecasts for each asset class. An
incremental component was added for the expected return from active management based both on the
RIP’s experience and on historical information obtained from the RIP’s investment consultants.
These forecast gross returns were reduced by estimated management fees and expenses, yielding a
long-term return forecast of 8.00% per annum for 2009.
Amounts recognized in assets and (liabilities) at year end consist of:
| |
|
|
|
|
|
|
|
|
|
|
|
|
|
|
|
|
| |
|
|
|
|
|
|
|
|
|
Retiree Health and Life |
|
| |
|
Pension Benefits |
|
|
Insurance Benefits |
|
| |
|
2009 |
|
|
2008 |
|
|
2009 |
|
|
2008 |
|
Prepaid pension costs |
|
$ |
114.1 |
|
|
|
— |
|
|
|
— |
|
|
|
— |
|
Accounts payable and
accrued expenses |
|
|
(3.3 |
) |
|
$ |
(3.3 |
) |
|
$ |
(30.6 |
) |
|
$ |
(31.7 |
) |
Postretirement and
postemployment benefit
liabilities |
|
|
— |
|
|
|
— |
|
|
|
(296.9 |
) |
|
|
(302.6 |
) |
Pension benefit liabilities |
|
|
(40.6 |
) |
|
|
(50.8 |
) |
|
|
— |
|
|
|
— |
|
|
|
|
|
|
|
|
|
|
|
|
|
|
Net amount recognized |
|
$ |
70.2 |
|
|
$ |
(54.1 |
) |
|
$ |
(327.5 |
) |
|
$ |
(334.3 |
) |
|
|
|
|
|
|
|
|
|
|
|
|
|
83
Armstrong World Industries, Inc., and Subsidiaries
Notes to Consolidated Financial Statements
(dollar amounts in millions)
Pre-tax amounts recognized in accumulated other comprehensive income at year end consist of:
| |
|
|
|
|
|
|
|
|
|
|
|
|
|
|
|
|
| |
|
|
|
|
|
|
|
|
|
Retiree Health and Life |
|
| |
|
Pension Benefits |
|
|
Insurance Benefits |
|
| |
|
2009 |
|
|
2008 |
|
|
2009 |
|
|
2008 |
|
Net actuarial loss (gain) |
|
$ |
550.2 |
|
|
$ |
627.2 |
|
|
$ |
(46.9 |
) |
|
$ |
(46.2 |
) |
Prior service cost |
|
|
14.2 |
|
|
|
3.1 |
|
|
|
0.1 |
|
|
|
— |
|
|
|
|
|
|
|
|
|
|
|
|
|
|
Accumulated other
comprehensive loss
(income) |
|
$ |
564.4 |
|
|
$ |
630.3 |
|
|
$ |
(46.8 |
) |
|
$ |
(46.2 |
) |
|
|
|
|
|
|
|
|
|
|
|
|
|
We expect to amortize $6.2 million of previously unrecognized prior service cost and net actuarial
losses into the pension credit in 2010. We expect to amortize $2.8 million of previously
unrecognized net actuarial gains into postretirement benefit cost in 2010.
The accumulated benefit obligation for the U.S. defined benefit pension plans was $1,755.7 million
and $1,734.2 million at December 31, 2009 and 2008, respectively.
| |
|
|
|
|
|
|
|
|
| U.S. pension plans with benefit obligations in excess of assets |
|
2009 |
|
|
2008 |
|
Projected benefit obligation, December 31 |
|
$ |
43.9 |
|
|
$ |
1,755.7 |
|
Accumulated benefit obligation, December 31 |
|
|
42.8 |
|
|
|
1,734.2 |
|
Fair value of plan assets, December 31 |
|
|
— |
|
|
|
1,701.6 |
|
The decrease in U.S. pension plans with benefit obligation in excess of assets occurred primarily
because the RIP, which was underfunded at December 31, 2008, was overfunded in relation to its
benefit obligations at December 31, 2009.
The components of pension credit are as follows:
| |
|
|
|
|
|
|
|
|
|
|
|
|
| U.S. defined-benefit pension plans |
|
2009 |
|
|
2008 |
|
|
2007 |
|
Service cost of benefits earned during the period |
|
$ |
18.0 |
|
|
$ |
17.4 |
|
|
$ |
16.9 |
|
Interest cost on projected benefit obligation |
|
|
96.0 |
|
|
|
97.8 |
|
|
|
96.3 |
|
Expected return on plan assets |
|
|
(171.2 |
) |
|
|
(175.3 |
) |
|
|
(169.4 |
) |
Amortization of prior service cost |
|
|
1.8 |
|
|
|
0.3 |
|
|
|
— |
|
|
|
|
|
|
|
|
|
|
|
Net periodic pension credit |
|
$ |
(55.4 |
) |
|
$ |
(59.8 |
) |
|
$ |
(56.2 |
) |
|
|
|
|
|
|
|
|
|
|
The components of postretirement benefit costs
are as follows:
| |
|
|
|
|
|
|
|
|
|
|
|
|
| U.S. defined-benefit retiree health and life insurance plans |
|
2009 |
|
|
2008 |
|
|
2007 |
|
Service cost of benefits earned during the period |
|
$ |
1.9 |
|
|
$ |
1.7 |
|
|
$ |
1.8 |
|
Interest cost on accumulated postretirement
benefit obligation |
|
|
16.7 |
|
|
|
18.9 |
|
|
|
19.1 |
|
Amortization of net actuarial (gain) loss |
|
|
(4.4 |
) |
|
|
(1.5 |
) |
|
|
(0.9 |
) |
|
|
|
|
|
|
|
|
|
|
Net periodic postretirement benefit cost |
|
$ |
14.2 |
|
|
$ |
19.1 |
|
|
$ |
20.0 |
|
|
|
|
|
|
|
|
|
|
|
84
Armstrong World Industries, Inc., and Subsidiaries
Notes to Consolidated Financial Statements
(dollar amounts in millions)
For measurement purposes, average rates of annual increase in the per capita cost of covered health
care benefits of 8.5% for pre-65 retirees and 9.0% for post-65 retirees were assumed for 2010,
decreasing 1% per year to an ultimate rate of 5%. Assumed health care cost trend rates have a
significant effect on the amounts reported for the health care plans. A one-percentage-point
change in assumed health care cost trend rates would have the following effects:
| |
|
|
|
|
|
|
|
|
| |
|
One percentage point |
|
| U.S. retiree health and life insurance benefit plans |
|
Increase |
|
|
Decrease |
|
Effect on total service and interest cost components |
|
$ |
0.4 |
|
|
$ |
(0.4 |
) |
Effect on postretirement benefit obligation |
|
|
7.8 |
|
|
|
(7.4 |
) |
We expect to contribute $3.3 million to our U.S. defined benefit pension plans and $30.5 million to
our U.S. postretirement benefit plans in 2010.
The following benefit payments, which reflect expected future service, as appropriate, are expected
to be paid over the next ten years for our U.S. plans:
| |
|
|
|
|
|
|
|
|
|
|
|
|
| |
|
|
|
|
|
Retiree Health and |
|
|
Retiree Health |
|
| |
|
|
|
|
|
Life Insurance |
|
|
Medicare Subsidy |
|
| |
|
Pension Benefits |
|
|
Benefits, Gross |
|
|
Receipts |
|
2010 |
|
$ |
119.3 |
|
|
$ |
32.2 |
|
|
$ |
(1.7 |
) |
2011 |
|
|
122.6 |
|
|
|
32.9 |
|
|
|
(1.8 |
) |
2012 |
|
|
122.4 |
|
|
|
32.7 |
|
|
|
(2.0 |
) |
2013 |
|
|
125.0 |
|
|
|
32.1 |
|
|
|
(2.1 |
) |
2014 |
|
|
126.8 |
|
|
|
31.2 |
|
|
|
(2.2 |
) |
2015-2019 |
|
|
654.2 |
|
|
|
139.7 |
|
|
|
(13.4 |
) |
These estimated benefit payments are based on assumptions about future events. Actual benefit
payments may vary significantly from these estimates.
85
Armstrong World Industries, Inc., and Subsidiaries
Notes to Consolidated Financial Statements
(dollar amounts in millions)
NON-U.S. PLANS
We have defined benefit pension plans covering employees in a number of foreign countries that
utilize assumptions which are consistent with, but not identical to, those of the U.S. plans. The
following tables summarize the balance sheet impact of foreign pension benefit plans, as well as
the related benefit obligations, assets, funded status and rate assumptions.
We use a December 31 measurement date for all of our non-U.S. defined benefit plans.
| |
|
|
|
|
|
|
|
|
| Non-U.S. defined-benefit plans |
|
2009 |
|
|
2008 |
|
Change in benefit obligation: |
|
|
|
|
|
|
|
|
Benefit obligation as of beginning of period |
|
$ |
329.2 |
|
|
$ |
403.0 |
|
Service cost |
|
|
5.1 |
|
|
|
5.6 |
|
Interest cost |
|
|
19.3 |
|
|
|
21.3 |
|
Plan participants’ contributions |
|
|
2.0 |
|
|
|
2.1 |
|
Foreign currency translation adjustment |
|
|
18.7 |
|
|
|
(50.2 |
) |
Effect of plan curtailment |
|
|
(0.2 |
) |
|
|
— |
|
Actuarial loss (gain) |
|
|
36.2 |
|
|
|
(28.1 |
) |
Benefits paid |
|
|
(24.5 |
) |
|
|
(24.5 |
) |
|
|
|
|
|
|
|
Benefit obligation as of end of period |
|
$ |
385.8 |
|
|
$ |
329.2 |
|
|
|
|
|
|
|
|
|
|
|
|
|
|
|
|
|
Change in plan assets: |
|
|
|
|
|
|
|
|
Fair value of plan assets as of beginning of period |
|
$ |
156.1 |
|
|
$ |
246.0 |
|
Actual return on plan assets — gain (loss) |
|
|
23.2 |
|
|
|
(39.8 |
) |
Employer contributions |
|
|
17.7 |
|
|
|
18.9 |
|
Plan participants’ contributions |
|
|
2.0 |
|
|
|
2.1 |
|
Foreign currency translation adjustment |
|
|
15.8 |
|
|
|
(46.6 |
) |
Benefits paid |
|
|
(24.5 |
) |
|
|
(24.5 |
) |
|
|
|
|
|
|
|
Fair value of plan assets as of end of period |
|
$ |
190.3 |
|
|
$ |
156.1 |
|
|
|
|
|
|
|
|
|
|
|
|
|
|
|
|
|
Funded status of the plans |
|
$ |
(195.5 |
) |
|
$ |
(173.1 |
) |
| |
|
|
|
|
|
|
|
|
| Non-U.S. defined-benefit plans |
|
2009 |
|
|
2008 |
|
Weighted-average assumptions used to determine
benefit obligations at end of period: |
|
|
|
|
|
|
|
|
Discount rate |
|
|
5.1 |
% |
|
|
5.9 |
% |
Rate of compensation increase |
|
|
3.3 |
% |
|
|
3.4 |
% |
| |
Weighted-average assumptions used to determine
net periodic benefit cost for the period: |
|
|
|
|
|
|
|
|
Discount rate |
|
|
5.8 |
% |
|
|
5.5 |
% |
Expected return on plan assets |
|
|
6.5 |
% |
|
|
6.7 |
% |
Rate of compensation increase |
|
|
3.4 |
% |
|
|
3.5 |
% |
Investment Policies
Each of the funded non-US pension plan’s primary investment objective is to earn sufficient
long-term returns on investments both to increase the ratio of the assets to liabilities in order
for the plans to meet their benefits obligations, and to minimize required cash contributions to
the plans. This is to be achieved by (a) investing primarily in publicly-traded equities, (b)
limiting return volatility by diversifying investments among additional asset classes with
differing expected rates of return and return correlations, and (c) utilizing long duration bonds
to limit the volatility of the plans’ asset/liability ratios.
86
Armstrong World Industries, Inc., and Subsidiaries
Notes to Consolidated Financial Statements
(dollar amounts in millions)
Each of the plans has a targeted asset allocation for each asset class. The table below shows, for
each asset class, the weighted average of the several plans’ asset allocation targets and positions
at December 31, 2009 and 2008:
| |
|
|
|
|
|
|
|
|
|
|
|
|
| |
|
Target Weight at |
|
|
Position at December 31, |
|
| Asset Class |
|
December 31, 2009 |
|
|
2009 |
|
|
2008 |
|
Equities |
|
|
54 |
% |
|
|
60 |
% |
|
|
56 |
% |
Long duration bonds |
|
|
27 |
% |
|
|
26 |
% |
|
|
26 |
% |
Other fixed income |
|
|
9 |
% |
|
|
8 |
% |
|
|
12 |
% |
Real estate |
|
|
10 |
% |
|
|
6 |
% |
|
|
6 |
% |
The following table sets forth by level within the fair value hierarchy a summary of our non-U.S.
plan assets measured at fair value on a recurring basis as of December 31, 2009:
| |
|
|
|
|
|
|
|
|
|
|
|
|
| Description |
|
Level 1 |
|
|
Level 2 |
|
|
Total |
|
Bonds |
|
|
— |
|
|
$ |
64.4 |
|
|
$ |
64.4 |
|
Equities |
|
$ |
4.3 |
|
|
|
110.0 |
|
|
|
114.3 |
|
Real estate |
|
|
— |
|
|
|
11.1 |
|
|
|
11.1 |
|
Cash and other short term
investments |
|
|
0.5 |
|
|
|
— |
|
|
|
0.5 |
|
|
|
|
|
|
|
|
|
|
|
Net assets |
|
$ |
4.8 |
|
|
$ |
185.5 |
|
|
$ |
190.3 |
|
|
|
|
|
|
|
|
|
|
|
Following is a description of the valuation methodologies used for non-U.S. plan assets measured at
fair value. There have been no changes in the methodologies used at December 31, 2009 and 2008.
Bonds: Consists of investments in individual corporate bonds as well as investments in registered
investment funds and common and collective trust funds investing in fixed income securities
tailored to institutional investors. Certain corporate bonds are valued at the closing price
reported in the active market in which the bond is traded. There are no readily available market
quotations for registered investment company funds or common collective trust funds. The fair
value is based on the underlying securities in the fund’s portfolio which is typically the amount
which the fund might reasonably expect to receive for the security upon a current sale.
Equities: Consists of investments in common and preferred stocks as well as investments in
registered investment funds investing in international equities tailored to institutional
investors. Equity securities are valued at the closing price reported on the active market on
which the individual securities are traded. There are no readily available market quotations for
registered investment company funds. The fair value is based on the underlying securities in the
fund’s portfolio which is typically the amount which the fund might reasonably expect to receive
for the security upon a current sale.
Real Estate: The plans’ real estate investments are comprised of pooled real estate mutual funds
valued based on a compilation of primarily observable market information or a broker quote in a
non-active market.
Cash and other Short Term Investments: Cash and short term investments consist primarily of cash
and cash equivalents. The carrying amounts of cash and cash equivalents approximate fair value due
to the short-term maturity of these instruments.
The non-U.S. pension plans have $179.9 million of investments in alternative investment funds which
are reported at fair value, and we have concluded that the net asset value reported by the
underlying fund approximates the fair value of the investment. These investments are redeemable at
net asset value
87
Armstrong World Industries, Inc., and Subsidiaries
Notes to Consolidated Financial Statements
(dollar amounts in millions)
under agreements with the underlying funds. However, it is possible that these redemption rights
may be restricted or eliminated by the funds in the future in accordance with the underlying fund
agreements. Due to the nature of the investments held by the funds, changes in market conditions
and the economic environment may significantly impact the net asset value of the funds and,
consequently, the fair value of the plans’ interest in the funds. Furthermore, changes to the
liquidity provisions of the funds may significantly impact the fair value of the plans’ interest in
the funds.
Basis of Rate-of-Return Assumption
Long-term asset class return forecasts were obtained from investment professionals. The forecasts
were averaged to come up with consensus passive return forecasts for each asset class. These
forecast asset class returns were weighted by the plans’ target asset class weights, yielding a
long-term return forecast of 6.5% for the year ended December 31, 2009 and 6.7% for the year ended
December 31, 2008.
Amounts recognized in the consolidated balance sheets consist of:
| |
|
|
|
|
|
|
|
|
| |
|
2009 |
|
|
2008 |
|
Prepaid pension costs |
|
$ |
0.1 |
|
|
$ |
0.3 |
|
Accounts payable and accrued expenses |
|
|
(12.8 |
) |
|
|
(12.8 |
) |
Pension benefit liabilities |
|
|
(182.8 |
) |
|
|
(160.6 |
) |
|
|
|
|
|
|
|
Net amount recognized |
|
$ |
(195.5 |
) |
|
$ |
(173.1 |
) |
|
|
|
|
|
|
|
Pre-tax amounts recognized in accumulated other comprehensive income at year end consist of:
| |
|
|
|
|
|
|
|
|
| |
|
2009 |
|
|
2008 |
|
Net actuarial loss (gain) |
|
$ |
14.4 |
|
|
$ |
(14.1 |
) |
|
|
|
|
|
|
|
Accumulated other comprehensive loss (income) |
|
$ |
14.4 |
|
|
$ |
(14.1 |
) |
|
|
|
|
|
|
|
We expect to amortize $0.4 million of previously unrecognized net actuarial losses into pension
cost in 2010.
The accumulated benefit obligation for the non-U.S. defined benefit pension plans was $360.2
million and $309.0 million at December 31, 2009 and 2008, respectively.
| |
|
|
|
|
|
|
|
|
| Non-U.S. pension plans with benefit obligations in excess of assets |
|
2009 |
|
|
2008 |
|
Projected benefit obligation, December 31 |
|
$ |
384.6 |
|
|
$ |
328.3 |
|
Accumulated benefit obligation, December 31 |
|
|
359.1 |
|
|
|
308.1 |
|
Fair value of plan assets, December 31 |
|
|
189.0 |
|
|
|
154.9 |
|
The components of pension cost are as follows:
| |
|
|
|
|
|
|
|
|
|
|
|
|
| Non-U.S. defined-benefit plans |
|
2009 |
|
|
2008 |
|
|
2007 |
|
Service cost of benefits earned during the period |
|
$ |
5.1 |
|
|
$ |
5.6 |
|
|
$ |
6.9 |
|
Interest cost on projected benefit obligation |
|
|
19.3 |
|
|
|
21.3 |
|
|
|
19.2 |
|
Expected return on plan assets |
|
|
(12.8 |
) |
|
|
(16.0 |
) |
|
|
(15.4 |
) |
Amortization of net actuarial gain |
|
|
(0.9 |
) |
|
|
(0.5 |
) |
|
|
— |
|
|
|
|
|
|
|
|
|
|
|
Net periodic pension cost |
|
$ |
10.7 |
|
|
$ |
10.4 |
|
|
$ |
10.7 |
|
|
|
|
|
|
|
|
|
|
|
We expect to contribute $17.6 million to our non-U.S. defined benefit pension plans in 2010.
88
Armstrong World Industries, Inc., and Subsidiaries
Notes to Consolidated Financial Statements
(dollar amounts in millions)
The following benefit payments, which reflect expected future service, as appropriate, are expected
to be paid over the next ten years:
| |
|
|
|
|
| |
|
Pension Benefits |
|
2010 |
|
$ |
22.2 |
|
2011 |
|
|
22.5 |
|
2012 |
|
|
21.4 |
|
2013 |
|
|
23.0 |
|
2014 |
|
|
24.5 |
|
2015-2019 |
|
|
125.6 |
|
Costs for other worldwide defined contribution benefit plans and multiemployer pension plans were
$13.3 million in 2009, $14.8 million in 2008 and $15.2 million in 2007.
NOTE 18. FINANCIAL INSTRUMENTS
We do not hold or issue financial instruments for trading purposes. The estimated fair values of
our financial instruments are as follows:
| |
|
|
|
|
|
|
|
|
|
|
|
|
|
|
|
|
| |
|
December 31, 2009 |
|
|
December 31, 2008 |
|
| |
|
Carrying |
|
|
Estimated |
|
|
Carrying |
|
|
Estimated |
|
| |
|
amount |
|
|
Fair Value |
|
|
amount |
|
|
Fair Value |
|
Assets/(Liabilities): |
|
|
|
|
|
|
|
|
|
|
|
|
|
|
|
|
Money market investments |
|
$ |
250.1 |
|
|
$ |
250.1 |
|
|
$ |
192.1 |
|
|
$ |
192.1 |
|
Long-term debt, including current portion |
|
|
(472.5 |
) |
|
|
(462.1 |
) |
|
|
(495.7 |
) |
|
|
(405.0 |
) |
Foreign currency contract obligations |
|
|
(4.1 |
) |
|
|
(4.1 |
) |
|
|
7.4 |
|
|
|
7.4 |
|
Natural gas contracts |
|
|
(4.6 |
) |
|
|
(4.6 |
) |
|
|
(13.5 |
) |
|
|
(13.5 |
) |
The carrying amounts of cash and cash equivalents (which consists primarily of money market
investments totaling $250.1 million and bank deposits totaling $319.4 million at December 31,
2009), receivables, accounts payable and accrued expenses, short-term debt and current installments
of long-term debt approximate fair value because of the short-term maturity of these instruments.
The fair value estimates of long-term debt were based upon quotes from a major financial
institution of recently observed trading levels of our Term Loan B debt. The fair value estimates
of foreign currency contract obligations are estimated from national exchange quotes. The fair
value estimates of natural gas contracts are estimated by obtaining quotes from major financial
institutions with verification using internal valuation models.
Refer to Note 17 for a discussion of fair value and the related inputs used to measure fair value.
Assets and liabilities measured at fair value on a recurring basis are summarized below:
| |
|
|
|
|
|
|
|
|
|
|
|
|
|
|
|
|
| |
|
December 31, 2009 |
|
|
December 31, 2008 |
|
| |
|
Fair value based on |
|
|
Fair value based on |
|
| |
|
Quoted, |
|
|
Other |
|
|
Quoted, |
|
|
Other |
|
| |
|
active |
|
|
observable |
|
|
active |
|
|
observable |
|
| |
|
markets |
|
|
inputs |
|
|
markets |
|
|
inputs |
|
| |
|
Level 1 |
|
|
Level 2 |
|
|
Level 1 |
|
|
Level 2 |
|
Assets/(Liabilities): |
|
|
|
|
|
|
|
|
|
|
|
|
|
|
|
|
Money market investments |
|
$ |
250.1 |
|
|
|
— |
|
|
$ |
192.1 |
|
|
|
— |
|
Foreign currency contract obligations |
|
|
(4.1 |
) |
|
|
— |
|
|
|
7.4 |
|
|
|
— |
|
Natural gas contracts |
|
|
— |
|
|
$ |
(4.6 |
) |
|
|
— |
|
|
$ |
(13.5 |
) |
We do not have any financial assets or liabilities that are valued using Level 3 (unobservable)
inputs.
89
Armstrong World Industries, Inc., and Subsidiaries
Notes to Consolidated Financial Statements
(dollar amounts in millions)
NOTE 19. DERIVATIVE FINANCIAL INSTRUMENTS
We are exposed to market risk from changes in foreign exchange rates, interest rates and commodity
prices that could impact our results of operations and financial condition. We use forward swaps
and option contracts to hedge these exposures. Exposure to individual counterparties is controlled
and derivative financial instruments are entered into with a diversified group of major financial
institutions. Forward swaps and option contracts are entered into for periods consistent with
underlying exposure and do not constitute positions independent of those exposures. At inception,
we formally designate and document our derivatives as either (1) a hedge of a forecasted
transaction or “cash flow” hedge, or (2) a hedge of the fair value of a recognized liability or
asset or “fair value” hedge. We also formally assess both at inception and at least quarterly
thereafter, whether the derivatives that are used in hedging transactions are highly effective in
offsetting changes in either the fair value or cash flows of the hedged item. If it is determined
that a derivative ceases to be a highly effective hedge, or if the anticipated transaction is no
longer probable of occurring, we discontinue hedge accounting, and any future mark to market
adjustments are recognized in earnings. We use derivative financial instruments as risk management
tools and not for speculative trading purposes.
Counter Party Risk
We only enter into derivative transactions with established counterparties having a credit rating
of A or better. We monitor counterparty credit default swap levels and credit ratings on a regular
basis. All of our derivative transactions with counterparties are governed by master International
Swap Dealer Agreements (“ISDA’s”) with netting arrangements. These agreements can limit our
exposure in situations where we have gain and loss positions outstanding with a single
counterparty. We generally do not post nor receive cash collateral with any counterparty for our
derivative transactions. As of December 31, 2009 we had no cash collateral posted or received for
any of our derivative transactions. These ISDA agreements do not have any credit contingent
features; however, a default under our bank credit facility would trigger a default under these
agreements. Exposure to individual counterparties is controlled, and thus we consider the risk of
counterparty default to be negligible.
Commodity Price Risk — We purchase natural gas for use in the manufacture of ceiling tiles
and other products, and to heat many of our facilities. As a result, we are exposed to movements
in the price of natural gas. We have a policy to reduce cost volatility for North American natural
gas purchases by purchasing natural gas forward contracts and swaps, purchased call options, and
zero-cost collars up to 15 months forward to reduce our overall exposure to natural gas price
movements. There is a high correlation between the hedged item and the hedged instrument. The
gains and losses on these transactions offset gains and losses on the transactions being hedged.
These instruments are designated as cash flow hedges. At December 31, 2009 the notional amount of
these hedges was 4.6 Million British Thermal Units (“MMBTU’s”). The mark-to-market gain or loss on
qualifying hedges is included in other comprehensive income to the extent effective, and
reclassified into cost of goods sold in the period during which the underlying gas is consumed.
The mark-to-market gains or losses on ineffective portions of hedges are recognized in cost of
goods sold immediately. The earnings impact of the ineffective portion of these hedges was not
material for the year ended December 31, 2009. The contracts are based on forecasted usage of
natural gas measured in MMBTU’s.
As of June 30, 2009 we de-designated several monthly natural gas hedge contracts maturing in 2009
and 2010 due to their over hedged positions. The over hedged positions were due to updated
projected production volumes (and gas usage) at our U.S. ceilings plants that were significantly
lower than originally forecasted when the hedges were entered. We discontinued hedge accounting on
the hedges and re-designated a portion of the original contracts based upon our revised forecasts,
which have been designated as cash flow hedges. Starting in July 2009 the fair value adjustments
for the portion of the derivative contracts not designated as a hedge have been recognized in cost
of goods sold. The earnings impact related to the over hedged portion of these hedges was not
material for the year ended December 31, 2009.
90
Armstrong World Industries, Inc., and Subsidiaries
Notes to Consolidated Financial Statements
(dollar amounts in millions)
Currency Rate Risk —
Sales and Purchases — We manufacture and sell our products in a number of countries
throughout the world and, as a result we are exposed to movements in foreign currency exchange
rates. To a large extent, our global manufacturing and sales provide a natural hedge of foreign
currency exchange rate movement, as foreign currency expenses generally offset foreign currency
revenues. We manage our cash flow exposures on a net basis and use derivatives to hedge the
majority of our unmatched foreign currency cash inflows and outflows. At December 31, 2009, our
major foreign currency exposures are to the Euro, the Canadian dollar, and the British pound.
We use foreign currency forward exchange contracts to reduce our exposure to the risk that the
eventual net cash inflows and outflows, resulting from the sale of products to foreign customers
and purchases from foreign suppliers, will be adversely affected by changes in exchange rates.
These derivative instruments are used for forecasted transactions and are classified as cash flow
hedges. Cash flow hedges are executed quarterly up to 15 months forward and allow us to further
reduce our overall exposure to exchange rate movements, since gains and losses on these contracts
offset gains and losses on the transactions being hedged. The notional amount of these hedges was
$86.7 million at December 31, 2009. Gains and losses on these instruments are deferred in other
comprehensive income, to the extent effective, until the underlying transaction is recognized in
earnings. The earnings impact of the ineffective portion of these hedges was not material for the
year ended December 31, 2009.
Intercompany Loan Hedges — We also use foreign currency forward exchange contracts to hedge
exposures created by cross-currency intercompany loans. The underlying intercompany loans are
classified as short-term and translation adjustments related to these loans are recorded in other
non-operating income or expense. The offsetting gains or losses on the related derivative
contracts are also recorded in other non-operating income or expense. These contracts are
decreased or increased as repayments are made or additional intercompany loans are extended. The
notional amount of these hedges was $8.3 million at December 31, 2009.
Interest Rate Risk — We utilize interest rate swaps to minimize the fluctuations in
earnings caused by interest rate volatility. Interest expense on variable-rate debt increases or decreases as a result of interest rate fluctuations. In February 2009 we entered into
interest rate swaps with a total notional amount of $100 million that matured in December 2009.
Under the terms of the swaps, we received 1-month LIBOR and paid a fixed rate over the hedged
period. These swaps were designated as cash flow hedges against changes in LIBOR for a portion of
our variable rate debt during their contract period.
91
Armstrong World Industries, Inc., and Subsidiaries
Notes to Consolidated Financial Statements
(dollar amounts in millions)
Financial Statement Impacts
The following tables detail amounts related to our derivatives as of December 31, 2009.
| |
|
|
|
|
|
|
|
|
| |
|
Asset Derivatives |
|
| |
|
Balance Sheet |
|
|
Fair |
|
| |
|
Location |
|
Value |
|
Derivatives designated as hedging instruments |
|
|
|
|
|
|
|
|
Foreign exchange contracts — purchases and sales |
|
Other current assets |
|
$ |
0.2 |
|
|
|
|
|
|
|
|
|
Total derivative assets designated as hedging instruments |
|
|
|
|
|
$ |
0.2 |
|
|
|
|
|
|
|
|
|
|
|
|
|
|
|
|
|
|
Derivatives not designated as hedging instruments |
|
|
|
|
|
|
|
|
Foreign exchange contracts — intercompany loans |
|
Other current assets |
|
$ |
0.1 |
|
|
|
|
|
|
|
|
|
Total derivative assets not designated as hedging instruments |
|
|
|
|
|
$ |
0.1 |
|
|
|
|
|
|
|
|
|
| |
|
|
|
|
|
|
|
|
| |
|
Liability Derivatives |
|
| |
|
Balance Sheet |
|
|
Fair |
|
| Derivatives designated as hedging instruments |
|
Location |
|
Value |
|
Natural gas commodity contracts |
|
Accounts payable and accrued expenses |
|
$ |
3.6 |
|
Natural gas commodity contracts |
|
Other long-term liabilities |
|
|
0.2 |
|
Foreign exchange contracts — purchases and sales |
|
Accounts payable and accrued expenses |
|
|
4.3 |
|
|
|
|
|
|
|
|
|
Total derivative liabilities designated as hedging instruments |
|
|
|
|
|
$ |
8.1 |
|
|
|
|
|
|
|
|
|
| |
|
|
|
|
|
|
|
|
| |
|
Liability Derivatives |
|
| |
|
Balance Sheet |
|
|
Fair |
|
| Derivatives not designated as hedging instruments |
|
Location |
|
Value |
|
Natural gas commodity contracts |
|
Accounts payable and accrued expenses |
|
$ |
0.8 |
|
Foreign exchange contracts — intercompany loans |
|
Accounts payable and accrued expenses |
|
|
0.1 |
|
|
|
|
|
|
|
|
|
Total derivative liabilities not designated as hedging instruments |
|
|
|
|
|
$ |
0.9 |
|
|
|
|
|
|
|
|
|
| |
|
|
|
|
| |
|
Amount of Gain/(Loss) |
|
| |
|
Recognized in Other |
|
| |
|
Comprehensive |
|
| |
|
Income (“OCI”) |
|
| Derivatives in Cash Flow Hedging Relationships |
|
(Effective Portion) |
|
Natural gas commodity contracts |
|
$ |
(4.3 |
) |
Foreign exchange contracts — purchases and sales |
|
|
(4.1 |
) |
|
|
|
|
Total |
|
$ |
(8.4 |
) |
|
|
|
|
92
Armstrong World Industries, Inc., and Subsidiaries
Notes to Consolidated Financial Statements
(dollar amounts in millions)
| |
|
|
|
|
|
|
|
|
| |
|
Gain/(Loss) Reclassified from Accumulated |
|
| |
|
OCI into Income (Effective Portion) (a) |
|
| |
|
|
|
|
|
Year Ended |
|
| |
|
|
|
|
|
December 31, 2009 |
|
| Derivatives in Cash Flow Hedging Relationships |
|
Location |
|
|
Amount |
|
Natural gas commodity contracts |
|
Cost of goods sold |
|
$ |
(22.4 |
) |
Foreign exchange contracts —
purchases and sales |
|
Cost of goods sold |
|
|
1.4 |
|
|
|
|
|
|
|
|
|
Total |
|
|
|
|
|
$ |
(21.0 |
) |
|
|
|
|
|
|
|
|
| |
|
|
| (a) |
|
As of December 31, 2009 the amount of existing (losses) in AOCI expected to be
recognized in earnings over the next twelve months is $(8.2) million. |
| |
|
|
| |
|
Location of |
| |
|
Gain/(Loss) |
| |
|
Recognized in Income |
| |
|
on Derivative |
| |
|
(Ineffective Portion) |
| Derivatives in Cash Flow Hedging Relationships |
|
(b) |
Natural gas commodity contracts |
|
Cost of goods sold |
Foreign exchange contracts — purchases and sales |
|
SG&A expense |
Interest rate swap contracts |
|
Interest expense |
| |
|
|
| (b) |
|
The loss recognized in income for the year ended December 31, 2009 of $0.9 million
related to the ineffective portion of the hedging relationships. No gains or losses are
excluded from the assessment of hedge effectiveness. |
The amount of loss recognized in income for derivative instruments not designated as hedging
instruments was $1.0 million for the year ended December 31, 2009.
NOTE 20. GUARANTEES
In disposing of assets, AWI and some subsidiaries have entered into contracts that included various
indemnity provisions, covering such matters as taxes, environmental liabilities and asbestos and
other litigation. Some of these contracts have exposure limits, but many do not. Due to the
nature of the indemnities, it is not possible to estimate the potential maximum exposure under
these contracts. For contracts under which an indemnity claim has been received, a liability of
$5.4 million has been recorded as of December 31, 2009.
93
Armstrong World Industries, Inc., and Subsidiaries
Notes to Consolidated Financial Statements
(dollar amounts in millions)
NOTE 21. PRODUCT WARRANTIES
We provide direct customer and end-user warranties for our products. These warranties cover
manufacturing defects that would prevent the product from performing in line with its intended and
marketed use. The terms of these warranties vary by product and generally provide for the repair
or replacement of the defective product. We collect and analyze warranty claims data with a focus
on the historic amount of claims, the products involved, the amount of time between the warranty
claims and their respective sales and the amount of current sales. The following table summarizes
the activity for the accrual of product warranties for 2009 and 2008:
| |
|
|
|
|
|
|
|
|
| |
|
2009 |
|
|
2008 |
|
Balance at beginning of year |
|
$ |
16.3 |
|
|
$ |
17.6 |
|
Reductions for payments |
|
|
(20.4 |
) |
|
|
(25.2 |
) |
Current period warranty accruals |
|
|
18.7 |
|
|
|
25.4 |
|
Preexisting warranty accrual changes |
|
|
(0.5 |
) |
|
|
(1.2 |
) |
Effects of foreign exchange translation |
|
|
— |
|
|
|
(0.3 |
) |
|
|
|
|
|
|
|
Balance at end of year |
|
$ |
14.1 |
|
|
$ |
16.3 |
|
|
|
|
|
|
|
|
The warranty reserve is recorded as a reduction of sales and accounts receivable.
NOTE 22. OTHER LONG-TERM LIABILITIES
| |
|
|
|
|
|
|
|
|
| |
|
December 31, |
|
|
December 31, |
|
| |
|
2009 |
|
|
2008 |
|
Long-term deferred compensation arrangements |
|
$ |
29.8 |
|
|
$ |
30.4 |
|
U.S. workers’ compensation |
|
|
11.9 |
|
|
|
13.4 |
|
Environmental liabilities |
|
|
6.3 |
|
|
|
6.5 |
|
Other |
|
|
10.0 |
|
|
|
12.1 |
|
|
|
|
|
|
|
|
Total other long-term liabilities |
|
$ |
58.0 |
|
|
$ |
62.4 |
|
|
|
|
|
|
|
|
NOTE 23. STOCK-BASED COMPENSATION PLANS
The 2006 Long-Term Incentive Plan (“2006 Plan”) authorizes us to issue stock options, stock
appreciation rights, restricted stock awards, stock units, performance-based awards and cash awards
to officers and key employees. No more than 5,349,000 common shares may be issued under the 2006
Plan, and the 2006 Plan will terminate on October 2, 2016, after which time no further awards may
be made. As of December 31, 2009, 2,775,740 shares were available for future grants under the 2006
plan.
For grants made between our Chapter 11 emergence on October 2, 2006 and October 17, 2006, options
were granted to purchase shares at a price equal to the volume weighted average closing price of
the shares for the period October 18, 2006 through October 31, 2006. For grants made on or after
October 18, 2006, options were granted to purchase shares at prices equal to the closing market
price of the shares on the dates the options were granted. The options generally become
exercisable in two to four years and expire 10 years from the date of grant.
94
Armstrong World Industries, Inc., and Subsidiaries
Notes to Consolidated Financial Statements
(dollar amounts in millions)
In August 2009 TPG and the Asbestos PI Trust entered into an agreement whereby TPG purchased
7,000,000 shares of AWI common stock from the Asbestos PI Trust, and acquired an economic interest
in an additional 1,039,777 shares from the Asbestos PI Trust. The Asbestos PI Trust and TPG
together hold more than 60% of AWI’s outstanding shares and have entered into a shareholders’
agreement pursuant to which the Asbestos PI Trust and TPG have agreed to vote their shares together
on certain matters. Under the terms of the 2006 Plan, a change in control occurred, causing the
accelerated vesting of all unvested stock-based compensation. The non-cash charge to earnings
related to this accelerated vesting was $31.6 million and was recorded within SG&A expenses in the
third quarter of 2009.
| |
|
|
|
|
|
|
|
|
|
|
|
|
|
|
|
|
| |
|
Year Ended December 31, 2009 |
|
| |
|
|
|
|
|
|
|
|
|
Weighted- |
|
|
|
|
| |
|
|
|
|
|
Weighted- |
|
|
average |
|
|
Aggregate |
|
| |
|
Number of |
|
|
average |
|
|
remaining |
|
|
intrinsic |
|
| |
|
shares |
|
|
exercise |
|
|
contractual |
|
|
value |
|
| |
|
(thousands) |
|
|
price |
|
|
term (years) |
|
|
(millions) |
|
Option shares outstanding at beginning of period |
|
|
1,532.9 |
|
|
$ |
29.85 |
|
|
|
|
|
|
|
|
|
Options granted |
|
|
434.9 |
|
|
|
13.46 |
|
|
|
|
|
|
|
|
|
Option shares exercised |
|
|
(79.3 |
) |
|
|
(29.37 |
) |
|
|
|
|
|
$ |
1.0 |
|
Options forfeited |
|
|
(261.0 |
) |
|
|
(27.37 |
) |
|
|
|
|
|
|
|
|
|
|
|
|
|
|
|
|
|
|
|
|
|
|
|
Option shares outstanding at end of period |
|
|
1,627.5 |
|
|
$ |
25.87 |
|
|
|
7.3 |
|
|
$ |
21.3 |
|
|
|
|
|
|
|
|
|
|
|
|
|
|
|
|
|
|
Option shares exercisable at end of period |
|
|
1,627.5 |
|
|
|
25.87 |
|
|
|
7.3 |
|
|
$ |
21.3 |
|
Option shares expected to vest |
|
|
— |
|
|
|
— |
|
|
|
|
|
|
|
|
|
| |
|
|
|
|
|
|
|
|
|
|
|
|
|
|
|
|
| |
|
Year Ended December 31, 2008 |
|
| |
|
|
|
|
|
|
|
|
|
Weighted- |
|
|
|
|
| |
|
|
|
|
|
Weighted- |
|
|
average |
|
|
Aggregate |
|
| |
|
Number of |
|
|
average |
|
|
remaining |
|
|
intrinsic |
|
| |
|
shares |
|
|
exercise |
|
|
contractual |
|
|
value |
|
| |
|
(thousands) |
|
|
price |
|
|
term (years) |
|
|
(millions) |
|
Option shares outstanding at beginning of period |
|
|
1,569.8 |
|
|
$ |
38.99 |
|
|
|
|
|
|
|
|
|
Options granted |
|
|
195.7 |
|
|
|
29.73 |
|
|
|
|
|
|
|
|
|
Option adjustment for March dividend (see below) |
|
|
95.8 |
|
|
|
29.16 |
|
|
|
|
|
|
|
|
|
Option shares exercised |
|
|
— |
|
|
|
— |
|
|
|
|
|
|
|
|
|
Options forfeited |
|
|
(328.4 |
) |
|
|
(31.02 |
) |
|
|
|
|
|
|
|
|
|
|
|
|
|
|
|
|
|
|
|
|
|
|
|
Option shares outstanding at end of period |
|
|
1,532.9 |
|
|
$ |
29.85 |
|
|
|
7.9 |
|
|
|
— |
|
|
|
|
|
|
|
|
|
|
|
|
|
|
|
|
|
|
Option shares exercisable at end of period |
|
|
505.8 |
|
|
|
29.85 |
|
|
|
7.9 |
|
|
|
— |
|
Option shares expected to vest |
|
|
936.6 |
|
|
|
30.17 |
|
|
|
|
|
|
|
— |
|
We have reserved sufficient authorized shares to allow us to issue new shares upon exercise of all
outstanding options. When options are actually exercised, we issue new shares, use treasury shares
(if available), acquire shares held by investors, or a combination of these alternatives in order
to satisfy the option exercises. The total value of options exercised during the year ended
December 31, 2009 was $1.2 million. Cash proceeds received from options exercised for the year
ended December 31, 2009 were $2.3 million.
95
Armstrong World Industries, Inc., and Subsidiaries
Notes to Consolidated Financial Statements
(dollar amounts in millions)
The fair value of option grants was estimated on the date of grant using the Black-Scholes option
pricing model. The weighted average assumptions for the years 2009, 2008 and 2007 are presented in
the table below.
| |
|
|
|
|
|
|
|
|
|
|
|
|
| |
|
2009 |
|
|
2008 |
|
|
2007 |
|
Weighted-average grant date fair value of
options granted (dollars per option) |
|
$ |
4.77 |
|
|
$ |
12.21 |
|
|
$ |
20.64 |
|
Assumptions |
|
|
|
|
|
|
|
|
|
|
|
|
Risk free rate of return |
|
|
2.1 |
% |
|
|
3.2 |
% |
|
|
4.8 |
% |
Expected volatility |
|
|
32.7 |
% |
|
|
29.8 |
% |
|
|
30.2 |
% |
Expected term (in years) |
|
|
6.0 |
|
|
|
6.0 |
|
|
|
6.0 |
|
Expected dividend yield |
|
|
0.0 |
% |
|
|
0.0 |
% |
|
|
0.0 |
% |
The risk free rate of return is determined based on the implied yield available on zero coupon U.S.
Treasury bills at the time of grant with a remaining term equal to the expected term of the option.
Because reorganized Armstrong’s stock has only been trading since the fourth quarter of 2006, the
expected volatility is established based on an average of the actual historical volatilities of the
stock prices of a peer group of companies. The expected life is the midpoint of the average
vesting period and the contractual life of the grant. For the same reasons mentioned earlier we
are using an allowable simplified method to determine an appropriate expected term for our option
valuation assumptions. The expected dividend yield is assumed to be zero because, at the time of
each grant, we had no plans to declare a dividend. The assumptions outlined above are applicable
to all option grants.
Under the terms of the 2006 Plan, the Management Development and Compensation Committee of our
Board of Directors is required to make equitable adjustments to stock option grants if there is a
change in our capital structure. The special cash dividend in 2008 qualified as a change to our
capital structure under the terms of the 2006 Plan. We used the Black-Scholes option pricing model
to determine the fair value of the awards before and after the special cash dividend, using
consistent assumptions for the risk free rate of return, expected term, expected volatility and
expected dividend yield. The stock prices used in the before and after calculations were $35.10
(the closing price on March 6, 2008, the day before the ex-dividend date) and $29.37 (the closing
price on March 7, 2008, the ex-dividend date), respectively. For all option grants, the fair value
of the award before and after the dividend remained the same. Therefore, there was no incremental
cost recognized in our financial statements due to these award modifications. The following
changes were made to the options outstanding as a result of this change:
| |
|
|
|
|
|
|
|
|
|
|
|
|
|
|
|
|
| |
|
Original Grant Terms |
|
|
Adjusted Grant Terms |
|
| |
|
Number of |
|
|
Exercise |
|
|
Number of |
|
|
Exercise |
|
| |
|
Shares |
|
|
Price |
|
|
Shares |
|
|
Price |
|
Options granted in 2006 |
|
|
1,445,700 |
|
|
$ |
38.42 |
|
|
|
1,520,024 |
|
|
$ |
29.37 |
|
Options granted in 2007 |
|
|
64,100 |
|
|
|
52.38 |
|
|
|
64,100 |
|
|
|
39.88 |
|
Options granted in 2008 |
|
|
110,370 |
|
|
|
34.00 |
|
|
|
131,904 |
|
|
|
28.45 |
|
96
Armstrong World Industries, Inc., and Subsidiaries
Notes to Consolidated Financial Statements
(dollar amounts in millions)
In addition to options, we have also granted restricted stock and restricted stock units. These
awards generally had vesting periods of two to four years at the grant date. A summary of the 2009
and 2008 activity related to these awards follows:
| |
|
|
|
|
|
|
|
|
| |
|
Non-Vested Stock Awards |
|
| |
|
|
|
|
|
Weighted- |
|
| |
|
|
|
|
|
average fair |
|
| |
|
Number of |
|
|
value at grant |
|
| |
|
Shares |
|
|
date |
|
|
|
|
|
|
|
|
|
|
January 1, 2008 |
|
|
590,934 |
|
|
$ |
39.24 |
|
Granted |
|
|
307,866 |
|
|
|
32.61 |
|
Vested |
|
|
(152,945 |
) |
|
|
(36.89 |
) |
Forfeited |
|
|
(138,369 |
) |
|
|
(37.54 |
) |
|
|
|
|
|
|
|
December 31, 2008 |
|
|
607,486 |
|
|
$ |
36.86 |
|
Granted |
|
|
445,183 |
|
|
|
13.46 |
|
Vested |
|
|
(947,459 |
) |
|
|
(26.53 |
) |
Forfeited |
|
|
(105,210 |
) |
|
|
(34.23 |
) |
|
|
|
|
|
|
|
December 31, 2009 |
|
|
0 |
|
|
$ |
0.00 |
|
In 2009 and 2008, we granted 116,624 and 58,390 performance restricted shares, respectively, to our
Chief Executive Officer, which entitled him to receive a specified number of shares of Armstrong’s
common stock on various vesting dates, provided certain cumulative financial targets were achieved
over the three-year performance period. We estimated the fair value of these share awards based on
the market price of the underlying stock on the date of grant. All outstanding performance
restricted shares vested to the maximum extent, or 150%, resulting in an additional 106,457 shares
being awarded in August 2009 as a result of the change in control caused by the TPG and Asbestos PI
Trust agreement.
In addition to the equity awards described above, as of December 31, 2009 we had 30,924
fully-vested phantom shares outstanding for non-employee directors under the 2006 Phantom Stock
Unit Plan. These awards are settled in cash and generally had vesting periods of one to three
years. The awards are generally payable six months following the director’s separation from
service. The total liability recorded for these shares as of December 31, 2009 was $1.6 million.
The awards under the 2006 Phantom Stock Unit Plan are not reflected in the Non-Vested Stock Awards
table above. The 2006 Phantom Stock Unit Plan is still in place; however, no additional shares
will be granted under that plan.
During 2008, we adopted the 2008 Directors Stock Unit Plan. At December 31, 2009 and 2008 there
were 141,782 and 111,950 restricted stock units, respectively, outstanding under the 2008 Directors
Stock Unit Plan. In 2009 and 2008, we granted 29,832 and 61,630 restricted stock units,
respectively, to non-employee directors. Additionally, 50,320 phantom shares were converted to
restricted stock units during 2008. These awards generally have vesting periods of one to three
years, and as of December 31, 2009 and 2008, 111,950 and 38,320 shares, respectively, were vested.
The awards are generally payable six months following the director’s separation from service. The
awards granted under the 2008 Directors Stock Unit Plan are not reflected in the Non-Vested Stock
Awards table above.
We recognize share-based compensation expense on a straight-line basis over the vesting period.
Share-based compensation cost, including the impact of the accelerated vesting, was $38.9 million
($29.6 million net of tax benefit) in 2009, $8.1 million ($5.2 million net of tax benefit) in 2008
and $13.6 million ($9.1 million net of tax benefit) in 2007. Share-based compensation expense is
recorded as a component of SG&A expenses. The benefits of tax deductions in excess of grant date
fair value for the vesting of stock-based awards for the year ended December 31, 2009 was $1.5
million. To the extent the vesting date value is greater than the grant date value, the excess tax
benefit is a credit to additional paid in capital (“APIC”), but only if it reduces income tax
currently payable. Due to our NOL, the credit to APIC will be suspended until the NOL is fully
utilized.
97
Armstrong World Industries, Inc., and Subsidiaries
Notes to Consolidated Financial Statements
(dollar amounts in millions)
As of December 31, 2009, there was $1.0 million of total unrecognized compensation cost related to
non-vested share-based compensation arrangements with our non-employee directors. That cost is
expected to be recognized over a weighted-average period of 1.7 years.
NOTE 24. EMPLOYEE COMPENSATION
Employee compensation is presented in the table below. Charges for severance costs and early
retirement incentives to terminated employees that were otherwise recorded as restructuring charges
have been excluded.
| |
|
|
|
|
|
|
|
|
|
|
|
|
| Employee compensation cost |
|
2009 |
|
|
2008 |
|
|
2007 |
|
Wages, salaries and incentive compensation |
|
$ |
635.6 |
|
|
$ |
710.8 |
|
|
$ |
742.7 |
|
Payroll taxes |
|
|
69.7 |
|
|
|
75.7 |
|
|
|
77.2 |
|
Pension expense (credits), net |
|
|
(31.4 |
) |
|
|
(34.6 |
) |
|
|
(30.3 |
) |
Insurance and other benefit costs |
|
|
69.1 |
|
|
|
77.5 |
|
|
|
84.0 |
|
Stock-based compensation |
|
|
38.3 |
|
|
|
8.1 |
|
|
|
13.6 |
|
|
|
|
|
|
|
|
|
|
|
Total |
|
$ |
781.3 |
|
|
$ |
837.5 |
|
|
$ |
887.2 |
|
|
|
|
|
|
|
|
|
|
|
NOTE 25. LEASES
We rent certain real estate and equipment. Several leases include options for renewal or purchase,
and contain clauses for payment of real estate taxes and insurance. In most cases, management
expects that in the normal course of business, leases will be renewed or replaced by other leases.
| |
|
|
|
|
|
|
|
|
|
|
|
|
| |
|
2009 |
|
|
2008 |
|
|
2007 |
|
Rent expense |
|
$ |
25.8 |
|
|
$ |
25.0 |
|
|
$ |
23.8 |
|
Sublease (income) |
|
|
(3.1 |
) |
|
|
(2.0 |
) |
|
|
(1.5 |
) |
|
|
|
|
|
|
|
|
|
|
Net rent expense |
|
$ |
22.7 |
|
|
$ |
23.0 |
|
|
$ |
22.3 |
|
|
|
|
|
|
|
|
|
|
|
Future minimum payments at December 31, 2009 by year and in the aggregate, having noncancelable
lease terms in excess of one year are as follows:
| |
|
|
|
|
|
|
|
|
|
|
|
|
| |
|
Total Minimum |
|
|
Sublease |
|
|
Net Minimum |
|
| Scheduled minimum lease payments |
|
Lease Payments |
|
|
(Income) |
|
|
Lease Payments |
|
2010 |
|
$ |
14.4 |
|
|
$ |
(2.2 |
) |
|
$ |
12.2 |
|
2011 |
|
|
10.6 |
|
|
|
(1.8 |
) |
|
|
8.8 |
|
2012 |
|
|
6.7 |
|
|
|
(1.0 |
) |
|
|
5.7 |
|
2013 |
|
|
3.6 |
|
|
|
(0.6 |
) |
|
|
3.0 |
|
2014 |
|
|
1.9 |
|
|
|
(0.5 |
) |
|
|
1.4 |
|
Thereafter |
|
|
6.3 |
|
|
|
(2.3 |
) |
|
|
4.0 |
|
|
|
|
|
|
|
|
|
|
|
Total |
|
$ |
43.5 |
|
|
$ |
(8.4 |
) |
|
$ |
35.1 |
|
|
|
|
|
|
|
|
|
|
|
Assets under capital leases are included in the consolidated balance sheet as follows:
| |
|
|
|
|
|
|
|
|
| Assets under capital leases |
|
2009 |
|
|
2008 |
|
Land |
|
$ |
1.6 |
|
|
$ |
1.6 |
|
Building |
|
|
3.2 |
|
|
|
3.2 |
|
Machinery |
|
|
3.0 |
|
|
|
3.0 |
|
Less accumulated amortization |
|
|
(2.7 |
) |
|
|
(2.0 |
) |
|
|
|
|
|
|
|
Net assets |
|
$ |
5.1 |
|
|
$ |
5.8 |
|
|
|
|
|
|
|
|
98
Armstrong World Industries, Inc., and Subsidiaries
Notes to Consolidated Financial Statements
(dollar amounts in millions)
NOTE 26. SHAREHOLDERS’ EQUITY
There were no treasury shares at December 31, 2009 or December 31, 2008.
The balance of each component of accumulated other comprehensive (loss) as of December 31, 2009 and
2008 is presented in the table below.
| |
|
|
|
|
|
|
|
|
| |
|
December 31, |
|
|
December 31, |
|
| |
|
2009 |
|
|
2008 |
|
Foreign currency translation adjustments |
|
$ |
23.9 |
|
|
$ |
(10.5 |
) |
Derivative (loss), net |
|
|
(5.5 |
) |
|
|
(3.3 |
) |
Pension and postretirement adjustments |
|
|
(316.2 |
) |
|
|
(335.0 |
) |
|
|
|
|
|
|
|
Accumulated other comprehensive (loss) |
|
$ |
(297.8 |
) |
|
$ |
(348.8 |
) |
|
|
|
|
|
|
|
The amounts and related tax effects allocated to each component of other comprehensive income
(loss) during 2009 are presented in the table below.
| |
|
|
|
|
|
|
|
|
|
|
|
|
| |
|
Pre-tax |
|
|
|
|
|
|
After tax |
|
| |
|
Amount |
|
|
Tax (Expense) |
|
|
Amount |
|
Foreign currency translation adjustments |
|
$ |
38.3 |
|
|
$ |
(3.9 |
) |
|
$ |
34.4 |
|
Derivative (loss), net |
|
|
(1.6 |
) |
|
|
(0.6 |
) |
|
|
(2.2 |
) |
Pension and postretirement adjustments |
|
|
37.9 |
|
|
|
(19.1 |
) |
|
|
18.8 |
|
|
|
|
|
|
|
|
|
|
|
Total other comprehensive income (loss) |
|
$ |
74.6 |
|
|
$ |
(23.6 |
) |
|
$ |
51.0 |
|
|
|
|
|
|
|
|
|
|
|
NOTE 27. SUPPLEMENTAL FINANCIAL INFORMATION
| |
|
|
|
|
|
|
|
|
|
|
|
|
| |
|
2009 |
|
|
2008 |
|
|
2007 |
|
Selected operating expenses |
|
|
|
|
|
|
|
|
|
|
|
|
Maintenance and repair costs |
|
$ |
103.5 |
|
|
$ |
111.3 |
|
|
$ |
116.9 |
|
Research and development costs |
|
|
38.0 |
|
|
|
38.8 |
|
|
|
44.0 |
|
Advertising costs |
|
|
28.8 |
|
|
|
29.6 |
|
|
|
36.2 |
|
|
|
|
|
|
|
|
|
|
|
|
|
|
Other non-operating expense |
|
|
|
|
|
|
|
|
|
|
|
|
Foreign currency translation loss, net of hedging activity |
|
$ |
0.3 |
|
|
$ |
1.1 |
|
|
$ |
0.7 |
|
Other |
|
|
0.6 |
|
|
|
0.2 |
|
|
|
0.7 |
|
|
|
|
|
|
|
|
|
|
|
Total |
|
$ |
0.9 |
|
|
$ |
1.3 |
|
|
$ |
1.4 |
|
|
|
|
|
|
|
|
|
|
|
|
|
|
|
|
|
|
|
|
|
|
|
|
Other non-operating income |
|
|
|
|
|
|
|
|
|
|
|
|
Interest income |
|
$ |
3.1 |
|
|
$ |
10.5 |
|
|
$ |
15.3 |
|
Foreign currency translation gain, net of hedging activity |
|
|
0.1 |
|
|
|
0.1 |
|
|
|
2.5 |
|
Other |
|
|
— |
|
|
|
— |
|
|
|
0.4 |
|
|
|
|
|
|
|
|
|
|
|
Total |
|
$ |
3.2 |
|
|
$ |
10.6 |
|
|
$ |
18.2 |
|
|
|
|
|
|
|
|
|
|
|
NOTE 28. SUPPLEMENTAL CASH FLOW INFORMATION
| |
|
|
|
|
|
|
|
|
|
|
|
|
| |
|
2009 |
|
|
2008 |
|
|
2007 |
|
Interest paid |
|
$ |
10.4 |
|
|
$ |
24.2 |
|
|
$ |
47.8 |
|
Income taxes paid (refunded), net |
|
|
8.9 |
|
|
|
25.7 |
|
|
|
(181.4 |
) |
99
Armstrong World Industries, Inc., and Subsidiaries
Notes to Consolidated Financial Statements
(dollar amounts in millions)
NOTE 29. RELATED PARTIES
We purchase grid products from WAVE, our 50%-owned joint venture with Worthington Industries. The
total amount of these purchases was approximately $67 million in 2009, $98 million in 2008, and $88
million in 2007. We also provide certain selling, promotional and administrative processing
services to WAVE for which we receive reimbursement. Those services amounted to $14.2 million in
2009, $16.1 million in 2008, and $15.0 million in 2007. The net amounts due from us to WAVE for
all of our relationships were $4.1 million and $2.8 million at the end of 2009 and 2008,
respectively. See Note 10 for additional information.
During 2009 we incurred approximately $0.6 million in consulting fees related to services provided
by an affiliate of TPG. See Note 1 for additional information.
NOTE 30. LITIGATION AND RELATED MATTERS
ENVIRONMENTAL MATTERS
Environmental Expenditures
Our manufacturing and research facilities are affected by various federal, state and local
requirements relating to the discharge of materials and the protection of the environment. We make
expenditures necessary for compliance with applicable environmental requirements at each of our
operating facilities. Regulatory requirements continually change, therefore we cannot predict with
certainty future expenditures associated with compliance with environmental requirements.
Environmental Remediation
Summary
We are actively involved in proceedings under the Comprehensive Environmental Response,
Compensation and Liability Act (“CERCLA”), and similar state “Superfund” laws at three off-site
locations. We have also been investigating and/or remediating environmental contamination
allegedly resulting from past industrial activity at four domestic and five foreign current or
former plant sites. In a few cases, we are one of many potentially responsible parties (“PRPs”)
which have potential liability for the required investigation and remediation of each site. In
some cases, we have agreed to jointly fund that required investigation and remediation, while at
some sites, we dispute the liability, the proposed remedy or the proposed cost allocation among the
PRPs. We may also have rights of contribution or reimbursement from other parties or coverage
under applicable insurance policies.
Estimates of our future environmental liability at the Superfund sites and current or former plant
sites are based on evaluations of currently available facts regarding each individual site and
consider factors such as our activities in conjunction with the site, existing technology,
presently enacted laws and regulations and prior company experience in remediating contaminated
sites. Although current law imposes joint and several liability on all parties at Superfund sites,
our contribution to the remediation of these sites is expected to be limited by the number of other
companies potentially liable for site remediation. As a result, our estimated liability reflects
only our expected share. In determining the probability of contribution, we consider the solvency
of other parties, whether liability is being disputed, the terms of any existing agreements and
experience with similar matters, and the impact of AWI’s emergence from Chapter 11 upon the
validity of the claim.
100
Armstrong World Industries, Inc., and Subsidiaries
Notes to Consolidated Financial Statements
(dollar amounts in millions)
Effects of Chapter 11
Upon AWI’s emergence from Chapter 11 on October 2, 2006, AWI’s environmental liabilities with
respect to properties that AWI does not own or operate (such as formerly owned sites, or landfills
to which AWI’s waste was taken) were discharged. Claims brought by a federal or state agency
alleging that AWI should reimburse the claimant for money that it spent cleaning up a site which
AWI does not own or operate, and claims by private parties, such as other PRPs with respect to
sites with multiple PRPs, were discharged upon emergence. Having emerged from Chapter 11, AWI does
not bear any responsibility for these claims. Environmental obligations with respect to AWI’s
subsidiaries and to property that they currently own or operate have not been discharged.
In addition to the right to sue for reimbursement of the money it spends, however, CERCLA also
gives the federal government the right to sue for an injunction compelling a defendant to perform a
cleanup. Several state statutes give similar injunctive rights to those states. While we believe
such rights against AWI were also discharged upon AWI’s emergence from Chapter 11, there does not
appear to be controlling judicial precedent in that regard. Thus, according to some cases, while a
governmental agency’s right to require AWI to reimburse it for the costs of cleaning up a site may
be dischargeable, the same government agency’s right to compel us to spend our money cleaning up
the same site may not be discharged even though the financial impact to AWI would have been the
same in both instances if the liability had not been discharged.
Specific Events
Upon emergence, AWI resolved its environmental liabilities at 45 sites through its Chapter 11 Case.
The liabilities at 38 sites were resolved through the global environmental settlement (“Global
Settlement”) with the Department of Justice (“DOJ”) and the U.S. Environmental Protection Agency
(“EPA”) with respect to CERCLA liability. The Global Settlement, which was approved by the
Bankruptcy Court in October 2005 and further amended in July 2007, provided the EPA an approved
proof of claim in the amount of $9.2 million, which included $7.8 million with respect to the
Peterson Puritan site. At one CERCLA site, however, AWI will continue to participate in the
cleanup under a previously approved Consent Decree. In addition to the federal claims resolved by
the Global Settlement, AWI’s emergence from Chapter 11 also resolved its environmental liabilities
with respect to claims asserted by the state and/or private parties at seven other sites.
AWI is subject to an order of the Oregon Department of Environmental Quality (“DEQ”) to investigate
and remediate hazardous substances present at its St. Helens, Oregon facility which was previously
owned by Kaiser Gypsum Company, Inc. (“Kaiser”) and then Owens Corning Fiberglas Corp. (“OC”).
Costs and responsibilities for the remedial investigation and remedy design are being shared with
Kaiser pursuant to an agreement between AWI and Kaiser. Contributions to these costs are also
being made available by DEQ pursuant to its settlement with OC for OC’s liabilities for the
property.
DEQ subsequently approached AWI to perform investigations in Scappoose Bay adjacent to the St.
Helens, Oregon facility. In January 2010 DEQ requested EPA evaluation of the site, which could
lead to listing on the federal National Priorities List. AWI has denied liability for any
contamination in Scappoose Bay. However, Kaiser entered into an agreement with DEQ to conduct such
investigations in the Bay and AWI and OC have cooperated with Kaiser and provided a portion of the
funding for the investigation, without waiving any defenses to liability. AWI continues to deny
all liability for any contamination of the adjacent bay. We are not currently able to estimate
with reasonable certainty any amounts we may incur with respect to the bay, although it is possible
that such amounts may be material.
Summary of Financial Position
Liabilities of $6.3 million and $6.5 million at December 31, 2009 and December 31, 2008,
respectively, were for potential environmental liabilities that we consider probable and for which
a reasonable estimate of the probable liability could be made. Where existing data is sufficient
to estimate the liability, that
estimate has been used; where only a range of probable liabilities is available and no amount
within that range is more likely than any other, the lower end of the range has been used. As
assessments and
101
Armstrong World Industries, Inc., and Subsidiaries
Notes to Consolidated Financial Statements
(dollar amounts in millions)
remediation activities progress at each site, these liabilities are reviewed to
reflect new information as it becomes available. These liabilities are undiscounted.
The estimated liabilities above do not take into account any claims for recoveries from insurance
or third parties. In the fourth quarter of 2008, AWI concluded a settlement with an insurance
carrier and the U.S. EPA for the reimbursement of funds for environmental costs related to
specific, identified sites. This arrangement included a recovery by AWI from the carrier, a
payment from AWI to the carrier for retrospective premiums and a payment from AWI to the EPA. This
matter has been concluded, and we recorded a gain of $6.9 million within SG&A during the fourth
quarter of 2008. It is our policy to record probable recoveries that are either available through
settlement or anticipated to be recovered through negotiation or litigation as assets in the
Consolidated Balance Sheets. The amount of the recorded asset for estimated recoveries was zero at
December 31, 2009 and December 31, 2008.
Actual costs to be incurred at identified sites may vary from our estimates. Based on our current
knowledge of the identified sites, we are not able to estimate with reasonable certainty future
costs which may exceed amounts already recognized.
PATENT INFRINGEMENT CLAIMS
We are a defendant in a lawsuit claiming patent infringement related to some of our laminate
flooring products. We are being defended and indemnified by our supplier for costs and potential
damages related to the litigation. The jury verdict held the asserted patent claims to be invalid
and non-infringed for several reasons. The plaintiffs, Pergo, Inc. and Pergo (Europe) AB, filed an
appeal, which was heard by the US Court of Appeals for the Federal Circuit (“CAFC”). In February
2010 the CAFC affirmed the trial court on all issues presented on appeal.
In the third quarter of 2009 AWI filed a lawsuit against Congoleum Corporation seeking a judgment
to invalidate a patent Congoleum holds relating to its Dura-Ceramic® vinyl tile. AWI also claimed
that Congoleum violated federal law in its marketing of this product. Congoleum filed a response
claiming that AWI infringed its patent, and sought damages and injunctive relief. In February
2010 the parties entered into a confidential settlement agreement resolving all issues regarding
this patent and the related litigation.
OTHER CLAIMS
Additionally, we are involved in various other claims and legal actions involving product
liability, patent infringement, breach of contract, distributor termination, employment law issues
and other actions arising in the ordinary course of business. While complete assurance cannot be
given to the outcome of these claims, we do not believe there is a reasonable possibility that a
loss exceeding amounts already recognized would be material.
102
Armstrong World Industries, Inc., and Subsidiaries
Notes to Consolidated Financial Statements
(dollar amounts in millions)
NOTE 31. EARNINGS PER SHARE
Earnings per share components may not add due to rounding.
The following table is a reconciliation of net earnings to net earnings attributable to common
shares used in our basic and diluted EPS calculations for the years ended December 31, 2009, 2008,
and 2007:
| |
|
|
|
|
|
|
|
|
|
|
|
|
| |
|
2009 |
|
|
2008 |
|
|
2007 |
|
Net earnings |
|
$ |
77.7 |
|
|
$ |
81.0 |
|
|
$ |
145.3 |
|
Net earnings allocated to non-vested share
awards |
|
|
(0.4 |
) |
|
|
(0.6 |
) |
|
|
(1.6 |
) |
|
|
|
|
|
|
|
|
|
|
Net earnings attributable to common shares |
|
$ |
77.3 |
|
|
$ |
80.4 |
|
|
$ |
143.7 |
|
|
|
|
|
|
|
|
|
|
|
The following table is a reconciliation of basic shares outstanding to diluted shares outstanding
for the years ended December 31, 2009, 2008, and 2007:
| |
|
|
|
|
|
|
|
|
|
|
|
|
| millions of shares |
|
2009 |
|
|
2008 |
|
|
2007 |
|
Basic shares outstanding |
|
|
56.8 |
|
|
|
56.4 |
|
|
|
56.1 |
|
Dilutive effect of stock option awards |
|
|
0.2 |
|
|
|
— |
|
|
|
— |
|
|
|
|
|
|
|
|
|
|
|
Diluted shares outstanding |
|
|
57.0 |
|
|
|
56.4 |
|
|
|
56.1 |
|
|
|
|
|
|
|
|
|
|
|
NOTE 32. SUBSEQUENT EVENT
Pursuant to a February 2010 separation agreement between Mr. Lockhart and the Company, Mr. Lockhart
will step down as Chief Executive Officer and President of the Company and Chairman and member of
the Board of Directors effective February 28, 2010. Terms of the separation agreement include a
severance payment to Mr. Lockhart of approximately $11 million.
103
|
|
|
| ITEM 9. |
|
CHANGES IN AND DISAGREEMENTS WITH ACCOUNTANTS ON ACCOUNTING AND
FINANCIAL DISCLOSURE |
Not applicable.
|
|
|
| ITEM 9A. |
|
CONTROLS AND PROCEDURES |
Our management, with the participation of our chief executive officer and our chief financial
officer, performed an evaluation of our disclosure controls and procedures (as defined in
Rules 13a-15(e) and 15d-15(e) of the Securities Exchange Act of 1934 (“Exchange Act”)) as of the
end of the period covered by this Annual Report on Form 10-K. Our chief executive officer and our
chief financial officer have concluded that our disclosure controls and procedures were effective
insofar as they are designed to ensure that information required to be disclosed by us in the
reports we file or submit under the Exchange Act is recorded, processed, summarized and reported,
within the time periods specified in the Commission’s rules and forms, and they include, without
limitation, controls and procedures designed to ensure that information required to be disclosed by
us in the reports we file or submit under the Exchange Act is accumulated and communicated to our
management, including our principal executive and principal financial officers, or persons
performing similar functions, as appropriate to allow timely decisions regarding required
disclosure.
No change in our internal control over financial reporting (as defined in Rules 13a-15(f) and
15d-15(f) under the Exchange Act) occurred during the fiscal quarter ended December 31, 2009 that
has materially affected, or is reasonably likely to materially affect, our internal control over
financial reporting.
Management’s Report on Internal Control over Financial Reporting and the Report of Independent
Registered Public Accounting Firm are incorporated by reference to Item 8.
|
|
|
| ITEM 9B. |
|
OTHER INFORMATION |
The Board of Directors established Friday, July 2, 2010 as the date for the Company’s annual
meeting of shareholders. Shareholders of record at the close of trading on April 5, 2010 will be
entitled to vote at that meeting. Pursuant to Article II, Section 5 of the Company’s Bylaws, if a
shareholder other than the Asbestos Personal Injury Settlement Trust should wish to propose business to come before that meeting, written notice of such business must
be received by the Corporate Secretary of the Company no later than March 24, 2010. Any such
notice should be addressed to the attention of: Jeffrey D. Nickel, Corporate Secretary, Armstrong
World Industries, Inc., 2500 Columbia Avenue, Lancaster, PA 17603. It is recommended that any
notice be sent via means that will provide confirmation of the delivery date.
104
PART III
|
|
|
| ITEM 10. |
|
DIRECTORS, EXECUTIVE OFFICERS AND CORPORATE GOVERNANCE |
The information required by Item 10, other than information regarding the executive officers of the
Company which is presented in Item 4A. Executive Officers of the Company, is incorporated by
reference to the sections entitled “Board of Directors,” “Director Information,” “Company
Leadership Structure,” “Board’s Role in Risk Management Oversight,” “Audit Committee,” “Audit
Committee Expert,” “Management Development and Compensation Committee,” “Nominating and Governance
Committee,” “Code of Ethics” and “Section 16(a) Beneficial Ownership Reporting Compliance” in the
Company’s proxy statement for its 2010 annual meeting of shareholders.
|
|
|
| ITEM 11. |
|
EXECUTIVE COMPENSATION |
The information required by Item 11 is incorporated by reference to the sections entitled
“Compensation Discussion and Analysis,” “Compensation Committee Report,” “Summary Compensation
Table,” “Grants of Plan-Based Awards,” “Outstanding Equity Awards at Fiscal Year-End,” “Option
Exercises and Stock Vested,” “Pension Benefits,” “Nonqualified Deferred Compensation,” “Potential
Payments Upon Termination or Change in Control,” “Compensation Committee Interlocks and Insider
Participation” and “Compensation of Directors” in the Company’s proxy statement for its 2010 annual
meeting of shareholders.
|
|
|
| ITEM 12. |
|
SECURITY OWNERSHIP OF CERTAIN BENEFICIAL OWNERS AND MANAGEMENT AND RELATED STOCKHOLDER MATTERS |
The information required by Item 12 is incorporated by reference to the sections entitled “Security
Ownership of Certain Beneficial Owners,” “Security Ownership of Management” and “Equity
Compensation Plan Information” in the Company’s proxy statement for its 2010 annual meeting of
shareholders.
|
|
|
| ITEM 13. |
|
CERTAIN RELATIONSHIPS AND RELATED TRANSACTIONS, AND DIRECTOR INDEPENDENCE |
The information required by Item 13 is incorporated by reference to the sections entitled “Certain
Relationships and Related Transactions” and “Director Independence” in the Company’s proxy
statement for its 2010 annual meeting of shareholders.
|
|
|
| ITEM 14. |
|
PRINCIPAL ACCOUNTANT FEES AND SERVICES |
The information required by Item 14 is incorporated by reference to the section entitled “Audit
Committee Report” in the Company’s proxy statement for its 2010 annual meeting of shareholders.
105
PART IV
|
|
|
| ITEM 15. |
|
EXHIBITS AND FINANCIAL STATEMENT SCHEDULES |
(a) Listing of Documents
| 1. |
|
The financial statements and schedule of Armstrong World Industries, Inc. filed as a part
of this 2009 Annual Report on Form 10-K is listed in the “Index to Financial Statements and
Schedules” on Page 48. |
| |
| 2. |
|
The financial statements required to be filed pursuant to Item 15 of Form 10-K are: |
| |
| |
|
Worthington Armstrong Venture consolidated financial statements for the years ended
December 31, 2009, 2008, and 2007 (filed herewith as Exhibit 99.1) |
| |
| 3. |
|
The following exhibits are filed as part of this 2009 Annual Report on Form 10-K: |
| |
|
|
| Exhibit No. |
|
Description |
| |
|
|
| No. 2
|
|
Armstrong World Industries, Inc.’s Fourth Amended Plan of Reorganization, as amended by
modifications through May 23, 2006, is incorporated by reference from the 2005 Annual Report
on Form 10-K, wherein it appeared as Exhibit 2.3. |
| |
|
|
| No. 3.1
|
|
Amended and Restated Certificate of Incorporation of Armstrong World Industries, Inc.
is incorporated by reference from the Current Report on Form 8-K dated October 2, 2006,
wherein it appeared as Exhibit 3.1. |
| |
|
|
| No. 3.2
|
|
Bylaws of Armstrong World Industries, Inc. are incorporated by reference from the
Current Report on Form 8-K dated October 2, 2006, wherein they appeared as Exhibit 3.2. |
| |
|
|
| No. 10.1
|
|
Management Achievement Plan for Key Executives, effective as of November 28, 1983, as
amended April 30, 2007 and December 8, 2008, is incorporated by reference from the 2008
Annual Report on Form 10-K, wherein it appeared as Exhibit 10.1. * |
| |
|
|
| No. 10.2
|
|
Retirement Benefit Equity Plan, effective January 1, 2005, as amended October 29, 2007
and December 8, 2008, is incorporated by reference from the 2008 Annual Report on Form 10-K,
wherein it appeared as Exhibit 10.2. * |
| |
|
|
| No. 10.3
|
|
Bonus Replacement Retirement Plan, effective as of January 1, 1998, as amended January
1, 2007, is incorporated by reference from the 2007 Annual Report on Form 10-K, wherein it
appeared as Exhibit 10.9.* |
| |
|
|
| No. 10.4
|
|
Employment Agreement with Michael D. Lockhart, as amended, is incorporated by
reference from the Quarterly Report on Form 10-Q for the quarter ended September 30, 2008,
wherein it appeared as Exhibit 10.8. * |
| |
|
|
| No. 10.5
|
|
Nonqualified Deferred Compensation Plan effective January 2005 is incorporated by
reference from the 2005 Annual Report on Form 10-K, wherein it appeared as Exhibit 10.29. * |
| |
|
|
| No. 10.6
|
|
Schedule of Armstrong World Industries, Inc. Nonemployee Directors Compensation is
incorporated by reference from the Quarterly Report filed on Form 10-Q for the quarter ended
September 30, 2009, wherein it appeared as Exhibit 10.8.* |
106
| |
|
|
| Exhibit No. |
|
Description |
| |
|
|
| No. 10.7
|
|
Credit Agreement, dated as of October 2, 2006, by and among the Company, certain
subsidiaries of the Company as guarantors, Bank of America, N.A., as Administrative Agent,
the other lenders party thereto, JP Morgan Chase Bank, N.A. and Barclays Bank PLC, as
Co-Syndication Agents and LaSalle Bank National Association and the Bank of Nova Scotia, as
Co-Documentation Agents, is filed with this Report. |
| |
|
|
| No. 10.8
|
|
Amendment No. 1, dated February 25, 2008, to the Credit Agreement, dated October 2,
2006, by and among the Company, certain subsidiaries of the Company as guarantors, Bank of
America, N.A., as Administrative Agent, the other lenders party thereto, JP Morgan Chase
Bank, N.A. and Barclays Bank PLC, as Co-Syndication Agents and LaSalle Bank National
Association and the Bank of Nova Scotia, as Co-Documentation Agents, is filed with this
Report. |
| |
|
|
| No. 10.9
|
|
Armstrong World Industries, Inc. Asbestos Personal Injury Settlement Trust Agreement
dated as of October 2, 2006, by and among Armstrong World Industries, Inc. and trustees, is
incorporated by reference from the Current Report on Form 8-K dated October 2, 2006, wherein
it appeared as Exhibit 10.2. |
| |
|
|
| No. 10.10
|
|
Stockholder and Registration Rights Agreement, dated as of October 2, 2006, by and
between Armstrong World Industries, Inc. and the Armstrong World Industries, Inc. Asbestos
Personal Injury Settlement Trust is incorporated by reference from the Current Report on Form
8-K dated October 2, 2006, wherein it appeared as Exhibit 10.3. |
| |
|
|
| No. 10.11
|
|
2006 Long-Term Incentive Plan, as amended February 23, 2009, is incorporated by
reference from the 2008 Annual Report on Form 10-K, wherein it appeared as Exhibit 10.13. * |
| |
|
|
| No. 10.12
|
|
Form of 2006 Long-Term Incentive Plan Stock Option Agreement is incorporated by
reference from the Current Report on Form 8-K dated October 2, 2006, wherein it appeared as
Exhibit 10.5. * |
| |
|
|
| No. 10.13
|
|
Form of 2006 Long-Term Incentive Plan Restricted Stock Award Agreement is
incorporated by reference from the Current Report on Form 8-K dated October 2, 2006, wherein
it appeared as Exhibit 10.6. * |
| |
|
|
| No. 10.14
|
|
Form of 2006 Long-Term Incentive Plan notice of restricted stock and/or option award
is incorporated by reference from the Current Report on Form 8-K dated October 2, 2006,
wherein it appeared as Exhibit 10.7. * |
| |
|
|
| No. 10.15
|
|
Form of Indemnification Agreement for Officers and Directors of Armstrong World
Industries, Inc. is incorporated by reference from the Current Report on Form 8-K dated
October 2, 2006, wherein it appeared as Exhibit 10.8. A Schedule of Participating Officers
and Directors is filed with this Report. * |
| |
|
|
| No. 10.16
|
|
2006 Phantom Stock Unit Plan, as amended December 8, 2008, is incorporated by
reference from the 2008 Annual Report on Form 10-K, wherein it appeared as Exhibit 10.18. * |
| |
|
|
| No. 10.17
|
|
2006 Phantom Stock Unit Agreement is incorporated by reference from the Current
Report on Form 8-K dated October 23, 2006, wherein it appeared as Exhibit 10.3. A Schedule
of Participating Directors is incorporated by reference from the 2006 Annual Report on Form
10-K, wherein it appeared as Exhibit 10.36. * |
107
| |
|
|
| Exhibit No. |
|
Description |
| |
|
|
| No. 10.18
|
|
2007 Award under the 2006 Phantom Stock Unit Agreement and the Schedule of
Participating Directors are incorporated by reference from the Current Report on Form 8-K
dated October 22, 2007, wherein they appeared as Exhibits 10.1 and 10.2, respectively. * |
| |
|
|
| No. 10.19
|
|
Stipulation and Agreement with Respect to Claims of Armstrong Holdings, Inc. and
Armstrong Worldwide, Inc.; and Motion for Order Approving Stipulation and Agreement are
incorporated by reference from the Current Report on Form 8-K dated February 26, 2007,
wherein they appeared as Exhibits 99.2 and 99.3, respectively. |
| |
|
|
| No. 10.20
|
|
Form of grant letter used in connection with the equity grant of stock options and
performance restricted shares under the 2006 Long-Term Incentive Plan to Michael D. Lockhart
is incorporated by reference from the 2007 Annual Report on Form 10-K, wherein it appeared as
Exhibit 10.34.* |
| |
|
|
| No. 10.21
|
|
Form of grant letter used in connection with awards of restricted stock under the
2006 Long-Term Incentive Plan is incorporated by reference from the 2007 Annual Report on
Form 10-K, wherein it appeared as Exhibit 10.35.* |
| |
|
|
| No. 10.22
|
|
Form of grant letter used in connection with award of stock options under the 2006
Long-Term Incentive Plan is incorporated by reference from the Quarterly Report on Form 10-Q
for the quarter ended March 31, 2008, wherein it appeared as Exhibit 10.37. * |
| |
|
|
| No. 10.23
|
|
2008 Directors Stock Unit Plan, as amended December 8, 2008 is incorporated by
reference from the 2008 Annual Report on Form 10-K, wherein it appeared as Exhibit 10.27. * |
| |
|
|
| No. 10.24
|
|
Form of Service Commencement Award to each of James C. Melville and Edward E. Steiner
is incorporated by reference from the Quarterly Report on Form 10-Q for the quarter ended
September 30, 2009, wherein it appeared as Exhibit 10.26. * |
| |
|
|
| No. 10.25
|
|
Form of 2009 Award under the 2008 Director Stock Unit Plan is incorporated by
reference from the Quarterly Report on Form 10-Q for the quarter ended September 30, 2009,
wherein it appeared as Exhibit 10.27. * |
| |
|
|
| No. 10.26
|
|
Schedule of Participating Directors to the 2009 Award under the 2008 Directors Stock
Unit Plan is incorporated by reference from the Quarterly Report on Form 10-Q for the quarter
ended September 30, 2009, wherein it appeared as Exhibit 10.28. * |
| |
|
|
| No. 10.27
|
|
Form of Change in Control Agreement with Michael D. Lockhart is incorporated by
reference from the Quarterly Report on Form 10-Q for the quarter ended September 30, 2008,
wherein it appeared as Exhibit 10.39. * |
| |
|
|
| No. 10.28
|
|
Form of Indemnification Agreement for Officers and Directors of Armstrong World
Industries, Inc. is incorporated by reference from the Quarterly Report on Form 10-Q for the
quarter ended September 30, 2009, wherein it appeared as Exhibit 10.32. A Schedule of
Participating Officers and Directors is filed with this Report. * |
| |
|
|
| No. 10.29
|
|
Non-Disclosure Agreement, dated July 30, 2009, between Armstrong World Industries,
Inc. and TPG Capital, L.P. (incorporated by reference to Exhibit 3 to the Schedule 13D filed
by TPG Advisors VI, Inc., TPG Advisors V, Inc., David Bonderman and James G. Coulter with the
SEC on August 11, 2009). |
108
| |
|
|
| Exhibit No. |
|
Description |
| |
|
|
| No. 10.30
|
|
Undertaking Letter from TPG Capital L.P., dated August 10, 2009, to Armstrong World
Industries, Inc. (incorporated by reference to Exhibit (e)(4) to the Schedule 14D-9 filed by
Armstrong World Industries, Inc. with the SEC on September 15, 2009). |
| |
|
|
| No. 10.31
|
|
Offer Letter to Thomas B. Mangas dated December 23, 2009, is incorporated by
reference from the Current Report on Form 8-K dated January 8, 2010, wherein it appeared as
Exhibit 99.2. * |
| |
|
|
| No. 10.32
|
|
Letter to Frank J. Ready dated January 8, 2010 is filed with this Report. * |
| |
|
|
| No. 11
|
|
Computation of Earnings Per Share. |
| |
|
|
| No. 21
|
|
Armstrong World Industries, Inc.’s Subsidiaries. |
| |
|
|
| No. 23.1
|
|
Consent of Independent Registered Public Accounting Firm. |
| |
|
|
| No. 23.2
|
|
Consent of Independent Registered Public Accounting Firm. |
| |
|
|
| No. 24
|
|
Power of Attorney and Authorizing Resolution. |
| |
|
|
| No. 31.1
|
|
Certification of Principal Executive Officer required by Rule 13a-15(e) or 15d-15(e)
of the Securities Exchange Act. |
| |
|
|
| No. 31.2
|
|
Certification of Principal Financial Officer required by Rule 13a-15(e) or 15d-15(e)
of the Securities Exchange Act. |
| |
|
|
| No. 32.1
|
|
Certification of Chief Executive Officer required by Rule 13a and 18 U.S.C. Section
1350 (furnished herewith). |
| |
|
|
| No. 32.2
|
|
Certification of Chief Financial Officer required by Rule 13a and 18 U.S.C. Section
1350 (furnished herewith). |
| |
|
|
| No. 99.1
|
|
Worthington Armstrong Venture consolidated financial statements as of December 31,
2009 and 2008 and for the years ended December 31, 2009, 2008 and 2007. |
| |
|
|
| No. 99.2
|
|
Shareholders’ Agreement, dated as of August 28, 2009, by and among Armor TPG Holdings
LLC and Armstrong World Industries, Inc. Asbestos Personal Injury Settlement Trust
(incorporated by reference to Exhibit (d)(3) of the Schedule TO filed on September 3, 2009,
by TPG Advisors VI, Inc., Armor TPG Holdings LLC and others with respect to Armstrong World
Industries, Inc.). |
| |
|
|
| * |
|
Management Contract or Compensatory Plan. |
109
SIGNATURES
Pursuant to the requirements of Section 13 or 15(d) of the Securities Exchange Act of 1934,
the registrant has duly caused this report to be signed on its behalf by the undersigned, thereunto
duly authorized.
| |
|
|
|
|
| |
ARMSTRONG WORLD INDUSTRIES, INC.
(Registrant)
|
|
| |
By: |
/s/ Michael D. Lockhart
|
|
| |
|
Chairman and Chief Executive Officer |
|
| |
| |
Date: February 26, 2010 |
|
Pursuant to the requirements of the Securities Exchange Act of 1934, as amended, this Report has
been signed below by the following persons on behalf of the registrant Armstrong and in the
capacities and on the dates indicated.
Directors and Principal Officers of the registrant AWI:
| |
|
|
| Name |
|
Title |
Michael D. Lockhart
|
|
Chairman and Chief Executive Officer
(Principal Executive Officer) |
|
|
|
Thomas B. Mangas
|
|
Senior Vice President and Chief Financial Officer
(Principal Financial Officer) |
|
|
|
Stephen F. McNamara
|
|
Vice President and Controller
(Chief Accounting Officer) |
|
|
|
Stanley A. Askren
|
|
Director |
|
|
|
David Bonderman
|
|
Director |
|
|
|
Jon A. Boscia
|
|
Director |
|
|
|
Kevin Burns
|
|
Director |
|
|
|
James J. Gaffney
|
|
Director |
|
|
|
Judith R. Haberkorn
|
|
Director |
|
|
|
James C. Melville
|
|
Director |
|
|
|
James J. O’Connor
|
|
Director |
|
|
|
John J. Roberts
|
|
Director |
|
|
|
Edward E. Steiner
|
|
Director |
| |
|
|
|
|
| |
|
|
| |
By: |
/s/ Michael D. Lockhart
|
|
| |
|
(Michael D. Lockhart, as attorney-in-fact |
|
| |
|
for AWI directors and on his own behalf)
As of February 26, 2010 |
|
| |
| |
|
|
| |
By: |
/s/ Thomas B. Mangas
|
|
| |
|
(Thomas B. Mangas) |
|
| |
|
As of February 26, 2010 |
|
| |
| |
|
|
| |
By: |
/s/ Stephen F. McNamara
|
|
| |
|
(Stephen F. McNamara) |
|
| |
|
As of February 26, 2010 |
|
110
SCHEDULE II
Armstrong World Industries, Inc.
Valuation and Qualifying Reserves of Accounts Receivable
(amounts in millions)
| |
|
|
|
|
|
|
|
|
|
|
|
|
| |
|
2009 |
|
|
2008 |
|
|
2007 |
|
Provision for Losses |
|
|
|
|
|
|
|
|
|
|
|
|
Balance at beginning of year |
|
$ |
10.8 |
|
|
$ |
11.8 |
|
|
$ |
10.6 |
|
Additions charged to earnings |
|
|
7.8 |
|
|
|
8.6 |
|
|
|
10.3 |
|
Deductions |
|
|
(8.1 |
) |
|
|
(9.6 |
) |
|
|
(9.1 |
) |
|
|
|
|
|
|
|
|
|
|
Balance at end of year |
|
$ |
10.5 |
|
|
$ |
10.8 |
|
|
$ |
11.8 |
|
|
|
|
|
|
|
|
|
|
|
|
|
|
|
|
|
|
|
|
|
|
|
|
Provision for Discounts and Warranties |
|
|
|
|
|
|
|
|
|
|
|
|
Balance at beginning of year |
|
$ |
43.7 |
|
|
$ |
51.9 |
|
|
$ |
56.2 |
|
Additions charged to earnings |
|
|
182.0 |
|
|
|
225.6 |
|
|
|
228.6 |
|
Deductions |
|
|
(187.9 |
) |
|
|
(233.8 |
) |
|
|
(232.9 |
) |
|
|
|
|
|
|
|
|
|
|
Balance at end of year |
|
$ |
37.8 |
|
|
$ |
43.7 |
|
|
$ |
51.9 |
|
|
|
|
|
|
|
|
|
|
|
Exhibit Index
| |
|
|
| Exhibit No. |
| |
|
|
| No. 10.7
|
|
Credit Agreement, dated as of October 2, 2006, by and among the
Company, certain subsidiaries of the Company as guarantors, Bank
of America, N.A., as Administrative Agent, the other lenders
party thereto, JP Morgan Chase Bank, N.A. and Barclays Bank PLC,
as Co-Syndication Agents and LaSalle Bank National Association
and the Bank of Nova Scotia, as Co-Documentation Agents. |
| |
|
|
| No. 10.8
|
|
Amendment No. 1, dated February 25, 2008, to the Credit
Agreement, dated October 2, 2006, by and among the Company,
certain subsidiaries of the Company as guarantors, Bank of
America, N.A. and Barclays Bank PLC, as Co-Syndication Agents
and LaSalle Bank National Association and the Bank of Nova
Scotia, as Co-Documentation Agents. |
| |
|
|
| No. 10.15
|
|
Schedule of Participating Officers and Directors to form of
Indemnification Agreement for Officers and Directors
incorporated by reference from the Current Report on Form 8-K
dated October 2, 2006, wherein it appeared as Exhibit 10.8. |
| |
|
|
| No. 10.28
|
|
Schedule of Participating Officers and Directors to form of
Indemnification Agreement for Officers and Directors
incorporated by reference from the Quarterly Report on Form 10-Q
for the quarter ended September 30, 2009, wherein it appeared as
Exhibit 10.32. |
| |
|
|
| No. 10.32
|
|
Letter to Frank J. Ready dated January 8, 2010. |
| |
|
|
| No. 11
|
|
Computation of Earnings Per Share. |
| |
|
|
| No. 21
|
|
Armstrong World Industries, Inc.’s Subsidiaries. |
| |
|
|
| No. 23.1
|
|
Consent of Independent Registered Public Accounting Firm. |
| |
|
|
| No. 23.2
|
|
Consent of Independent Registered Public Accounting Firm. |
| |
|
|
| No. 24
|
|
Power of Attorney and Authorizing Resolution. |
| |
|
|
| No. 31.1
|
|
Certification of Principal Executive Officer required by Rule
13a-15(e) or 15d-15(e) of the Exchange Act. |
| |
|
|
| No. 31.2
|
|
Certification of Principal Financial Officer required by Rule
13a-15(e) or 15d-15(e) of the Exchange Act. |
| |
|
|
| No. 32.1
|
|
Certification of Chief Executive Officer required by Rule 13a
and 18 U.S.C. Section 1350. |
| |
|
|
| No. 32.2
|
|
Certification of Chief Financial Officer required by Rule 13a
and 18 U.S.C. Section 1350. |
| |
|
|
| No. 99.1
|
|
Worthington Armstrong Venture consolidated financial statements
as of December 31, 2009 and 2008 and for the years ended
December 31, 2009, 2008 and 2007. |