Attached files
| file | filename |
|---|---|
| 8-K - FORM 8-K - Delek US Holdings, Inc. | c13087e8vk.htm |
Exhibit 99.1

| Investor Presentation February 2011 |

| Business Overview Refining. Marketing. Retail. |

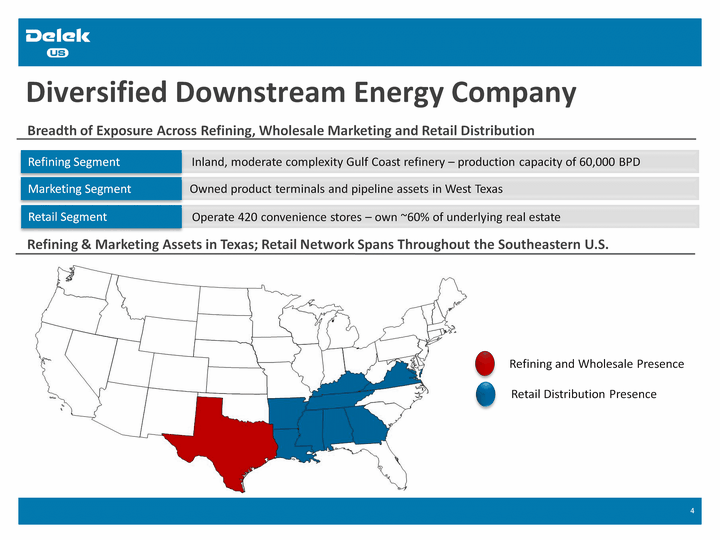
| Diversified Downstream Energy Company Breadth of Exposure Across Refining, Wholesale Marketing and Retail Distribution Inland, moderate complexity Gulf Coast refinery - production capacity of 60,000 BPD Refining Segment ) Owned product terminals and pipeline assets in West Texas Marketing Segment Operate 420 convenience stores - own ~60% of underlying real estate Retail Segment 3 Refining and Wholesale Presence Retail Distribution Presence Refining & Marketing Assets in Texas; Retail Network Spans Throughout the Southeastern U.S. |

| Refining Segment Operational Update |

| Refining Segment | Operational Update Elevated benchmark 5-3-2 Gulf Coast crack spread supported by strong distillate economics early in 2011 5 Strong Gulf Coast Refining Economics Entering 2011 Spreads between WTI and LLS/Brent/Mars have widened substantially during the first quarter 2011 Access To WTI is a Key Competitive advantage Long-term focus on producing higher value products such as ULSD and gasoline Focused on producing more high- value specialty products 100% of production at Tyler is sold into the local market Niche Market Position Remains Intact Regulatory spending at Tyler largely complete Anticipate Tyler CAPEX will be ~$20 million in 2011(1) Lower Capital Spending Requirements Expected In 2011 (1) As indicated in the Company's latest form 10-Q |

| Tyler Refinery Is A Niche, Inland Asset Tyler Refinery 60,000 barrels per day Niche, Inland Refiner In PADD III ) 9.4 complexity; equipped with a delayed coking unit High Conversion, Moderate Complexity Process local crudes such as West Texas Intermediate and East Texas Crude Processes Mostly Light Sweet Crudes 6 Generally produces more than 90% light products; sold at rack in Tyler market Production Sold Into Local Niche Market Tyler Refinery Refinery Product Slate(2) (1) Crude slate data for the full-year 2009, as indicated in the Company's latest 10-K (2) Nine Months Ended September 30, 2010 Tyler Refinery Crude Slate(1) (CHART) (CHART) |

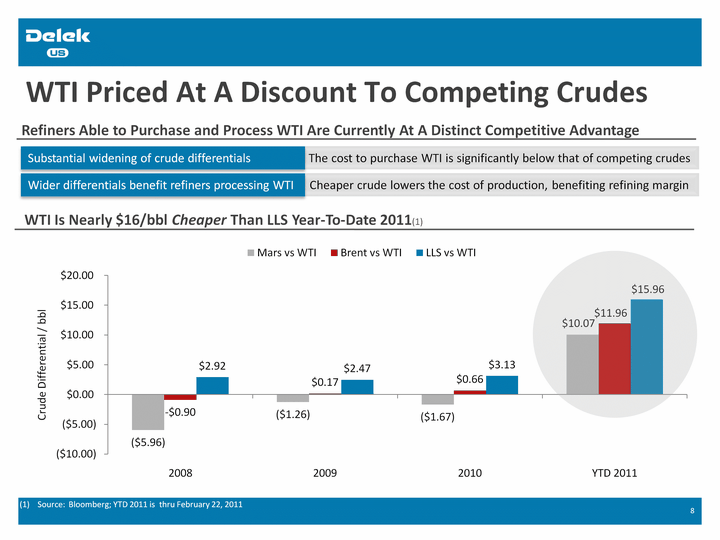
| WTI Priced At A Discount To Competing Crudes The cost to purchase WTI is significantly below that of competing crudes Substantial widening of crude differentials ) Cheaper crude lowers the cost of production, benefiting refining margin Wider differentials benefit refiners processing WTI 7 (CHART) WTI Is Nearly $16/bbl Cheaper Than LLS Year-To-Date 2011(1) Source: Bloomberg; YTD 2011 is thru February 22, 2011 Refiners Able to Purchase and Process WTI Are Currently At A Distinct Competitive Advantage |

| WTI Contango Market Structure Favors Tyler WTI Contango Benefit Effectively Reduces Tyler's Cost of Crude Oil Tyler historically has purchased mostly WTI - an inexpensive local crude Purchase Light, Sweet, Domestic Crudes ) Serves as a reduction to our cost of goods; additive to refining margin Contango Lessens Our Cost of Crude 8 WTI Differential To CMA NYMEX(1) Quarterly contango calculation derived from Argus Media (trade) month average prices *March 2011 trade-month-to-date data is as of February 18, 2011 (CHART) |

| Crude Inventories At Cushing Remain Elevated 9 (CHART) Operable Crude Oil Storage Capacity at Cushing, OK Has Risen In Recent Months(1) Source: EIA; assumes estimated operable storage capacity of 44 mil barrels |

| Contango Benefits The Theoretical Benchmark Building a Theoretical Benchmark High-Sulfur Diesel 5-3-2 Gulf Coast Crack Spread + Contango Benefit = Benchmark "Theoretical" Benchmark For Tyler 10 High-Sulfur Diesel 5-3-2 Gulf Coast Crack Spread, Including Contango Benefit *Source: WTI Backwardation/Contango data is published and supplied by Argus Media; all crack spread data supplied by Platts; February 2011 month-to-date crack spread data is as of February 21, 2011. (CHART) |

| Refining Benchmark Well Above Historical Levels 11 Gulf Coast 5-3-2 Crack Spread/bbl Reached Multi-Year High During January and February 2011(1) (1) Source: Platts; February 2011 data is thru February 21, 2011 Elevated Gulf Coast 5-3-2 Crack Spread In January and February Strong Refining Economics Entering 2011 Improved Benchmark Refining Economics During Early 2011 More than $6/bbl Above 4-Yr Trailing Average in January More than $10/bbl Above 4-Yr Trailing Average In February (CHART) |

| Expected Decline in Capital Spending At Tyler Tyler Capital Spending Forecast To Decline To Multi-Year Low In 2011 Invested more than $400 million in CAPEX at Tyler (2006-2010) Regulatory Spending Largely Complete ) Refining segment historically 65-90% of total annual Delek US CAPEX Net-Positive For Non-Refining Segments 2011 CAPEX in refining segment expected to be approximately $20 million(1) 2011 Refining CAPEX Lowest Since IPO 12 Actual and Projected Capital Spending at Tyler ($MM) (1) As indicated in the latest form 10-Q (CHART) |

| Retail Segment Operational Update |

| Retail Segment | Operational Update Same-store merchandise sales benefit from new product offerings and food service 14 Recovery In Same-Store Merchandise Sales Recovery in Vehicle Miles Traveled; no major supply disruptions; more affordable fuel at the pump Lower Fuel Prices Helped Fuel Demand Adding Quick Service Restaurant concepts to locations - positioning MAPCO as a fresh food destination point Food Service Initiative Gaining Momentum Introduced dozens of new private label SKUs that generate higher average gross profit margin Private Label Initiative - A Key Margin Driver Focused on enhancing the look/feel and branding of older locations to attract broader demographic Store Reimaging Program Successful - Remains a Key Focus Intend to build 10-20 stores per annum during the next five years in both existing and new markets Multi-Year New Store Construction Program Begins In 2011(1) (1) As indicated on the Company's Third Quarter 2010 Earnings Conference Call dated November 4, 2010 |

| Cyclical Recovery In Same-Store Sales Key Factors Affecting Same-Store Sales Relevant Factors: Location, size, appeal, offering, affordability, people Same-Store Merchandise Sales ) Relevant Factors: Commodity prices, weather, supply disruptions Same-Store Gallons Sold 15 Same-Store Merchandise Sales (Y/Y % Change) Same-Store Fuel Gallons Sold (Y/Y % Change) (CHART) (CHART) |

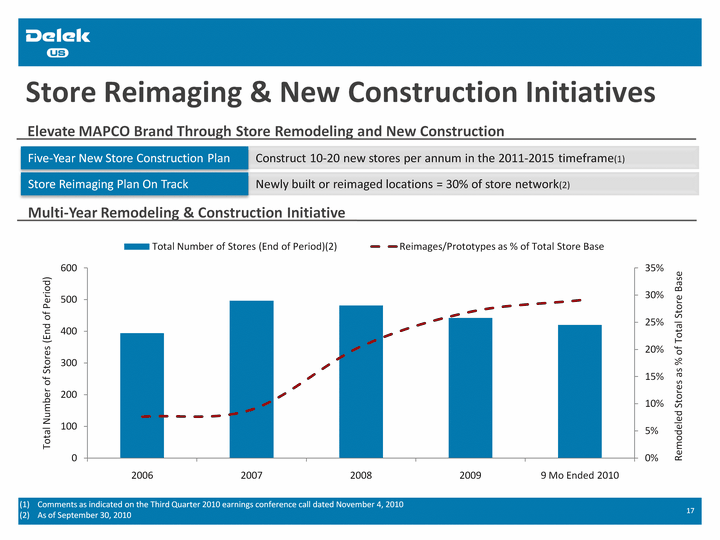
| Store Reimaging & New Construction Initiatives Elevate MAPCO Brand Through Store Remodeling and New Construction ) Construct 10-20 new stores per annum in the 2011-2015 timeframe(1) Five-Year New Store Construction Plan 16 Multi-Year Remodeling & Construction Initiative Comments as indicated on the Third Quarter 2010 earnings conference call dated November 4, 2010 As of September 30, 2010 ) Newly built or reimaged locations = 30% of store network(2) Store Reimaging Plan On Track (CHART) |

| Marketing Segment Operational Update |

| Marketing Segment | Operational Update Wholesale Marketing In West Texas Owned (San Angelo, Abilene, Tyler); Third-Party (Aledo, Odessa, Big Spring, Frost) Product Marketing Terminals ) Owned and leased pipelines transport crude to Tyler refinery Supply Synergies With Tyler 18 Total Sales Volumes (BPD) ) Annual CAPEX less than $1 million per year 2006-2010 Minimal CAPEX requirements ) Positive contribution margin every quarter since 2006 Consistent Contribution Margin Consistent Contribution Margin ($MM) (CHART) (CHART) *2010 YTD is defined as the nine months period ended September 30, 2010 |

