Attached files
 Rex
Energy Rex Energy
Year End 2010 Conference Call
Year End 2010 Conference Call
Rex Energy Corporation | 476 Rolling Ridge Drive | State College, PA 16801
P: (814) 278-7267 | F: (814) 278-7286
E: InvestorRelations@RexEnergyCorp.com
www.rexenergy.com
Together We Can Make A Difference
Exhibit 99.2 |
 Forward
Looking Statements Except for historical information, statements made in this
release, including those relating to significant potential, future earnings, cash flow, capital expenditures,
production growth and planned number of wells (as well as the timing of rig operations,
natural gas processing plant commissioning and operations, fracture stimulation
activities and the completion of wells and the expected dates that wells are producing hydrocarbons that are sold), are forward-looking statements
within
the
meaning
of
Section
27A
of
the
Securities
Act
of
1933,
as
amended,
and
Section
21E
of
the
Securities
Exchange
Act
of
1934,
as
amended.
These
forward-
looking
statements
are
indicated
by
words
such
as
“expected”,
“expects”,
“anticipates”
and
similar
words.
These
statements
are
based
on
assumptions
and
estimates that management believes are reasonable based on currently available
information; however, management's assumptions and the company's future
performance are subject to a wide range of business risks and uncertainties, and there is
no assurance that these goals and projections can or will be met. Any number of
factors could cause actual results to differ materially from those in the forward-looking statements, including (without limitation) the following:
•adverse economic conditions in the United States and globally;
•the difficult and adverse conditions in the domestic and global capital and credit
markets; •domestic and global demand for oil and natural gas;
•sustained
or
further
declines
in
the
prices
the
company
receives
for
oil
and
natural
gas;
•the
effects
of
government
regulation,
permitting
and
other
legal
requirements;
•the geologic quality of the company’s properties with regard to, among other things, the existence of hydrocarbons in economic
quantities; •uncertainties about the estimates of the company’s oil and natural gas reserves;
•the company’s ability to increase production and oil and natural gas income through exploration and
development; •the company’s ability to successfully apply horizontal drilling techniques and tertiary recovery
methods; •the number of well locations to be drilled, the cost to drill and the time frame within
which they will be drilled; •the effects of adverse weather on operations;
•drilling and operating risks;
•the ability of contractors to timely and adequately perform their drilling, construction,
well stimulation, completion and production services;
•the availability of equipment, such as drilling rigs and transportation pipelines;
•changes in the company’s drilling plans and related budgets;
•the adequacy of capital resources and liquidity including (without limitation) access to
additional borrowing capacity; and •uncertainties associated with our legal proceedings and the outcome.
The company undertakes no obligation to publicly update or revise any forward-looking
statements. Further information on the company’s risks and uncertainties is
available in the company's filings with the Securities and Exchange Commission.
The company's internal estimates of reserves may be subject to revision and may be
different from estimates by the company's external reservoir engineers at year
end. Although the company believes the expectations and forecasts reflected in these and other forward-looking statements are reasonable, it can give no
assurance they will prove to have been correct. They can be affected by inaccurate
assumptions or by known or unknown risks and uncertainties. 2
Forward Looking Statements
Forward Looking Statements |
 Hydrocarbon Volume Estimates
This presentation includes management’s estimates of Marcellus Shale potential
recoverable resources, per well EUR (estimated ultimate recovery of resources)
and
upside
potential
of
recoverable
resources.
Except
as
noted,
these
have
been
estimated
internally
by
the
Company
without
review
by
independent
engineers and do not necessarily constitute reserves. These estimates are included
to demonstrate the potential for future drilling by the Company. Actual
recovery of these potential volumes is inherently more speculative than recovery of
estimated proved reserves. Estimates of potential recoverable resources,
per well EURs and upside potential for Company oil and gas shale acreage are
particularly speculative due to the limited experience in Marcellus Shale
horizontal development, with its limited production history. Ultimate recoveries will be dependent upon numerous factors including actual
encountered geological conditions, the impact of future oil and gas pricing and
exploration costs, and our future drilling decisions and budgets based upon our
future evaluation of risk, returns and the availability of capital and, in many areas, the outcome of negotiation of drilling arrangements with holders of
adjacent or fractional interest leases. In addition, potential recoverable
resources are based on undesignated future well locations under assumed acreage
spacing which may not have been specifically included in any definitive development plan
and ultimately may not be drilled. Accordingly, such estimates may differ
significantly from the hydrocarbon quantities that are ultimately recovered. SEC
rules prohibit a publicly-reporting oil and gas company from including oil and gas resource estimates in their filings with the SEC, except proved, probable
and
possible
reserves
that
meet
the
SEC’s
definitions
of
such
terms.
Illinois
Basin
estimates
(including
Lawrence
Field)
of
oil
in
place
and
other
resource
volumes,
oil
in
place
and
other
reserve
volumes
indicated
herein
are
not
based
on
SEC
definitions
and
guidelines.
Unless
otherwise
indicated,
estimates
of
non-proved reserves and other hydrocarbons included herein may not meet specific
definitions of reserves or resource categories within the meaning of the
SPE/SPEE/WPC Petroleum Resource Management System. Hydrocarbon Value Estimates
Hydrocarbon Value Estimates
3 |
 Key
Takeaways Key Takeaways
4
th
Quarter Highlights
•
Average
Daily
Production:
Up
12%
from
3
rd
quarter
•
Oil
&
Gas
Revenue:
Up
14%
from
3
rd
quarter
•
Lease
Operating
Expense
per
Mcfe:
down
11%
compared
to
3
rd
quarter
due to increased production
•
EBITDAX:
Up
42%
from
3
rd
Quarter
2010 Highlights
•
Full year average daily production increased 26%
over 2009 average daily production
•
Operating
revenue
including
cash
settled
derivatives
increased
28%
over
2009
(1)
•
EBITDAX: Up 17% compared to 2009
•
Proved reserves increased 61% (net) over previous year
•
Total reserve replacement of 1,560%, with an increase to
201.7 Bcfe
of proved reserves
•
Historical reserve CAGR of 75%
•
Drill Bit F&D of $0.68/ Mcfe
2011 Outlook
•
Full year production expected to grow 71% -
95%
over 2010
•
74% of 2011 capital budget allocated to oil and liquids-rich
production areas
1-
Excludes $4.6M cash settled derivative unwind in first quarter,
2009
4 |
 Daily
Production & Pricing Daily Production & Pricing
1
st
Quarter
2010
2
nd
Quarter
2010
3
rd
Quarter
2010
4
th
Quarter
2010
Quarter to Quarter
Change %
Change Production
–
Average
Per
Day
Oil (Bbls)
1,886
1,856
1,912
1,924
12
1%
Gas (Mcf)
7,394
7,357
8,415
10,647
2,232
27%
Natural Gas Liquids (Bbls)
58
51
77
94
17
22%
Mcfe
19,059
18,799
20,346
22,755
2,409
12%
Average Crude Oil Price per Bbl
Realized Price (Before Derivatives)
$ 74.99
$ 74.80
$ 72.60
$ 81.59
$ 9.99
12%
Realized Impact From Cash Settled Derivatives
$ (4.91)
$ (5.12)
$ (3.58)
$ (8.65)
$ 5.07
142%
Effective Realized Price
$ 70.08
$ 69.68
$ 69.02
$ 72.94
$ 3.92
6%
Average Natural Gas Price per Mcf
Realized Price (Before Derivatives)
$ 5.44
$ 4.10
$ 4.49
$ 4.03
$ 0.46
10%
Realized Impact From Cash Settled Derivatives
$ 0.90
$ 1.80
$ 1.36
$ 1.85
$ 0.49
33%
Effective Realized Price
$ 6.34
$ 5.90
$ 5.85
$ 5.88
$ 0.03
1%
Average Natural Gas Liquid Price per Bbl
Realized Price
$ 32.02
$ 32.65
$ 24.53
$ 42.48
$ 17.95
73%
5 |
 Selected
Financial Highlights Selected Financial Highlights
(in millions except per share data)
1
st
Quarter
2010
2
nd
Quarter
2010
3
rd
Quarter
2010
4
th
Quarter
2010
Quarter to Quarter
Change % Change
Operating Revenue
$ 16.8
$ 15.7
$ 16.9
19.5
$ 2.6
15%
Gain (Loss) on Oil & Gas Cash Settled Derivatives
$ (0.2)
$ 0.3
$ 0.4
$0.3
$ 0.1
25%
Total Revenue & Cash Settled Derivatives
$ 16.6
$ 16.0
$ 17.3
$19.8
$ 2.5
14%
Lease Operating Expense
$ 5.9
$ 5.8
$ 6.5
$6.5
$ 0.0
0%
General & Administrative
$ 4.2
$ 4.6
$ 5.0
$4.2
$ 0.8
16%
Loss (Gain) on Sale of Assets & Impairment
$ 0.6
$ 0.6
$ (14.1)
$5.4
$ 19.5
138%
Exploration Expense (Income)
$ 1.1
$ 2.3
$ (0.5)
$2.3
$ 2.8
560%
DD&A & Accretion
$ 5.1
$ 5.1
$ 5.0
$6.6
$ 1.6
32%
Interest Expense
$ 0.1
$ 0.4
$ 0.6
$0.3
$ 0.3
50%
Net Earnings (Loss) Comparable to Analysts’
Estimates
$ 0.0
$ (1.7)
$ 0.4
$(0.7)
$(1.1)
275%
Net Earnings (Loss) Comparable to Analysts’
Estimates per Share
$ 0.00
$ (0.04)
$ 0.01
$(0.02)
$ (0.03)
300
%
EBITDAX
$ 6.7
$ 5.8
$ 5.7
$8.1
$ 2.4
42%
6 |
 Current
Hedging Summary Current Hedging Summary
Current Production Hedged
•
Percentage of production hedged based on December,
2010 exit rate with built in decline
7
1. ~30% of current natural gas production covered in 2011 by putspread with a $3.84 short put
price for a $1.04 put spread 2. ~21% of current natural gas production covered in
2011 and 2012 by put spread with a $4.00 short put price for a $1.75 put spread |
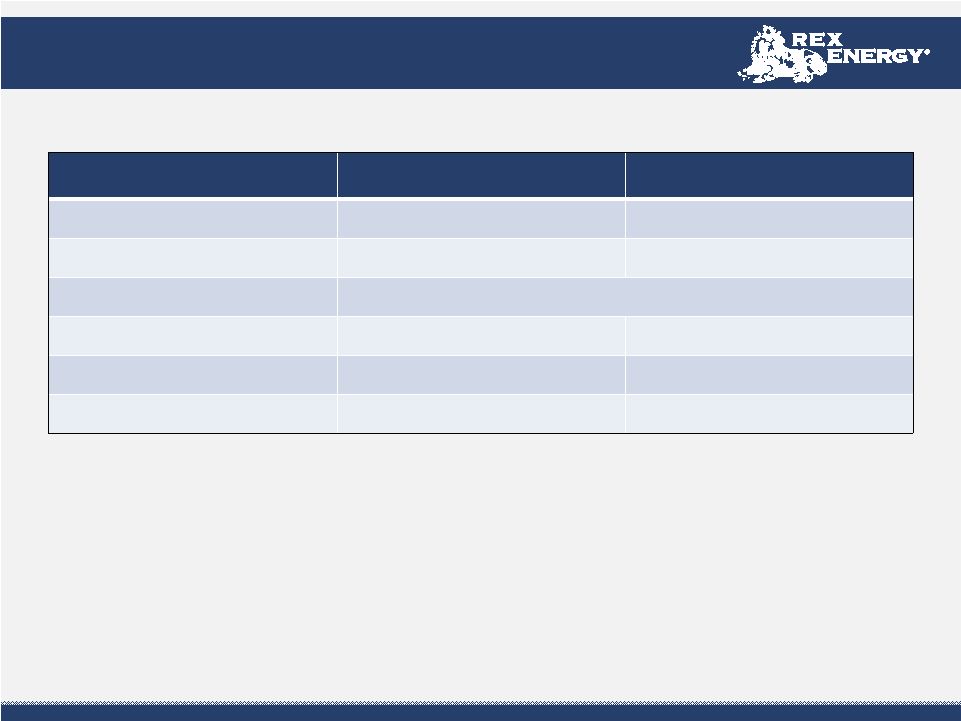
 Balance
Sheet Balance Sheet
($ in millions)
Dec. 31, 2010
Dec. 31, 2010
Assets
Cash & Cash Equivalents
11.0
Other Current Assets
34.8
Net Property and Equipment
322.7
Other Net Assets
37.5
Total Assets
406.0
Liabilities
and
Owners’
Equity
Current Liabilities
62.3
Senior Secured Line of Credit and Long Term Debt
10.0
Other Long-Term Liabilities
29.0
Total Liabilities
101.3
Total Owners’
Equity
304.7
Total
Liabilities
and
Owners’
Equity
406.0
Debt to Owners’
Equity Ratio
0.03x
Additional Liquidity Availability
Net Borrowing Base Availability
115.0
Remaining on Sumitomo Carry
28.8
8 |
 Guidance
1st Quarter 2011
Full Year 2011
Production
25.8 –
27.3 MMcfe/d
34.7 –
39.4 MMcfe/d
% Production Oil
~ 40%
~ 34%
Exit Rate (December 2011 Production)
40.7 –
48.5 MMcfe/d
Lease Operating Expenses
$ 6.7 –
7.2 million
$ 32.0 –
37.0 million
Cash General & Administrative
$ 4.9 –
5.3 million
$ 20.0 –
21.0 million
Capital Expenditures
$ 20.4 million
$ 148.8 million
9 |
 Marcellus
Projects: Butler Marcellus Projects: Butler
~34,100 net acres -
70% Rex Energy / 30% Sumitomo
E&P
•
Inception to date, currently have 11 gross (7.7
net) wells in service
o
5 well Drushel
pad awaiting fracture
stimulation estimated to begin March 1
st
o
Drilling lateral on second well of three
on Talarico
pad
•
25 gross (16 net) wells planned to be drilled
in 2011
•
Second rig expected in the area early
2
nd
Quarter 2011
Midstream
•
Sarsen
Plant –
40 MMcf/d
cryogenic facility
o
Operating at ~20.0 Mmcf
/d with current
capacity of 30 Mmcf
/d
o
Additional capacity of 10 Mmcf/d
is
available through additional compressor
•
Second cryogenic plant in permitting process
and is expected to be commissioned by 1Q 2012
Leasing
•
Company has completed and is in the process of
closing the 9,000 acres required under Sumitomo
Joint Venture agreement
10 |
 2011
Butler Drilling Schedule 2011 Butler Drilling Schedule
Rig
Pad
Pad
Gross Well
Gross Well
Count
Count
Net Well
Net Well
Count
Count
Status
Status
UDI 54
Drushel¹
5
3.5
Awaiting fracture and completion in 1Q11
UDI 54
Talarico
3
2.1
Horizontal rig currently drilling second
of three wells to fracture and complete in 2Q11
UDI 54
Grosick
7
3.0
Pilot holes drilled, awaiting horizontal rig
UDI 54
Gilliland
6
4.2
Currently drilling last
of six pilot holes with vertical rig,
included is one horizontal Upper Devonian well
21
12.8
UDI 52
McElhinney
2
1.4
Awaiting vertical and horizontal rig
UDI 52
Behm
3
2.1
Awaiting vertical and horizontal rig
UDI 52
Grahm
3
2.1
Awaiting vertical and horizontal rig
8
5.6
11
•UDI 54 rig is currently drilling
onsite •Expect to
pick up UDI 52 rig in the second quarter of 2011 1. Four of the five Drushel
wells were drilled in 2010 |
 Marcellus
Projects: Westmoreland Marcellus Projects: Westmoreland
Operated by Williams Appalachia, LLC
~8,600 net acres / 40% working interest
E&P
•
Inception to date, currently have 9 gross
(3.6 net) wells placed in service
o
5 Uschak
#2 wells drilled awaiting
fracture stimulation
o
H&P 287 Rig currently drilling last
of three Androstic
wells
o
Patterson 480 Rig currently drilling
last of four Uschak
#1 wells
•
20 gross (8 net) wells expected to be
drilled in 2011
Midstream
•
Currently constrained at ~14 gross
MMcf
per day
•
Jointly owned gathering system being
constructed to Equitrans
with completion
expected in May 2011
o
Additional gathering system
will increase capacity to
26 –
38 Mmcf/d
12 |
 Rig
Pad
Pad
Gross Well
Gross Well
Count
Count
Net Well
Net Well
Count
Count
Status
Status
H&P 287
Uschak
#2
1
5
2
Drilled, awaiting fracture and
completion
H&P 287
Androstic
3
1.2
Currently drilling last of three wells
H&P 287
National Metals
2
0.8
Awaiting drilling rig
H&P 287
Frye
2
0.8
Awaiting drilling rig
H&P 287
McBroom
2
0.8
Awaiting drilling rig
H&P 287
Skacel
2
0.8
Awaiting drilling rig
16
6.4
Patterson 480
Uschak #1
4
1.6
Currently drilling last of
four wells
Patterson 480
Marco
3
1.2
Awaiting drilling rig
7
2.8
2011 Westmoreland Drilling Schedule
2011 Westmoreland Drilling Schedule
1. Four of the five Uschak wells were drilled in 2010.
13 |
 Marcellus
Projects: Central Marcellus Projects: Central
Centre & Clearfield Counties, Pennsylvania
Operated by Williams Appalachia, LLC
~11,300 net acres / 40% working interest
E&P
•
Inception to date, currently have 4 gross
(1.6 net) wells placed in service
•
Vertical Rig drilling first of four wells on
Resource Recovery #3 pad
Midstream
•
Gathering system to Columbia Pipeline
complete
o
Current capacity at 10 Mmcf/d with
current option to add an additional
30 Mmcf/d
14 |
 Lawrence
Field ASP Update Lawrence Field ASP Update
Project Update
•
Completed a 25% pore volume injection of ASP slug, and
currently at 10% pore volume
o
Initial results expected during late first quarter 2011 to
early second quarter 2011
Phase I: (Middagh Unit)
•
Objectives:
o
Test University of Texas chemical recipe in the Bridgeport
Sandstone
o
Optimize drilling/completion procedure
o
Optimize reservoir flow conformance
o
Provide relatively rapid response time; economics
secondary
o
Optimize well pattern
o
Determine economic quantity of chemicals required for
future floods
Middagh Unit Design
15 |
 Niobrara
Overview Niobrara Overview
•
~65,400 gross (45,000 net) acres
•
3 horizontal wells drilled and fractured , all recovering
load
•
Silo State 41-22H:
o
Drilled to a total measured depth of 11,700 ft.
(3,560 ft. lateral length)
o
Controlled test rates of 201 gross BOE/d
(153 Bop/d & 288 Mcf/d)
o
On electric submersible pump (ESP) since 1/30/2011 with
48% of frac load recovered
•
Herrington 41-26H:
o
Drilled to a total measured depth of 11,950 ft.
(4,706 ft. lateral length)
o
Controlled test rates of 450 gross BOE/d
(408 BOE/d & 253 Mcf/d)
o
On ESP since 2/4/2011 with 51% of frac load recovered
•
BJB 34-14H:
o
Drilled to total measured depth of 10,800 ft.
(3,348 ft. lateral length)
o
Currently recovering fracture stimulation load
o
Showing similar production characteristics as Herrington
41-26H well
o
On ESP since 1/27/2011 with 30% of frac load recovered
•
Currently analyzing 3-D seismic in the Silo area
•
Resume drilling in the second quarter 2011
•
11 Additional Drilling Locations Identified
DJ Basin
Rex Energy
Silo State 41-22H
201 BOE/d Test Rate
Rex Energy
BJB #1H
Drilled and Completed,
Recovering Load
Rex Energy
Herrington Farms 1H
450 BOE/d Test Rate
16 |
 17
1)
Maintain a safe workplace, free of injury and
environmental damage.
2)
Fill the Sarsen plant as soon as possible.
3)
Complete our Butler County drilling program in
anticipation of having additional midstream capacity
from the Bluestone Plant early next year.
4)
Improve production on each Marcellus well by using
our experience to improve our drilling and frac
techniques while reducing F&D costs.
5)
Continue to arrest production declines and improve
lease operating expense in Illinois and Indiana.
6)
Complete our Lawrence Field ASP Pilot in the Middagh
Unit, and prepare the Perkins-Smith Unit for the next
ASP flood.
7)
Review our Silo Field seismic to top grade drilling
locations and execute our 5 well Niobrara plan for
2011.
2011 Focus
2011 Focus |
 Rex
Energy Rex Energy
Appendix: Non-GAAP Reconciliation Tables
Appendix: Non-GAAP Reconciliation Tables
Together We Can Make A Difference |
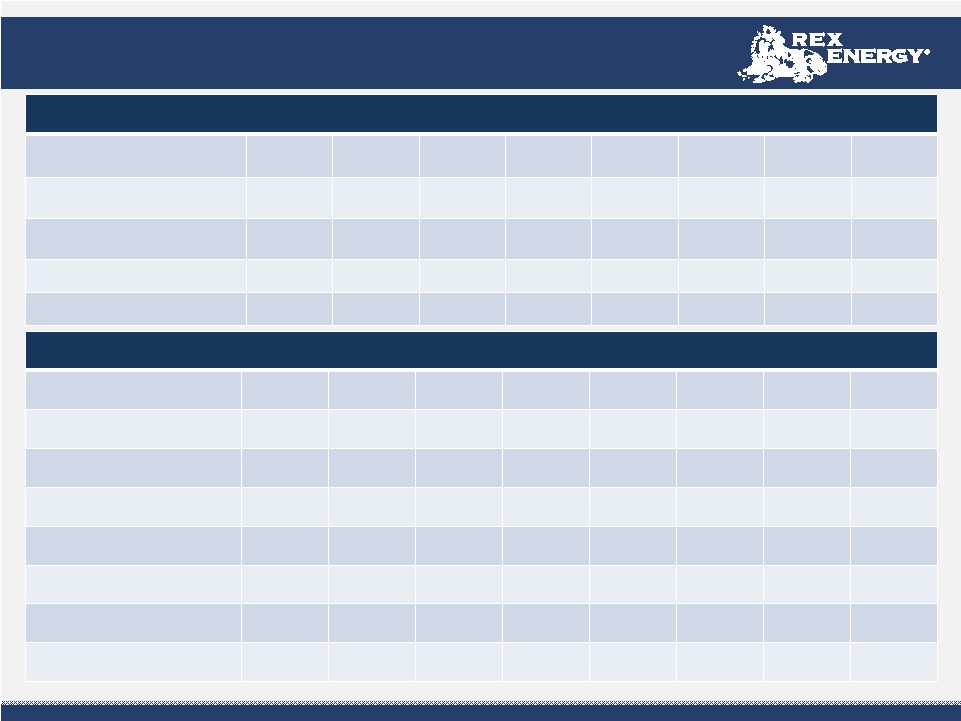 Current
Hedging Summary Current Hedging Summary
(1)
(1)
Crude Oil
1Q11
2Q11
3Q11
4Q11
1Q12
2Q12
3Q12
4Q12
Collar Contracts
Volume Hedged
144,000
144,000
144,000
144,000
135,000
135,000
135,000
135,000
Ceiling
$ 104.69
$ 104.69
$ 104.69
$ 104.69
$ 112.03
$ 112.03
$ 112.03
$ 112.03
Floor
$ 68.54
$ 68.54
$ 68.54
$ 68.54
$ 67.10
$ 67.10
$ 67.10
$ 67.10
19
1. Includes hedging position as of fiscal year end December 31, 2010 as well as
two additional natural gas hedges added in January, 2011. Natural Gas Hedges
1Q11
2Q11
3Q11
4Q11
1Q12
2Q12
3Q12
4Q12
Swap Contracts
Volume
260,000
300,000
300,000
300,000
330,000
330,000
330,000
330,000
Price
$ 5.09
$ 5.03
$ 5.03
$ 5.03
$ 5.58
$ 5.58
$ 5.58
$ 5.58
Collar Contracts
Volume
330,000
330,000
330,000
330,000
330,000
330,000
330,000
330,000
Ceiling
$ 7.18
$ 7.18
$ 7.18
$ 7.18
$ 7.07
$ 7.07
$ 7.07
$ 7.07
Floor
$ 5.18
$ 5.18
$ 5.18
$ 5.18
$5.09
$ 5.09
$5.09
$ 5.09 |
 Current
Hedging Summary Current Hedging Summary
(1)
(1)
1. Includes hedging position as of fiscal year end December 31, 2010 as well as
two additional natural gas hedges added in January, 2011. Natural Gas Hedges
Cont’d 1Q11
2Q11
3Q11
4Q11
1Q12
2Q12
3Q12
4Q12
Put Contracts
Volume
180,000
180,000
180,000
180,000
-
-
-
-
Floor
$ 8.00
$ 8.00
$ 8.00
$ 8.00
-
-
-
-
Put Contracts with Short
Volume
180,000
180,000
180,000
180,000
-
-
-
-
Floor
$ 5.00
$ 5.00
$ 5.00
$ 5.00
-
-
-
-
Short Put
$ 3.68
$ 3.68
$ 3.68
$ 3.68
-
-
-
-
Collar Contracts with Short
Volume
120,000
180,000
180,000
180,000
180,000
180,000
180,000
180,000
Ceiling
$ 5.25
$ 5.25
$ 5.25
$ 5.25
$ 5.25
$ 5.25
$ 5.25
$ 5.25
Floor
$ 4.75
$ 4.75
$ 4.75
$ 4.75
$ 4.75
$ 4.75
$ 4.75
$ 4.75
Short Put
$4.00
$4.00
$4.00
$4.00
$4.00
$4.00
$4.00
$4.00 |
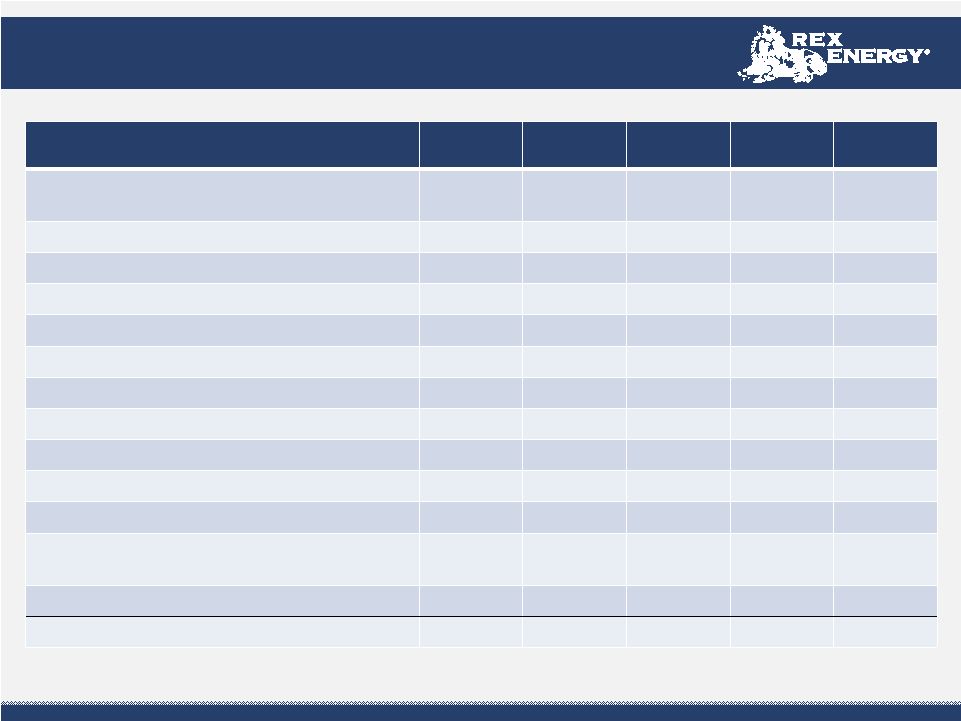 EBITDAX
(in thousands)
1
st
Quarter
2010
2
nd
Quarter
2010
3
rd
Quarter
2010
4
th
Quarter
2010
Full Year
2010
Net Income (Loss) from Continuing Operations
$ 1,992
$ 813
$ 9,540
$(6,559)
$5,783
Add Back (Less):
DD&A & Accretion
5,092
5,139
4,979
6,595
21,806
Non-Cash Compensation
433
521
213
(254)
914
Interest Expense
164
167
430
310
1,071
Impairment Expense
571
577
2,419
5,296
8,863
Exploration Expense (Income)
1,135
2,311
(474)
2,270
5,242
Interest Income
(35)
(16)
(6)
(12)
(68)
Realized Loss on Interest Rate Swap
196
195
196
123
710
Loss (Gain) on Disposal of Assets
2
(10)
(16,485)
98
(16,395)
Unrealized (Gain) Loss on Derivatives
(4,223)
(4,112)
(1,764)
4,140
(5,960)
Non-controlling Interest Share of Net Gain
56
64
88
45
253
Income Tax Expense (Benefit)
1,281
143
6,610
(3,959)
4,075
EBITDAX from Continuing Operations
$ 6,664
$ 5,792
$ 5,746
$8,093
$26,294
21 |
 Clean
Earnings Clean Earnings
(in thousands)
1
st
Quarter
2010
2
nd
Quarter
2010
3
rd
Quarter
2010
4
th
Quarter
2010
Full Year
2010
Income (Loss) From Continuing Operations Before Income Taxes, as
reported
$ 3,273
$ 956
$ 16,150
$ (10,518)
$ 9,858
Add Back (Less):
Unrealized Loss (Gain) on Derivatives
(4,223)
(4,112)
(1,764)
4,140
(5,960)
Non-Cash Compensation
433
521
213
(254)
914
Loss (Gain) on Disposal of Assets
2
(10)
(16,485)
98
(16,395)
Impairment of Unproved Properties
571
577
2,419
5,296
8,863
Loss Attributable to Noncontrolling
Interests
56
64
88
45
253
Loss From Continuing Operations Before Income Taxes, adjusted
$ 112
$ (2,004)
$ 621
$ (1,193)
$ (2,467)
Income Tax Benefit (Expense), adjusted
(1)
(44)
301
(254)
451
993
Clean Earnings (Loss) from Continuing Operations
$ 68
$ (1,703)
$ 367
$ (742)
$ (1,474)
1. Income tax adjustment represents the effect of our effective tax rate on Income (Loss) From
Continuing Operations Before Income Taxes, adjusted 22
|