Attached files
| file | filename |
|---|---|
| 8-K - FORM 8-K - TIDEWATER INC | d8k.htm |
| EX-99.2 - TRANSCRIPT OF THE PRESENTATION PRESENTED AT THE 2011 CS ENERGY SUMMIT CONFERENCE - TIDEWATER INC | dex992.htm |
 CREDIT SUISSE
2011 ENERGY SUMMIT
2011 ENERGY SUMMIT
February 8, 2011
February 8, 2011
Quinn P. Fanning
Quinn P. Fanning
Executive Vice President and
Executive Vice President and
Chief Financial Officer
Chief Financial Officer
Joseph M. Bennett
Joseph M. Bennett
Executive Vice President and
Executive Vice President and
Chief Investor Relations Officer
Chief Investor Relations Officer
Exhibit 99.1 |
 FORWARD-LOOKING STATEMENTS
2
Phone:
504.568.1010
Fax:
504.566.4580
Web:
www.tdw.com
Email:
connect@tdw.com
In accordance with the safe harbor provisions of the Private Securities Litigation Reform
Act
of
1995,
the
Company
notes
that
certain
statements
set
forth
in
this
presentation
provide other than historical information and are forward looking. The actual
achievement of any forecasted results, or the unfolding of future economic or business
developments in a way anticipated or projected by the Company, involve numerous risks
and uncertainties that may cause the Company’s actual performance to be materially
different from that stated or implied in the forward-looking statement. Among those risks
and uncertainties, many of which are beyond the control of the Company, include,
without limitation, fluctuations in worldwide energy demand and oil and gas prices;
fleet additions by competitors and industry overcapacity; changes in capital spending
by customers in the energy industry for offshore exploration, development and
production; changing customer demands for vessel specifications, which may make some of
our older vessels technologically obsolete for certain customer projects or in certain
markets; instability of global financial markets and difficulty accessing
credit or capital; acts of
terrorism and piracy; significant weather conditions; unsettled political conditions, war,
civil unrest and governmental actions, such as expropriation, especially in higher risk
countries of operations; foreign currency fluctuations; labor influences proposed by
international conventions; increased regulatory burdens and oversight following the
Deepwater Horizon incident; and enforcement of laws related to the environment, labor
and foreign corrupt practices. Participants should consider all of these risk factors
as well as other information contained in the Company’s form 10-K’s and
10-Q’s. |
 KEY
TAKEAWAYS Culture of safety & operating excellence
History of earnings growth and solid returns
World’s largest and newest fleet provides
basis for continued earnings growth
Strong balance sheet allows us to act upon
available opportunities
3 |
 SM
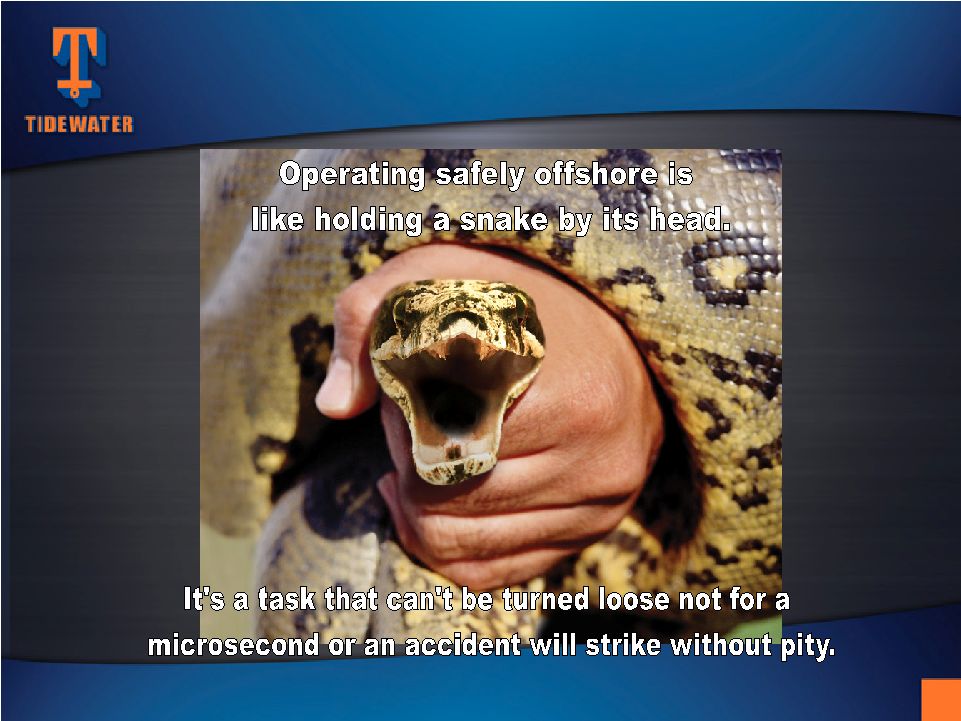
SAFETY –
SAFETY –
A TOP PRIORITY
A TOP PRIORITY
4 |
 0.00
0.25
0.50
0.75
1.00
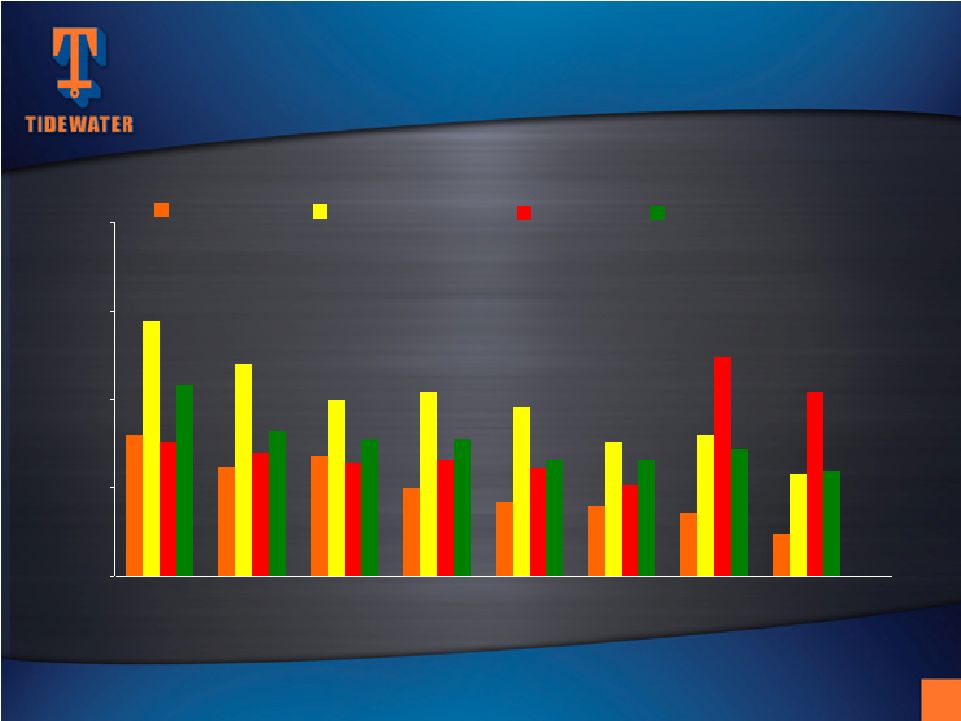
Total Recordable Incident Rates
Calendar Years
2002
2003
2004
2005
2006
2007
2008
2009
TIDEWATER
DUPONT
DOW CHEMICAL
EXXON MOBIL
SAFETY RECORD RIVALS
SAFETY RECORD RIVALS
LEADING COMPANIES
LEADING COMPANIES
5 |
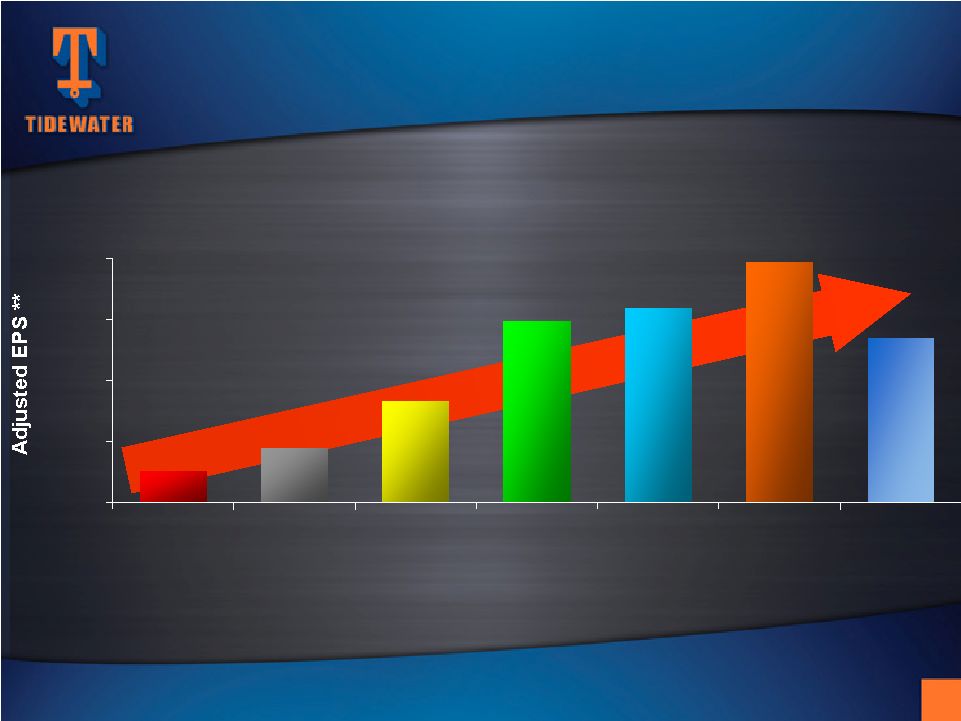 32%
Six-Year Compounded Annual Earnings Growth Rate
**
EPS
in
Fiscal
2004
is
exclusive
of
the
$.30
per
share
after
tax
impairment
charge.
EPS
in
Fiscal
2006
is
exclusive
of
the
$.74
per
share
after
tax
gain
from
the
sale
of
six
KMAR
vessels.
EPS
in
Fiscal
2007
is
exclusive
of
$.37
per
share
of
after
tax
gains
from
the
sale
of
14
offshore
tugs.
EPS
in
Fiscal
2010
is
exclusive
of
$.87
per
share
Venezuelan
provision,
a
$.70
per
share
tax
benefit
related
to
favorable
resolution
of
tax
litigation
and
a
$0.22
per
share
charge
for
the
proposed
settlement
with
the
SEC
of
the
company’s
FCPA
matter.
Adjusted Return
On Avg. Equity
4.3% 7.2%
12.4%
18.5%
18.3%
19.5%
11.9% SIGNIFICANT EARNINGS GROWTH
SIGNIFICANT EARNINGS GROWTH
6
$5.41
$7.89
$1.03
$1.78
$3.33
$5.94
$6.39
$0.00
$2.00
$4.00
$6.00
$8.00
Fiscal 2004
Fiscal 2005
Fiscal 2006
Fiscal 2007
Fiscal 2008
Fiscal 2009
Fiscal 2010 |
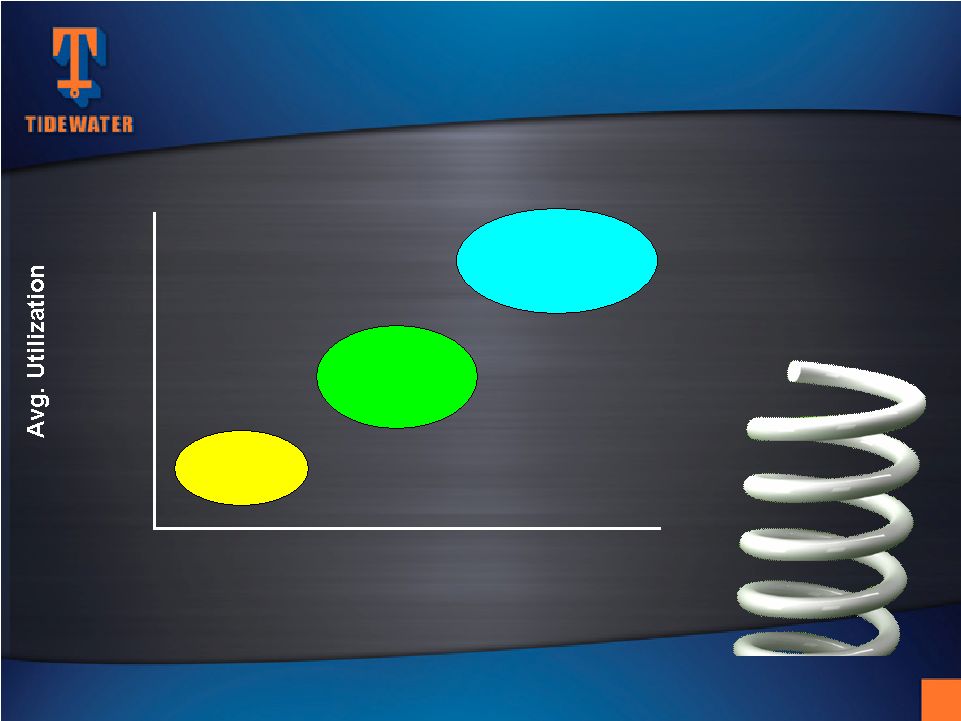 Avg.
Dayrates $14,561*
$16,017
(+ 10%)
$17,619
(+ 10%)
85.8%*
85.0%
90.0%
~$4.20
EPS
~$6.00
EPS
~$9.50
EPS
273 vessels assumes (191 current new vessels + 37 under construction + ~ 20
additional new vessels per year for two and a quarter years).
WHERE COULD FISCAL 2014 FIND US?
WHERE COULD FISCAL 2014 FIND US?
Potential for Earnings Acceleration
Potential for Earnings Acceleration
* 12/31/10 nine month YTD actual stats
This info is not meant to be a
prediction of future earnings
performance, but simply an
indication of earning sensitivities
resulting from future fleet
additions and reductions and
varying operating assumptions.
7
~$400M+
EBITDA
~$525M+
EBITDA
~$750M+
EBITDA |
 Unique global footprint; 50+ years of Int’l experience
Unmatched scale and scope of operations
International market opportunities
•
Growth
•
Longer contracts
•
Better utilization
•
Higher dayrates
Solid customer base of NOC’s and IOC’s
INTERNATIONAL STRENGTH
INTERNATIONAL STRENGTH
8 |
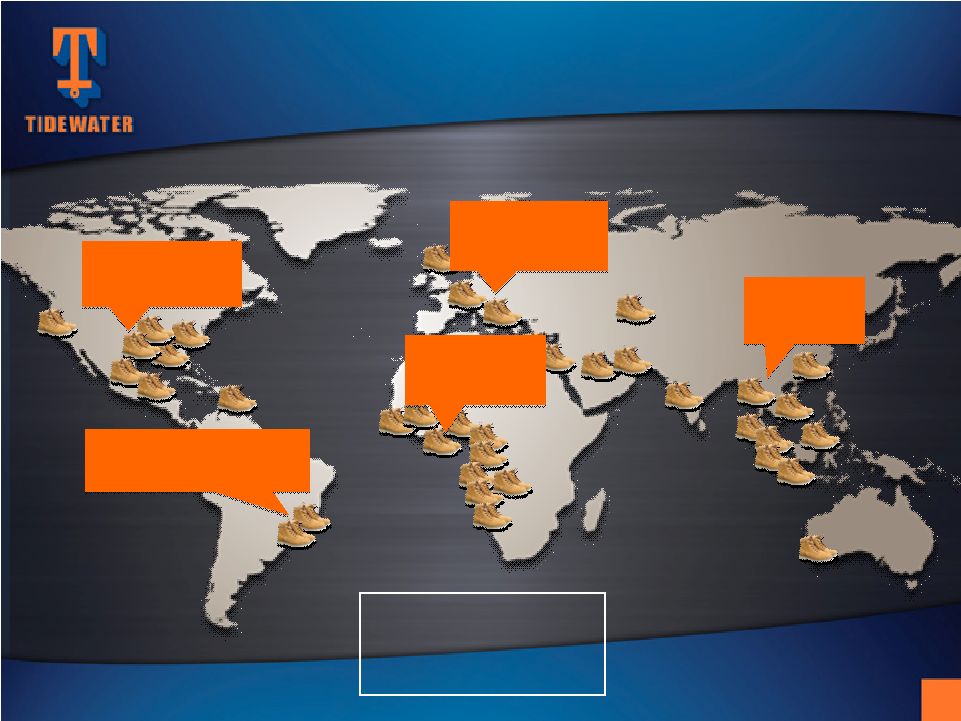           OUR
GLOBAL FOOTPRINT OUR GLOBAL FOOTPRINT
Vessel Distribution by Region
Vessel Distribution by Region
(excludes stacked vessels –
as of 12/31/10)
North America
17
(6%)
Central/South America
55
(20%)
West Africa
130
(47%)
Europe / M.E.
36
(13%)
Far East
39
(14%)
International / U.S.
2010: 94% / 6%
2000: 62% / 38%
9 |
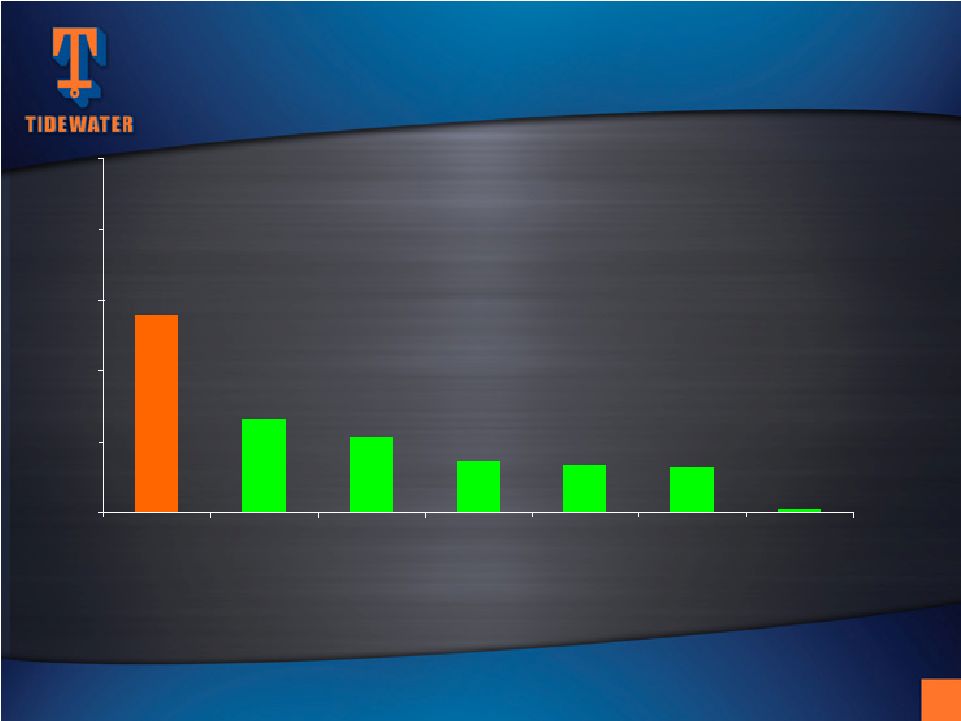 VESSEL POPULATION BY OWNER
(Includes AHTS and PSV’s
only) Estimated as of Mid-January 2011
Source:
ODS-Petrodata
and
Tidewater
Tidewater
Competitor #2
Competitor #3
Competitor #4
Competitor # 5
Competitor #1
Avg.
All Others (1,867
total
vessels for
350+ owners)
5
64
67
72
106
132
280
0
100
200
300
400
500
Tidewater fleet includes 138 vessel additions since 2000
10 |
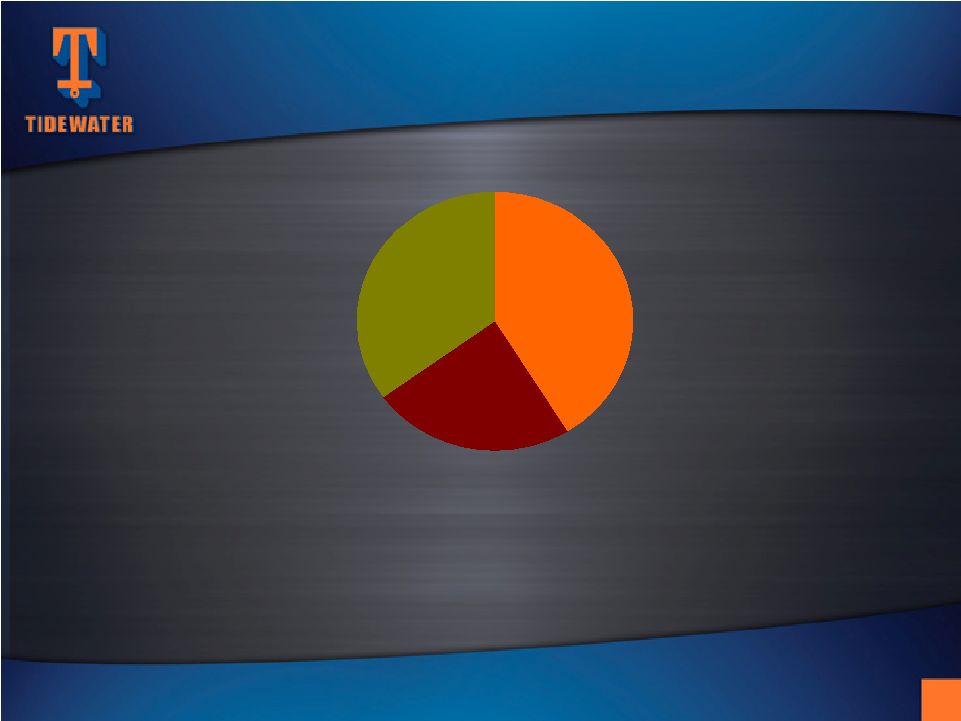 NOC's
24%
Others
35%
Super Majors
41%
Our top 10 customers in Fiscal 2010 (6 Super Majors,
3 NOC’s and one large independent) accounted for 63% of our revenue
CURRENT REVENUE MIX
CURRENT REVENUE MIX
Quality of Customer Base
Quality of Customer Base
11 |
 0
50
100
150
200
250
300
1965
1970
1975
1980
1985
1990
1995
2000
2005
2010
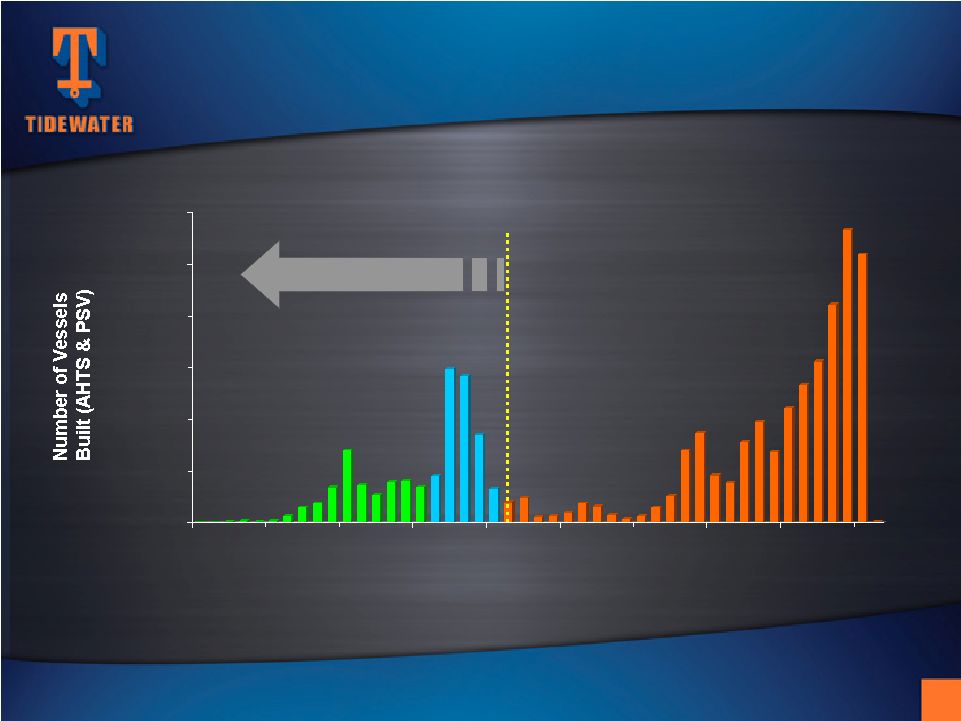
THE WORLDWIDE FLEET -
THE WORLDWIDE FLEET -
RETIREMENTS
RETIREMENTS
EXPECTED TO EXCEED NEW DELIVERIES
EXPECTED TO EXCEED NEW DELIVERIES
(Includes AHTS and PSV’s
only) Estimated as of Mid-January2011
Source:
ODS-Petrodata
and
Tidewater
As of mid-January 2011, there are approximately 387 additional AHTS
and PSV’s
(~15% of the global fleet) under construction.
Global fleet estimated at 2,588 vessels, including 331 vessels
that are 30+ yrs old (13%),
and another 454 vessels that are
25-29 yrs old (18%)
12
Vessels > 25 years old today |
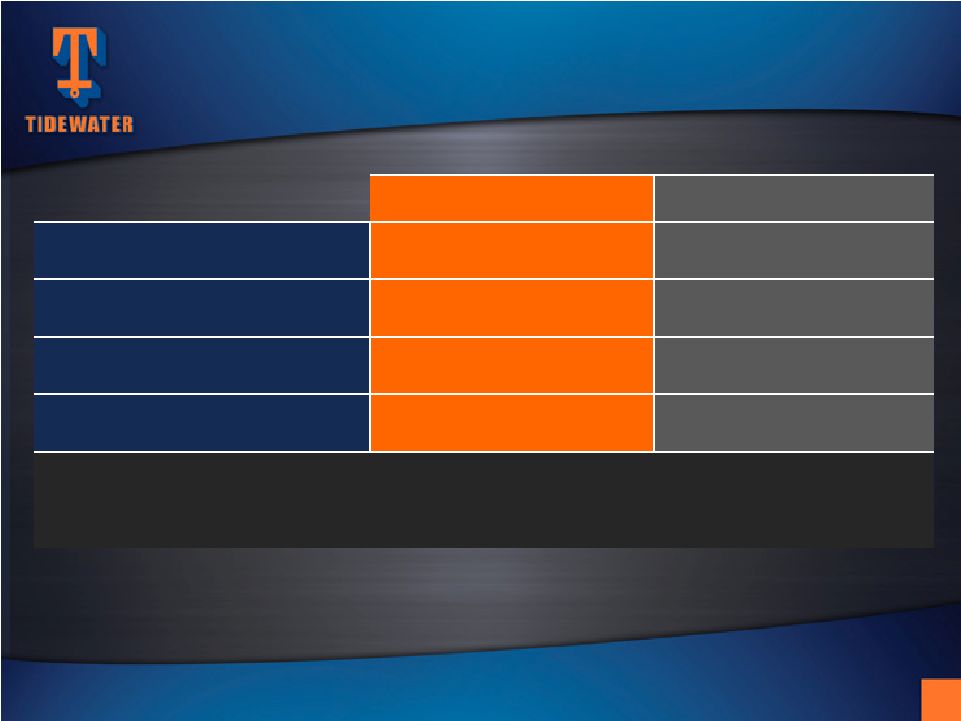 Vessel Count
Estimated Cost
AHTS
99
$1,735m
PSV’s
82
$1,651m
Crewboats & Tugs
67
$290m
TOTALS:
248
$3,676m
(1)
(1) $3,190m (87%) funded through 12/31/10
.
THE LARGEST MODERN FLEET
THE LARGEST MODERN FLEET
IN THE INDUSTRY…
IN THE INDUSTRY…
At 12/31/10, 191 new vessels in fleet with ~4.5 year average age
Vessel Commitments
Jan. ’00 –
December ‘10
13 |
 0
5
10
15
20
25
30
35
2001
2002
2003
2004
2005
2006
2007
2008
2009
2010
2011
2012
2013
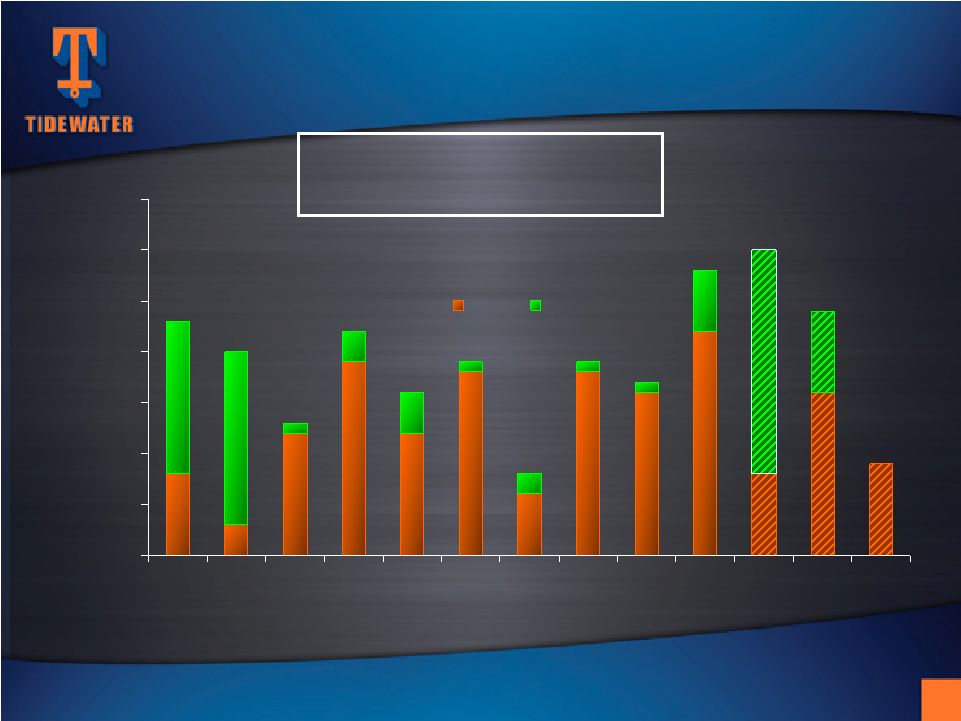
Built
Acquired
VESSEL DELIVERIES
VESSEL DELIVERIES
14
Fiscal Year
Fiscal years 2011-2013 include actual deliveries through 12/31/10 and
estimated deliveries of vessels committed to build or acquire as
of 12/31/10
At 12/31/10, total 248 vessels with
a capital cost of $3.68 billion |
 Count
AHTS
18
PSV
18
Crew and Tug
1
Total
37
Vessels Under Construction*
As of December 31, 2010
…
…
AND OUR LEAD IS GROWING
AND OUR LEAD IS GROWING
* Includes eleven new vessels committed to purchase as of 12/31/10
Estimated delivery schedule –
4 in remainder of FY ‘11,
24 in FY ‘12 and 9 thereafter
CAPX of $130m in remainder of FY ‘11,
$303m in FY ‘12 and $53m in FY ‘13
15 |
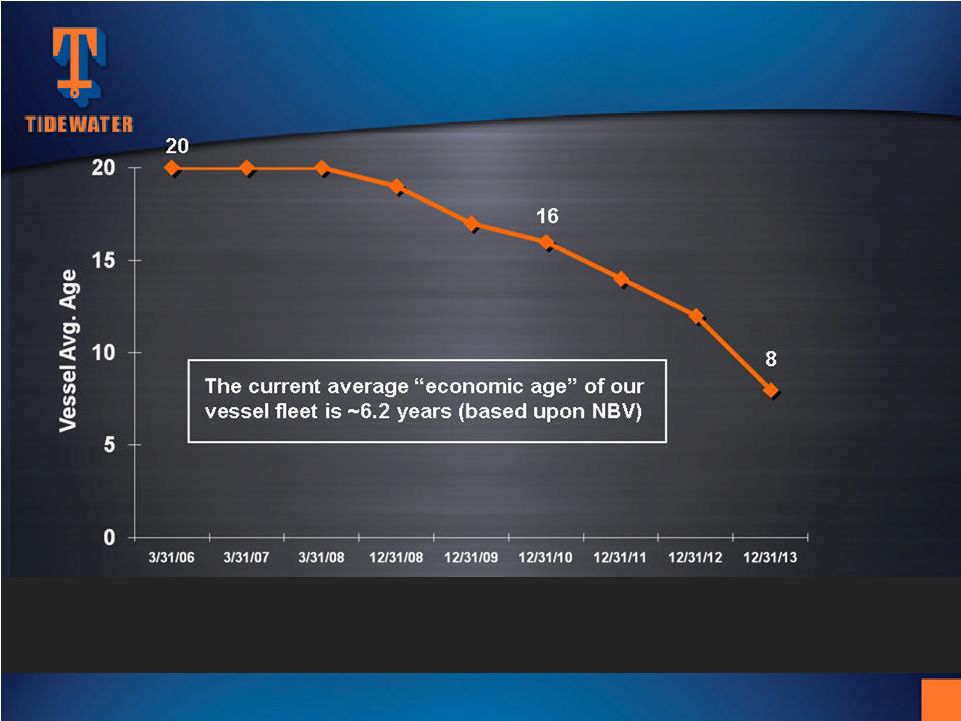 SIGNIFICANT AVERAGE AGE IMPROVEMENT
Assumptions: 1) Average 45 vessel disposals per year in future (averaged 47 per
year last three years). 2) Includes 37 vessels under construction (including
eleven purchase commitments) in year delivered plus additional
newbuilds/acquisitions from approximately $500 million per year of future
commitments (average additional 20 vessels
per year). Tidewater is not committed to spending $500 million annually, but this
level is used as an assumption in estimating average fleet age in the
future. 16 |
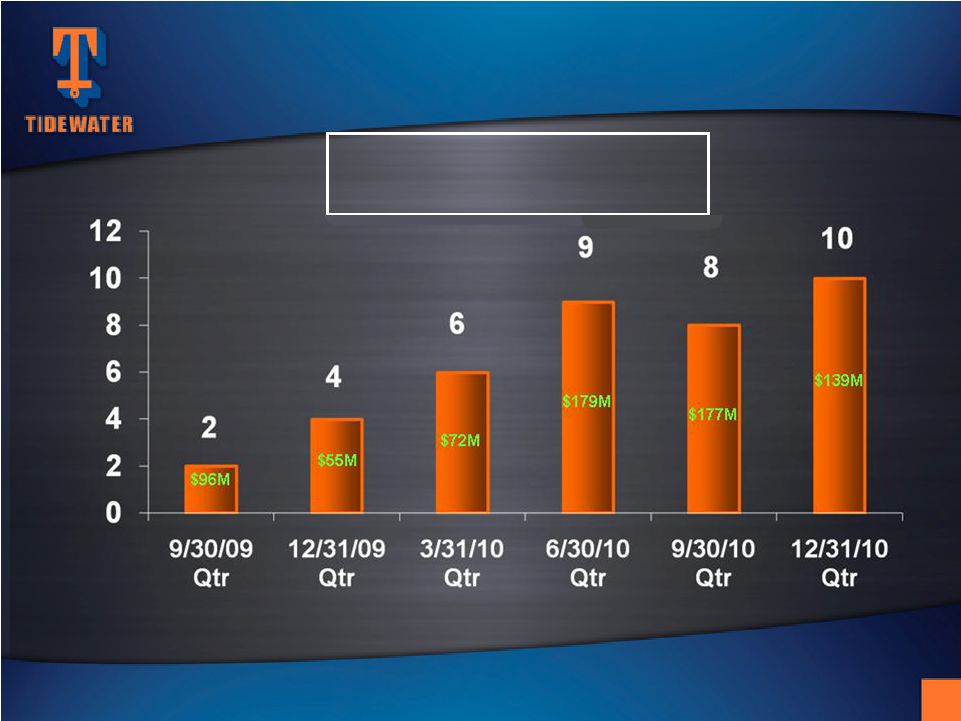 RECENT VESSEL COMMITMENTS
17
Amounts depict vessel count and total cost in quarter commitment
was made to acquire (not when delivery or payments were made)
1 MPSV
1 PSV
4 AHTS
6 AHTS
6 AHTS
3 PSV’s
39 vessels over six quarters with
total capital cost of $718 million
4 PSV’s
4 AHTS
1 PSV
9 AHTS |
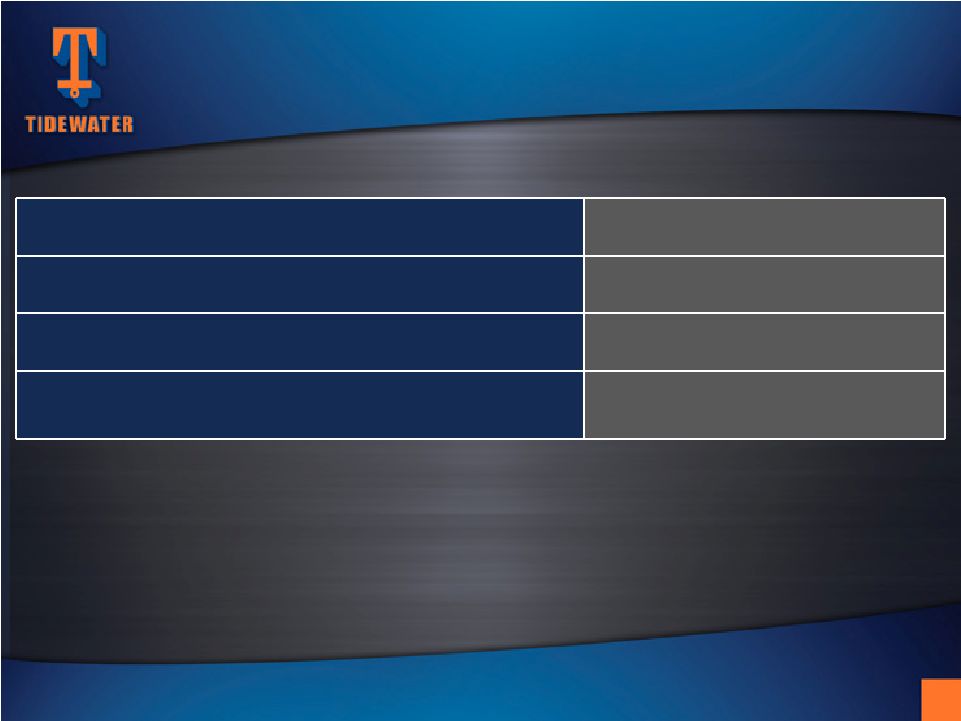
 Senior Unsecured Notes
$425 million
Average Life to Maturity
~ 9 years
Weighted Average Coupon
4.25%
Closing Dates
$310 million 10/15/10
$115 million 12/30/10
NEW PRIVATE PLACEMENT FINANCING
NEW PRIVATE PLACEMENT FINANCING
18 |
 Term Loan*
$125 million
Revolving Line of Credit
$450 million
Term
Five years
Interest Rate
Prime plus 0.5 to 1.25%, or
Eurodollar plus 1.5 to 2.25%
NEW CREDIT FACILITIES
NEW CREDIT FACILITIES
19
*
Term loan allows for multiple draws for up to 180 days from 1/27/11.
|
 A
STRONG BALANCE SHEET A STRONG BALANCE SHEET
AND READY LIQUIDITY
AND READY LIQUIDITY
20
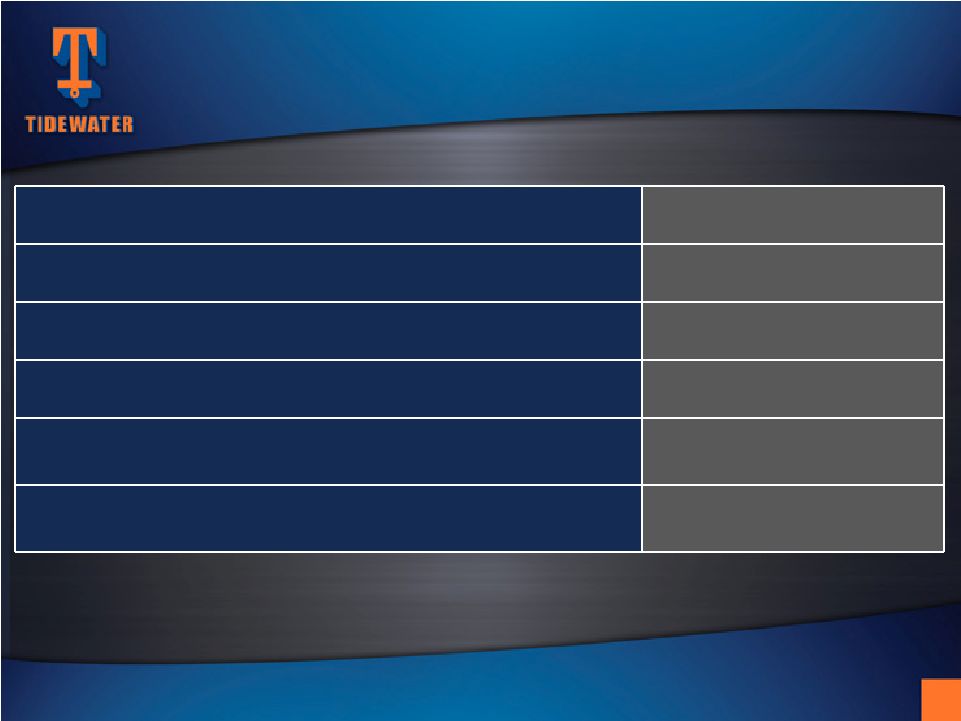
December 31, 2010 info:
Cash & Cash Equivalents
$308 million
Total Debt
$700 million
Shareholders Equity
$2,506 million
Net Debt / Net Capitalization
14%
Total Debt / Capitalization
22%
Pro forma liquidity as of 12/31/10 of ~ $885 million,
including $575 million available under credit facilities
|
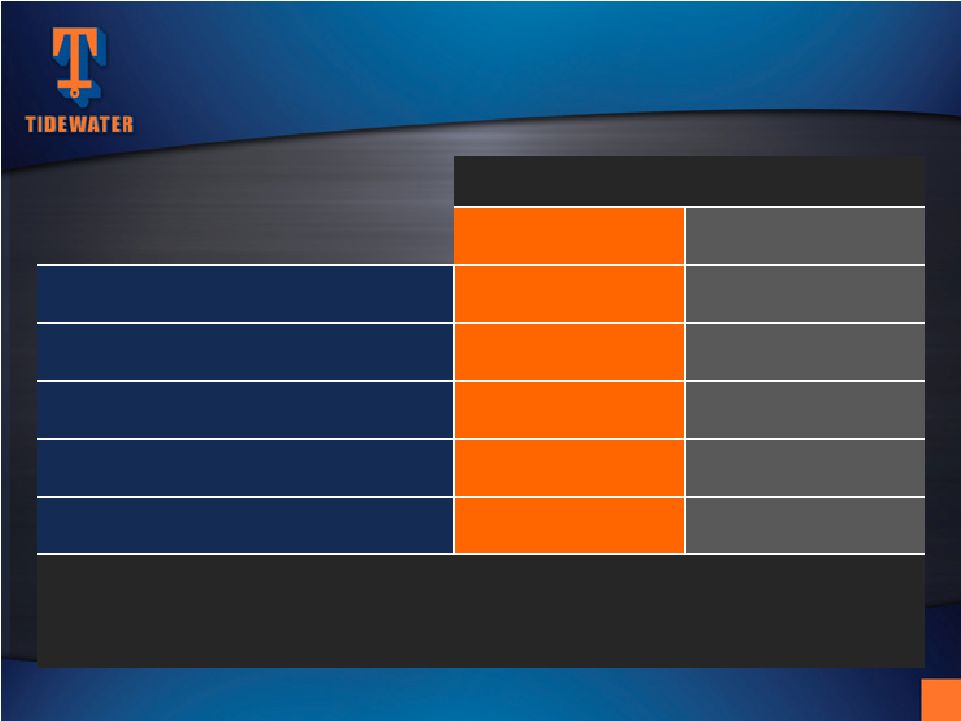 Nine Months Ended
12/31/10
12/31/09
Revenues
$801
$909
Adjusted Net Earnings*
$102
$216
Adjusted EPS*
$1.99
$4.21
Net Cash from Operations
$218
$299
Capital Expenditures
$509
$304
* Adjusted Net Earnings and Adjusted EPS for the nine months ended 12/31/10 exclude
an after-tax $4.35 million, or $0.09 per share, charge related to
settlement with DOJ for FCPA matters, and an after-tax $3.9 million, or $0.08 per
share, charge related to participation in a multi-company U.K.-based
pension plan. Adjusted net earnings and EPS for the nine months ended
12/31/09 exclude $48.1 million, or $0.94 per share, related to provision for Venezuelan operations and
$34.3 million, or $0.66 per share, tax benefit related to favorable resolution of
tax litigation.. SELECTED FINANCIAL
HIGHLIGHTS SELECTED FINANCIAL HIGHLIGHTS
$ in Millions,
Except Per Share Data
21 |
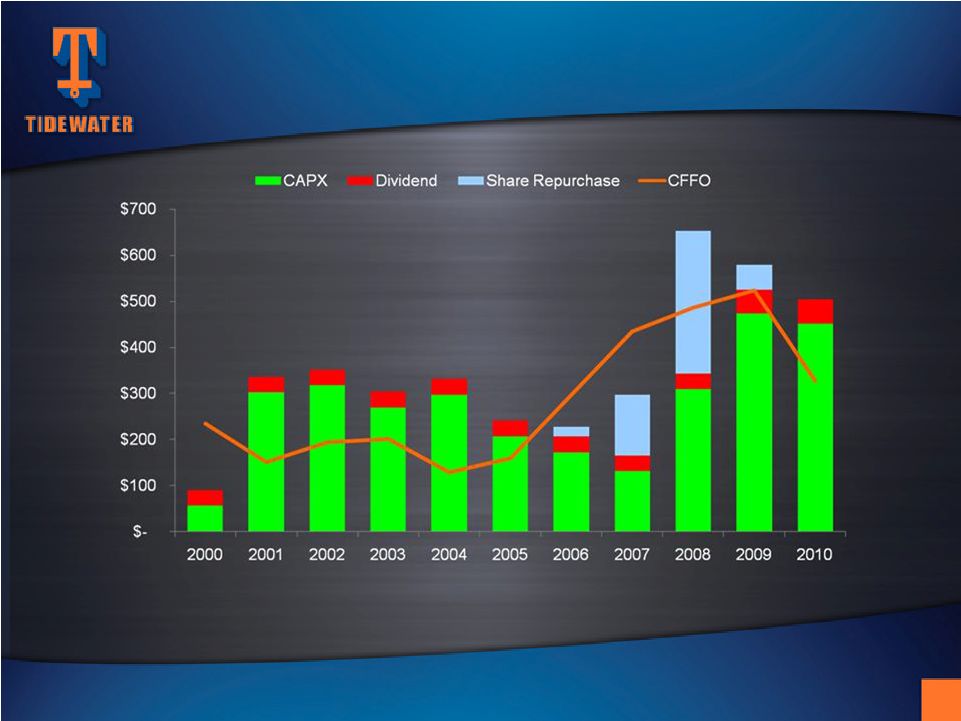 Over
an 11-year period, Tidewater invested $3.2 billion in CAPX ($2.8 billion in the “new”
fleet),
and paid out $923 million through dividends and share repurchases. Over the
same period, CFFO and proceeds from dispositions were $3.1 billion and $640
million, respectively PRIMARY USES OF CASH
PRIMARY USES OF CASH
22 |
 Maintain
Financial Strength
EVA-Based Investments
On Through-cycle Basis
Deliver Results
FINANCIAL STRATEGY FOCUSED ON
FINANCIAL STRATEGY FOCUSED ON
CREATING LONG-TERM SHAREHOLDER VALUE
CREATING LONG-TERM SHAREHOLDER VALUE
23 |
 CREDIT SUISSE
2011 ENERGY SUMMIT
2011 ENERGY SUMMIT
February 8, 2011
February 8, 2011
Quinn P. Fanning
Quinn P. Fanning
Executive Vice President and
Executive Vice President and
Chief Financial Officer
Chief Financial Officer
Joseph M. Bennett
Joseph M. Bennett
Executive Vice President and
Executive Vice President and
Chief Investor Relations Officer
Chief Investor Relations Officer |
 Appendix
25 |
 RECENT ACCOMPLISHMENTS
First full fiscal year without a lost time accident (FY 2010)
Respectable earnings & returns in a trough (tough) market
Selected acquisitions of choice assets
Disciplined disposal of traditional equipment
Delivery of 45 new vessels over last two full fiscal years
Balance sheet still solid
Strategy working –
Poised to seize opportunities
26 |
 0
100
200
300
400
500
Active Fleet
Dispositions
CONTINUALLY ACQUIRING NEW AND
CONTINUALLY ACQUIRING NEW AND
DISPOSING OF MATURE VESSELS
DISPOSING OF MATURE VESSELS
(As of 12/31/10)
(As of 12/31/10)
314
(B)
539
(C)
228 New Vessels (A)
434 Sold
105 Scrapped
(A)
Net
new
vessels
added
to
the
fleet
since
January
2000,
including
37
vessels
under
construction
at
12/31/10.
This
new
vessel total excludes 20 new vessels that were acquired, then disposed (mostly to a
TDW joint venture.) (B) Total fleet count excludes 92 stacked vessels as of
12/31/10. (C) 539 vessel dispositions generated $682 million of proceeds and
$284 million of gains over the last 11 years. 27
|
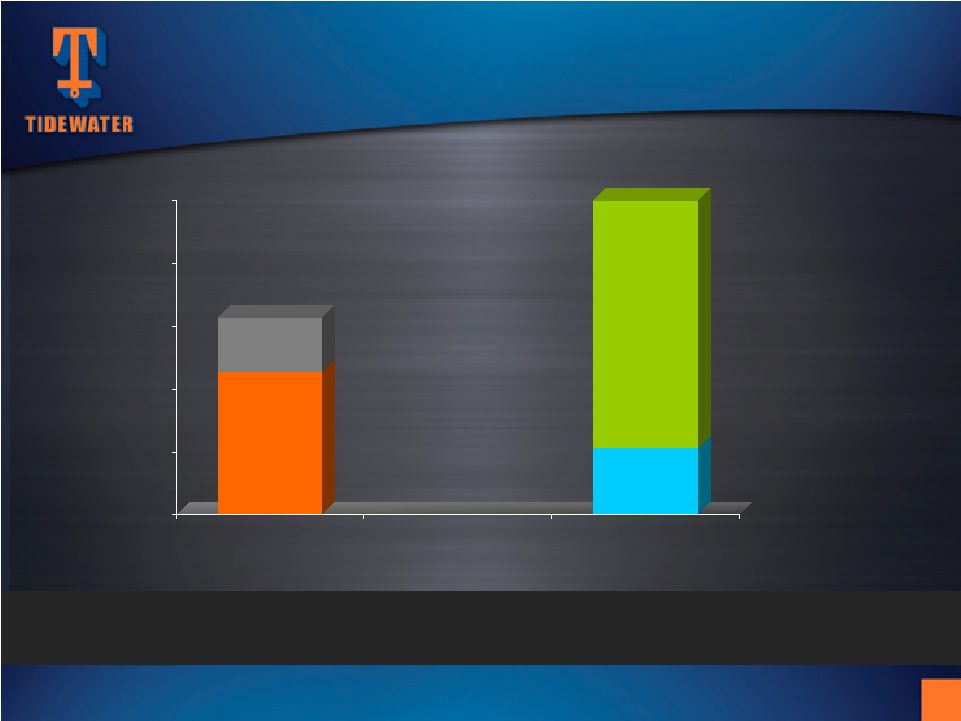
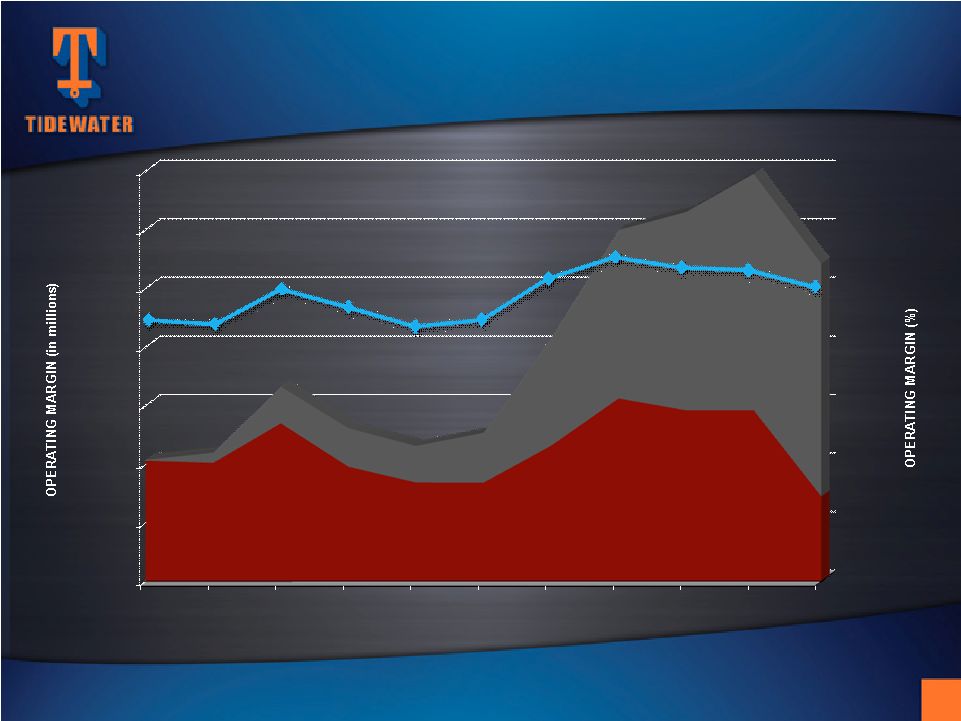 FLEET CASH OPERATING MARGINS
Note:
Cash
operating
margins
are
defined
as
vessel
revenue
less
vessel
operating
expenses
$0
$100
$200
$300
$400
$500
$600
$700
2000
2001
2002
2003
2004
2005
2006
2007
2008
2009
2010
Fiscal Years
50%
40%
30%
20%
10%
60%
Total Fleet
Operating Margin %
New Vessels
Traditional Vessels
38.6%
37.6%
46.5%
41.9%
36.9%
38.7%
49.1%
54.6%
51.9%
51.3%
46.8%
28 |
 50%
60%
70%
80%
90%
12/07
6/08
12/08
6/09
12/09
6/10
12/10
Utilization
$4,000
$6,000
$8,000
$10,000
$12,000
$14,000
Dayrate
* Dayrate and utilization information is for all classes of vessels operating
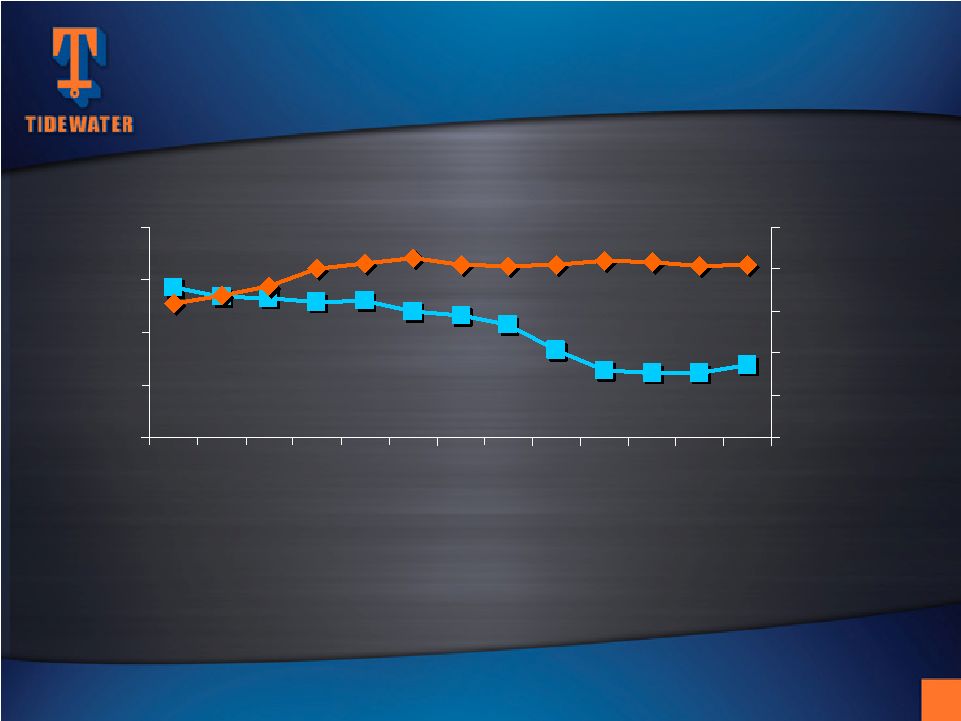
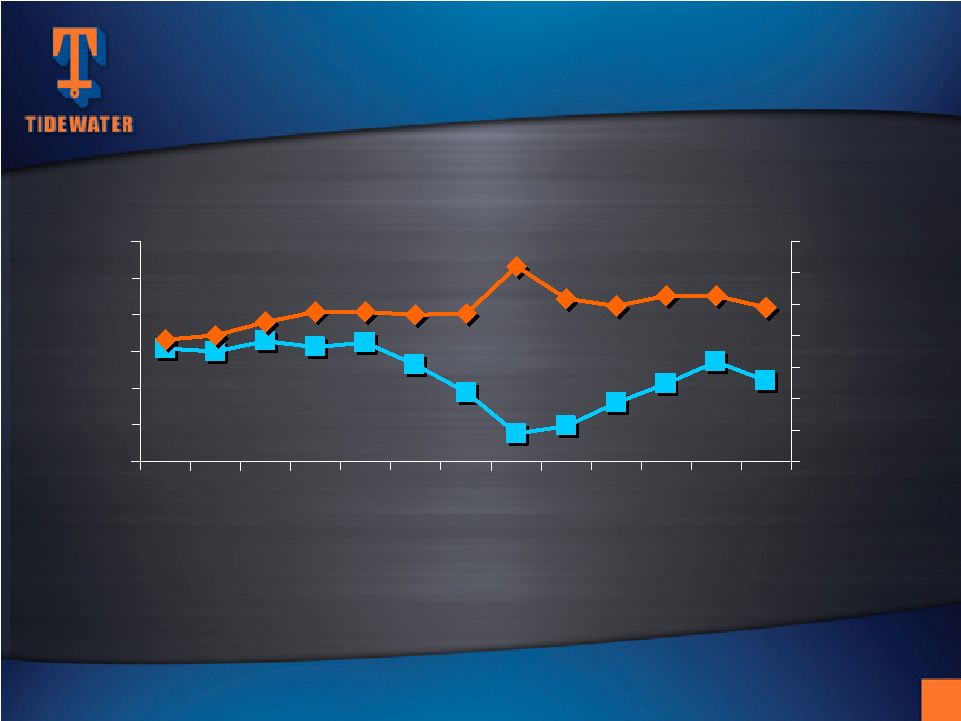
international INTERNATIONAL VESSELS
INTERNATIONAL VESSELS
Dayrates and Utilization
Dayrates and Utilization
$100 change in dayrate = ~$8.1M in annual revenue
1% change in utilization = ~$15.5M in annual revenue
29 |
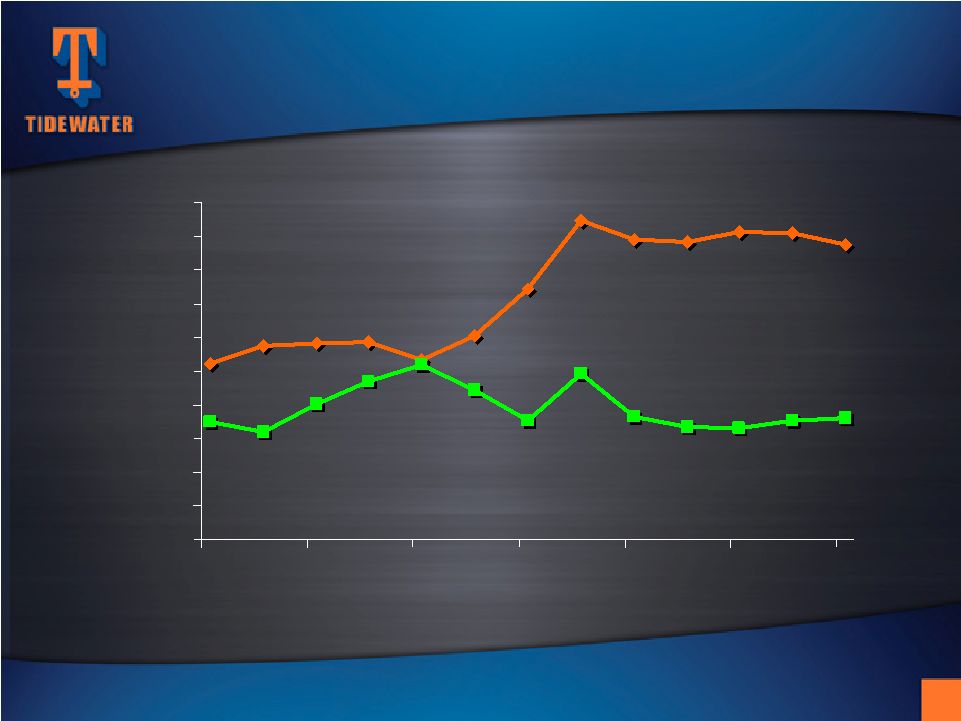
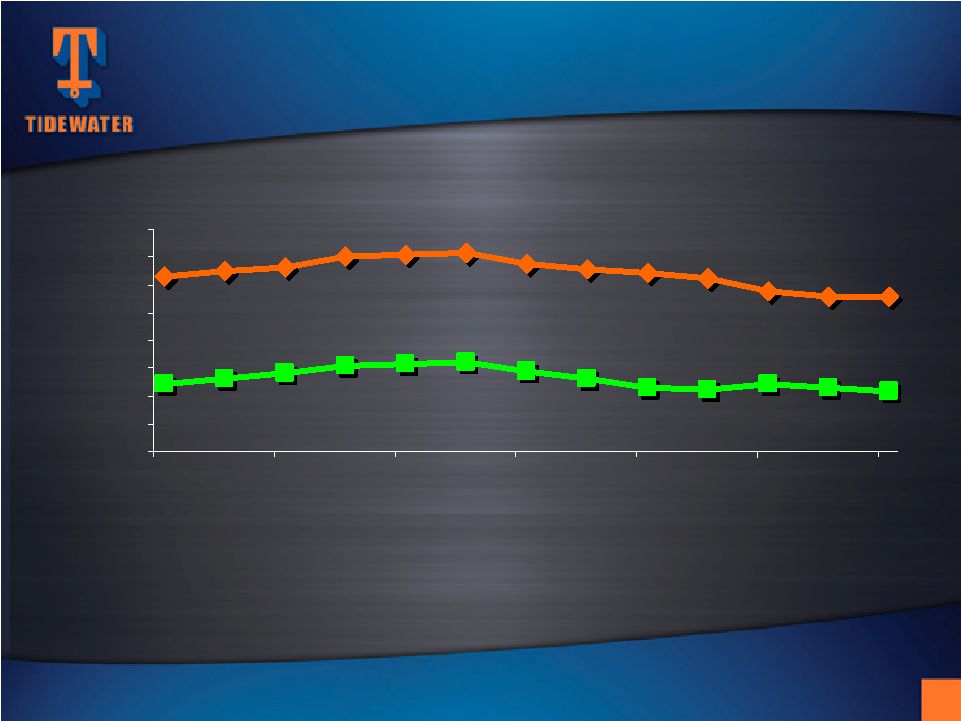 INTERNATIONAL VESSEL DAYRATES
* Dayrate and utilization information is for all classes of vessels operating
international $3,000
$5,000
$7,000
$9,000
$11,000
$13,000
$15,000
$17,000
$19,000
12/07
06/08
12/08
06/09
12/09
06/10
12/10
Traditional Vessels
New Vessels
30 |
 30%
40%
50%
60%
70%
80%
90%
12/07
6/08
12/08
6/09
12/09
6/10
12/10
Utilization
$4,000
$6,000
$8,000
$10,000
$12,000
$14,000
$16,000
$18,000
Dayrate
DOMESTIC VESSELS
DOMESTIC VESSELS
Dayrates and Utilization
Dayrates and Utilization
* Dayrate and utilization information is for all classes of vessels operating in the
U.S. 31 |
 DOMESTIC VESSEL DAYRATES
* Dayrate and utilization information is for all classes of vessels operating in the
U.S. $3,000
$5,000
$7,000
$9,000
$11,000
$13,000
$15,000
$17,000
$19,000
$21,000
$23,000
12/07
06/08
12/08
06/09
12/09
06/10
12/10
Traditional Vessels
New Vessels
32 |
 Source:
ODS-Petrodata
and
Tidewater
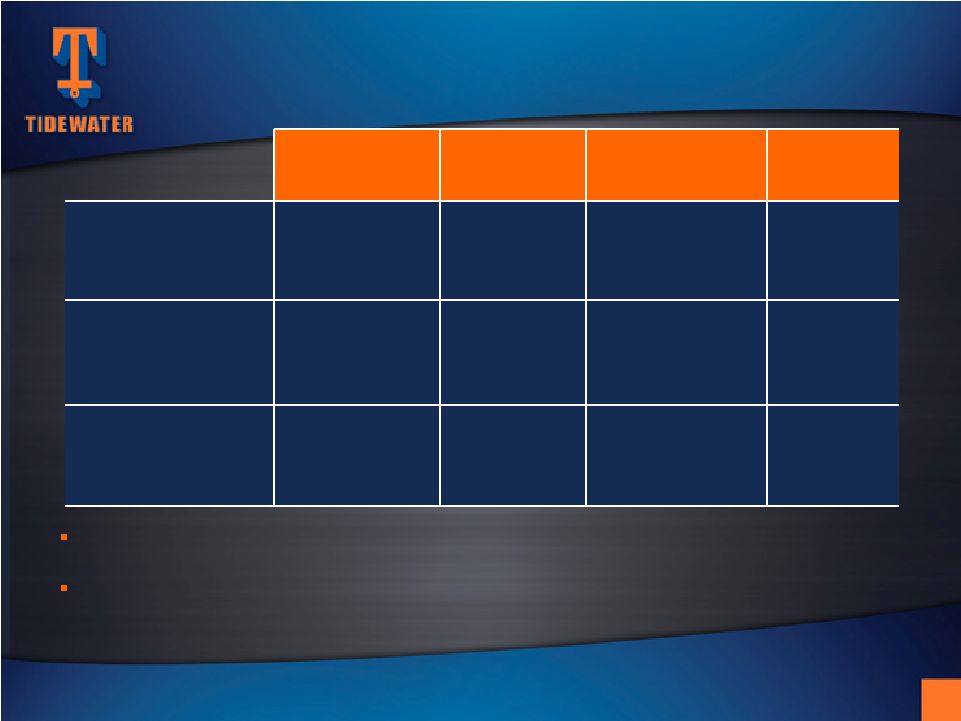
WORKING RIG COUNTS
WORKING RIG COUNTS
“Peak to Present”
“Peak to Present”
GOM
accounts
for
32
of
the
74
working
jackup
count
variance
from
June
2008
(Peak)
to
January
2011
(post-Horizon)
GOM
Semi
&
Drillship
count
drops
by
21
units
(from
31
to
10)
between
April
2010
and
January
2011;
offset
by
an
increase
of
6
units
in
the
rest
of
world
Jackups
Semis
Drillships
Total
June 2008
(Peak)
379
145
30
554
Late-April 2010
(pre-Horizon)
323
150
46
519
Mid-Jan. 2011
(post-Horizon)
305
143
38
486
33 |
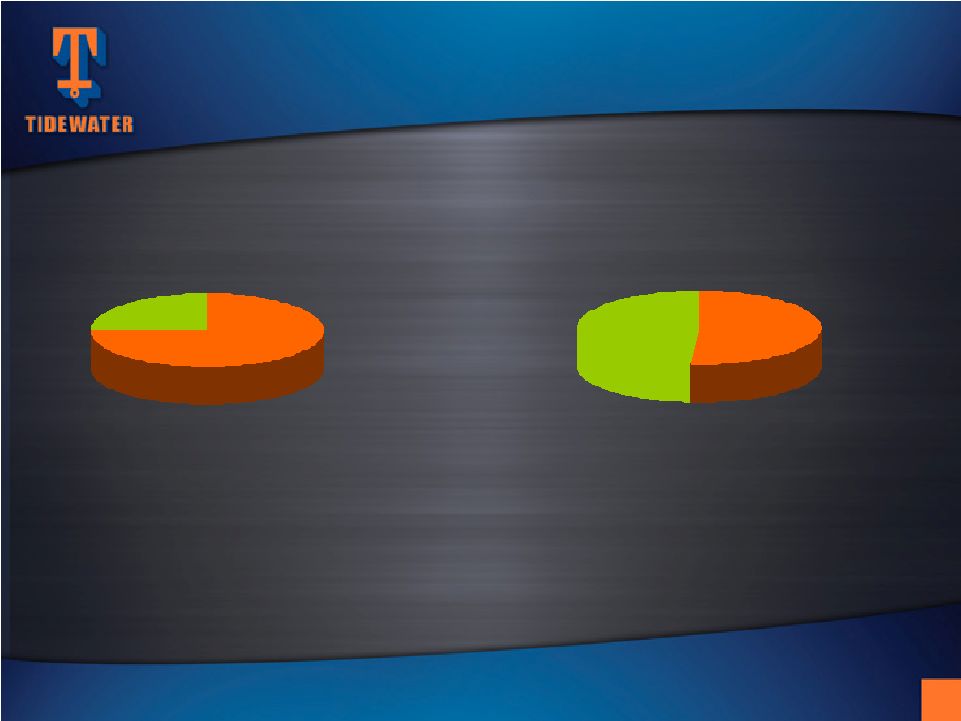 Other Operators
Top 10 Customers
Tidewater’s top 10 customers contract nearly 22% of the working
worldwide jackup
fleet and ~49% of the working worldwide floater fleet
Jackups
(305 Working Rigs)
Floater Rigs
(181 Working Rigs)
66
239
89
RIGS CONTRACTED BY OUR
RIGS CONTRACTED BY OUR
TOP
10 CUSTOMERS
10 CUSTOMERS
(Estimated as of Mid-January 2011)
34
Source:
ODS-Petrodata
and
Tidewater
Other Operators
Top 10 customers
92 |
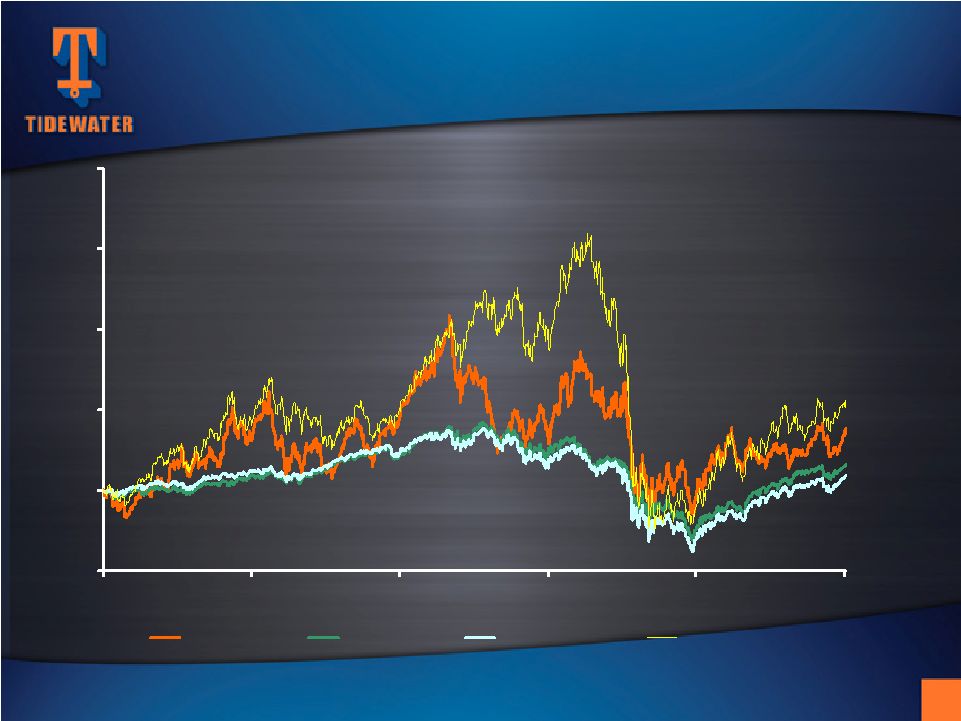 -50%
0%
50%
100%
150%
200%
Mar-05
Mar-06
Mar-07
Mar-08
Mar-09
Mar-10
TDW
DJIA
S&P500
OSX
OSX 52%
S&P 500 9%
DJIA 16%
TDW 36%
RETURNS vs the MARKET
RETURNS vs the MARKET
FIVE YEAR STOCKHOLDER RETURN
FIVE YEAR STOCKHOLDER RETURN
35 |