Attached files
Table of Contents
U. S. SECURITIES AND EXCHANGE COMMISSION
WASHINGTON, DC 20549
FORM 10-Q
| x | Quarterly report pursuant to Section 13 or 15(d) of the Securities Exchange Act of 1934 |
For the quarterly period ended December 31, 2010
| ¨ | Transition report pursuant to Section 13 or 15(d) of the Securities Exchange Act of 1934 |
For the transition period from to .
Commission File Number 001-34409
RECON TECHNOLOGY, LTD
(Exact name of registrant as specified in its charter)
| Cayman Islands | Not Applicable | |
| (State or other jurisdiction of incorporation or organization) |
(I.R.S. employer identification number) |
Room 1902, Building C, King Long International Mansion
No. 9 Fulin Road, Beijing, 100107
People’s Republic of China
(Address of principal executive offices and zip code)
+8610 8494 5799
(Registrant’s telephone number, including area code)
Indicate by check mark whether the registrant (1) has filed all reports required to be filed by Section 13 or 15(d) of the Securities Exchange Act of 1934 during the preceding 12 months (or for such shorter period that the registrant was required to file such reports) and (2) has been subject to such filing requirements for the past 90 days. Yes x No ¨
Indicate by check mark whether the registrant has submitted electronically and posted on its corporate Web site, if any, every Interactive Data File required to be submitted and posted pursuant to Rule 405 of Regulation S-T (§232.405 of this chapter) during the preceding 12 months (or for such shorter period that the registrant was required to submit and post such files). Yes ¨ No ¨
Indicate by check mark whether the registrant is a large accelerated filer, an accelerated filer, a non-accelerated filer, or a smaller reporting company.
| Large accelerated filer | ¨ | Accelerated filer | ¨ | |||
| Non-accelerated filer | ¨ (Do not check if a smaller reporting company) | Smaller reporting company | x | |||
Indicate by check mark whether the registrant is a shell company (as defined in Rule 12b-2 of the Exchange Act). Yes ¨ No x
Indicate the number of shares outstanding of each of the issuer’s classes of common stock, as of the latest practicable date. The Company is authorized to issue 25,000,000 Shares. As of the date of this report, the Company has issued and outstanding 3,951,811 Shares.
Table of Contents
FORM 10-Q
INDEX
| SPECIAL NOTE REGARDING FORWARD-LOOKING STATEMENTS | ii | |||||
| PART I FINANCIAL INFORMATION | 1 | |||||
| Item 1. | Financial Statements | 1 | ||||
| Item 2. | Management’s Discussion and Analysis of Financial Condition and Results of Operations | 1 | ||||
| Item 3. | Quantitative and Qualitative Disclosures about Market Risk | 16 | ||||
| Item 4/4T. | Controls and Procedures | 16 | ||||
| PART II OTHER INFORMATION | 17 | |||||
| Item 1. | Legal Proceedings | 17 | ||||
| Item 1A | Risk Factors | 17 | ||||
| Item 2. | Unregistered Sales of Equity Securities and Use of Proceeds | 17 | ||||
| Item 3. | Defaults upon Senior Securities | 17 | ||||
| Item 4. | (Removed and Reserved) | 17 | ||||
| Item 5. | Other Information | 17 | ||||
| Item 6. | Exhibits | 18 | ||||
i
Table of Contents
SPECIAL NOTE REGARDING FORWARD-LOOKING STATEMENTS
This document contains certain statements of a forward-looking nature. Such forward-looking statements, including but not limited to projected growth, trends and strategies, future operating and financial results, financial expectations and current business indicators are based upon current information and expectations and are subject to change based on factors beyond the control of the Company. Forward-looking statements typically are identified by the use of terms such as “look,” “may,” “should,” “might,” “believe,” “plan,” “expect,” “anticipate,” “estimate” and similar words, although some forward-looking statements are expressed differently. The accuracy of such statements may be impacted by a number of business risks and uncertainties that could cause actual results to differ materially from those projected or anticipated, including but not limited to the following:
| • | the timing of the development of future products; |
| • | projections of revenue, earnings, capital structure and other financial items; |
| • | statements of our plans and objectives; |
| • | statements regarding the capabilities of our business operations; |
| • | statements of expected future economic performance; |
| • | statements regarding competition in our market; and |
| • | assumptions underlying statements regarding us or our business. |
Readers are cautioned not to place undue reliance on these forward-looking statements, which speak only as of the date hereof. The Company undertakes no obligation to update this forward-looking information. Nonetheless, the Company reserves the right to make such updates from time to time by press release, periodic report or other method of public disclosure without the need for specific reference to this Report. No such update shall be deemed to indicate that other statements not addressed by such update remain correct or create an obligation to provide any other updates.
ii
Table of Contents
| Item 1. | Financial Statements. |
See the financial statements following the signature page of this report, which are incorporated herein by reference.
| Item 2. | Management’s Discussion and Analysis of Financial Condition and Results of Operations |
The following discussion and analysis of our company’s financial condition and results of operations should be read in conjunction with our unaudited consolidated financial statements and the related notes included elsewhere in this report. This discussion contains forward-looking statements that involve risks and uncertainties. Actual results and the timing of selected events could differ materially from those anticipated in these forward-looking statements as a result of various factors.
Overview
We are a company with limited liability incorporated in 2007 under the laws of the Cayman Islands. Headquartered in Beijing, we provide products and services to oil and gas companies and their affiliates through our contractually controlled affiliates, Beijing BHD Petroleum Technology Co. Ltd (“BHD”), Nanjing Recon Technology Co., Ltd. (“Nanjing Recon”), and Jining ENI Energy Technology Co., Ltd. (“ENI” and, together with BHD and Nanjing Recon, the “Domestic Companies”). We are the center of strategic management, financial control and human resources allocation for the Domestic Companies.
Through our contractual relationships with the Domestic Companies, we provide equipment, tools and other hardware related to oilfield production and management and develop and sell our own specialized industrial automation control and information solutions. However, we do not engage in the production of petroleum or petroleum products.
Our business is mainly focused on the upstream sectors of the oil and gas industry as shown by the solid framed boxes on the chart below:
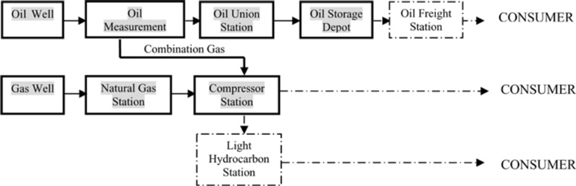
We derive our revenues from (1) the sale of hardware products, (2) the sale of software products, and (3) services. Our products and services involve most of the key procedures of extraction and production of oil and gas, which include automation systems, equipment, tools and on-site technical services. We do not, however, engage in the production of petroleum or petroleum products.
Financial Results
For the six months ended December 31, 2010, 96.93% of our revenue came from sales of hardware, and 3.07% came from our services business. We did not recognize any revenues from software sales during the six months ended December 31, 2010. For the same period in 2009, hardware sales, software sales, and services constituted approximately 91.46%, 8.22% and 0.31%, respectively, of our revenues.
1
Table of Contents
Service and Products
Our products and services include:
Equipment for Oil and Gas Production and Transportation
High-Efficiency Heating Furnaces. Crude petroleum contains certain impurities that must be removed before the petroleum can be sold, including water and natural gas. To remove the impurities and to prevent solidification and blockage in transport pipes, companies employ heating furnaces. BHD researched, developed and implemented a new oilfield furnace that is advanced, highly automated, reliable, easily operable, and comparatively safe and highly heat efficient (90% efficiency).
Burner. We serve as an agent for the Unigas Burner which is designed and manufactured by UNIGAS, a European burning equipment production company. The burner we provide has the following characteristics: high degree of automation; energy conservation; high turn down ratio; high security and is environmentally safe.
Separator. The test separator is the key measurement device for gas and oil in metering plants. Oil and gas mixture sprays on the oil block cap after entering into the separator through the oil pipeline. The diffused oil falls along the pipe wall to the separator bottom and through the draw-off pipe. The gas rises due to its low density and changes the flow direction after concentrating by the separator umbrella. In the process, the small oil droplets in the gas adhere to the umbrella wall and fall along the wall of the pipe. The de-oiled gas enters the pipeline through the freeing pipe at the top of the separator for measurement.
Oil and Gas Development Tools and Equipment
Oil and Gas Production Increasing Techniques:
Packers of Fracturing. This utility model is used concertedly with the security joint, hydraulic anchor, and slide brushing of sand spray in the well. It is used for easy seat sealing and sand-up prevention. The utility model reduces desilting volume and prevents sand-up which makes the deblocking processes easier to realize. The back flushing is sand-stick proof.
Production Packer. At varying withdrawal points, the production packer separates different oil layers, and protects the oil pipe from sand and permeation, promoting the recovery ratio.
Water Injection Packer. The water injection packer injects water into different layers rather than injecting on a large scale; this can reduce cost and promote effectiveness.
Fissure Shaper. This is our proprietary product that is used along with a perforating gun to effectively increase perforation depth by between 46% and 80%, shape stratum fissures, improve stratum diversion capability and, as a result, improve our ability to locate oilfields and increase the output of oil wells.
Sand Prevention in Oil and Water Well. This technique processes additives that are resistant to elevated temperatures into “resin sand” which is transported to the bottom of the well via carrying fluid. The “resin sand” goes through the borehole, pilling up and compacting at the borehole and oil vacancy layer. An artificial borehole wall is then formed, functioning as a means of sand prevention. This sand prevention technique has been adapted to more than 100 wells, including heavy oil wells, light oil wells, water wells and gas wells, with a 100% success rate and a 98% effective rate.
Water Locating and Plugging Technique. High water cut affects the normal production of oilfields. Previously, there was no sophisticated method for water locating and tubular column plugging in China. The mechanical water locating and tubular column plugging technique we have developed resolves the problem of high water cut wells. This technique conducts a self-sealing-test during multi-stage usage and is reliable to separate different production
2
Table of Contents
sets effectively. The water location switch forms a complete set by which the water locating and plugging can be finished in one trip. The tubular column is adaptable to several oil drilling methods and is available for water locating and plugging in second and third class layers.
Fracture Acidizing. We inject acid to layers under pressure which can form or expand fissures. The treatment process of the acid is defined as fracture acidizing. The technique is mainly adapted to oil and gas wells that are blocked up relatively deeply, or the ones in the zones of low permeability.
Electronic Break-down Service. This service resolves block-up and freezing problems by generating heat from the electric resistivity of the drive pipe and utilizing a loop tank composed of an oil pipe and a drive pipe. This technique saves energy and is environment friendly. It can increase the production of oilfields that are in the middle and later periods.
Automation System and Service:
Pumping Unit Controller. Functions as a monitor to the pumping unit, and also collects data for load, pressure, voltage, startup and shutdown control.
RTU Monitor. Collects gas well pressure data.
Wireless Dynamometer and Wireless Pressure Gauge. These products replace wired technology with cordless displacement sensor technology. They are easy to install and significantly reduce the work load associated with cable laying.
Electric Multi-way Valve for Oilfield Metering Station Flow Control. This multi-way valve is used before the test separator to replace the existing three valve manifolds. It facilitates the electronic control of the connection of the oil lead pipeline with the separator.
Natural Gas Flow Computer System. The flow computer system issued in natural gas stations and gas distribution stations to measure flow.
Recon SCADA Oilfield Monitor and Data Acquisition System. Recon SCADA is a system which applies to the oil well, measurement station, and the union station for supervision and data collection.
EPC Service of Pipeline SCADA System. A service technique for pipeline monitoring and data acquisition after crude oil transmission.
EPC Service of Oil and Gas Wells SCADA System. A service technique for monitoring and data acquisition of oil wells and natural gas wells.
EPC Service of Oilfield Video Surveillance and Control System. A video surveillance technique for controlling the oil and gas wellhead area and the measurement station area.
Technique Service for “Digital oilfield” Transformation. Includes engineering technique services such as oil and gas SCADA system, video surveillance and control system and communication systems.
Factors Affecting Our Business
Business Outlook
The oilfield engineering and technical service industry is generally divided into five sections: (1) exploration, (2) drilling and completion, (3) testing and logging, (4) production, and (5) oilfield construction. Thus far our businesses have only been involved in production. Our management believes it’s time to expand our core business, move into new markets, and develop new businesses. There are great opportunities both in new markets and our existing markets. We believe that many existing wells and oilfields need to improve or renew their equipment and service to maintain production and our techniques and services will be needed as new oil and gas fields are developed. In the next three years, we will focus on:
Measuring Equipment and Service. Our priority is the development of our well, pipeline and oilfield SCADA engineering project contracting service, oilfield video surveillance and control system, and reforming technical support service. According to conservative estimates, the potential market for our wireless indicator and remote monitoring system (SCADA) is approximately RMB 5 billion.
3
Table of Contents
Gathering and Transferring Equipment. (1) Furnace. We estimate demand for our furnace at about 2,000 units per year, of which, 500 are expected to come from new wells and 1,500 are expected to come from reconstruction of old wells. The potential market is estimated at RMB 800 million (approximately $121 million) based on an average price of RMB 400,000 (approximately $60,498) per furnace. (2) Oil/water separator. We estimate demand at about 800 units per year, of which, 300 are expected to come from new wells and 500 are expected to come from reconstruction of old wells. The potential market is about RMB 400 million (approximately $60 million) based on an average price of RMB 500,000 (approximately $75,622); (3) Burner. We estimate demand at about 5,000 units per year, of which, 1,000 are expected to come from new wells and 4,000 are expected to come from reconstruction of old wells. The potential market is about RMB 300 million (approximately $45 million) based on an average price of RMB 60,000 (approximately $9,075).
New business. Along with the opening of the oilfield service market to private companies, we plan to establish our own service team equipped with work-over rigs (specialized equipment used during the operation of well repairing) and coiled tubing machines. We do not currently have a timeline in place for the establishment of this service team. Only a few companies can provide this business in China at present.
Growth Strategy
As a small local company, it is our basic strategy to focus on developing our onshore oilfield business, i.e. the upstream of the industry. Due to the remote location and difficult environment of China’s oil and gas fields, foreign competitors rarely enter those fields.
Large domestic oil companies prefer to focus on their exploration and development businesses to earn high margins and keep their competitive advantage. With regard to private oilfield service companies, 90% specialize in the manufacture of drilling and production equipment. Thus, the market for technical support and project service is still in its early stage. Our management insists on providing high quality products and service in the oilfield where we have a geographical advantage. This allows us to avoid conflicts of interest with bigger suppliers of drilling equipment and keep our leading position within the market segment. Our mission is to increase the automation and safety levels of industrial petroleum production in China, and improve the under-developed working process and management mode by using advanced technologies. At the same time, we are always looking to improve our business and to increase our earning capability.
Industry and Recent Developments
Oilfield drilling and production equipment and engineering technique services are applied in the process of oil and gas extraction, thus the exploration and exploitation activities of petroleum companies directly influence demand for oilfield technique service and corresponding equipment. The number of new oil and gas wells each year is a key indicator of activity. It can also reflect the prosperity of the oilfield service industry. China is the world’s second-largest petroleum producing country, with nearly 30,000 wells drilled and annual drill depths of 49,000,000 meters. In the long run, factors affecting the development of petroleum companies include prices of oil and gas, and China’s national energy strategy. In the short or mid-term, petroleum companies plan their development activities according to the level of demand.
Thus, the level of demand for oil and gas in the short or mid-term affects the number of oil and gas wells. Meanwhile, well prospecting is done to ensure the supplement of oil and gas in the medium and long run, and also to ensure that well development will satisfy the production demand of petroleum companies in the short term. At present, China is short of oil and gas. The discrepancy between production and demand is growing. For the three state owned petroleum companies, the top priority is to ensure the supplements of the nation and promote stable and
4
Table of Contents
increased oilfield production. Their capital expenditures are restricted by the national energy strategy to a large extent. Under such circumstances, despite the adverse domestic and international market conditions influencing the Chinese oil market in 2009, the investment by petroleum companies to upstream prospecting and development continues to increase. Advanced oilfield drill equipment and technique services are in greater demand, as petroleum companies make efforts to promote effectiveness and reduce costs.
The Several Opinions of the State Council on Encouraging and Guiding the Healthy Development of Private Investment (the “New 36 Guidelines on Non-State-owned Economy”) promulgated in 2010 by the State encourages private investors to take part in oil and natural gas construction, and supports private enterprise investors entering into exploration and development of the oilfield area. As exploration of oil and gas fields involves a wide range of professional technologies, it is expected that in the future the private investors investing in oil and gas field exploration will seek out general contracting and integrated services. We believe this will bring opportunities to the integrated service projects of our company.
Recently, China’s dependence on imported oil exceeded 50%, and an increasingly serious “gas shortage” also put stress on China’s energy supply. The government has decided to invest more into the construction of gas storage and the long-distance natural gas transportation pipeline. Our management believes our current product lines and experience in pipe line transportation and monitoring and development of automation products could help us rapidly grow and develop to be a leader of this segment of the oilfield service industry.
Factors Affecting Our Results of Operations — Generally
Our operating results in any period are subject to general conditions typically affecting the Chinese oilfield service industry including:
| • | the amount of spending by our customers, primarily those in the oil and gas industry; |
| • | growing demand from large corporations for improved management and software designed to achieve such corporate performance; |
| • | the procurement processes of our customers, especially those in the oil and gas industry; |
| • | competition and related pricing pressure from other oilfield service solution providers, especially those targeting the Chinese oil and gas industry; |
| • | the ongoing development of the oilfield service market in China; and |
| • | inflation and other factors. |
Unfavorable changes in any of these general conditions could negatively affect the number and size of the projects we undertake, the number of products we sell, the amount of services we provide, the price of our products and services and otherwise affect our results of operations.
Our operating results in any period are more directly affected by company-specific factors including:
| • | our revenue growth; |
| • | the proportion of our business dedicated to large companies; |
| • | our ability to successfully develop, introduce and market new solutions and services; |
| • | our ability to increase our revenues to businesses, both old customers and new in the Chinese oil and gas industry; |
| • | our ability to effectively manage our operating costs and expenses; and |
| • | our ability to effectively implement any targeted acquisitions and/or strategic alliances so as to provide efficient access to markets and industries in the Chinese oil and gas industry. |
Critical Accounting Policies and Estimates
Estimates and Assumptions. We prepare our consolidated financial statements in conformity with accounting principles generally accepted in the United States of America (U.S. GAAP), which requires us to make judgments, estimates and assumptions. We continually evaluate these estimates and assumptions based on the most recently
5
Table of Contents
available information, our own historical experience and various other assumptions that we believe to be reasonable under the circumstances. Since the use of estimates is an integral component of the financial reporting process, actual results could differ from those estimates. An accounting policy is considered critical if it requires an accounting estimate to be made based on assumptions about matters that are highly uncertain at the time such estimate is made, and if different accounting estimates that reasonably could have been used, or changes in the accounting estimates that are reasonably likely to occur periodically, could materially impact the consolidated financial statements. We believe that the following policies involve a higher degree of judgment and complexity in their application and require us to make significant accounting estimates. The following descriptions of critical accounting policies, judgments and estimates should be read in conjunction with our consolidated financial statements and other disclosures included in this quarterly report. Significant accounting estimates reflected in our Company’s consolidated financial statements include revenue recognition, allowance for doubtful accounts, and useful lives of property and equipment.
Revenue Recognition. We recognize revenue when the following four criteria are met: (1) persuasive evidence of an arrangement exists, (2) delivery has occurred or services have been provided, (3) the sales price is fixed or determinable, and (4) collectability is reasonably assured. Delivery does not occur until products have been shipped or services have been provided to the client and the client has signed a completion and acceptance report, risk of loss has transferred to the client, client acceptance provisions have lapsed, or we have objective evidence that the criteria specified in client acceptance provisions has been satisfied. The sales price is not considered to be fixed or determinable until all contingencies related to the sale have been resolved.
Hardware:
Revenue from hardware sales is generally recognized when the product is shipped to the customer and when there are no unfulfilled company obligations that affect the customer’s final acceptance of the arrangement.
Software:
We sell self-developed software. For software sales, we recognize revenues in accordance with the provisions of Statement of Position No. 97-2 (ASC 985-605), “Software Revenue Recognition,” and related interpretations. Revenue from software is recognized according to project contracts. Contract costs are accumulated during the periods of installation and testing or commissioning. Usually this is short term. Revenue is not recognized until completion of the contracts and receipt of acceptance statements.
Services:
We provide services to improve software functions and system requirements on separated fixed-price contracts. Revenue is recognized on the completed contract method when acceptance is determined by a completion report signed by the customer.
Deferred income represents unearned amounts billed to customers related to sales contracts.
Cost of Revenues. When the criteria for revenue recognition have been met, costs incurred are recognized as cost of revenue. Cost of revenues includes wages, materials, handling charges, the cost of purchased equipment and pipes, and other expenses associated with manufactured products and services provided to customers. We expect cost of revenues to grow as our revenues grow. It is possible that we could incur development costs with little revenue recognition, but based upon our past history, we expect our revenues to grow.
Fair Values of Financial Instruments. The carrying amounts reported in the consolidated balance sheets for trade accounts receivable, other receivables, advances to suppliers, trade accounts payable, accrued liabilities, advances from customers and notes payable approximate fair value because of the immediate or short-term maturity of these financial instruments.
Allowance for Doubtful Accounts. Trade receivables and other receivable accounts are recognized initially at fair value and subsequently measured at amortized cost using the effective interest method, less a provision made for impairment of these receivables. Provisions are applied to trade and other receivables where events or changes in circumstances indicate that the balance may not be collectible. The identification of doubtful debts requires the use of judgment and estimates of management. Our management must make estimates of the collectability of our accounts receivable. Management specifically analyzes accounts receivable, historical bad debts, customer
6
Table of Contents
creditworthiness, current economic trends and changes in our customer payment terms when evaluating the adequacy of the allowance for doubtful accounts. Our allowance for trade accounts receivable was ¥1,089,331 and ¥1,565,779 ($236,816) on June 30 and December 31, 2010 respectively.
Property and Equipment. We record property and equipment at cost. We depreciate property and equipment on a straight-line basis over their estimated useful lives using the following annual rates:
| Motor Vehicles |
10 years | |||
| Office Equipment |
2-5 years | |||
| Leasehold Improvements |
5 years |
We expense maintenance and repair expenditures as they do not improve or extend an asset’s productive life. These estimates are reasonably likely to change in the future since they are based upon matters that are highly uncertain such as general economic conditions, potential changes in technology and estimated cash flows from the use of these assets.
Depreciation expense was ¥170,864 and ¥203,278 ($30,745) for the six months ended December 31, 2009 and 2010, respectively.
| June
30, 2010 |
December
31, 2010 |
December 31, 2010 |
||||||||||
| RMB | RMB | U.S. Dollars | ||||||||||
| (Unaudited) | (Unaudited) | |||||||||||
| Motor vehicles |
¥ | 1,796,955 | ¥ | 1,796,955 | $ | 271,780 | ||||||
| Office equipment and fixtures |
450,715 | 475,564 | 71,927 | |||||||||
| Leasehold improvement |
426,181 | 426,181 | 64,458 | |||||||||
| Total property and equipment |
2,673,851 | 2,698,700 | 408,165 | |||||||||
| Less: Accumulated depreciation |
(1,190,970 | ) | (1,394,248 | ) | (210,873 | ) | ||||||
| Property and equipment, net |
¥ | 1,482,881 | ¥ | 1,304,452 | $ | 197,292 | ||||||
Software Development Costs. We charge all of our development costs to research and development until we have established technological feasibility. We acknowledge technological feasibility of our software when a detailed program design has been completed, or upon the completion of a working model. Upon reaching technological feasibility, we capitalize additional software costs until the software is available for general release to customers. Although we have not established a budget or time table for software development, we anticipate the need to continue the development of our software products in the future and the cost could be significant. We believe that, as in the past, the costs of development will result in new products that will increase revenue and therefore justify costs. There is, however, a reasonable possibility that we may be unable to realize the carrying value of our software, and the amount not so realized may adversely affect our financial position, results of operation or liquidity in the future.
Valuation of Long-Lived Assets. We review the carrying values of our long-lived assets for impairment whenever events or changes in circumstances indicate that they may not be recoverable. When such an event occurs, we project undiscounted cash flows to be generated from the use of the asset and its eventual disposition over the remaining life of the asset. If projections indicate that the carrying value of the long-lived asset will not be recovered, we reduce the carrying value of the long-lived asset by the estimated excess of the carrying value over the projected discounted cash flows. In the past, we have not had to make significant adjustments to the carrying values of our long-lived assets, and we do not anticipate a need to do so in the future. However, circumstances could cause us to have to reduce the value of our capitalized software more rapidly than we have in the past if our revenues were to significantly decline. Estimated cash flows from the use of the long-lived assets are highly uncertain and therefore the estimation of the need to impair these assets is reasonably likely to change in the future. Should the economy or acceptance of our software change in the future, it is likely that our estimate of the future cash flows from the use of these assets will change by a material amount.
7
Table of Contents
Results of Operations
The following consolidated results of operations includes the results of operations of the Company, all the subsidiaries and all of the variable interest entities (“VIE”s) (which are BHD, Nanjing Recon and ENI) of the Company. The results of operations are primarily those of the VIEs.
Three Months Ended December 31, 2010 Compared to Three Months Ended December 31, 2009
Our historical reporting results are not necessarily indicative of the results to be expected for any future period.
Revenue
| For the Three Months Ended December 31, | ||||||||||||||||
| 2010 | 2009 | Increase (Decrease) |
Percentage Change |
|||||||||||||
| Hardware |
¥ | 44,847,074 | ¥ | 47,081,742 | ¥ | (2,234,668 | ) | (4.75 | %) | |||||||
| Service |
¥ | 2,111,111 | ¥ | 2,992,353 | ¥ | (881,242 | ) | (29.45 | %) | |||||||
| Total Revenue |
¥ | 46,958,185 | ¥ | 50,074,095 | ¥ | (3,115,910 | ) | (6.22 | %) | |||||||
Revenues. Our total revenues were ¥46,958,185 ($7,102,179), a decrease of 6.22% or ¥3,115,910 from ¥50,074,095 for the three months ended December 31, 2009. During this three month period, our automation business increased over 29.95%, while our accessory sales business and sales of transportation equipment decreased by 24.98% and 9.19%, respectively. The decrease in our revenues for the three months ended December 31, 2010 compared to the three months ended December 31, 2009 was due to the following operating challenges: (1) some of our clients adjusted their procurement policies, to increase direct purchases from brand manufacturers rather than purchase from agency companies, thus decreasing our revenues as an agent for hardware sales, and (2) some of our clients experienced delays in oilfield construction, which in turn caused delays in our projects, so we could not provide equipment to our clients and recognize the corresponding revenue as scheduled. The changes to our clients’ procurement policies may have long-term adverse effects on our operation and our management believes we need to adjust our business structure to place a greater emphasis on our automation and service business.
Cost and Margin
| For the Three Months Ended December 31, | ||||||||||||||||
| 2010 | 2009 | Increase (Decrease) |
Percentage Change |
|||||||||||||
| Total Revenue |
¥ | 46,958,185 | ¥ | 50,074,095 | ¥ | (3,115,910 | ) | (6.22 | %) | |||||||
| Cost of Revenue |
¥ | 27,127,021 | ¥ | 25,396,611 | ¥ | 1,730,410 | 6.81 | % | ||||||||
| Gross margin |
¥ | 19,831,164 | ¥ | 24,677,484 | ¥ | (4,846,320 | ) | (19.64 | %) | |||||||
| % |
42.23 | % | 49.28 | % | (7.05 | %) | ||||||||||
Cost of Revenues. Our cost of revenues includes raw materials and costs related to design, implementation, delivery and maintenance of products and services. We are a light-asset company, and all materials and components we need can be purchased or manufactured under contract. Usually the price of electronic components doesn’t fluctuate violently due to competitive forces, and it will not affect our cost significantly. Specialized equipment and incentive chemical products can be influenced directly if the price for metal and oil changes. Additionally, the price for some imported accessories appointed by our clients can also impact our cost.
8
Table of Contents
Our cost of revenues increased from ¥25,396,611 in the three months ended December 31, 2009 to ¥27,127,021 ($4,102,819) for the same period of 2010, an increase of ¥1,730,410 or 6.81%. As a percentage of revenues, our cost of revenues increased from 50.72% in the three months ended December 31, 2009 to 57.77% in the three months ended December 31, 2010. During this period, the increase was mainly caused by (1) price increase for raw materials, and (2) less preferential policies and higher prices provided by manufacturers.
Gross Profit. For the three months ended December 31, 2010, our gross profit decreased to ¥19,831,164 ($2,999,359) from ¥24,677,484 for the same period in 2009, a decrease of ¥4,846,320, or approximately 19.64%. For the three months ended December 31, 2010, our gross profit as a percentage of revenue decreased to 42.23%, from 49.28% for the same period in 2009. As a result of a decrease in our revenue and an increase in our cost, our gross profit decreased and gross margin dropped. Our management believes that a higher margin level is very important to secure our business. Additionally, as more and more domestic peer companies go public in Chinese capital markets, the oilfield service industry is becoming more and more competitive. To maintain our position and profitability in our segmented market, our management plans to focus its efforts on research and development of our products and expansion of our service business. As we also plan to actively finance our development.
The capital and technology intensive nature of our industry, abundant capital strength and spending of oil companies and a higher threshold for access make it possible for suppliers to earn high yields. As to sales of equipment and accessories, our gross margin remains at approximately 40% (a medium level), margin of automation products is approximately 50% and that of oilfield service and project engineering service can be higher than 60%. It’s our strategy to improve our operating results by participating in more projects and increasing the services we provide.
Expenses
Operating Expenses
| For the Three Months Ended December 31, | ||||||||||||||||
| 2010 | 2009 | Increase (Decrease) |
Percentage Change |
|||||||||||||
| Selling and Distribution Expenses |
¥ | 3,293,164 | ¥ | 3,863,886 | ¥ | (570,722 | ) | (14.77 | %) | |||||||
| Percentage of Revenue |
7.01 | % | 7.72 | % | (0.71 | %) | ||||||||||
| General and Administrative Expenses |
¥ | 7,503,250 | ¥ | 3,520,245 | ¥ | 3,983,005 | 113.15 | % | ||||||||
| Percentage of Revenue |
15.98 | % | 7.03 | % | 8.95 | % | ||||||||||
| Operating Expenses |
¥ | 10,796,414 | ¥ | 7,384,131 | ¥ | 3,412,283 | 46.21 | % | ||||||||
Selling and Distribution Expenses. Selling and distribution expenses consist primarily of salaries and related expenditures of our sales and marketing department, sales commissions, costs of our marketing programs, including public relations, advertising and trade shows; and an allocation of our facilities and depreciation expenses. Selling expenses decreased by 14.77%, from ¥3,863,886 for the three months ended December 31, 2009 to ¥3,293,164 ($498,074) for the same period of 2010. This decrease is mainly attributed to our long-term and stable relationship with CNPC and SINOPEC.
General and Administrative Expenses. General and administrative expenses consist primarily of costs from our human resources organization, facilities costs, depreciation expenses, professional advisor fees, audit fees and other expenses incurred in connection with general operations. General and administrative expenses increased 113.15%, or ¥3,983,005, from ¥3,520,245 in three months ended December 31, 2009 to ¥7,503,250 ($1,134,827) for the same period of 2010. General and administrative expenses were 7.03% of total revenues in the three months ended December 31, 2009 and 15.98% of total revenues in the same period in 2010. This percentage increase was primarily attributable to (1) some of our contracts could not be finished on time due to our clients’ project delays
9
Table of Contents
and our management’s decision to make some allowance for purchase advances related to these projects; (2) additional expenses related to our annual shareholder meeting; and (3) an increase of expenses related to our secondary offering, which was withdrawn due to unfavorable market conditions.
Income from Operations. Due to the construction delays experienced by some of our customers, which in turn delayed our projects, and the extra expenses we incurred associated with our annual meeting and our now withdrawn secondary offering, our revenue during the period decreased while our administrative expenses increased, causing our income from operations for the period to decrease by ¥8,258,603 to ¥9,034,750 ($1,366,458) for the three months ended December 31, 2010, compared to ¥17,293,353 for the same period of 2009.
Subsidy Income. We received grants of ¥1,131,709 and ¥0 ($0) from the local government for the three months ended December 31, 2009 and 2010, respectively. These grants were given by the government as return of income tax to support local companies to develop high technology and improve their products.
Income Tax Expense. Income taxes are provided based upon the liability method of accounting pursuant to ASC No. 740, “Accounting for Income Taxes.” Under this approach, deferred income taxes are recorded to reflect the tax consequences on future years of differences between the tax basis of assets and liabilities and their financial reporting amounts. A valuation allowance is recorded against deferred tax assets if it is not likely that the asset will be realized. We have not been subject to any income taxes in the United States or the Cayman Islands. Enterprises doing business in PRC are generally subject to federal (state) enterprise income tax at a rate of 25%; however, Nanjing Recon and BHD were granted certifications of High Technology Enterprise and are taxed at a rate of 15% for taxable income generated. The applicable tax rate for each of our subsidiaries changed in the past few years because of their qualifications and different local policies. From calendar year 2010, Nanjing Recon and BHD are taxed at a rate of 15% and ENI is still taxed at 25%. Our effective EIT burden will vary, depending on which of our domestic companies generate greater revenue.
Income tax expense for three months ended December 31, 2009 and 2010 was ¥4,414,087 and ¥1,844,184 ($278,923), respectively. This decrease was mainly due to a decrease in taxable operating income and a lower effective tax rate.
Net Income Attributable to Ordinary Shareholders. As a result of the factors described above, net income attributable to ordinary shareholders was ¥6,133,179 ($927,611) for the three months ended December 31, 2010, a decrease of 51.15% over ¥12,554,153 for the same period of 2009.
ADJUSTED EBITDA
| For the Three months ended December 31, | ||||||||||||||||||||
| 2010 | 2009 | Increase | Percentage | 2010 | ||||||||||||||||
| RMB | RMB | (Decrease) | Change | U.S. Dollars | ||||||||||||||||
| (Unaudited) | (Unaudited) | (Unaudited) | ||||||||||||||||||
| Reconciliation of Adjusted EBITDA from Net Income (Loss): |
||||||||||||||||||||
| Net income from continuing operations |
7,028,220 | 13,987,777 | (6,959,557 | ) | (49.75 | %) | 1,062,981 | |||||||||||||
| Income tax expense (benefit) |
1,844,184 | 4,414,087 | (2,569,903 | ) | (58.22 | %) | 278,923 | |||||||||||||
| Interest expense |
213,357 | 36,069 | 177,288 | 491.52 | % | 32,269 | ||||||||||||||
| Stock compensation expense |
431,378 | 442,013 | (10,635 | ) | (2.41 | %) | 65,244 | |||||||||||||
| Depreciation, amortization and accretion |
104,681 | 87,790 | 16,891 | 20.33 | % | 15,832 | ||||||||||||||
| Adjusted EBITDA |
9,621,820 | 18,967,736 | (9,345,916 | ) | (49.67 | %) | 1,455,249 | |||||||||||||
10
Table of Contents
Adjusted EBITDA. We define Adjusted EBITDA as income from continuing operations before income tax expense, interest expense, non-cash stock compensation expense, and depreciation, amortization and accretion expense. We think it is useful to an equity investor in evaluating our operating performance because: (1) it is widely used by investors in our industry to measure a company’s operating performance without regard to items such as interest expense, depreciation and amortization, which can vary substantially from company to company depending upon accounting methods and book value of assets, capital structure and the method by which the assets were acquired; and (2) it helps investors more meaningfully evaluate and compare the results of our operations from period to period by removing the impact of our capital structure and asset base from our operating results.
Adjusted EBITDA decreased ¥9,345,916 or 49.67% to ¥9,621,820 for the three months ended December 31, 2010 compared to the same period in 2009. This was due to the construction delays experienced by some of our customers, which in turn delayed our projects, and the extra expenses we incurred associated with our annual meeting and our now withdrawn secondary offering. These factors caused revenues during the period to decrease while our administrative expenses increased. Compared to the 51.15% decrease in net income available for ordinary shareholders, we believe EBITDA more accurately reflects our operations.
Six Months Ended December 31, 2010 Compared to Six Months Ended December 31, 2009
Our historical reporting results are not necessarily indicative of the results to be expected for any future period.
Revenue
| For the Six Months ended December 31, | ||||||||||||||||
| 2010 | 2009 | Increase (Decrease) |
Percentage Change |
|||||||||||||
| Hardware |
¥ | 66,646,385 | ¥ | 66,353,385 | ¥ | 293,000 | 0.44 | % | ||||||||
| Service |
¥ | 2,111,111 | ¥ | 5,965,812 | ¥ | (3,854,701 | ) | (64.61 | %) | |||||||
| Software |
— | ¥ | 226,496 | ¥ | (226,496 | ) | (100.00 | %) | ||||||||
| Total Revenue |
¥ | 68,757,496 | ¥ | 72,545,692 | ¥ | (3,788,197 | ) | (5.22 | %) | |||||||
Revenues. Our total revenues were ¥68,757,496 ($10,399,209), a slight decrease of 5.22% from ¥72,545,692 for the six months ended December 31, 2009. During this six month period, our automation business increased approximately 11.94%, while our accessory sales business and sales of transportation equipment decreased by 8.84% and 10.89%, respectively. This was mainly caused by our shrinking accessory agency business and delays in some of our projects caused by our clients’ field construction.
Cost and Margin
| For the Six Months Ended December 31, | ||||||||||||||||
| 2010 | 2009 | Increase (Decrease) |
Percentage Change |
|||||||||||||
| Total Revenue |
¥ | 68,757,496 | ¥ | 72,545,692 | ¥ | (3,788,196 | ) | (5.22 | %) | |||||||
| Cost of Revenue |
¥ | 41,208,514 | ¥ | 41,469,158 | ¥ | (260,644 | ) | (0.63 | %) | |||||||
| Gross Margin |
¥ | 27,548,982 | ¥ | 31,076,535 | ¥ | (3,527,552 | ) | (11.35 | %) | |||||||
| Margin % |
40.07 | % | 42.84 | % | (2.77 | %) | ||||||||||
11
Table of Contents
Cost of Revenues. Our cost of revenues decreased slightly from ¥41,469,158 in the six months ended December 31, 2009 to ¥41,208,514 ($6,232,571) for the same period of 2010. As a percentage of revenues, our cost of revenues increased from 57.16% in the six months ended December 31, 2009 to 59.93% in the same period of 2010. This increase was a result of a price increase for our raw materials and for the products we sell as an agent.
Gross Profit. For the six months ended December 31, 2010, our gross profit decreased to ¥27,548,982 ($4,166,638) from ¥31,076,535 for the same period in 2009, a decrease of ¥3,527,552, or approximately 11.35%. For the six months ended December 31, 2010, our gross profit as a percentage of revenue decreased to 40.07%, from 42.84% for the same period in 2009. Our management believes it is necessary to adjust our business structure to maintain a higher margin ratio. We plan to accomplish this by focusing more on our automation business and self-developed products and services, while shifting our focus away from agency sales, which provide a lower margin.
Expenses
Operating expenses
| For the Six Months Ended December 31, | ||||||||||||||||
| 2010 | 2009 | Increase (Decrease) |
Percentage Change |
|||||||||||||
| Selling and Distribution Expenses |
¥ | 5,096,317 | ¥ | 6,023,098 | ¥ | (926,781 | ) | (15.39 | %) | |||||||
| Percentage of Revenue |
7.41 | % | 8.30 | % | (0.89 | %) | ||||||||||
| General and Administrative Expenses |
¥ | 11,725,064 | ¥ | 6,465,900 | ¥ | 5,259,164 | 81.34 | % | ||||||||
| Percentage of Revenue |
17.05 | % | 8.91 | % | 8.14 | % | ||||||||||
| Operating Expenses |
¥ | 16,821,381 | ¥ | 12,488,998 | ¥ | 4,332,383 | 34.69 | % | ||||||||
Selling and Distribution Expenses. Selling expenses decreased by 15.39%, from ¥6,023,098 for six months ended December 31, 2009 to ¥5,096,317 ($770,791) for the same period of 2010. This decrease is mainly attributed to our long-term and stable relationship with CNPC and SINOPEC, as expenses associated with maintaining their business decreased.
General and Administrative Expenses. General and administrative expenses increased 81.34%, or ¥5,259,164, from ¥6,465,900 in six months ended December 31, 2009 to ¥11,725,064 ($1,773,354) for the same period of 2010. General and administrative expenses were 8.91% of total revenues for the six months ended December 31, 2009 and 17.05% of total revenues in the same period in 2010. This percentage increase was primarily attributable to (1) more expenses related to being a public company, particularly expenses associated without annual shareholder meeting, director meeting and investor relations service; and (2) an increase of expenses related to our planned secondary offering, which was withdrawn due to unfavorable market conditions.
Income from Operations. Income from operations was ¥10,727,601 ($1,622,493) for the six months ended December 31, 2010, compared to ¥18,587,537 for the same period of 2009. As a result of lower revenue and higher administrative expenses, income from operations decreased during this period.
Subsidy Income. We received grants of ¥1,158,034 and ¥451,520 ($68,290) from the local government for the six months ended December 31, 2009 and 2010, respectively. These grants were given by the government as return of income tax to support local companies to develop advanced technology and improve their products.
Income Tax Expense. Income tax expense for the six months ended December 31, 2009 and 2010 was ¥5,106,765 and ¥2,650,010 ($400,800), respectively. This decrease was mainly due to a decrease in taxable operating income and a lower effective tax rate.
12
Table of Contents
Net Income Attributable to Ordinary Shareholders. As a result of the factors described above, net income attributable to ordinary shareholders was ¥6,976,942 ($1,055,226) for the six months ended December 31, 2010, a decrease of 46.24% over ¥12,978,572 for the same period of 2009.
ADJUSTED EBITDA
| For the Six Months Ended December 31, | ||||||||||||||||||||
| 2010 | 2009 | Increase | Percentage | 2010 | ||||||||||||||||
| RMB | RMB | (Decrease) | Change | U.S. Dollars | ||||||||||||||||
| (Unaudited) | (Unaudited) | (Unaudited) | ||||||||||||||||||
| Reconciliation of Adjusted EBITDA from Net Income (Loss): |
||||||||||||||||||||
| Income from continuing operations |
8,212,313 | 14,649,511 | (6,437,198 | ) | (43.94 | %) | 1,242,069 | |||||||||||||
| Income tax expense (benefit) |
2,650,010 | 5,106,765 | (2,456,755 | ) | (48.11 | %) | 400,800 | |||||||||||||
| Interest expense |
326,796 | 77,313 | 249,483 | 322.69 | % | 49,426 | ||||||||||||||
| Stock compensation expense |
870,084 | 736,688 | 133,396 | 18.11 | % | 131,596 | ||||||||||||||
| Depreciation, amortization and accretion |
203,278 | 170,864 | 32,414 | 18.97 | % | 30,745 | ||||||||||||||
| Adjusted EBITDA |
12,262,481 | 20,741,141 | (8,478,660 | ) | (40.88 | %) | 1,854,636 | |||||||||||||
Adjusted EBITDA. Adjusted EBITDA decreased ¥8,478,660 or 40.88% to ¥12,262,481 for the six months ended December 31, 2010 compared to the same period in 2009. This was due to the construction delays experienced by some of our customers, which in turn delayed our projects, and the extra expenses we incurred associated with our annual meeting and our now withdrawn secondary offering. These factors caused revenues during the period to decrease while our administrative expenses increased. Compared to the 46.24% decrease in net income attributable to ordinary shareholders, we believe EBITDA more accurately reflects our operations.
Liquidity and Capital Resources.
General
Cash and Cash Equivalents. Cash and cash equivalents are comprised of cash on hand, demand deposits and highly liquid short-term debt investments with stated maturities of no more than six months. As of December 31, 2010, we had cash and cash equivalents in the amount of ¥12,087,113 ($1,828,112).
Indebtedness. As of December 31, 2010, except for ¥10,509,939 ($1,589,573) of short-term borrowings and a ¥5,000,000 ($756,224) commercial loan from a local bank, we did not have any finance leases or hire purchase commitments, guarantees or other material contingent liabilities.
Holding Company Structure. We are a holding company with no operations of our own. All of our operations are conducted through our Domestic Companies. As a result, our ability to pay dividends and to finance any debt that we may incur is dependent upon the receipt of dividends and other distributions from the Domestic Companies. In addition, Chinese legal restrictions permit payment of dividends to us by our Domestic Companies only out of their accumulated net profit, if any, determined in accordance with Chinese accounting standards and regulations. Under Chinese law, our Domestic Companies are required to set aside a portion (at least 10%) of their after-tax net income (after discharging all cumulated loss), if any, each year for compulsory statutory reserve until the amount of the reserve reaches 50% of our Domestic Companies’ registered capital. These funds may be distributed to shareholders at the time of their wind up. When we were incorporated in the Cayman Islands in August 2007, 5,000,000 ordinary shares were authorized, and 50,000 ordinary shares were issued to Mr. Yin Shenping, Mr. Chen Guangqiang and Mr. Li Hongqi, at a par value of $0.01 each. On December 10, 2007, our company sold 2,632 ordinary shares to an investor at an aggregate consideration of $200,000. On June 8, 2009, in connection with our initial public offering,
13
Table of Contents
the Board of Directors approved a 42.7840667-to-1 split of ordinary shares and redeemable ordinary shares to shareholders of record as of such date. After giving effect to the share split of our ordinary shares and the completion of our initial public offering, we had 3,951,811 ordinary shares outstanding.
Off-Balance Sheet Arrangements. We have not entered into any financial guarantees or other commitments to guarantee the payment obligations of any third parties. In addition, we have not entered into any derivative contracts that are indexed to our own shares and classified as shareholders’ equity, or that are not reflected in our financial statements. Furthermore, we do not have any retained or contingent interest in assets transferred to an unconsolidated entity that serves as credit, liquidity or market risk support to such entity. Moreover, we do not have any variable interest in an unconsolidated entity that provides financing, liquidity, market risk or credit support to us or engages in leasing, hedging or research and development services with us.
Capital Resources. To date we have financed our operations primarily through cash flows from financing operations. As of December 31, 2010 we had total assets of ¥195,299,159 ($29,537,971), of which includes cash amounting to ¥12,087,113 ($1,828,112), and net accounts receivable amounting to ¥104,434,261 ($15,795,133). Working capital amounted to ¥126,044,837 ($19,063,619) and shareholders’ equity amounted to ¥128,138,739 ($19,380,310).
Cash from Operating Activities. Net cash used by operating activities was ¥3,137,045 ($474,462) for the six months ended December 31, 2010. This was a decrease of ¥13,775,202 from ¥16,912,247 for the six months ended December 31, 2009. The decrease was due to the fact that we paid significant funds to purchase inventory and pay expenses for our secondary offering.
Cash from Investing Activities. Net cash used in investing activities was ¥24,849($3,758) for the six months ended December 31, 2010, relatively stable compared to the same period in 2009.
Cash from Financing Activities. Cash flows provided by financing activities amounted to ¥3,141,601 ($475,151) for the six months ended December 31, 2010 and cash flows provided by financing activities amounted to ¥59,381,762 for the six months ended December 31, 2009. The decrease was due to the fact that we received our IPO funds in the same period of 2009. In this period of 2010, we borrowed funds of ¥5,000,000 ($756,224) from a domestic commercial bank to supplement working capital.
Working Capital. Total current assets as of December 31, 2010 amounted to ¥193,205,257 ($29,221,279), an increase of ¥18,316,812 ($2,770,322) compared to ¥174,888,445 at June 30, 2010. The increase was attributable mainly to an increase in the amount of trade receivables and inventories.
Current liabilities amounted to ¥67,160,420 ($10,157,661) at December 31, 2010, in comparison to ¥57,563,362 at June 30, 2010. This increase has been attributed to the increase in trade accounts payable and short term loans.
The current ratio decreased from 3.04 at June 30, 2010 to 2.88 at December 31, 2010. The change in our current ratio was primarily due to the increase of trade accounts payable and short term loans.
Recently Enacted Accounting Standards
The FASB issued ASU 2010-13, Compensation - Stock Compensation (ACS Topic 718): Effect of Denominating the Exercise Price of a Share-Based Payment Award in the Currency of the Market in Which the Underlying Equity Security Trades. The ASU codifies the consensus reached in Emerging Issues Task Force (EITF) Issue No. 09-J. The amendments to the Codification clarify that an employee share-based payment award with an exercise price denominated in the currency of a market in which a substantial portion of the entity’s equity shares trades should not be considered to contain a condition that is not a market, performance, or service condition. Therefore, an entity would not classify such an award as a liability if it otherwise qualifies as equity.
The amendments in the ASU are effective for fiscal years, and interim periods within those fiscal years, beginning on or after December 15, 2010. Earlier adoption is permitted. The amendments are to be applied by recording a cumulative-effect adjustment to beginning retained earnings. We are currently evaluating the impact of adopting this update on our consolidated financial statements.
14
Table of Contents
In February 2010, FASB issued ASU No. 2010-09 “Subsequent Events” (ASC Topic 855) which removes the requirement for an SEC filer to disclose a date in both issued and revised financial statements. This amendment shall be applied prospectively for interim or annual financial periods ending after June 15, 2010. The Company does not believe the adoption will have a material effect on the Company’s consolidated financial statements.
The FASB has issued ASU 2010-06, Fair Value Measurements and Disclosures (ACS Topic 820): Improving Disclosures about Fair Value Measurements. This ASU requires some new disclosures and clarifies some existing disclosure requirements about fair value measurement as set forth in Codification Subtopic 820-10. The FASB’s objective is to improve these disclosures and, thus, increase the transparency in financial reporting. Specifically, ASU 2010-06 amends Codification Subtopic 820-10 to now require:
| • | A reporting entity to disclose separately the amounts of significant transfers in and out of Level 1 and Level 2 fair value measurements and describe the reasons for the transfers; and |
| • | In the reconciliation for fair value measurements using significant unobservable inputs, a reporting entity should present separately information about purchases, sales, issuances, and settlements. |
In addition, ASU 2010-06 clarifies the requirements of the following existing disclosures:
| • | For purposes of reporting fair value measurement for each class of assets and liabilities, a reporting entity needs to use judgment in determining the appropriate classes of assets and liabilities; and |
| • | A reporting entity should provide disclosures about the valuation techniques and inputs used to measure fair value for both recurring and nonrecurring fair value measurements. |
ASU 2010-06 is effective for interim and annual reporting periods beginning after December 15, 2009, except for the disclosures about purchases, sales, issuances, and settlements in the roll forward of activity in Level 3 fair value measurements. Those disclosures are effective for fiscal years beginning after December 15, 2010, and for interim periods within those fiscal years. Early adoption is permitted. This guidance was effective for our third quarter ended March 31, 2010.
The FASB has issued Accounting Standard Update (ASU) 2009-17, Consolidations (Topic 810) - Improvements to Financial Reporting by Enterprises Involved with Variable Interest Entities. ASU 2009-17 changes how a reporting entity determines when an entity that is insufficiently capitalized or is not controlled through voting (or similar rights) should be consolidated. This determination is based on, among other things, the other entity’s purpose and design and the Company’s ability to direct the activities of the other entity that most significantly impact the other entity’s economic performance. ASU 2009-17 also required additional disclosures concerning an enterprise’s continuing involvement with variable interest entities. ASU 2009-17 is effective at the start of the Company’s first fiscal year beginning after November 15, 2009. The adoption had no effect on the Company’s financial position, results of operations, or cash flows but resulted in additional disclosures related to variable interest entities.
15
Table of Contents
| Item 3. | Quantitative and Qualitative Disclosures about Market Risk. |
Not applicable.
| Item 4/4T. | Controls and Procedures |
Disclosure Controls and Procedures
As of December 31, 2010, our company carried out an evaluation, under the supervision of and with the participation of management, including our company’s chief executive officer and chief financial officer, of the effectiveness of the design and operation of our company’s disclosure controls and procedures. Based on the foregoing, the chief executive officer and chief financial officer concluded that our company’s disclosure controls and procedures (as defined in Rules 13a-15(e) and 15d-15(e) under the Securities Exchange Act of 1934) were effective.
Changes in Internal Control over Financial Reporting
There were no changes in our company’s internal control over financial reporting (as defined in Rule 13a-15(f) of the Securities Exchange Act of 1934) during the quarter ended December 31, 2010 that have materially affected, or are reasonably likely to materially affect, our company’s internal control over financial reporting.
16
Table of Contents
| Item 1. | Legal Proceedings |
None.
| Item 1A | Risk Factors |
Not applicable.
| Item 2. | Unregistered Sales of Equity Securities and Use of Proceeds |
| (a) | None |
| (b) | The section entitled “Use of Proceeds” from our registration statement filed on August 12, 2008, as amended (the “Registration Statement”) is incorporated herein by reference. The effective date of the Registration Statement is July 22, 2009, and the Commission file number assigned to the Registration Statement is 333-152964. The Registration Statement registers the offering of up to 1,700,000 ordinary shares (subject to amendment in accordance with the Securities Act of 1933 and the rules and regulations promulgated thereunder) (the Offering”). As of December 31, 2010, the Company has spent proceeds from the Offering in accordance with the following chart: |
| Description of Use |
Proposed Expenditure Amount |
Actual Expenditures through December 31, 2010 |
||||||
| Product Research and development |
$ | 1,273,024 | $ | 0 | ||||
| Acquisition and business development in oil-field industry in China and globally |
4,073,675 | 5,000,000 | ||||||
| Sarbanes-Oxley compliance |
424,341 | 0 | ||||||
| Fixed asset purchases |
442,341 | 0 | ||||||
| Employee training |
169,736 | 6,639 | ||||||
| General working capital |
2,121,706 | 1,138,268 | ||||||
| Total |
$ | 8,486,824 | $ | 6,144,907 | ||||
| (c) | None |
| Item 3. | Defaults upon Senior Securities |
None.
| Item 4. | (Removed and Reserved) |
| Item 5. | Other Information |
None.
17
Table of Contents
| Item 6. | Exhibits |
The following exhibits are filed herewith:
| Exhibit |
Document | |
| 3.1 | Amended and Restated Articles of Association of the Registrant (1) | |
| 3.2 | Amended and Restated Memorandum of Association of the Registrant (1) | |
| 4.1 | Specimen Share Certificate (1) | |
| 10.1 | Translation of Exclusive Technical Consulting Service Agreement between Recon Technology (Jining) Co., Ltd. and Beijing BHD Petroleum Technology Co., Ltd. (1) | |
| 10.2 | Translation of Power of Attorney for rights of Chen Guangqiang in Beijing BHD Petroleum Technology Co., Ltd. (1) | |
| 10.3 | Translation of Power of Attorney for rights of Yin Shenping in Beijing BHD Petroleum Technology Co., Ltd. (1) | |
| 10.4 | Translation of Power of Attorney for rights of Li Hongqi in Beijing BHD Petroleum Technology Co., Ltd. (1) | |
| 10.5 | Translation of Exclusive Equity Interest Purchase Agreement between Recon Technology (Jining) Co. Ltd., Chen Guangqiang and Beijing BHD Petroleum Technology Co., Ltd. (1) | |
| 10.6 | Translation of Exclusive Equity Interest Purchase Agreement between Recon Technology (Jining) Co. Ltd., Yin Shenping and Beijing BHD Petroleum Technology Co., Ltd. (1) | |
| 10.7 | Translation of Exclusive Equity Interest Purchase Agreement between Recon Technology (Jining) Co. Ltd., Li Hongqi and Beijing BHD Petroleum Technology Co., Ltd. (1) | |
| 10.8 | Translation of Equity Interest Pledge Agreement between Recon Technology (Jining) Co., Ltd., Chen Guangqiang and Beijing BHD Petroleum Technology Co., Ltd. (1) | |
| 10.9 | Translation of Equity Interest Pledge Agreement between Recon Technology (Jining) Co., Ltd., Yin Shenping and Beijing BHD Petroleum Technology Co., Ltd. (1) | |
| 10.10 | Translation of Equity Interest Pledge Agreement between Recon Technology (Jining) Co., Ltd., Li Hongqi and Beijing BHD Petroleum Technology Co., Ltd. (1) | |
| 10.11 | Translation of Exclusive Technical Consulting Service Agreement between Recon Technology (Jining) Co., Ltd. and Jining ENI Energy Technology Co., Ltd. (1) | |
| 10.12 | Translation of Power of Attorney for rights of Chen Guangqiang in Jining ENI Energy Technology Co., Ltd. (1) | |
| 10.13 | Translation of Power of Attorney for rights of Yin Shenping in Jining ENI Energy Technology Co., Ltd. (1) | |
| 10.14 | Translation of Power of Attorney for rights of Li Hongqi in Jining ENI Energy Technology Co., Ltd. (1) | |
| 10.15 | Translation of Exclusive Equity Interest Purchase Agreement between Recon Technology (Jining) Co. Ltd., Chen Guangqiang and Jining ENI Energy Technology Co., Ltd. (1) | |
| 10.16 | Translation of Exclusive Equity Interest Purchase Agreement between Recon Technology (Jining) Co. Ltd., Yin Shenping and Jining ENI Energy Technology Co., Ltd. (1) | |
| 10.17 | Translation of Exclusive Equity Interest Purchase Agreement between Recon Technology (Jining) Co. Ltd., Li Hongqi and Jining ENI Energy Technology Co., Ltd. (1) | |
| 10.18 | Translation of Equity Interest Pledge Agreement between Recon Technology (Jining) Co., Ltd., Chen Guangqiang and Jining ENI Energy Technology Co., Ltd. (1) | |
18
Table of Contents
| 10.19 | Translation of Equity Interest Pledge Agreement between Recon Technology (Jining) Co., Ltd., Yin Shenping and Jining ENI Energy Technology Co., Ltd. (1) | |
| 10.20 | Translation of Equity Interest Pledge Agreement between Recon Technology (Jining) Co., Ltd., Li Hongqi and Jining ENI Energy Technology Co., Ltd. (1) | |
| 10.21 | Translation of Exclusive Technical Consulting Service Agreement between Recon Technology (Jining) Co., Ltd. and Nanjing Recon Technology Co., Ltd. (1) | |
| 10.22 | Translation of Power of Attorney for rights of Chen Guangqiang in Nanjing Recon Technology Co., Ltd. (1) | |
| 10.23 | Translation of Power of Attorney for rights of Yin Shenping in Nanjing Recon Technology Co., Ltd. (1) | |
| 10.24 | Translation of Power of Attorney for rights of Li Hongqi in Nanjing Recon Technology Co., Ltd. (1) | |
| 10.25 | Translation of Exclusive Equity Interest Purchase Agreement between Recon Technology (Jining) Co. Ltd., Chen Guangqiang and Nanjing Recon Technology Co., Ltd. (1) | |
| 10.26 | Translation of Exclusive Equity Interest Purchase Agreement between Recon Technology (Jining) Co. Ltd., Yin Shenping and Nanjing Recon Technology Co., Ltd. (1) | |
| 10.27 | Translation of Exclusive Equity Interest Purchase Agreement between Recon Technology (Jining) Co. Ltd., Li Hongqi and Nanjing Recon Technology Co., Ltd. (1) | |
| 10.28 | Translation of Equity Interest Pledge Agreement between Recon Technology (Jining) Co., Ltd., Chen Guangqiang and Nanjing Recon Technology Co., Ltd. (1) | |
| 10.29 | Translation of Equity Interest Pledge Agreement between Recon Technology (Jining) Co., Ltd., Yin Shenping and Nanjing Recon Technology Co., Ltd. (1) | |
| 10.30 | Translation of Equity Interest Pledge Agreement between Recon Technology (Jining) Co., Ltd., Li Hongqi and Nanjing Recon Technology Co., Ltd. (1) | |
| 10.33 | Employment Agreement between Recon Technology (Jining) Co., Ltd. and Mr. Yin Shenping (1) | |
| 10.34 | Employment Agreement between Recon Technology (Jining) Co., Ltd. and Mr. Chen Guangqiang (1) | |
| 10.35 | Employment Agreement between Recon Technology (Jining) Co., Ltd. and Mr. Li Hongqi (1) | |
| 10.36 | Summary Translation of Technical Service Contract by and between Natural Gas Development Company of Qinghai Oilfield and Beijing BHD Petroleum Technology Co., Ltd. (1) | |
| 10.37 | Summary Translation of Sales Contract, by and between the West Site Department of Bazhou, Zhongyuan Petroleum Exploration Bureau Project Construction Corporation and Jining ENI Energy Technology Co., Ltd. (1) | |
| 10.38 | Ordinary Shares Subscription Agreement dated December 31, 2007 between the Registrant and Bloomsway Development Ltd (1) | |
| 10.39 | Translation of Contract for the Sale of Industrial and Mineral Products between Nanjing Recon Technology Co., Ltd. and PetroChina Qinghai Oilfield Co., Ltd. (1) | |
| 10.40 | Translation of Contract of Material Reserves and Sales between Beijing BHD Petroleum Technology Co., Ltd. and PetroChina Qinghai Oilfield Co., Ltd. (1) | |
| 10.41 | Translation of Contract of Material Reserves and Sales between Beijing BHD Petroleum Technology Co., Ltd. and PetroChina Qinghai Oilfield Co., Ltd. (1) | |
| 10.42 | Translation of Contract for Purchasing Vacuum-Heating-Furnace between Beijing BHD Petroleum Technology Co., Ltd. and PetroChina Huabei Oilfield Co., Ltd. (1) | |
19
Table of Contents
| 10.43 | Translation of Contract of the Sale of Goods between Beijing BHD Petroleum Technology Co., Ltd. and PetroChina Huabei Oilfield Co., Ltd. (1) | |
| 10.44 | Summary Translation of Chuan East to Chuan West Transferring Gas Pipe Project Product Collective Contract between Jining ENI Energy Technology Co., Ltd. and Southwest Oil Gas Company of Sinopec. (1) | |
| 10.45 | Summary Translation of Industrial Product Purchasing Agreement between Jining ENI Energy Technology Co., Ltd. and Southwest Oil Gas Company of Sinopec. (1) | |
| 10.46 | Summary Translation of Purchase Agreement between Jining ENI Energy Technology Co., Ltd. and Southwest Oil Gas Company of Sinopec. (1) | |
| 10.47 | Summary Translation of Chuan East to Chuan West Transferring Gas Pipe Project Product Collective Contract between Jining ENI Energy Technology Co., Ltd. and Southwest Oil Gas Company of Sinopec. (1) | |
| 10.48 | Operating Agreement among Recon Technology (Jining) Co. Ltd., Nanjing Recon Technology Co., Ltd. and Mr. Yin Shenping, Mr. Chen Guangqiang and Mr. Li Hongqi (1) | |
| 10.49 | Operating Agreement among Recon Technology (Jining) Co. Ltd., Jining ENI Energy Technology Co., Ltd., and Mr. Yin Shenping, Mr. Chen Guangqiang and Mr. Li Hongqi (1) | |
| 10.50 | Operating Agreement among Recon Technology (Jining) Co. Ltd., Beijing BHD and Mr. Yin Shenping, Mr. Chen Guangqiang and Mr. Li Hongqi (1) | |
| 21.1 | Subsidiaries of the Registrant (1) | |
| 99.1 | Stock Option Plan (1) | |
| 99.2 | Code of Business Conduct and Ethics (1) | |
| 31.1 | Certifications pursuant to Rule 13a-14(a) or 15d-14(a) under the Securities Exchange Act of 1934, as amended, as adopted pursuant to Section 302 of the Sarbanes-Oxley Act of 2002. (2) | |
| 31.2 | Certifications pursuant to Rule 13a-14(a) or 15d-14(a) under the Securities Exchange Act of 1934, as amended, as adopted pursuant to Section 302 of the Sarbanes-Oxley Act of 2002. (2) | |
| 32.1 | Certifications pursuant to 18 U.S.C. Section 1350, as adopted pursuant to Section 906 of the Sarbanes-Oxley Act of 2002. (2) | |
| 32.1 | Certifications pursuant to 18 U.S.C. Section 1350, as adopted pursuant to Section 906 of the Sarbanes-Oxley Act of 2002. (2) | |
| (1) | Incorporated by reference to the Company’s Registration Statement on Form S-1, Registration No. 333-152964. |
| (2) | Filed herewith. |
20
Table of Contents
SIGNATURES
In accordance with the requirements of the Exchange Act, the Company caused this report to be signed on its behalf by the undersigned, thereunto duly authorized.
| RECON TECHNOLOGY, LTD | ||||
| February 14, 2011 | By: | /s/ Liu Jia | ||
| Liu Jia | ||||
| Chief Financial Officer | ||||
| (Principal Financial and Accounting Officer) | ||||
21
Table of Contents
| INDEX TO FINANCIAL STATEMENTS | PAGE | |||
| F-2 | ||||
| F-3 | ||||
| F-4 | ||||
| F-5 - F-25 | ||||
Table of Contents
RECON TECHNOLOGY, LTD
CONSOLIDATED BALANCE SHEETS
| June 30, | December 31, | December 31, | ||||||||||
| 2010 | 2010 | 2010 | ||||||||||
| RMB | RMB | U.S. Dollars | ||||||||||
| (Unaudited) | (Unaudited) | |||||||||||
| ASSETS |
||||||||||||
| Current assets |
||||||||||||
| Cash and cash equivalents (including balance from consolidated parent companies of ¥7,453,184 and ¥3,796,211 ($574,157) as of June 30, 2010 and December 31, 2010, respectively) |
¥ | 12,142,957 | ¥ | 12,087,113 | $ | 1,828,112 | ||||||
| Trade accounts receivable, net |
89,425,990 | 104,434,261 | 15,795,133 | |||||||||
| Other receivables, net |
12,850,547 | 18,685,512 | 2,826,085 | |||||||||
| Purchase advances (including balance from consolidated parent companies of ¥255,323 and ¥171,907 ($26,000) as of June 30, 2010 and December 31, 2010, respectively) |
46,551,402 | 27,025,069 | 4,087,400 | |||||||||
| Prepaid expenses (including balance from consolidated parent companies of ¥237,879 and ¥140,038 ($21,180) as of June 30, 2010 and December 31, 2010, respectively) |
766,638 | 140,038 | 21,180 | |||||||||
| Inventories |
13,150,911 | 30,833,264 | 4,663,369 | |||||||||
| Total current assets |
174,888,445 | 193,205,257 | 29,221,280 | |||||||||
| Property and equipment, net (including balance from consolidated parent companies of ¥10,690 and ¥9,720 ($1,470) as of June 30, 2010 and December 31, 2010, respectively) |
1,482,881 | 1,304,452 | 197,292 | |||||||||
| Deferred tax assets |
275,960 | 789,450 | 119,400 | |||||||||
| Total Assets |
¥ | 176,647,286 | ¥ | 195,299,159 | $ | 29,537,971 | ||||||
| LIABILITIES AND EQUITY |
||||||||||||
| Current liabilities |
||||||||||||
| Trade accounts payable |
¥ | 16,536,796 | ¥ | 21,148,001 | $ | 3,198,524 | ||||||
| Other payables (including balance from consolidated parent companies of ¥194,361 and ¥456,221 ($69,001) as of June 30, 2010 and December 31, 2010, respectively) |
3,096,309 | 3,472,063 | 525,131 | |||||||||
| Deferred income |
4,267,711 | 2,438,253 | 368,773 | |||||||||
| Advances from customers |
439,761 | 120,650 | 18,248 | |||||||||
| Accrued payroll and employees’ welfare |
360,540 | 87,169 | 13,184 | |||||||||
| Accrued expenses |
290,803 | 278,873 | 42,178 | |||||||||
| Taxes payable |
20,203,104 | 24,105,472 | 3,645,826 | |||||||||
| Short-term bank loan |
— | 5,000,000 | 756,224 | |||||||||
| Short-term borrowings |
5,024,881 | 4,568,540 | 690,968 | |||||||||
| Short-term borrowings- related parties |
7,343,457 | 5,941,399 | 898,605 | |||||||||
| Total current liabilities |
57,563,362 | 67,160,420 | 10,157,661 | |||||||||
| Total Liabilities |
57,563,362 | 67,160,420 | 10,157,661 | |||||||||
| Commitments and Contingencies |
||||||||||||
| Equity |
||||||||||||
| Ordinary shares ($ 0.0185 U.S. dollar par value, 25,000,000 shares authorized; 3,951,811 and 3,951,811 shares issued and outstanding as of June 30, 2010 and December 31, 2010, respectively) |
529,979 | 529,979 | 80,157 | |||||||||
| Additional paid-in capital |
69,257,098 | 70,141,123 | 10,608,476 | |||||||||
| Appropriated retained earnings |
3,755,503 | 4,557,675 | 689,324 | |||||||||
| Unappropriated retained earnings |
36,034,500 | 42,209,270 | 6,383,930 | |||||||||
| Accumulated other comprehensive loss |
(76,997 | ) | (114,368 | ) | (17,298 | ) | ||||||
| Total controlling shareholders’ equity |
109,500,083 | 117,323,680 | 17,744,589 | |||||||||
| Non-controlling interest, net of tax |
9,583,841 | 10,815,060 | 1,635,721 | |||||||||
| Total equity |
119,083,924 | 128,138,739 | 19,380,310 | |||||||||
| Total Liabilities and Equity |
¥ | 176,647,286 | ¥ | 195,299,159 | $ | 29,537,971 | ||||||
(Note: except for some items including balances from consolidated parent companies as indicated above, all of the assets represented assets of consolidated variable interest entities (VIEs) that can be used only to settle obligations of the consolidated VIEs, all of the liabilities represented liabilities of the consolidated VIEs for which creditors (or beneficial interest holders) do not have recourse to the general credit of the primary beneficiary. For the summary information regarding VIEs, please refer to note 18)
See notes to the consolidated financial statements
F-2
Table of Contents
RECON TECHNOLOGY, LTD
CONSOLIDATED STATEMENTS OF INCOME AND COMPREHENSIVE INCOME
| For the Six Months ended December 31, |
For the Three Months ended December 31, |
For the Six Months ended December 31, |
||||||||||||||||||
| 2009 | 2010 | 2009 | 2010 | 2010 | ||||||||||||||||
| RMB | RMB | RMB | RMB | U.S. Dollars | ||||||||||||||||
| (Unaudited) | (Unaudited) | (Unaudited) | (Unaudited) | (Unaudited) | ||||||||||||||||
| Revenues |
||||||||||||||||||||
| Hardware |
¥ | 66,353,385 | ¥ | 66,646,385 | ¥ | 47,081,742 | ¥ | 44,847,074 | $ | 10,079,915 | ||||||||||
| Service |
5,965,812 | 2,111,111 | 2,992,353 | 2,111,111 | 319,294 | |||||||||||||||
| Software |
226,496 | — | — | — | — | |||||||||||||||
| Total revenues |
72,545,692 | 68,757,496 | 50,074,094 | 46,958,185 | 10,399,209 | |||||||||||||||
| Cost of revenues |
41,469,158 | 41,208,514 | 25,396,611 | 27,127,021 | 6,232,571 | |||||||||||||||
| Gross margin |
31,076,535 | 27,548,982 | 24,677,484 | 19,831,164 | 4,166,638 | |||||||||||||||
| Selling and distribution expenses |
6,023,098 | 5,096,317 | 3,863,886 | 3,293,164 | 770,791 | |||||||||||||||
| General and administrative expenses |
6,465,900 | 11,725,064 | 3,520,245 | 7,503,250 | 1,773,354 | |||||||||||||||
| Operating expenses |
12,488,998 | 16,821,381 | 7,384,131 | 10,796,414 | 2,544,145 | |||||||||||||||
| Income from operations |
18,587,537 | 10,727,601 | 17,293,353 | 9,034,750 | 1,622,493 | |||||||||||||||
| Other income (expenses) |
||||||||||||||||||||
| Subsidy income |
1,158,034 | 451,520 | 1,131,709 | — | 68,290 | |||||||||||||||
| Interest income |
5,772 | 4,939 | 4,096 | 3,553 | 747 | |||||||||||||||
| Interest expense |
(35,187 | ) | (73,299 | ) | (17,594 | ) | (36,649 | ) | (11,086 | ) | ||||||||||
| Interest expense - related parties |
(42,126 | ) | (253,497 | ) | (18,475 | ) | (176,708 | ) | (38,340 | ) | ||||||||||
| Other income |
82,246 | 5,059 | 8,774 | 47,458 | 765 | |||||||||||||||
| Other income (expenses) |
1,168,739 | 134,722 | 1,108,510 | (162,346 | ) | 20,376 | ||||||||||||||
| Income before income taxes and non-controlling interest |
19,756,277 | 10,862,323 | 18,401,864 | 8,872,404 | 1,642,869 | |||||||||||||||
| Provision for income taxes |
5,106,765 | 2,650,010 | 4,414,087 | 1,844,184 | 400,800 | |||||||||||||||
| Net income before allocation to non-controlling interests |
14,649,512 | 8,212,313 | 13,987,777 | 7,028,220 | 1,242,069 | |||||||||||||||
| Less: Net income attributable to non-controlling interest |
(1,670,940 | ) | (1,235,371 | ) | (1,433,624 | ) | (895,041 | ) | (186,843 | ) | ||||||||||
| Net income attributable to ordinary shareholders |
¥ | 12,978,572 | ¥ | 6,976,942 | ¥ | 12,554,153 | ¥ | 6,133,179 | ¥ | 1,055,226 | ||||||||||
| Comprehensive income |
||||||||||||||||||||
| Net income before allocation to non-controlling interests |
14,649,512 | 8,212,313 | 13,987,777 | 7,028,220 | 1,242,069 | |||||||||||||||
| Foreign currency translation adjustment |
(55,536 | ) | (41,523 | ) | (3,763 | ) | 66,511 | (6,280 | ) | |||||||||||
| Comprehensive income |
14,593,976 | 8,170,790 | 13,984,014 | 7,094,731 | 1,235,789 | |||||||||||||||
| Comprehensive income attributable to non-controlling interests |
(1,670,940 | ) | (1,231,219 | ) | (1,433,624 | ) | (901,692 | ) | (186,215 | ) | ||||||||||
| Comprehensive income attributable to ordinary shareholders |
¥ | 12,923,036 | ¥ | 6,939,571 | ¥ | 12,550,390 | ¥ | 6,193,039 | $ | 1,049,574 | ||||||||||
| Earnings per ordinary share - basic |
||||||||||||||||||||
| Net income attributable to ordinary shareholders |
¥ | 3.55 | ¥ | 1.77 | ¥ | 3.18 | ¥ | 1.55 | $ | 0.27 | ||||||||||
| Earning per ordinary share - diluted |
||||||||||||||||||||
| Net income attributable to ordinary shareholders |
¥ | 3.51 | ¥ | 1.77 | ¥ | 3.10 | ¥ | 1.55 | $ | 0.27 | ||||||||||
| Weighted - average shares - basic |
3,656,277 | 3,951,811 | 3,951,811 | 3,951,811 | 3,951,811 | |||||||||||||||
| Weighted - average shares - diluted |
3,698,981 | 3,951,811 | 4,046,573 | 3,951,811 | 3,951,811 | |||||||||||||||
See notes to the consolidated financial statements
F-3
Table of Contents
RECON TECHNOLOGY, LTD.
CONSOLIDATED STATEMENTS OF CASH FLOWS
| For the Six Months ended December 31, |
||||||||||||
| 2009 | 2010 | 2010 | ||||||||||
| RMB | RMB | U.S. Dollars | ||||||||||
| (Unaudited) | (Unaudited) | (Unaudited) | ||||||||||
| Cash flows from operating activities: |
||||||||||||
| Net income before allocation to non-controlling interests |
¥ | 14,649,512 | ¥ | 8,212,313 | $ | 1,242,069 | ||||||
| Adjustments to reconcile net income before non-controlling interests to net cash used in operating activities: |
||||||||||||
| Depreciation |
170,864 | 203,278 | 30,745 | |||||||||
| Stock based payment |
736,688 | 870,084 | 131,596 | |||||||||
| Provision for doubtful debts |
— | 2,644,369 | 399,947 | |||||||||
| Movement of deferred taxation |
3,923,533 | (513,490 | ) | (77,663 | ) | |||||||
| Changes in operating assets and liabilities: |
||||||||||||
| Trade accounts receivable, net |
(29,594,234 | ) | (15,008,271 | ) | (2,269,922 | ) | ||||||
| Trade accounts receivable-related parties, net |
(11,590,498 | ) | — | — | ||||||||
| Other receivable, net |
(1,484,297 | ) | (8,471,365 | ) | (1,281,249 | ) | ||||||
| Other receivables related parties, net |
(500,000 | ) | — | — | ||||||||
| Purchase advance, net |
(783,333 | ) | 19,526,333 | 2,953,255 | ||||||||
| Prepaid expense |
(7,160,434 | ) | 626,600 | 94,770 | ||||||||
| Inventories |
(399,430 | ) | (17,682,353 | ) | (2,674,363 | ) | ||||||
| Trade accounts payable |
(2,241,257 | ) | 4,611,205 | 697,421 | ||||||||
| Trade accounts payable-related parties |
12,119,119 | — | — | |||||||||
| Other payables |
(103,868 | ) | 375,754 | 56,831 | ||||||||
| Other payables-related parties |
(326,557 | ) | — | — | ||||||||
| Deferred income |
— | (1,829,458 | ) | (276,696 | ) | |||||||
| Advances from customers |
2,678,536 | (319,111 | ) | (48,264 | ) | |||||||
| Accrued payroll and employees’ welfare |
(885,846 | ) | (273,371 | ) | (41,346 | ) | ||||||
| Accrued expenses |
— | (11,930 | ) | (1,804 | ) | |||||||
| Interest payable |
3,707,849 | — | — | |||||||||
| Taxes payable |
171,407 | 3,902,368 | 590,213 | |||||||||
| Net cash used in operating activities |
(16,912,247 | ) | (3,137,045 | ) | (474,462 | ) | ||||||
| Cash flows from investing activities: |
||||||||||||
| Purchases of property and equipment |
(133,554 | ) | (24,849 | ) | (3,758 | ) | ||||||
| Net cash used in investing activities |
(133,554 | ) | (24,849 | ) | (3,758 | ) | ||||||
| Cash flows from financing activities: |
||||||||||||
| Proceeds from stock issuance |
60,209,057 | — | — | |||||||||
| Proceeds from short-term bank loan |
— | 5,000,000 | 756,224 | |||||||||
| Proceeds from (Repayment to) short-term borrowings |
1,806,464 | (456,341 | ) | (69,019 | ) | |||||||
| Repayment to short-term borrowings-related party |
(2,633,759 | ) | (1,402,058 | ) | (212,054 | ) | ||||||
| Net cash provided by financing activities |
59,381,762 | 3,141,601 | 475,151 | |||||||||
| Effect of exchange rate fluctuation on cash and cash equivalents |
(76,116 | ) | (35,551 | ) | (5,377 | ) | ||||||
| Net increase (decrease) in cash and cash equivalent |
¥ | 42,259,845 | ¥ | (55,844 | ) | $ | (8,446 | ) | ||||
| Cash and cash equivalents at beginning of period |
2,727,735 | 12,142,957 | 1,836,558 | |||||||||
| Cash and cash equivalents at end of period |
¥ | 44,987,580 | ¥ | 12,087,113 | $ | 1,828,112 | ||||||
| Supplemental cash flow information |
||||||||||||
| Cash paid during the period for interest |
¥ | — | ¥ | 36,000 | $ | 5,445 | ||||||
| Cash paid during the period for taxes |
¥ | 248,176 | ¥ | 2,337,279 | $ | 353,501 | ||||||
See notes to the consolidated financial statements
F-4
Table of Contents
NOTES TO THE CONSOLIDATED FINANCIAL STATEMENTS (UNAUDITED)
NOTE 1. ORGANIZATION AND BASIS OF PRESENTATION
Organization - Recon Technology, Ltd (the “Company”) was incorporated under the laws of the Cayman Islands on August 21, 2007 by Mr. Yin Shenping, Mr. Chen Guangqiang and Mr. Li Hongqi (the “Principal Shareholders”) as a company with limited liability. The Company provides oilfield specialized equipment, automation systems, tools, chemicals and field services to petroleum companies in the People’s Republic of China (the “PRC”). Its wholly owned subsidiary, Recon Technology Co., Limited (“Recon-HK”) was incorporated on September 6, 2007 in Hong Kong. Other than the equity interest in Recon-HK, the Company does not own any assets or conduct any operations. On November 15, 2007, Recon-HK established one wholly owned subsidiary, Jining Recon Technology Ltd. (“Recon-JN”) under the laws of the PRC. Other than the equity interest in Recon-JN, Recon-HK does not own any assets or conduct any operations.
The Company conducts its business through the following PRC legal entities that are consolidated as variable interest entities (“VIEs”) and operate in the Chinese oilfield equipment & service industry:
Beijing BHD Petroleum Technology Co., Ltd. (“BHD”),
Nanjing Recon Technology Co., Ltd. (“Nanjing Recon”), and
Jining ENI Energy Technology Co., Ltd. (“ENI”)
Chinese laws and regulations currently do not prohibit or restrict foreign ownership in petroleum businesses. However, Chinese laws and regulations do prevent direct foreign investment in certain industries. On January 1, 2008, to protect the Company’s shareholders from possible future foreign ownership restrictions, the Principal Shareholders, who also hold the controlling interest of BHD, Nanjing Recon and ENI, reorganized the corporate and shareholding structure of these entities by entering into certain exclusive agreements with Recon-JN, which entitles Recon-JN to receive a majority of the residual returns. On May 29, 2009 Recon JN and BHD, Nanjing Recon, and ENI entered into an operating agreement to provide full guarantee for the performance of such contracts, agreements or transactions entered into by BHD, Nanjing Recon, and ENI. As a result of the new agreement, Recon-JN will absorb 100% of the expected losses and receive 90% of the expected gains of BHD, Nanjing Recon, and ENI, which results in Recon-JN being the primary beneficiary of these Companies.
Recon-JN also entered into Share Pledge Agreements with the Principal Shareholders, who pledged all their equity interest in these entities to Recon-JN. The Share Pledge Agreements, which were entered into by each Principal Shareholder, pledged each of the Principal Shareholders’ equity interest in BHD, Nanjing Recon and ENI as a guarantee for the service payment under the Service Agreement.
The Service Agreement, entered into on January 1, 2008, between Recon-JN and BHD, Nanjing Recon, and ENI, states that Recon-JN will provide technical consulting services to BHD, Nanjing Recon, and ENI in exchange for 90% of their annual net profits as a service fee, which is to be paid quarterly.
F-5
Table of Contents
RECON TECHNOLOGY, LTD
NOTES TO THE CONSOLIDATED FINANCIAL STATEMENTS (UNAUDITED)
In addition, Recon-HK entered into Option Agreements to acquire the Principal Shareholders’ equity interest in these entities if or when permitted by the PRC laws.
Based on these exclusive agreements, the Company consolidates BHD, Nanjing Recon and ENI as VIEs as required by ASC Topic 810, Consolidation because the Company is the primary beneficiary of the VIEs.
On August 28, 2000 a Principal Shareholder of the Company purchased a controlling interest in BHD which was organized under the laws of the PRC on June 29, 1999. As of June 30, 2010 and December 31, 2010, the Principal Shareholders held 67.5% ownership in BHD. BHD is combined with the Company through the date of the exclusive agreements, and is consolidated following January 1, 2008, the date of the agreements based on ASC Topic 810. The Company allocates profits and losses 90% and 100%, respectively based upon the control agreements. Profits allocated to the minority interest is the remaining amount (10%).
On January 21, 2003, ENI was organized under the laws of the PRC. Principal Shareholders of the Company own a controlling interest of ENI. As of June 30, 2010 and December 31, 2010, the Principal Shareholders held 80% ownership interest in ENI. ENI is combined with the Company through the date of the exclusive agreements, and is consolidated following January 1, 2008, the date of the agreements based on ASC Topic 810. The Company allocates profits and losses 90% and 100%, respectively based upon the control agreements. Profits allocated to the minority interest is the remaining amount (10%).
On July 4, 2003, Nanjing Recon was organized under the laws of the PRC. On August 27, 2007 the Principal Shareholders of the Company purchased a majority ownership of Nanjing Recon from a related party who was a majority owner of Nanjing Recon. As of June 30, 2010 and December 31, 2010, the Principal Shareholders held 80% ownership interest in Nanjing Recon. Nanjing Recon is combined with the Company through the date of the exclusive agreements, and is consolidated following January 1, 2008, the date of the agreements based on ASC Topic 810. The Company allocates profits and losses 90% and 100%, respectively based upon the control agreements. Profits allocated to the minority interest is the remaining amount (10%).
Nature of Operations - The Company engaged in (1) providing equipment, tools and other hardware related to oilfield production and management. Simple installations may happen in connection with some projects; (2) developing and selling its own specialized industrial automation control and information solutions. The products and services provided by the Company include:
High-Efficiency Heating Furnaces - High-Efficiency Heating Furnaces are designed to remove the impurities and to prevent solidification blockage in transport pipes carrying crude petroleum. Crude petroleum contains certain impurities which, include water and natural gas, that must be removed before the petroleum can be sold.
F-6
Table of Contents
RECON TECHNOLOGY, LTD
NOTES TO THE CONSOLIDATED FINANCIAL STATEMENTS (UNAUDITED)
Multi-Purpose Fissure Shaper - Multipurpose fissure shapers improve the extractors’ ability to test for and extract petroleum which must be perforated into the earth before any petroleum extractor can test for the presence of oil.
Oil Field Water Finding/Blocking Technology - The Company developed this technology designed to find and block water content in petroleum.
Supervisory Control and Data Acquisition System (“SCADA”) - SCADA is an industrial computerized process control system for monitoring, managing and controlling petroleum extraction. SCADA integrates underground and above-ground activities of the petroleum extraction industry. This system can help to manage the oil extraction process in real-time to reduce the costs associated with extraction.
F-7
Table of Contents
RECON TECHNOLOGY, LTD
NOTES TO THE CONSOLIDATED FINANCIAL STATEMENTS (UNAUDITED)
NOTE 2. SIGNIFICANT ACCOUNTING POLICIES
Basis of Presentation - The accompanying consolidated financial statements were prepared in accordance with accounting principles generally accepted in the United States of America (“U.S. GAAP”). They are consolidated following January 1, 2008, the date of the agreements. The accompanying consolidated financial statements include the financial statements of the Company, its subsidiaries, and VIEs for which the Company is the primary beneficiary. All inter-company transactions and balances between the Company, its subsidiaries and VIEs are eliminated upon consolidation. In the opinion of management, the accompanying unaudited consolidated financial statements reflect all adjustments, consisting only of normal recurring entries, which are necessary for a fair presentation of the results for the interim periods presented. These financial statements should be read in conjunction with the audited financial statements and notes thereto included in the Company’s Form 10-K for the fiscal year ended June 30, 2010. The results of operations for the interim periods presented are not indicative of the operating results to be expected for the Company’s fiscal year ending June 30, 2011.
Reclassifications - Certain amounts have been reclassified to conform to the current presentation.
Principles of Consolidation - The consolidated financial statements include the financial statements of the Company, all the subsidiaries and VIEs of the Company. All transactions and balances between the Company and its subsidiaries and VIEs have been eliminated upon consolidation.
Variable Interest Entities - A Variable Interest Entity (VIE) is an entity that either (i) has insufficient equity to permit the entity to finance its activities without additional subordinated financial support or (ii) has equity investors who lack the characteristics of a controlling financial interest. A VIE is consolidated by its primary beneficiary. The primary beneficiary has both the power to direct the activities that most significantly impact the entity’s economic performance and the obligation to absorb losses or the right to receive benefits from the entity that could potentially be significant to the VIE.
If the Company determines that it has operating power and the obligation to absorb losses or receive benefits, the Company consolidates the VIE as the primary beneficiary, and if not, does not consolidate. The Company’s involvement constitutes power that is most significant to the entity when it has unconstrained decision making ability over key operational functions within the entity.
Assets recognized as a result of consolidating VIEs do not represent additional assets that could be used to satisfy claims against the Company’s general assets. Conversely, liabilities recognized as a result of consolidating these VIEs do not represent additional claims on the Company’s general assets; rather, they represent claims against the specific assets of the consolidated VIEs.
F-8
Table of Contents
RECON TECHNOLOGY, LTD
NOTES TO THE CONSOLIDATED FINANCIAL STATEMENTS (UNAUDITED)
Currency Translation - The Company’s functional currency is the Chinese Yuan ( “RMB”) and the accompanying consolidated financial statements have been expressed in Chinese Yuan. The consolidated financial statements as of and for the six months ended December 31, 2010 have been translated into United States dollars (“U.S. dollars”) solely for the convenience of the readers and are unaudited. The translation has been made at the rate of ¥6.6118 = US$1.00, the approximate exchange rate prevailing on December 31, 2010. These translated U.S. dollar amounts should not be construed as representing Chinese Yuan amounts or that the Chinese Yuan amounts have been or could be converted into U.S. dollars.
Accounting Estimates - The preparation of the consolidated financial statements in conformity with accounting principles generally accepted in the United States of America requires that management make estimates and assumptions that affect the reported amounts of assets and liabilities and disclosure of contingent assets and liabilities at the dates of the financial statements and the reported amounts of revenues and expenses during the reporting periods. Estimates are adjusted to reflect actual experience when necessary. Significant accounting estimates reflected in the Company’s consolidated financial statements include revenue recognition, allowance for doubtful accounts, and useful lives of property and equipment. Since the use of estimates is an integral component of the financial reporting process, actual results could differ from those estimates.
Fair Values of Financial Instruments - The carrying amounts reported in the consolidated balance sheets for trade accounts receivable, other receivables, advances to suppliers, trade accounts payable, accrued liabilities, advances from customers, short term bank loan and short term borrowings approximate fair value because of the immediate or short-term maturity of these financial instruments.
Cash and Cash Equivalents - Cash and cash equivalents are comprised of cash on hand, demand deposits and highly liquid short-term debt investments with stated maturities of no more than three months.
Trade Accounts and Other Receivables - Accounts receivable are recorded when revenue is recognized and are carried at original invoiced amount less a provision for any potential uncollectible amounts. Provision is made against trade accounts and other receivables to the extent they are considered to be doubtful. Other receivables are from transactions with non-trade customers.
Purchase Advances - Purchase advances are the amounts prepaid to suppliers for purchases of inventory and are recognized when the final amount is paid to the suppliers and the inventory is delivered.
Inventories - Inventories are stated at the lower of cost or market value, on a weighted average basis. The method of determining inventory costs is used consistently from year to year. Allowance for inventory obsolescence is provided when the market value of certain inventory items are lower than the cost.
F-9
Table of Contents
RECON TECHNOLOGY, LTD
NOTES TO THE CONSOLIDATED FINANCIAL STATEMENTS (UNAUDITED)
Property and equipment - Property and equipment are stated at cost. Depreciation on motor vehicles and office equipment is computed using the straight-line method over the estimated useful lives of the assets, which range from two to ten years. Leasehold improvements are amortized over the shorter of the lease term or the estimated useful life of the assets
| Items |
Useful life | |
| Motor vehicles |
10 Years | |
| Office equipment |
2-5 Years | |
| Leasehold improvement |
5 years |
Long-lived Assets - The Company applies the Accounting Standards Codification (“ASC”) No. 360-10 “Property, plant and equipment”, ASC NO. 360 requires that long-lived assets, such as property and equipment and intangible assets subject to amortization, are reviewed for impairment whenever events or changes in circumstances indicate that the carrying amount of an asset or asset group may not be recoverable. Recoverability of assets to be held and used is measured by a comparison of the carrying amount of an asset to estimated undiscounted future cash flows expected to be generated by the asset. If the carrying amount of an asset exceeds its estimated future cash flows, an impairment charge is recognized for the amount by which the carrying amount of the asset exceeds the fair value of the asset. Fair value is determined based on the estimated discounted future cash flows expected to be generated by the asset.
Advances from Customers - The Company, as is common practice in the PRC, will often receive advance payments from its customers for its products or service. The advances are showed as current liabilities and are recognized as revenue when the products are delivered or service is provided.
Stock Split - On June 8, 2009, in connection with the Company’s contemplated initial public offering (“IPO”) of ordinary shares, the Board of Directors approved a 42.7840667-to-1 split of ordinary shares and redeemable ordinary shares to shareholders of record as of such date. All references to the number of ordinary shares and per share amounts have been restated as appropriate to reflect the effect of the split for all periods presented.
Revenue Recognition - The Company recognizes revenue when the following four criteria are met: (1) persuasive evidence of an arrangement, (2) delivery has occurred or services have been provided, (3) the sales price is fixed or determinable, and (4) collectability is reasonably assured. Delivery does not occur until products have been shipped or services have been provided to the client and the client has signed a completion and acceptance report, risk of loss has transferred to the client, client acceptance provisions have lapsed, or the Company has objective evidence that the criteria specified in client acceptance provisions have been satisfied. The sales price is not considered to be fixed or determinable until all contingencies related to the sale have been resolved.
F-10
Table of Contents
RECON TECHNOLOGY, LTD
NOTES TO THE CONSOLIDATED FINANCIAL STATEMENTS (UNAUDITED)
Hardware:
Revenue from hardware sales is generally recognized when the product is shipped to the customer and when there are no unfulfilled company obligations that affect the customer’s final acceptance of the arrangement.
Software:
The Company sells self-developed software. For software sales, the Company recognizes revenues in accordance with ASC No. 985 - 605 “Software Revenue Recognition”. Revenue from software is recognized according to project contracts. Contract costs are accumulated during the periods of installation and testing or commissioning. Usually this is short term. Revenue are not recognized until completion of the contracts and receipt of acceptance statements.
Services:
The Company provides services to improve software functions and system requirements on separated fixed-price contracts. Revenue is recognized on the completed contract method when acceptance is determined by a completion report signed by the customer.
Deferred income represents unearned amounts billed to customers related to sales contracts.
Cost of Revenues - When the criteria for revenue recognition have been met, costs incurred are recognized as cost of revenue. Cost of revenues include wages, materials, handling charges, the cost of purchased equipment and pipes and other expenses associated with manufactured products and service provided to customers.
Subsidy Income - The company received grants of ¥1,131,709 and ¥0 ($0) from the local government for the three months ended December 31, 2009 and 2010, respectively. The Company received grants of ¥1,158,034 and ¥451,520 ($68,290) from the local government for the six months ended December 31, 2009 and 2010, respectively. 1) Grants given by the government were to support local software companies’ operation and research and development. Grants related to research and development projects are recognized as subsidy income in the consolidated statements of operations when received. 2) Grants in form of value-added-tax refund for software products are recognized when received.
Advertising expenses - Advertising expenses, which generally represent the cost of promotions to create or stimulate a positive image of the Company or a desire to buy the Company’s products and services, are expensed as incurred. The Company incurred no advertising expenses in each of the periods presented.
Share-Based Compensation - The Company accounts for share-based compensation in accordance with ASC Topic.718, Share-Based Payment. Under the fair value recognition provisions of this statement, share-based compensation cost is measured at the grant date based on the fair value of the award and is recognized as expense with graded vesting on a straight – line basis over the requisite service period for the entire award. .The Company has elected to recognize compensation expenses using the Binomial Lattice valuation model estimated at the grant date based on the award’s fair value
F-11
Table of Contents
RECON TECHNOLOGY, LTD
NOTES TO THE CONSOLIDATED FINANCIAL STATEMENTS (UNAUDITED)
Income Taxes - Income taxes are provided based upon the liability method of accounting pursuant to ASC Topic 740, Accounting for Income Taxes, . Provisions for income taxes are based on taxes payable or refundable for the current year and deferred taxes. Deferred taxes are provided on differences between the tax bases of assets and liabilities and their reported amounts in the financial statements, and tax carry forwards. Deferred tax assets and liabilities are included in the financial statements at currently enacted income tax rates applicable to the period in which the deferred tax assets and liabilities are expected to be realized or settled. As changes in tax laws or rates are enacted, deferred tax assets and liabilities are adjusted through the provision for income taxes. The Company has not been subject to any income taxes in the United States or the Cayman Islands.
Business Segments - The Company operates in one industry which includes the sale of products for the oil field construction solely to customers in China; therefore, no business segment information has been presented.
Earnings per Share (“EPS”) - Basic EPS is computed by dividing net income available for ordinary shareholders by the weighted average number of ordinary shares outstanding. Diluted EPS are computed by dividing net income available for ordinary shareholders by the weighted-average number of ordinary shares and dilutive potential ordinary share equivalents outstanding.
Recently Enacted Accounting Standards
The FASB issued ASU 2010-13, Compensation—Stock Compensation (ACS Topic 718): Effect of Denominating the Exercise Price of a Share-Based Payment Award in the Currency of the Market in Which the Underlying Equity Security Trades. The ASU codifies the consensus reached in Emerging Issues Task Force (EITF) Issue No. 09-J. The amendments to the Codification clarify that an employee share-based payment award with an exercise price denominated in the currency of a market in which a substantial portion of the entity’s equity shares trades should not be considered to contain a condition that is not a market, performance, or service condition. Therefore, an entity would not classify such an award as a liability if it otherwise qualifies as equity.
The amendments in the ASU are effective for fiscal years, and interim periods within those fiscal years, beginning on or after December 15, 2010. Earlier adoption is permitted. The amendments are to be applied by recording a cumulative-effect adjustment to beginning retained earnings. We are currently evaluating the impact of adopting this update on our consolidated financial statements.
In February 2010, FASB issued ASU No. 2010-09 “Subsequent Events” (“ASC Topic 855”) which removes the requirement for an SEC filer to disclose a date in both issued and revised financial statements. This amendment shall be applied prospectively for interim or annual financial periods ending after June 15, 2010. The Company does not believe the adoption will have a material effect on the Company’s consolidated financial statements.
F-12
Table of Contents
RECON TECHNOLOGY, LTD
NOTES TO THE CONSOLIDATED FINANCIAL STATEMENTS (UNAUDITED)
The FASB has issued ASU 2010-06, Fair Value Measurements and Disclosures (ACS Topic 820): Improving Disclosures about Fair Value Measurements. This ASU requires some new disclosures and clarifies some existing disclosure requirements about fair value measurement as set forth in Codification Subtopic 820-10. The FA SB’s objective is to improve these disclosures and, thus, increase the transparency in financial reporting. Specifically, ASU 2010-06 amends Codification Subtopic 820-10 to now require:
| • | A reporting entity to disclose separately the amounts of significant transfers in and out of Level 1 and Level 2 fair value measurements and describe the reasons for the transfers; and |
| • | In the reconciliation for fair value measurements using significant unobservable inputs, a reporting entity should present separately information about purchases, sales, issuances, and settlements. |
In addition, ASU 2010-06 clarifies the requirements of the following existing disclosures:
| • | For purposes of reporting fair value measurement for each class of assets and liabilities, a reporting entity needs to use judgment in determining the appropriate classes of assets and liabilities; and |
| • | A reporting entity should provide disclosures about the valuation techniques and inputs used to measure fair value for both recurring and nonrecurring fair value measurements. |
ASU 2010-06 is effective for interim and annual reporting periods beginning after December 15, 2009, except for the disclosures about purchases, sales, issuances, and settlements in the roll forward of activity in Level 3 fair value measurements. Those disclosures are effective for fiscal years beginning after December 15, 2010, and for interim periods within those fiscal years. Early adoption is permitted. This guidance was effective for our third quarter ended March 31, 2010.
The FASB has issued Accounting Standard Update (ASU) 2009-17, Consolidations (Topic 810) - Improvements to Financial Reporting by Enterprises Involved with Variable Interest Entities. ASU 2009-17 changes how a reporting entity determines when an entity that is insufficiently capitalized or is not controlled through voting (or similar rights) should be consolidated. This determination is based on, among other things, the other entity’s purpose and design and the Company’s ability to direct the activities of the other entity that most significantly impact the other entity’s economic performance. ASU 2009-17 also required additional disclosures concerning an enterprise’s continuing involvement with variable interest entities. ASU 2009-17 is effective at the start of the Company’s first fiscal year beginning after November 15, 2009. The adoption had no effect on the Company’s financial position, results of operations, or cash flows but resulted in additional disclosures related to variable interest entities (Note 18).
F-13
Table of Contents
RECON TECHNOLOGY, LTD
NOTES TO THE CONSOLIDATED FINANCIAL STATEMENTS (UNAUDITED)
NOTE 3. TRADE ACCOUNTS RECEIVABLE, NET
Accounts receivable consisted of the following at June 30, 2010 and December 31, 2010:
| June 30, 2010 |
December 31, 2010 |
December 31, 2010 |
||||||||||
| RMB | RMB | U.S. Dollars | ||||||||||
| (Unaudited) | (Unaudited) | |||||||||||
| Trade accounts receivable |
¥ | 90,515,321 | ¥ | 106,000,040 | $ | 16,031,949 | ||||||
| Allowance for doubtful accounts |
(1,089,331 | ) | (1,565,779 | ) | (236,816 | ) | ||||||
| Trade accounts receivable, net |
¥ | 89,425,990 | ¥ | 104,434,261 | $ | 15,795,133 | ||||||
NOTE 4. OTHER RECEIVABLES, NET
Other receivables consisted of the following at June 30, 2010 and December 31, 2010:
| June 30, 2010 |
December 31, 2010 |
December 31, 2010 |
||||||||||
| RMB | RMB | U.S. Dollars | ||||||||||
| (Unaudited) | (Unaudited) | |||||||||||
| Deposit for purchasing inventory |
¥ | 7,930,268 | ¥ | 16,121,348 | $ | 2,438,269 | ||||||
| loans to third party |
3,723,982 | 3,948,519 | 597,193 | |||||||||
| Advance to staff |
1,186,807 | 663,963 | 100,421 | |||||||||
| Deposit for project |
80,000 | 89,600 | 13,552 | |||||||||
| Others |
83,547 | 184,060 | 27,837 | |||||||||
| Allowance for doubtful accounts |
(154,057 | ) | (2,321,978 | ) | (351,187 | ) | ||||||
| Other receivable |
¥ | 12,850,547 | ¥ | 18,685,512 | $ | 2,826,085 | ||||||
Deposit for purchasing inventory was ¥7,930,268 and ¥16,121,348($2,438,269) as of June 30 and December 31, 2010, respectively. It represents that Company paid to certain agents designated by the ending customers to purchase special inventory.
Loans to third party are mainly used for short-term fund to support cooperative companies. These loans are due on demand without interest bearing.
Advances to staff are for business travel and sundry expenses related to oil field or on-site installation and inspection of products until the test running is normal.
F-14
Table of Contents
RECON TECHNOLOGY, LTD
NOTES TO THE CONSOLIDATED STATEMENTS (UNAUDITED)
NOTE 5. PURCHASE ADVANCES
Purchase advances consisted of the following at June 30, 2010 and December 31, 2010:
| June 30, 2010 |
December 31, 2010 |
December 31, 2010 |
||||||||||
| RMB | RMB | U.S. Dollars | ||||||||||
| (Unaudited) | (Unaudited) | |||||||||||
| Prepayment for purchasing inventory |
¥ | 46,293,094 | ¥ | 26,853,162 | $ | 4,061,400 | ||||||
| Service fee |
258,308 | 171,907 | 26,000 | |||||||||
| Purchase advances |
¥ | 46,551,402 | ¥ | 27,025,069 | $ | 4,087,400 | ||||||
NOTE 6. INVENTORIES
Inventories consisted of the following at June 30, 2010 and December 31, 2010:
| June 30, 2010 |
December 31, 2010 |
December 31, 2010 |
||||||||||
| RMB | RMB | U.S. Dollars | ||||||||||
| (Unaudited) | (Unaudited) | |||||||||||
| Low-value consumption goods |
¥ | 310,381 | ¥ | 262,828 | $ | 39,751 | ||||||
| Purchased goods and raw materials |
5,721,871 | 267,608 | 40,474 | |||||||||
| Work in process |
— | 768,852 | 116,285 | |||||||||
| Finished goods |
7,118,659 | 29,533,976 | 4,466,859 | |||||||||
| Total inventories |
¥ | 13,150,911 | ¥ | 30,833,264 | $ | 4,663,369 | ||||||
NOTE 7. OTHER PAYABLE
Other payable consisted of the following at June 30, 2010 and December 31, 2010:
| June 30, 2010 |
December 31, 2010 |
December 31, 2010 |
||||||||||
| RMB | RMB | U.S. Dollars | ||||||||||
| (Unaudited) | (Unaudited) | |||||||||||
| Loans from third-party companies |
¥ | 2,183,965 | ¥ | — | $ | — | ||||||
| Loans from third-party individuals |
223,448 | — | — | |||||||||
| Rental |
441,921 | — | — | |||||||||
| Freight |
— | 2,531,106 | 382,816 | |||||||||
| Expenses paid by third-parties on behalf of Recon |
194,361 | 790,820 | 119,607 | |||||||||
| Service |
— | 150,000 | 22,687 | |||||||||
| Others |
52,614 | 137 | 21 | |||||||||
| Total other payable |
¥ | 3,096,309 | ¥ | 3,472,063 | $ | 525,131 | ||||||
F-15
Table of Contents
RECON TECHNOLOGY, LTD
NOTES TO THE CONSOLIDATED STATEMENTS (UNAUDITED)
Loans from third-party companies were mainly borrowed for supplemental working capital by BHD with amount of ¥1,100,000 and Nanjing Recon of ¥1,083,965 as of June 30, 2010. These loans are due on demand without interest bearing. As of December 31, 2010, the outstanding loan with balance of ¥1,083,384 ($163,856) was reclassified to short-term borrowings.
NOTE 8. PROPERTY AND EQUIPMENT, NET
Property and equipment consisted of the following at June 30 and December 31, 2010:
| June 30, 2010 |
December 31, 2010 |
December 31, 2010 |
||||||||||
| RMB | RMB | U.S. Dollars | ||||||||||
| (Unaudited) | (Unaudited) | |||||||||||
| Motor vehicles |
¥ | 1,796,955 | ¥ | 1,796,955 | $ | 271,780 | ||||||
| Office equipment and fixtures |
450,715 | 475,564 | 71,927 | |||||||||
| Leasehold improvement |
426,181 | 426,181 | 64,458 | |||||||||
| Total property and equipment |
2,673,851 | 2,698,700 | 408,165 | |||||||||
| Less: Accumulated depreciation |
(1,190,970 | ) | (1,394,248 | ) | (210,873 | ) | ||||||
| Property and equipment, net |
¥ | 1,482,881 | ¥ | 1,304,452 | $ | 197,292 | ||||||
Depreciation expense was ¥83,074 and ¥104,681 ($15,832) for the three months ended December 31, 2009 and 2010, respectively. Depreciation expense was ¥170,864 and ¥203,278 ($30,745) for the six months ended December 31, 2009 and 2010, respectively.
NOTE 9. SHAREHOLDERS’ EQUITY
Ordinary Shares - When the Company was incorporated in the Cayman Islands on August 21, 2007, 25,000,000 ordinary shares were authorized, and 2,139,203 ordinary shares were issued to the Principal Shareholders, at a par value of $0.0185 each. On July 29, 2009, the Company completed its IPO by offering 1,700,000 ordinary shares at $6.00 per share. After this IPO, all the 112,608 redeemable ordinary shares outstanding were automatically converted into non-redeemable ordinary shares pursuant to the Agreement. On July 31, 2009 ordinary shares of the Company commenced trading on NASDAQ Exchange. The Company has 3,951,811 ordinary shares issued and outstanding on July 31, 2009 and December 31, 2010.
Appropriated Retained Earnings - According to the Articles of Incorporation, the Company is required to transfer a certain portion of its net profit, as determined under PRC accounting regulations, from current net income to the statutory reserve fund. In accordance with the PRC Company Law, the Companies are required to transfer 10% of their profit after tax, as determined in accordance with PRC accounting standards and regulations, to the statutory reserves until such reserves reach 50% of the registered capital or paid-in capital of the Companies. As of June 30, 2010 and December 31, 2010 the balance of total statutory reserves was ¥3,755,503 and ¥4,557,675 ($689,324).
F-16
Table of Contents
RECON TECHNOLOGY, LTD
NOTES TO THE CONSOLIDATED STATEMENTS (UNAUDITED)
Share-based Awards Plan - In June 2009, the Board of Directors and the shareholders of the Company adopted the 2009 Stock Incentive Plan (the “2009 Plan”). The 2009 Plan provides for the granting of share options and restricted ordinary shares to employees, non-employee directors and consultants of the Company. Options granted under the 2009 Plan may be Incentive Stock Options or Non-statutory Stock Options. Non-employee directors and Consultants are not eligible to receive the award of an Incentive Stock Option. The Compensation Committee of the Board of Director is entitled to establish the term, vesting conditions and exercise price of the options as well as the vesting conditions and transferability of restricted shares. Under the 2009 Plan, 790,362 unissued ordinary shares have been reserved for issuance. As discussed in Note 16, under the 2009 Plan, the Company granted options to purchase 293,000 of ordinary shares to its employees and non-employee directors on July 29, 2009 and 170,000 warrants to placement agent.
NOTE 10. INCOME TAXES
The Company is not subject to any income taxes in the United States or the Cayman Islands and had minimal operations in jurisdictions other than the PRC. ENI, BHD and Nanjing Recon are subject to PRC’s income taxes as PRC domestic companies. Before the implementation of the new Enterprise Income Tax Law (“EIT Law”), PRC domestic companies are generally subject to an enterprise income tax (“EIT”) rate of 33%. On March 16, 2007, the National People’s Congress of China passed the new EIT Law, and on December 6, 2007, the State Council of China passed the Implementing Rules for the EIT Law (“Implementing Rules”) which took effect on January 1, 2008. The new amended EIT Law introduces a wide range of changes which include, but are not limited to the unification of the income tax rate for domestic-invested and foreign-invested enterprises at 25%. As a result, income tax rate for ENI was reduced from 33% to 25% in calendar year 2008 and after.
As approved by the domestic tax authority in the PRC, Nanjing Recon was entitled to a tax holiday with 50% tax exemption for calendar year 2006 and 2007. Nanjing Recon is also a government-certified high technology company and is subject to an income tax rate of 15%. As a result, Nanjing Recon was subject to an income tax rate of 7.5% for calendar year 2007 and 15% for calendar year 2008. Since calendar year 2009, Guidelines for the Administration of the Recognition of Hi-tech Enterprises was updated and all companies were required to have their post registration reviewed. Thus for the calendar year 2009, Nanjing Recon is subject to an income tax rate of 25%. For calendar year 2010, the company reapplied for hi-tech approval and has passed all relevant review. Thus, for the calendar year 2010, Nanjing Recon is subject to an income tax rate of 15%.
As approved by the domestic tax authority in the PRC, BHD was recognized as a government-certified high technology company on November. 25, 2009 and is subject to an income tax rate of 15% for calendar year 2010. This qualification certificate will stay effective till the certificate matures in 2012.
F-17
Table of Contents
RECON TECHNOLOGY, LTD
NOTES TO THE CONSOLIDATED STATEMENTS (UNAUDITED)
Deferred taxes are comprised of the following:
| June 30, 2010 |
December 31, 2010 |
December 31, 2010 |
||||||||||
| RMB | RMB | U.S. Dollars | ||||||||||
| (Unaudited) | (Unaudited) | |||||||||||
| Allowance for doubtful receivables |
¥ | 275,960 | ¥ | 789,450 | $ | 119,400 | ||||||
| Total deferred income tax assets |
¥ | 275,960 | ¥ | 789,450 | $ | 119,400 | ||||||
Following is a reconciliation of income taxes at the calculated statutory rates:
| For the three months Ended December 31, 2009 |
For the three months Ended December 31, 2010 |
For the three months Ended December 31, 2010 |
||||||||||
| RMB | RMB | U.S. Dollars | ||||||||||
| (Unaudited) | (Unaudited) | (Unaudited) | ||||||||||
| Income tax calculated at statutory rates |
¥ | 4,994,175 | ¥ | 2,899,190 | $ | 438,487 | ||||||
| Benefit of favorable rate for high-technology companies |
(580,088 | ) | (1,984 | ) | (300 | ) | ||||||
| Benefit of revenue exempted from enterprise income tax |
— | (1,053,022 | ) | (159,264 | ) | |||||||
| Provision for income taxes |
¥ | 4,414,087 | ¥ | 1,844,184 | $ | 278,923 | ||||||
| For the six months Ended December 31, 2009 |
For the six months Ended December 31, 2010 |
For the six months Ended December 31, 2010 |
||||||||||
| RMB | RMB | U.S. Dollars | ||||||||||
| (Unaudited) | (Unaudited) | (Unaudited) | ||||||||||
| Income tax calculated at statutory rates |
¥ | 5,760,634 | ¥ | 3,951,472 | $ | 597,639 | ||||||
| Benefit of favorable rate for high-technology companies |
(653,869 | ) | (1,233,734 | ) | (186,595 | ) | ||||||
| Benefit of revenue exempted from enterprise income tax |
— | (67,728 | ) | (10,244 | ) | |||||||
| Provision for income taxes |
¥ | 5,106,765 | ¥ | 2,650,010 | $ | 400,800 | ||||||
F-18
Table of Contents
RECON TECHNOLOGY, LTD
NOTES TO THE CONSOLIDATED STATEMENTS (UNAUDITED)
The provision for income taxes is comprised of the following:
| For the three months Ended December 31, 2009 |
For the three months Ended December 31, 2010 |
For the three months Ended December 31, 2010 |
||||||||||
| RMB | RMB | U.S. Dollars | ||||||||||
| (Unaudited) | (Unaudited) | (Unaudited) | ||||||||||
| Current income taxes |
¥ | (253,988 | ) | ¥ | 1,844,184 | $ | 278,923 | |||||
| Deferred income taxes |
4,668,075 | — | — | |||||||||
| Provision for income taxes |
¥ | 4,414,087 | ¥ | 1,844,184 | $ | 278,923 | ||||||
| For the six months Ended December 31, 2009 |
For the six months Ended December 31, 2010 |
For the six months Ended December 31, 2010 |
||||||||||
| RMB | RMB | U.S. Dollars | ||||||||||
| (Unaudited) | (Unaudited) | (Unaudited) | ||||||||||
| Current income taxes |
¥ | 1,186,407 | ¥ | 2,650,010 | $ | 400,800 | ||||||
| Deferred income taxes |
3,920,358 | — | — | |||||||||
| Provision for income taxes |
¥ | 5,106,765 | ¥ | 2,650,010 | $ | 400,800 | ||||||
NOTE 11. SHORT-TERM BANK LOAN
Short-term bank loan consist of the following:
| June 30, 2010 |
December 31, 2010 |
December 31, 2010 |
||||||||||
| RMB | RMB | U.S. Dollars | ||||||||||
| (Unaudited) | (Unaudited) | |||||||||||
| Beijing Bank, interest rate at 5.56% annually, mature on December 21, 2011 |
¥ | — | ¥ | 5,000,000 | $ | 756,224 | ||||||
| Short-term bank loan |
¥ | — | ¥ | 5,000,000 | $ | 756,224 | ||||||
F-19
Table of Contents
RECON TECHNOLOGY, LTD
NOTES TO THE CONSOLIDATED STATEMENTS (UNAUDITED)
NOTE 12. SHORT-TERM BORROWINGS
Short-term borrowings consist of the following:
| June 30, 2010 |
December 31, 2010 |
December 31, 2010 |
||||||||||
| Short-term borrowings due to non-related parties: |
RMB | RMB | U.S. Dollars | |||||||||
| (Unaudited) | (Unaudited) | |||||||||||
| Due-on-demand borrowing, no interest |
¥ | 1,224,888 | ¥ | 1,108,272 | $ | 167,620 | ||||||
| Short-term borrowings, no interest, matures on Aug. 25, 2011 |
140,000 | 140,000 | 21,174 | |||||||||
| Short-term borrowings, interest at 6%, matures on Dec. 11, 2011 |
1,172,911 | 1,243,286 | 188,041 | |||||||||
| Short-term borrowings, no interest, matures on Dec. 27, 2011 |
411,500 | — | — | |||||||||
| Short-term borrowings, no interest, matures on May 24, 2011 |
1,575,582 | 1,576,982 | 238,511 | |||||||||
| Short-term borrowings, interest at 1.2% per month, matures on Nov. 19, 2011 |
500,000 | 500,000 | 75,622 | |||||||||
| Total short-term borrowings due to non-related parties |
¥ | 5,024,881 | ¥ | 4,568,540 | $ | 690,968 | ||||||
The interest expenses for short-term borrowings due to non-related parties are ¥17,594 and ¥36,649 ($5,543) for the three month ended December 31, 2009 and 2010, respectively, and are ¥35,187 and ¥73,299 ($11,086) for the six month ended December 31, 2009 and 2010, respectively.
| June 30, 2010 |
December 31, 2010 |
December 31, 2010 |
||||||||||
| Short-term borrowings due to related parties: |
RMB | RMB | U.S. Dollars | |||||||||
| (Unaudited) | (Unaudited) | |||||||||||
| Due-on-demand borrowings to Principal Shareholders, no interest |
¥ | 376,377 | ¥ | 376,377 | $ | 56,925 | ||||||
| Short-term borrowings to a Principal Shareholder’s family member, interest at 6%, matures on Dec. 9, 2011 |
249,100 | 314,046 | 47,498 | |||||||||
| Short-term borrowings to a Principal Shareholder’s family member, no interest at 6%, matures on Dec. 31, 2011 |
6,200,000 | 4,700,000 | 710,850 | |||||||||
| Short-term borrowings to management, interest at 6%, matures on March 10, 2011 |
517,980 | 550,976 | 83,332 | |||||||||
| Total short-term borrowings due to related parties |
¥ | 7,343,457 | ¥ | 5,941,399 | $ | 898,605 | ||||||
The interest expenses for short-term borrowings due to related parties are ¥18,475 and ¥176,708 ($26,726) for the three month ended December 31, 2009 and 2010, respectively, and are ¥42,126 and ¥253,497 ($38,340) for the six month ended December 31, 2009 and 2010, respectively.
F-20
Table of Contents
RECON TECHNOLOGY, LTD
NOTES TO THE CONSOLIDATED STATEMENTS (UNAUDITED)
NOTE 13. CONCENTRATIONS
For the three months ended December 31, 2009, the largest two customers, CNPC and SINOPEC, represented about 61.93% and 10.05% of the Company’s revenue. For the three month ended December 31, 2010, the Company’s two largest customers accounted for approximately 65.60% and 15.27% of its revenue.
For the six months ended December 31, 2009, the largest two customers represented about 58.27% and 21.77% of the Company’s revenue. For the six month ended December 31, 2010, the Company’s two largest customers accounted for approximately 53.17% and 22.56% of its revenue. The Company provided service directly to these two largest customers, but it did not sign contracts directly with them. It must enter into contracts with the agents.
For the three and six months ended December 31, 2009 and 2010, no supplier accounted 10% of its total purchases.
NOTE 14. COMMITMENTS AND CONTINGENCIES
The Company leases offices for three subsidiaries in Beijing, Nanjing and Shandong. All the lease agreements expired on December 31, 2011 with a monthly payment of ¥ 87,101 ($158,083).
Contingencies through February 14, 2010 have been considered by the Company and none were noted which were required to be disclosed.
NOTE 15. RELATED PARTY TRANSACTIONS AND BALANCES
Sales to related parties - The Company had no sales to related parties which are the companies under common ownership.
Leases from related parties - On January 1, 2010, the Company entered into a one-year agreement for the lease of office space owned by the principal shareholders and their family member. The terms of the agreement state that the Company will lease the property for one year, the monthly rental is ¥86,583 and the annual rental expense is ¥1,039,000 ($157,143). Specifically, one of our subsidiaries, ENI, leases its office from Mr. Li Hongqi for one year from Jan. 1, 2010 to Dec. 31, 2010 with monthly rental of ¥40,000.
Short-term borrowings from related parties - The Company borrowed ¥7,343,457 and ¥5,941,399 ($898,605) from principal shareholders, their family member and senior officials as of June 30 and December 31, 2010. For specific term and interest rate of loan, please see Note 12.
F-21
Table of Contents
RECON TECHNOLOGY, LTD
NOTES TO THE CONSOLIDATED STATEMENTS (UNAUDITED)
NOTE 16. STOCK-BASED COMPENSATION
Share-based Payments - As discussed in Note 9 the Company granted options to purchase 293,000 ordinary shares under the 2009 Plan to its employees and non-employee directors on July 29, 2009. The options have an excise price of $6.00 equal to the IPO price of the Company and will vest over a period of five years, with the first 20% vesting on July 29, 2010. The options expire ten years after the date of grant, on July 29, 2019. The fair value was estimated on July 29, 2009 using the Binomial Lattice valuation model, using the following weighted-average assumptions:
| Stock Price at grant date |
6.00 | |||
| Exercise price (per share) |
6.00 | |||
| Risk free rate of interest*** |
4.6118 | % | ||
| Dividend Yield |
0.0 | % | ||
| Life of option (years)** |
10 | |||
| Volatility* |
78 | % | ||
| Foreiture rate**** |
0 | % |
| * | Volatility is projected using the performance of PHLX Oil Service Sector index. |
| ** | The life of options represents the period the option is expected to be outstanding. |
| *** | The risk-free interest rate is based on the Chinese international bond denominated in U.S dollar with a maturity that approximates the life of the option. |
| **** | Forfeiture rate is the estimated percentage of options forfeited by employees by leaving or being terminated before vesting. |
The Company recognizes compensation cost for awards with graded vesting on a straight – line basis over the requisite service period for the entire award. The grant date fair value of the options was ¥30.17 ($4.42) per share. Compensation expense recorded for three months ended December 31, 2009 and 2010 was ¥294,675 and ¥431,378($65,244), and ¥736,688 and ¥870,084 ($131,596) for the six months ended December 31, 2009 and 2010, respectively.
As of December 31, 2010, options to purchase 293,000 of ordinary shares were outstanding, 58,600 of them are vested under the 2009 Plan and zero of granted stock options were exercised.
Placement Agent Warrants - As discussed in Note 9, the Company completed its IPO offering on July 29, 2009, and the gross proceeds received by the Company for the Offering were $10,200,000 (1,700,000 ordinary shares at $6.00 per share) before the cash offering costs of ¥9,651,771 ($1,412,896).
In connection with the Offering, the Company sold the placement agent warrants to purchase 170,000 ordinary shares at $7.20 per share for a nominal amount. These warrants are exercisable for a period of five years. The Company has agreed to file, during the five year period at its cost,
F-22
Table of Contents
RECON TECHNOLOGY, LTD
NOTES TO THE CONSOLIDATED STATEMENTS (UNAUDITED)
at the request of the holders of a majority of the placement agents warrants and the underlying ordinary shares, and to use its best efforts to cause to become effective a registration statement under the Securities Act, as required to permit the public sale of ordinary shares issued or issuable upon exercise of the placement agent’s warrants. The Company accounted for the warrants as an additional offering cost with an estimated value of $627,341 which was a deduction of the gross proceeds mentioned above. The following table presents the assumptions used in the Black-Scholes valuation model to estimate the fair value of the placement agent warrants sold:
| Risk-free interest rate |
3.7679 | % | ||
| Dividend yield |
0 | % | ||
| Expected volatility |
78 | % | ||
| Expected life (in years) |
5 |
The Company had 170,000 of granted placement agent warrants as of December 31, 2010 and zero of warrants were exercised.
NOTE 17. EARNINGS PER SHARE.
ASC 260 “Earnings Per Share,” requires dual presentation of basic and diluted earnings per share (“EPS”) with a reconciliation of the numerator and denominator of the basic EPS computation to the numerator and denominator of the diluted EPS computation. Basic EPS excludes dilution. Diluted EPS reflects the potential dilution that could occur if securities or other contracts to issue ordinary shares were exercised or converted into ordinary shares or resulted in the issuance of ordinary shares that then shared in the earnings of the entity.
Basic net income per share is computed by dividing net income available to ordinary shareholders by the weighted average number of shares of ordinary shares outstanding during the period. Diluted income per share is computed by dividing net income by the weighted average number of shares of ordinary shares, ordinary shares equivalents and potentially dilutive securities outstanding during each period. Potentially dilutive ordinary shares consist of ordinary shares issuable upon the conversion of ordinary stock options and warrants (using the treasury stock method). However, the effect from options and warrants would have been anti-dilutive due to the fact that the weighted average exercise price per share of options and warrants is higher than the weighted average market price per share of the ordinary shares during the three months and six months ended December 31, 2010.
F-23
Table of Contents
RECON TECHNOLOGY, LTD
NOTES TO THE CONSOLIDATED STATEMENTS (UNAUDITED)
The following is a reconciliation of the numerators and denominators of the basic and diluted earnings per share computations:
| For the three months ended December 31, | ||||||||||||
| 2009 | 2010 | 2010 | ||||||||||
| RMB | RMB | U.S. Dollars | ||||||||||
| (Unaudited) | (Unaudited) | (Unaudited) | ||||||||||
| Basic weighted average ordinary shares outstanding |
3,951,811 | 3,951,811 | 3,951,811 | |||||||||
| Effect of options and warrants |
94,762 | — | — | |||||||||
| Diluted weighted average ordinary shares outstanding |
4,046,573 | 3,951,811 | 3,951,811 | |||||||||
| Net income available for ordinary shareholders |
¥ | 12,554,153 | ¥ | 6,133,179 | $ | 927,611 | ||||||
| Basic earnings per share |
¥ | 3.18 | ¥ | 1.55 | $ | 0.23 | ||||||
| Diluted earnings per share |
¥ | 3.10 | ¥ | 1.55 | $ | 0.23 | ||||||
| For the six months ended December 31, | ||||||||||||
| 2009 | 2010 | 2010 | ||||||||||
| RMB | RMB | U.S. Dollars | ||||||||||
| (Unaudited) | (Unaudited) | (Unaudited) | ||||||||||
| Basic weighted average ordinary shares outstanding |
3,656,277 | 3,951,811 | 3,951,811 | |||||||||
| Effect of options and warrants |
42,704 | — | — | |||||||||
| Diluted weighted average ordinary shares outstanding |
3,698,981 | 3,951,811 | 3,951,811 | |||||||||
| Net income available for ordinary shareholders |
¥ | 12,978,572 | ¥ | 6,976,942 | $ | 1,055,226 | ||||||
| Basic earnings per share |
¥ | 3.55 | ¥ | 1.77 | $ | 0.27 | ||||||
| Diluted earnings per share |
¥ | 3.51 | ¥ | 1.77 | $ | 0.27 | ||||||
NOTE 18. VARIABLE INTEREST ENTITIES
The Company is the primary beneficiary of BHD, Nanjing Recon and ENI, VIEs. Accordingly, the assets and liabilities of VIEs are included in the accompanying consolidated balance sheets.
The Company reports VIEs’ portion of consolidated net income and stockholders’ equity as noncontrolling interests in the consolidated financial statements.
F-24
Table of Contents
RECON TECHNOLOGY, LTD
NOTES TO THE CONSOLIDATED STATEMENTS (UNAUDITED)
Summary information regarding consolidated VIEs. is as follows:
| June 30, 2010 |
December 31, 2010 |
December 31, 2010 |
||||||||||
| RMB | RMB | U.S. Dollars | ||||||||||
| (Unaudited) | (Unaudited) | |||||||||||
| ASSETS |
||||||||||||
| Current assets |
||||||||||||
| Cash and cash equivalents |
¥ | 4,689,773 | ¥ | 8,290,902 | $ | 1,253,955 | ||||||
| Trade accounts receivable, net |
89,425,990 | 104,434,261 | 15,795,133 | |||||||||
| Purchase advances |
46,296,079 | 26,853,162 | 4,061,400 | |||||||||
| Other assets |
26,530,217 | 49,518,776 | 7,489,454 | |||||||||
| Total current assets |
¥ | 166,942,059 | ¥ | 189,097,101 | $ | 28,599,942 | ||||||
| Non-current assets |
1,748,151 | 2,084,182 | 315,222 | |||||||||
| Total Assets |
¥ | 168,690,210 | ¥ | 191,181,283 | $ | 28,915,164 | ||||||
| LIABILITIES |
||||||||||||
| Trade accounts payable |
¥ | 16,536,796 | ¥ | 21,148,001 | $ | 3,198,524 | ||||||
| Taxes payable |
20,203,104 | 24,105,472 | 3,645,826 | |||||||||
| Other liabilities |
20,629,101 | 21,450,726 | 3,244,310 | |||||||||
| Total current liabilities |
¥ | 57,369,001 | ¥ | 66,704,199 | $ | 10,088,660 | ||||||
| Total Liabilities |
¥ | 57,369,001 | ¥ | 66,704,199 | $ | 10,088,660 | ||||||
The financial performance of VIEs reported in the consolidated income statement is for the three months ended December 31, 2010 includes revenues of ¥46,958,185 ($7,102,179), operating expenses of ¥8,084,595 ($1,222,753), other expense of ¥149,524 ($22,615) and net income before allocation to non-controlling interests of ¥9,752,861 ($1,475,069).
The financial performance of VIEs reported in the consolidated income statement is for the six months ended December 31, 2010 includes revenues of ¥68,757,496 ($10,399,209), operating expenses of ¥ 11,900,919 ($1,799,951), other income of ¥158,089 ($23,910) and net income before allocation to non-controlling interests of ¥13,156,142 ($1,989,797).
NOTE 19. SUBSEQUENT EVENTS
Management has considered all events occurring through the date the financial statements have been issued, and has determined that there are no such events that are material to the financial statements, or all such material events have been fully disclosed.
F-25