Attached files
| file | filename |
|---|---|
| EX-31.1 - EXHIBIT 31.1 - Recon Technology, Ltd | dex311.htm |
| EX-32.1 - EXHIBIT 32.1 - Recon Technology, Ltd | dex321.htm |
| EX-32.2 - EXHIBIT 32.2 - Recon Technology, Ltd | dex322.htm |
| EX-31.2 - EXHIBIT 31.2 - Recon Technology, Ltd | dex312.htm |
Table of Contents
U.S. SECURITIES AND EXCHANGE COMMISSION
WASHINGTON, DC 20549
FORM 10-K
| x | Annual report pursuant to Section 13 or 15(d) of the Securities Exchange Act of 1934 |
For the fiscal year ended June 30, 2010
| ¨ | Transition report pursuant to Section 13 or 15(d) of the Securities Exchange Act of 1934 |
For the transition period from to .
Commission File Number 001-34409
RECON TECHNOLOGY, LTD
(Exact name of registrant as specified in its charter)
| Cayman Islands | Not Applicable | |
| (State or other jurisdiction of incorporation or organization) |
(I.R.S. employer identification number) |
Room 1902, Building C, King Long International Mansion
No. 9 Fulin Road
Beijing, 100107
People’s Republic of China
(Address of principal executive offices and zip code)
010-84945799
(Registrant’s telephone number, including area code)
Securities registered under Section 12(b) of the Exchange Act:
| Title of each class |
Name of each exchange on which registered | |
| Ordinary Shares, $0.0185 par value per share | NASDAQ Capital Market |
Securities registered under Section 12(g) of the Exchange Act:
None.
Table of Contents
Indicate by check mark if the registrant is a well-known seasoned issuer, as defined in Rule 405 of the Securities Act. Yes ¨ No x
Indicate by check mark if the registrant is not required to file reports pursuant to Section 13 or Section 15(d) of the Act. Yes ¨ No x
Indicate by check mark whether the registrant (1) has filed all reports required to be filed by Section 13 or 15(d) of the Exchange Act during the preceding 12 months (or for such shorter period that the registrant was required to file such reports), and (2) has been subject to such filing requirements for the past 90 days. Yes x No ¨
Indicate by check mark whether the registrant has submitted electronically and posted on its corporate web site, if any, every Interactive Data File required to be submitted and posted pursuant to Rule 405 of Regulation S-T (§232.405 of this chapter) during the preceding 12 months (or for such shorter period that the registrant was required to submit and post such files). Yes ¨ No ¨
Indicate by check mark if disclosure of delinquent filers pursuant to Item 405 of Regulation S-K (§229.405 of this chapter) is not contained and will not be contained, to the best of registrant’s knowledge, in definitive proxy or information statements incorporated by reference in Part III of this Form 10-K or any amendment to this Form 10-K or any amendment to this Form 10-K. x
Indicate by check mark whether the registrant is a large accelerated filer, an accelerated filer, a non-accelerated filer, or a smaller reporting company. See the definitions of “large accelerated filer,” “accelerated filer” and “smaller reporting company” in Rule 12b-2 of the Exchange Act.
| Large accelerated filer | ¨ | Accelerated filer | ¨ | |||
| Non-accelerated filer | ¨ (Do not check if a smaller reporting company) | Smaller reporting company | x | |||
Indicate by check mark whether the registrant is a shell company (as defined in Rule 12b-2 of the Act). Yes ¨ No x
The aggregate market value of the ordinary shares, $0.0185 par value per share (“Shares”), of the registrant held by non-affiliates on December 31, 2009 was approximately $12,549,101, based on the closing sales price of $6.68 per share, as reported on the Nasdaq Capital Market, multiplied by the number of outstanding Shares held by non-affiliates on that date (1,878,608).
The Company is authorized to issue 25,000,000 Shares. As of the date of this report, the Company has issued and outstanding 3,951,811 Shares.
DOCUMENTS INCORPORATED BY REFERENCE
This Form 10-K incorporates the registration statement filed with the Commission on August 12, 2008, as amended (file no. 333-152964) (the “Registration Statement”) and prospectus filed pursuant to Rule 424(b)(3) of the Securities Act of 1933 (the “Securities Act”) on July 24, 2009 (the “IPO Prospectus”). The Registration Statement and IPO Prospectus are incorporated by reference into Parts I, II and III of this Form 10-K.
Table of Contents
FORM 10-K
INDEX
| 2 | ||||
| Item 1. |
Business | 2 | ||
| Item 1A. |
Risk Factors | 13 | ||
| Item 1B. |
Unresolved Staff Comments | 13 | ||
| Item 2. |
Properties | 13 | ||
| Item 3. |
Legal Proceedings | 13 | ||
| Item 4. |
(Removed and Reserved) | 13 | ||
| 14 | ||||
| Item 5. |
14 | |||
| Item 6. |
15 | |||
| Item 7. |
15 | |||
| Item 7A. |
26 | |||
| Item 8. |
26 | |||
| Item 9. |
Changes in and Disagreements with Accountants on Accounting and Financial Disclosure |
26 | ||
| Item 9A/9A(T). |
26 | |||
| Item 9B. |
27 | |||
| 27 | ||||
| Item 10. |
27 | |||
| Item 11. |
32 | |||
| Item 12. |
Security Ownership of Certain Beneficial Owners and Management and Related Stockholder Matters |
33 | ||
| Item 13. |
Certain Relationships and Related Transactions, and Director Independence |
34 | ||
| Item 14. |
35 | |||
| Item 15. |
36 | |||
i
Table of Contents
SPECIAL NOTE REGARDING FORWARD-LOOKING STATEMENTS
We have made statements in this annual report that constitute forward-looking statements. Forward-looking statements involve risks and uncertainties, such as statements about our plans, objectives, expectations, assumptions or future events. In some cases, you can identify forward-looking statements by terminology such as “anticipate,” “estimate,” “plan,” “project,” “continuing,” “ongoing,” “expect,” “we believe,” “we intend,” “may,” “should,” “could” and similar expressions. These statements involve estimates, assumptions, known and unknown risks, uncertainties and other factors that could cause actual results to differ materially from any future results, performances or achievements expressed or implied by the forward-looking statements.
Examples of forward-looking statements include:
| • | projections of revenue, earnings, capital structure and other financial items; |
| • | statements of our plans and objectives; |
| • | statements regarding the capabilities and capacities of our business operations; |
| • | statements of expected future economic performance; and |
| • | assumptions underlying statements regarding us or our business. |
The ultimate correctness of these forward-looking statements depends upon a number of known and unknown risks and events. Many factors could cause our actual results to differ materially from those expressed or implied in our forward-looking statements. Consequently, you should not place undue reliance on these forward-looking statements.
The forward-looking statements speak only as of the date on which they are made, and, except as required by law, we undertake no obligation to update any forward-looking statement to reflect events or circumstances after the date on which the statement is made or to reflect the occurrence of unanticipated events.
In addition, we cannot assess the impact of each factor on our business or the extent to which any factor, or combination of factors, may cause actual results to differ materially from those contained in any forward-looking statements.
Readers are cautioned not to place undue reliance on these forward-looking statements, which speak only as of the date hereof. The Company undertakes no obligation to update this forward-looking information. Nonetheless, the Company reserves the right to make such updates from time to time by press release, periodic report or other method of public disclosure without the need for specific reference to this Report. No such update shall be deemed to indicate that other statements not addressed by such update remain correct or create an obligation to provide any other updates.
1
Table of Contents
| Item 1. | Business. |
General
We are a provider of computer software and hardware solutions to companies in the petroleum mining and extraction industry. We provide services designed to automate and enhance the extraction of petroleum in China. To this end, the PRC companies we control by contract, Beijing BHD Petroleum Technology Co., Ltd. (“BHD”), Nanjing Recon Technology Co., Ltd. (“Nanjing Recon”) and Jining ENI Energy Technology Co., Ltd, (“ENI”) (collectively the “Domestic Companies”), and we have developed specialized software and hardware to manage the oil extraction process in real-time and to reduce the costs associated with extraction.
We believe that one of the most important advancements in China’s petroleum industry has been the automation of significant segments of the exploration and extraction process. The Domestic Companies’ and our automation products and services allow petroleum mining and extraction companies to reduce their labor requirements and improve the productivity of oilfields. The Domestic Companies’ and our solutions allow our customers to locate productive oilfields more easily and accurately, improve control over the extraction process, increase oil yield efficiency in tertiary stage oil recovery, and improve the transportation of crude oil through the mining process.
Market Background
China is the world’s second-largest consumer of petroleum products, third-largest importer of petroleum and sixth-largest producer of petroleum. In the last twenty years, China’s demand for oil has more than tripled, while its production of oil has only modestly increased. China became a net importer of petroleum in 1983, and, as a result, oil production in China has been aimed at meeting domestic requirements. The oil industry in China is dominated by three state-owned holding companies: China National Petroleum Corporation (CNPC), China Petroleum and Chemical Corporation (Sinopec) and China National Offshore Oil Corporation (CNOOC). Foreign companies have also recently become involved in China’s petroleum industry; however, according to Chinese law, China’s national oil companies may take a majority (or minority) stake in any commercial discovery. As a result, the number of major foreign companies involved in the industry is relatively limited: Agip, Apache, BP, ChevronTexaco, ConocoPhillips, Eni, ExxonMobil, Husky Energy, Kerr-McGee, Mitsubishi, Royal Dutch Shell, Saudi Aramco, and Total.
In the past, China’s petroleum companies mined for petroleum by leveraging its abundance of inexpensive labor, rather than focusing on new technologies. For example, a typical, traditional oilfield with an annual capacity of 1,000,000 tons would require between 10,000 and 20,000 laborers. By contrast, when Baker CAC products were employed to explore and automate Cainan Oil Field, a desert oilfield in Xinjiang, annual capacity for the field reached 1,500,000 tons. Moreover, only 400 employees were required to manage the oilfield. After the introduction of Baker CAC’s products into China’s petroleum industry, Chinese companies have also sought to provide automation solutions.
In the primary oil recovery stage, oil pressure in an oil reservoir may be high enough to force oil to the surface. Approximately 20% of oil may be harvested at this stage. The secondary oil recovery stage accounts for another 5% to 15% of oil recovery and involves such efforts as pumps to extract petroleum and the injection of water, natural gas, carbon dioxide or other gasses into the oil reservoir to force oil to the surface. Most oilfields in China have now entered into the tertiary stage of oil recovery, at which oil extraction becomes increasingly difficult and inefficient. Tertiary recovery generally focuses on decreasing oil viscosity to make extraction easier and accounts for between 5% and 15% of oil recovery. Our efforts in tertiary recovery focus on reducing water content in crude oil in order to make extraction more efficient.
2
Table of Contents
China’s Economic Development
China’s population of approximately 1.3 billion people is expected to grow by roughly 9 million people per year. The country’s gross national product has grown at a rate of approximately 9 percent for more than 25 years, making it the fastest growth rate for a major economy in recorded history. During the same 25 year period, China has moved more than 300 million people out of poverty and quadrupled the average Chinese person’s income. The tremendous potential of this market is noted by the fact that 400 of the world’s largest 500 companies are investing in China.
China’s economy experienced overall growth of only 8.7% in 2009, its lowest growth rate in eight years, down from growth rates of 9.6% and 13% in 2008 and 2007, respectively. The global financial crisis has significantly decreased demand for Chinese exports, resulting in factory closures and losses of millions of jobs. This 8.7% growth rate is well above the 7.2% rate predicted by the World Bank and also exceeds the 8% rate the Chinese government had predicted and said would be necessary to avoid significant further job losses. While China’s growth rate has fallen, it remains well above the World Bank’s forecast for decline of 1.5% for the world economy in 2009.
Our Products
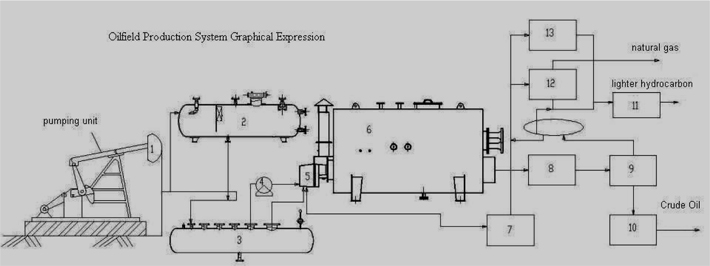
We currently provide products and services to oil and gas field companies, which focus on the development and production of oil and natural gas. Our products and services described below correlate to the numbered stages of the oilfield production system graphical expression shown below.
Our products and services include:
Equipment for Oil and Gas Production and Transportation
| • | High-Efficiency Heating Furnaces (as shown above by No. 6). Crude petroleum contains certain impurities that must be removed before the petroleum can be sold, including water and natural gas. To remove the impurities and to prevent solidification and blockage in transport pipes, companies employ heating furnaces. BHD researched, developed and implemented a new oilfield furnace that is advanced, highly automated, reliable, easily operable, and comparatively safe and highly heat efficient (90% efficiency). |
| • | Burner (as shown above by No. 5). We serve as an agent for the Unigas Burner which is designed and manufactured by UNIGAS, a European burning equipment production company. The burner we provide has the following characteristics: high degree of automation; energy conservation; high turn down ratio; high security and is environmentally safe. |
| • | Separator (as shown above by No. 2 and No. 3). The test separator is the key measurement device for gas and oil in metering plants. Oil and gas mixture spray on the oil block cap after entering into the separator through the oil pipeline. The diffused oil falls along the pipe wall to the separator bottom and through the |
3
Table of Contents
| draw-off pipe. The gas rises due to its low density and changes the flow direction after concentrating by the separator umbrella. In the process, the small oil droplets in the gas adhere to the umbrella wall and fall along the wall of the pipe. The de-oiled gas enters the pipeline through the freeing pipe at the top of the separator for measurement. |
Oil and Gas Development Tools and Equipment
| • | Packers of Fracturing. This utility model is used concertedly with the security joint, hydraulic anchor, and slide bushing of sand spray in the well. It is used for easy seat sealing and sand-up prevention. The utility model reduces desilting volume and prevents sand up which makes the deblocking processes easier to realize. The back flushing is sand-stick proof. |
| • | Production Packer. According to different withdraw points, the production packer separates different oil layers, and protects the oil pipe from sand and permeability, so as to promote the recovery ratio. |
| • | Water Injection Packer. The water injection packer injects water into different layers rather than injecting on a large scale; this can reduce cost and promote effectiveness. |
Oil and Gas Production Increasing Techniques
| • | Fissure Shaper. This is our proprietary product that is used along with a perforating gun to effectively increase perforation depth by between 46% and 80%, shape stratum fissures, improve stratum diversion capability and, as a result, improve our ability to locate oilfields and increase the output of oil wells. |
| • | Sand Prevention in Oil and Water Well. This technique processes additives that are resistant to elevated temperatures into “resin sand” which will be transported to the bottom of the well via carrying fluid. The “resin sand” goes through the borehole, pilling up and compacting at the borehole and oil vacancy layer. Then an artificial borehole wall is formed, functioning as a means of sand prevention. This sand prevention technique has been adapted to more than 100 wells, including heavy oil wells, light oil wells, water wells and gas wells, with a 100% success rate and a 98% effective rate. |
| • | Water Locating and Plugging Technique. High water cut affects the normal production of oilfields. Previously, there was no sophisticated method for water locating and tubular column plugging in China. The mechanical water locating and tubular column plugging technique we have developed resolves the problem of high water cut wells. This technique conducts a self-sealing-test during multi-stage usage and is reliable to separate different production sets effectively. The water location switch forms a complete set by which the water locating and plugging can be finished in one trip. The tubular column is adaptable to several oil drilling methods and is available for water locating and plugging in second and third class layers. |
| • | Fracture Acidizing. We inject acid to layers under pressure which can form or expand fissures. The treatment process of the acid is defined as fracture acidizing. The technique is mainly adapted to oil and gas wells that are blocked up relatively deeply, or the ones in the low permeable zones. |
| • | Electronic Broken-down Service. This service resolves block-up and freezing problems by generating heat from the electric resistivity of the drive pipe and utilizing a loop tank composed of an oil pipe and a drive pipe. This technique saves energy and is environment friendly. It can increase the production of oilfields that are in the middle and later periods. |
Automation System and Service
| • | Pumping unit controller. Refers to process “1” above. Functions as a monitor to the pumping unit, and also collects data for load, pressure, voltage, startup and shutdown control. |
| • | RTU used to monitor natural gas wells. Collects gas well pressure data. |
| • | Wireless dynamometer and wireless pressure gauge. Refers to process “1” above. These products replace wired technology with cordless displacement sensor technology. They are easy to install and significantly reduce the working load associated with cable laying. |
| • | Electric multi-way valve for oilfield metering station flow control. Refers to process “2” above. This multi-way valve is used before the test separator to replace the existing three valve manifolds. It facilitates the electronic control of the connection of the oil lead pipeline with the separator. |
4
Table of Contents
| • | Natural gas flow computer system. Flow computer system used in natural gas stations and gas distribution stations to measure flow. |
| • | Recon SCADA oilfield monitor and data acquisition system. Recon SCADA is a system which applies to the oil well, measurement station, and the union station for supervision and data collection. |
| • | EPC service of pipeline SCADA system. A service technique for pipeline monitoring and data acquisition after crude oil transmission. |
| • | EPC service of oil and gas wells SCADA system. A service technique for monitoring and data acquisition of oil wells and natural gas wells. |
| • | EPC service of oilfield video surveillance and control system. A video surveillance technique for controlling the oil and gas wellhead area and the measurement station area. |
| • | Technique service for “Digital oilfield” transformation. Includes engineering technique services such as oil and gas SCADA system, video surveillance and control system and communication systems. |
ISO9000 Certification
We have received ISO9000 certifications for several of our processes. The International Organization for Standardization consists of a worldwide federation of national standards bodies for approximately 130 countries, and the ISO9000 certification represents an international consensus of these standards bodies, with the aim of creating global standards of product and service quality. We have received ISO9000 certification for the following:
| • | Nanjing Recon has received certification for the development and service of RSCADA. |
| • | ENI has received certification for the distribution service of instruments, valves, transformation and transmission apparatus, electromechanical equipment, and a pipeline leak hunting system with sound wave for oilfields and oilfield assistant agents. |
| • | BHD has received certification for high efficiency heating furnaces, import burners, and manometer surrogate rendition and service. |
Customers
We operate our business by cooperating with oil companies and their subsidiaries, petroleum administration bureau and local service companies. Most actual control of our direct and indirect clients can be traced to Sinopec and CNPC, the two major Chinese state-owned companies responsible for on-shore petroleum mining and extraction. We have conducted automation projects for plants in three of China’s four highest producing oilfields, Daqing, Shengli and Xinjiang. We have undertaken the automation projects at the following locations, among others:
Sinopec
| • | Jiangsu Oil Field |
| • | Shengli Oil Field |
| • | Xinjiang Oil Field |
| • | Zhongyuan Oil Field |
| • | Sichuan Oil Field |
| • | Jianghan Oil Field |
| • | Puguang Oil Field |
We provide products and services to Sinopec under a series of agreements, each of which is terminable without notice. We first began to provide services to Sinopec in 1998. Sinopec accounted for approximately 49.02% and 32.40% of our revenues in 2009 and 2010, respectively, and any termination of our business relationships with Sinopec would materially harm our operations.
CNPC
| • | Huatugou Oil Field |
| • | Qinghai Oil Field |
| • | Sebei Gas Field |
| • | Luliang Oil Field |
5
Table of Contents
| • | Tuha Oil Field |
| • | Daqing Oil Field |
| • | Jidong Oil Field |
We provide products and services to CNPC under a series of agreements, each of which is terminable without notice. We first began to provide services to CNPC in 2000. CNPC accounted for approximately 43.11% and 48.79% of our revenues in 2009 and 2010, respectively, and any termination of our business relationships with CNPC would materially harm our operations.
Our Strengths
| • | Safety of products. The automation projects we have conducted have demonstrated that our products are reliable, safe and effective at automating the petroleum extraction process. |
| • | Efficiency of technology. We believe our technology increases efficiency and profitability for petroleum companies by enabling them to monitor, manage and control petroleum extraction; increase the amount of petroleum extracted and reduce impurities in extracted petroleum. |
| • | Ability to leverage our knowledge of Chinese business culture. Many of our competitors are based outside of China. As the Domestic Companies are based in China, we are in a unique position to emphasize Chinese culture and business knowledge to obtain new customers and new agreements with existing customers. We believe that many Chinese businesses, including state-owned companies like Sinopec and CNPC, would prefer to hire a Chinese company to assist in their business operations if a Chinese company exists with the ability to fulfill their needs on a timely and cost-efficient basis. In addition, our knowledge of Chinese culture allows us to anticipate and adapt to Chinese oilfield management methods. We provide our software solutions in Mandarin for the benefit of our Chinese customers, and all of our customer support is available from fluent personnel. |
| • | Experienced, successful executive management team. Our executive management team has significant experience and success in the petroleum automation industry. They will be able to draw on their knowledge of the industry and their relationships in the industry. |
| • | Ability to leverage China’s cost structure. As a Chinese company, we believe we can operate our business more cost effectively because all of our employees, operations and assets are located in China, resulting in lower labor, development, manufacturing and rent costs than we believe we would incur if we also maintained operations abroad. We expect these costs savings will be reflected in lower costs to our customers for comparable products. |
| • | Ownership of our intellectual property. Because we own our intellectual property, we are able to avoid licensing fees or contravening licensing agreements. |
Our Strategies
Our goal is to help our customers improve their efficiency and profitability by providing them with software and hardware solutions and services to improve their ability to locate productive oil reservoirs, manage the oil extraction process, reduce extraction costs, and enhance recovery from extraction activities. Key elements of our strategies include:
| • | Increase our market share in China. We believe that as the Chinese economy and oil industry continue to develop, Chinese petroleum extraction automation companies will compete with international businesses at an increasing rate. Consequently, we believe we will have opportunities to take market share from foreign companies by developing positive business relationships in China’s petroleum mining and extraction industry. We will also use strategic advertisements, predominantly in China’s northeast and northwest, where China’s major oilfields are located, to increase our brand awareness and market penetration. We will continue to develop new technologies designed to improve petroleum mining and extraction efficiency and profitability for our customers. |
| • | Focus on higher-profit subsection of market. While we plan to continue to provide services to all of our clients, we believe that we may improve our profit margins by focusing a higher portion of our advertising and promotions at those sub-divisions of our industry that have traditionally held the highest profit margins. |
6
Table of Contents
| • | Offer services to foreign oilfields contracted by Chinese petroleum companies. As Sinopec and CNPC continue to invest in oilfields in other countries, we will focus on offering our services in these new locations based on our success in working with the companies in China. |
| • | Seek opportunities with foreign companies in China. Even where oilfields in China are partially operated by foreign companies, a significant number of employees will be Chinese and will benefit from our Chinese-language services. We believe our hardware and software solutions would be beneficial to any petroleum company doing business in China and will continue to market to foreign companies entering the Chinese market. |
| • | Provide services that generate high customer satisfaction levels. Chinese companies in our market are strongly influenced by formal and informal referrals. We believe that we have the opportunity to expand market share by providing high levels of customer satisfaction with our current customers, thereby fostering strong customer referrals to support sales activities. |
Competition
We face competition from a variety of foreign and domestic companies involved in the petroleum mining automation industry. While we believe we effectively compete in our market, our competitors hold a substantial market share.
A few of our existing competitors, as well as a number of potential new competitors, have significantly greater financial, technical, marketing and other resources than we do, which could provide them with a significant competitive advantage over us. We cannot guarantee that we will be able to compete successfully against our current or future competitors in our industry or that competition will not have a material adverse effect on our business, operating results and financial condition.
Our primary domestic competitors include the following:
| • | Beijing Satellite Science & Technology Co., Ltd. (“BSS”). BSS has been retained to provide RSCADA system integrations for platforms at Shengli Oil Field at sea. |
| • | Beijing Echo Technologies Development Co., Ltd. (“BET”). BET provides a combination of software and hardware products for industrial automatic control systems in the petroleum industry. BET currently engages in research and development of software and hardware applied to industrial automatic control systems, manufacturing and installation of industrial automation instruments and integration of automatic control products. |
| • | Beijing Golden-Time Petroleum Measurement Technology Co., Ltd. (“BGT”). BGT develops analysis software used in oilfields but does not yet, to our knowledge, produce a substantial amount of hardware products. |
| • | Jinan GigaNano Industry Co., Ltd. (“JGI”). JGI has developed a ratio monitoring system to provide real time measurement and recording of oil extraction operating parameters. |
Our primary foreign competitors include the following:
| • | Schlumberger Limited (“Schlumberger”). Schlumberger is an oilfield services provider for oil and gas companies around the world. Schlumberger recently launched a family of multistage fracturing and completion services, which have integrated stimulation technologies. |
| • | Baltur Technologie Per IL Clima (“Baltur”). Baltur designs advanced products for the high performance burner, boiler and air conditioning markets. |
| • | Honeywell International, Inc. (“Honeywell”). Honeywell provides diversified products and services including aerospace products and services, control technologies for buildings, homes and industry, automotive products, turbochargers, and specialty materials. |
| • | Emerson Process Management (“Emerson”). Emerson is a global supplier of products, services, and solutions that measure, analyze, control, automate, and improve process-related operations. |
| • | Rockwell Automation, Inc. (“Rockwell”). Rockwell provides industrial automation power, control and information solutions to a wide range of industries. Rockwell provides both stand-alone, industrial components and enterprise-wide integrated systems. |
7
Table of Contents
Research and Development
We focus our research and development efforts on improving our development efficiency and the quality of our products and services. As of June 30, 2010, our research and development team consisted of six experienced engineers, developers and programmers. In addition, some of our support employees regularly participate in our research and development programs.
In the fiscal years ended June 30, 2010 and 2009, respectively, we spent ¥1,775,347 and ¥420,166 ($61,516), respectively, on research and development activities.
Intellectual Property
Our success and competitive position is dependent in part upon our ability to develop and maintain the proprietary aspect of our technology. The reverse engineering, unauthorized copying, or other misappropriation of our technology could enable third parties to benefit from our technology without paying for it. We rely on a combination of trademark, trade secret, copyright law and contractual restrictions to protect the proprietary aspects of the Domestic Companies’ and our technology. We seek to protect the source code to the Domestic Companies’ and our software, documentation and other written materials under trade secret and copyright laws. While we actively take steps to protect the Domestic Companies’ and our proprietary rights, such steps may not be adequate to prevent the infringement or misappropriation of the Domestic Companies’ and our intellectual property. This is particularly the case in China where the laws may not protect our proprietary rights as fully as in the United States.
We license the Domestic Companies’ and our software products under signed license agreements that impose restrictions on the licensee’s ability to utilize the software and do not permit the re-sale, sublicense or other transfer of the software. Finally, we seek to avoid disclosure of the Domestic Companies’ and our intellectual property by requiring employees and independent consultants to execute confidentiality agreements.
Although the Domestic Companies and we develop our software products, each is based upon middleware developed by third parties. We integrate this technology, licensed by our customers from third parties in our software products. If our customers are unable to continue to license any of this third party software, or if the third party licensors do not adequately maintain or update their products, we would face delays in the releases of our software until equivalent technology can be identified, licensed or developed, and integrated into our software products. These delays, if they occur, could harm our business, operating results and financial condition.
There has been a substantial amount of litigation in the software industry regarding intellectual property rights. It is possible that in the future third parties may claim that our current or potential future software solutions infringe their intellectual property. We expect that software product developers will increasingly be subject to infringement claims as the number of products and competitors in our industry segment grows and the functionality of products in different industry segments overlap. In addition, we may find it necessary to initiate claims or litigation against third parties for infringement of our proprietary rights or to protect our trade secrets. Although the Domestic Companies and we may disclaim certain intellectual property representations to our customers, these disclaimers may not be sufficient to fully protect us against such claims. Any claims, with or without merit, could be time consuming, result in costly litigation, cause product shipment delays or require the Domestic Companies and us to enter into royalty or license agreements. Royalty or licensing agreements, if required, may not be available on terms acceptable to us or at all, which could have a material adverse effect on our business, operating results and financial condition.
Our standard software license agreements contain an infringement indemnity clause under which we agree to indemnify and hold harmless our customers and business partners against liability and damages arising from claims of various copyright or other intellectual property infringement by the Domestic Companies’ and our products. We have never lost an infringement claim and our costs to defend such lawsuits have been insignificant. Although it is possible that in the future third parties may claim that our current or potential future software solutions or we infringe on their intellectual property, we do not currently expect a significant impact on our business, operating results, or financial condition.
8
Table of Contents
We market our products under the following trademarks which are registered with the PRC Trademark Bureau under the State Administration for Industry and Commerce. We currently own or have applied for the following trademarks:
1. Trademark of “Senior” valid from May 14, 2005 until May 13, 2015;
2. Trademark of “BHD” valid from November 7, 2003 to November 6, 2013;
3. We have submitted the trademark application of “Recon” on August 17, 2009. The application was accepted by the PRC Trademark Bureau and is currently under review process. We anticipate the approval may be granted in the first half year of 2012.
We own the following eight patents registered with the State Intellectual Property Office which are applied on our automated services products for the petroleum extraction industry:
1. Patent of eccentric water distributor valid until February 8, 2011;
2. Patent of oilfield wastewater degreasing treatment plant valid until May 15, 2013;
3. Patent of fracturing packer valid until August 5, 2018;
4. Patent of pressure phase transition furnace valid until June 3, 2019;
5. Patent of vacuum furnace phase transition valid until August 5, 2019;
6. Patent of heavy oil pipeline valid until June 17, 2015;
7. Patent of automatically adjusting negative pressure burner valid until July 22, 2019; and
8. Patent of wireless data instrument diagram valid until December 10, 2018;
We have registered the following software products with the State Intellectual Property Office:
1. Recon flow control computer monitoring system software was registered and published on February 8, 2008;
2. Recon SCADA field monitoring and data acquisition system software version 2 was published on August 18, 2003, and version 3 was registered and published on April 5, 2008.
Litigation
From time to time, we may become involved in various lawsuits and legal proceedings, which arise in the ordinary course of business. However, litigation is subject to inherent uncertainties, and an adverse result in these or other matters may arise from time to time that may harm our business. We are currently not aware of any such pending or threatened legal proceedings, claims, regulatory inquiries or investigations that we believe will have a material adverse affect on our business, financial condition or operating results.
Environmental Matters
We have not incurred material expenses in connection with compliance with Chinese environmental laws and regulations. We do not anticipate expending any material amounts for such compliance purposes for the remainder of our current or succeeding fiscal year.
China’s Intellectual Property Rights Enforcement System
In 1998, China established the State Intellectual Property Office (“SIPO”) to coordinate China’s intellectual property enforcement efforts. SIPO is responsible for granting and enforcing patents, as well as coordinating intellectual property rights related to copyrights and trademarks. Protection of intellectual property in China follows a two-track system. The first track is administrative in nature, whereby a holder of intellectual property rights files a complaint at a local administrative office. Determining which intellectual property agency can be confusing, as jurisdiction of intellectual property matters is diffused throughout a number of government agencies and offices, with each typically responsible for the protection afforded by one statute or one specific area of intellectual property-related law. The second track is a judicial track, whereby complaints are filed through the Chinese court system. Since 1993, China has maintained various intellectual property tribunals. The total volume of intellectual property related litigation, however, remains small.
9
Table of Contents
Although there are differences in intellectual property rights between the United States and China, of most significance to our company is the inexperience of China in connection with the development and protection of intellectual property rights. Similar to the United States, China has chosen to protect software under copyright law rather than trade secrets, patent or contract law. As such, we will attempt to protect our most significant intellectual property pursuant to Chinese laws that have only recently been adopted. Unlike the United States, which has lengthy case law related to the interpretation and applicability of intellectual property law, China has a less developed body of relevant intellectual property case law.
Regulation on Software Products
On March 1, 2009, the Ministry of Industry and Information Technology of China issued the Administrative Measures on Software Products, or the Software Measures, which became effective as of April 10, 2009, to strengthen the regulation of software products and to encourage the development of the Chinese software industry. Under the Software Measures, a software developer must have all software products imported into or sold in China tested by a testing organization supervised by the Ministry of Industry and Information Technology. The software industry authorities in provinces, autonomous regions, municipalities and cities with independent planning are in charge of the registration, report and management of software products. Software products can be registered for five years, and the registration is renewable upon expiration. Although Nanjing Recon’s current software products were registered in 2008, there can be no guarantee that the registration will be renewed in 2013 or that the Domestic Companies’ and our future products will be registered.
Regulation of Intellectual Property Rights
China has adopted legislation governing intellectual property rights, including trademarks and copyrights. China is a signatory to the main international conventions on intellectual property rights and became a member of the Agreement on Trade Related Aspects of Intellectual Property Rights upon its accession to the WTO in December 2001.
Copyright. China adopted its first copyright law in 1990. The National People’s Congress amended the Copyright Law in 2001 to widen the scope of works and rights that are eligible for copyright protection. The amended Copyright Law extends copyright protection to software products, among others. In addition, there is a voluntary registration system administered by the China Copyright Protection Center. Unlike patent and trademark registration, copyrighted works do not require registration for protection. Protection is granted to individuals from countries belonging to the copyright international conventions or bilateral agreements of which China is a member. Nanjing Recon has two copyrights for software programs.
Trademark. The Chinese Trademark Law, adopted in 1982 and revised in 1993 and 2001, protects registered trademarks. The Trademark Office under the Chinese State Administration for Industry and Commerce handles trademark registrations and grants a term of ten years to registered trademarks. Trademark license agreements must be filed with the Trademark Office for record. China has a “first-to-register” system that requires no evidence of prior use or ownership. The Domestic Companies and we have registered a number of product names with the Trademark Office.
Regulations on Foreign Exchange
Foreign Currency Exchange. The principal regulations governing foreign currency exchange in China are the Foreign Exchange Administration Regulations (1996), as amended, and the Administration Rules of the Settlement, Sale and Payment of Foreign Exchange (1996). Under these regulations, Renminbi are freely convertible for current account items, including the distribution of dividends, interest payments, trade and service-related foreign exchange transactions, but not for most capital account items, such as direct investment, loan, repatriation of investment and investment in securities outside China, unless the prior approval of SAFE or its local counterparts is obtained. In addition, any loans to an operating subsidiary in China that is a foreign invested enterprise, cannot, in the aggregate, exceed the difference between its respective approved total investment amount and its respective approved registered capital amount. Furthermore, any foreign loan must be registered with SAFE or its local counterparts for the loan to be effective. Any increase in the amount of the total investment and registered capital must be approved by the PRC Ministry of Commerce or its local counterpart. We may not be able to obtain these government approvals or registrations on a timely basis, if at all, which could result in a delay in the process of making these loans.
10
Table of Contents
The dividends paid by the subsidiary to its shareholder are deemed shareholder income and are taxable in China. Pursuant to the Administration Rules of the Settlement, Sale and Payment of Foreign Exchange (1996), foreign-invested enterprises in China may purchase or remit foreign exchange, subject to a cap approved by SAFE, for settlement of current account transactions without the approval of SAFE. Foreign exchange transactions under the capital account are still subject to limitations and require approvals from, or registration with, SAFE and other relevant PRC governmental authorities.
Regulation of Dividend Distribution. The principal regulations governing the distribution of dividends by foreign holding companies include the Foreign Investment Enterprise Law (1986), as amended, and the Administrative Rules under the Foreign Investment Enterprise Law (2001).
Under these regulations, foreign investment enterprises in China may pay dividends only out of their retained profits, if any, determined in accordance with PRC accounting standards and regulations. In addition, foreign investment enterprises in China are required to allocate at least 10% of their respective retained profits each year, if any, to fund certain reserve funds unless these reserves have reached 50% of the registered capital of the enterprises. These reserves are not distributable as cash dividends.
Notice 75. On October 21, 2005, SAFE issued Notice 75, which became effective as of November 1, 2005. According to Notice 75, prior registration with the local SAFE branch is required for PRC residents to establish or to control an offshore company for the purposes of financing that offshore company with assets or equity interests in an onshore enterprise located in the PRC. An amendment to registration or filing with the local SAFE branch by such PRC resident is also required for the injection of equity interests or assets of an onshore enterprise in the offshore company or overseas funds raised by such offshore company, or any other material change involving a change in the capital of the offshore company.
Moreover, Notice 75 applies retroactively. As a result, PRC residents who have established or acquired control of offshore companies that have made onshore investments in the PRC in the past are required to complete the relevant registration procedures with the local SAFE branch. Under the relevant rules, failure to comply with the registration procedures set forth in Notice 75 may result in restrictions being imposed on the foreign exchange activities of the relevant onshore company, including the increase of its registered capital, the payment of dividends and other distributions to its offshore parent or affiliate and capital inflow from the offshore entity, and may also subject relevant PRC residents to penalties under PRC foreign exchange administration regulations.
PRC residents who control our company are required to register with SAFE in connection with their investments in us. Such individuals completed this registration in 2007, and 2008, as amended. If we use our equity interest to purchase the assets or equity interest of a PRC company owned by PRC residents in the future, such PRC residents will be subject to the registration procedures described in Notice 75.
Regulations on Foreign Investment in Automation Service Industry and Oil Exploration and Extraction Industry in PRC. In accordance with the Catalogue of Industries for Guiding Foreign Investment (Revised 2007), the oil and gas automation service industries are in the catalogue of permitted industries, and thus there are no restrictions on foreign investment in such industry. In addition the following industries are encouraged for foreign investment in China:
| • | Manufacturing of equipment for oil prospecting, well drilling, and centralized transportation: floating well drilling system and floating production system operating at a water depth over 500m, seabed oil extraction & centralized transportation equipment operating at a water depth over 600m, deep-water oil driller with winch power over 3000KW, top driving power over 850KW and drilling pump power over, land-based oil driller & desert-based oil driller for drilling wells deeper than 9000m, 80 ton or bigger reciprocating piston compressor for use in oil refineries with a capacity of 10 million tons/year, CNC oil well measuring instrument, and oil drilling mud-hole equipment. |
| • | Exploration and exploitation of oil and natural gas with venture capital (limited to equity joint ventures and cooperative joint ventures); |
11
Table of Contents
| • | Development and application of new technologies that increase the recovery ratio of crude oil (limited to equity joint ventures and cooperative joint ventures); |
| • | Development and application of new oil exploration and exploitation technologies such as geophysical exploration, drilling, well logging, and downhole operation, etc. (limited to cooperative joint ventures); and |
| • | Exploration and development of unconventional oil resources such as oil shale, oil sands, heavy oil, and excess oil (limited to cooperative joint ventures). |
Employees
As of June 30, 2010, we had 118 employees, all of whom were based in China. Of the total, 17 were in management, 39 were in technical support and research and development, 30 were engaged in sales and marketing, 14 were in financial affairs, and 18 were in administration. We believe that our relations with our employees are good. We have never had a work stoppage, and our employees are not subject to a collective bargaining agreement.
Insurance
We do not have any business interruption, litigation or natural disaster insurance coverage for our operations in China. Insurance companies in China offer limited business insurance products. While business interruption insurance is available to a limited extent in China, we have determined that the risks of interruption, cost of such insurance and the difficulties associated with acquiring such insurance on commercially reasonable terms make it impractical for us to have such insurance. Therefore, we are subject to business and product liability exposure. Business or product liability claims or potential regulatory actions could materially and adversely affect our business and financial condition.
We do, however, pay certain required insurance amounts in connection with our employees’ wages. The amount and types of insurance we must provide under Chinese and local requirements vary by the location of each of the Domestic Companies. The following table summarizes the types of insurance paid for each of the Domestic Companies:
Nanjing Recon
Housing Fund
Pension
Unemployment Insurance
Medical Insurance
Occupational Injury Insurance
Maternity Insurance
BHD
Pension
Unemployment Insurance
Medical Insurance
Occupational Injury Insurance
ENI
Pension
Unemployment Insurance
Medical Insurance
Occupational Injury Insurance
Maternity Insurance
12
Table of Contents
| Item 1A. | Risk Factors. |
The Company is not required to provide the information required by this Item because the Company is a smaller reporting company.
| Item 1B. | Unresolved Staff Comments. |
The Company is not required to provide the information required by this Item because the Company is a smaller reporting company.
| Item 2. | Properties. |
We currently operate in four facilities throughout China. Our headquarters are located in Beijing.
| Office |
Address |
Rental Term |
Space | |||
| Headquarters |
Jinglongguoji Mansion, 19th Floor Chaoyang District Beijing, PRC |
July 1, 2010 to June 30, 2011 |
220 square meters | |||
| Nanjing Recon |
Yongfeng Mansion, 14th Floor No. 123 Jiqing Road Nanjing City, PRC |
July 10, 2010 to July 9, 2011 |
440 square meters | |||
| BHD |
Jinglongguoji Mansion, 18th Floor Chaoyang District, Beijing, PRC | January 1, 2010 to December 31, 2010 |
450 square meters | |||
| ENI |
Torch Industrial Garden 4th Building Jining, Shandong Province, PRC |
January 1, 2010 to December 31, 2010 |
200 square meters | |||
| Item 3. | Legal Proceedings. |
From time to time, we may become involved in various lawsuits and legal proceedings, which arise in the ordinary course of business. However, litigation is subject to inherent uncertainties, and an adverse result in these or other matters may arise from time to time that may harm our business. We are currently not aware of any such pending or threatened legal proceedings, claims, regulatory inquires or investigations that we believe will have a material adverse affect on our business, financial condition or operating results.
| Item 4. | (Removed and Reserved) |
13
Table of Contents
| Item 5. | Market for Registrant’s Common Equity, Related Stockholder Matters and Issuer Purchases of Equity Securities. |
(a) Market for Our Ordinary Shares
We completed our initial public offering on July 29, 2009. The following table sets forth the quarterly high and low sale prices for our ordinary shares as reported on the NASDAQ Capital Market.
Fiscal 2010
| High | Low | |||||
| First Quarter Ended September 30, 2009 |
$ | 10.85 | $ | 5.13 | ||
| Second Quarter Ended December 31, 2009 |
$ | 8.28 | $ | 5.21 | ||
| Third Quarter Ended March 31, 2010 |
$ | 7.52 | $ | 5.42 | ||
| Fourth Quarter Ended June 30, 2010 |
$ | 6.48 | $ | 4.12 | ||
| Year Ended June 30, 2010 |
$ | 10.85 | $ | 4.12 | ||
As of June 30, 2010, there were approximately six holders of record of our ordinary shares. This excludes our ordinary shares owned by shareholders holding ordinary shares under nominee security position listings. On June 30, 2010, the last sales price of our ordinary shares as reported on the NASDAQ Capital Market was $4.85 per ordinary share.
Dividend Policy
We have never declared or paid any cash dividends on our ordinary shares. We anticipate that we will retain any earnings to support operations and to finance the growth and development of our business. Therefore, we do not expect to pay cash dividends in the foreseeable future. Any future determination relating to our dividend policy will be made at the discretion of our Board of Directors and will depend on a number of factors, including future earnings, capital requirements, financial conditions and future prospects and other factors the Board of Directors may deem relevant.
Because we are a holding company with no operations of our own and all of our operations are conducted through our Chinese subsidiary, our ability to pay dividends and to finance any debt that we may incur is dependent upon dividends and other distributions paid. In addition, Chinese legal restrictions permit payment of dividends to us by our Chinese subsidiary only out of its accumulated net profit, if any, determined in accordance with Chinese accounting standards and regulations. Under Chinese law, our subsidiary is required to set aside a portion (at least 10%) of its after-tax net income (after discharging all cumulated loss), if any, each year for compulsory statutory reserve until the amount of the reserve reaches 50% of our subsidiaries’ registered capital. These funds may be distributed to shareholders at the time of its wind up. See “Management’s Discussion and Analysis of Financial Condition and Results of Operations—Holding Company Structure.”
Payments of dividends by our subsidiary in China to our company are also subject to restrictions including primarily the restriction that foreign invested enterprises may only buy, sell and/or remit foreign currencies at those banks authorized to conduct foreign exchange business after providing valid commercial documents. There are no such similar foreign exchange restrictions in the Cayman Islands.
14
Table of Contents
(b) The section entitled “Use of Proceeds” from our registration statement filed on August 12, 2008, as amended (the “Registration Statement”) is incorporated herein by reference. The effective date of the Registration Statement is July 22, 2009, and the Commission file number assigned to the Registration Statement is 333-152964. The Registration Statement registers the offering of up to 1,700,000 ordinary shares (subject to amendment in accordance with the Securities Act of 1933 and the rules and regulations promulgated thereunder) (the “Offering”). As of June 30, 2010, the Company has spent proceeds from the Offering in accordance with the following chart:
| Description of Use |
Proposed Expenditure Amount |
Actual Expenditures through June 30, 2010 | ||||
| Product Research and development |
$ | 1,273,024 | $ | 150,000 | ||
| Acquisition and business development in oil-field industry in China and globally |
4,073,675 | 5,000,000 | ||||
| Sarbanes-Oxley compliance |
424,341 | 0 | ||||
| Fixed asset purchases |
442,341 | 0 | ||||
| Employee training |
169,736 | 0 | ||||
| General working capital |
2,121,706 | 2,878,163 | ||||
| Total |
$ | 8,504,823 | $ | 8,028,163 | ||
(c) None.
| Item 6. | Selected Financial Data. |
The Company is not required to provide the information required by this Item because the Company is a smaller reporting company.
| Item 7. | Management’s Discussion and Analysis or Plan of Operation. |
Organization
We are a company with limited liability incorporated in 2007 under the laws of the Cayman Islands. Headquartered in Beijing, we provide products and services to oil and gas companies and their affiliates through the Domestic Companies. As the parent company of the Domestic Companies, we are the center of strategic management, financial control and human resources allocation for the Domestic Companies.
Our business is mainly focused on the upstream aspects of the oil and gas industry as shown by the solid framed boxes on the chart below:
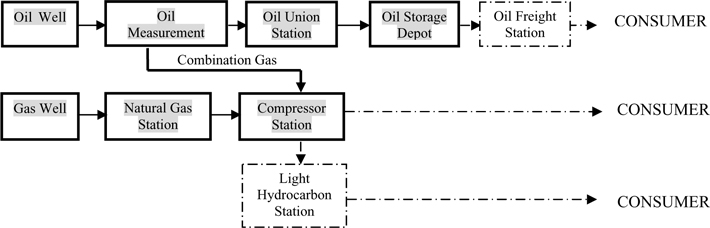
We derive our revenues from the sale of hardware products, the sale of software products, and services. Our products and services involve most of the key procedures of extraction and production of oil and gas, which include automation systems, equipment, tools and onsite technical services. We do not, however, engage in the production of petroleum or petroleum products. Specifically, our products and services can be broken down into automation products and technical services; oil-gas gathering and transportation equipment; and accessories for rig and production equipment. As our business increases, we continue to improve the structure of our operating department for better management and development of our business.
15
Table of Contents
Financial Results
In the year ended June 30, 2010, approximately 92.61% of our revenues came from hardware sales, 6.75% came from software sales, and 0.64% came from services. Within our hardware sales business, the sale of accessories is one of our basic businesses; its steady development has ensured our continued successful operation. Sales of gathering and transportation equipment are another important part of our business. We are able to provide these types of products according to specific requirements and the particular natural and geographical environments of different oilfields. The valuable data gathered from this field work will help us achieve more business and customer loyalty. Automation products and ancillary services is our fastest growing business and we can earn high profit margins because this industry is still in its early stage.
Business Outlook
The oilfield engineering and technical service industry is generally divided into five sections: (1) exploration, (2) drilling and completion, (3) testing and logging, (4) production, and (5) oilfield construction. Thus far our businesses have only been involved in production. Our management believes it’s time to expand our core business, move into new markets, and develop new businesses. There are great opportunities both in new markets and our existing markets. We believe that many existing wells and oilfields need to improve or renew their equipment and service to maintain production and our techniques and services will be needed as new oil and gas fields are developed. In the next three years, we will focus on:
| • | Measuring equipment and service. Our priority is the development of our well, pipeline and oilfield SCADA engineering project contracting service, oilfield video surveillance and control system and reforming technical supporting service. According to conservative estimates, the potential market for our wireless indicator and remote monitoring system (SCADA) is approximately RMB 5 billion. |
| • | Gathering and transferring equipment. (1) Furnace. We estimate demands for our furnace at about 2,000 units per year, of which 500 come from new wells and 1,500 come from reconstruction of old wells. The potential market is estimated at RMB 800 million based on an average price of RMB 400,000 per furnace. (2) Oil/water separator. We estimate demand at about 800 units per year, of which 300 come from new wells and 500 come from reconstruction of old wells. The potential market is about RMB 400 million based on an average price of RMB 500,000; (3) Burner. We estimate demand at about 5,000 units per year, of which 1,000 come from new wells and 4,000 come from reconstruction of old wells. The potential market is about 300 million based on an average price of RMB 60,000. |
| • | New business. Along with the opening of the oilfield service market to private companies, we will establish our own service team equipped with work-over rigs (specialized equipment used during the operation of well repairing) and coiled tubing machines. Only a few companies can provide this business in China at present. |
Growth Strategy
As a small local company, it is our basic strategy to focus on developing our onshore oilfield business, i.e. the upstream of the industry. Due to the remote location and bad environment of China’s oil and gas fields, foreign competitors rarely enter those fields. Large domestic oil companies prefer to focus on the exploration and development business to earn high margin and keep their absolute competitive advantage. As to private oilfield service companies, 90% specialize in the manufacture of drilling and production equipment. Thus, the market for technical support and project service is still in its early stage. Our management insists on providing high quality products and service in the oilfield where we have geographical advantage, avoiding conflicts of interest with bigger suppliers of drilling equipment and keeping our leading position within the market segment. Our mission is to increase the automation and safety levels of industrial petroleum production in China, and improve the under-developed working process and management mode by using high-technology. At the same time, we are always looking to improve ourselves and to increase our earning capability.
16
Table of Contents
As a technology development company, we put a priority on research, exploration, design and innovation. For years we have been increasing investments in attracting and training talents to continually improve our research and development capability. We currently have more than 100 employees, 80% of whom graduated from college. We also cooperate with the Oil Field Service & Geology Research Laboratory of Nanjing University.
Industry and Recent Developments
Oilfield drilling and production equipment and engineering technique services are applied in the process of oil and gas extraction, thus the exploration and exploitation activities of petroleum companies cause direct influences on demands of oilfield technique service and corresponding equipment. The number of newly increased oil and gas wells each year is a key indicator of activity. It can also reflect the prosperity of the oilfield service industry. China is the world’s second-largest petroleum producing country, with nearly 30,000 wells drilled and drill depths of 49,000,000 meters annually.
In the long run, factors affecting the development of petroleum companies include prices of oil and gas, and the national energy strategy. In the short or medium term, the petroleum companies plan their development activities according to the quantity demanded. Thus, the demanded quantity of oil and gas in the short or medium term affects the increased number of oil and gas wells. Meanwhile, well prospecting is done to ensure the supplement of oil and gas in medium and long run, and well development will satisfy the production demand of petroleum companies in the short term.
At present, China is short of oil and gas. The discrepancy between production and demand is enlarging. For the three state owned petroleum companies, the top priority is to ensure the supplements of the nation, promoting stable and increased production of the oilfield. Their capital expenditures are restricted by the national energy strategy to a large extent. Under such circumstances, despite the adverse domestic and international market conditions influencing the Chinese oil market in 2009, the investment by petroleum companies to the upstream of prospecting and development kept increasing. Advanced oilfield drill equipment and technique services are in greater demand, for the petroleum companies to promote effectiveness and reduce cost.
Furthermore, the Several Opinions of the State Council on Encouraging and Guiding the Healthy Development of Private Investment (the “New 36 Guidelines on Non-State-owned Economy”) promulgated in 2010 by the State encourages private investors to take part in oil and natural gas construction, and supports private enterprise investors entering into exploration and development of oilfield area. As exploration of oil and gas fields involves a wide range of professional technologies, it is expected that in the future the private investors investing in oil and gas field exploration will seek out general contracting and integrated services. We believe this will bring opportunities to the integrated service projects of our Company.
Factors Affecting Our Results of Operations — Generally
Our operating results in any period are subject to general conditions typically affecting the Chinese oil-field service industry including:
| • | the amount of spending by our customers, primarily those in the oil and gas industry; |
| • | growing demand from large corporations for improved management and software designed to achieve such corporate performance; |
| • | the procurement processes of our customers, especially those in the oil and gas industry; |
| • | competition and related pricing pressure from other oilfield service solution providers, especially those targeting the Chinese oil and gas industry; |
| • | the ongoing development of the oilfield service market in China; and |
| • | inflation and other factors. |
Unfavorable changes in any of these general conditions could negatively affect the number and size of the projects we undertake, the number of products we sell, the amount of services we provide, the price of our products and services and otherwise affect our results of operations.
17
Table of Contents
Our operating results in any period are more directly affected by company-specific factors including:
| • | our revenue growth; |
| • | the proportion of our business dedicated to large companies; |
| • | our ability to successfully develop, introduce and market new solutions and services; |
| • | our ability to increase our revenues to businesses, both old customers and new in the Chinese oil and gas industry; |
| • | our ability to effectively manage our operating costs and expenses; and |
| • | our ability to effectively implement any targeted acquisitions and/or strategic alliances so as to provide efficient access to markets and industries in the Chinese oil and gas industry. |
Critical Accounting Policies and Estimates
Estimates and Assumptions. We prepare our financial statements in conformity with U.S. GAAP, which requires us to make judgments, estimates and assumptions. We continually evaluate these estimates and assumptions based on the most recently available information, our own historical experience and various other assumptions that we believe to be reasonable under the circumstances. Since the use of estimates is an integral component of the financial reporting process, actual results could differ from those estimates. An accounting policy is considered critical if it requires an accounting estimate to be made based on assumptions about matters that are highly uncertain at the time such estimate is made, and if different accounting estimates that reasonably could have been used, or changes in the accounting estimates that are reasonably likely to occur periodically, could materially impact the consolidated financial statements. We believe that the following policies involve a higher degree of judgment and complexity in their application and require us to make significant accounting estimates. The following descriptions of critical accounting policies, judgments and estimates should be read in conjunction with our consolidated financial statements and other disclosures included in this prospectus. Significant accounting estimates reflected in our company’s consolidated financial statements include revenue recognition, allowance for doubtful accounts, and useful lives of property and equipment.
Revenue Recognition. We recognize revenue when it is realized and earned. We consider revenue realized or realizable and earned when (1) we have persuasive evidence of an arrangement, (2) delivery has occurred or services have been provided, (3) the sales price is fixed or determinable, and (4) collectability is reasonably assured. Delivery does not occur until products have been shipped or services have been provided to the client and the client has signed a completion and acceptance report, risk of loss has transferred to the client, client acceptance provisions have lapsed, or we have objective evidence that the criteria specified in client acceptance provisions have been satisfied. The sales price is not considered to be fixed or determinable until all contingencies related to the sale have been resolved.
| • | Hardware. Revenue from hardware sales is generally recognized when the product is shipped to the customer and when there are no unfulfilled company obligations that affect the customer’s final acceptance of the arrangement. |
| • | Software. The Company sells self-developed software. For software sales, the Company recognizes revenues in accordance with the provisions of Statement of Position No. 97-2 (ASC Topic 985-605), “Software Revenue Recognition,” and related interpretations. Revenue from software is recognized according to project contracts. Contract costs are accumulated during the periods of installation and testing or commissioning. Usually this is short term. Revenue are not recognized until completion of the contracts and receipt of acceptance statements. Costs included in inventory as work in process include direct materials, labor and related expense. Corporate general and administrative expenses are charged to expense in the period they are incurred. |
| • | Services. The Company provides services to improve software functions and system requirements on separated fixed-price contracts. Revenue is recognized on the completed contract method when acceptance is determined by a completion report signed by the customer. |
| • | Deferred income represents unearned amounts billed to customers related to sales contracts. |
18
Table of Contents
Fair Values of Financial Instruments. The carrying amounts reported in the consolidated balance sheets for trade accounts receivable, other receivables, advances to suppliers, trade accounts payable, accrued liabilities, advances from customers and notes payable approximate fair value because of the immediate or short-term maturity of these financial instruments.
Allowance for Doubtful Accounts. Trade accounts receivable and other receivables are recognized initially at fair value and subsequently measured at amortized cost using the effective interest method, less a provision made for impairment of these receivables. Provisions are applied to trade accounts and other receivables where events or changes in circumstances indicate that the balance may not be collectible. The identification of doubtful debts requires the use of judgment and estimates of management. Our management must make estimates of the collectability of our accounts receivable. Management specifically analyzes accounts receivable, historical bad debts, customer creditworthiness, current economic trends and changes in our customer payment terms when evaluating the adequacy of the allowance for doubtful accounts. Our allowance for trade accounts receivable was ¥604,953 and ¥1,089,331 ($159,993) on June 30, 2009 and 2010 respectively. Our allowance for trade accounts receivable increased primarily because as our business grows, our management continually conducts comprehensive risk assessments and increases the allowance to guard against bad debts accordingly. However, most of the growth occurred between us and our large clients. Because these clients are Chinese state-owned companies, our management believes the possibility that these accounts receivable will be uncollectable is relatively low. If the financial condition of our clients were to deteriorate, resulting in their inability to make payments, an additional allowance might be required.
Property and Equipment. We record property and equipment at cost. We depreciate property and equipment on a straight-line basis over their estimated useful lives using the following annual rates:
| Motor Vehicles |
10 years | |
| Office Equipment |
2-5 years | |
| Leasehold Improvements |
5 years |
We expense maintenance and repair expenditures as they do not improve or extend an asset’s productive life. These estimates are reasonably likely to change in the future since they are based upon matters that are highly uncertain such as general economic conditions, potential changes in technology and estimated cash flows from the use of these assets.
Gains or losses on sales or retirements are included in the consolidated statements of operations in the year of disposition. Depreciation expense was ¥321,300 and ¥368,804 ($54,167) for the year 2009 and 2010, respectively.
| Chinese Yuan (Renminbi) | U.S. Dollars |
|||||||||||
| June 30, 2009 |
June 30, 2010 |
June 30, 2010 |
||||||||||
| Motor vehicles |
¥ | 1,464,918 | ¥ | 1,796,955 | $ | 263,924 | ||||||
| Office equipment and fixtures |
779,257 | 450,715 | 66,198 | |||||||||
| Leasehold improvement |
169,462 | 426,181 | 62,595 | |||||||||
| Total property and equipment |
2,413,637 | 2,673,851 | 392,717 | |||||||||
| Less: Accumulated depreciation |
(1,006,761 | ) | (1,190,970 | ) | (174,922 | ) | ||||||
| Property and equipment, net |
¥ | 1,406,876 | ¥ | 1,482,881 | $ | 217,795 | ||||||
Software Development Costs. We charge all of our development costs to research and development until we have established technological feasibility. We acknowledge technological feasibility of our software when a detailed program design has been completed, or upon the completion of a working model. Upon reaching technological feasibility, we capitalize additional software costs until the software is available for general release to customers. Although we have not established a budget or timetable for software development, we anticipate the need to continue the development of our software products in the future and the cost could be significant. We believe that,
19
Table of Contents
as in the past, the costs of development will result in new products that will increase revenue and therefore justify costs. There is, however, a reasonable possibility that we may be unable to realize the carrying value of our software, and the amount not so realized may adversely affect our financial position, results of operation or liquidity in the future.
Cost of Revenues. Cost of revenues includes wages, materials, handling charges, and other expenses associated with manufactured products and services provided to customers; the cost of purchased raw materials such as steel products and chemical materials. We expect cost of revenues to grow as our revenues grow. It is possible that we could incur development costs with little revenue recognition, but based upon our past history, we expect our revenues to grow.
Valuation of Long-Lived Assets. We review the carrying values of our long-lived assets for impairment whenever events or changes in circumstances indicate that they may not be recoverable. When such an event occurs, we project undiscounted cash flows to be generated from the use of the asset and its eventual disposition over the remaining life of the asset. If projections indicate that the carrying value of the long-lived asset will not be recovered, we reduce the carrying value of the long-lived asset, by the estimated excess of the carrying value over the projected discounted cash flows. In the past, we have not had to make significant adjustments to the carrying values of our long-lived assets, and we do not anticipate a need to do so in the future. However, circumstances could cause us to have to reduce the value of our capitalized software more rapidly than we have in the past if our revenues were to significantly decline. Estimated cash flows from the use of the long-lived assets are highly uncertain and therefore the estimation of the need to impair these assets is reasonably likely to change in the future. Should the economy or acceptance of our software change in the future, it is likely that our estimate of the future cash flows from the use of these assets will change by a material amount.
Results of Operations for the Year ended June 30, 2010 compared to June 30, 2009
Our historical reporting results are not necessarily indicative of the results to be expected for any future period.
Revenue
| Chinese Yuan (RMB) |
2010 | 2009 | Increase (Decrease) |
Percentage Change |
||||||
| Hardware |
108,351,654 | 72,265,176 | 36,086,478 | 49.94 | % | |||||
| Service |
750,769 | 1,495,662 | (744,893 | ) | -49.80 | % | ||||
| Software |
7,901,709 | 1,886,069 | 6,015,640 | 318.95 | % | |||||
| Total Revenue |
117,004,132 | 75,646,907 | 41,357,225 | 54.67 | % | |||||
Revenue. Our total revenues increased by approximately 54.67%, from ¥75,646,907 in 2009 to ¥117,004,132 ($17,184,756) in 2010. Despite the worldwide economic downturn, decreased oil prices, and oil companies’ decreased exploration expenditures and production slowdown, our revenue increased instead of going down. This is mainly due to the following factors:
(a) Unlike drilling, exploration, and equipment manufacturing sections, the sub-sector we operate in has a lower direct correlation with crude-oil prices, and expenditures here would not be cut down obviously by oil companies;
(b) We expanded our business into new markets of gas field actively to avoid the business reductions of some prior clients;
(c) We benefited from the proceeds of our IPO, we participated in some larger contracts, especially contracts that combine products and service. We believe this kind of business can help us to form our own business model of providing equipment and systems with value-added services to secure our revenue development and high level of margin.
20
Table of Contents
During the 2010 fiscal year, automation products increased the most both in amount and growth rate. In this area, all of our revenue came from China.
Our management believes that China’s oilfield service industry, especially the upstream, oil production and field management, is still at its early stage. With the increasing difficulty in exploring and developing the oil and gas field and increased requirements for environment protection and safety, oil companies will need more and more high-end technology products and value-added services, such as automation equipment, engineering services and outsourcing packages. We always insist on investment in new technology and research since our establishment, setting up our competitive advantage for the long run. There will be more and more opportunities for non-state owned small companies like us with the liberalization of service industry. Our managements take it as our principal to occupy market and prevent import substitution by taking advantage of cost and price.
Cost and Margin
| Chinese Yuan (RMB) |
2010 | 2009 | Increase (Decrease) |
Percentage Change |
|||||||
| Total Revenue |
117,004,132 | 75,646,907 | 41,357,225 | 54.67 | % | ||||||
| Cost of revenue |
67,593,524 | 45,758,804 | 21,834,720 | 47.72 | % | ||||||
| Gross margin |
49,410,608 | 29,888,103 | 19,522,505 | 65.32 | % | ||||||
| Margin ratio |
42.23 | % | 39.51 | % | — | 2.72 | % | ||||
Cost of Revenues. Our cost of revenues includes raw materials, labor cost and costs related to design, implementation, delivery and maintenance of products and services. We are a light-asset company, and all materials and components needed can be purchased or manufactured under contract. Usually the price of electronic components doesn’t fluctuate violently due to competitive forces, and it will not affect our cost significantly. Specialized equipment and incentive chemical products can be influenced directly if the price for metal and oil changes. Additionally, the price for some imported accessories appointed by our clients can also have some impact on our cost.
Our cost of revenues increased from ¥45,758,804 in 2009 to ¥67,593,524 ($9,927,669) in 2010, an increase of 47.72% or 21,834,720 as a result of an expansion of our business.
To achieve a greater cost advantage, we are improving our purchase management and working to be the agent or distributor for more foreign and domestic companies, so that we can foster long-term business relationships with these companies and be able to purchase at relatively lower prices.
Gross Profit. For the year ended June 30, 2010, our gross profit increased to ¥49,410,608 ($7,257,087) from ¥29,888,103 for the same period in 2009, an increase of ¥19,522,505, or approximately 65.32%. For the year ended June 30, 2010 our gross profit as a percentage of revenue increased to 42.23%, from 39.51% for the same period in 2009. This increase in gross profit can be attributed primarily to the increase in sales volume to CNPC and Sinopec and development of our lower cost software and service business. We believe this increase in sales volume resulted, in part, from the Chinese government’s policy to improve safety and security in the energy industry.
As a kind of capital and technology intensive industry, abundant capital strength and huge spending of oil companies and a higher threshold for access make it possible for suppliers to earn high yields. As to sales of equipment and accessories, our gross margin remains at about 40%( a medium level), margin of automation products is about 50% and that of oilfield service and project engineering service can be higher than 60%.
During the 2010 fiscal year, the gross margin for our accessories business increased significantly, driving up the overall gross margin of our company.
Our managements believe it can better safeguard our profitability by quickly upgrading our technology and products and adjusting our internal business structure. We will focus more on our automation system business and
21
Table of Contents
related engineering services, oilfield surface production management and expansion of gas field business. Additionally, we will gradually develop the oversees market in conjunction with the international expansion of our current clients.
Expenses
Selling and Distribution Expenses. Selling and distribution expenses consist primarily of salaries and related expenditures of our sales and marketing departments; sales commissions; costs of our marketing programs, including public relations, advertising and trade shows; and an allocation of our facilities and depreciation expenses. Selling expenses increased by 44.85% or 2,538,544, from ¥5,660,198 in 2009 to ¥8,198,742 ($1,204,174) in 2010. This increase resulted primarily from: (1) our business expansion activities; and (2) our reclassification of expenses according to the branch and project. Selling expenses were 7.48% of total revenues in 2009 and 7.01% of total revenues in 2010. The stability of our selling expenses resulted from the fact that during 2009 and 2010, we were able to generate additional revenues from our existing client base (CNPC and Sinopec) without increasing our marketing efforts. In view of the fact that we will accelerate the development of our business by entering new markets and providing technical services, we expect to see our selling expenses as a percentage of revenue increase. We plan to strengthen our expense controls accordingly.
General and Administrative Expenses. General and administrative expenses consist primarily of costs from our human resources organization, facilities costs, depreciation expenses, professional advisor fees, audit fees and other expenses incurred in connection with general operations. General and administrative expenses increased 137.23%, from ¥5,593,382 in 2009 to ¥13,269,162 ($1,948,883) in 2010. General and administrative expenses were 7.39% of total revenues in 2009 and 11.34% of total revenues in 2010. This was mainly due to: (1) as a public company, we spend more on auditing, public disclosure and other issues associated with being a public company; (2) non-pay cost of incentive options offset a large amount of our profits; and (3) investment in research and development increased. These expenses are necessary and inelastic, we expected our general and administrative expenses of revenue would maintain a relatively high level after going public. We plan offset this negative influence by generating higher revenues and controlling expenses.
Income from Operations. As a result of the factors analyzed above, income from operations was ¥27,942,704 ($4,104,030) for the year ended June 30, 2010, a 49.95%, or 9,308.181, increase from ¥18,634,523 for the same period in 2009. This increase in income from operations can be attributed primarily to the increase in sales volume to CNPC and Sinopec.
Subsidy Income
For the year ended June 30, 2010, we received ¥2,132,880 ($313,263) in subsidy income, approximately the same as that of the prior year. These grants were given by the government: (1) to support local software companies’ research and development activities; and (2) to further reduce the burden of enterprises with high technology and encourage companies to restructure their business. We plan to arrange more research projects and develop more software products to continue seeking such subsidy income in the future.
Income Tax Expense
Income taxes are provided based upon the liability method of accounting pursuant to SFAS No. 109, “Accounting for Income Taxes.” Under this approach, deferred income taxes are recorded to reflect the tax consequences on future years of differences between the tax basis of assets and liabilities and their financial reporting amounts. A valuation allowance is recorded against deferred tax assets if it is not likely that the asset will be realized. We have not been subject to any income taxes in the United States or the Cayman Islands. Enterprises doing business in PRC are generally subject to federal (state) enterprise income tax at a rate of 25%; however, Nanjing Recon and BHD were granted certifications of High Technology Enterprise and are taxed at a rate of 15% for taxable income generated. The applicable tax rate for each of our subsidiaries changed in the past years because of their qualifications and different local policies. For the calendar year 2010, Nanjing Recon and BHD will be taxed at a rate of 15% and ENI is still taxed at 25%. Our effective EIT burden will vary, depending on which of our domestic companies generate greater revenue.
22
Table of Contents
Income tax expense for years ended June 30, 2009 and 2010 were ¥3,677,887 and ¥7,504,877($1,102,264), respectively. This increase resulted from our increased revenues from sales. We expect that our effective EIT will vary, depending on which of our Domestic Companies generate greater revenues, as an increased percentage of revenues from BHD and Nanjing Recon will result in our effective rate moving closer to 15% rate and away from ENI’s 25% rate.
Net Income Attributable to Common Shareholders. As a result of the factors described above, net income attributable to common shareholders was ¥20,058,538 ($2,946,060) for the year ended June 30, 2010, an increase of ¥4,853,217, or 31.92%, from ¥15,205,321 for 2009.
Adjusted EBITDA
| Chinese Yuan (RMB) |
2010 | 2009 | Increase (Decrease) |
Percentage Change |
|||||
| Income from continuing operations |
22,811,319 | 16,885,931 | 5,925,388 | 35.09 | % | ||||
| Income tax expense (benefit) |
7,504,877 | 3,677,887 | 3,826,990 | 104.05 | % | ||||
| Interest expense |
214,431 | 113,179 | 101,252 | 89.46 | % | ||||
| Stock compensation expense |
1,623,034 | — | 1,623,034 | — | |||||
| Depreciation, amortization and accretion |
368,804 | 321,300 | 47,504 | 14.78 | % | ||||
| Adjusted EBITDA |
32,522,465 | 20,998,297 | 11,524,168 | 54.88 | % | ||||
Adjusted EBITDA. We define Adjusted EBITDA as income from continuing operations before income tax expense, interest expense, non-cash stock compensation expense, and depreciation, amortization and accretion expense. We think it is useful to an equity investor in evaluating our operating performance because: (1) it is widely used by investors in our industry to measure a company’s operating performance without regard to items such as interest expense, depreciation and amortization, which can vary substantially from company to company depending upon accounting methods and book value of assets, capital structure and the method by which the assets were acquired; and (2) it helps investors more meaningfully evaluate and compare the results of our operations from period to period by removing the impact of our capital structure and asset base from our operating results.
Adjusted EBITDA increased ¥11,524,168 or 54.88% for the year ended June 30, 2010 compared to the same period in 2009 to ¥20,998,297. Compared to the 31.92% increase in net income available for ordinary shareholders, we believe this can reflect our improvement of operation much better.
Liquidity and Capital Resources
General
Cash and Cash Equivalents. Cash and cash equivalents are comprised of cash on hand, demand deposits and highly liquid short-term debt investments with stated maturities of no more than three months. On June 30, 2010, we had cash and cash equivalents in the amount of ¥12,142,957 ($1,783,473). We believe that anticipated cash flow from operations and the proceeds from our initial public offering will be sufficient to finance our operations for the foreseeable future. We expect that our plan to assume new, larger, more capital-intensive projects will require us to raise additional funds beyond those we currently possess.
Indebtedness. As of June 30, 2010, except for ¥12,368,338 ($1,816,576) of notes payable, we did not have any other outstanding loan capital issued or agreed to be issued, bank overdrafts, loans, debt securities or similar indebtedness, liens, liabilities under acceptance (other than normal trade bills) or acceptance credits, debentures, mortgages, charges, finance leases or hire purchase commitments, guarantees or other material contingent liabilities. In addition, there has not been any material change in our indebtedness, commitments and contingent liabilities since June 30, 2010.
23
Table of Contents
Holding Company Structure. We are a holding company with no operations of our own. All of our operations are conducted through our Chinese subsidiary. As a result, our ability to pay dividends and to finance any debt that we may incur is dependent upon dividends and other distributions paid. In addition, Chinese legal restrictions permit payment of dividends to us by our Chinese subsidiary only out of its accumulated net profit, if any, determined in accordance with Chinese accounting standards and regulations. Under Chinese law, our subsidiary is required to set aside a portion (at least 10%) of its after-tax net income (after discharging all cumulated loss), if any, each year for compulsory statutory reserve until the amount of the reserve reaches 50% of our subsidiaries’ registered capital. These funds may be distributed to shareholders at the time of its wind up. When we were incorporated in the Cayman Islands in August 2007, 5,000,000 ordinary shares were authorized, and 50,000 ordinary shares were issued to Mr. Yin Shenping, Mr. Chen Guangqiang and Mr. Li Hongqi, at a par value of $0.01 each. On December 10, 2007, our company sold 2,632 ordinary shares to an investor at an aggregate consideration of $200,000. On June 8, 2009, in connection with our initial public offering, the Board of Directors approved a 42.7840667-to-1 split of ordinary shares and redeemable ordinary shares to shareholders of record as of such date. After giving effect to the share split of our ordinary shares and the completion of our initial public offering, we had 3,951,811 ordinary shares outstanding.
Off-Balance Sheet Arrangements. We have not entered into any financial guarantees or other commitments to guarantee the payment obligations of any third parties. In addition, we have not entered into any derivative contracts that are indexed to our own shares and classified as shareholders’ equity, or that are not reflected in our financial statements. Furthermore, we do not have any retained or contingent interest in assets transferred to an unconsolidated entity that serves as credit, liquidity or market risk support to such entity. Moreover, we do not have any variable interest in an unconsolidated entity that provides financing, liquidity, market risk or credit support to us or engages in leasing, hedging or research and development services with us.
Operating Cash Flows. To date we have financed our operations primarily through cash flows from financing operations. As of June 30, 2010 we had total assets of ¥176,647,286 ($25,944,728), of which cash amounted to ¥12,142,957 ($1,783,473), and net accounts receivable amounted to ¥89,425,990 ($13,134,270). Working capital amounted to ¥117,601,043 ($17,272,425) and shareholders’ equity amounted to ¥119,083,924 ($17,490,220). The current ratio equaled 3.04 up from 1.90 at June 30, 2009. The increase in this ratio was mainly due to the receipt of proceeds from our IPO and expansion of our business.
Cash from Operating Activities. Net cash used in operating activities was ¥ 53,901,388 ($7,916,662) in 2010. This was an increase of ¥47,865,007 over ¥6,036,381 for the year ended June 30, 2009.
We successfully finished our IPO during this period, changing our operations and causing the following differences: (1) our trade accounts receivable and inventories increased dramatically, due to our business development, seasonality of fund collection and trade accounts receivables from non-related and related parties; (2) our other receivables increased because we assigned procurement agencies to purchase goods for us at a lower cost, since these related projects were not officially begun by then end of fiscal year 2010, we recorded this amount under subject other receivables; and (3) our deferred income due to contracts increased.
Our revenue has been subject to high seasonality and the revenue recognized in the first quarter is usually the smallest in proportion to that for the whole year in most cases, due to our clients’ budgeting and planning schedule. Nevertheless, we continued to experience steady demand for our services from our oil industrial client base.
Cash from Investing Activities. Net cash used in investing activities was ¥260,214 ($38,218) for the year ended June 30, 2010, compared to net cash used in investing activities of ¥952,153 in 2009.
Cash from Financing Activities. Cash flows used in financing activities amounted to ¥63,662,376 ($9,350,288) for the year ended June 30, 2010 and cash flow provided by financing activities amounted to ¥2,078,848 for the year ended June 30, 2009. For the year ended June 30, 2010, cash provided by financing activities mainly included receipt of proceeds from our IPO and funds borrowed from management to support business development.
24
Table of Contents
Working Capital. Total current assets at June 30, 2010 amounted to ¥175,164,405 ($ 25,726,933), an increase of approximately ¥99,938,583 compared to ¥75,225,822 at June 30, 2009. The increase was attributable mainly to proceeds from our IPO and our active business operation.
Current liabilities amounted to ¥57,563,362 ($8,454,508) at June 30, 2010, in comparison to ¥39,594,476 at June 30, 2009. This increase is attributable to an increase in short term notes payable, deferred income and tax payable, and our increased revenues.
The current ratio increased from 1.90 at June 30, 2009 to 3.04 in 2010. The change in our current ratio was primarily due to our IPO and the rapid development of our business that followed.
Operating Lease Agreements
We lease offices in Beijing, Nanjing and Shandong. All related contracts are renewable every year. The commitment amounts for non-cancelable operating leases for the calendar year were as follows:
| Chinese Yuan (RMB) |
U.S. Dollars | |||||
| (Unaudited) | ||||||
| 2010 |
¥ | 407,108 | $ | 59,793 | ||
Recently Issued Accounting Standards
The FASB issued ASU 2010-13, Compensation—Stock Compensation (ACS Topic 718): Effect of Denominating the Exercise Price of a Share-Based Payment Award in the Currency of the Market in Which the Underlying Equity Security Trades. The ASU codifies the consensus reached in Emerging Issues Task Force (EITF) Issue No. 09-J. The amendments to the Codification clarify that an employee share-based payment award with an exercise price denominated in the currency of a market in which a substantial portion of the entity’s equity shares trades should not be considered to contain a condition that is not a market, performance, or service condition. Therefore, an entity would not classify such an award as a liability if it otherwise qualifies as equity.
The amendments in the ASU are effective for fiscal years, and interim periods within those fiscal years, beginning on or after December 15, 2010. Earlier adoption is permitted. The amendments are to be applied by recording a cumulative-effect adjustment to beginning retained earnings. We are currently evaluating the impact of adopting this update on our consolidated financial statements.
In February 2010, FASB issued ASU No. 2010-09 “Subsequent Events” (“ASC Topic 855”) which removes the requirement for an SEC filer to disclose a date in both issued and revised financial statements. This amendment shall be applied prospectively for interim or annual financial periods ending after June 15, 2010. The Company does not believe the adoption will have a material effect on the Company’s consolidated financial statements.
The FASB has issued ASU 2010-06, Fair Value Measurements and Disclosures (ACS Topic 820): Improving Disclosures about Fair Value Measurements. This ASU requires some new disclosures and clarifies some existing disclosure requirements about fair value measurement as set forth in Codification Subtopic 820-10. The FASB’s objective is to improve these disclosures and, thus, increase the transparency in financial reporting. Specifically, ASU 2010-06 amends Codification Subtopic 820-10 to now require:
| • | A reporting entity to disclose separately the amounts of significant transfers in and out of Level 1 and Level 2 fair value measurements and describe the reasons for the transfers; and |
| • | In the reconciliation for fair value measurements using significant unobservable inputs, a reporting entity should present separately information about purchases, sales, issuances, and settlements. |
25
Table of Contents
In addition, ASU 2010-06 clarifies the requirements of the following existing disclosures:
| • | For purposes of reporting fair value measurement for each class of assets and liabilities, a reporting entity needs to use judgment in determining the appropriate classes of assets and liabilities; and |
| • | A reporting entity should provide disclosures about the valuation techniques and inputs used to measure fair value for both recurring and nonrecurring fair value measurements. |
ASU 2010-06 is effective for interim and annual reporting periods beginning after December 15, 2009, except for the disclosures about purchases, sales, issuances, and settlements in the roll forward of activity in Level 3 fair value measurements. Those disclosures are effective for fiscal years beginning after December 15, 2010, and for interim periods within those fiscal years. Early adoption is permitted. This guidance was effective for our third quarter ended March 31, 2010.
Since the filing of our 2009 Form 10-K, the FASB issued ASU No. 2010-1 through No. 2010-21. These ASUs entail technical corrections to existing guidance or affect guidance related to specialized industries or entities and therefore have minimal, if any, impact on the Company.
| Item 7A. | Quantitative and Qualitative Disclosures about Market Risk. |
The Company is not required to provide the information required by this Item because the Company is a smaller reporting company.
| Item 8. | Financial Statements and Supplementary Data. |
The Company’s financial statements and the related notes, together with the report of Hansen Barnett & Maxwell, P.C. for the year ended June 30, 2009 and the report of Bernstein & Pinchuk LLP for the year ended June 30, 2010, are set forth following the signature pages of this report.
| Item 9. | Changes in and Disagreements with Accountants on Accounting and Financial Disclosure. |
None.
Item 9A/9A(T). Controls and Procedures
Disclosure Controls and Procedures
As of June 30, 2010, our company carried out an evaluation, under the supervision of and with the participation of management, including our company’s chief executive officer and chief financial officer, of the effectiveness of the design and operation of our company’s disclosure controls and procedures. Based on the foregoing, the chief executive officer and chief financial officer concluded that our company’s disclosure controls and procedures (as defined in Rules 13a-15(e) and 15d-15(e) under the Securities Exchange Act of 1934) were effective.
Changes in Internal Control over Financial Reporting
There were no changes in our company’s internal control over financial reporting (as defined in Rule 13a-15(f) of the Securities Exchange Act of 1934) during the year ended June 30, 2010 that have materially affected, or are reasonably likely to materially affect, our company’s internal control over financial reporting.
26
Table of Contents
Management’s Annual Report on Internal Control over Financial Reporting
The Company’s management is responsible for establishing and maintaining adequate internal control over financial reporting as defined in Rule 13a-15(f) under the Securities and Exchange Act of 1934, as amended. The Company’s internal control over financial reporting is designed to provide reasonable assurance regarding the reliability of financial reporting and the preparation of financial statements for external purposes in accordance with generally accepted accounting principles. The Company’s internal control over financial reporting includes those policies and procedures that:
(1) pertain to the maintenance of records that, in reasonable detail, accurately and fairly reflect the transactions and dispositions of the Company’s assets;
(2) provide reasonable assurance that transactions are recorded as necessary to permit preparation of financial statements in accordance with U.S. GAAP, and that the Company’s receipts and expenditures are being made only in accordance with the authorization of its management and directors; and
(3) provide reasonable assurance regarding prevention or timely detection of unauthorized acquisition, use or disposition of the Company’s assets that could have a material effect on the financial statements.
The Company’s management assessed the effectiveness of its internal control over financial reporting as of June 30, 2010. In making this assessment, management used the framework set forth in the report entitled Internal Control—Integrated Framework issued by the Committee of Sponsoring Organizations of the Treadway Commission, or COSO. The COSO framework summarizes each of the components of a company’s internal control system, including (i) the control environment, (ii) risk assessment, (iii) control activities, (iv) information and communication, and (v) monitoring. Based on this assessment, the Company’s management believes that, as of June 30, 2010, its internal control over financing reporting is effective based on those criteria.
| Item 9B. | Other Information. |
None.
| Item 10. | Directors, Executive Officers and Corporate Governance. |
Regulation S-K Item 401:
Executive Officers and Directors
The following table sets forth our executive officers and directors, their ages and the positions held by them:
| Name |
Age | Position Held | ||
| Mr. Yin Shenping |
41 | Chief Executive Officer and Director | ||
| Ms. Liu Jia |
27 | Chief Financial Officer | ||
| Mr. Chen Guangqiang |
47 | Chief Technology Officer and Director | ||
| Mr. Li Hongqi |
36 | Chief Marketing Officer and Director | ||
| Mr. Dennis O. Laing |
64 | Independent Director | ||
| Mr. Nelson N.S. Wong |
48 | Independent Director | ||
| Mr. Hu Jijun |
45 | Independent Director | ||
| Ms. Liao Xiaorong |
40 | Independent Director |
Yin Shenping. Mr. Yin is our Chief Executive Officer. In 2003 Mr. Yin founded Nanjing Recon, a Chinese company that provides services to automate and enhance the extraction of petroleum in the PRC, and has been the Chief Executive Officer since that time. Prior to founding Nanjing Recon, Mr. Yin served as a sales manager for Fujian Haitian Network Company from 1992 through 1994. Mr. Yin has founded and operated a number of companies: Xiamen Hengda Haitian Computer Network Co., Ltd. (1994), Baotou Hengda Haitian Computer Network Co., Ltd. (1997) and Beijing Jingke Haitian Electronic Technology Development Co., Ltd. (1999), and Jingsu Huasheng Information Technology Co., Ltd. (2000). In 2000, Mr. Yin merged the former Nanjing Kingsley Software Engineering Co., Ltd. into Nanjing Recon. Mr. Yin received his bachelor’s degree in 1991 from Nanjing Agricultural University in information systems. Mr. Yin has been chosen as a director because he is one of the founders of our company and we believe his knowledge of our company and years of experience in our industry give him the ability to guide our company as a director.
27
Table of Contents
Liu Jia. Ms. Liu has served as our Chief Financial Officer since 2008. In 2008 Ms. Liu assisted Heilongjiang Province Jintian Group with financial due diligence, field surveys and data analysis. While in college Ms. Liu served internships in Xinghua Certified Public Accountants, Ltd.; Beijing Zhongweihuahao Accountants Affairs Office; Tiantong Securities Co., Ltd. and Industrial and Commercial Bank of China, which internships focused on auditing, accounting and data analysis. Ms. Liu received her bachelor’s degree in 2006 from Beijing University of Chemical Technology, School of Economics and Management and her master’s degree in industrial economics in 2009 from Beijing Wuzi University.
Chen Guangqiang. Mr. Chen has served as our Chief Technology Officer since 2003. Mr. Chen was a geological engineer for the Fourth Oil Extraction Plant of Huabei Oil Field from 1985 through 1993. From 1993 through 1999, Mr. Chen was a chief engineer for Xinda Company, CNPC Development Bureau. From 1999 through 2003, Mr. Chen served as the general manager of Beijing Adar. Mr. Chen received his bachelor’s degree in 1985 from Southwest Petroleum Institute. Mr. Chen has been chosen as a director because he is one of the founders of our company and we believe we can benefit from his years of engineering experience and management experience in the oil extraction industry.
Li Hongqi. Mr. Li serves as our Chief Marketing Officer. He founded Jining ENI Energy & Technology Co., Ltd. and served as Chief Marketing Officer since 2003. Mr. Li served as a sales manager for Beijing ITL Fiber-Optic Communication Technology Company from 1994 through 1997. Mr. Li served as a vice sales president for Beijing Oil-Land Trade Company from 1998 through 2003. Mr. Li received his bachelor’s degree in 1996 from the Second Artillery Force Commands Institute. Mr. Li has been chosen as a director because he is one of the founders of our company and we believe we can benefit from his management experience and marketing skills.
Nelson N.S. Wong. Mr. Wong joined our Board of Directors in 2008. In 1990 Mr. Wong joined the Vigers Group, a real estate company that provides services in valuation, corporate property services, investment advisory services, general practice surveying, building surveying, commercial, retail and industrial agency, and property and facilities management. Mr. Wong became the Vice Chairman and CEO of the Vigers Group in 1993. In 1995 Mr. Wong established the ACN Group, a business consulting firm, where he has worked continuously and continues to serve as the Chairman and Managing Partner. Mr. Wong received a bachelor’s degree in arts from the PLA Institute of International Relations in Nanjing in 1983. Mr. Wong has been chosen as a director because we believe we can benefit from his leadership skills and management experience.
Hu Jijun. Mr. Hu joined our Board of Directors in 2008. From 1988 to 2003, Mr. Hu served in a variety of positions at our No. 2 test-drill plant, including technician of installation, assets equipment work, electrical installation, control room production dispatcher, Deputy Chief Engineer of the Technology Battalion, and Deputy Director of Production. From 2003 to 2005 he served as Head of the Integrated Battalion and he is currently the Head of the Transport Battalion, Senior Electric Engineer. Mr. Hu graduated as an automated professional from the China University of Petroleum in 1988. Mr. Hu has been chosen as a director because we believe his years of experience and knowledge gained while working at our No. 2 test-drill plant will prove beneficial to the guidance of our company.
Liao Xiaorong. Ms. Liao joined our Board of Directors in 2008. From 1992 to 1993, Ms. Liao worked for the Liaohe Oilfield. From 1993 to 1995 Ms. Liao served in the Storage and Transportation Room of the Liaohe Oilfield Design Institute. From 2003 through the present, Ms. Liao has served as a Senior Engineer in the finance department of Petroleum Engineering for the Southwest Oil and Gas Branch of Sinopec. Ms. Liao received her degree in oil and gas storage and transportation projects from Southwest Petroleum University. Ms. Liao has been chosen as a director because of her financial expertise as well as her years of experience working in the oil extraction industry.
Dennis O. Laing. Mr. Laing joined our Board of Directors in 2008. Mr. Laing has practiced law in Richmond, Virginia for over 30 years and currently has his own practice, The Law Offices of Dennis O. Laing. Mr. Laing’s law practice centers upon business and corporate law with special interest in energy, healthcare and technology sectors. Mr. Laing received a bachelor’s degree in government from the University of Virginia and a law degree from the University of Richmond. Mr. Laing currently serves as a director of e-Future Information Technology Inc., an enterprise solutions software and services company that is listed on the NASDAQ Capital Market (EFUT), and Sino-Global Shipping America, Ltd., a shipping agency that is listed on the NASDAQ Capital
28
Table of Contents
Market (SINO). Mr. Laing has been chosen as a director because we believe his legal experience as well as his experience serving on the board of another Chinese company listed in the U.S. will be beneficial to the guidance of our company.
Employment Agreements
We have employment agreements with each of our Chief Executive Officer, Chief Technology Officer, Chief Marketing Officer and Chief Financial Officer. With the exception of the employment agreement with our Chief Financial Officer, each of these employment agreements provides for an indefinite term. Such employment agreements may be terminated (1) if the employee gives written notice of his or her intention to resign, (2) the employee is absent from three consecutive meetings of the Board of Directors, without special leave of absence from the other members of the Board of Directors, and the Board of Directors passes a resolution that such employee has vacated his office, or (3) the death, bankruptcy or mental incapacity of the employee. The employment agreement for our Chief Financial Officer provides for a two-year term, currently expiring on March 12, 2011. Such employment agreement may be terminated if the employee gives thirty days’ written notice of her intention to resign, or if the Board of Directors determines she can no longer perform her duties as Chief Financial Officer and provides her with thirty days’ written notice of termination.
Under Chinese law, we may only terminate employment agreements without cause and without penalty by providing notice of non-renewal one month prior to the date on which the employment agreement is scheduled to expire. If we fail to provide this notice or if we wish to terminate an employment agreement in the absence of cause, then we are obligated to pay the employee one month’s salary for each year we have employed the employee. We are, however, permitted to terminate an employee for cause without penalty to our company, where the employee has committed a crime or the employee’s actions or inactions have resulted in a material adverse effect to us.
Share Option Pool
In connection with our initial public offering, we established a pool for share options for the Domestic Companies’ and our employees. This pool contains options to purchase up to 790,362 of our ordinary shares. The options will vest at a rate of 20% per year for five years and have an exercise price of the market price of our shares on the date the options are granted. We have issued 293,000 options out of our employee share option pool.
Board of Directors and Board Committees
Our board of directors currently consists of seven (7) members. There are no family relationships between any of our executive officers and directors.
The directors are divided into three classes, as nearly equal in number as the then total number of directors permits. Class I directors shall face re-election at our annual general meeting of shareholders in 2010 and every three years thereafter. Class II directors shall face re-election at our annual general meeting of shareholders in 2011 and every three years thereafter. Class III directors shall face re-election at our annual general meeting of shareholders in 2012 and every three years thereafter.
If the number of directors changes, any increase or decrease will be apportioned among the classes so as to maintain the number of directors in each class as nearly as possible. Any additional directors of a class elected to fill a vacancy resulting from an increase in such class will hold office for a term that coincides with the remaining term of that class. Decreases in the number of directors will not shorten the term of any incumbent director. These board provisions could make it more difficult for third parties to gain control of our company by making it difficult to replace members of our Board of Directors.
A director may vote in respect of any contract or transaction in which he is interested, provided, however that the nature of the interest of any director in any such contract or transaction shall be disclosed by him at or prior to its consideration and any vote on that matter. A general notice or disclosure to the directors or otherwise contained in the minutes of a meeting or a written resolution of the directors or any committee thereof that a director is a shareholder of any specified firm or company and is to be regarded as interested in any transaction with such firm or company shall be sufficient disclosure and after such general notice it shall not be necessary to give special notice relating to any particular transaction.
29
Table of Contents
There are no membership qualifications for directors. Further, there are no share ownership qualifications for directors unless so fixed by us in a general meeting.
The Board of Directors maintains a majority of independent directors who are deemed to be independent under the definition of independence provided by NASDAQ Stock Market Rule 4200(a)(15). Mr. Laing, Mr. Wong, Mr. Hu, and Ms. Liao are our independent directors.
Mr. Yin Shenping currently holds both the positions of Chief Executive Officer and Chairman of the Board. These two positions have not been consolidated into one position; Mr. Yin simply holds both positions at this time. We do not have a lead independent director because of the foregoing reason and also because we believe our independent directors are encouraged to freely voice their opinions on a relatively small company board. We believe this leadership structure is appropriate because we are a smaller reporting company that recently became listed on a public exchange; as such we deem it appropriate to be able to benefit from the guidance of Mr. Yin as both our principal executive officer and Chairman of the Board.
Our Board of Directors plays a significant role in our risk oversight. The Board of Directors makes all relevant Company decisions. As such, it is important for us to have our Chief Executive Officer serve on the Board as he plays a key role in the risk oversight of the Company. As a smaller reporting company with a small board of directors, we believe it is appropriate to have the involvement and input of all of our directors in risk oversight matters.
Currently, three committees have been established under the board: the audit committee, the compensation committee and the nominating committee. All of these committees consist solely of independent directors.
The audit committee is responsible for overseeing the accounting and financial reporting processes of our company and audits of the financial statements of our company, including the appointment, compensation and oversight of the work of our independent auditors. The audit committee consists solely of independent directors, Mr. Dennis O. Laing, Mr. Nelson N.S. Wong, and Ms. Liao Xiaorong. Mr. Wong qualifies as the audit committee financial expert and serves as the chair of the audit committee.
The compensation committee of the board of directors reviews and makes recommendations to the board regarding our compensation policies for our officers and all forms of compensation, and also administers our incentive compensation plans and equity-based plans (but our board retains the authority to interpret those plans). The compensation committee consists solely of independent directors, Mr. Hu Jijun, Mr. Nelson N.S. Wong, and Ms. Liao Xiaorong. Ms. Liao serves as the chair of the compensation committee.
The nominating committee of the board of directors is responsible for the assessment of the performance of the board, considering and making recommendations to the board with respect to the nominations or elections of directors and other governance issues. The nominating committee considers diversity of opinion and experience when nominating directors. The nominating committee consists solely of independent directors, Mr. Dennis O. Laing, Mr. Hu Jijun, and Ms. Liao Xiaorong. Mr. Laing serves as the chair of the nominating committee.
There are no other arrangements or understandings pursuant to which our directors are selected or nominated.
Duties of Directors
Under Cayman Islands law, our directors have a fiduciary duty to the company to act in good faith in their dealings with or on behalf of our company and exercise their powers and fulfill the duties of their office honestly. This duty has four essential elements:
| • | a duty to act in good faith in the best interests of the company; |
| • | a duty not to personally profit from opportunities that arise from the office of director; |
30
Table of Contents
| • | a duty to avoid conflicts of interest; and |
| • | a duty to exercise powers for the purpose for which such powers were intended. |
In general, Cayman Islands law imposes various duties on directors of a company with respect to certain matters of management and administration of the company. In addition to the remedies available under general law, the Companies Law imposes fines on directors who fail to satisfy some of these requirements. However, in many circumstances, an individual is only liable if he is knowingly guilty of the default or knowingly and willfully authorizes or permits the default. In comparison, under Delaware law, the business and affairs of a corporation are managed by or under the direction of its board of directors. In exercising their powers, directors are charged with a fiduciary duty of care to protect the interests of the corporation and a fiduciary duty of loyalty to act in the best interests of its shareholders. In addition, under Delaware law, a party challenging the propriety of a decision of the directors bears the burden of rebutting the applicability of the presumptions afforded to directors by the “business judgment rule.” If the presumption is not rebutted, the business judgment rule protects the directors and their decisions, and their business judgments will not be second guessed. If the presumption is rebutted, the directors bear the burden of demonstrating the entire fairness of the relevant transaction. Notwithstanding the foregoing, Delaware courts subject directors’ conduct to enhanced scrutiny in respect of defensive actions taken in response to a threat to corporate control and approval of a transaction resulting in a sale of control of the corporation.
Limitation of Director and Officer Liability
Pursuant to our Memorandum and Articles of Association, every director or officer and the personal representatives of the same shall be indemnified and held harmless out of our assets and funds against all actions, proceedings, costs, charges, expenses, losses, damages or liabilities incurred or sustained by him or her in or about the conduct of our business or affairs or in the execution or discharge of his or her duties, powers, authorities or discretions, including without prejudice to the generality of the foregoing, any costs, expenses, losses or liabilities incurred by him in defending (whether successfully or otherwise) any civil proceedings concerning us or our affairs in any court whether in the Cayman Islands or elsewhere. No such director or officer will be liable for: (a) the acts, receipts, neglects, defaults or omissions of any other such Director or officer or agent; or (b) any loss on account of defect of title to any of our properties; or (c) account of the insufficiency of any security in or upon which any of our money shall be invested; or (d) any loss incurred through any bank, broker or other similar person; or (e) any loss occasioned by any negligence, default, breach of duty, breach of trust, error of judgment or oversight on his or her part; or (f) any loss, damage or misfortune whatsoever which may happen in or arise from the execution or discharge of the duties, powers authorities, or discretions of his or her office or in relation thereto, unless the same shall happen through his or her own dishonesty, gross negligence or willful default.
Involvement in Certain Legal Proceedings
To the best of our knowledge, none of our directors or executive officers has been convicted in a criminal proceeding, excluding traffic violations or similar misdemeanors, or has been a party to any judicial or administrative proceeding during the past ten years that resulted in a judgment, decree or final order enjoining the person from future violations of, or prohibiting activities subject to, federal or state securities laws, or a finding of any violation of federal or state securities or commodities laws, any laws respecting financial institutions or insurance companies, any law or regulation prohibiting mail or wire fraud in connection with any business entity or been subject to any disciplinary sanctions or orders imposed by a stock, commodities or derivatives exchange or other self-regulatory organization, except for matters that were dismissed without sanction or settlement.
31
Table of Contents
Regulation S-K Item 405:
Based solely upon a review of Forms 3 and 4 and amendments thereto furnished to the Company under 17 CFR 240.16a-3(e) during its most recent fiscal year and Form 5 and amendments thereto furnished to the Company with respect to its most recent fiscal year, and any written representation referred to in paragraph (b)(1) of this section, the Company is not aware of any director, officer, beneficial owner of more than ten percent of any class of equity securities of the Company registered pursuant to Section 12 that failed to file on a timely basis, as disclosed in the above Forms, reports required by Section 16(a) during the most recent fiscal year or prior years.
Regulation S-K Item 406:
The Company has adopted a Code of Ethics and has filed a copy of the Code of Ethics with the Commission.
Regulation S-K Item 407(c)(3):
None.
Regulation S-K Item 407(d)(4) and (5):
The Board of Directors maintains a majority of independent directors who are deemed to be independent under the definition of independence provided by NASDAQ Stock Market Rule 4200(a)(15). The Company has an audit committee, consisting solely of independent directors of the Company, Mr. Dennis O. Laing, Mr. Nelson N.S. Wong, and Ms. Liao Xiaorong. Mr. Wong qualifies as the audit committee financial expert. The Company’s audit committee charter has been filed as Exhibit 99.1 to the Company’s annual report on Form 10-K for the year ended June 30, 2009 and is available on the Company’s website (www.recon.cn).
| Item 11. | Executive Compensation. |
The following table shows the annual compensation paid by us to Mr. Yin Shenping, our Chief Executive Officer, and Mr. Chen Guangqiang and Mr. Li Hongqi, our two most highly compensated officers other than Mr. Yin Shenping, for the years ended June 30, 2010 and 2009.
Summary Compensation Table
| Name and principal position |
Year | Salary | Bonus | Option Awards |
All Other Compensation |
Total | |||||||||||||
| Yin Shenping, |
2010 | $ | 80,000 | $ | — | $ | 265,200 | (1) | $ | 2,000 | (5) | $ | 347,200 | ||||||
| 2009 | $ | 80,000 | $ | — | $ | — | $ | — | $ | 80,000 | |||||||||
| Chen
Guangqiang, |
2010 | $ | 60,000 | $ | — | $ | 221,000 | (2) | $ | 2,000 | (5) | $ | 283,000 | ||||||
| 2009 | $ | 60,000 | $ | — | $ | — | $ | — | $ | 60,000 | |||||||||
| Li Hongqi, |
2010 | $ | 60,000 | $ | — | $ | 221,000 | (3) | $ | 2,000 | (5) | $ | 283,000 | ||||||
| 2009 | $ | 60,000 | $ | — | $ | — | $ | — | $ | 60,000 | |||||||||
| (1) | On July 30, 2009, 60,000 share options were awarded to Yin Shenping, which options vest over a period of five years, the first 20% of which vested on July 30, 2010. The grant date fair value of such options was $4.42. |
| (2) | On July 30, 2009, 50,000 share options were awarded to Chen Guangqiang, which options vest over a period of five years, the first 20% of which vested on July 30, 2010. The grant date fair value of such options was $4.42. |
| (3) | On July 30, 2009, 50,000 share options were awarded to Li Hongqi, which options vest over a period of five years, the first 20% of which vested on July 30, 2010. The grant date fair value of such options was $4.42. |
| (4) | Did not qualify as named executive officers in 2009, and would not qualify as named executive officers in 2010, but for option awards which have a grant date fair value in excess of $100,000. |
| (5) | Fees paid in cash for services as a director. |
32
Table of Contents
Director Compensation
All directors hold office until the expiration of their respective terms and until their successors have been duly elected and qualified. There are no family relationships among our directors or executive officers. Officers are elected by and serve at the discretion of the Board of Directors. Employee directors and non-voting observers do not receive any compensation for their services. Non-employee directors are entitled to receive $2,000 per Board of Directors meeting attended. In addition, non-employee directors are entitled to receive compensation for their actual travel expenses for each Board of Directors meeting attended.
Summary Director Compensation Table FY 2010
| Name(1) |
Director Fees earned or paid in cash |
Option Awards(2) |
Total(3) | ||||||
| Dennis O. Laing |
$ | 2,000 | $ | 66,300 | $ | 68,300 | |||
| Nelson N.S. Wong |
$ | 2,000 | $ | 79,560 | $ | 81,560 | |||
| Hu Jijun |
$ | 2,000 | $ | 66,300 | $ | 68,300 | |||
| Liao Xiaorong |
$ | 2,000 | $ | 66,300 | $ | 68,300 | |||
| (1) | Compensation for our directors Yin Shenping, Chen Guangqiang and Li Hongqi, who also serve as executive officers, is fully disclosed in the executive compensation table. |
| (2) | On July 30, 2009, share options were awarded to directors as follows: 15,000 share options to Dennis O. Laing, 18,000 share options to Nelson N.S. Wong, 15,000 share options to Hu Jijun, and 15,000 share options to Liao Xiaorong. Such options have a grant date fair value of $4.42 per option. |
| (3) | None of the directors received any ordinary share awards, nonqualified deferred compensation earnings or non-equity incentive plan compensation in fiscal year 2010. |
| Item 12. | Security Ownership of Certain Beneficial Owners and Management and Related Stockholder Matters. |
| Plan category |
Number of securities to be issued upon exercise of outstanding options, warrants and rights (a) |
Weighted-average exercise price of outstanding options, warrants and rights (b) |
Number of securities remaining available for future issuance under equity compensation plans (excluding securities reflected in column (a)) (c) | ||||
| Equity compensation plans approved by security holders |
293,000 | $ | 6.00 | 497,362 | |||
PRINCIPAL SHAREHOLDERS
The following table sets forth information with respect to beneficial ownership of our ordinary shares as of the date of this report, for each person known by us to beneficially own 5% or more of our ordinary shares, and all of our executive officers and directors individually and as a group. Beneficial ownership is determined in accordance with the rules of the SEC and includes voting or investment power with respect to the securities. Except as indicated below, and subject to applicable community property laws, the persons named in the table have sole voting and investment power with respect to all ordinary shares shown as beneficially owned by them. Percentage of beneficial ownership is based on 3,996,411 Shares, which consists of 3,951,811 Shares outstanding as of September 28, 2010 and 44,600 vested options. Our major shareholders do not possess voting rights that differ from our other shareholders. The address of each of the below shareholders is c/o Recon Technology Ltd, Room 1401 Yong Feng Mansion, 123 Jiqing Road, Nanjing, People’s Republic of China 210006.
33
Table of Contents
| Amount of Beneficial Ownership |
Percentage Ownership |
||||
| Mr. Yin Shenping (1) |
631,761 | 15.81 | % | ||
| Mr. Li Hongqi (2) |
843,681 | 21.11 | % | ||
| Mr. Chen Guangqiang (3) |
629,761 | 15.76 | % | ||
| Mr. Hu Jijun (4) |
3,000 | * | % | ||
| Ms. Liao Xiaorong (5) |
3,000 | * | % | ||
| Mr. Dennis O. Laing (6) |
3,500 | * | % | ||
| Mr. Nelson Wong (7) |
3,600 | * | % | ||
| Total |
2,118,303 | 53.01 | % | ||
| Directors and Executive Officers as a Group (seven members) |
2,118,303 | 53.01 | % |
| (1) | Includes 12,000 options to purchase ordinary shares which vested on July 30, 2010. |
| (2) | Includes 10,000 options to purchase ordinary shares which vested on July 30, 2010. |
| (3) | Includes 10,000 options to purchase ordinary shares which vested on July 30, 2010. |
| (4) | Includes 3,000 options to purchase ordinary shares which vested on July 30, 2010. |
| (5) | Includes 3,000 options to purchase ordinary shares which vested on July 30, 2010. |
| (6) | Includes 3,000 options to purchase ordinary shares which vested on July 30, 2010. |
| (7) | Includes 3,600 options to purchase ordinary shares which vested on July 30, 2010. |
| * | Less than 1%. |
| Item 13. | Certain Relationships and Related Transactions, and Director Independence. |
Contractual Arrangements with Domestic Companies and their Shareholders
Our relationships with the Domestic Companies and their shareholders are governed by a series of contractual arrangements. The term of each agreement is 25 years, and our company (or Recon-JN to the extent we are not a party to the agreement in question) is able to renew each agreement unilaterally for one or more additional terms, provided such renewal is permitted under applicable law at the time.
Equity Interest Pledge Agreement. Recon-JN and the shareholders of each of the Domestic Companies have entered into Equity Interest Pledge Agreements, pursuant to which each shareholder pledges all of his shares of the Domestic Company to Recon-JN in order to guarantee cash-flow payments under the applicable Exclusive Technical Consulting Service Agreement.
Exclusive Equity Interest Purchase Agreement. Each of the shareholders of each of the Domestic Companies has entered into an Exclusive Equity Interest Purchase Agreement, which provides that Recon-HK will be entitled to acquire the Domestic Company’s shares from its current shareholders upon certain terms and conditions, if such a purchase is or becomes allowable under PRC laws and regulations. If the shares are acquired under the Exclusive Equity Interest Purchase Agreement, the purchase price will be determined at the time of exercise by negotiation but will be the lowest price permitted at such time under Chinese law. Recon-HK has not yet taken any corporate action to exercise this right of purchase, and there is no guarantee that it will do so or will be permitted to do so by applicable law at such time as it may wish to do so.
Exclusive Technical Consulting Service Agreement. Each of the Domestic Companies and Recon-JN has entered into an Exclusive Technical Consulting Service Agreement, which provides that Recon-JN will be the exclusive provider of technology services to the Domestic Company and that the Domestic Company will pay 90% of net profits to Recon-JN for such services. Payments will be made on a quarterly basis, with any over- or underpayment to be reconciled once each Domestic Company’s annual net profits are determined at its fiscal year end. Any such payment from Recon-JN to Recon-CI would need to comply with applicable Chinese laws affecting payments from Chinese companies to non-Chinese companies.
The remaining 10% of net profits is restricted by the Equity Pledge Agreement, which entitles Recon-JN to collect dividends from each Domestic Company during the term of the pledge. Because the pledge remains in effect to guarantee payment under the Exclusive Technical Consulting Service Agreement, Mr. Yin, Mr. Li, and Mr. Chen will not have any right to receive any dividends from the Domestic Companies if they are declared.
34
Table of Contents
Operating Agreement. Pursuant to the operating agreement among Recon-JN, each Domestic Company and each of Mr. Yin, Mr. Li and Mr. Chen, Recon-JN provides guidance and instructions on each Domestic Company’s daily operations and financial affairs. The shareholders of each Domestic Company must designate the candidates recommended by Recon-JN as their representatives on their respective boards of directors. Recon-JN has the right to appoint senior executives of each Domestic Company. In addition, Recon-JN agrees to guarantee each Domestic Company’s performance under any agreements or arrangements relating to the Domestic Company’s business arrangements with any third party. Each Domestic Company, in return, agrees to pledge its accounts receivable and all of its assets to Recon-JN. Moreover, each Domestic Company agrees that without the prior consent of Recon-JN, the Domestic Company will not engage in any transactions that could materially affect its assets, liabilities, rights or operations, including, without limitation, incurrence or assumption of any indebtedness, sale or purchase of any assets or rights, incurrence of any encumbrance on any of its assets or intellectual property rights in favor of a third party or transfer of any agreements relating to its business operation to any third party.
Powers of Attorney. Each of Mr. Yin, Mr. Li and Mr. Chen has executed an irrevocable power of attorney to authorize Recon-JN to exercise any and all shareholder rights associated with his ownership in each of the Domestic Companies, including the right to attend shareholders’ meetings, the right to execute shareholders’ resolutions, the right to sell, assign, transfer or pledge any or all of the equity interest in each Domestic Company, and the right to vote such equity interest for any and all matters. Because Recon-JN has the authority to exercise all shareholder rights, only Recon-JN (and our company by virtue of our ownership of Recon-JN) may declare dividends in the Domestic Companies.
Director Independence
The Board of Directors maintains a majority of independent directors who are deemed to be independent under the definition of independence provided by NASDAQ Stock Market Rule 4200(a)(15).
Other than as described therein, no transactions required to be disclosed under Item 404 of Regulation S-K have occurred since the beginning of the Company’s last fiscal year.
| Item 14. | Principal Accountant Fees and Services. |
Bernstein & Pinchuk LLP was appointed by the Company to serve as its independent registered public accounting firm for fiscal 2010. Audit services provided by Bernstein & Pinchuk LLP for fiscal 2010 included the examination of the consolidated financial statements of the Company’s and services related to periodic filings made with the SEC. Hansen Barnett & Maxwell, P.C. was appointed by the Company to serve as its independent registered public accounting firm for fiscal 2009. Audit services provided by Hansen Barnett & Maxwell, P.C. for fiscal 2009 included the examination of the consolidated financial statements of the Company; and services related to periodic filings made with the SEC.
Fees Paid To Independent Registered Public Accounting Firm
Audit Fees
During fiscal 2010, Bernstein & Pinchuk LLP’s fees for the annual audit of our financial statements and the quarterly reviews of the financial statements were $135,000.
During fiscal 2009, Hansen Barnett & Maxwell, P.C.’s fees for the annual audit of our financial statements and the quarterly reviews of the financial statements were $212,259.
Audit Related Fees
During fiscal 2010, the Company paid Bernstein & Pinchuk LLP $14,750 for audit-related services. These services consisted of advice relating to SEC matters and the filing of a registration statement.
35
Table of Contents
During fiscal 2010, the Company paid Hansen Barnett & Maxwell, P.C., 35,277.25 for audit related services. These services related to the filing of a registration statement
During fiscal 2009, the Company paid Hansen Barnett & Maxwell, P.C. $55,000 for audit-related services. These services consisted of assurance and related services that were reasonably related to the performance of the audit and reviews of our financial statements and are not included in “Audit Fees” above. The services provided by our accountants within this category consisted of advice relating to SEC matters and the filing of our registration statement and amendments thereto.
Tax Fees
The Company did not pay Bernstein & Pinchuk LLP for tax services in fiscal 2010.
The Company did not pay Hansen Barnett & Maxwell, P.C. for tax services in fiscal 2009.
All Other Fees
The Company did not pay Bernstein & Pinchuk LLP for any other services in fiscal 2010.
The Company did not pay Hansen Barnett & Maxwell, P.C. for any other services in fiscal 2009.
Audit Committee Pre-Approval Policies
Before Hansen Barnett & Maxwell, P.C. and Bernstein & Pinchuk LLP were engaged by the Company to render audit or non-audit services, their engagements were approved by the Company’s audit committee. All services rendered by Hansen Barnett & Maxwell, P.C. and Bernstein & Pinchuk LLP have been so approved.
| Item 15. | Exhibits, Financial Statement Schedules. |
The following documents are filed herewith:
| Number |
Exhibit | |
| 3.1 | Amended and Restated Articles of Association of the Registrant (1) | |
| 3.2 | Amended and Restated Memorandum of Association of the Registrant (1) | |
| 4.1 | Specimen Share Certificate (1) | |
| 10.1 | Translation of Exclusive Technical Consulting Service Agreement between Recon Technology (Jining) Co., Ltd. and Beijing BHD Petroleum Technology Co., Ltd. (1) | |
| 10.2 | Translation of Power of Attorney for rights of Chen Guangqiang in Beijing BHD Petroleum Technology Co., Ltd. (1) | |
| 10.3 | Translation of Power of Attorney for rights of Yin Shenping in Beijing BHD Petroleum Technology Co., Ltd. (1) | |
| 10.4 | Translation of Power of Attorney for rights of Li Hongqi in Beijing BHD Petroleum Technology Co., Ltd. (1) | |
| 10.5 | Translation of Exclusive Equity Interest Purchase Agreement between Recon Technology (Jining) Co. Ltd., Chen Guangqiang and Beijing BHD Petroleum Technology Co., Ltd. (1) | |
| 10.6 | Translation of Exclusive Equity Interest Purchase Agreement between Recon Technology (Jining) Co. Ltd., Yin Shenping and Beijing BHD Petroleum Technology Co., Ltd. (1) | |
| 10.7 | Translation of Exclusive Equity Interest Purchase Agreement between Recon Technology (Jining) Co. Ltd., Li Hongqi and Beijing BHD Petroleum Technology Co., Ltd. (1) | |
36
Table of Contents
| 10.8 | Translation of Equity Interest Pledge Agreement between Recon Technology (Jining) Co., Ltd., Chen Guangqiang and Beijing BHD Petroleum Technology Co., Ltd. (1) | |
| 10.9 | Translation of Equity Interest Pledge Agreement between Recon Technology (Jining) Co., Ltd., Yin Shenping and Beijing BHD Petroleum Technology Co., Ltd. (1) | |
| 10.10 | Translation of Equity Interest Pledge Agreement between Recon Technology (Jining) Co., Ltd., Li Hongqi and Beijing BHD Petroleum Technology Co., Ltd. (1) | |
| 10.11 | Translation of Exclusive Technical Consulting Service Agreement between Recon Technology (Jining) Co., Ltd. and Jining ENI Energy Technology Co., Ltd. (1) | |
| 10.12 | Translation of Power of Attorney for rights of Chen Guangqiang in Jining ENI Energy Technology Co., Ltd. (1) | |
| 10.13 | Translation of Power of Attorney for rights of Yin Shenping in Jining ENI Energy Technology Co., Ltd. (1) | |
| 10.14 | Translation of Power of Attorney for rights of Li Hongqi in Jining ENI Energy Technology Co., Ltd. (1) | |
| 10.15 | Translation of Exclusive Equity Interest Purchase Agreement between Recon Technology (Jining) Co. Ltd., Chen Guangqiang and Jining ENI Energy Technology Co., Ltd. (1) | |
| 10.16 | Translation of Exclusive Equity Interest Purchase Agreement between Recon Technology (Jining) Co. Ltd., Yin Shenping and Jining ENI Energy Technology Co., Ltd. (1) | |
| 10.17 | Translation of Exclusive Equity Interest Purchase Agreement between Recon Technology (Jining) Co. Ltd., Li Hongqi and Jining ENI Energy Technology Co., Ltd. (1) | |
| 10.18 | Translation of Equity Interest Pledge Agreement between Recon Technology (Jining) Co., Ltd., Chen Guangqiang and Jining ENI Energy Technology Co., Ltd. (1) | |
| 10.19 | Translation of Equity Interest Pledge Agreement between Recon Technology (Jining) Co., Ltd., Yin Shenping and Jining ENI Energy Technology Co., Ltd. (1) | |
| 10.20 | Translation of Equity Interest Pledge Agreement between Recon Technology (Jining) Co., Ltd., Li Hongqi and Jining ENI Energy Technology Co., Ltd. (1) | |
| 10.21 | Translation of Exclusive Technical Consulting Service Agreement between Recon Technology (Jining) Co., Ltd. and Nanjing Recon Technology Co., Ltd. (1) | |
| 10.22 | Translation of Power of Attorney for rights of Chen Guangqiang in Nanjing Recon Technology Co., Ltd. (1) | |
| 10.23 | Translation of Power of Attorney for rights of Yin Shenping in Nanjing Recon Technology Co., Ltd. (1) | |
| 10.24 | Translation of Power of Attorney for rights of Li Hongqi in Nanjing Recon Technology Co., Ltd. (1) | |
| 10.25 | Translation of Exclusive Equity Interest Purchase Agreement between Recon Technology (Jining) Co. Ltd., Chen Guangqiang and Nanjing Recon Technology Co., Ltd. (1) | |
| 10.26 | Translation of Exclusive Equity Interest Purchase Agreement between Recon Technology (Jining) Co. Ltd., Yin Shenping and Nanjing Recon Technology Co., Ltd. (1) | |
| 10.27 | Translation of Exclusive Equity Interest Purchase Agreement between Recon Technology (Jining) Co. Ltd., Li Hongqi and Nanjing Recon Technology Co., Ltd. (1) | |
| 10.28 | Translation of Equity Interest Pledge Agreement between Recon Technology (Jining) Co., Ltd., Chen Guangqiang and Nanjing Recon Technology Co., Ltd. (1) | |
| 10.29 | Translation of Equity Interest Pledge Agreement between Recon Technology (Jining) Co., Ltd., Yin Shenping and Nanjing Recon Technology Co., Ltd. (1) | |
| 10.30 | Translation of Equity Interest Pledge Agreement between Recon Technology (Jining) Co., Ltd., Li Hongqi and Nanjing Recon Technology Co., Ltd. (1) | |
37
Table of Contents
| 14.1 | Code of Ethics of the Company. (2) | |
| 21.1 | List of subsidiaries of the Company. (1) | |
| 31.1 | Certifications pursuant to Rule 13a-14(a) or 15d-14(a) under the Securities Exchange Act of 1934, as amended, as adopted pursuant to Section 302 of the Sarbanes-Oxley Act of 2002. (3) | |
| 31.2 | Certifications pursuant to Rule 13a-14(a) or 15d-14(a) under the Securities Exchange Act of 1934, as amended, as adopted pursuant to Section 302 of the Sarbanes-Oxley Act of 2002. (3) | |
| 32.1 | Certifications pursuant to 18 U.S.C. Section 1350, as adopted pursuant to Section 906 of the Sarbanes-Oxley Act of 2002. (3) | |
| 32.2 | Certifications pursuant to 18 U.S.C. Section 1350, as adopted pursuant to Section 906 of the Sarbanes-Oxley Act of 2002. (3) | |
| 99.1 | Audit Committee Charter (2) | |
| (1) | Incorporated by reference to the Company’s Registration Statement on Form S-1, Registration No. 333-152964. |
| (2) | Incorporated by reference to the Company’s Annual Report of Form 10-K for the fiscal year ended June 30, 2009, filed with the SEC on September 28, 2009. |
| (3) | Filed herewith. |
38
Table of Contents
SIGNATURES
In accordance with the requirements of the Exchange Act, the Company caused this report to be signed on its behalf by the undersigned, thereunto duly authorized.
| RECON TECHNOLOGY, LTD | ||||
| September 27, 2010 | By: | /s/ Liu Jia | ||
| Liu Jia | ||||
| Chief Financial Officer | ||||
| (Principal Financial and Accounting Officer) | ||||
Pursuant to the requirements of the Exchange Act, this report has been signed by the following persons in the capacities and on the dates indicated:
| Signature |
Title |
Date | ||
| /s/ Yin Shenping |
Chief Executive Officer and Director |
September 27, 2010 | ||
| Yin Shenping | (Principal Executive Officer) | |||
| /s/ Chen Guangqiang |
Chief Technology Officer and Director | September 27, 2010 | ||
| Chen Guangqiang | ||||
| /s/ Li Hongqi |
Chief Marketing Officer and Director | September 27, 2010 | ||
| Li Hongqi | ||||
| /s/ Dennis O. Laing |
Director (Authorized Representative in the United States) | September 27, 2010 | ||
| Dennis O. Laing | ||||
|
|
Director | September 27, 2010 | ||
| Nelson N.S. Wong | ||||
|
|
Director | September 27, 2010 | ||
| Hu Jijun | ||||
|
|
Director | September 27, 2010 | ||
| Liao Xiaorong | ||||
39
Table of Contents
Table of Contents

To the Board of Directors and Stockholders of
Recon Technology, Ltd
We have audited the accompanying consolidated balance sheet of Recon Technology, Ltd (the “Company”) as of June 30, 2010 and the related consolidated statements of income, comprehensive income, stockholders’ equity and cash flows for the year ended June 30, 2010. These financial statements are the responsibility of the Company’s management. Our responsibility is to express an opinion on these consolidated financial statements based on our audit.
We conducted our audit in accordance with the standards of the Public Company Accounting Oversight Board (United States). Those standards require that we plan and perform the audit to obtain reasonable assurance about whether the financial statements are free of material misstatement. The Company is not required to have, nor were we engaged to perform, an audit of its internal control over financial reporting. Our audit included consideration of internal control over financial reporting as a basis for designing audit procedures that are appropriate in the circumstances, but not for the purpose of expressing an opinion on the effectiveness of the Company’s internal control over financial reporting. Accordingly, we express no such opinion. An audit also includes examining, on a test basis, evidence supporting the amounts and disclosures in the financial statements, assessing the accounting principles used and significant estimates made by management, as well as evaluating the overall financial statement presentation. We believe that our audit provides a reasonable basis for our opinion.
In our opinion, the consolidated financial statements referred to above present fairly, in all material respects, the financial position of Recon Technology, Ltd at June 30, 2010, and the results of its operations and its cash flows for the year ended June 30, 2010, in conformity with accounting principles generally accepted in the United States of America.
/s/ Bernstein Pinchuk LLP
New York, NY
September 27, 2010

F-1
Table of Contents
| HANSEN, BARNETT & MAXWELL, P.C. A Professional Corporation CERTIFIED PUBLIC ACCOUNTANTS 5 Triad Center, Suite 750 Salt Lake City, UT 84180-1128 Phone: (801) 532-2200 Fax: (801) 532-7944 www.hbmcpas.com |
Registered with the Public Company Accounting Oversight Board
| |

REPORT OF INDEPENDENT REGISTERED PUBLIC ACCOUNTING FIRM
To the Board of Directors and the
Shareholders of Recon Technology, Ltd.
We have audited the accompanying consolidated balance sheet of Recon Technology, Ltd. (the Company) as of June 30, 2009, and the related consolidated statements of income and comprehensive income, cash flows, and changes in shareholders’ equity for the year ended June 30, 2009. The Company’s management is responsible for these financial statements. Our responsibility is to express an opinion on these financial statements based on our audit.
We conducted our audit in accordance with the standards of the Public Company Accounting Oversight Board (United States). Those standards require that we plan and perform the audit to obtain reasonable assurance about whether the financial statements are free of material misstatement. The Company is not required to have, nor were we engaged to perform, an audit of its internal control over financial reporting. Our audit included consideration of internal control over financial reporting as a basis for designing audit procedures that are appropriate in the circumstances, but not for the purpose of expressing an opinion on the effectiveness of the Company’s internal control over financial reporting. Accordingly, we express no such opinion. An audit includes examining, on a test basis, evidence supporting the amounts and disclosures in the financial statements, assessing the accounting principles used and significant estimates made by management, as well as evaluating the overall financial statement presentation. We believe our audit provide a reasonable basis for our opinion.
In our opinion, the consolidated financial statements referred to above present fairly, in all material respects, the financial position of Recon Technology, Ltd. as of June 30, 2009, and the results of its operations and its cash flows for the year ended June 30, 2009 in conformity with accounting principles generally accepted in the United States of America.
/s/ HANSEN, BARNETT & MAXWELL, P.C.
HANSEN, BARNETT & MAXWELL, P.C.
Salt Lake City, Utah
September 23, 2009
F-2
Table of Contents
CONSOLIDATED BALANCE SHEETS
RECON TECHNOLOGY, LTD
CONSOLIDATED STATEMENTS OF BALANCE SHEETS
| As of June 30, | |||||||||||
| 2009 | 2010 | 2010 | |||||||||
| RMB | RMB | U.S. Dollars | |||||||||
| ASSETS |
|||||||||||
| Current assets |
|||||||||||
| Cash and cash equivalents |
¥ | 2,727,735 | ¥ | 12,142,957 | $ | 1,783,473 | |||||
| Trade accounts receivable, net of allowance for doubtful accounts of ¥604,953 and ¥1,089,331($159,993) for 2009 and 2010, respectively |
44,103,981 | 89,425,990 | 13,134,270 | ||||||||
| Trade accounts receivable-related parties, net of allowance for doubtful accounts of ¥350,498 for 2009 |
7,458,302 | — | — | ||||||||
| Other receivables, net |
2,048,015 | 12,850,547 | 1,887,399 | ||||||||
| Other receivables-related parties, net |
507,541 | — | — | ||||||||
| Purchase advances |
5,637,082 | 46,551,402 | 6,837,147 | ||||||||
| Purchase advances-related parties |
73,028 | — | — | ||||||||
| Prepaid expenses |
338,072 | 766,638 | 112,598 | ||||||||
| Inventories |
10,710,018 | 13,150,911 | 1,931,515 | ||||||||
| Deferred tax assets |
— | 275,960 | 40,531 | ||||||||
| Deferred offering costs |
1,622,048 | — | — | ||||||||
| Total current assets |
75,225,822 | 175,164,405 | 25,726,933 | ||||||||
| Property and equipment, net of accumulated depreciation |
1,406,876 | 1,482,881 | 217,795 | ||||||||
| ¥ | 76,632,698 | ¥ | 176,647,286 | $ | 25,944,728 | ||||||
| LIABILITIES AND SHAREHOLDERS’ EQUITY |
|||||||||||
| Current liabilities |
|||||||||||
| Trade accounts payable |
¥ | 15,601,101 | ¥ | 16,536,796 | $ | 2,428,810 | |||||
| Trade accounts payable-related parties |
189,744 | — | — | ||||||||
| Other payables |
1,767,005 | 3,096,309 | 454,764 | ||||||||
| Other payables-related parties |
73,579 | — | — | ||||||||
| Deferred income |
2,361,605 | 4,267,711 | 626,812 | ||||||||
| Advances from customers |
910,215 | 439,761 | 64,589 | ||||||||
| Accrued payroll and employees’ welfare |
393,074 | 360,540 | 52,954 | ||||||||
| Accrued expenses |
262,083 | 290,803 | 42,711 | ||||||||
| Taxes payable |
9,182,676 | 20,203,104 | 2,967,292 | ||||||||
| Short-term notes payable |
3,143,792 | 5,024,881 | 738,020 | ||||||||
| Short-term notes payable-related parties |
3,344,377 | 7,343,457 | 1,078,556 | ||||||||
| Deferred tax liabilities |
2,365,225 | — | — | ||||||||
| Total current liabilities |
39,594,476 | 57,563,362 | 8,454,508 | ||||||||
| Redeemable ordinary shares |
1,434,342 | — | — | ||||||||
| Commitments and Contingencies |
|||||||||||
| Shareholders’ equity |
|||||||||||
| Ordinary shares, $0.0185 U.S. dollar par value, 25,000,000 shares authorized; 2,139,203 and 3,951,811 shares issued and outstanding at June 30, 2009 and 2010 |
300,534 | 529,979 | 77,840 | ||||||||
| Additional paid-in capital |
8,732,266 | 69,257,098 | 10,172,003 | ||||||||
| Appropriated retained earnings |
1,687,772 | 3,755,503 | 551,582 | ||||||||
| Unappropriated retained earnings |
18,043,692 | 36,034,500 | 5,292,498 | ||||||||
| Accumulated other comprehensive loss |
— | (76,997 | ) | (11,311 | ) | ||||||
| Total controlling shareholders’ equity |
28,764,264 | 109,500,083 | 16,082,612 | ||||||||
| Non-controlling interest, net of tax |
6,839,616 | 9,583,841 | 1,407,608 | ||||||||
| Total shareholders’ equity |
35,603,880 | 119,083,924 | 17,490,220 | ||||||||
| ¥ | 76,632,698 | ¥ | 176,647,286 | $ | 25,944,728 | ||||||
See notes to the consolidated financial statements
F-3
Table of Contents
CONSOLIDATED STATEMENTS OF INCOME AND COMPREHENSIVE INCOME
| For the Years ended June 30, | ||||||||||||
| 2009 | 2010 | 2010 | ||||||||||
| RMB | RMB | U.S. Dollars | ||||||||||
| Revenues |
||||||||||||
| Hardware |
¥ | 70,121,586 | ¥ | 108,351,654 | $ | 15,913,940 | ||||||
| Service |
1,495,662 | 750,769 | 110,268 | |||||||||
| Software |
226,496 | 7,901,709 | 1,160,548 | |||||||||
| Hardware-related parties |
2,143,590 | — | — | |||||||||
| Software-related parties |
1,659,573 | — | — | |||||||||
| Total revenues |
75,646,907 | 117,004,132 | 17,184,756 | |||||||||
| Cost of revenues |
45,758,804 | 67,593,524 | 9,927,669 | |||||||||
| Gross margin |
29,888,103 | 49,410,608 | 7,257,087 | |||||||||
| Selling and distribution expenses |
5,660,198 | 8,198,742 | 1,204,174 | |||||||||
| General and administrative expenses |
5,593,382 | 13,269,162 | 1,948,883 | |||||||||
| Operating expenses |
11,253,580 | 21,467,904 | 3,153,057 | |||||||||
| Income from operations |
18,634,523 | 27,942,704 | 4,104,030 | |||||||||
| Other income (expenses) |
||||||||||||
| Subsidy income |
2,038,015 | 2,132,880 | 313,263 | |||||||||
| Interest income |
15,159 | 10,476 | 1,539 | |||||||||
| Interest expense |
(113,179 | ) | (214,431 | ) | (31,494 | ) | ||||||
| Other income (expenses) |
(10,700 | ) | 444,567 | 65,295 | ||||||||
| 1,929,295 | 2,373,492 | 348,603 | ||||||||||
| Income before income taxes and non-controlling interest |
20,563,818 | 30,316,196 | 4,452,633 | |||||||||
| Provision for income taxes |
(3,677,887 | ) | (7,504,877 | ) | (1,102,264 | ) | ||||||
| Net income before allocation to noncontrolling interests |
16,885,931 | 22,811,319 | 3,350,369 | |||||||||
| Less: Net income attributable to noncontrolling interest |
(1,629,056 | ) | (2,752,780 | ) | (404,309 | ) | ||||||
| Accrued dividend for redeemable ordinary shares |
(51,554 | ) | — | — | ||||||||
| Net income attributable to common shareholders |
15,205,321 | 20,058,539 | 2,946,060 | |||||||||
| Net income from operations |
16,885,931 | 22,811,319 | 3,350,369 | |||||||||
| Net income attributable to common shareholders |
15,205,321 | 20,058,539 | 2,946,060 | |||||||||
| Comprehensive income |
||||||||||||
| Net income from operations |
16,885,931 | 22,811,319 | 3,350,369 | |||||||||
| Foreign currency translation adjustment |
— | (85,552 | ) | (12,565 | ) | |||||||
| Comprehensive income |
16,885,931 | 22,725,767 | 3,337,804 | |||||||||
| Comprehensive income attributable to non-controlling interests |
(1,629,056 | ) | (2,744,225 | ) | (403,053 | ) | ||||||
| Comprehensive income attributable to redeemable common shares |
(51,554 | ) | — | — | ||||||||
| Comprehensive income attributable to common shareholders |
¥ | 15,205,321 | ¥ | 19,981,542 | $ | 2,934,751 | ||||||
| Earnings per common share - basic |
||||||||||||
| Net income attributable to common shareholders |
¥ | 7.11 | ¥ | 5.26 | $ | 0.77 | ||||||
| Earnings per common share - diluted |
||||||||||||
| Net income attributable to common shareholders |
¥ | 6.75 | ¥ | 5.23 | $ | 0.77 | ||||||
| Weighted - average shares -basic |
2,139,203 | 3,812,085 | 3,812,085 | |||||||||
| Weighted - average shares -diluted |
2,251,811 | 3,836,469 | 3,836,469 | |||||||||
See notes to the consolidated financial statements
F-4
Table of Contents
CONSOLIDATED STATEMENTS OF CASH FLOWS
| For the Years ended June 30, | ||||||||||||
| 2009 | 2010 | 2010 | ||||||||||
| RMB | RMB | U.S. Dollars | ||||||||||
| Cash flows from operating activities: |
||||||||||||
| Net income before allocation to noncontrolling interests |
¥ | 16,885,931 | ¥ | 22,811,319 | $ | 3,350,369 | ||||||
| Adjustments to reconcile net income before noncontrolling interests to net cash provided by operating activities: |
||||||||||||
| Depreciation |
321,300 | 368,804 | 54,167 | |||||||||
| Loss from disposal of office equipment |
— | 9,715 | 1,427 | |||||||||
| Stock based payment |
— | 1,623,034 | 238,380 | |||||||||
| Accrued dividend for redeemable common stock |
(5,855 | ) | — | — | ||||||||
| Movement of deferred taxation |
3,986,259 | (2,641,185 | ) | (387,919 | ) | |||||||
| Changes in operating assets and liabilities: |
||||||||||||
| Trade accounts receivable, net |
(22,988,109 | ) | (45,322,009 | ) | (6,656,583 | ) | ||||||
| Trade accounts receivable-related parties, net |
(1,105,319 | ) | 7,458,302 | 1,095,424 | ||||||||
| Other receivables, net |
343,000 | (8,367,477 | ) | (1,228,957 | ) | |||||||
| Other receivables related parties, net |
(407,991 | ) | 507,541 | 74,544 | ||||||||
| Purchase advance, net |
(2,066,514 | ) | (40,914,320 | ) | (6,009,212 | ) | ||||||
| Purchase advance-related party, net |
(50,790 | ) | 73,028 | 10,726 | ||||||||
| Prepaid expense |
(225,097 | ) | (428,566 | ) | (62,945 | ) | ||||||
| Inventories |
(1,933,901 | ) | (2,440,893 | ) | (358,501 | ) | ||||||
| Trade accounts payable |
6,774,850 | 935,695 | 137,428 | |||||||||
| Trade accounts payable-related parties |
(1,067,534 | ) | (189,744 | ) | (27,868 | ) | ||||||
| Other payables |
(2,080,751 | ) | 236,681 | 34,762 | ||||||||
| Other payables-related parties |
(980,280 | ) | (73,579 | ) | (10,807 | ) | ||||||
| Deferred income |
(2,182,086 | ) | 1,906,106 | 279,956 | ||||||||
| Advances from customers |
(158,096 | ) | (470,454 | ) | (69,097 | ) | ||||||
| Accrued employees’ welfare |
(72,802 | ) | (32,534 | ) | (4,778 | ) | ||||||
| Accrued expenses |
(561 | ) | 28,720 | 4,218 | ||||||||
| Taxes payable |
977,966 | 11,020,428 | 1,618,604 | |||||||||
| Net cash used in operating activities |
(6,036,381 | ) | (53,901,388 | ) | (7,916,662 | ) | ||||||
| Cash flows from investing activities: |
||||||||||||
| Purchases of property and equipment |
(952,153 | ) | (260,214 | ) | (38,218 | ) | ||||||
| Net cash used in investing activities |
(952,153 | ) | (260,214 | ) | (38,218 | ) | ||||||
| Cash flows from financing activities: |
||||||||||||
| Proceeds from stock issuance |
— | 59,318,949 | 8,712,356 | |||||||||
| Proceeds from short-term notes payable |
1,842,896 | 1,881,089 | 276,281 | |||||||||
| Proceeds from short-term notes payable-related party |
1,858,000 | 3,999,080 | 587,357 | |||||||||
| Payments for initial public offering cost |
(1,622,048 | ) | — | — | ||||||||
| Loan to third-party companies |
— | (1,536,742 | ) | (225,706 | ) | |||||||
| Net cash provided by financing activities |
2,078,848 | 63,662,376 | 9,350,288 | |||||||||
| Effect of exchange rate fluctuation on cash and cash equivalent |
— | (85,552 | ) | (12,565 | ) | |||||||
| Net increase (decrease) in cash and cash equivalent |
(4,909,686 | ) | 9,415,222 | 1,382,842 | ||||||||
| Cash and cash equivalents at beginning of year |
7,637,421 | 2,727,735 | 400,631 | |||||||||
| Cash and cash equivalents at end of year |
¥ | 2,727,735 | ¥ | 12,142,957 | $ | 1,783,473 | ||||||
| Supplemental cash flow information |
||||||||||||
| Cash paid during the year for interest |
¥ | — | ¥ | 6,000 | $ | 881 | ||||||
| Cash paid during the year for taxes |
¥ | 9,578,370 | ¥ | 2,223,959 | $ | 326,640 | ||||||
See notes to the consolidated financial statements
F-5
Table of Contents
CONSOLIDATED STATEMENTS OF CHANGES IN SHAREHOLDERS’ EQUITY
| Common Stock | Additional Paid-in Capital |
Statutory Reserves |
Retained Earnings |
Accumulated Other Comprehensive Income |
Controlling Share-Holders’ Equity |
Noncontrolling interests |
Total Share-Holders’ Equity |
|||||||||||||||||||||||||
| Number of Shares |
Amount | |||||||||||||||||||||||||||||||
| (RMB) | (RMB) | (RMB) | (RMB) | (RMB) | (RMB) | (RMB) | (RMB) | |||||||||||||||||||||||||
| Balance, June 30, 2008 |
2,139,203 | ¥ | 300,534 | ¥ | 8,732,266 | ¥ | 1,687,772 | ¥ | 2,838,371 | ¥ | — | ¥ | 13,558,943 | ¥ | 5,210,560 | ¥ | 18,769,503 | |||||||||||||||
| Net income for the year |
— | — | — | — | 15,205,321 | — | 15,205,321 | 1,629,056 | 16,834,377 | |||||||||||||||||||||||
| Balance, June 30, 2009 |
2,139,203 | 300,534 | 8,732,266 | 1,687,772 | 18,043,692 | — | 28,764,264 | 6,839,616 | 35,603,880 | |||||||||||||||||||||||
| Issuance of common stock |
1,700,000 | 215,190 | 59,103,759 | — | — | — | 59,318,949 | — | 59,318,949 | |||||||||||||||||||||||
| Conversion of redeemable stock to common stock |
112,608 | 14,255 | 1,420,087 | — | — | — | 1,434,342 | — | 1,434,342 | |||||||||||||||||||||||
| Deferred listing cost |
— | — | (1,622,048 | ) | — | — | — | (1,622,048 | ) | — | (1,622,048 | ) | ||||||||||||||||||||
| Stock based payment |
— | — | 1,623,034 | — | — | — | 1,623,034 | — | 1,623,034 | |||||||||||||||||||||||
| Net income for the year |
— | — | — | — | 20,058,539 | — | 20,058,539 | — | 20,058,539 | |||||||||||||||||||||||
| Appropriation of statutory reserves |
— | — | — | 2,067,731 | (2,067,731 | ) | — | — | 2,752,780 | 2,752,780 | ||||||||||||||||||||||
| Foreign currency translation adjustment |
— | — | — | — | — | (76,997 | ) | (76,997 | ) | (8,555 | ) | (85,552 | ) | |||||||||||||||||||
| Balance, June 30, 2010 |
3,951,811 | ¥ | 529,979 | ¥ | 69,257,098 | ¥ | 3,755,503 | ¥ | 36,034,500 | ¥ | (76,997 | ) | ¥ | 109,500,083 | ¥ | 9,583,841 | ¥ | 119,083,924 | ||||||||||||||
See notes to the consolidated financial statements
F-6
Table of Contents
NOTES TO THE CONSOLIDATED FINANCIAL STATEMENTS
NOTE 1. ORGANIZATION AND BASIS OF PRESENTATION
Organization - Recon Technology, Ltd (the “Company”) was incorporated under the laws of the Cayman Islands on August 21, 2007 by Mr. Yin Shenping, Mr. Chen Guangqiang and Mr. Li Hongqi (the “Principal Shareholders”) as a company with limited liability. The Company provides oilfield specialized equipment, automation systems, tools, chemicals and field services to petroleum companies in the People’s Republic of China (the “PRC”). Its wholly owned subsidiary, Recon Technology Co., Limited (“Recon-HK”) was incorporated on September 6, 2007 in Hong Kong. Other than the equity interest in Recon-HK, the Company does not own any assets or conduct any operations. On November 15, 2007, Recon-HK established one wholly owned subsidiary, Jining Recon Technology Ltd. (“Recon-JN”) under the laws of the PRC. Other than the equity interest in Recon-JN, Recon-HK does not own any assets or conduct any operations.
The Company conducts its business through the following PRC legal entities that are consolidated as variable interest entities (“VIEs”) and operate in the Chinese oilfield equipment & service industry:
Beijing BHD Petroleum Technology Co., Ltd. (“BHD”),
Nanjing Recon Technology Co., Ltd. (“Nanjing Recon”), and
Jining ENI Energy Technology Co., Ltd. (“ENI”)
The following former subsidiaries of BHD entities were sold by June 2008:
Inner Mongolia Adar Energy Technology (“Inner Mongolia Adar”)
Beijing Weigu Windows Co. Technology (“Beijing Weigu”)
Xiamen Recon Technology, Ltd. (“Xiamen Recon”).
The following former subsidiaries of Nanjing Recon were sold by June 2009:
Xiamen Hengda Haitian (“Hengda Haitian”)
Beijing Yabei Nuoda Technology, Ltd. (“Yabei Nuoda”).
Chinese laws and regulations currently do not prohibit or restrict foreign ownership in petroleum businesses. However, Chinese laws and regulations do prevent direct foreign investment in certain industries. On January 1, 2008, to protect the Company’s shareholders from possible future foreign ownership restrictions, the Principal Shareholders, who also hold the controlling interest of BHD, Nanjing Recon and ENI, reorganized the corporate and shareholding structure of these entities by entering into certain exclusive agreements with Recon-JN, which entitles Recon-JN to receive a majority of the residual returns. On May 29, 2009 Recon JN and BHD, Nanjing Recon, and ENI entered into an operating agreement to provide full guarantee for the performance of such contracts, agreements or transactions entered into by BHD, Nanjing Recon, and ENI. As a result of the new agreement, Recon-JN will absorb 100% of the expected losses and receive 90% of the expected gains of BHD, Nanjing Recon, and ENI, which results in Recon-JN being the primary beneficiary of these Companies.
Recon-JN also entered into Share Pledge Agreements with the Principal Shareholders, who pledged all their equity interest in these entities to Recon-JN. The Share Pledge Agreements,
F-7
Table of Contents
RECON TECHNOLOGY, LTD
NOTES TO THE CONSOLIDATED STATEMENTS
which were entered into by each Principal Shareholder, pledged each of the Principal Shareholders’ equity interest in BHD, Nanjing Recon and ENI as a guarantee for the service payment under the Service Agreement.
The Service Agreement, entered into on January 1, 2008, between Recon-JN and BHD, Nanjing Recon, and ENI, states that Recon-JN will provide technical consulting services to BHD, Nanjing Recon, and ENI in exchange for 90% of their annual net profits as a service fee, which is to be paid quarterly.
In addition, Recon-HK entered into Option Agreements to acquire the Principal Shareholders’ equity interest in these entities if or when permitted by the PRC laws.
Based on these exclusive agreements, the Company consolidates BHD, Nanjing Recon and ENI as VIEs as required by Financial Accounting Standards Board (“FASB”) Interpretation No. 46R (“FIN 46(R)”) (ASC Topic 810), Consolidation of Variable Interest Entities, an Interpretation of ARB No. 51 (ASC Topic 810) because the Company is the primary beneficiary of the VIEs.
On August 28, 2000 a Principal Shareholder of the Company purchased a controlling interest in BHD which was organized under the laws of the PRC on June 29, 1999. As of June 30, 2009 and 2010, the Principal Shareholders held 67.5% ownership in BHD. BHD is combined with the Company through the date of the exclusive agreements, and is consolidated following January 1, 2008, the date of the agreements based on FIN 46(R) (ASC Topic 810). The Company allocates profits and losses 90% and 100%, respectively based upon the control agreements. Profits allocated to the minority interest is the remaining amount (10%).
On April 18, 2007, BHD organized Inner Mongolia Adar under the laws of the PRC, of which BHD owned a 70% majority interest. On May 11, 2007 BHD created another subsidiary, Beijing Weigu, of which BHD held a 90% interest. On June 21, 2008 Beijing Weigu was sold to unrelated parties. On June 24, 2008 Inner Mongolia Adar was sold to unrelated parties. Inner Mongolia Adar and Beijing Weigu are consolidated with BHD for all periods presented to the date of disposition. They are not consolidated since fiscal year 2009.
On January 21, 2003, ENI was organized under the laws of the PRC. Principal Shareholders of the Company own a controlling interest of ENI. As of June 30, 2009 and 2010, the Principal Shareholders held 80% ownership interest in ENI. ENI is combined with the Company through the date of the exclusive agreements, and is consolidated following January 1, 2008, the date of the agreements based on FIN 46(R) (ASC Topic 810). The Company allocates profits and losses 90% and 100%, respectively based upon the control agreements. Profits allocated to the minority interest is the remaining amount (10%).
On July 4, 2003, Nanjing Recon was organized under the laws of the PRC. On August 27, 2007 the Principal Shareholders of the Company purchased a majority ownership of Nanjing Recon from a related party who was a majority owner of Nanjing Recon. As of June 30, 2009 and 2010, the Principal Shareholders held 80% ownership interest in Nanjing Recon. Nanjing Recon is
F-8
Table of Contents
RECON TECHNOLOGY, LTD
NOTES TO THE CONSOLIDATED STATEMENTS
combined with the Company through the date of the exclusive agreements, and is consolidated following January 1, 2008, the date of the agreements based on FIN 46(R) (ASC Topic 810). The Company allocates profits and losses 90% and 100%, respectively based upon the control agreements. Profits allocated to the minority interest is the remaining amount (10%).
Nature of Operations – The Company engaged in (1) providing equipment, tools and other hardware related to oilfield production and management. Simple installations may happen in connection with some projects; (2) developing and selling its own specialized industrial automation control and information solutions. The products and services provided by the Company include:
High-Efficiency Heating Furnaces - High-Efficiency Heating Furnaces are designed to remove the impurities and to prevent solidification blockage in transport pipes carrying crude petroleum. Crude petroleum contains certain impurities which, include water and natural gas, that must be removed before the petroleum can be sold.
Multi-Purpose Fissure Shaper - Multipurpose fissure shapers improve the extractors’ ability to test for and extract petroleum which must be perforated into the earth before any petroleum extractor can test for the presence of oil.
Oil Field Water Finding/Blocking Technology - The Company developed this technology designed to find and block water content in petroleum.
Supervisory Control and Data Acquisition System (“SCADA”) - SCADA is an industrial computerized process control system for monitoring, managing and controlling petroleum extraction. SCADA integrates underground and above-ground activities of the petroleum extraction industry. This system can help to manage the oil extraction process in real-time to reduce the costs associated with extraction.
F-9
Table of Contents
RECON TECHNOLOGY, LTD
NOTES TO THE CONSOLIDATED STATEMENTS
NOTE 2. SIGNIFICANT ACCOUNTING POLICIES
Basis of Presentation and Translating Financial Statements - The accompanying consolidated financial statements were prepared in accordance with accounting principles generally accepted in the United States of America (“U.S. GAAP”). They are consolidated following January 1, 2008, the date of the agreements. The accompanying consolidated financial statements include the financial statements of the Company, its subsidiaries, and VIEs for which the Company is the primary beneficiary. All inter-company transactions and balances between the Company, its subsidiaries and VIEs are eliminated upon consolidation. In the opinion of management, all adjustments considered necessary for a fair presentation have been included, and such adjustments are of a normal recurring nature.
Currency Translation - The Company’s functional currency is the Chinese Yuan (“Renminbi” or “RMB”) and the accompanying consolidated financial statements have been expressed in Chinese Yuan. The consolidated financial statements as of and for the year ended June 30, 2010 have been translated into United States dollars (“U.S. dollars”) solely for the convenience of the readers and are unaudited. The translation has been made at the rate of ¥6.8086 = US$1.00, the approximate exchange rate prevailing on June 30, 2010. These translated U.S. dollar amounts should not be construed as representing Chinese Yuan amounts or that the Chinese Yuan amounts have been or could be converted into U.S. dollars.
Accounting Estimates - The preparation of the consolidated financial statements in conformity with accounting principles generally accepted in the United States of America requires that management make estimates and assumptions that affect the reported amounts of assets and liabilities and disclosure of contingent assets and liabilities at the dates of the financial statements and the reported amounts of revenues and expenses during the reporting periods. Estimates are adjusted to reflect actual experience when necessary. Significant accounting estimates reflected in the Company’s consolidated financial statements include revenue recognition, allowance for doubtful accounts, and useful lives of property and equipment. Since the use of estimates is an integral component of the financial reporting process, actual results could differ from those estimates.
Fair Values of Financial Instruments - The carrying amounts reported in the consolidated balance sheets for trade accounts receivable, other receivables, advances to suppliers, trade accounts payable, accrued liabilities, advances from customers and notes payable approximate fair value because of the immediate or short-term maturity of these financial instruments.
Cash and Cash Equivalents - Cash and cash equivalents are comprised of cash on hand, demand deposits and highly liquid short-term debt investments with stated maturities of no more than three months.
Trade Accounts and Other Receivables - Accounts receivable are recorded when revenue is recognized and are carried at original invoiced amount less a provision for any potential
F-10
Table of Contents
RECON TECHNOLOGY, LTD
NOTES TO THE CONSOLIDATED STATEMENTS
uncollectible amounts. Provision is made against trade accounts and other receivables to the extent they are considered to be doubtful. Other receivables are from transactions with non-trade customers.
Purchase Advances - Purchase advances are the amounts prepaid to suppliers for purchases of inventory and are recognized when the final amount is paid to the suppliers and the inventory is delivered.
Inventories - Inventories are stated at the lower of cost or market value, on a weighted average basis. The method of determining inventory costs is used consistently from year to year. Allowance for inventory obsolescence is provided when the market value of certain inventory items are lower than the cost.
| Motor vehicles |
10 Years | |
| Office equipment |
2-5 Years | |
| Leasehold improvement |
5 years |
Property and equipment - Property and equipment are stated at cost. Depreciation on office equipment is computed using the straight-line method over the estimated useful lives of the assets, which range from two to ten years. Leasehold improvements are amortized over the shorter of the lease term or the estimated useful life of the assets
Long-lived Assets - In accordance with FASB guidance, Accounting for the Impairment or Disposal of Long-Lived Assets, long-lived assets, such as property and equipment and intangible assets subject to amortization, are reviewed for impairment whenever events or changes in circumstances indicate that the carrying amount of an asset or asset group may not be recoverable. Recoverability of assets to be held and used is measured by a comparison of the carrying amount of an asset to estimated undiscounted future cash flows expected to be generated by the asset. If the carrying amount of an asset exceeds its estimated future cash flows, an impairment charge is recognized for the amount by which the carrying amount of the asset exceeds the fair value of the asset. Fair value is determined based on the estimated discounted future cash flows expected to be generated by the asset.
Advances from Customers - The Company, as is common practice in the PRC, will often receive advance payments from its customers for its products. The advances are showed as current liabilities and are recognized as revenue when the products are delivered.
Stock Split - On June 8, 2009, in connection with the Company’s contemplated initial public offering (“IPO”) of common shares, the Board of Directors approved a 42.7840667-to-1 split of common shares and redeemable common shares to shareholders of record as of such date. All references to the number of common shares and per share amounts have been restated as appropriate to reflect the effect of the split for all periods presented.
Revenue Recognition - The Company recognizes revenue when the four following criteria are met: (1) persuasive evidence of an arrangement, (2) delivery has occurred or services have been provided, (3) the sales price is fixed or determinable, and (4) collectability is reasonably assured.
F-11
Table of Contents
RECON TECHNOLOGY, LTD
NOTES TO THE CONSOLIDATED STATEMENTS
Delivery does not occur until products have been shipped or services have been provided to the client and the client has signed a completion and acceptance report, risk of loss has transferred to the client, client acceptance provisions have lapsed, or the Company has objective evidence that the criteria specified in client acceptance provisions have been satisfied. The sales price is not considered to be fixed or determinable until all contingencies related to the sale have been resolved.
Hardware:
Revenue from hardware sales is generally recognized when the product is shipped to the customer and when there are no unfulfilled company obligations that affect the customer’s final acceptance of the arrangement.
Software:
The Company sells self-developed software. For software sales, the Company recognizes revenues in accordance with the provisions of Statement of Position No. 97-2 (ASC985-605), “Software Revenue Recognition,” and related interpretations. Revenue from software is recognized according to project contracts. Contract costs are accumulated during the periods of installation and testing or commissioning. Usually this is short term. Revenue are not recognized until completion of the contracts and receipt of acceptance statements.
Services:
The Company provides services to improve software functions and system requirements on separated fixed-price contracts. Revenue is recognized on the completed contract method when acceptance is determined by a completion report signed by the customer.
Deferred income represents unearned amounts billed to customers related to sales contracts.
Cost of Revenues - When the criteria for revenue recognition have been met, costs incurred are recognized as cost of revenue. Cost of revenues include wages, materials, handling charges, and other expenses associated with manufactured products and service provided to customers; the cost of purchased equipment and pipes.
Subsidy Income - The Company received grants of ¥2,038,015 and ¥2,132,880 ($313,263) from the local government for the year ended June 30, 2009 and 2010, respectively. 1) Grants given by the government were to support local software companies’ operation and research and development. Grants related to research and development projects are recognized as subsidy income in the consolidated statements of operations when received. 2) Grants in form of value-added-tax refund for software products are recognized when received.
Share-Based Compensation - The Company accounts for share-based compensation in accordance with ASC Topic.718, Share-Based Payment(formerly SFAS No. 123(R)). Under the fair value recognition provisions of this statement, share-based compensation cost is measured at the grant date based on the fair value of the award and is recognized as expense over the applicable vesting period of the share award using the straight-line method.
F-12
Table of Contents
RECON TECHNOLOGY, LTD
NOTES TO THE CONSOLIDATED STATEMENTS
Income Taxes - Income taxes are provided based upon the liability method of accounting pursuant to ASC Topic 740), Accounting for Income Taxes, (formerly SFAS No. 109. Provisions for income taxes are based on taxes payable or refundable for the current year and deferred taxes. Deferred taxes are provided on differences between the tax bases of assets and liabilities and their reported amounts in the financial statements, and tax carry forwards. Deferred tax assets and liabilities are included in the financial statements at currently enacted income tax rates applicable to the period in which the deferred tax assets and liabilities are expected to be realized or settled. As changes in tax laws or rates are enacted, deferred tax assets and liabilities are adjusted through the provision for income taxes. The Company has not been subject to any income taxes in the United States or the Cayman Islands.
Business Segments - The Company operates in one industry which includes the sale of products for the oil field construction solely to customers in China; therefore, no business segment information has been presented.
Earnings per Share(“EPS”) - Basic EPS is computed by dividing net income available for common shareholders by the weighted average number of common shares outstanding. Diluted EPS are computed by dividing net income available for common shareholders by the weighted-average number of common shares and dilutive potential common share equivalents outstanding.
Recently Enacted Accounting Standards
The FASB issued ASU 2010-13, Compensation—Stock Compensation (ACS Topic 718): Effect of Denominating the Exercise Price of a Share-Based Payment Award in the Currency of the Market in Which the Underlying Equity Security Trades. The ASU codifies the consensus reached in Emerging Issues Task Force (EITF) Issue No. 09-J. The amendments to the Codification clarify that an employee share-based payment award with an exercise price denominated in the currency of a market in which a substantial portion of the entity’s equity shares trades should not be considered to contain a condition that is not a market, performance, or service condition. Therefore, an entity would not classify such an award as a liability if it otherwise qualifies as equity.
The amendments in the ASU are effective for fiscal years, and interim periods within those fiscal years, beginning on or after December 15, 2010. Earlier adoption is permitted. The amendments are to be applied by recording a cumulative-effect adjustment to beginning retained earnings. We are currently evaluating the impact of adopting this update on our consolidated financial statements.
In February 2010, FASB issued ASU No. 2010-09 “Subsequent Events” (“ASC Topic 855”) which removes the requirement for an SEC filer to disclose a date in both issued and revised financial statements. This amendment shall be applied prospectively for interim or annual financial periods ending after June 15, 2010. The Company does not believe the adoption will have a material effect on the Company’s consolidated financial statements.
F-13
Table of Contents
RECON TECHNOLOGY, LTD
NOTES TO THE CONSOLIDATED STATEMENTS
The FASB has issued ASU 2010-06, Fair Value Measurements and Disclosures (ACS Topic 820): Improving Disclosures about Fair Value Measurements. This ASU requires some new disclosures and clarifies some existing disclosure requirements about fair value measurement as set forth in Codification Subtopic 820-10. The FASB’s objective is to improve these disclosures and, thus, increase the transparency in financial reporting. Specifically, ASU 2010-06 amends Codification Subtopic 820-10 to now require:
| • | A reporting entity to disclose separately the amounts of significant transfers in and out of Level 1 and Level 2 fair value measurements and describe the reasons for the transfers; and |
| • | In the reconciliation for fair value measurements using significant unobservable inputs, a reporting entity should present separately information about purchases, sales, issuances, and settlements. |
In addition, ASU 2010-06 clarifies the requirements of the following existing disclosures:
| • | For purposes of reporting fair value measurement for each class of assets and liabilities, a reporting entity needs to use judgment in determining the appropriate classes of assets and liabilities; and |
| • | A reporting entity should provide disclosures about the valuation techniques and inputs used to measure fair value for both recurring and nonrecurring fair value measurements. |
ASU 2010-06 is effective for interim and annual reporting periods beginning after December 15, 2009, except for the disclosures about purchases, sales, issuances, and settlements in the roll forward of activity in Level 3 fair value measurements. Those disclosures are effective for fiscal years beginning after December 15, 2010, and for interim periods within those fiscal years. Early adoption is permitted. This guidance was effective for our third quarter ended March 31, 2010.
Since the filing of our 2009 Form 10-K, the FASB issued ASU No. 2010-1 through No. 2010-21. These ASUs entail technical corrections to existing guidance or affect guidance related to specialized industries or entities and therefore have minimal, if any, impact on the Company.
NOTE 3. TRADE ACCOUNTS RECEIVABLE
Accounts receivable consisted of the following at June 30, 2009 and 2010:
| As of June 30, | ||||||||||||
| 2009 | 2010 | 2010 | ||||||||||
| RMB | RMB | U.S. Dollars | ||||||||||
| Trade accounts receivable |
¥ | 44,708,934 | ¥ | 90,515,321 | $ | 13,294,263 | ||||||
| Allowance for doubtful accounts |
(604,953 | ) | (1,089,331 | ) | (159,993 | ) | ||||||
| Trade accounts receivable, net |
¥ | 44,103,981 | ¥ | 89,425,990 | $ | 13,134,270 | ||||||
As of September 15, 2010, collection of above trade accounts receivable as of June 30, 2010 is ¥21,043,740 ($3,090,759).
F-14
Table of Contents
RECON TECHNOLOGY, LTD
NOTES TO THE CONSOLIDATED STATEMENTS
NOTE 4. OTHER RECEIVABLES
Other receivables consisted of the following at June 30, 2009 and 2010:
| As of June 30, | |||||||||
| 2009 | 2010 | 2010 | |||||||
| RMB | RMB | U.S. Dollars | |||||||
| Deposit for purchasing inventory |
¥ | — | ¥ | 7,930,268 | $ | 1,164,743 | |||
| loans to third party |
1,094,617 | 3,723,982 | 546,953 | ||||||
| Advance to staff |
908,572 | 1,032,750 | 151,683 | ||||||
| Deposit for project |
20,000 | 80,000 | 11,750 | ||||||
| Others |
24,826 | 83,547 | 12,270 | ||||||
| Other receivable, net |
¥ | 2,048,015 | ¥ | 12,850,547 | $ | 1,887,399 | |||
Advances to staff are for business travel and other sundry expenses related to customer on-site installation and inspection of products.
NOTE 5. PURCHASE ADVANCES
Purchase advances consisted of the following at June 30, 2009 and 2010:
| As of June 30, | |||||||||
| 2009 | 2010 | 2010 | |||||||
| RMB | RMB | U.S. Dollars | |||||||
| Prepayment for purchasing inventory |
¥ | 5,354,387 | ¥ | 46,293,094 | $ | 6,799,209 | |||
| Payment for freight |
91,680 | — | — | ||||||
| Others |
191,015 | 258,308 | 37,938 | ||||||
| Purchase advances, net |
¥ | 5,637,082 | ¥ | 46,551,402 | $ | 6,837,147 | |||
NOTE 6. INVENTORIES
Inventories consisted of the following at June 30, 2009 and 2010:
| As of June 30, | |||||||||
| 2009 | 2010 | 2010 | |||||||
| RMB | RMB | U.S. Dollars | |||||||
| Low-value consumption goods |
¥ | — | ¥ | 310,381 | $ | 45,587 | |||
| Purchased goods and raw materials |
228,569 | 5,721,871 | 840,389 | ||||||
| Work in process |
319,490 | — | — | ||||||
| Finished goods |
10,161,959 | 7,118,659 | 1,045,539 | ||||||
| Total inventories |
¥ | 10,710,018 | ¥ | 13,150,911 | $ | 1,931,515 | |||
NOTE 7. PROPERTY AND EQUIPMENT
| Motor vehicles |
10 Years | |
| Office equipment |
2-5 Years | |
| Leasehold improvement |
5 years |
F-15
Table of Contents
RECON TECHNOLOGY, LTD
NOTES TO THE CONSOLIDATED STATEMENTS
Gain or loss on the sales or retirements is included in the consolidated statements of operations. Depreciation expense was ¥321,300 and ¥368,804 ($54,167) for the years ended June 30, 2009 and 2010, respectively. Property and equipment consisted of the following at June 30, 2009 and 2010:
| As of June 30, | ||||||||||||
| 2009 | 2010 | 2010 | ||||||||||
| RMB | RMB | U.S. Dollars | ||||||||||
| Motor vehicles |
¥ | 1,464,918 | ¥ | 1,796,955 | $ | 263,924 | ||||||
| Office equipment and fixtures |
779,257 | 450,715 | 66,198 | |||||||||
| Leasehold improvement |
169,462 | 426,181 | 62,595 | |||||||||
| Total property and equipment |
2,413,637 | 2,673,851 | 392,717 | |||||||||
| Less: Accumulated depreciation |
(1,006,761 | ) | (1,190,970 | ) | (174,922 | ) | ||||||
| Property and equipment, net |
¥ | 1,406,876 | ¥ | 1,482,881 | $ | 217,795 | ||||||
NOTE 8. SHAREHOLDERS’ EQUITY
Common Shares - When the Company was incorporated in the Cayman Islands on August 21, 2007, 25,000,000 common shares were authorized, and 2,139,203 common shares were issued to the Principal Shareholders, at a par value of $0.0185 each. On July 29, 2009, the Company completed its IPO by offering 1,700,000 common shares at $6.00 per share. After this IPO, all the 112,608 redeemable common shares outstanding were automatically converted into non-redeemable common shares pursuant to the Agreement.
Statutory Reserves - According to the Articles of Incorporation, the Company is required to transfer a certain portion of its net profit, as determined under PRC accounting regulations, from current net income to the statutory reserve fund. As of June 30, 2009 and 2010 the balance of total statutory reserves was ¥1,687,772 and ¥3,755,503($551,582).
Redeemable Common Shares - On December 10, 2007, the Company signed a Common Shares Subscription Agreement (the “Agreement”) to sell 112,608 common shares to an investor at an aggregate consideration of $200,000. Net total proceeds of $200,000 were received by the Company during March and April, 2008.
The common shares issued are subject to redemption under certain conditions. In the event that the Company fails to list on a recognized stock exchange or complete a qualified IPO within 18 months after the signing of the Agreement, the Company shall repay all the consideration plus 5% per annum of the consideration to the investor. The three Principal Shareholders, Nanjing Recon, ENI, and BHD severally and jointly guaranteed the payment.
The shares issued are only conditionally redeemable as described above and are therefore not classified as a liability. However, redemption of the shares is not solely within the control of the Company; therefore, the shares are classified outside of permanent equity. Upon the completion of the IPO in July 2009, all the 112,608 redeemable common shares outstanding were automatically converted into non-redeemable common shares pursuant to the Agreement.
Share-based Awards Plan - In June 2009, the Board of Directors and the shareholders of the Company adopted the 2009 Stock Incentive Plan (the “2009 Plan”). The 2009 Plan provides for the granting of share options and restricted common shares to employees, non-employee directors and consultants of the Company. Options granted under the 2009 Plan may be Incentive Stock Options or Non-statutory Stock Options. Non-employee directors and Consultants are not eligible to receive the award of an Incentive Stock Option. The Compensation Committee of the Board of
F-16
Table of Contents
RECON TECHNOLOGY, LTD
NOTES TO THE CONSOLIDATED STATEMENTS
Director is entitled to establish the term, vesting conditions and exercise price of the options as well as the vesting conditions and transferability of restricted shares. Under the 2009 Plan, 790,362 unissued common shares have been reserved for issuance. As discussed in Note 14, under the 2009 Plan, the Company granted options to purchase 293,000 common shares to its employees and non-employee directors on July 29, 2009 and 170,000 warrants to placement agent.
NOTE 9. INCOME TAXES
The Company is not subject to any income taxes in the United States or the Cayman Islands and had minimal operations in jurisdictions other than the PRC. ENI, BHD and Nanjing Recon are subject to PRC’s income taxes as PRC domestic companies. Before the implementation of the new Enterprise Income Tax Law (“EIT Law”), PRC domestic companies are generally subject to an enterprise income tax (“EIT”) rate of 33%. On March 16, 2007, the National People’s Congress of China passed the new EIT Law, and on December 6, 2007, the State Council of China passed the Implementing Rules for the EIT Law (“Implementing Rules”) which took effect on January 1, 2008. The new amended EIT Law introduces a wide range of changes which include, but are not limited to the unification of the income tax rate for domestic-invested and foreign-invested enterprises at 25%. As a result, income tax rate for ENI was reduced from 33% to 25% in calendar year 2008 and after.
As approved by the domestic tax authority in the PRC, Nanjing Recon was entitled to a tax holiday with 50% tax exemption for calendar year 2006 and 2007. Nanjing Recon is also a government-certified high technology company and is subject to an income tax rate of 15%. As a result, Nanjing Recon was subject to an income tax rate of 7.5% for calendar year 2007 and 15% for calendar year 2008. Since calendar year 2009, Guidelines for the Administration of the Recognition of Hi-tech Enterprises was updated and all companies were required to have their post registration reviewed. Thus for the calendar year 2009, Nanjing Recon is subject to an income tax rate of 25%. For calendar year 2010, the company reapplied for hi-tech approval and has passed all relevant review. Thus, for the calendar year 2010, Nanjing Recon is subject to an income tax rate of 15%.
As approved by the domestic tax authority in the PRC, BHD was recognized as a government-certified high technology company on November. 25, 2009 and is subject to an income tax rate of 15% for calendar year 2010. This qualification certificate will stay effective till the certificate matures in 2012.
Deferred taxes are comprised of the following:
| As of June 30, | ||||||||||
| 2009 | 2010 | 2010 | ||||||||
| RMB | RMB | U.S. Dollars | ||||||||
| Allowance for doubtful receivables |
¥ | 913,943 | ¥ | 275,960 | $ | 40,531 | ||||
| Deferred revenue and cost recognition in tax return |
(3,901,616 | ) | — | — | ||||||
| Loss carryforward |
622,448 | — | — | |||||||
| Total deferred income tax assets (liabilities) |
¥ | (2,365,225 | ) | ¥ | 275,960 | $ | 40,531 | |||
F-17
Table of Contents
RECON TECHNOLOGY, LTD
NOTES TO THE CONSOLIDATED STATEMENTS
Following is a reconciliation of income taxes at the calculated statutory rates:
| As of June 30, | ||||||||||||
| 2009 | 2010 | 2010 | ||||||||||
| RMB | RMB | U.S. Dollars | ||||||||||
| Income tax calculated at statutory rates |
¥ | 4,722,553 | ¥ | 9,275,102 | $ | 1,362,263 | ||||||
| Nondeductible expenses (non-taxable income) |
(90,090 | ) | 70,590 | 10,368 | ||||||||
| Benefit of favorable rate for high-technology companies |
(588,251 | ) | (1,683,080 | ) | (247,199 | ) | ||||||
| Benefit of operating loss carryforwards |
(622,448 | ) | — | — | ||||||||
| Effect of change in income tax rates |
(132,485 | ) | — | — | ||||||||
| Benefit of revenue exempted from enterprise income tax |
— | (157,735 | ) | (23,168 | ) | |||||||
| Effect of non-taxable parent company income/expense |
388,608 | — | — | |||||||||
| Provision for income taxes |
¥ | 3,677,887 | ¥ | 7,504,877 | $ | 1,102,264 | ||||||
The provision for income taxes is comprised of the following:
| As of June 30, | |||||||||
| 2009 | 2010 | 2010 | |||||||
| RMB | RMB | U.S. Dollars | |||||||
| Current income taxes |
¥ | 2,435,342 | ¥ | 7,504,877 | $ | 1,102,264 | |||
| Deferred income taxes |
1,242,545 | — | — | ||||||
| Provision for income taxes |
¥ | 3,677,887 | ¥ | 7,504,877 | $ | 1,102,264 | |||
NOTE 10. SHORT-TERM NOTES PAYABLE
Short-term notes payable consist of the following, and the interest expense is Rmb214,431 ($31,494) and Rmb113,179 during the years ended June 30, 2010 and June 30, 2009, respectively.
| As of June 30, | |||||||||
| 2009 | 2010 | 2010 | |||||||
| RMB | RMB | U.S. Dollars | |||||||
| Short-term notes payable due to non-related parties: |
|||||||||
| Due-on-demand note payable, no interest |
¥ | 1,374,888 | ¥ | 1,224,888 | $ | 179,903 | |||
| Short-term note payable, no interest, matures on Aug. 25, 2010 (*) |
193,504 | 140,000 | 20,562 | ||||||
| Short-term notes payable, interest at 6%, matures on Dec. 11, 2010 |
625,400 | 1,172,911 | 172,269 | ||||||
| Short-term note payable, no interest, matures on Dec. 27, 2010 |
300,000 | 411,500 | 60,438 | ||||||
| Short-term note payable, no interest, matures on May 24, 2011 |
650,000 | 1,575,582 | 231,411 | ||||||
| Short-term note payable, interest at 1.2% a month, matures on Nov. 19, 2010 |
— | 500,000 | 73,437 | ||||||
| Total short-term notes payable due to non-related parties |
¥ | 3,143,792 | ¥ | 5,024,881 | $ | 738,020 | |||
| * | Subsequent to 6/30/10, the maturity of this note was extended and is currently outstanding. |
F-18
Table of Contents
RECON TECHNOLOGY, LTD
NOTES TO THE CONSOLIDATED STATEMENTS
| As of June 30, | |||||||||
| 2009 | 2010 | 2010 | |||||||
| RMB | RMB | U.S. Dollars | |||||||
| Short-term notes payable due to related parties: |
|||||||||
| Due-on-demand note payable to Principal Shareholders, no interest |
¥ | 376,377 | ¥ | 376,377 | $ | 55,280 | |||
| Short-term note payable to a Principal Shareholder’s family member, interest at 6%, matures on Dec. 9, 2010 |
182,000 | 249,100 | 36,586 | ||||||
| Short-term note payable to a Principal Shareholder’s family member, no interest at 6%, matures on Dec. 31, 2010 |
53,000 | 6,200,000 | 910,613 | ||||||
| Short-term note payable to management, interest at 6%, matures on March 10, 2010 |
583,000 | 517,980 | 76,077 | ||||||
| Short-term note payable to management, no interest, matures on April 28, 2009 |
100,000 | — | — | ||||||
| Short-term note payable to management, interest at 3.72%, matures on April 21, 2009 |
2,050,000 | — | — | ||||||
| Total short-term notes payable due to related parties |
¥ | 3,344,377 | ¥ | 7,343,457 | $ | 1,078,556 | |||
NOTE 11. CONCENTRATIONS
For the year ended June 30, 2010 and June 30 2009, the largest two ending customers, CNPC and SINOPEC, to which we provided service however entered into contract with the agents, represented about 48.79 %, 43.11% and 32.40%, 49.02% of the Company’s revenue, respectively. For the years ended June 30, 2010 and June 30, 2009, no supplier accounted 10% of its total purchases.
NOTE 12. COMMITMENTS AND CONTINGENCIES
The Company leases offices for three subsidiaries in Beijing, Nanjing and Shandong. All the lease agreements expire in December 31, 2010 with a monthly payment of ¥ 67,851 ($9,966). The amount of commitments for non-cancelable operating leases is ¥ 407,108 ($59,793) for remaining six months until December 31, 2010.
Contingencies through September 27, 2010 have been considered by the Company and none were noted which were required to be disclosed.
NOTE 13. RELATED PARTY TRANSACTIONS AND BALANCES
Sales to related parties–The Company had sales to related parties which are the companies under common ownership of ¥3,803,163 and ¥0 during the year ended June 30, 2009 and 2010,
Receivables from related parties - In 2009 the Company had net trade receivables from companies under common ownership of ¥7,458,302 for the sale of goods to related parties. At June 30, 2009, the Company had net other receivables from companies under common control of ¥507,541. There were no such receivables from companies under common ownership or control in 2010.
F-19
Table of Contents
RECON TECHNOLOGY, LTD
NOTES TO THE CONSOLIDATED STATEMENTS
Payables to related parties - At June 30, 2009 the Company owed companies under common ownership of ¥189,744 for the purchase of goods. The Company also had other payables to related parties of ¥73,579 due to principal shareholders and companies under common ownership for payments of expenses made on behalf of the Company. There were no such payables to companies under common control in 2010.
Leases from related parties -On January 1, 2010, the Company entered into a one-year agreement for the lease of office space owned by the principal shareholders and their family member. The terms of the agreement state that the Company will lease the property for one year, The monthly rental is ¥80,833 ($11,872) and the annual rental expense is ¥969,996 ($142,466).
Short-term loan from related parties - The Company borrowed ¥3,344,377 and ¥7,343,457 ($1,078,556) from principal shareholders, their family member and senior officials as of June 30, 2009 and 2010. For specific term and interest rate of loan, please see Note 10.
NOTE 14. STOCK-BASED COMPENSATION
The Company adopted Statement of Financial Accounting Standards (SFAS) No. 123-R, “Share-Based Payment” (“SFAS No. 123-R”)(ASC 718), which requires the measurement and recognition of compensation expense for all share-based payment awards made to employees and directors, including stock options based on their fair values. SFAS No. 123-R (ASC 718) supersedes Accounting Principles Board Opinion No. 25, “Accounting for Stock Issued to Employees” (“APB 25”), which the Company previously followed in accounting for stock-based awards. In March 2005, the SEC issued Staff Accounting Bulletin No. 107 (SAB 107) (ASC 107) to provide guidance on SFAS No. 123-R. The Company has applied SAB 107 in its adoption of SFAS No. 123-R. Statement No. 123(R) (ASC 718) requires companies to record compensation expense for stock options measured at fair value, on the date of grant, using an option-pricing model. The fair value of stock options is determined using the Binomial Lattice valuation model instead of the Black-Scholes Model previously utilized under Statement No. 123(ASC 718). The Company believes that the revised model represents a more likely projection of actual outcomes.
Statement No. 123(R)(ASC 718) requires that the realized tax benefit related to the excess of the deductible amount over the compensation expense recognized be reported as a financing cash flow rather than as an operating cash flow, as required under previous accounting guidance. The Company does not recognize any tax benefit related to this based on the Company’s historical operating performance, lack of taxable income and the accumulated deficit.
As of June 30, 2010, there was no unrecognized compensation cost related to non-vested share-based compensation arrangements granted under the Company’s option plans.
Share-based Payments -As discussed in Note 8, the Company granted options to purchase 293,000 common shares under the 2009 Plan to its employees and non-employee directors on July 30, 2009. The options have an excise price of $6.00 equal to the IPO price of the Company and
F-20
Table of Contents
RECON TECHNOLOGY, LTD
NOTES TO THE CONSOLIDATED STATEMENTS
will vest over a period of five years, with the first 20% vesting on July 30, 2010. The options expire ten years after the date of grant, on July 29, 2019. The fair value was estimated on July 30, 2009 using the Binomial Lattice valuation model, using the following weighted-average assumptions:
| Stock Price at grant date | 6.00 | ||
| Exercise price (per share) | 6.00 | ||
| Risk free rate of interest*** | 4.6118 | % | |
| Dividend Yield | 0.0 | % | |
| Life of option (years)** | 10.00 | ||
| Volatility* | 78 | % | |
| Forfeiture rate**** | 0 | % |
| * | Volatility is projected using the performance of PHLX Oil Service Sector index. |
| ** | The life of options represents the period the option is expected to be outstanding. |
| *** | The risk-free interest rate is based on the Chinese international bond denominated in U.S dollar with a maturity that approximates the life of the option. |
| **** | Forfeiture rate is the estimated percentage of options forfeited by employees by leaving or being terminated before vesting. |
Vested options are as follows:
| Number outstanding |
Total fair value |
Weighted average grant- date fair value per share | ||||
| Options vested at , |
RMB | RMB | ||||
| June 1, 2009 |
— | — | — | |||
| Vested during the fiscal year of 2010 |
58,600 | 1,623,034 | 30.17 | |||
| June 30, 2010 |
58,600 | 1,623,034 | 30.17 | |||
The Company recognizes compensation cost for awards with graded vesting on a straight – line basis over the requisite service period for the entire award. The grant date fair value of the options was ¥30.17($4.42) per share. Compensation expense recorded for the year ended June 30, 2010 was ¥ 1,623,034 ($238,380).
If not previously exercised or canceled, options outstanding at June 30, 2010 will expire as follows:
| Expiry Date |
Range of Exercise Prices High |
Low | Number of Shares |
Weighted average exercise price | |||||||
| July 29, 2019 | $ | 7.2 | $ | 7.2 | 234,400 | $ | 7.2 | ||||
F-21
Table of Contents
RECON TECHNOLOGY, LTD
NOTES TO THE CONSOLIDATED STATEMENTS
Placement Agent Warrants - As discussed in Note 8, the Company completed its IPO offering on July 29, 2009, and the gross proceeds received by the Company for the Offering were $10,200,000 (1,700,000 common shares at $6.00 per share) before the cash offering costs of ¥9,651,771 ($1,412,896).
In connection with the Offering, the Company sold the placement agent warrants to purchase 170,000 common shares at $7.20 per share for a nominal amount. These warrants are exercisable for a period of five years. The Company has agreed to file, during the five year period at its cost, at the request of the holders of a majority of the placement agents warrants and the underlying common shares, and to use its best efforts to cause to become effective a registration statement under the Securities Act, as required to permit the public sale of common shares issued or issuable upon exercise of the placement agent’s warrants. The Company accounted for the warrants as an additional offering cost with an estimated value of $627,341. The following table presents the assumptions used in the Black-Scholes valuation model to estimate the fair value of the placement agent warrants sold:
| Risk-free interest rate |
3.7679 | % | |
| Dividend yield |
0 | % | |
| Expected volatility |
78 | % | |
| Expected life (in years) |
5 |
On July 31, 2009 common shares of the Company commenced trading on NASDAQ Exchange. The Company has 3,951,811 common shares issued and outstanding on July 31, 2009.
The Company had 293,000 of granted stock options that were exercisable as of June 30, 2010 and zero of granted stock options were exercised. The Company had 170,000 of granted placement agent warrants as of June 30, 2010 and zero of warrants were exercised.
| NOTE 15. | EARNINGS PER SHARE. |
ASC 260 “Earnings Per Share,” requires dual presentation of basic and diluted earnings per share (“EPS”) with a reconciliation of the numerator and denominator of the basic EPS computation to the numerator and denominator of the diluted EPS computation. Basic EPS excludes dilution. Diluted EPS reflects the potential dilution that could occur if securities or other contracts to issue common stock were exercised or converted into common stock or resulted in the issuance of common stock that then shared in the earnings of the entity.
Basic net income per share is computed by dividing net income available to common shareholders by the weighted average number of shares of common stock outstanding during the period. Diluted income per share is computed by dividing net income by the weighted average number of
F-22
Table of Contents
RECON TECHNOLOGY, LTD
NOTES TO THE CONSOLIDATED STATEMENTS
shares of common stock, common stock equivalents and potentially dilutive securities outstanding during each period. Potentially dilutive common shares consist of common shares issuable upon the conversion of common stock options (using the treasury stock method). However, the effect from warrant would have been anti-dilutive due to the fact that the weighted average exercise price per share of the warrant is higher than the weighted average market price per share of the common stock during the year ended June 30, 2010.
According to the share subscription agreement signed on December 10, 2007, if the company completed an initial public offering of its common stock on or before September 30, 2009, the founder’s obligation to purchase, and the investor’s obligation to sell, the shares terminate automatically and immediately. So the company’s 112,608 redeemable common shares are currently included in the calculation of the basic EPS and there are no more redeemable shares.
The following is a reconciliation of the numerators and denominators of the basic and diluted earnings per share computations:
| For the Year ended June 30, | |||||||||
| 2009 | 2010 | 2010 | |||||||
| RMB | RMB | U.S. Dollars | |||||||
| Basic weighted average ordinary shares outstanding |
2,139,203 | 3,812,085 | 3,812,085 | ||||||
| Effect of redeemable common stock |
112,608 | — | — | ||||||
| Effect of options |
— | 24,384 | 24,384 | ||||||
| Diluted weighted average ordinary shares outstanding |
2,251,811 | 3,836,469 | 3,836,469 | ||||||
| Net income available for common shareholders |
¥ | 15,205,321 | ¥ | 20,058,539 | $ | 2,946,060 | |||
| Basic earnings per share |
¥ | 7.11 | ¥ | 5.26 | $ | 0.77 | |||
| Diluted earnings per share |
¥ | 6.75 | ¥ | 5.23 | $ | 0.77 | |||
| NOTE 16. | Subsequent events |
Management has considered all events occurring through September 27, 2010, the date the financial statements have been issued, and has determined that there areno such events that are material to the financial statements, or all such material events have been fully disclosed.
F-23