Attached files
| file | filename |
|---|---|
| 8-K - FORM 8-K - OTELCO INC. | t69702_8k.htm |
Exhibit 99.1
 |
Stifel Nicolaus
Technology, Communications & Internet Conference
February 2011
Otelco Inc. (NASDAQ: OTT; TSX: OTT.un)
|
 |
Safe Harbor Statement
Some of the statements included herein may include forward-looking
statements which reflect the Company’s current views with respect to future
events and financial performance. Statements which include the words
“expect,” “intend,” “plan,” “believe,” “project,” “anticipate” and similar
statements of a future or forward-looking nature identify forward-looking
statements for the purposes of the federal securities laws or otherwise.
All forward-looking statements address matters that involve risks and
uncertainties. Accordingly, there are or will be important factors that could
cause actual results to differ materially from those indicated in these
statements.
1
|
 |
Coming Attractions
Otelco Inc. will announce
Fourth quarter and year 2010 results
February 16, 2011
2
|
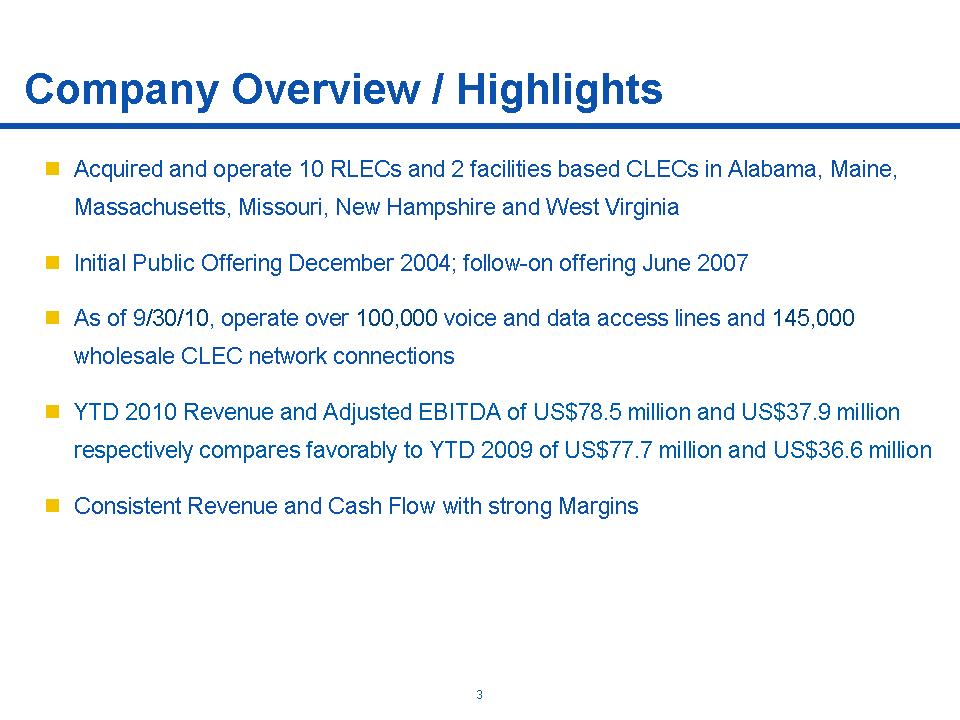 |
Company Overview / Highlights
. Acquired and operate 10 RLECs and 2 facilities based CLECs in Alabama, Maine,
Massachusetts, Missouri, New Hampshire and West Virginia
. Initial Public Offering December 2004; follow-on offering June 2007
. As of 9/30/10, operate over 100,000 voice and data access lines and 145,000
wholesale CLEC network connections
. YTD 2010 Revenue and Adjusted EBITDA of US$78.5 million and US$37.9 million
respectively compares favorably to YTD 2009 of US$77.7 million and US$36.6 million
. Consistent Revenue and Cash Flow with strong Margins
3
|
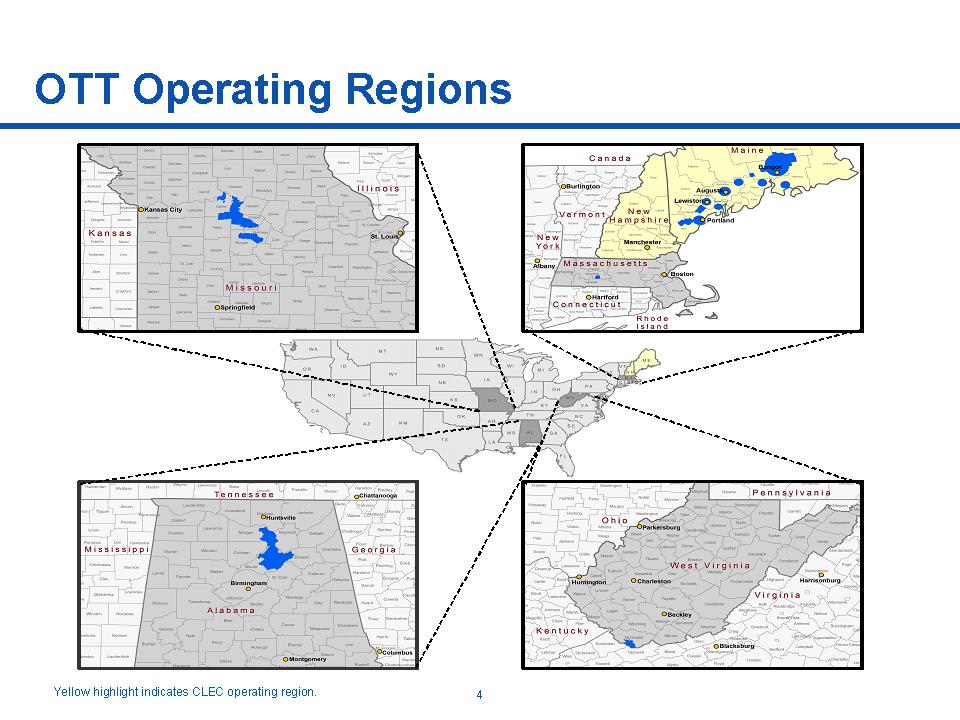 |
OTT Operating Regions
Yellow highlight indicates CLEC operating region. 4
|
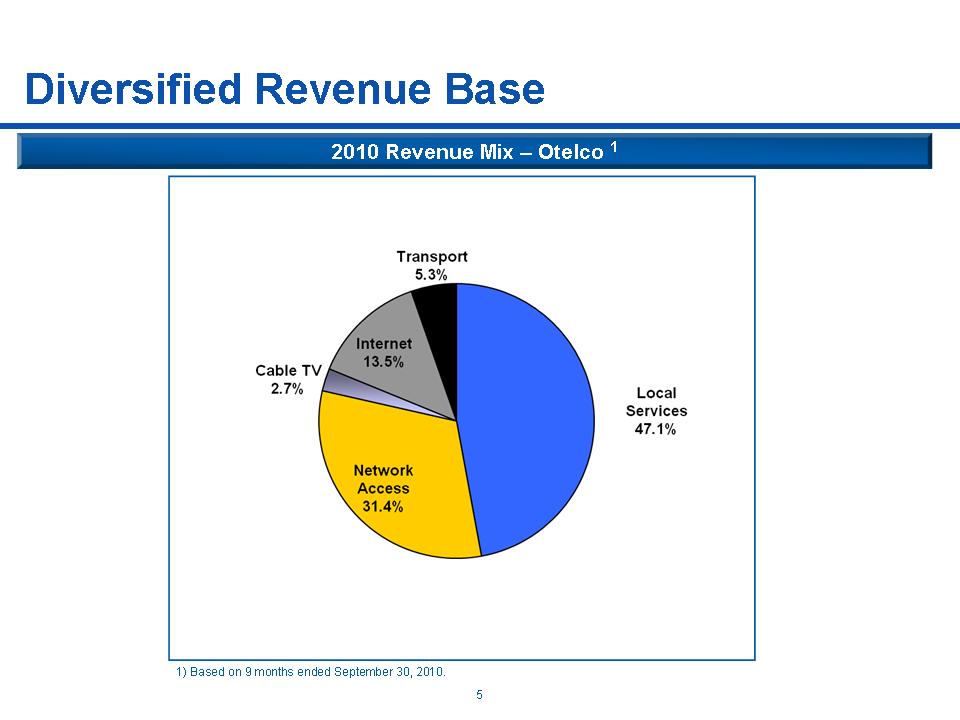 |
Diversified Revenue Base
2010 Revenue Mix – Otelco 1
1) Based on 9 months ended September 30, 2010.
5
|
 |
Business Strategy
|
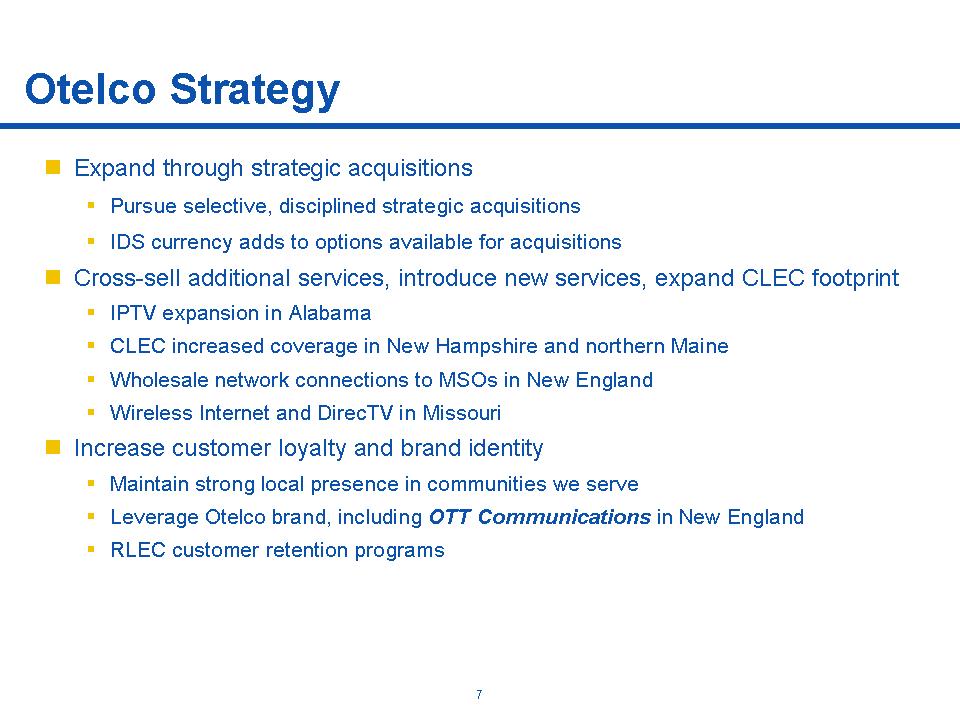 |
Otelco Strategy
. Expand through strategic acquisitions
. Pursue selective, disciplined strategic acquisitions
. IDS currency adds to options available for acquisitions
. Cross-sell additional services, introduce new services, expand CLEC footprint
. IPTV expansion in Alabama
. CLEC increased coverage in New Hampshire and northern Maine
. Wholesale network connections to MSOs in New England
. Wireless Internet and DirecTV in Missouri
. Increase customer loyalty and brand identity
. Maintain strong local presence in communities we serve
. Leverage Otelco brand, including OTT Communications in New England
. RLEC customer retention programs
7
|
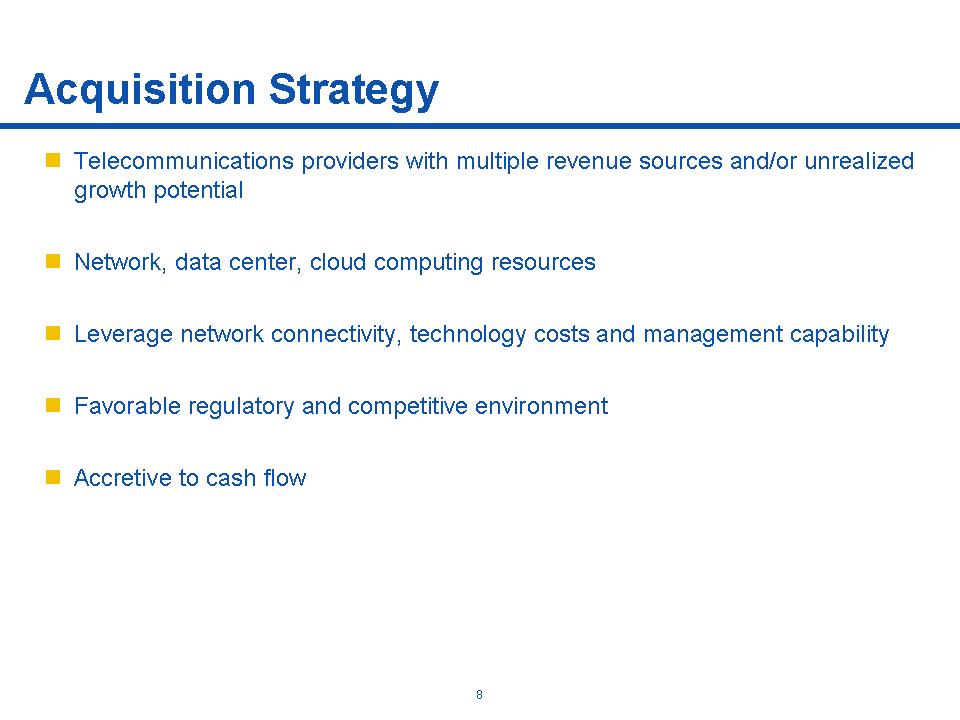 |
Acquisition Strategy
. Telecommunications providers with multiple revenue sources and/or unrealized
growth potential
. Network, data center, cloud computing resources
. Leverage network connectivity, technology costs and management capability
. Favorable regulatory and competitive environment
. Accretive to cash flow
8
|
 |
Financial Overview
|
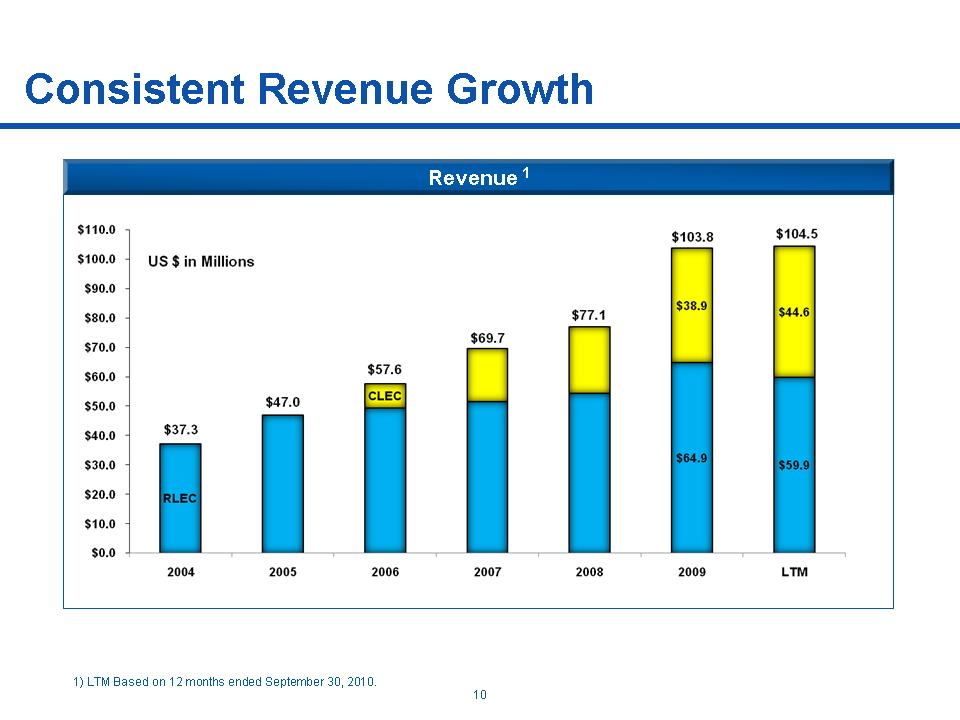 |
Consistent Revenue Growth
Revenue 1
1) LTM Based on 12 months ended September 30, 2010.
10
|
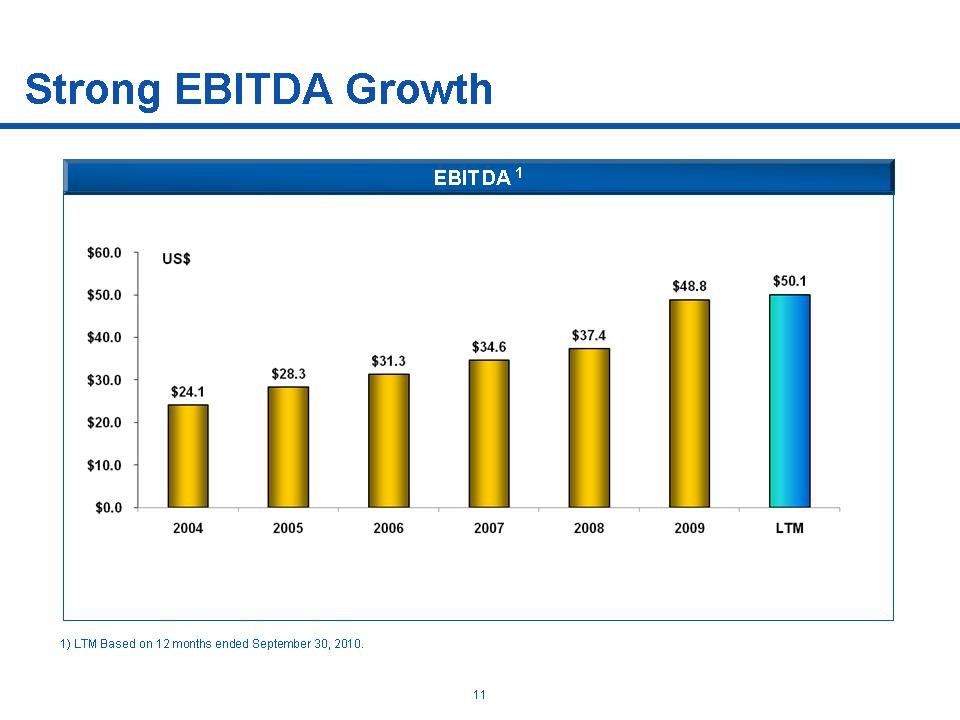 |
Strong EBITDA Growth
EBITDA 1
1) LTM Based on 12 months ended September 30, 2010.
11
|
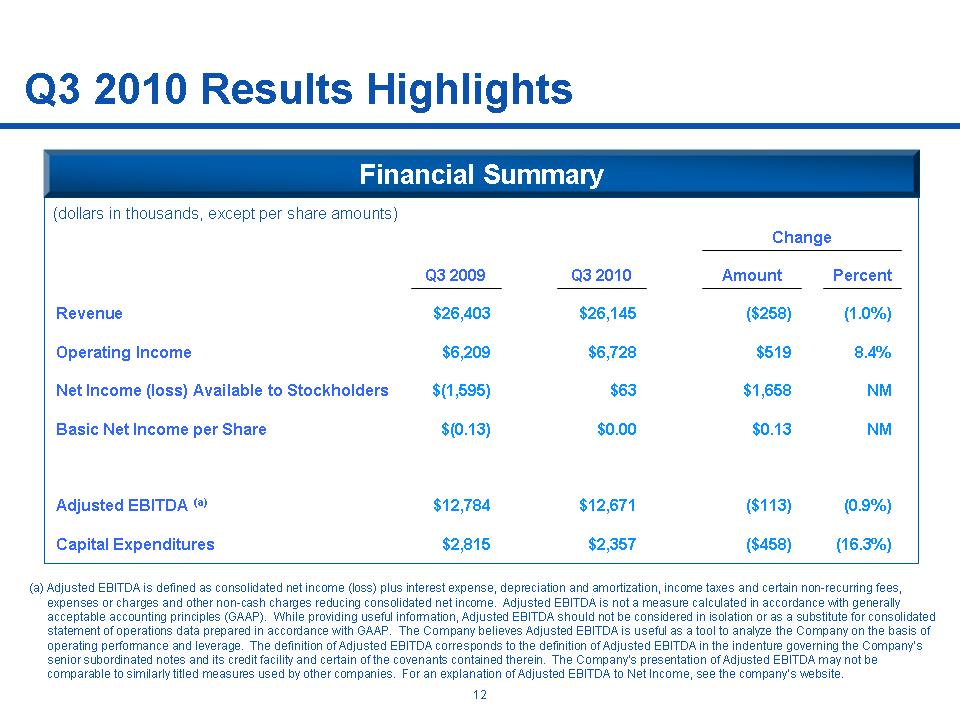 |
Q3 2010 Results Highlights
Financial Summary
(dollars in thousands, except per share amounts)
Change
Q3 2009 Q3 2010 Amount Percent
Revenue $26,403 $26,145 ($258) (1.0%)
Operating Income $6,209 $6,728 $519 8.4%
Net Income (loss) Available to Stockholders $(1,595) $63 $1,658 NM
Basic Net Income per Share $(0.13) $0.00 $0.13 NM
Adjusted EBITDA (a) $12,784 $12,671 ($113) (0.9%)
Capital Expenditures $2,815 $2,357 ($458) (16.3%)
(a) Adjusted EBITDA is defined as consolidated net income (loss) plus interest expense, depreciation and amortization, income taxes and certain non-recurring fees,
expenses or charges and other non-cash charges reducing consolidated net income. Adjusted EBITDA is not a measure calculated in accordance with generally
acceptable accounting principles (GAAP). While providing useful information, Adjusted EBITDA should not be considered in isolation or as a substitute for consolidated
statement of operations data prepared in accordance with GAAP. The Company believes Adjusted EBITDA is useful as a tool to analyze the Company on the basis of
operating performance and leverage. The definition of Adjusted EBITDA corresponds to the definition of Adjusted EBITDA in the indenture governing the Company’s
senior subordinated notes and its credit facility and certain of the covenants contained therein. The Company’s presentation of Adjusted EBITDA may not be
comparable to similarly titled measures used by other companies. For an explanation of Adjusted EBITDA to Net Income, see the company’s website.
12
|
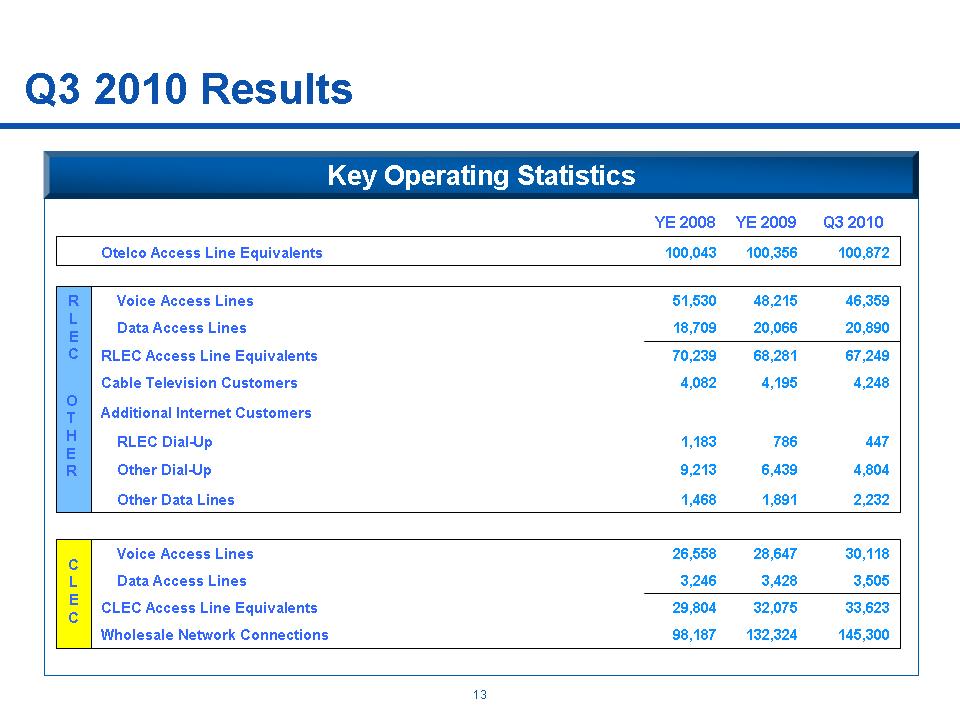 |
Q3 2010 Results
Key Operating Statistics
R
L
E
C
O
T
H
E
R
C
L
E
C
YE 2008 YE 2009 Q3 2010
Otelco Access Line Equivalents 100,043 100,356 100,872
Voice Access Lines 51,530 48,215 46,359
Data Access Lines 18,709 20,066 20,890
RLEC Access Line Equivalents 70,239 68,281 67,249
Cable Television Customers 4,082 4,195 4,248
Additional Internet Customers
RLEC Dial-Up 1,183 786 447
Other Dial-Up 9,213 6,439 4,804
Other Data Lines 1,468 1,891 2,232
Voice Access Lines 26,558 28,647 30,118
Data Access Lines 3,246 3,428 3,505
CLEC Access Line Equivalents 29,804 32,075 33,623
Wholesale Network Connections 98,187 132,324 145,300
13
|
 |
Balance Sheet
|
 |
Conservative Balance Sheet
• Cash growth, after IDS distributions and $5 million voluntary debt
repayment, averages $3 million annually since IPO
• Payout ratio 97% in 2008, 95.3% in 2009 (including $5 million
voluntary debt repayment) and 81.6% through 3Q2010
• Senior leverage of 3.4x and total leverage of 5.5x well within
industry norms
• Additional $6.1 million voluntary debt repayment November 2010
• Senior debt matures October 2013; IDS subordinated debt matures
December 2019
• Interest rate swaps on $150 million average 2% LIBOR through
February 2012
15
|
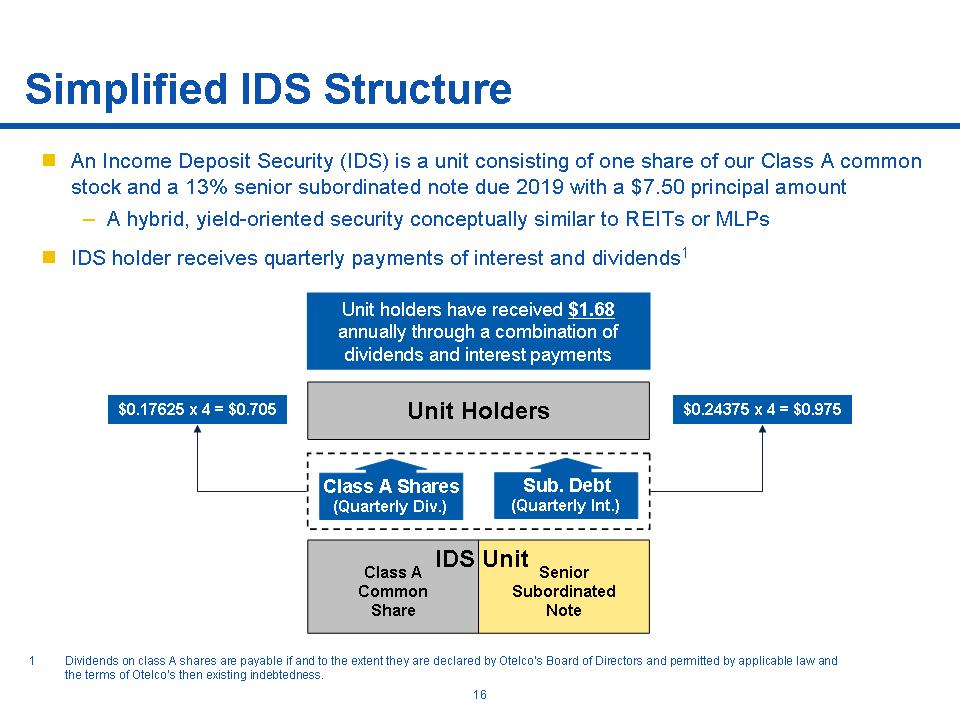 |
Simplified IDS Structure
. An Income Deposit Security (IDS) is a unit consisting of one share of our Class A common
stock and a 13% senior subordinated note due 2019 with a $7.50 principal amount
– A hybrid, yield-oriented security conceptually similar to REITs or MLPs
. IDS holder receives quarterly payments of interest and dividends1
Unit Holders
Sub. Debt
(Quarterly Int.)
Class A Shares
(Quarterly Div.)
$0.17625 x 4 = $0.705 $0.24375 x 4 = $0.975
Unit holders have received $1.68
annually through a combination of
dividends and interest payments
Senior
Subordinated
Note
Class A
Common
Share
IDS Unit
Dividends on class A shares are payable if and to the extent they are declared by Otelco’s Board of Directors and permitted by applicable law and
the terms of Otelco’s then existing indebtedness.
16
|
 |
Dividend Policy
. Dividends are established by the Board of Directors
. Twenty-four consecutive IDS quarterly distribution payments of interest and dividends of
US$0.42 per IDS
. Board considers historical performance and the current market environment in which the
Company operates in establishing dividend level
. 2008, 2009 and 2010 dividends considered a return of capital
17
|
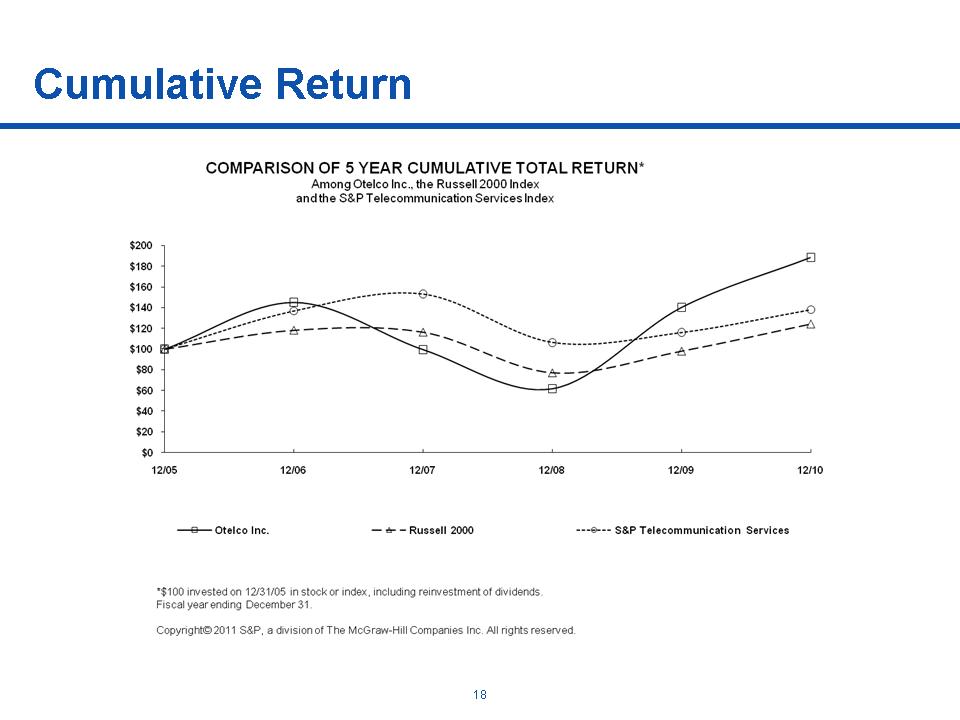 |
Cumulative Return
18
|
 |
Michael D. Weaver -CEO
Curtis L. Garner, Jr. -CFO
|