Attached files
| file | filename |
|---|---|
| 8-K - FORM 8-K - STERLING FINANCIAL CORP /WA/ | d8k.htm |
 Sandler O’Neill + Partners
New York City
February 8, 2011
Ticker: STSA
Spokane, Washington
www.sterlingfinancialcorporation-spokane.com
*
*
*
*
*
*
Exhibit 99.1 |
 Safe Harbor
(1) The Reform Act defines the term "forward-looking statements"
to include: statements of management plans and objectives, statements regarding the future economic performance, and projections of revenues and
other financial data, among others. The Reform Act precludes liability for
oral or written forward-looking statements if the statement is identified as such and accompanied by "meaningful cautionary statements
identifying important factors that could cause actual results to
differ materially from those made in the forward-looking
statements." In
the
course
of
our
presentation,
we
may
discuss
matters
that
are
deemed
to
be
forward-
looking
statements,
which
are
intended
to
be
covered
by
the
safe
harbor
for
“forward-looking
statements”
provided
by
the
Private
Securities
Litigation
Reform
Act
of
1995
(the
“Reform
Act”)
(1)
.
Forward-looking
statements,
including
those
relating
to
our
position
and
strategy
as
a
result
of
our
recapitalization
transactions
discussed
herein,
involve
substantial
risks
and
uncertainties,
many
of
which
are
difficult
to
predict
and
are
generally
beyond
our
control
and
actual
results
may
differ
from
management’s
view
and
our
projected
financial
results.
For
example,
our
strategy
of
acquiring
troubled
institutions
in
FDIC-assisted
transactions
is
subject
to
the
risk
that
we
remain
not
qualified
to
bid
or
are
otherwise
prohibited
by
regulators
from
bidding.
We
assume
no
obligation
to
update
any
forward-looking
statements
(including
any
projections)
to
reflect
any
changes
or
events
occurring
after
the
date
hereof.
Additional
information
about
risks
of
Sterling
achieving
results
suggested
by
any
forward-
looking
statements
may
be
found
in
Sterling’s
10-K,
10-Q
and
other
SEC
filings,
including
under
the
headings
“Risk
Factors”
and
“Management’s
Discussion
and
Analysis
of
Financial
Condition
and
Results
of
Operations.”
This
presentation
contains
certain
Non-GAAP
financial
measures.
Reconciliations
to
the
comparable
GAAP
measures
are
set
forth
on
page
20.
2 |
 Based in Spokane, Wash.,
STSA is one of the largest
commercial banks, by assets,
headquartered in the Pacific
Northwest
(1)
$6.9 billion of deposits with an
average cost of 1.13%
More than 25,000 commercial
accounts and nearly 200,000
retail accounts
J.D. Power and Associates
award winner
for customer
service
(2)
178 branches in 5 states
Source: SNL Financial, Company filings
Note: Financial data as of Dec. 31, 2010.
(1)
Pacific Northwest defined as Idaho, Oregon, and Washington.
(2)
J.D. Power and Associates 2010 Retail Banking Satisfaction Study.
(3)
Deposit market share data as of 6/30/2010.
MONTANA
IDAHO
OREGON
WASHINGTON
San Jose
San
Francisco
Stockton
Sacramento
Santa
Rosa
Eugene
Salem
Portland
Seattle
Spokane
Walla
Great Falls
Helena
Billings
Boise
Major cities
Sterling branches
Key Statistics as of 12/31/2010
(billions)
Total assets:
$9.5
Total deposits
6.9
Net Loans
5.4
Deposit Market Share
(3)
State
Branches
Rank
Market Share
Washington
72
7
3.20%
Oregon
67
7
3.58%
California
13
46
0.14%
Idaho
18
11
2.57%
Montana
8
14
1.21%
Sterling Franchise at a Glance
3 |
 2010
Achievements Successful $730 million capital infusion (August
2010) Anchors Warburg Pincus and Thomas H. Lee Partners, plus
additional PIPE investors U.S. Treasury preferred stock ($303
million) converted to common Fortified management and board leadership
driving future success Les Biller, chairman; anchor investors hold
board seats Recent appointments (Howard Behar, Webb Edwards and Pat
Rusnak) pending regulatory approval
Cease and desist order lifted by regulators (September 2010);
replaced with an MOU
Merger of Golf Savings Bank into Sterling Savings Bank
Further reductions in high-risk assets and NPLs
Core earnings power (current EPS generation masked by NPL drag)
4 |
 Highlights
Reported Q4 net loss
(1)
of $38 million, or $10 million lower than Q3
Experienced a declining provision for credit losses of $30 million,
compared to $61 million in Q3 and $340 million in Q4 2009
NPLs of $655 million were down from $809 million in Q3,
a decline of 19%
Reduced construction loan exposure
Down $990 million, or 65%, since Dec. 31, 2009
Quality deposit metrics continue to drive down cost of funds
Deposit costs decreased 14bps in Q4 and 63bps during 2010
Stabilizing mix: Reduced brokered deposits; improved funding costs
Adjusted pre-tax, pre-provision earnings of $43 million
(1)
Excludes a one-time, non-cash charge for the conversion of preferred stock
to common stock. The Q4 net loss attributable to common shareholders was $642.7 million or
$12.79 per common diluted share.
5 |
 2010 Financial /
Operating Highlights 6 |
 Sterling’s
Formula for Success 7
Cost-
effective
Funding
Improved
Asset
Quality
High Quality,
Relationship
Based Asset
Generation
Expense
Control
Profitable
Growth
Focus on Customers
Deliver value to customers through fair pricing and competitive products
and services
Intelligent market segmentation
Increased emphasis on sales and business development
Simplify the Business -
Back to Basics banking drives growth
Strategic Expansion
Expand in key markets and segments
Opportunistic hiring –
e.g. commercial bankers and home loan officers
Manage to potential regulatory changes |
 Deposit
Composition 8 |
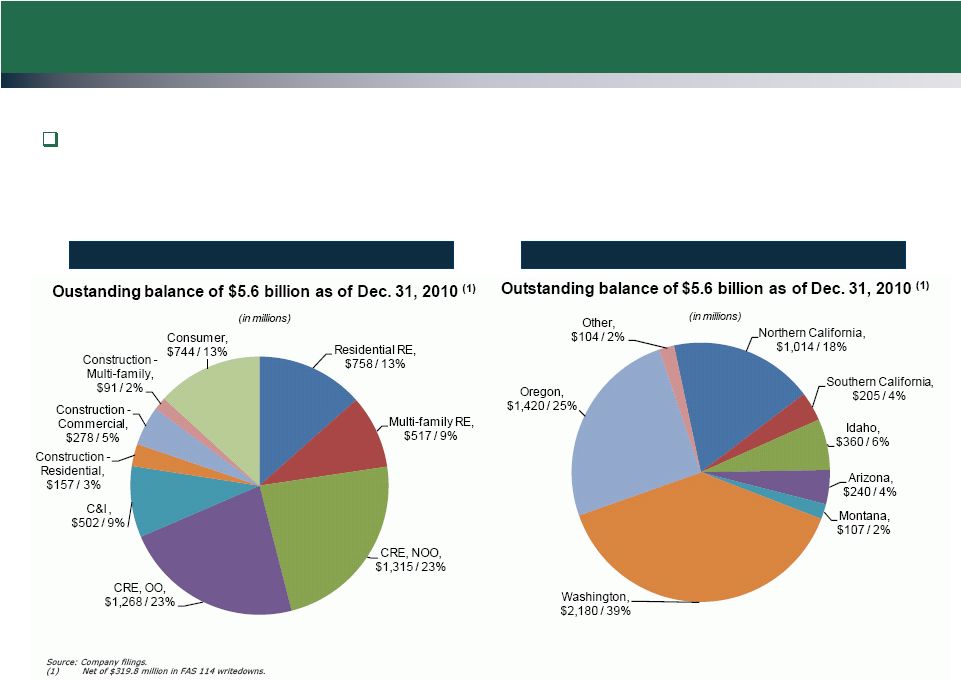 Loan Portfolio
Summary Reducing Construction and Focusing on Relationship-Based Lending
Gross
loans
decreased
by
$288
million
during
Q4
2010
and
by
$2.1
billion
since Q4 2009 –
reductions of 5% and 27%, respectively
Loan mix by geography
Loan mix by category
9 |
 Commercial,
$167 / 50%
Multi-family,
$62 / 19%
Residential -
vertical
$48 / 14%
Lots,
$23 / 7%
Raw land
$18 / 5%
A&D
$18 / 5%
Outstanding balance of $336 million as of Dec. 31, 2010
(in millions)
Construction Loan Exposure Decreasing
Construction loans of $526 million (9% of total
loans) as of 12/31/2010
Construction non-performing loans of $336
million (51% of total NPLs) as of 12/31/2010
Aggressively shrinking construction portfolio
Currently 9% of total loans vs. 32% in 4Q 2007
Construction balances have decreased $2.4 billion,
or 82% vs. 4Q 2007
Residential construction concentration reduced to
3% at Q4 2010 from 9% at Q4 2009
Non-performing construction loans
Total construction loans
10
Commercial,
$278 / 53%
Multi-family,
$91 / 17%
Residential -
vertical,
$72 / 14%
Lots,
$40 / 8%
Raw land,
$23 / 4%
A&D,
$22 / 4%
Outstanding balance of $526 million as of Dec. 31, 2010
(in millions)
$158.3
$533.7
$551.9
$639.6
$618.5
$540.4
$458.6
$335.7
$-
$100.0
$200.0
$300.0
$400.0
$500.0
$600.0
$700.0
1Q09
2Q09
3Q09
4Q09
1Q10
2Q10
3Q10
4Q10
Non-performing construction loans
(in millions) |
 Improving Trend
in Classified and Non-Performing Assets 11
|
  Non-performing
Loan (NPL) Flow Analysis 12
Year-to-date
(in millions)
3/31/2010
6/30/2010
9/30/2010
12/31/2010
12/31/2010
NPLs beginning-of-period
$895.9
$958.8
$884.2
$809.0
$895.9
Additions/increases
327.3
263.5
171.6
62.5
824.9
Return to accruing status
(28.7)
(45.2)
(16.6)
(11.1)
(101.6)
Charge-offs
(136.5)
(101.8)
(77.1)
(31.4)
(346.8)
Transfer to OREO
(51.0)
(83.1)
(74.3)
(58.6)
(267.0)
Payments/sales
(48.2)
(108.0)
(78.8)
(115.8)
(350.8)
NPLs end of period
$958.8
$884.2
$809.0
$654.6
$654.6
% decline since beginning of year
27%
For the quarter ended |
 Summary
Executing on our strategic plan
Strong regional franchise with critical mass
Valuable, core-deposit franchise drives earnings power
Continued improvement in asset quality metrics
High-quality, relationship-driven asset generation
Ongoing expense management
Capitalization
Exceeds regulatory levels required for
“well-capitalized” status
Additional capital in place for opportunistic growth
Strengthened corporate governance
Earnings power continues to progress
Strong core earnings power masked by current NPL drag
Focused on increasing pre-tax, pre-provision earnings
Expected upon realization of Deferred Tax Asset of $359 million
13 |
 Appendix
14
*
*
*
*
*
*
* |
 Capital Compared
to Peers 15
Source: SNL Financial and company filings. Sterling financial data as of Dec.
31, 2010. Peer group data as of most recent quarter available. (1)
Peers include all U.S. depository institutions with $7 billion -
$25 billion in assets.
12/31/2010
Peer median
(1)
TCE/TA
8.0%
7.5%
Tier 1 leverage:
10.1%
8.9%
Tier 1 risk-based capital
16.2%
13.3%
Total risk-based capital
17.5%
15.3%
NPA/Tier 1 Capital + ALLL
67.2%
n/a |
  MBS, $2,089,
74%
Muni bonds, $199,
7%
Corp, $21, 1%
Tax credit, $13,
0%
Other, $1, 0%
Non-agency, $48,
2%
Ginnie Mae,
$234, 8%
Freddie Mac,
$58, 2%
Fannie Mae,
$171, 6%
$2.8 billion total portfolio
(in millions)
High Quality, Low Risk Investment Portfolio
Strategy remains to reduce exposure to 30-yr MBS
and replace with 10-
and 15-year MBS with good
cash flows to fund loan growth
74% FNMA, FHLMC and GNMA pass-throughs
Rise in average life and duration in Q4 attributable
to higher market interest rates and reduction in
balances of short CMO balances
Source: Company filings.
(1)
Durations and average life measures are base case, under current
market rates.
(2)
Yields are quarter-ending yields.
Investment Portfolio
Weighted Avg. Life and Effective Duration
3.21%
overall
portfolio
yield
(2)
MBS Composition
16
4.36
4.12
3.46
4.96
3.52
3.41
2.64
3.64
0
1
2
3
4
5
6
3/31/2010
6/30/2010
9/30/2010
12/31/2010
WA Life-Base case
Eff Dur -
Base case
Yield
(2)
4.58%
4.18% 3.58%
3.12%
$1.60B
$1.49B
$2.28B
$2.60B |
 Source: Company filings.
Loan Portfolio –
Construction Summary
Construction (residential, commercial and multi-family) totals $526
million as of 12/31/2010
Decreased by $194 million during Q4 2010, a 27% decline
Concentration reduced to 9% of gross loan portfolio as of 12/31/2010, down
from 20% as of 12/31/2009
Non-performing construction assets represent 53% of all
non-performing assets as of 12/31/2010
Over 90% of commercial construction portfolio re-appraised over the last
12 months 17 |
 Loan Portfolio
– CRE Non-Owner Occupied
Includes Multi-family
Non-owner-occupied commercial real estate, including
multi-family portfolio totals $1.8 billion as of 12/31/2010
Decreased by $89 million, or 5% year over year
Concentration is 33% of gross loans as of 12/31/2010, up from 25% at
12/31/2009
8% of non-owner occupied CRE loans were non-performing as of
12/31/2010 Source: Company filings.
18 |
 Loan Portfolio
– CRE Owner-Occupied
Includes SBA
Owner-occupied commercial real estate totals $1.27 billion as of
12/31/2010 Decreased by $212 million year over year, a 14%
decline Concentration was 23% of gross loans at 12/31/2010
6% of owner-occupied CRE loans were non-performing at
12/31/2010 SBA loans are $112 million, or 9% of total
owner-occupied CRE loans at 12/31/2010 19 |
 Adjusted
Pre-Tax, Pre-Provision Income 20
(1)
Management believes that this presentation of non-GAAP results provides
useful information to investors regarding the effects of the credit cycle on the Company’s reported results of
operations.
(in thousands, unaudited)
Year-to-Date
Mar 31,
June 30,
Sept 30,
Dec 31,
Dec 31,
2010
2010
2010
2010
2010
Loss before income taxes
(84,346)
$
(53,773)
$
(48,022)
$
(38,141)
$
(224,282)
$
Provision for credit losses
88,556
70,781
60,892
30,000
250,229
OREO
10,923
17,206
10,456
23,993
62,578
Interest reversal on non-performing loans
23,721
20,711
17,302
15,527
77,261
Charge on prepayment of debt
0
0
0
11,296
11,296
Total
(1)
38,854
$
54,925
$
40,628
$
42,675
$
177,082
$
Three Months Ended |
 Sandler O’Neill + Partners
New York City
February 8, 2010
Ticker: STSA
Spokane, Washington
www.sterlingfinancialcorporation-spokane.com
Investor Contacts
Daniel G. Byrne
David Brukardt
EVP/Corporate Development
EVP/Investor and Corporate Relations
(509) 458-3711
(509) 863-5423
Media Contact
Cara Coon
VP/Communications and Public Affairs Director
(509) 626-5348 |