Attached files
| file | filename |
|---|---|
| 8-K - FORM 8-K - IMPERIAL OIL LTD | d8k.htm |
|
|

| |
|
| ||
|
Exhibit 99.1 |
|
Q4 news release
FOR THE TWELVE MONTHS ENDED DECEMBER 31, 2010
|
|
Calgary, January 31, 2011
Imperial Oil announces estimated fourth-quarter financial and operating results
|
| Fourth quarter | Twelve months | |||||||||||||
| (millions of dollars, unless noted) | 2010 | 2009 | % | 2010 | 2009 | % | ||||||||
| Net income (U.S. GAAP) |
799 | 534 | 50 | 2,210 | 1,579 | 40 | ||||||||||
| Net income per common share |
||||||||||||||||
| - assuming dilution (dollars) |
0.94 | 0.62 | 50 | 2.59 | 1.84 | 40 | ||||||||||
| Capital and exploration expenditures |
1,065 | 834 | 28 | 4,045 | 2,438 | 66 | ||||||||||
|
Bruce March, chairman, president and chief executive officer of Imperial Oil, commented: |
|
“Imperial Oil’s focus on operational excellence delivered strong results with fourth quarter earnings of $799 million or $0.94 per share, up from $534 million in the fourth quarter of 2009. The 50 percent earnings increase resulted primarily from improved downstream margins, higher crude oil commodity prices and improved refinery operations. These factors were partially offset by unfavourable foreign exchange effects of the stronger Canadian dollar. Strong operating performance in all business segments allowed us to capture the higher crude oil realizations in the Upstream and improved margins in petroleum product markets.
Earnings for the full year 2010 were $2,210 million or $2.59 per share, up from $1,579 million in the full year 2009, an increase of 40 percent.
Our consistent long-term business approach and disciplined investment strategy will continue to position Imperial to grow without compromising base business performance. Capital and exploration expenditures for 2010 were $4 billion, up 66 percent from last year and included continued investment in the Kearl oil sands project. Capital expenditures in the fourth quarter were funded almost entirely through internally generated funds.”
Imperial Oil is one of Canada’s largest corporations and a leading member of the country’s petroleum industry. The company is a major producer of crude oil and natural gas, Canada’s largest petroleum refiner, a key petrochemical producer and a leading marketer with a coast-to-coast supply network that includes about 1,850 retail service stations. |
1
|
|
| |||
|
| ||||
|
Fourth quarter items of interest | ||||
| • |
Net income was $799 million, compared with $534 million for the fourth quarter of 2009, an increase of 50% or $265 million. | |||
| • |
Net income per common share was $0.94, an increase of 50% from the fourth quarter of 2009. | |||
| • |
Cash generated from operating activities was $1,004 million, compared with $927 million in the same period last year when changes in working capital also contributed cash flow. | |||
| • |
Capital and exploration expenditures were $1,065 million, up 28% from the fourth quarter of 2009, as a result of progressing the Kearl oil sands and other growth projects. | |||
| • |
Gross oil-equivalent barrels of production averaged 302,000 barrels a day, compared with 297,000 barrels a day in the same period last year. Higher production volumes in the fourth quarter were primarily due to increased Cold Lake bitumen production, a result of improved facility reliability and the cyclic nature of production at Cold Lake. | |||
| • |
Safety performance – Imperial achieved another best-ever safety performance year for employees and near-best year for contractors in its relentless pursuit of a workplace where nobody gets hurt. The company’s Operations Integrity Management System (OIMS) provides a rigorous and systematic approach to managing safety, health, environmental and security risks throughout all aspects of its business. | |||
| • |
Oil sands tailings research – Imperial will work with Canadian Natural Resources, Shell Canada, Suncor Energy, Syncrude Canada, Teck Resources and Total E&P Canada to advance tailings management. The companies agreed to share existing technologies and research and to cooperate on a coordinated research and development plan going forward to improve the pace of oil sands reclamation. | |||
| • |
Kearl oil sands project update – the initial development at Kearl is more than 50 percent complete and is progressing on schedule with expected start up in late 2012. The production rate for the initial development will start at about 110 thousand barrels a day. | |||
| • |
Mackenzie natural gas project update – the National Energy Board announced its approval of plans to build and operate the project, subject to federal cabinet approval and 264 conditions in areas such as engineering, safety and environmental protection. | |||
| • |
Horn River update – Imperial has begun its 2011 winter program which includes drilling exploration wells and beginning a horizontal multi-well pad pilot development to evaluate longer term well productivity. Imperial also added additional acreage, bringing its joint venture holdings to 346,000 net acres – one of industry’s largest acreage positions in the area. | |||
| • |
Strong volumes in Fuels Marketing – total Retail fuel sales volume in 2010 was the highest in the history of the business, surpassing the prior record set in 2009. Growth was observed in both company-owned same store sales and through our branded wholesale network. In addition, the Aviation business also achieved a sales record in 2010. | |||
| • |
Capital and exploration expenditures – cash generated by Imperial’s businesses helped fund $4 billion in 2010 capital and exploration expenditures, including continued investment in the Kearl oil sands project. Planned capital and exploration expenditures in 2011 are between $4.0 and $4.5 billion and the company is looking to invest about $35 to $40 billion in growth projects over the next decade. | |||
| • |
Contributed to Canadian communities – Imperial contributed $15 million to Canadian communities in 2010, including the launch of Imperial’s signature program, Indigenous Women in Community Leadership. The program supports First Nations, Métis and Inuit women leaders in Canada in their pursuit of community development and economic independence. | |||
2

|
| |
|
| ||
|
Fourth quarter 2010 vs. fourth quarter 2009
The company’s net income for the fourth quarter of 2010 was $799 million or $0.94 a share on a diluted basis, compared with $534 million or $0.62 a share for the same period last year.
Earnings in the fourth quarter were higher than the same quarter in 2009 with improvements across all operating segments. The higher fourth quarter earnings were primarily attributable to stronger downstream margins of about $160 million, higher upstream crude oil commodity prices of about $80 million and improved refinery operations of about $65 million. These factors were partially offset by the unfavourable foreign exchange effects of the stronger Canadian dollar of about $85 million.
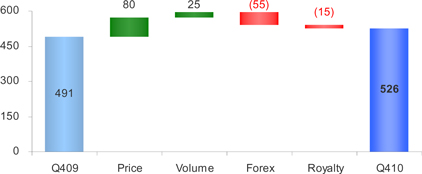
Upstream net income in the fourth quarter was $526 million, $35 million higher than the same period of 2009. Earnings benefited from higher crude oil commodity prices of about $80 million, including the $35 million negative impact from third-party pipeline reliability issues, and increased Cold Lake bitumen production of about $60 million. These factors were partially offset by the unfavourable foreign exchange effects of the stronger Canadian dollar of about $55 million, lower volumes at Syncrude of about $20 million as a result of planned maintenance activities, and higher royalties due to higher commodity prices of about $15 million.
The average price of Brent crude oil was U.S. $86.49 a barrel in the fourth quarter, up about 16 percent versus the corresponding period last year. The company’s average realizations on sales of Canadian conventional crude oil and synthetic crude oil from Syncrude production also increased. However, the company’s average bitumen realizations were slightly lower in the fourth quarter of 2010 versus 2009, reflecting a widened price spread between the lighter crude oils and Cold Lake bitumen, partly a result of third-party pipeline outages.
Gross production of Cold Lake bitumen averaged 147 thousand barrels a day during the fourth quarter, up from 134 thousand barrels in the same quarter last year. Higher volumes were due to improved facility reliability as well as the cyclic nature of production at Cold Lake.
The company’s share of Syncrude’s gross production in the fourth quarter was 79 thousand barrels a day, versus 82 thousand barrels in the fourth quarter of 2009. Slightly lower volumes were the result of planned maintenance activities, which began in September 2010 and were successfully completed in the fourth quarter of 2010.
Gross production of conventional crude oil averaged 24 thousand barrels a day in the fourth quarter, unchanged from the same period last year.
Gross production of natural gas during the fourth quarter of 2010 was 275 million cubic feet a day, down slightly from 298 million cubic feet in the same period last year. The lower production volume was primarily a result of natural reservoir decline.
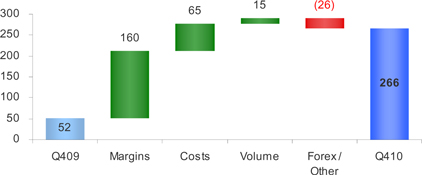
Downstream net income was $266 million in the fourth quarter of 2010, $214 million higher than the same period a year ago. Earnings benefited from stronger overall margins of about $160 million, improved refinery operations of about $65 million along with improved sales volumes of about $15 million. These factors were partially offset by the unfavourable effects of the stronger Canadian dollar of about $30 million.
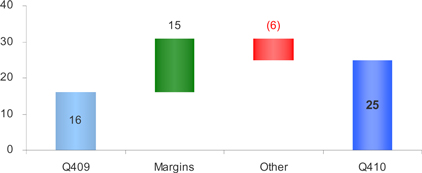
Chemical net income was $25 million in the fourth quarter, $9 million higher than the same quarter last year. Improved industry margins for polyethylene and intermediate products were the main contributors to the increase.
Net income effects from Corporate and other were negative $18 million in the fourth quarter, compared with negative $25 million in the same period of 2009. |
3
|
|
| |
|
| ||
|
Fourth quarter 2010 vs. fourth quarter 2009 (continued) | ||
|
Cash flow generated from operating activities was $1,004 million during the fourth quarter of 2010, compared with $927 million in the same period of 2009. Higher cash flow was primarily driven by increased earnings partially offset by working capital effects.
Investing activities used net cash of $992 million in the fourth quarter compared to $785 million in the corresponding period in 2009. Additions to property, plant and equipment were $1,045 million in the fourth quarter, compared with $807 million during the same quarter in 2009. For the Upstream segment, expenditures were primarily directed towards the advancement of the Kearl oil sands project. Other investments included development drilling at Cold Lake, exploration drilling at Horn River as well as environmental projects at Syncrude.
In the fourth quarter, the company increased its debt level by $300 million by drawing on existing facilities.
The company’s balance of cash was $267 million at December 31, 2010, compared with $513 million at the end of 2009. |
4
|
|
| |||
|
| ||||
|
Full year highlights | ||||
| • |
2010 net income was $2,210 million, up from $1,579 million in 2009. | |||
| • |
2010 net income per common share increased to $2.59 compared to $1.84 in 2009. | |||
| • |
Cash generated from operations was $3,207 million, more than double the $1,591 million generated in 2009. | |||
| • |
Capital and exploration expenditures were $4,045 million, up 66 percent, supporting the Kearl oil sands and other growth projects. | |||
| • |
Gross oil-equivalent barrels of production averaged 294 thousands of barrels a day, slightly higher than 293 thousands of barrels a day in 2009. | |||
| • |
Per-share dividends declared in 2010 totaled $0.43, up from $0.40 in 2009. | |||
|
| ||||
|
Full year 2010 vs. full year 2009
Net income in 2010 was $2,210 million or $2.59 a share on a diluted basis, versus $1,579 million or $1.84 a share for the full year 2009.
For the full year 2010, earnings increased primarily due to the impacts of higher upstream commodity prices of about $880 million, improved refinery operations and lower refinery maintenance activities totaling about $145 million, increased Cold Lake bitumen production of about $90 million, improved Syncrude volumes of about $70 million, and higher Downstream sales volumes and margins of about $35 million and $30 million respectively. These factors were partially offset by the unfavourable effects of the stronger Canadian dollar of about $410 million and higher royalty costs due to higher commodity prices of about $255 million. Gains from sale of non-operating assets in 2010 were about $40 million higher than the previous year.
Upstream net income for the year was $1,764 million, up $440 million from 2009. Higher crude oil and natural gas commodity prices in 2010 increased revenues, contributing to higher earnings of about $880 million. Earnings were also positively impacted by higher Cold Lake bitumen production of about $90 million and higher Syncrude volumes, reflecting improved reliability, of about $70 million. These factors were partially offset by the impact of the stronger Canadian dollar of about $320 million and higher royalty costs due to higher commodity prices of about $255 million. Third-party pipeline reliability issues in the second half of 2010 negatively impacted the supply and transportation of western crude oil. The company estimates the negative impact on earnings of about $80 million mostly from lower realizations in the third quarter and October of 2010, the effect of which has been reflected in the commodity price factor above.
The average price of Brent crude was U.S. $79.50 a barrel in 2010, up about 29 percent from the previous year. The company’s average realizations on sales of Canadian conventional crude oil and synthetic crude oil from Syncrude production also increased. The company’s average bitumen realizations were slightly higher in 2010, but by less than the relative increase in light crude oil prices, reflecting a widened price spread between the lighter crude oils and Cold Lake bitumen, attributable to third-party pipeline outages.
Gross production of Cold Lake bitumen increased to 144 thousand barrels a day in 2010 from 141 thousand barrels in 2009. Higher volumes in 2010 were due to improved facility reliability as well as the cyclic nature of production at Cold Lake. | ||||
5
|
|
| |
|
| ||
|
Full year 2010 vs. full year 2009 (continued)
| ||
| The company’s share of gross production from Syncrude averaged 73 thousand barrels a day this year, up from 70 thousand barrels in 2009. Increased production was due to improved operational reliability.
2010 gross production of conventional crude oil averaged 23 thousand barrels a day, compared with 25 thousand barrels in 2009. Planned maintenance activities at the Norman Wells field and natural reservoir decline were the main contributors to the lower production.
Gross production of natural gas in 2010 was 280 million cubic feet a day, down from 295 million cubic feet in 2009. The lower production volume was primarily a result of natural reservoir decline and maintenance activities.
2010 Downstream net income was $442 million, an increase of $164 million over 2009. Higher earnings were primarily due to favourable impacts of about $145 million associated with improved refinery operations and lower refinery maintenance activities, improved sales volumes of about $35 million and an additional contribution from sale of non-operating assets of about $35 million. Stronger overall margins also contributed about $30 million to the earnings increase, despite a negative impact from alternate sourcing of crude oil as a result of third-party pipeline outages. These factors were partially offset by the unfavourable effects of the stronger Canadian dollar of about $90 million.
Twelve-month Chemical net income was $69 million, up $23 million from 2009. Improved industry margins were partially offset by lower sales volumes for polyethylene products and higher costs due to planned maintenance activities.
2010 net income effects from Corporate and other were negative $65 million, in line with the negative $69 million reported last year.
Key financial and operating data follow.
Forward-Looking Statements
Statements in this report relating to future plans, projections, events or conditions are forward-looking statements. Actual future results, including project plans, costs, timing and capacities; financing sources; the resolution of contingencies and uncertain tax positions; the effect of changes in prices and other market conditions; and environmental and capital expenditures could differ materially depending on a number of factors, such as the outcome of commercial negotiations; changes in the supply of and demand for crude oil, natural gas, and petroleum and petrochemical products; political or regulatory events; and other factors discussed in Item 1A of the company’s 2009 Form 10K. |
6
Attachment I
IMPERIAL OIL LIMITED
FOURTH QUARTER 2010
| Fourth Quarter | Twelve Months | |||||||||||||||
| millions of Canadian dollars, unless noted
|
2010 | 2009 | 2010 | 2009 | ||||||||||||
| Net income (U.S. GAAP) |
||||||||||||||||
| Total revenues and other income |
6,936 | 5,864 | 25,092 | 21,398 | ||||||||||||
| Total expenses |
5,883 | 5,119 | 22,138 | 19,198 | ||||||||||||
| Income before income taxes |
1,053 | 745 | 2,954 | 2,200 | ||||||||||||
| Income taxes |
254 | 211 | 744 | 621 | ||||||||||||
| Net income |
799 | 534 | 2,210 | 1,579 | ||||||||||||
| Net income per common share (dollars) |
0.95 | 0.63 | 2.61 | 1.86 | ||||||||||||
| Net income per common share - assuming dilution (dollars) |
0.94 | 0.62 | 2.59 | 1.84 | ||||||||||||
| Gain/(loss) on asset sales, after tax |
30 | 12 | 80 | 38 | ||||||||||||
| Total assets at December 31 |
20,580 | 17,473 | ||||||||||||||
| Total debt at December 31 |
756 | 140 | ||||||||||||||
| Interest coverage ratio - earnings basis |
||||||||||||||||
| (times covered) |
370.3 | 276.0 | ||||||||||||||
| Other long-term obligations at December 31 |
2,753 | 2,839 | ||||||||||||||
| Shareholders’ equity at December 31 |
11,177 | 9,439 | ||||||||||||||
| Capital employed at December 31 |
11,966 | 9,615 | ||||||||||||||
| Return on average capital employed (a) |
||||||||||||||||
| (percent) |
20.5 | 16.8 | ||||||||||||||
| Dividends on common stock |
||||||||||||||||
| Total |
93 | 85 | 364 | 340 | ||||||||||||
| Per common share (dollars) |
0.11 | 0.10 | 0.43 | 0.40 | ||||||||||||
| Millions of common shares outstanding |
||||||||||||||||
| At December 31 |
847.6 | 847.6 | ||||||||||||||
| Average - assuming dilution |
853.6 | 854.0 | 854.2 | 856.7 | ||||||||||||
| (a) | Return on capital employed is the net income excluding after-tax cost of financing, divided by the average of beginning and ending capital employed. |
7
Attachment II
IMPERIAL OIL LIMITED
FOURTH QUARTER 2010
| Fourth Quarter | Twelve Months | |||||||||||||||
| millions of Canadian dollars | 2010 | 2009 | 2010 | 2009 | ||||||||||||
| Total cash and cash equivalents at period end |
267 | 513 | 267 | 513 | ||||||||||||
| Net income |
799 | 534 | 2,210 | 1,579 | ||||||||||||
| Adjustment for non-cash items: |
||||||||||||||||
| Depreciation and depletion |
186 | 197 | 747 | 781 | ||||||||||||
| (Gain)/loss on asset sales |
(37 | ) | (13 | ) | (95 | ) | (45 | ) | ||||||||
| Deferred income taxes and other |
97 | (12 | ) | 152 | (61 | ) | ||||||||||
| Changes in operating assets and liabilities |
(41 | ) | 221 | 193 | (a) | (663 | ) | |||||||||
| Cash from (used in) operating activities |
1,004 | 927 | 3,207 | 1,591 | ||||||||||||
| Cash from (used in) investing activities |
(992 | ) | (785 | ) | (3,709 | ) | (2,216 | ) | ||||||||
| Proceeds from asset sales |
49 | 22 | 144 | 67 | ||||||||||||
| Cash from (used in) financing activities |
204 | (87 | ) | 256 | (836 | ) | ||||||||||
| (a) | 2010 cash flow from operating activities was positively impacted by the higher payable balances due to timing of expenditures and other working capital effects. |
8
Attachment III
IMPERIAL OIL LIMITED
FOURTH QUARTER 2010
| Fourth Quarter | Twelve Months | |||||||||||||||
| millions of Canadian dollars | 2010 | 2009 | 2010 | 2009 | ||||||||||||
| Net income (U.S. GAAP) |
||||||||||||||||
| Upstream |
526 | 491 | 1,764 | 1,324 | ||||||||||||
| Downstream |
266 | 52 | 442 | 278 | ||||||||||||
| Chemical |
25 | 16 | 69 | 46 | ||||||||||||
| Corporate and other |
(18 | ) | (25 | ) | (65 | ) | (69 | ) | ||||||||
| Net income |
799 | 534 | 2,210 | 1,579 | ||||||||||||
| Total revenues |
||||||||||||||||
| Upstream |
2,159 | 2,025 | 8,144 | 6,919 | ||||||||||||
| Downstream |
6,027 | 5,019 | 21,619 | 18,381 | ||||||||||||
| Chemical |
358 | 336 | 1,386 | 1,236 | ||||||||||||
| Eliminations/Other |
(1,608 | ) | (1,516 | ) | (6,057 | ) | (5,138 | ) | ||||||||
| Revenues |
6,936 | 5,864 | 25,092 | 21,398 | ||||||||||||
| Purchases of crude oil and products |
||||||||||||||||
| Upstream |
707 | 624 | 2,692 | 2,024 | ||||||||||||
| Downstream |
4,698 | 4,002 | 17,169 | 14,164 | ||||||||||||
| Chemical |
255 | 248 | 1,009 | 898 | ||||||||||||
| Eliminations |
(1,608 | ) | (1,517 | ) | (6,059 | ) | (5,152 | ) | ||||||||
| Purchases of crude oil and products |
4,052 | 3,357 | 14,811 | 11,934 | ||||||||||||
| Production and manufacturing expenses |
||||||||||||||||
| Upstream |
608 | 560 | 2,375 | 2,385 | ||||||||||||
| Downstream |
334 | 323 | 1,413 | 1,372 | ||||||||||||
| Chemical |
52 | 52 | 209 | 194 | ||||||||||||
| Eliminations |
(1 | ) | - | (1 | ) | - | ||||||||||
| Production and manufacturing expenses |
993 | 935 | 3,996 | 3,951 | ||||||||||||
| Capital and exploration expenditures |
||||||||||||||||
| Upstream |
1,006 | 745 | 3,844 | 2,167 | ||||||||||||
| Downstream |
55 | 84 | 184 | 251 | ||||||||||||
| Chemical |
1 | 3 | 10 | 15 | ||||||||||||
| Corporate and other |
3 | 2 | 7 | 5 | ||||||||||||
| Capital and exploration expenditures |
1,065 | 834 | 4,045 | 2,438 | ||||||||||||
| Exploration expenses charged to income included above
|
|
20
|
|
|
27
|
|
|
191
|
|
|
153
|
| ||||
9
Attachment IV
IMPERIAL OIL LIMITED
FOURTH QUARTER 2010
| Operating statistics |
Fourth Quarter |
Twelve Months |
||||||||||||||
| 2010 | 2009 | 2010 | 2009 | |||||||||||||
| Gross crude oil and Natural Gas Liquids (NGL) production |
||||||||||||||||
| (thousands of barrels a day) |
||||||||||||||||
| Cold Lake |
147 | 134 | 144 | 141 | ||||||||||||
| Syncrude |
79 | 82 | 73 | 70 | ||||||||||||
| Conventional |
24 | 24 | 23 | 25 | ||||||||||||
| Total crude oil production |
250 | 240 | 240 | 236 | ||||||||||||
| NGLs available for sale |
6 | 7 | 7 | 8 | ||||||||||||
| Total crude oil and NGL production |
256 | 247 | 247 | 244 | ||||||||||||
| Gross natural gas production (millions of cubic feet a day) |
275 | 298 | 280 | 295 | ||||||||||||
| Gross oil-equivalent production (a) |
||||||||||||||||
| (thousands of oil-equivalent barrels a day) |
302 | 297 | 294 | 293 | ||||||||||||
| Net crude oil and NGL production (thousands of barrels a day) |
||||||||||||||||
| Cold Lake |
116 | 107 | 115 | 120 | ||||||||||||
| Syncrude |
73 | 73 | 67 | 65 | ||||||||||||
| Conventional |
18 | 18 | 17 | 20 | ||||||||||||
| Total crude oil production |
207 | 198 | 199 | 205 | ||||||||||||
| NGLs available for sale |
4 | 6 | 5 | 6 | ||||||||||||
| Total crude oil and NGL production |
211 | 204 | 204 | 211 | ||||||||||||
| Net natural gas production (millions of cubic feet a day) |
252 | 264 | 254 | 274 | ||||||||||||
| Net oil-equivalent production (a) |
||||||||||||||||
| (thousands of oil-equivalent barrels a day) |
253 | 248 | 246 | 257 | ||||||||||||
| Cold Lake blend sales (thousands of barrels a day) |
190 | 174 | 188 | 184 | ||||||||||||
| NGL Sales (thousands of barrels a day) |
7 | 12 | 10 | 10 | ||||||||||||
| Natural gas sales (millions of cubic feet a day) |
270 | 277 | 264 | 272 | ||||||||||||
| Average realizations (Canadian dollars) |
||||||||||||||||
| Conventional crude oil realizations (a barrel) |
74.14 | 69.92 | 71.64 | 60.32 | ||||||||||||
| NGL realizations (a barrel) |
58.94 | 48.15 | 50.09 | 41.19 | ||||||||||||
| Natural gas realizations (a thousand cubic feet) |
3.60 | 4.23 | 4.04 | 4.11 | ||||||||||||
| Synthetic oil realizations (a barrel) |
84.31 | 78.64 | 80.63 | 69.69 | ||||||||||||
| Bitumen realizations (a barrel) |
58.91 | 59.77 | 58.36 | 51.81 | ||||||||||||
| Refinery throughput (thousands of barrels a day) |
467 | 412 | 444 | 413 | ||||||||||||
| Refinery capacity utilization (percent) |
93 | 82 | 88 | 82 | ||||||||||||
| Petroleum product sales (thousands of barrels a day) |
||||||||||||||||
| Gasolines |
226 | 200 | 218 | 200 | ||||||||||||
| Heating, diesel and jet fuels |
177 | 142 | 153 | 143 | ||||||||||||
| Heavy fuel oils |
29 | 31 | 28 | 27 | ||||||||||||
| Lube oils and other products |
41 | 42 | 43 | 39 | ||||||||||||
| Net petroleum products sales |
473 | 415 | 442 | 409 | ||||||||||||
|
Petrochemical Sales (thousands of tonnes a day)
|
|
2.7
|
|
|
2.9
|
|
|
2.7
|
|
|
2.8
|
| ||||
| (a) | Gas converted to oil-equivalent at 6 million cubic feet = 1 thousand barrels |
10
Attachment V
IMPERIAL OIL LIMITED
FOURTH QUARTER 2010
| Net income (U.S. GAAP) (millions of Canadian dollars) |
Net income |
|||||||
| 2006 |
||||||||
| First Quarter |
591 | 0.60 | ||||||
| Second Quarter |
837 | 0.85 | ||||||
| Third Quarter |
822 | 0.84 | ||||||
| Fourth Quarter |
794 | 0.83 | ||||||
| Year |
3,044 | 3.12 | ||||||
| 2007 |
||||||||
| First Quarter |
774 | 0.82 | ||||||
| Second Quarter |
712 | 0.76 | ||||||
| Third Quarter |
816 | 0.88 | ||||||
| Fourth Quarter |
886 | 0.97 | ||||||
| Year |
3,188 | 3.43 | ||||||
| 2008 |
||||||||
| First Quarter |
681 | 0.76 | ||||||
| Second Quarter |
1,148 | 1.29 | ||||||
| Third Quarter |
1,389 | 1.57 | ||||||
| Fourth Quarter |
660 | 0.77 | ||||||
| Year |
3,878 | 4.39 | ||||||
| 2009 |
||||||||
| First Quarter |
289 | 0.34 | ||||||
| Second Quarter |
209 | 0.25 | ||||||
| Third Quarter |
547 | 0.64 | ||||||
| Fourth Quarter |
534 | 0.63 | ||||||
| Year |
1,579 | 1.86 | ||||||
| 2010 |
||||||||
| First Quarter |
476 | 0.56 | ||||||
| Second Quarter |
517 | 0.61 | ||||||
| Third Quarter |
418 | 0.49 | ||||||
| Fourth Quarter |
799 | 0.95 | ||||||
| Year |
2,210 | 2.61 | ||||||
11
Attachment VI
IMPERIAL OIL LIMITED
FOURTH QUARTER 2010
Factors affecting net income (millions of Canadian dollars)
Upstream Earnings Q410 vs Q409
|
|
Q410 | Q409 | Q410 vs Q409 |
|||||||||
|
|
526 |
|
|
491 |
|
|
35 |
| ||||
| Downstream Earnings Q410 vs Q409 |
||||||||||||
|
Q410 | Q409 | Q410 vs Q409 |
|||||||||
|
|
266 |
|
|
52 |
|
|
214 |
| ||||
| Chemical Earnings Q410 vs Q409 |
||||||||||||
|
Q410 | Q409 | Q410 vs Q409 |
|||||||||
|
|
25 |
|
|
16 |
|
|
9 |
| ||||
12