Attached files
| file | filename |
|---|---|
| EX-32.2 - EX-32.2 - IMPERIAL OIL LTD | d297427dex322.htm |
| EX-32.1 - EX-32.1 - IMPERIAL OIL LTD | d297427dex321.htm |
| EX-31.2 - EX-31.2 - IMPERIAL OIL LTD | d297427dex312.htm |
| EX-31.1 - EX-31.1 - IMPERIAL OIL LTD | d297427dex311.htm |
| EX-23.II.A - EX-23(II)(A) - IMPERIAL OIL LTD | d297427dex23iia.htm |
Table of Contents
UNITED STATES SECURITIES AND EXCHANGE COMMISSION
WASHINGTON, D.C. 20549
FORM 10-K
ANNUAL REPORT PURSUANT TO SECTION 13 OR 15 (d) OF THE
SECURITIES EXCHANGE ACT OF 1934
| For the fiscal year-ended December 31, 2016 | Commission file number: 0-12014 |
IMPERIAL OIL LIMITED
(Exact name of registrant as specified in its charter)
| CANADA (State or other jurisdiction of incorporation or organization) |
98-0017682 (I.R.S. Employer Identification No.) |
| 505 QUARRY PARK BOULEVARD S.E., CALGARY, AB, CANADA (Address of principal executive offices) |
T2C 5N1 (Postal Code) |
Registrant’s telephone number, including area code:
1-800-567-3776
Securities registered pursuant to Section 12(b) of the Act:
| Title of each class None
|
Name of each exchange on which registered None
|
Securities registered pursuant to Section 12(g) of the Act:
Common Shares (without par value)
(Title of Class)
Indicate by check mark if the registrant is a well-known seasoned issuer (as defined in Rule 405 of the Securities Act).
Yes ✓ No......
Indicate by check mark if the registrant is not required to file reports pursuant to Section 13 or Section 15(d) of the Securities Exchange Act of 1934.
Yes ......No ✓
Indicate by check mark whether the registrant (1) has filed all reports required to be filed by Section 13 or 15(d) of the Securities Exchange Act of 1934 during the preceding 12 months (or for such shorter period that the registrant was required to file such reports), and (2) has been subject to such filing requirements for the past 90 days.
Yes ✓ No......
Indicate by check mark whether the registrant has submitted electronically and posted on its corporate web site, if any, every Interactive Data File required to be submitted and posted pursuant to Rule 405 of Regulation S-T during the preceding 12 months (or for such shorter period that the registrant was required to submit and post such files).
Yes✓ No......
Indicate by check mark if disclosure of delinquent filers pursuant to Item 405 of Regulation S-K is not contained herein, and will not be contained, to the best of registrant’s knowledge, in definitive proxy or information statements incorporated by reference in Part III of this Form 10-K or any amendment to this Form 10-K.
Yes ✓ No......
Indicate by check mark whether the registrant is a large accelerated filer, an accelerated filer, a non-accelerated filer, or a smaller reporting company (see the definitions of “large accelerated filer”, “accelerated filer” and “smaller reporting company” in Rule 12b-2 of the Securities Exchange Act of 1934).
Large accelerated filer ✓ Accelerated filer...... Non-accelerated filer...... Smaller reporting company......
Indicate by check mark whether the registrant is a shell company (as defined in Rule 12 b-2 of the Securities Exchange Act of 1934).
Yes ......No ✓
As of the last business day of the 2016 second fiscal quarter, the aggregate market value of the voting stock held by non-affiliates of the registrant was Canadian $10,533,578,543 based upon the reported last sale price of such stock on the Toronto Stock Exchange on that date.
The number of common shares outstanding, as of February 8, 2017, was 847,599,011.
1
Table of Contents
| Table of contents | Page | |||||
| 3 | ||||||
| Item 1. |
3 | |||||
| 4 | ||||||
| 4 | ||||||
| 5 | ||||||
| Oil and gas production, production prices and production costs |
6 | |||||
| 8 | ||||||
| 10 | ||||||
| 11 | ||||||
| 11 | ||||||
| 13 | ||||||
| 13 | ||||||
| 13 | ||||||
| 13 | ||||||
| 13 | ||||||
| 14 | ||||||
| 14 | ||||||
| 14 | ||||||
| 15 | ||||||
| 15 | ||||||
| 15 | ||||||
| 15 | ||||||
| 17 | ||||||
| Item 1A. |
17 | |||||
| Item 1B. |
20 | |||||
| Item 2. |
20 | |||||
| Item 3. |
20 | |||||
| Item 4. |
20 | |||||
| 21 | ||||||
| Item 5. |
21 | |||||
| Item 6. |
22 | |||||
| Item 7. |
Management’s discussion and analysis of financial condition and results of operations |
22 | ||||
| Item 7A. |
22 | |||||
| Item 8. |
23 | |||||
| Item 9. |
Changes in and disagreements with accountants on accounting and financial disclosure |
23 | ||||
| Item 9A. |
23 | |||||
| Item 9B. |
23 | |||||
| 24 | ||||||
| Item 10. |
24 | |||||
| Item 11. |
24 | |||||
| Item 12. |
Security ownership of certain beneficial owners and management and related stockholder matters |
25 | ||||
| Item 13. |
Certain relationships and related transactions, and director independence |
25 | ||||
| Item 14. |
26 | |||||
| 27 | ||||||
| Item 15. |
27 | |||||
| Item 16. |
28 | |||||
| 29 | ||||||
| 30 | ||||||
| 86 | ||||||
All dollar amounts set forth in this report are in Canadian dollars, except where otherwise indicated.
Note that numbers may not add due to rounding.
The following table sets forth (i) the rates of exchange for the Canadian dollar, expressed in United States (U.S.) dollars, in effect at the end of each of the periods indicated, (ii) the average of exchange rates in effect on the last day of each month during such periods, and (iii) the high and low exchange rates during such periods, in each case based on the noon buying rate in New York City for wire transfers in Canadian dollars as certified for customs purposes by the Federal Reserve Bank of New York.
| dollars | 2016 | 2015 | 2014 | 2013 | 2012 | |||||||||||||||
|
|
||||||||||||||||||||
| Rate at end of period |
0.7448 | 0.7226 | 0.8620 | 0.9401 | 1.0042 | |||||||||||||||
| Average rate during period |
0.7559 | 0.7748 | 0.9023 | 0.9665 | 1.0006 | |||||||||||||||
| High |
0.7972 | 0.8529 | 0.9423 | 1.0164 | 1.0299 | |||||||||||||||
| Low |
0.6853 | 0.7148 | 0.8588 | 0.9348 | 0.9600 | |||||||||||||||
|
|
||||||||||||||||||||
On February 8, 2017, the noon buying rate in New York City for wire transfers in Canadian dollars as certified for customs purposes by the Federal Reserve Bank of New York was $0.7601 U.S. = $1.00 Canadian.
2
Table of Contents
Forward-looking statements
Statements of future events or conditions in this report, including projections, targets, expectations, estimates, and business plans are forward-looking statements. Actual future financial and operating results, including demand growth and energy source mix; production growth and mix; project plans, dates, costs and capacities; production rates; production life and resource recoveries; cost savings; product sales; financing sources; and capital and environmental expenditures could differ materially depending on a number of factors, such as changes in the supply of and demand for crude oil, natural gas, and petroleum and petrochemical products and resulting price and margin impacts; limitations on transportation for accessing markets; political or regulatory events, including changes in law or government policy, applicable royalty rates and tax laws; the receipt, in a timely manner, of regulatory and third-party approvals; third party opposition to operations and projects; environmental risks inherent in oil and gas exploration and production activities; environmental regulation, including climate change and greenhouse gas restrictions; currency exchange rates; availability and allocation of capital; performance of third party service providers; unanticipated operational disruptions; management effectiveness; commercial negotiations; project management and schedules; response to unexpected technological developments; operational hazards and risks; disaster response preparedness; the ability to develop or acquire additional reserves; and other factors discussed in Item 1A of this annual report on Form 10-K and in the management’s discussion and analysis of financial condition and results of operations contained in Item 7. Forward-looking statements are not guarantees of future performance and involve a number of risks and uncertainties, some that are similar to other oil and gas companies and some that are unique to Imperial Oil Limited. Imperial Oil Limited’s actual results may differ materially from those expressed or implied by its forward-looking statements and readers are cautioned not to place undue reliance on them. Imperial Oil Limited undertakes no obligation to update any forward-looking statements contained herein, except as required by applicable law.
The term “project” as used in this report can refer to a variety of different activities and does not necessarily have the same meaning as in any government payment transparency reports.
Imperial Oil Limited was incorporated under the laws of Canada in 1880 and was continued under the Canada Business Corporations Act (the “CBCA”) by certificate of continuance dated April 24, 1978. The head and principal office of the company is located at 505 Quarry Park Boulevard S.E. Calgary, Alberta, Canada T2C 5N1. Exxon Mobil Corporation (ExxonMobil) owns approximately 69.6 percent of the outstanding shares of the company. In this report, unless the context otherwise indicates, reference to “the company” or “Imperial” includes Imperial Oil Limited and its subsidiaries.
The company is one of Canada’s largest integrated oil companies. It is active in all phases of the petroleum industry in Canada, including the exploration for, and production and sale of, crude oil and natural gas. In Canada, it is a major producer of crude oil, natural gas and the largest petroleum refiner and a leading marketer of petroleum products. It is also a major producer of petrochemicals.
The company’s operations are conducted in three main segments: Upstream, Downstream and Chemical. Upstream operations include the exploration for, and production of, crude oil, natural gas, synthetic oil and bitumen. Downstream operations consist of the transportation and refining of crude oil, blending of refined products and the distribution and marketing of those products. Chemical operations consist of the manufacturing and marketing of various petrochemicals.
Financial information about segments and geographic areas for the company is contained in the Financial section of this report under note 2 to the consolidated financial statements: “Business segments”.
3
Table of Contents
Summary of oil and gas reserves at year-end
The table below summarizes the net proved reserves for the company, as at December 31, 2016, as detailed in the “Supplemental information on oil and gas exploration and production activities” part of the Financial section, starting on page 30 of this report.
All of the company’s reported reserves are located in Canada. The company has reported proved reserves based on the average of the first-day-of-the-month price for each month during the last 12-month period ending December 31. Natural gas is converted to an oil-equivalent basis at six million cubic feet per one thousand barrels. No major discovery or other favourable or adverse event has occurred since December 31, 2016 that would cause a significant change in the estimated proved reserves as of that date.
| Liquids (a) | Natural gas | Synthetic oil | Bitumen | Total oil-equivalent | ||||||
|
| ||||||||||
| millions of barrels |
billions of cubic feet |
millions of barrels |
millions of barrels |
millions of barrels | ||||||
| Net proved reserves: |
||||||||||
| Developed |
19 | 263 | 564 | 436 | 1,063 | |||||
| Undeveloped |
16 | 232 | - | 265 | 319 | |||||
|
| ||||||||||
| Total net proved |
35 | 495 | 564 | 701 | 1,382 | |||||
|
| ||||||||||
| (a) | Liquids include crude oil, condensate and natural gas liquids (NGLs). NGL proved reserves are not material and are therefore included under liquids. |
The estimation of proved reserves, which is based on the requirement of reasonable certainty, is an ongoing process based on rigorous technical evaluations, commercial and market assessments and detailed analysis of well information such as flow rates and reservoir pressures. Furthermore, the company only records proved reserves for projects which have received significant funding commitments by management made toward the development of the reserves. Although the company is reasonably certain that proved reserves will be produced, the timing and amount recovered can be affected by a number of factors, including completion of development projects, reservoir performance, regulatory approvals, royalty framework and significant changes in projections of long-term oil and gas price levels. In addition, proved reserves could be affected by an extended period of low prices which could reduce the level of the company’s capital spending and also impact its partners’ capacity to fund their share of joint projects.
As a result of low prices during 2016, under the U.S. Securities and Exchange Commission definition of proved reserves, certain quantities of bitumen that qualified as proved reserves in prior years did not qualify as proved reserves at year-end 2016. Amounts no longer qualifying as proved reserves include the entire 2.5 billion barrels of bitumen at Kearl and approximately 0.2 billion barrels of bitumen at Cold Lake. Among the factors that would result in these amounts being recognized again as proved reserves at some point in the future are a recovery in average price levels, a further decline in costs, and / or operating efficiencies. Under the terms of certain contractual arrangements or government royalty regimes, lower prices can also increase proved reserves attributable to Imperial. The company does not expect the downward revision of reported proved reserves under the U.S. Securities and Exchange Commission definitions to affect the operation of the underlying projects or to alter its outlook for future production volumes.
Technologies used in establishing proved reserves estimates
Imperial’s proved reserves in 2016 were based on estimates generated through the integration of available and appropriate geological, engineering and production data, utilizing well established technologies that have been demonstrated in the field to yield repeatable and consistent results.
Data used in these integrated assessments included information obtained directly from the subsurface via wellbores, such as well logs, reservoir core samples, fluid samples, static and dynamic pressure information, production test data, and surveillance and performance information. The data utilized also included subsurface information obtained through indirect measurements, including high-quality 3-D and 4-D seismic data, calibrated with available well control information. The tools used to interpret the data included proprietary seismic processing software, proprietary reservoir modeling and simulation software and commercially available data analysis packages.
4
Table of Contents
In some circumstances, where appropriate analog reservoirs were available, reservoir parameters from these analogs were used to increase the quality of and confidence in the reserves estimates.
Preparation of reserves estimates
Imperial has a dedicated reserves management group that is separate from the base operating organization. Primary responsibilities of this group include oversight of the reserves estimation process for compliance with the U.S. Securities and Exchange Commission (SEC) rules and regulations, review of annual changes in reserves estimates and the reporting of Imperial’s proved reserves. This group also maintains the official company reserves estimates for Imperial’s proved reserves. In addition, this group provides training to personnel involved in the reserve estimation and reporting processes within Imperial.
The reserves management group maintains a central database containing the official company reserves estimates. Appropriate controls, including limitations on database access and update capabilities, are in place to ensure data integrity within this central database. An annual review of the system’s controls is performed by internal audit. Key components of the reserves estimation process include technical evaluations and analysis of well and field performance and a rigorous peer review. No changes may be made to reserves estimates in the central database, including the addition of any new initial reserves estimates or subsequent revisions, unless those changes have been thoroughly reviewed and evaluated by duly authorized personnel within the base operating organization. In addition, changes to reserves estimates that exceed certain thresholds require further review and endorsement by the operating organization and the reserves management group, culminating in reviews with and approval by senior management and the company’s board of directors.
The internal qualified reserves evaluator is a professional engineer registered in Alberta, Canada and has over 30 years of petroleum industry experience, including 23 years of reserves related experience. The position provides leadership to the internal reserves management group and is responsible for filing a reserves report with the Canadian securities regulatory authorities. The company’s internal reserves evaluation staff consists of 39 persons with an average of 15 years of relevant technical experience in evaluating reserves, of whom 24 persons are qualified reserves evaluators for purposes of Canadian securities regulatory requirements. The company’s internal reserves evaluation management team is made up of 19 persons with an average of 14 years of relevant experience in evaluating and managing the evaluation of reserves. No independent qualified reserves evaluator or auditor was involved in the preparation of the company’s reserves data.
As at December 31, 2016, approximately 23 percent of the company’s proved reserves were proved undeveloped reserves reflecting volumes of 319 million oil-equivalent barrels. Most of the undeveloped reserves are associated with the Cold Lake field. This compared to 513 million oil-equivalent barrels of proved undeveloped reserves reported at the end of 2015. Proved undeveloped reserves decreased by 177 million oil-equivalent barrels in 2016 associated with end of field life truncation as a result of low oil and natural gas prices. Migration of proved undeveloped reserves into proved developed was not material in 2016.
Proved undeveloped reserves that have remained undeveloped for five years or more represent about 22 percent (71 million oil-equivalent barrels) of proved undeveloped reserves and are primarily associated with Cold Lake’s ongoing drilling program. These undeveloped reserves are planned to be developed in a staged approach to align with operational capacity and efficient capital spending commitment over the life of the field. The company is reasonably certain that these proved reserves will be produced; however the timing and amount recovered can be affected by a number of factors including completion of development projects, reservoir performance, and significant changes in long-term oil prices.
One of the company’s requirements to report resources as proved reserves is that management has made significant funding commitments towards the development of the reserves. The company has a disciplined investment strategy and many major fields require a long lead-time in order to be developed. The company made investments of about $105 million during the year to progress the development of reported proved undeveloped reserves in the Montney and Duvernay formations, and at Cold Lake. These investments represented about 12 percent of the $896 million in total reported Upstream capital and exploration expenditures. Investments made by the company to develop quantities which no longer meet the SEC definition of proved reserves due to 2016 average prices are included in the $896 million of Upstream capital and exploration expenditures.
5
Table of Contents
Oil and gas production, production prices and production costs
Reference is made to the portion of the Financial section entitled “Management’s discussion and analysis of financial condition and results of operations” on page 34 of this report for a narrative discussion on the material changes.
Average daily production of oil
The company’s average daily oil production by final products sold during the three years ended December 31, 2016 was as follows. All reported production volumes were from Canada.
| thousands of barrels per day (a) | 2016 | 2015 | 2014 | |||||||||||
|
|
||||||||||||||
| Bitumen: |
||||||||||||||
| Cold Lake: |
- gross (b) | 161 | 158 | 146 | ||||||||||
| - net (c) | 138 | 139 | 114 | |||||||||||
| Kearl: |
- gross (b) | 120 | 108 | 51 | ||||||||||
| - net (c) | 118 | 106 | 47 | |||||||||||
|
|
||||||||||||||
| Total bitumen: |
- gross (b) | 281 | 266 | 197 | ||||||||||
| - net (c) | 256 | 245 | 161 | |||||||||||
| Synthetic oil (d): |
- gross (b) | 68 | 62 | 64 | ||||||||||
| - net (c) | 67 | 58 | 60 | |||||||||||
| Liquids: |
- gross (b) | 15 | 16 | 21 | ||||||||||
| - net (c) | 13 | 15 | 16 | |||||||||||
|
|
||||||||||||||
| Total: |
- gross (b) | 364 | 344 | 282 | ||||||||||
| - net (c) | 336 | 318 | 237 | |||||||||||
|
|
||||||||||||||
| (a) | Barrels per day metric is calculated by dividing the volume for the period by the number of calendar days in the period. |
| (b) | Gross production is the company’s share of production (excluding purchases) before deduction of the mineral owners’ or governments’ share or both. |
| (c) | Net production is gross production less the mineral owners’ or governments’ share or both. |
| (d) | The company’s synthetic oil production volumes were from the company’s share of production volumes in the Syncrude joint venture. |
Average daily production and production available for sale of natural gas
The company’s average daily production and production available for sale of natural gas during the three years ended December 31, 2016 are set forth below. All reported production volumes were from Canada. All gas volumes in this report are calculated at a pressure base of 14.73 pounds per square inch absolute at 60 degrees Fahrenheit. Reference is made to the portion of the Financial section entitled “Management’s discussion and analysis of financial condition and results of operations” on page 34 of this report for a narrative discussion on the material changes.
| millions of cubic feet per day (a) | 2016 | 2015 | 2014 | |||||||||
|
|
||||||||||||
| Gross production (b) (c) |
129 | 130 | 168 | |||||||||
| Net production (c) (d) (e) |
122 | 125 | 156 | |||||||||
| Net production available for sale (f) |
87 | 94 | 124 | |||||||||
|
|
||||||||||||
| (a) | Cubic feet per day metric is calculated by dividing the volume for the period by the number of calendar days in the period. |
| (b) | Gross production is the company’s share of production (excluding purchases) before deduction of the mineral owners’ or governments’ share or both. |
| (c) | Production of natural gas includes amounts used for internal consumption with the exception of the amounts reinjected. |
| (d) | Net production is gross production less the mineral owners’ or governments’ share or both. |
| (e) | Net production reported in the above table is consistent with production quantities in the net proved reserves disclosure. |
| (f) | Includes sales of the company’s share of net production and excludes amounts used for internal consumption. |
6
Table of Contents
Total average daily oil-equivalent basis production
The company’s total average daily production expressed in oil-equivalent basis is set forth below, with natural gas converted to an oil-equivalent basis at six million cubic feet per one thousand barrels.
| thousands of barrels per day (a) | 2016 | 2015 | 2014 | |||||||||
|
|
||||||||||||
| Total production oil-equivalent basis: |
||||||||||||
| - gross (b) |
386 | 366 | 310 | |||||||||
| - net (c) |
356 | 339 | 263 | |||||||||
|
|
||||||||||||
| (a) | Barrels per day metric is calculated by dividing the volume for the period by the number of calendar days in the period. |
| (b) | Gross production is the company’s share of production (excluding purchases) before deduction of the mineral owners’ or governments’ share or both. |
| (c) | Net production is gross production less the mineral owners’ or governments’ share or both. |
Average unit sales price
The company’s average unit sales price and average unit production costs by product type for the three years ended December 31, 2016 were as follows.
| Canadian dollars per barrel | 2016 | 2015 | 2014 | |||||||||
|
|
||||||||||||
| Bitumen |
26.52 | 32.48 | 67.20 | |||||||||
| Synthetic oil |
57.12 | 61.33 | 99.58 | |||||||||
| Liquids |
28.01 | 30.62 | 67.82 | |||||||||
|
|
||||||||||||
| dollars per thousand cubic feet |
||||||||||||
| Natural gas |
2.41 | 2.78 | 4.54 | |||||||||
|
|
||||||||||||
In 2016, Imperial’s average Canadian dollar realizations for bitumen and synthetic crudes declined essentially in line with the North American benchmarks, adjusted for changes in the exchange rate and transportation costs.
Unit sales prices decreased in 2015, primarily driven by the decline in the global crude oil and natural gas price environment.
Average unit production costs
| Canadian dollars per barrel | 2016 | 2015 | 2014 | |||||||||
|
|
||||||||||||
| Bitumen |
24.24 | 25.16 | 34.87 | |||||||||
| Synthetic oil |
46.24 | 54.81 | 62.14 | |||||||||
| Total oil-equivalent basis (a) |
28.52 | 30.60 | 41.02 | |||||||||
|
|
||||||||||||
| (a) | Includes liquids, bitumen, synthetic oil and natural gas. |
In 2016, synthetic oil unit production costs were lower, primarily driven by increased volumes and cost management.
Bitumen unit production costs were lower in 2015, primarily driven by Kearl expansion project start-up and cost management.
Synthetic oil unit production costs were lower in 2015, primarily driven by cost management.
7
Table of Contents
Drilling and other exploratory and development activities
The company has been involved in the exploration for and development of crude oil and natural gas in Canada only.
Wells drilled
The following table sets forth the net exploratory and development wells that were drilled or participated in by the company during the three years ended December 31, 2016.
| wells | 2016 | 2015 | 2014 | |||||||||
|
|
||||||||||||
| Net productive exploratory |
- | - | - | |||||||||
| Net dry exploratory |
- | - | - | |||||||||
| Net productive development |
6 | 46 | 111 | |||||||||
| Net dry development |
- | - | - | |||||||||
|
|
||||||||||||
| Total |
6 | 46 | 111 | |||||||||
|
|
||||||||||||
In 2015, the following wells were drilled to add productive capacity: 41 development wells at Cold Lake, of which 36 development wells relate to the Cold Lake Nabiye expansion project and five net other wells.
In 2014, the following wells were drilled to add productive capacity: 90 development wells at Cold Lake, of which 74 development wells relate to the Cold Lake Nabiye expansion project, eight net tight gas wells and 13 net other wells.
Wells drilling
At December 31, 2016, the company was participating in the drilling of the following exploratory and development wells. All wells were located in Canada.
| 2016 | ||||||||
| wells | Gross | Net | ||||||
|
|
||||||||
| Total |
13 | 6 | ||||||
|
|
||||||||
Exploratory and development activities regarding oil and gas resources
Cold Lake
To maintain production at Cold Lake, capital expenditures for additional production wells and associated facilities are required periodically. Additional wells were drilled on existing phases in 2015. No wells were drilled in 2016.
The company also conducts experimental pilot operations to improve recovery of bitumen from wells by means of new drilling, production and recovery techniques.
Aspen, Cold Lake expansion and other oil sands activities
The company filed a regulatory application for a new in-situ oil sands project at Aspen in December 2013, using steam-assisted gravity drainage (SAGD) technology to develop the project in three phases producing about 45,000 barrels per day before royalties, per phase.
In 2015, the company amended the regulatory application to develop the Aspen project using solvent-assisted, steam-assisted gravity drainage (SA-SAGD) technology. The technology significantly improves capital efficiency and lowers greenhouse gas intensity versus the existing SAGD technologies. The project is proposed to be executed in two phases producing about 75,000 barrels per day before royalties, per phase. Development timing is subject to regulatory approvals and market conditions. No final investment decision has been made.
In March 2016, Imperial filed a regulatory application for the Cold Lake Expansion project to develop the Grand Rapids interval using SA-SAGD technology. The project is proposed to produce 50,000 barrels per day, before royalties. Development timing is subject to regulatory approval and market conditions. No final investment decision has been made.
Work continues on technical evaluations to support potential Corner and Clyden in-situ development regulatory applications.
8
Table of Contents
The company also has interests in other oil sands leases in the Athabasca and Peace River areas of northern Alberta. Evaluation wells completed on these leased areas established the presence of bitumen. The company continues to evaluate these leases to determine their potential for future development.
Other activities
The company is continuing to evaluate other undeveloped natural gas resources in the Montney and Duvernay formations in the western provinces.
Mackenzie Delta
In 1999, the company and three other companies entered into an agreement to study the feasibility of developing Mackenzie Delta gas, anchored by three large onshore natural gas fields. The company retains a 100 percent interest in the largest of these fields.
In late 2010, the National Energy Board (NEB) announced its approval of plans to build and operate the project subject to 264 conditions in areas such as engineering, safety and environmental protection. Federal cabinet approved the project in early 2011.
The commercial viability of these natural gas resources, and the pipeline required to transport this natural gas to markets, is dependent on a number of factors. These factors include natural gas markets, continued support from northern parties, fiscal framework and the cost of constructing, operating and abandoning the field production and pipeline facilities.
In 2016, the Federal Government of Canada approved the extension of the pipeline and gathering system construction permits to December 31, 2022. No final investment decision has been made.
Beaufort Sea
In 2007, the company acquired a 50 percent interest in an exploration licence in the Beaufort Sea. As part of the evaluation, a 3-D seismic survey was conducted in 2008 and the company has since carried out data collection programs to support environmental studies and safe exploration drilling operations.
In 2010, the company executed an agreement to cross-convey interests with another company to acquire a 25 percent interest in an additional Beaufort Sea exploration licence. As a result of that agreement, the company operates both licences and its interest in the original licence was reduced to 25 percent. The exploration licences are held through 2019 and 2020, respectively.
In 2013, the company and its joint venture partners filed a project description, initiating the formal regulatory review of the project.
In December 2016, the Federal Government of Canada declared Arctic waters off limits to new offshore oil and gas licences for five years subject to review at the end of that period. Existing licences will not be impacted. The government has indicated they will undertake a one year consultation process to discuss the interests of existing leaseholders, including Imperial. Current activities continue to focus on data gathering and community consultation. Imperial is seeking extended terms for the Beaufort Sea exploration licences with the Federal Government of Canada. No final investment decision has been made.
Liquefied natural gas (LNG) activity
WCC LNG Ltd., jointly owned by the company (20 percent) and ExxonMobil Canada Ltd. (80 percent), was granted an export licence in 2013 for up to 30 million tonnes of LNG per year for a period of 25 years. In 2016, the licence period was extended to 40 years. The project is proceeding through the pre-application phase in a British Columbia environmental assessment process. No final investment decision has been made.
Exploratory and development activities regarding oil and gas resources extracted by mining methods
The company continues to evaluate other undeveloped, mineable oil sands acreage in the Athabasca region.
9
Table of Contents
Review of principal ongoing activities
Cold Lake
Cold Lake is an in-situ heavy oil bitumen operation. The product, a blend of bitumen and diluent, is shipped to certain of the company’s refineries, Exxon Mobil Corporation refineries and to other third parties. Diluent is natural gas condensate or other light hydrocarbons added to the crude bitumen to facilitate transportation by pipeline and rail.
The Province of Alberta, in its capacity as lessor of Cold Lake oil sands leases, is entitled to a royalty on production at Cold Lake. Royalties are subject to the oil sands royalty regulations which are based upon a sliding scale determined largely by the price of crude oil.
During 2016, net production at Cold Lake was about 138,000 barrels per day and gross production was about 161,000 barrels per day.
As a result of low prices during 2016, under the SEC definition of proved reserves, approximately 0.2 billion barrels of bitumen at Cold Lake no longer qualified as proved reserves at year-end 2016. The company does not expect the downward revision of reported proved reserves under SEC definitions to affect the Cold Lake operation or to alter Imperial’s outlook for future production volumes. Among the factors that would result in these amounts being recognized again as proved reserves at some point in the future are a recovery in average price levels, a further decline in costs, and / or operating efficiencies.
Kearl
Kearl is a joint venture established to recover shallow deposits of oil sands using open-pit mining methods to extract the crude bitumen, which is processed through extraction and froth treatment trains. The company holds a 70.96 percent participating interest in the joint venture and ExxonMobil Canada Properties holds the other 29.04 percent. The product, a blend of bitumen and diluent, is shipped to certain of the company’s refineries, Exxon Mobil Corporation refineries and to other third parties.
The Province of Alberta, in its capacity as lessor of Kearl oil sands leases, is entitled to a royalty on production at Kearl. Royalties are subject to the oil sands royalty regulations which are based upon a sliding scale determined largely by the price of crude oil.
During 2016, the company’s share of Kearl’s net bitumen production was about 118,000 barrels per day and gross production was about 120,000 barrels per day. Increased production in the year was due to the start-up of the expansion project.
Potential future debottlenecking of the Kearl operation would increase output to reach the regulatory capacity of 345,000 barrels of bitumen per day, of which the company’s share would be about 245,000 barrels per day. Such debottlenecking remains under evaluation.
As a result of low prices during 2016, under the SEC definition of proved reserves, the entire 2.5 billion barrels of bitumen at Kearl no longer qualified as proved reserves at year-end 2016. The company does not expect the downward revision of reported proved reserves under SEC definitions to affect the Kearl operation or to alter Imperial’s outlook for future production volumes. Among the factors that would result in these amounts being recognized again as proved reserves at some point in the future are a recovery in average price levels, a further decline in costs, and / or operating efficiencies.
Syncrude
Syncrude is a joint venture established to recover shallow deposits of oil sands using open-pit mining methods to extract crude bitumen, and then upgrade it to produce a high-quality, light (32 degrees API), sweet, synthetic crude oil. The company holds a 25 percent participating interest in the joint venture. The produced synthetic crude oil is shipped to certain of the company’s refineries, Exxon Mobil Corporation refineries and to other third parties.
The Province of Alberta, in its capacity as lessor of Syncrude oil sands leases, is entitled to a royalty on production at Syncrude. In 2016, Syncrude transitioned to the new generic oil sands royalty regulations which are based on a sliding scale determined largely by the price of crude oil. Syncrude’s royalties are based on bitumen value with upgrading costs and revenues excluded from the calculation.
10
Table of Contents
In 2016, the company’s share of Syncrude’s net production of synthetic crude oil was about 67,000 barrels per day and gross production was about 68,000 barrels per day.
The company has no material commitments to provide a fixed and determinable quantity of oil or gas under existing contracts and agreements.
Oil and gas properties, wells, operations and acreage
Production wells
The company’s production of liquids, bitumen and natural gas is derived from wells located exclusively in Canada. The total number of wells capable of production, in which the company had interests at December 31, 2016 and December 31, 2015, is set forth in the following table. The statistics in the table are determined in part from information received from other operators.
| Year ended December 31, 2016 | Year ended December 31, 2015 | |||||||||||||||||||||||||||||||
| Crude oil | Natural gas | Crude oil | Natural gas | |||||||||||||||||||||||||||||
| wells | Gross (a) | Net (b) | Gross (a) | Net (b) | Gross (a) | Net (b) | Gross (a) | Net (b) | ||||||||||||||||||||||||
|
|
||||||||||||||||||||||||||||||||
| Total (c) |
4,752 | 4,647 | 3,546 | 1,188 | 4,731 | 4,592 | 3,611 | 1,199 | ||||||||||||||||||||||||
|
|
||||||||||||||||||||||||||||||||
| (a) | Gross wells are wells in which the company owns a working interest. |
| (b) | Net wells are the sum of the fractional working interests owned by the company in gross wells, rounded to the nearest whole number. |
| (c) | Multiple completion wells are permanently equipped to produce separately from two or more distinctly different geological formations. At year-end 2016, the company had an interest in 16 gross wells with multiple completions (2015 - 26 gross wells). |
Land holdings
At December 31, 2016 and 2015, the company held the following oil and gas rights, and bitumen and synthetic oil leases, all of which are located in Canada, specifically in the western provinces, in the Canada lands and in the Atlantic offshore.
| Developed | Undeveloped | Total | ||||||||||||||||||||||||
| thousands of acres | 2016 | 2015 | 2016 | 2015 | 2016 | 2015 | ||||||||||||||||||||
|
|
||||||||||||||||||||||||||
| Western provinces (a): |
||||||||||||||||||||||||||
| Liquids and gas |
- gross (b) | 1,464 | 1,400 | 876 | 1,016 | 2,340 | 2,416 | |||||||||||||||||||
| - net (c) | 703 | 686 | 482 | 528 | 1,185 | 1,214 | ||||||||||||||||||||
| Bitumen |
- gross (b) | 197 | 193 | 674 | 673 | 871 | 866 | |||||||||||||||||||
| - net (c) | 182 | 181 | 319 | 319 | 501 | 500 | ||||||||||||||||||||
| Synthetic oil |
- gross (b) | 118 | 118 | 136 | 136 | 254 | 254 | |||||||||||||||||||
| - net (c) | 29 | 29 | 34 | 34 | 63 | 63 | ||||||||||||||||||||
| Canada lands (d): |
||||||||||||||||||||||||||
| Liquids and gas |
- gross (b) | 4 | 4 | 1,831 | 2,274 | 1,835 | 2,278 | |||||||||||||||||||
| - net (c) | 2 | 2 | 498 | 720 | 500 | 722 | ||||||||||||||||||||
| Atlantic offshore: |
||||||||||||||||||||||||||
| Liquids and gas |
- gross (b) | 65 | 65 | 288 | 288 | 353 | 353 | |||||||||||||||||||
| - net (c) | 6 | 6 | 46 | 46 | 52 | 52 | ||||||||||||||||||||
|
|
||||||||||||||||||||||||||
| Total (e): |
- gross (b) | 1,848 | 1,780 | 3,805 | 4,387 | 5,653 | 6,167 | |||||||||||||||||||
| - net (c) | 922 | 904 | 1,379 | 1,647 | 2,301 | 2,551 | ||||||||||||||||||||
|
|
||||||||||||||||||||||||||
| (a) | Western provinces include British Columbia, Alberta and Saskatchewan. |
| (b) | Gross acres include the interests of others. |
| (c) | Net acres exclude the interests of others. |
| (d) | Canada lands include the Arctic Islands, Beaufort Sea / Mackenzie Delta, and other Northwest Territories, Nunavut and Yukon regions. |
| (e) | Certain land holdings are subject to modification under agreements whereby others may earn interests in the company’s holdings by performing certain exploratory work (farm-out) and whereby the company may earn interests in others’ holdings by performing certain exploratory work (farm-in). |
11
Table of Contents
Western provinces
The company’s bitumen leases include about 194,000 net acres of oil sands leases near Cold Lake and an area of about 34,000 net acres at Kearl. The company also has about 80,000 net acres of undeveloped, mineable oil sands acreage in the Athabasca region. In addition, the company has interests in other bitumen oil sands leases in the Athabasca areas totalling about 193,000 net acres, which include about 62,000 net acres of oil sands leases in the Clyden area, about 34,000 net acres of oil sands in the Aspen area and about 30,000 net acres of oil sands in the Corner area. These 193,000 net acres are amenable to in-situ recovery techniques.
The company’s share of Syncrude joint venture leases covering about 63,000 net acres accounts for the entire synthetic oil acreage.
Oil sands leases have an exploration period of fifteen years and are continued beyond that point by meeting the minimum level of evaluation, by payment of escalating rentals, or by production. The majority of the acreage in Cold Lake, Kearl and Syncrude is continued by production.
The company holds interests in an additional 1,185,000 net acres of developed and undeveloped land in the western provinces related to crude oil and natural gas.
Petroleum and natural gas leases and licences from the western provinces have exploration periods ranging from two to 15 years and are continued beyond that point by proven production capability.
Canada lands
Land holdings in Canada lands primarily include exploration licence (EL) acreage in the Beaufort Sea of about 252,000 net acres and significant discovery licence (SDL) acreage in the Mackenzie Delta and Beaufort Sea areas of about 183,000 net acres. In 2016, the company surrendered its interest in the Summit Creek area of central Mackenzie Valley totalling about 222,000 net acres.
Exploration licences on Canada lands and Atlantic offshore have a finite term. If a significant discovery is made, a SDL may be granted that holds the acreage under the SDL indefinitely, subject to certain conditions.
The company’s net acreage in Canada lands is either continued by production or held through ELs and SDLs.
Atlantic offshore
The Atlantic offshore acreage is continued by production or held by SDLs.
12
Table of Contents
The company supplements its own production of crude oil, condensate and petroleum products with substantial purchases from a number of other sources at negotiated market prices. Purchases are made under both spot and term contracts from domestic and foreign sources, including ExxonMobil.
Imperial currently transports the company’s crude oil production and third party crude oil required to supply refineries by contracted pipelines, common carrier pipelines and rail. To mitigate uncertainty associated with the timing of industry pipeline projects and pipeline capacity constraints, the company has developed rail infrastructure. The Edmonton rail terminal commenced operation in the second quarter of 2015 and has total capacity to ship up to 210,000 barrels per day of crude oil.
The company owns and operates three refineries, which process predominantly Canadian crude oil. The Strathcona refinery operates lubricating oil production facilities. In addition to crude oil, the company purchases finished products to supplement its refinery production.
In 2016, capital expenditures of about $95 million were made at the company’s refineries. Capital expenditures focused mainly on refinery projects to improve reliability, feedstock flexibility, energy efficiency and environmental performance.
The approximate average daily volumes of refinery throughput during the three years ended December 31, 2016, and the daily rated capacities of the refineries as at December 31, 2016 were as follows.
| Refinery throughput (a) Year ended December 31 |
Rated capacities (b) at December 31 |
|||||||||||||||
| thousands of barrels per day | 2016 | 2015 | 2014 | 2016 | ||||||||||||
|
|
||||||||||||||||
| Strathcona, Alberta |
168 | 181 | 182 | 191 | ||||||||||||
| Sarnia, Ontario |
108 | 103 | 109 | 119 | ||||||||||||
| Nanticoke, Ontario |
86 | 102 | 103 | 113 | ||||||||||||
|
|
||||||||||||||||
| Total |
362 | 386 | 394 | 423 | ||||||||||||
|
|
||||||||||||||||
| (a) | Refinery throughput is the volume of crude oil and feedstocks that is processed in the refinery atmospheric distillation units. |
| (b) | Rated capacities are based on definite specifications as to types of crude oil and feedstocks that are processed in the refinery atmospheric distillation units, the products to be obtained and the refinery process, adjusted to include an estimated allowance for normal maintenance shutdowns. Accordingly, actual capacities may be higher or lower than rated capacities due to changes in refinery operation and the type of crude oil available for processing. |
Refinery throughput averaged 362,000 barrels per day in 2016, compared to 386,000 barrels per day in 2015. Capacity utilization decreased to 86 percent from 92 percent in 2015, reflecting the more significant scope of turnaround maintenance activity in the current year.
In 2015, refinery throughput was 92 percent of capacity, 2 percent lower than the previous year. The lower rate was primarily a result of planned maintenance.
The company maintains a nationwide distribution system, to handle bulk and packaged petroleum products moving from refineries to market by pipeline, tanker, rail and road transport. The company owns and operates natural gas liquids and products pipelines in Alberta, Manitoba and Ontario and has interests in the capital stock of one crude oil and two products pipeline companies.
13
Table of Contents
The company markets petroleum products throughout Canada under well-known brand names, most notably Esso and Mobil, to all types of customers.
The company supplies petroleum products to the motoring public through Esso-branded retail sites and independent marketers. In 2016, the company completed the sale of its remaining company-owned Esso-branded retail sites completing the conversion to a branded wholesaler operating model. On average during the year, there were more than 1,700 retail sites, which by the end of 2016 were all operating under a branded wholesaler model whereby Imperial supplies fuel to independent third parties who own and operate retail sites in alignment with Esso brand standards.
Imperial sells petroleum products to large industrial and transportation customers, independent marketers, resellers as well as other refiners. The company serves agriculture, residential heating and commercial markets through branded resellers.
The approximate daily volumes of net petroleum products (excluding purchases / sales contracts with the same counterparty) sold during the three years ended December 31, 2016, are set out in the following table.
| thousands of barrels per day | 2016 | 2015 | 2014 | |||||||||
|
|
||||||||||||
| Gasolines |
261 | 247 | 244 | |||||||||
| Heating, diesel and jet fuels |
170 | 170 | 179 | |||||||||
| Heavy fuel oils |
16 | 16 | 22 | |||||||||
| Lube oils and other products |
37 | 45 | 40 | |||||||||
|
|
||||||||||||
| Net petroleum product sales |
484 | 478 | 485 | |||||||||
|
|
||||||||||||
Total Downstream capital expenditures were $190 million in 2016.
The company’s Chemical operations manufacture and market benzene, aromatic and aliphatic solvents, plasticizer intermediates and polyethylene resin. Its petrochemical and polyethylene manufacturing operations are located in Sarnia, Ontario, adjacent to the company’s petroleum refinery.
The company’s total sales volumes of petrochemicals during the three years ended December 31, 2016, were as follows.
| thousands of tonnes | 2016 | 2015 | 2014 | |||||||||
|
|
||||||||||||
| Total sales of petrochemicals |
908 | 945 | 953 | |||||||||
|
|
||||||||||||
Lower sales volumes in 2016 were primarily due to higher plant maintenance and feedstock availability.
Total Chemical capital expenditures were $26 million in 2016.
The approximate total gross research expenditures, before credits, during the three years ended December 31, 2016, were as follows.
| millions of Canadian dollars | 2016 | 2015 | 2014 | |||||||||
|
|
||||||||||||
| Gross research expenditures, before credits |
195 | 195 | 175 | |||||||||
|
|
||||||||||||
Research expenditures are mainly for developing technologies to improve bitumen recovery, reduce costs and reduce the environmental impact of upstream operations, supporting environmental and process improvements in the refineries, as well as accessing ExxonMobil’s research worldwide.
The company has scientific research agreements with affiliates of ExxonMobil, which provide
for technical and engineering work to be performed by all parties, the exchange of technical information and the assignment and licensing of patents and patent rights. These agreements provide mutual access to scientific and operating data related to nearly every phase of the petroleum and petrochemical operations of the parties.
14
Table of Contents
In 2016, Imperial completed its Calgary Research Centre in Quarry Park, a state-of-the-art facility focused on oil sands innovation and technology.
The company regards protecting the environment in connection with its various operations a priority. The company works in cooperation with government agencies, industry associations and communities to address existing, and to anticipate potential, environmental protection issues. In the past five years, the company has made capital and operating expenditures of about $6.1 billion on environmental protection and facilities. In 2016, the company’s environmental capital and operating expenditures totalled approximately $0.7 billion, which was spent primarily on water treatment, tailings treatment and emission reductions at company-owned facilities and Syncrude; and on remediation of idled facilities and operations. Capital and operating expenditures relating to environmental protection are expected to be about $0.7 billion in 2017.
| career employees (a)
|
2016 | 2015 | 2014 | |||||||||
|
|
||||||||||||
| Total |
5,600 | 5,700 | 5,500 | |||||||||
|
|
||||||||||||
| (a) | Rounded. Career employees are defined as active executive, management, professional, technical, administrative and wage employees who work full time or part time for the company and are covered by the company’s benefit plans. |
About 7 percent of the company’s employees are members of unions.
The Canadian petroleum, natural gas and chemical industries are highly competitive. Competition exists in the search for and development of new sources of supply, the construction and operation of crude oil, natural gas and refined products pipelines and facilities and the refining, distribution and marketing of petroleum products and chemicals. The petroleum industry also competes with other industries in supplying energy, fuel and other needs of consumers.
Petroleum and natural gas rights
Most of the company’s petroleum and natural gas rights were acquired from governments, either federal or provincial. These rights, in the form of leases or licences, are generally acquired for cash or work commitments. A lease or licence entitles the holder to explore for petroleum and/or natural gas on the leased lands for a specified period.
In western provinces, the lease holder can produce the petroleum or natural gas discovered on the leased lands and retains the rights based on continued production. Oil sands leases are retained by meeting the minimum level of evaluation, payment of rentals, or by production.
The holder of a licence relating to Canada lands and the Atlantic offshore can apply for a SDL if a discovery is made. If granted, the SDL holds the lands indefinitely subject to certain conditions. The holder may then apply for a production licence in order to produce petroleum or natural gas from the licenced land.
Crude oil
Production
The maximum allowable gross production of crude oil from wells in Canada is subject to limitation by various regulatory authorities on the basis of engineering and conservation principles.
Exports
Export contracts of more than one year for light crude oil and petroleum products and two years for heavy crude oil (including crude bitumen) require the prior approval of the NEB and the Government of Canada.
15
Table of Contents
Natural gas
Production
The maximum allowable gross production of natural gas from wells in Canada is subject to limitations by various regulatory authorities. These limitations are to ensure oil recovery is not adversely impacted by accelerated gas production practices. These limitations do not impact gas reserves, only the timing of production of the reserves and did not have a significant impact on 2016 gas production rates.
Exports
The Government of Canada has the authority to regulate the export price for natural gas and has a gas export pricing policy, which accommodates export prices for natural gas negotiated between Canadian exporters and U.S. importers.
Exports of natural gas from Canada require approval by the NEB and the Government of Canada. The Government of Canada allows the export of natural gas by NEB order without volume limitation for terms not exceeding 24 months.
Royalties
The Government of Canada and the provinces in which the company produces crude oil and natural gas, impose royalties on production from lands where they own the mineral rights. Some producing provinces also receive revenue by imposing taxes on production from lands where they do not own the mineral rights.
Different royalties are imposed by the Government of Canada and each of the producing provinces. Royalties imposed on crude oil, natural gas and natural gas liquids vary depending on a number of parameters, including well production volumes, selling prices and recovery methods. For information with respect to royalties for Cold Lake, Syncrude and Kearl, see “Upstream” section under Item 1.
Investment Canada Act
The Investment Canada Act requires Government of Canada approval, in certain cases, of the acquisition of control of a Canadian business by an entity that is not controlled by Canadians. The acquisition of natural resource properties may, in certain circumstances, be considered a transaction that constitutes an acquisition of control of a Canadian business requiring Government of Canada approval.
The Act also requires notification of the establishment of new unrelated businesses in Canada by entities not controlled by Canadians, but does not require Government of Canada approval except when the new business is related to Canada’s cultural heritage or national identity. The Government of Canada is also authorized to take any measures that it considers advisable to protect national security, including the outright prohibition of a foreign investment in Canada. By virtue of the majority stock ownership of the company by ExxonMobil, the company is considered to be an entity which is not controlled by Canadians.
Competition Act
The Competition Bureau ensures that Canadian businesses and consumers prosper in a competitive and innovative marketplace. The Competition Bureau is responsible for the administration and enforcement of the Competition Act (the Act). A merger transaction, whether or not notifiable, is subject to examination by the Commissioner of the Competition Bureau to determine whether the merger will have or is likely to have, the effect of preventing or lessening substantially, competition in a definable market. The assessment of the competitive effects of a merger is made with reference to the factors identified under the Act.
An Advance Ruling Certificate (ARC) may be issued by the Commissioner to a party or parties to a proposed merger transaction who want to be assured that the transaction will not give rise to proceedings under section 92 of the Act. Section 102 of the Act provides that an ARC may be issued when the Commissioner is satisfied that there would not be sufficient grounds on which to apply to the Competition Tribunal for an order against a proposed merger. The issuance of an ARC is discretionary. An ARC cannot be issued for a transaction that has been completed, nor does an ARC ensure approval of the transaction by any agency other than the Competition Bureau.
16
Table of Contents
The company’s website www.imperialoil.ca contains a variety of corporate and investor information which is available free of charge, including the company’s annual report on Form 10-K, quarterly reports on Form 10-Q and current reports on Form 8-K and amendments to these reports, as well as required interactive data filings. These reports are made available as soon as reasonably practicable after they are filed or furnished to the SEC.
The public may read and copy any materials the company files with the SEC at the SEC’s Public Reference Room at 100 F Street, NE., Washington, DC 20549. The public may obtain information on the operation of the Public Reference Room by calling the SEC at 1-800-SEC-0330. The SEC’s website, www.sec.gov, contains reports, proxy and information statements and other information regarding issuers that file electronically with the SEC.
Imperial’s financial and operating results are subject to a variety of risks inherent in oil, gas and petrochemical businesses. Many of these risk factors are not within Imperial’s control and could adversely affect Imperial’s business, financial and operating results, or financial position. These risk factors include:
Volatility of commodity prices
The company’s operations and earnings may be significantly affected by changes in oil and gas prices and by changes in margins on refined products and petrochemicals. Crude oil, natural gas, petrochemical and product prices and margins depend on local, regional, and global events or conditions that affect supply and demand for the relevant commodity.
Demand related factors which could impact Imperial’s results include economic conditions, where periods of low or negative economic growth will typically have an adverse impact on results; technological improvements in energy efficiency; seasonal weather patterns, which affect the demand for energy associated with heating and cooling; increased competitiveness of alternative energy sources; and changes in technology or consumer preferences that affect the market for petroleum products.
Commodity prices and margins also vary depending on a number of factors affecting supply. For example, increased supply from the development of new oil and gas supply sources and technologies to enhance recovery from existing sources tend to reduce commodity prices to the extent such supply increases are not offset by commensurate growth in demand. Similarly, increases in industry refining or petrochemical manufacturing capacity tend to reduce margins on affected products. World oil, gas and petrochemical supply levels can also be affected by factors that reduce available supplies, such as adherence by member countries to Organization of the Petroleum Exporting Countries (OPEC) production quotas and the occurrence of wars, hostile actions, natural disasters, disruptions in competitors’ operations, or unexpected pipeline constraints that may disrupt supplies. Technological change can also alter the relative costs for competitors to find, produce, and refine oil and gas and to manufacture petrochemicals.
Commodity prices have been volatile, and the company expects that volatility to continue. Any material decline in crude oil prices could have a material adverse effect on Imperial’s Upstream operations, financial position, proved reserves and the amount spent to develop reserves.
A significant portion of the company’s production is bitumen, which is blended with diluent to create a marketable heavy crude oil. The market price for western Canadian heavy crude oil is typically lower than light and medium grades of oil principally due to the higher transportation and refining costs, and limited refining capacity capable of processing heavy crude oil. Heavy crude oil may also be subject to limits on transportation capacity to markets to a larger extent than light crude oil. Future crude price differentials are uncertain and increases in the heavy crude oil discounts could have a material adverse effect on the company’s business. Increases to diluent prices, relative to heavy crude oil prices, could also have an adverse effect on the company’s business.
The company does not currently make use of derivative instruments to offset exposures associated with hydrocarbon prices, currency exchange rates and interest rates that arise from existing assets, liabilities and forecasted transactions. The company does not engage in speculative derivative activities nor does it use derivatives with leveraged features.
17
Table of Contents
Government and political factors
Imperial’s results can be adversely impacted by political or regulatory developments affecting operations. Changes in government policy or regulations, or third party opposition to company or infrastructure projects could impact Imperial’s existing operations and planned projects. For example, increases in taxes or government royalty rates (including retroactive claims); changes in environmental regulations or other laws that increase the cost of compliance or reduce or delay available business opportunities; and adoption of regulations mandating the use of alternative fuels or uncompetitive fuel components could affect the company’s operations.
Environmental risks
All phases of the Upstream, Downstream and Chemical businesses are subject to environmental regulation pursuant to a variety of Canadian federal, provincial, territorial and municipal laws and regulations, as well as international conventions (collectively, “environmental legislation”).
Environmental legislation imposes, among other things, restrictions, liabilities and obligations in connection with the generation, handling, storage, transportation, treatment and disposal of hazardous substances and waste and in connection with spills, releases and emissions of various substances to the environment. As well, environmental regulations are imposed on the qualities and compositions of the products sold and imported. Environmental legislation also requires that wells, facility sites and other properties associated with the company’s operations be operated, maintained, monitored, abandoned and reclaimed to the satisfaction of applicable regulatory authorities. In addition, certain types of operations, including exploration and development projects and significant changes to certain existing projects, may require the submission and approval of environmental impact assessments. Compliance with environmental legislation can require significant expenditures and failure to comply with environmental legislation may result in the cessation of operations, imposition of fines and penalties and liability for clean-up costs and damages.
The costs of complying with environmental legislation in the future could have a material adverse effect on the company’s financial condition or results of operations. The company anticipates that changes in environmental legislation may require, among other things, reductions in emissions from its operations to the air and water and may result in increased capital expenditures. Changes in environmental legislation (including, but not limited to, application of regulations related to air, water, land and biodiversity) may increase the cost of compliance or reduce or delay available business opportunities. Future changes in environmental legislation could occur and result in stricter standards and enforcement, larger fines and liability, and increased capital expenditures and operating costs, which could have a material adverse effect on the company’s financial condition or results of operations.
There are operational risks inherent in oil and gas exploration and production activities, as well as the potential to incur substantial financial liabilities, if those risks are not effectively managed. The ability to insure such risks is limited by the capacity of the applicable insurance markets, which may not be sufficient to cover the likely cost of a major adverse operating event. Accordingly, the company’s primary focus is on prevention, including through its rigorous operations integrity management system. The company’s future results will depend on the continued effectiveness of these efforts.
Climate change and greenhouse gas restrictions
Due to concern over the risk of climate change, a number of provinces and the Government of Canada have adopted, or are considering the adoption of, regulatory frameworks to reduce greenhouse gas (GHG) emissions. These include adoption of carbon emissions pricing, cap and trade regimes, carbon taxes, emissions limits, increased efficiency standards, and incentives or mandates for renewable energy. These requirements could make Imperial’s products more expensive, reduce or delay available business opportunities, reduce demand for hydrocarbons, and shift hydrocarbon demand toward lower GHG emission energy sources. Current and pending GHG regulations may also increase compliance and abatement costs, lengthen project implementation times, and affect operations.
Currency
Prices for commodities produced by the company are commonly benchmarked in U.S. dollars. The majority of Imperial’s sales and purchases are related to these industry U.S. dollar benchmarks. As the company records and reports its financial results in Canadian dollars, to the extent that the value of the Canadian dollar strengthens, the company’s earnings will be negatively affected.
18
Table of Contents
Other business risks
Imperial is reliant on a number of key chemicals, catalysts and third party service providers, including input and output commodity transportation (pipelines, rail, trucking, marine) and utilities providing services, including electricity and water, to various company operations. The lack of availability and capacity, and proximity of pipeline facilities and railcars could negatively impact Imperial’s ability to produce at capacity levels. Transportation disruptions could adversely affect the company’s price realizations, refining operations and sales volumes, as well as potentially limit the ability to deliver production to market. A third party utilities outage could have an adverse impact on the company’s operations and ability to produce.
Management effectiveness
In addition to external economic and political factors, Imperial’s future business results also depend on the company’s ability to manage successfully those factors that are at least in part within its control. The extent to which Imperial manages these factors will impact its performance relative to competition. For projects in which the company is not the operator, Imperial depends on the management effectiveness of one or more co-venturers whom the company does not control.
Project management
The company’s results are affected by its ability to develop and operate projects and facilities as planned. The company’s results will, therefore, be affected by events or conditions that affect the advancement, operation, cost or results of such projects or facilities. These risks include the company’s ability to obtain the necessary environmental and other regulatory approvals; changes in resources and operating costs including the availability and cost of materials, equipment and qualified personnel; the impact of general economic, business and market conditions; and the occurrence of unforeseen technical difficulties.
Operational efficiency
An important component of Imperial’s competitive performance, especially given the commodity based nature of Imperial’s business, is the ability to operate efficiently, including the company’s ability to manage expenses and improve production yields on an ongoing basis. This requires continuous management focus, including technology improvements, cost control, productivity enhancements, regular reappraisal of the company’s asset portfolio, and the recruitment, development and retention of high caliber employees.
Research and development
Imperial relies upon the research and development organizations of the company and ExxonMobil, with whom the company conducts shared research. To maintain the company’s competitive position, especially in light of the technological nature of Imperial’s business and the need for continuous efficiency improvement, research and development organizations must be successful and able to adapt to a changing market and policy environment, including developing technologies to help reduce GHG emissions.
Safety, business controls and environmental risk management
The scope and nature of the company’s operations present a variety of significant hazards and risks, including operational hazards and risks such as explosions, fires, pipeline ruptures and crude oil spills. Imperial’s operations are also subject to the additional hazards of pollution, releases of toxic gas and environmental hazards and risks, such as severe weather, and geological events. The company’s results depend on management’s ability to minimize these inherent risks, to effectively control business activities and to minimize the potential for human error. Imperial applies rigorous management systems, including a combined program of effective operations integrity management, ongoing upgrades, key equipment replacements, and comprehensive inspection and surveillance. The company also maintains a disciplined framework of internal controls and applies a controls management system for monitoring compliance with this framework. Substantial liabilities and other adverse impacts could result if the company’s management systems and controls do not function as intended.
Business risks also include the risk of cybersecurity breaches. If systems for protecting against cybersecurity risks prove insufficient, the company could be adversely affected such as by having its business systems compromised, its proprietary information altered, lost or stolen, or its business operations disrupted.
19
Table of Contents
Reserves
The company’s future production and cash flows from bitumen, synthetic oil, liquids and natural gas reserves are highly dependent upon the company’s success in exploiting its current reserve base. To maintain production and cash flows, the company must continue to replace produced reserves as they are depleted, which can be accomplished through exploration discovery of new resources, appraisal and investments in developing discovered resources, or acquisition of reserves. To the extent cash flows from operations are insufficient to fund capital expenditures and external sources of capital become limited or unavailable, the company’s ability to make the necessary capital investments to maintain and expand oil and natural gas reserves will be adversely impacted. In addition, the company may be unable to find and develop or acquire additional reserves to replace oil and natural gas production at acceptable costs.
Estimates of economically recoverable oil and natural gas reserves and future net cash flows involve many uncertainties, including factors beyond the company’s control. Key factors with uncertainty include: geological and engineering estimates; the assumed effects of regulation by government agencies including royalty frameworks; future commodity prices; and operating costs. Actual production, revenues, taxes, development costs, abandonment costs, and operating expenditures with respect to reserves will likely vary from such estimates, and such variances could be material.
Preparedness
The company’s operations may be disrupted by severe weather events, natural disasters, human error, and similar events. Imperial’s ability to mitigate the adverse impacts of these events depends in part upon the effectiveness of its rigorous disaster preparedness and response planning, as well as business continuity planning.
Item 1B. Unresolved staff comments
Not applicable.
Reference is made to Item 1 above.
Not applicable.
Item 4. Mine safety disclosures
Not applicable.
20
Table of Contents
| Item 5. | Market for registrant’s common equity, related stockholder matters and issuer purchases of equity securities |
Market information
The company’s common shares trade on the Toronto Stock Exchange and the NYSE MKT LLC. Reference is made to the “Quarterly financial and stock trading data” portion of the Financial section on page 85 of this report. The closing price for Imperial Oil Limited common shares on the Toronto Stock Exchange was $42.30 as at February 8, 2017.
Dividends
The following table sets forth the frequency and amount of all cash dividends declared by the company on its outstanding common shares for the two most recent fiscal years.
| 2016 | 2015 | |||||||||||||||||||||||||||||||
| Canadian dollars | Q4 | Q3 | Q2 | Q1 | Q4 | Q3 | Q2 | Q1 | ||||||||||||||||||||||||
|
|
||||||||||||||||||||||||||||||||
| Declared dividend per share |
0.15 | 0.15 | 0.15 | 0.14 | 0.14 | 0.14 | 0.13 | 0.13 | ||||||||||||||||||||||||
|
|
||||||||||||||||||||||||||||||||
Information for security holders outside Canada
Cash dividends paid to shareholders resident in countries with which Canada has an income tax convention are usually subject to a Canadian non-resident withholding tax of 15 percent, but may vary from one tax convention to another.
The withholding tax is reduced to 5 percent on dividends paid to a corporation resident in the U.S. that owns at least 10 percent of the voting shares of the company.
The company is a qualified foreign corporation for purposes of the reduced U.S. capital gains tax rates, which are applicable to dividends paid by U.S. domestic corporations and qualified foreign corporations.
There is no Canadian tax on gains from selling shares or debt instruments owned by non-residents not carrying on business in Canada, as long as the shareholder does not, in any given 60 month period, own 25 percent or more of the shares of the company.
As of February 8, 2017 there were 11,238 holders of record of common shares of the company.
Between October 1, 2016 and December 31, 2016, pursuant to the company’s restricted stock unit plan, 400 shares were issued to employees outside the U.S. in reliance on Regulation S under the Securities Act, and 650 shares were issued to a seconded employee in reliance on the section 4(a)(2) exemption under the Securities Act.
Securities authorized for issuance under equity compensation plans
Sections of the company’s management proxy circular are contained in the Proxy information section, starting on page 86. The company’s management proxy circular is prepared in accordance with Canadian securities regulations.
Reference is made to the section under the “Company executives and executive compensation”:
| ● | Entitled “Performance graph” within the “Compensation discussion and analysis” section on page 141 of this report; and |
| ● | Entitled “Equity compensation plan information”, within the “Compensation discussion and analysis”, on page 146 of this report. |
21
Table of Contents
Issuer purchases of equity securities
| Total number of shares purchased |
Average price paid per share |
Total number of shares plans or programs |
Maximum number of shares that may yet |
|||||||||||||
|
|
||||||||||||||||
| October 2016 (October 1 – October 31) |
- | - | - | 1,000,000 | ||||||||||||
| November 2016 (November 1 - November 30) |
- | - | - | 1,000,000 | ||||||||||||
| December 2016 (December 1 - December 31) |
1,050 | 48.09 | 1,050 | 998,950 | ||||||||||||
|
|
||||||||||||||||
| (a) | On June 22, 2016, the company announced by news release that it had received final approval from the Toronto Stock Exchange for a new normal course issuer bid and will continue its share repurchase program. The new program enables the company to repurchase up to a maximum of 1,000,000 common shares during the period June 27, 2016 to June 26, 2017. The program will end when the company has purchased the maximum allowable number of shares, or on June 26, 2017. |
| Item 6. | Selected financial data |
| millions of Canadian dollars | 2016 | 2015 | 2014 | 2013 | 2012 | |||||||||||||||
|
|
||||||||||||||||||||
| Operating revenues |
25,049 | 26,756 | 36,231 | 32,722 | 31,053 | |||||||||||||||
| Net income (loss) |
2,165 | 1,122 | 3,785 | 2,828 | 3,766 | |||||||||||||||
| Total assets at year-end |
41,654 | 43,170 | 40,830 | 37,218 | 29,364 | |||||||||||||||
| Long-term debt at year-end |
5,032 | 6,564 | 4,913 | 4,444 | 1,175 | |||||||||||||||
| Total debt at year-end |
5,234 | 8,516 | 6,891 | 6,287 | 1,647 | |||||||||||||||
| Other long-term obligations at year-end |
3,656 | 3,597 | 3,565 | 3,091 | 3,983 | |||||||||||||||
|
|
||||||||||||||||||||
| Canadian dollars |
||||||||||||||||||||
| Net income (loss) per share - basic |
2.55 | 1.32 | 4.47 | 3.34 | 4.44 | |||||||||||||||
| Net income (loss) per share - diluted |
2.55 | 1.32 | 4.45 | 3.32 | 4.42 | |||||||||||||||
| Dividends declared |
0.59 | 0.54 | 0.52 | 0.49 | 0.48 | |||||||||||||||
|
|
||||||||||||||||||||
Reference is made to the table setting forth exchange rates for the Canadian dollar, expressed in U.S. dollars, on page 2 of this report.
| Item 7. | Management’s discussion and analysis of financial condition and results of operations |
Reference is made to the section entitled “Management’s discussion and analysis of financial condition and results of operations” in the Financial section, starting on page 34 of this report.
| Item 7A. | Quantitative and qualitative disclosures about market risk |
Reference is made to the section entitled “Market risks and other uncertainties” in the Financial section, starting on page 44 of this report. All statements other than historical information incorporated in this Item 7A are forward-looking statements. The actual impact of future market changes could differ materially due to, among other things, factors discussed in this report.
22
Table of Contents
| Item 8. | Financial statements and supplementary data |
Reference is made to the table of contents in the Financial section on page 30 of this report:
| ● | Consolidated financial statements, together with the report thereon of PricewaterhouseCoopers LLP (PwC) dated February 22, 2017 beginning with the section entitled “Report of independent registered public accounting firm” on page 52 and continuing through note 17, “Other comprehensive income (loss) information” on page 80; |
| ● | “Supplemental information on oil and gas exploration and production activities” (unaudited) starting on page 81; and |
| ● | “Quarterly financial and stock trading data” (unaudited) on page 85. |
| Item 9. | Changes in and disagreements with accountants on accounting and financial disclosure |
None.
| Item 9A. | Controls and procedures |
As indicated in the certifications in Exhibit 31 of this report, the company’s principal executive officer and principal financial officer have evaluated the company’s disclosure controls and procedures as of December 31, 2016. Based on that evaluation, these officers have concluded that the company’s disclosure controls and procedures are effective in ensuring that information required to be disclosed by the company in the reports that it files or submits under the Securities Exchange Act of 1934, as amended, is accumulated and communicated to them in a manner that allows for timely decisions regarding required disclosures and are effective in ensuring that such information is recorded, processed, summarized and reported within the time periods specified in the SEC’s rules and forms.
Reference is made to page 51 of this report for “Management’s report on internal control over financial reporting” and page 52 for the “Report of independent registered public accounting firm” on the company’s internal control over financial reporting as of December 31, 2016.
There has not been any change in the company’s internal control over financial reporting during the last fiscal quarter that has materially affected, or is reasonably likely to materially affect, the company’s internal control over financial reporting.
| Item 9B. | Other information |
None.
23
Table of Contents
| Item 10. | Directors, executive officers and corporate governance |
Sections of the company’s management proxy circular are contained in the Proxy information section, starting on page 86. The company’s management proxy circular is prepared in accordance with Canadian securities regulations.
The company currently has seven directors. The articles of the company require that the board have between five and fifteen directors. Each director is elected to hold office until the close of the next annual meeting. Each of the seven individuals listed in the section entitled “Director nominee information” on pages 87 to 95 of this report have been nominated for election at the annual meeting of shareholders to be held April 28, 2017. All of the nominees are directors and have been since the dates indicated.
Reference is made to the section under “Director nominee information”:
| ● | “Director nominee tables”, on pages 87 to 95 of this report; |
Reference is made to the sections under “Corporate governance disclosure”:
| ● | “Other public company directorships of our board nominees”, on page 102 of this report. |
| ● | The table entitled “Audit committee” under “Board and committee structure”, on page 106 of this report; |
| ● | “Ethical business conduct”, starting on page 118 of this report; and |
| ● | “Largest shareholder”, on page 120 of this report. |
Reference is made to the sections under “Company executives and executive compensation”:
| ● | “Named executive officers of the company” and “Other executive officers of the company”, on pages 121 to 123 of this report. |
| Item 11. | Executive compensation |
Sections of the company’s management proxy circular are contained in the Proxy information section, starting on page 86. The company’s management proxy circular is prepared in accordance with Canadian securities regulations.
Reference is made to the sections under “Corporate governance disclosure”:
| ● | “Board of director compensation”, on pages 110 to 116 of this report; and |
| ● | “Share ownership guidelines of independent directors and chairman, president and chief executive officer”, on page 117 of this report. |
Reference is made to the following sections under “Company executives and executive compensation”:
| ● | “Letter to Shareholders from the executive resources committee on executive compensation”, starting on page 124 of this report; and |
| ● | “Compensation discussion and analysis”, on pages 126 to 147 of this report. |
24
Table of Contents
| Item 12. | Security ownership of certain beneficial owners and management and related stockholder matters |
Sections of the company’s management proxy circular are contained in the Proxy information section, starting on page 86. The company’s management proxy circular is prepared in accordance with Canadian securities regulations.
Reference is made to the section under “Company executives and executive compensation” entitled “Equity compensation plan information”, within the “Compensation discussion and analysis” section, on page 146 of this report.
Reference is made to the section under “Corporate governance disclosure” entitled “Largest shareholder”, on page 120 of this report.
Reference is also made to the security ownership information for directors and executive officers of the company under the preceding Items 10 and 11. With respect to named executive officers who are not directors of the company, as of February 8, 2017, B.A. Babcock was the owner of 25,539 common shares of the company and held 111,500 restricted stock units of the company. B.P. Cahir held 32,400 restricted stock units of the company. W.J. Hartnett was the owner of 14,925 common shares of the company and held 96,800 restricted stock units of the company. T.B. Redburn was the owner of 3,215 common shares of the company and held 76,950 restricted stock units of the company.
The directors and the executive officers of the company, whose compensation for the year-ended December 31, 2016 is described in the sections under “Director nominee information” starting on page 87 and “Company executives and executive compensation” starting on page 121, consist of 18 persons, who, as a group, as of February 8, 2017, beneficially own 161,024 common shares of the company, being approximately 0.02 percent of the total number of outstanding shares of the company, and 457,483 shares of Exxon Mobil Corporation (including 398,050 restricted shares). This information not being within the knowledge of the company has been provided by the directors and the executive officers individually. As a group, the directors and executive officers of the company held restricted stock units to acquire 724,758 common shares of the company, as of February 8, 2017.
| Item 13. | Certain relationships and related transactions, and director independence |
Sections of the company’s management proxy circular are contained in the Proxy information section, starting on page 86. The company’s management proxy circular is prepared in accordance with Canadian securities regulations.
Reference is made to the section under “Corporate governance disclosure” entitled “Independence of our board nominees”, on page 99 of this report.
Reference is made to the section under “Corporate governance disclosure” entitled “Transactions with Exxon Mobil Corporation”, on page 120 of this report.
D.G. (Jerry) Wascom is deemed a non-independent member of the board of directors and the executive resources committee, environmental, health and safety committee, nominations and corporate governance committee and contributions committee under the relevant standards. As an employee of ExxonMobil Refining & Supply Company, D.G. (Jerry) Wascom is independent of the company’s management and is able to assist these committees by reflecting the perspective of the company’s shareholders.
25
Table of Contents
| Item 14. | Principal accountant fees and services |
Auditor information
The audit committee of the board of directors recommends that PricewaterhouseCoopers LLP (“PwC”) be reappointed as the auditor of the company until the close of the next annual meeting. PwC have been the auditor of the company for more than five years and are located in Calgary, Alberta. PwC are a participating audit firm with the Canadian Public Accountability Board.
Auditor fees
The aggregate fees of PwC for professional services rendered for the audit of the company’s financial statements and other services for the fiscal years ended December 31, 2016 and December 31, 2015 were as follows:
| thousands of Canadian dollars | 2016 | 2015 | ||||||
|
|
||||||||
| Audit fees | 1,500 | 1,416 | ||||||
| Audit-related fees | 104 | 107 | ||||||
| Tax fees | - | - | ||||||
| All other fees | - | - | ||||||
|
|
||||||||
| Total fees | 1,604 | 1,523 | ||||||
|
|
||||||||
Audit fees included the audit of the company’s annual financial statements, internal control over financial reporting, and a review of the first three quarterly financial statements in 2016. Audit-related fees consisted of other assurance services including the audit of the company’s retirement plan and royalty statement audits for oil and gas producing entities. The company did not engage the auditor for any other services.
The audit committee formally and annually evaluates the performance of the external auditor, recommends the external auditor to be appointed by the shareholders, fixes their remuneration and oversees their work. The audit committee also approves the proposed current year audit program of the external auditor, assesses the results of the program after the end of the program period and approves in advance any non-audit services to be performed by the external auditor after considering the effect of such services on their independence.
All of the services rendered by the auditor to the company were approved by the audit committee.
Auditor independence
The audit committee continually discusses with PwC their independence from the company and from management. PwC have confirmed that they are independent with respect to the company within the meaning of the Rules of Professional Conduct of the Institute of Chartered Professional Accountants of Alberta and the rules of the U.S. Securities and Exchange Commission. The company has concluded that the auditor’s independence has been maintained.
26
Table of Contents
| Item 15. | Exhibits, financial statement schedules |
Reference is made to the table of contents in the Financial section on page 30 of this report.
The following exhibits, numbered in accordance with Item 601 of Regulation S-K, are filed as part of this report:
| (3) | (i) | Restated certificate and articles of incorporation of the company (Incorporated herein by reference to Exhibit (3.1) to the company’s Form 8-Q filed on May 3, 2006 (File No. 0-12014)). | ||||
| (ii) | By-laws of the company (Incorporated herein by reference to Exhibit (3)(ii) to the company’s Quarterly Report on Form 10-Q for the quarter ended March 31, 2003 (File No. 0-12014)). | |||||
| (10) | (ii) | (1) | Syncrude Ownership and Management Agreement, dated February 4, 1975 (Incorporated herein by reference to Exhibit 13(b) of the company’s Registration Statement on Form S-1, as filed with the Securities and Exchange Commission on August 21, 1979 (File No. 2-65290)). | |||
| (2) | Letter Agreement, dated February 8, 1982, between the Government of Canada and Esso Resources Canada Limited, amending Schedule “C” to the Syncrude Ownership and Management Agreement filed as Exhibit (10)(ii)(2) (Incorporated herein by reference to Exhibit (20) of the company’s Annual Report on Form 10-K for the year ended December 31, 1981 (File No. 2-9259)). | |||||
| (3) | Alberta Cold Lake Crown Agreement, dated June 25, 1984, relating to the royalties payable and the assurances given in respect of the Cold Lake production project (Incorporated herein by reference to Exhibit (10)(ii)(11) of the company’s Annual Report on Form 10-K for the year ended December 31, 1986 (File No. 0-12014)). | |||||
| (4) | Amendment to Syncrude Ownership and Management Agreement, dated March 10, 1982 (Incorporated herein by reference to Exhibit (10)(ii)(14) of the company’s Annual Report on Form 10-K for the year ended December 31, 1989 (File No. 0-12014)). | |||||
| (5) | Alberta Cold Lake Transition Agreement, effective January 1, 2000, relating to the royalties payable in respect of the Cold Lake production project and terminating the Alberta Cold Lake Crown Agreement. (Incorporated herein by reference to Exhibit (10)(ii)(20) of the company’s Annual Report on Form 10-K for the year ended December 31, 2001 (File No. 0-12014)). | |||||
| (6) | Amendment to Syncrude Ownership and Management Agreement effective January 1, 2001 (Incorporated herein by reference to Exhibit (10)(ii)(22) of the company’s Quarterly Report on Form 10-Q for the quarter ended June 30, 2002 (File No. 0-12014)). | |||||
| (7) | Amendment to Syncrude Ownership and Management Agreement effective September 16, 1994 (Incorporated herein by reference to Exhibit (10)(ii)(23) of the company’s Quarterly Report on Form 10-Q for the quarter ended June 30, 2002 (File No. 0-12014)). | |||||
| (8) | Syncrude Bitumen Royalty Option Agreement, dated November 18, 2008, setting out the terms of the exercise by the Syncrude Joint Venture owners of the option contained in the existing Crown Agreement to convert to a royalty payable on the value of bitumen, effective January 1, 2009 (Incorporated herein by reference to Exhibit 1.01(10)(ii)(2) of the company’s Form 8-K filed on November 19, 2008 (File No. 0-12014)). | |||||
| (iii)(A) | (1) | Form of Letter relating to Supplemental Retirement Income (Incorporated herein by reference to Exhibit (10)(c)(3) of the company’s Annual Report on Form 10-K for the year ended December 31, 1980 (File No. 2-9259)). | ||||
| (2) | Deferred Share Unit Plan for Nonemployee Directors. (Incorporated herein by reference to Exhibit (10)(iii)(A)(6) of the company’s Annual Report on Form 10-K for the year ended December 31, 1998 (File No. 0-12014)). | |||||
| (3) | Amended Restricted Stock Unit Plan with respect to Restricted Stock Units granted in 2008 and subsequent years, as amended effective November 20, 2008 (Incorporated herein by reference to Exhibit 9.01(c)[10(iii)(A)(5)] of the company’s Form 8-K filed on November 25, 2008 (File No. 0-12014)). | |||||
| (4) | Short Term Incentive Program for selected executives effective February 2, 2012 (Incorporated herein by reference to Exhibit 9.01(c)[10(iii)(A)(1)] of the company’s Form 8-K filed on February 7, 2012 (File No. 0-12014)). | |||||
27
Table of Contents
| (5) | Amended Restricted Stock Unit Plan with respect to Restricted Stock Units granted in 2011 and subsequent years, as amended effective November 14, 2011 (Incorporated herein by reference to Exhibit 9.01(c)[10(iii)(A)(1)] of the company’s Form 8-K filed on February 23, 2012 (File No. 0-12014)). | |||||
| (6) | Amended Restricted Stock Unit Plan with respect to Restricted Stock Units granted in 2016 and subsequent years, as amended effective October 26, 2016 (Incorporated herein by reference to Exhibit 9.01(c)[10(iii)(A)(1)] of the company’s Form 8-K filed on October 31, 2016 (File No. 0-12014)). | |||||
| (7) | Amended Short Term Incentive Program with respect to awards granted in 2016 and subsequent years, as amended effective October 26, 2016 (Incorporated herein by reference to Exhibit 9.01(c)[10(iii)(A)(1)] of the company’s Form 8-K filed on October 31, 2016 (File No. 0-12014)). | |||||
| (21) | Imperial Oil Resources Limited, McColl-Frontenac Petroleum ULC and Imperial Oil Resources Ventures Limited, all incorporated in Canada, are wholly-owned subsidiaries of the company. The names of all other subsidiaries of the company are omitted because, considered in the aggregate as a single subsidiary, they would not constitute a significant subsidiary as of December 31, 2016. | |||||
| (23) (ii) | (A) | Consent of Independent Registered Public Accounting Firm (PricewaterhouseCoopers LLP). | ||||
| (31.1) | Certification by principal executive officer of Periodic Financial Report pursuant to Rule 13a-14(a). | |||||
| (31.2) | Certification by principal financial officer of Periodic Financial Report pursuant to Rule 13a-14(a). | |||||
| (32.1) | Certification by chief executive officer of Periodic Financial Report pursuant to Rule 13a-14(b) and 18 U.S.C. Section 1350. | |||||
| (32.2) | Certification by chief financial officer of Periodic Financial Report pursuant to Rule 13a-14(b) and 18 U.S.C. Section 1350. | |||||
Copies of Exhibits may be acquired upon written request of any shareholder to the investor relations manager, Imperial Oil Limited, 505 Quarry Park Boulevard S.E., Calgary, Alberta T2C 5N1, and payment of processing and mailing costs.
Not applicable.
28
Table of Contents
Pursuant to the requirements of Section 13 or 15(d) of the Securities Exchange Act of 1934, the registrant has duly caused this report to be signed on its behalf on February 22, 2017 by the undersigned, thereunto duly authorized.
| Imperial Oil Limited |
|
by /s/ Richard M. Kruger |
| (Richard M. Kruger) |
| Chairman, president and chief executive officer |
Pursuant to the requirements of the Securities Exchange Act of 1934, this report has been signed below on February 22, 2017 by the following persons on behalf of the registrant and in the capacities indicated.
| Signature | Title | |||
| /s/ Richard M. Kruger |
Chairman, president and | |||
| (Richard M. Kruger) | chief executive officer and director | |||
| (Principal executive officer) | ||||
| /s/ Beverley A. Babcock |
Senior vice-president, | |||
| (Beverley A. Babcock) | finance and administration, and controller | |||
| (Principal financial officer and principal | ||||
| accounting officer) | ||||
| /s/ Krystyna T. Hoeg |
Director | |||
| (Krystyna T. Hoeg) | ||||
| /s/ Jack M. Mintz |
Director | |||
| (Jack M. Mintz) | ||||
| /s/ David S. Sutherland |
Director | |||
| (David S. Sutherland) | ||||
| /s/ D.G. (Jerry) Wascom |
Director | |||
| (D.G. (Jerry) Wascom) | ||||
| /s/ Sheelagh D. Whittaker |
Director | |||
| (Sheelagh D. Whittaker) | ||||
| /s/ Victor L. Young |
Director | |||
| (Victor L. Young) | ||||
29
Table of Contents
| Table of contents | Page | |||
| 31 | ||||
| 32 | ||||
| Management’s discussion and analysis of financial condition and results of operations |
34 | |||
| 34 | ||||
| 34 | ||||
| 37 | ||||
| 41 | ||||
| 44 | ||||
| 44 | ||||
| 46 | ||||
| 50 | ||||
| Management’s report on internal control over financial reporting |
51 | |||
| 52 | ||||
| 53 | ||||
| 54 | ||||
| 55 | ||||
| 56 | ||||
| 57 | ||||
| 58 | ||||
| 58 | ||||
| 63 | ||||
| 65 | ||||
| 66 | ||||
| 72 | ||||
| 72 | ||||
| 72 | ||||
| 74 | ||||
| 74 | ||||
| 75 | ||||
| 76 | ||||
| 12. Financing costs and additional notes and loans payable information |
76 | |||
| 76 | ||||
| 77 | ||||
| 78 | ||||
| 79 | ||||
| 80 | ||||
| Supplemental information on oil and gas exploration and production activities (unaudited) |
81 | |||
| 85 | ||||
30
Table of Contents
Financial information (U.S. GAAP)
| millions of Canadian dollars | 2016 | 2015 | 2014 | 2013 | 2012 | |||||||||||||||
|
|
||||||||||||||||||||
| Operating revenues |
25,049 | 26,756 | 36,231 | 32,722 | 31,053 | |||||||||||||||
| Net income (loss) by segment: |
||||||||||||||||||||
| Upstream |
(661 | ) | (704 | ) | 2,059 | 1,712 | 1,888 | |||||||||||||
| Downstream |
2,754 | 1,586 | 1,594 | 1,052 | 1,772 | |||||||||||||||
| Chemical |
187 | 287 | 229 | 162 | 165 | |||||||||||||||
| Corporate and Other |
(115 | ) | (47 | ) | (97 | ) | (98 | ) | (59) | |||||||||||
|
|
||||||||||||||||||||
| Net income (loss) |
2,165 | 1,122 | 3,785 | 2,828 | 3,766 | |||||||||||||||
|
|
||||||||||||||||||||
| Cash and cash equivalents at year-end |
391 | 203 | 215 | 272 | 482 | |||||||||||||||
| Total assets at year-end |
41,654 | 43,170 | 40,830 | 37,218 | 29,364 | |||||||||||||||
| Long-term debt at year-end |
5,032 | 6,564 | 4,913 | 4,444 | 1,175 | |||||||||||||||
| Total debt at year-end |
5,234 | 8,516 | 6,891 | 6,287 | 1,647 | |||||||||||||||
| Other long-term obligations at year-end |
3,656 | 3,597 | 3,565 | 3,091 | 3,983 | |||||||||||||||
| Shareholders’ equity at year-end |
25,021 | 23,425 | 22,530 | 19,524 | 16,377 | |||||||||||||||
| Cash flow from operating activities |
2,015 | 2,167 | 4,405 | 3,292 | 4,680 | |||||||||||||||
| Per-share information (dollars) |
||||||||||||||||||||
| Net income (loss) per share - basic |
2.55 | 1.32 | 4.47 | 3.34 | 4.44 | |||||||||||||||
| Net income (loss) per share - diluted |
2.55 | 1.32 | 4.45 | 3.32 | 4.42 | |||||||||||||||
| Dividends declared |
0.59 | 0.54 | 0.52 | 0.49 | 0.48 | |||||||||||||||
|
|
||||||||||||||||||||
31
Table of Contents
Listed below are definitions of several of Imperial’s key business and financial performance measures. The definitions are provided to facilitate understanding of the terms and how they are calculated.
Capital employed
Capital employed is a measure of net investment. When viewed from the perspective of how capital is used by the business, it includes the company’s property, plant and equipment and other assets, less liabilities, excluding both short-term and long-term debt. When viewed from the perspective of the sources of capital employed in total for the company, it includes total debt and equity. Both of these views include the company’s share of amounts applicable to equity companies, which the company believes should be included to provide a more comprehensive measurement of capital employed.
| millions of Canadian dollars | 2016 | 2015 | 2014 | |||||||||
|
|
||||||||||||
| Business uses: asset and liability perspective |
||||||||||||
| Total assets |
41,654 | 43,170 | 40,830 | |||||||||
| Less: total current liabilities excluding notes and loans payable |
(3,681 | ) | (3,441 | ) | (4,003) | |||||||
| total long-term liabilities excluding long-term debt |
(7,718 | ) | (7,788 | ) | (7,406) | |||||||
| Add: Imperial’s share of equity company debt |
17 | 18 | 19 | |||||||||
|
|
||||||||||||
| Total capital employed |
30,272 | 31,959 | 29,440 | |||||||||
|
|
||||||||||||
| Total company sources: debt and equity perspective |
||||||||||||
| Notes and loans payable |
202 | 1,952 | 1,978 | |||||||||
| Long-term debt |
5,032 | 6,564 | 4,913 | |||||||||
| Shareholders’ equity |
25,021 | 23,425 | 22,530 | |||||||||
| Add: Imperial’s share of equity company debt |
17 | 18 | 19 | |||||||||
|
|
||||||||||||
| Total capital employed |
30,272 | 31,959 | 29,440 | |||||||||
|
|
||||||||||||
Return on average capital employed (ROCE)
ROCE is a financial performance ratio. From the perspective of the business segments, ROCE is annual business-segment net income divided by average business-segment capital employed (an average of the beginning and end-of-year amounts). Segment net income includes Imperial’s share of segment net income of equity companies, consistent with the definition used for capital employed, and excludes the cost of financing. The company’s total ROCE is net income excluding the after-tax cost of financing divided by total average capital employed. The company has consistently applied its ROCE definition for many years and views it as the best measure of historical capital productivity in a capital-intensive, long-term industry to both evaluate management’s performance and demonstrate to shareholders that capital has been used wisely over the long term. Additional measures, which are more cash flow based, are used to make investment decisions.
| millions of Canadian dollars | 2016 | 2015 | 2014 | |||||||||
|
|
||||||||||||
| Net income |
2,165 | 1,122 | 3,785 | |||||||||
| Financing costs (after tax), including Imperial’s share of equity companies |
53 | 30 | 1 | |||||||||
|
|
||||||||||||
| Net income excluding financing costs |
2,218 | 1,152 | 3,786 | |||||||||
|
|
||||||||||||
| Average capital employed |
31,116 | 30,700 | 27,637 | |||||||||
|
|
||||||||||||
| Return on average capital employed (percent) – corporate total |
7.1 | 3.8 | 13.7 | |||||||||
|
|
||||||||||||
32
Table of Contents
Cash flow from operating activities and asset sales
Cash flow from operating activities and asset sales is the sum of the net cash provided by operating activities and proceeds from asset sales reported in the consolidated statement of cash flows. This cash flow reflects the total sources of cash both from operating the company’s assets and from the divesting of assets. The company employs a long-standing and regular disciplined review process to ensure that all assets are contributing to the company’s strategic objectives. Assets are divested when they no longer meet these objectives or are worth considerably more to others. Because of the regular nature of this activity, the company believes it is useful for investors to consider sales proceeds together with cash provided by operating activities when evaluating cash available for investment in the business and financing activities, including shareholder distributions.
| millions of Canadian dollars | 2016 | 2015 | 2014 | |||||||||
|
|
||||||||||||
| Cash from operating activities |
2,015 | 2,167 | 4,405 | |||||||||
| Proceeds from asset sales |
3,021 | 142 | 851 | |||||||||
|
|
||||||||||||
| Total cash flow from operating activities and asset sales |
5,036 | 2,309 | 5,256 | |||||||||
|
|
||||||||||||
Operating costs
Operating costs are the costs during the period to produce, manufacture, and otherwise prepare the company’s products for sale – including energy costs, staffing and maintenance costs. They exclude the cost of raw materials, taxes and interest expense and are on a before-tax basis. While the company is responsible for all revenue and expense elements of net income, operating costs represent the expenses most directly under the company’s control and therefore, are useful in evaluating the company’s performance.
Reconciliation of operating costs
| millions of Canadian dollars | 2016 | 2015 | 2014 | |||||||||
|
|
||||||||||||
| From Imperial’s consolidated statement of income |
||||||||||||
| Total expenses |
24,910 | 24,965 | 31,945 | |||||||||
| Less: |
||||||||||||
| Purchases of crude oil and products |
15,120 | 15,284 | 22,479 | |||||||||
| Federal excise tax |
1,650 | 1,568 | 1,562 | |||||||||
| Financing costs |
65 | 39 | 4 | |||||||||
|
|
||||||||||||
| Subtotal |
16,835 | 16,891 | 24,045 | |||||||||
| Imperial’s share of equity company expenses |
63 | 40 | 39 | |||||||||
|
|
||||||||||||
| Total operating costs |
8,138 | 8,114 | 7,939 | |||||||||
|
|
||||||||||||
| Components of operating costs | ||||||||||||
| millions of Canadian dollars | 2016 | 2015 | 2014 | |||||||||
|
|
||||||||||||
| From Imperial’s consolidated statement of income |
||||||||||||
| Production and manufacturing |
5,224 | 5,434 | 5,662 | |||||||||
| Selling and general |
1,129 | 1,117 | 1,075 | |||||||||
| Depreciation and depletion |
1,628 | 1,450 | 1,096 | |||||||||
| Exploration |
94 | 73 | 67 | |||||||||
|
|
||||||||||||
| Subtotal |
8,075 | 8,074 | 7,900 | |||||||||
| Imperial’s share of equity company expenses |
63 | 40 | 39 | |||||||||
|
|
||||||||||||
| Total operating costs |
8,138 | 8,114 | 7,939 | |||||||||
|
|
||||||||||||
33
Table of Contents
Management’s discussion and analysis of financial condition and results of operations
The following discussion and analysis of Imperial’s financial results, as well as the accompanying financial statements and related notes to consolidated financial statements to which they refer, are the responsibility of the management of Imperial Oil Limited.
The company’s accounting and financial reporting fairly reflect its straightforward business model involving the extracting, refining and marketing of hydrocarbons and hydrocarbon-based products. The company’s business involves the production (or purchase), manufacture and sale of physical products, and all commercial activities are directly in support of the underlying physical movement of goods.
Imperial, with its resource base, financial strength, disciplined investment approach and technology portfolio, is well-positioned to participate in substantial investments to develop new Canadian energy supplies. The company’s integrated business model, with significant investments in Upstream, Downstream and Chemical segments, reduces the company’s risk from changes in commodity prices. While commodity prices are volatile on a short-term basis depending upon supply and demand, Imperial’s investment decisions are based on its long-term business outlook, using a disciplined approach in selecting and pursuing the most attractive investment opportunities. The corporate plan is a fundamental annual management process that is the basis for setting near-term operating and capital objectives, in addition to providing the longer-term economic assumptions used for investment evaluation purposes. Major investment opportunities are tested over a wide range of economic scenarios. Once major investments are made, a reappraisal process is completed to ensure relevant lessons are learned and improvements are incorporated into future projects.
The term “project” as used in this report can refer to a variety of different activities and does not necessarily have the same meaning as in any government payment transparency reports.
Business environment and risk assessment
Long-term business outlook
By 2040, the world’s population is projected to grow to approximately nine billion people, or about 1.8 billion more people than in 2015. Coincident with this population increase, the company expects worldwide economic growth to average close to 3 percent per year. As economies and populations grow, and as living standards improve for billions of people, the need for energy will continue to rise. Even with significant efficiency gains, global energy demand is projected to rise by about 25 percent from 2015 to 2040. This demand increase is expected to be concentrated in developing countries (i.e., those that are not member nations of the Organization for Economic Cooperation and Development). Canada is expected to see flat to modest local energy demand growth through to 2040 and will continue to be a large supplier of energy exports to help meet rising global energy needs.
As expanding prosperity drives global energy demand higher, increasing use of energy-efficient technologies and practices as well as lower-emission fuels will continue to help significantly reduce energy consumption and emissions per unit of economic output over time. Substantial efficiency gains are likely in all key aspects of the world economy through 2040, affecting energy requirements for transportation, power generation, industrial applications and residential and commercial needs.
Energy for global transportation – including cars, trucks, ships, trains and airplanes – is expected to increase by about 25 percent from 2015 to 2040. The growth in transportation energy demand is likely to account for approximately 60 percent of the growth in liquid fuels demand worldwide over this period. Nearly all the world’s transportation fleets will continue to run on liquid fuels, which are abundant, widely available, easy to transport and provide a large quantity of energy in small volumes.
Demand for electricity around the world is likely to increase approximately 60 percent from 2015 to 2040, led by a doubling of demand in developing countries. Consistent with this projection, power generation is expected to remain the largest and fastest-growing major segment of global energy demand. Meeting the expected growth in power demand will require a diverse set of energy sources. In 2015 coal-fired generation provided about 40 percent of the world’s electricity, however by 2040 coal-fired generation is likely to decline
34
Table of Contents
to less than 30 percent, in part as a result of policies to improve air quality as well as reduce greenhouse gas emissions to address the risks of climate change. From 2015 to 2040, the amount of electricity generated using natural gas, nuclear power, and renewables is likely to approximately double, and account for 90 percent of the growth in electricity supplies. By 2040, coal, natural gas and renewables are projected to each generate a similar share of electricity worldwide, although significant differences will exist across regions reflecting a wide range of factors including the cost and availability of energy types.
Liquid fuels provide the largest share of global energy supplies today due to their broad-based availability, affordability, ease of distribution and storage. By 2040, global demand for liquid fuels is expected to grow to approximately 112 million barrels of oil-equivalent per day, an increase of almost 20 percent from 2015. Globally, crude production from traditional conventional sources will likely decline slightly through 2040, with significant development activity mostly offsetting natural declines from these fields. However, this decline is expected to be more than offset by rising production from a wide variety of emerging supply sources – including tight oil, deep-water, oil sands, natural gas liquids and biofuels. The world’s resource base is sufficient to meet projected demand through 2040 as technology advances continue to expand the availability of economic supply options. However, access to resources and timely investments will remain critical to meeting global needs with reliable, affordable supplies.
Natural gas is a versatile fuel, suitable for a wide variety of applications and it is expected to be the fastest-growing major fuel source from 2015 to 2040, meeting about 40 percent of energy demand growth. Global demand is expected to rise about 45 percent from 2015 to 2040, with about 45 percent of that increase in the Asia Pacific region. Helping meet these needs will lead to significant growth in supplies of unconventional gas - the natural gas found in shale and other rock formations that was once considered uneconomic to produce. In total, about 60 percent of the growth in natural gas supplies is expected to be from unconventional sources. However, it is expected conventionally-produced natural gas will remain the cornerstone of supply, meeting about two-thirds of global demand in 2040. Worldwide liquefied natural gas (LNG) trade will expand significantly, likely reaching more than 2.5 times the level of 2015 by 2040, with much of this supply expected to meet rising demand in Asia Pacific.
The world’s energy mix is highly diverse and will remain so through 2040. Oil is expected to remain the largest source of energy with its share remaining close to one-third in 2040. Coal is currently the second largest source of energy, but it is likely to lose that position to natural gas in the 2025 to 2030 timeframe. The share of natural gas is expected to reach 25 percent by 2040, while the share of coal falls to about 20 percent. Nuclear power is projected to grow significantly, as many nations are likely to expand nuclear capacity to address rising electricity needs as well as energy security and environmental issues. Total renewable energy is likely to reach about 15 percent of total energy by 2040, with biomass, hydro and geothermal contributing a combined share of more than 10 percent. Total energy supplied from wind, solar and biofuels is expected to increase rapidly, growing over 200 percent from 2015 to 2040, when they will approach 4 percent of the world’s energy.
The company anticipates that the world’s available oil and gas resource base will grow not only from new discoveries but also from reserve increases in previously discovered fields. Technology will underpin these increases. The cost to develop and supply these resources will be significant. According to the International Energy Agency, the investment required to meet oil and natural gas supply requirements worldwide over the period 2016 to 2040 will be about US$23 trillion (measured in 2015 dollars) or approximately US$900 billion per year on average.
International accords and underlying regional and national regulations covering greenhouse gas emissions continue to evolve with uncertain timing and outcome, making it difficult to predict their business impact. Imperial’s estimate of potential costs related to possible public policies covering energy-related greenhouse gas emissions are consistent with those outlined in ExxonMobil’s long-term Outlook for Energy, which is used as a foundation for assessing the business environment and Imperial’s investment evaluations.
The information provided in the long-term business outlook includes internal estimates and forecasts based upon internal data and analyses as well as publicly available information from external sources including the International Energy Agency.
Upstream
Imperial produces crude oil and natural gas for sale predominantly into the North American markets. Imperial’s Upstream business strategies guide the company’s exploration, development, production, research and gas marketing activities. These strategies include capturing material and accretive opportunities to
35
Table of Contents
continually high-grade the resource portfolio, exercising a disciplined approach to investing and cost management, developing and applying high-impact technologies, pursuing productivity and efficiency gains, and growing profitable oil and gas production. These strategies are underpinned by a relentless focus on operational excellence, commitment to innovative technologies, development of employees and investment in the communities within which the company operates.
Imperial has a significant oil and gas resource base and a large inventory of potential projects. The company continues to evaluate opportunities to support the company’s long-term growth. Actual volumes will vary from year to year due to the factors described in Item 1A. Risk factors.
Prices for most of the company’s crude oil sold are referenced to West Texas Intermediate (WTI) and Western Canada Select (WCS) oil markets. In 2016, the average WTI and WCS crude oil prices, in U.S. dollars, were lower versus 2015. The upstream industry environment has been challenged in recent years with abundant crude oil supply causing crude oil prices to decrease to levels not seen since 2004. However, current market conditions are not necessarily indicative of future conditions. The markets for crude oil and natural gas have a history of significant price volatility. Imperial believes prices over the long term will continue to be driven by market supply and demand, with the demand side largely being a function of global economic growth. On the supply side, prices may be significantly impacted by political events, the actions of OPEC and other large government resource owners, and other factors. To manage the risks associated with price, Imperial evaluates annual plans and all major investments across a range of price scenarios.
Downstream
Imperial’s Downstream serves predominantly Canadian markets with refining, logistics and marketing assets. Imperial’s Downstream business strategies guide the company’s activities. These strategies include targeting best-in-class operations in all aspects of the business, maximizing value from advanced technologies, capitalizing on integration across Imperial’s businesses, selectively investing for resilient and advantaged returns, operating efficiently and effectively, and providing valued products and services to customers.
Imperial owns and operates three refineries in Canada, with aggregate distillation capacity of 423,000 barrels per day. Imperial’s fuels marketing business across Canada serves customers through more than 1,700 Esso-branded retail sites, as well as wholesale and industrial operations through a network of primary distribution terminals.
Refining margins are largely driven by differences in commodity prices and are a function of the difference between what a refinery pays for its raw materials (primarily crude oil) and market prices for the range of products produced (primarily gasoline, heating oil, diesel oil, jet fuel and fuel oil). Crude oil and many products are widely traded with published prices, including those quoted on the New York Mercantile Exchange. Prices for these commodities are determined by global and regional marketplaces and are influenced by many factors, including supply/demand balances, inventory levels, industry refinery operations, import / export balances, currency fluctuations, seasonal demand, weather and political climate.
While demand remained strong in 2016, margins weakened as surplus distillate and gasoline production capacity created higher inventory. North American refineries have benefitted from cost-competitive feedstock and energy supplies, but that benefit decreased in 2016.
Imperial’s long-term outlook is that the North American refining industry will remain subject to intense competition. Additionally, as described in more detail in Item 1A. Risk Factors, proposed carbon policy and other climate-related regulations, as well as the continued growth in biofuels mandates, could have negative impacts on the downstream business. Imperial’s integration across the value chain, from refining to marketing, enhances overall value in both fuels and lubricants businesses.
The company supplies petroleum products to the motoring public through Esso-branded retail sites and independent marketers. In 2016, the company completed the sale of its remaining company-owned Esso-branded retail sites completing the conversion to a branded wholesaler operating model. On average during the year, there were more than 1,700 retail sites, which by the end of 2016 were all operating under a branded wholesaler model whereby Imperial supplies fuel to independent third parties who own and operate retail sites in alignment with Esso brand standards.
36
Table of Contents
Chemical
In North America, unconventional natural gas continued to provide advantaged ethane feedstock for steam crackers and a favourable margin environment for integrated chemical producers. The company’s strategy for its Chemical business is to reduce costs and maximize value by continuing the integration of its chemical plant in Sarnia with the refinery. The company also benefits from its integration within ExxonMobil’s North American chemical businesses, enabling Imperial to maintain a leadership position in its key market segments.
Consolidated
| millions of Canadian dollars | 2016 | 2015 | 2014 | |||||||||
|
|
||||||||||||
| Net income (loss) |
2,165 | 1,122 | 3,785 | |||||||||
|
|
||||||||||||
2016
Net income in 2016 was $2,165 million, or $2.55 per-share on a diluted basis, including a gain of $1.7 billion ($2.01 per-share) from the sale of retail sites, versus net income of $1,122 million or $1.32 per-share in 2015. Downstream net income was $2,754 million, up from $1,586 million in 2015. Chemical net income was $187 million. Upstream recorded a net loss of $661 million in 2016, compared to a net loss of $704 million in 2015.
2015
Net income in 2015 was $1,122 million, or $1.32 per share on a diluted basis, versus $3,785 million or $4.45 per share in 2014. Upstream recorded a net loss of $704 million, compared to a net income of $2,059 million in 2014. Downstream earnings decreased by $8 million and Chemical earnings increased by $58 million.
Upstream
| millions of Canadian dollars | 2016 | 2015 | 2014 | |||||||||
|
|
||||||||||||
| Net income (loss) |
(661) | (704) | 2,059 | |||||||||
|
|
||||||||||||
2016
Upstream recorded a net loss of $661 million in 2016, compared to a net loss of $704 million in 2015. The loss in 2016 reflected lower realizations of about $700 million, the impact of the northern Alberta wildfires of about $155 million and higher depreciation expense of about $120 million. These factors were partially offset by higher volumes of about $320 million, the impact of a weaker Canadian dollar of about $130 million, the favorable impact of lower royalties of about $80 million, lower field operating costs of about $80 million and lower energy cost of about $50 million. The loss in 2015 reflected the impact associated with the Alberta corporate income tax rate increase of $327 million.
2015
Upstream recorded a net loss of $704 million in 2015, compared to net income of $2,059 million in the same period of 2014. Earnings in 2015 reflected lower crude oil and gas realizations of about $3,790 million, a net charge of $327 million associated with increased Alberta corporate income taxes, higher depreciation expense of about $180 million, lower liquids and gas volumes of about $80 million reflecting the impact of divested properties in the prior year and a net charge of about $60 million associated with the inventory carrying value. These factors were partially offset by the impact of a weaker Canadian dollar of about $770 million, the favourable impact of lower royalties of about $700 million, higher volumes from Kearl and Cold Lake of about $670 million and lower energy costs of about $140 million.
37
Table of Contents
Average realizations
| Canadian dollars | 2016 | 2015 | 2014 | |||||||||
|
|
||||||||||||
| Bitumen realizations (per barrel) |
26.52 | 32.48 | 67.20 | |||||||||
| Synthetic oil realizations (per barrel) |
57.12 | 61.33 | 99.58 | |||||||||
| Conventional crude oil realizations (per barrel) |
32.93 | 36.58 | 76.03 | |||||||||
| Natural gas liquids realizations (per barrel) |
15.58 | 14.70 | 49.11 | |||||||||
| Natural gas realizations (per thousand cubic feet) |
2.41 | 2.78 | 4.54 | |||||||||
|
|
||||||||||||
2016
West Texas Intermediate averaged US$43.44 per barrel in 2016, down from US$48.83 per barrel in 2015. Western Canada Select averaged US$29.49 per barrel and US$35.34 per barrel respectively for the same periods. The WTI / WCS differential widened to 32 percent in 2016, up from 28 percent in 2015. The Canadian dollar averaged US$0.75 in 2016, a decrease of US$0.03 from 2015.
Imperial’s average Canadian dollar realizations for bitumen and synthetic crudes declined essentially in line with the North American benchmarks, adjusted for changes in the exchange rate and transportation costs. Bitumen realizations averaged $26.52 for 2016, a decrease of $5.96 per barrel from 2015. Synthetic crude realizations averaged $57.12 per barrel, a decrease of $4.21 per barrel from 2015.
2015
The average price for WTI, the main benchmark crude for North America, decreased by 47 percent compared to the same period in 2014. The company’s average Canadian dollar realizations for synthetic crude oil and bitumen decreased about 38 and 52 percent in 2015 to $61.33 and $32.48 per barrel respectively, as the decline in benchmark crude and increased light-heavy differentials were partially offset by the weaker Canadian dollar. The company’s average realizations on sales of natural gas of $2.78 per thousand cubic feet in 2015 were lower by $1.76 per thousand cubic feet, versus 2014.
Crude oil and NGLs - production and sales (a)
| thousands of barrels per day | 2016 | 2015 | 2014 | |||||||||||||||||||||
|
|
||||||||||||||||||||||||
| gross | net | gross | net | gross | net | |||||||||||||||||||
|
|
||||||||||||||||||||||||
| Bitumen |
281 | 256 | 266 | 245 | 197 | 161 | ||||||||||||||||||
| Synthetic oil (b) |
68 | 67 | 62 | 58 | 64 | 60 | ||||||||||||||||||
| Conventional crude oil |
14 | 12 | 15 | 14 | 18 | 14 | ||||||||||||||||||
|
|
||||||||||||||||||||||||
| Total crude oil production |
363 | 335 | 343 | 317 | 279 | 235 | ||||||||||||||||||
| NGLs available for sale |
1 | 1 | 1 | 1 | 3 | 2 | ||||||||||||||||||
|
|
||||||||||||||||||||||||
| Total crude oil and NGL production |
364 | 336 | 344 | 318 | 282 | 237 | ||||||||||||||||||
| Bitumen sales, including diluent (c) |
374 | 349 | 259 | |||||||||||||||||||||
| NGL sales |
5 | 5 | 8 | |||||||||||||||||||||
|
|
||||||||||||||||||||||||
| Natural gas - production and production available for sale (d)
|
|
|||||||||||||||||||||||
| millions of cubic feet per day | 2016 | 2015 | 2014 | |||||||||||||||||||||
|
|
||||||||||||||||||||||||
| gross | net | gross | net | gross | net | |||||||||||||||||||
|
|
||||||||||||||||||||||||
| Production (e) (f) |
129 | 122 | 130 | 125 | 168 | 156 | ||||||||||||||||||
| Production available for sale (g) |
87 | 94 | 124 | |||||||||||||||||||||
|
|
||||||||||||||||||||||||
| (a) | Barrels per day metric is calculated by dividing the volume for the period by the number of calendar days in the period. Gross production is the company’s share of production (excluding purchases) before deduction of the mineral owners’ or governments’ share or both. Net production excludes those shares. |
| (b) | The company’s synthetic oil production volumes were from the company’s share of production volumes in the Syncrude joint venture. |
| (c) | Diluent is natural gas condensate or other light hydrocarbons added to crude bitumen to facilitate transportation to market by pipeline and rail. |
| (d) | Cubic feet per day metric is calculated by dividing the volume for the period by the number of calendar days in the period. |
| (e) | Gross production of natural gas includes amounts used for internal consumption with the exception of the amounts re-injected. |
| (f) | Net production is gross production less the mineral owners’ or governments’ share or both. Net production reported in the above table is consistent with production quantities in the net proved reserves disclosure. |
| (g) | Includes sales of the company’s share of net production and excludes amounts used for internal consumption. |
38
Table of Contents
2016
Gross production of Cold Lake bitumen averaged 161,000 barrels per day in 2016, up from 158,000 barrels per day in 2015.
Gross production of Kearl bitumen averaged 169,000 barrels per day in 2016 (120,000 barrels Imperial’s share) compared to 152,000 barrels per day (108,000 barrels Imperial’s share) in 2015. The increase was the result of start-up of the expansion project.
During 2016, the company’s share of gross production from Syncrude averaged 68,000 barrels per day, up from 62,000 barrels per day in 2015. Increased production reflects continued efforts to improve the reliability of operations, which more than offset the impact of the Alberta wildfires.
2015
Gross production of Cold Lake bitumen averaged 158,000 barrels per day in 2015, up from 146,000 barrels from the same period last year, with new production from Nabiye offsetting cycle timing of the base operations.
Gross production of Kearl bitumen averaged 152,000 barrels per day during 2015 (108,000 barrels Imperial’s share) up from 72,000 barrels per day (51,000 barrels Imperial’s share) in 2014, reflecting early start-up of the Kearl expansion project and improved reliability of the initial development.
During 2015, the company’s share of gross production from Syncrude averaged 62,000 barrels per day, compared to 64,000 barrels in 2014.
Gross production of conventional crude oil averaged 15,000 barrels per day during 2015, compared to 18,000 barrels in 2014. The lower production volume was primarily due to the impact of properties divested during the first half of 2014.
Gross production of natural gas during 2015 was 130 million cubic feet per day, down from 168 million cubic feet in the same period last year, reflecting the impact of divested properties and natural reservoir decline.
Downstream
| millions of Canadian dollars | 2016 | 2015 | 2014 | |||||||||
|
|
||||||||||||
| Net income (loss) |
2,754 | 1,586 | 1,594 | |||||||||
|
|
||||||||||||
2016
Downstream net income was $2,754 million, up from $1,586 million in 2015. Earnings increased mainly due to a gain of $1,841 million from the sale of retail sites and the general aviation business, the impact of a weaker Canadian dollar of about $130 million, higher marketing sales volumes of $50 million, partially offset by lower downstream margins of about $910 million.
2015
Downstream net income was $1,586 million, compared to $1,594 million in the same period of 2014. Earnings decreased due to the impact of lower refinery margins of about $590 million and higher operating costs of about $70 million mainly associated with the Edmonton rail terminal. These factors were partially offset by the favourable impact of a weaker Canadian dollar of about $390 million, higher fuels marketing margins and volumes of about $170 million, lower energy costs of about $80 million and a 2015 gain of $17 million from the sale of assets.
39
Table of Contents
Refinery utilization
| thousands of barrels per day (a) | 2016 | 2015 | 2014 | |||||||||
|
|
||||||||||||
| Total refinery throughput (b) |
362 | 386 | 394 | |||||||||
| Refinery capacity at December 31 |
423 | 421 | 421 | |||||||||
| Utilization of total refinery capacity (percent) |
86 | 92 | 94 | |||||||||
|
|
||||||||||||
Sales
| thousands of barrels per day (a) | 2016 | 2015 | 2014 | |||||||||
|
|
||||||||||||
| Gasolines |
261 | 247 | 244 | |||||||||
| Heating, diesel and jet fuels |
170 | 170 | 179 | |||||||||
| Heavy fuel oils |
16 | 16 | 22 | |||||||||
| Lube oils and other products |
37 | 45 | 40 | |||||||||
|
|
||||||||||||
| Net petroleum product sales |
484 | 478 | 485 | |||||||||
|
|
||||||||||||
| (a) | Volumes per day are calculated by dividing total volumes for the year by the number of calendar days in the year. |
| (b) | Crude oil and feedstocks sent directly to atmospheric distillation units. |
2016
Refinery throughput averaged 362,000 barrels per day in 2016, compared to 386,000 barrels per day in 2015. Capacity utilization decreased to 86 percent from 92 percent in 2015, reflecting the more significant scope of turnaround maintenance activity in the current year. Petroleum product sales were 484,000 barrels per day in 2016, up from 478,000 barrels per day in 2015. Sales growth was driven by the company’s focus on establishing long-term supply agreements.
2015
Total refinery throughput was 386,000 barrels per day. Refinery throughput was 92 percent of capacity in 2015, 2 percent lower than the previous year. The lower rate was primarily a result of planned maintenance. Total net petroleum sales decreased to 478,000 barrels per day, compared with 485,000 barrels in 2014.
Chemical
| millions of Canadian dollars | 2016 | 2015 | 2014 | |||||||||
|
|
||||||||||||
| Net income (loss) |
187 | 287 | 229 | |||||||||
|
|
||||||||||||
Sales
| thousands of tonnes | 2016 | 2015 | 2014 | |||||||||
|
|
||||||||||||
| Polymers and basic chemicals |
697 | 735 | 741 | |||||||||
| Intermediate and others |
211 | 210 | 212 | |||||||||
|
|
||||||||||||
| Total petrochemical sales |
908 | 945 | 953 | |||||||||
|
|
||||||||||||
2016
Chemical net income was $187 million, compared to $287 million in the same period of 2015, mainly due to weaker margins across all major product lines and lower volumes.
2015
Chemical net income was a record $287 million in 2015, an increase of $58 million over the same period in 2014, primarily due to the impact of a weaker Canadian dollar, lower feedstock costs and higher sales of polyethylene.
40
Table of Contents
Corporate and Other
| millions of Canadian dollars | 2016 | 2015 | 2014 | |||||||||
|
|
||||||||||||
| Net income (loss) |
(115 | ) | (47 | ) | (97) | |||||||
|
|
||||||||||||
2016
In 2016, net income effects from Corporate and Other were negative $115 million, versus negative $47 million in 2015, primarily due to higher share-based compensation charges, the absence of the impact from the Alberta tax rate increase in 2015 and lower capitalized interest.
2015
In 2015, net income effects from Corporate and Other were negative $47 million, compared to negative $97 million in 2014, primarily due to lower share-based compensation charges and the impact of the Alberta corporate income tax rate increase.
Liquidity and capital resources
Sources and uses of cash
| millions of Canadian dollars | 2016 | 2015 | 2014 | |||||||||
|
|
||||||||||||
| Cash provided by (used in) |
||||||||||||
| Operating activities |
2,015 | 2,167 | 4,405 | |||||||||
| Investing activities |
1,947 | (2,884 | ) | (4,562) | ||||||||
| Financing activities |
(3,774 | ) | 705 | 100 | ||||||||
|
|
||||||||||||
| Increase (decrease) in cash and cash equivalents |
188 | (12 | ) | (57) | ||||||||
|
|
||||||||||||
| Cash and cash equivalents at end of year |
391 | 203 | 215 | |||||||||
|
|
||||||||||||
The company issues long-term debt from time to time and maintains a commercial paper program. However internally generated funds cover the majority of its financial requirements. Cash that may be temporarily surplus to the company’s immediate needs is carefully managed through counterparty quality and investment guidelines to ensure that it is secure and readily available to meet the company’s cash requirements and to optimize returns.
Cash flows from operating activities are highly dependent on crude oil and natural gas prices, as well as petroleum and chemical product margins. In addition, to provide for cash flow in future periods, the company needs to continually find and develop new resources, and continue to develop and apply new technologies to existing fields in order to maintain or increase production.
The company’s financial strength enables it to make large, long-term capital expenditures. Imperial’s portfolio of development opportunities and the complementary nature of its business segments help mitigate the overall risks for the company and its cash flows. Further, due to its financial strength, debt capacity and portfolio of opportunities, the risk associated with delay of any single project would not have a significant impact on the company’s liquidity or ability to generate sufficient cash flows for its operations and fixed commitments.
Funding of registered retirement plans complies with federal and provincial pension regulations, and the company makes contributions to the plans based on an independent actuarial valuation completed at least once every three years, or more, depending on funding status. The most recent valuation of the company’s registered retirement plans was completed as at December 31, 2013. As a result of the valuation, the company contributed $163 million to the registered retirement plans in 2016. Future funding requirements are not expected to affect the company’s existing capital investment plans or its ability to pursue new investment opportunities.
41
Table of Contents
Cash flow from operating activities
2016
Cash flow generated from operating activities was $2,015 million in 2016, compared with $2,167 million in 2015, reflecting lower earnings, excluding the gain on retail sites and the general aviation business.
2015
Cash flow generated from operating activities was $2,167 million, compared with $4,405 million in 2014. Lower cash flow was due to lower earnings.
Cash flow from investing activities
2016
Investing activities generated net cash of $1,947 million in 2016, compared with cash used in investing activities of $2,884 million in 2015, reflecting proceeds from asset sales and the completion of major upstream growth projects.
2015
Cash used in investing activities of $2,884 million, compared with $4,562 million in 2014, mainly reflecting the decline in additions to property, plant and equipment.
Cash flow from financing activities
2016
Cash used in financing activities was $3,774 million in 2016, compared with cash provided by financing activities of $705 million in 2015. Cash from operating activities and proceeds from the asset sales were used to reduce outstanding debt.
At the end of 2016, total debt outstanding was $5,234 million, compared with $8,516 million at the end of 2015.
The company repaid debt of $1,505 million from existing long-term loan facilities and $1,749 million from short-term loan facilities.
In October 2016, the company decreased the amount of its unused committed long-term line of credit from $500 million to $250 million and extended the maturity date to November 2018.
In December 2016, the company decreased the amount of its unused committed short-term line of credit from $500 million to $250 million and extended the maturity date to December 2017.
During 2016, the company did not make any share repurchases except those to offset the dilutive effects from the exercise of share-based awards. The company will continue to evaluate its share repurchase program in the context of its operating performance and overall capital project activities.
Dividends paid in 2016 were $492 million. The per-share dividend paid was $0.58, up from $0.53 in 2015.
2015
Cash provided by financing activities was $705 million, compared with $100 million in 2014.
The company drew on existing loan facilities of $1,206 million.
At the end of 2015, total debt outstanding was $8,516 million, compared with $6,891 million at the end of 2014.
In March 2015, the company extended the maturity date of its existing $500 million 364-day short-term unsecured committed bank credit facility to March 2016. The company did not draw on the facility.
In July 2015, the company increased the capacity of its existing floating rate loan facility with an affiliated company of ExxonMobil from $6.25 billion to $7.75 billion. All terms and conditions of the agreement remained unchanged.
42
Table of Contents
In August 2015, the company extended the maturity date of its existing $500 million long-term bank credit facility to August 2017. The company did not draw on the facility.
Cash dividends of $449 million were paid in 2015 compared with $441 million in 2014. Per-share dividends paid in 2015 totalled $0.53, up from $0.52 in 2014.
Subsequent to December 31, 2015 and up to February 10, 2016, the company increased its total debt by $328 million by drawing on an existing facility. The increased debt was used to supplement normal operations and capital projects.
Financial percentages and ratios
| 2016 | 2015 | 2014 | ||||||||||
|
|
||||||||||||
| Total debt as a percentage of capital (a) |
17 | 27 | 23 | |||||||||
| Interest coverage ratio – earnings basis (b) |
21 | 20 | 61 | |||||||||
|
|
||||||||||||
| (a) | Current and long-term debt (page 55) and the company’s share of equity company debt, divided by debt and shareholders’ equity (page 55). |
| (b) | Net income (page 53), debt-related interest before capitalization, including the company’s share of equity company interest, and income taxes (page 53), divided by debt-related interest before capitalization, including the company’s share of equity company interest. |
Debt represented 17 percent of the company’s capital structure at the end of 2016.
Debt-related interest incurred in 2016, before capitalization of interest, was $121 million, compared with $102 million in 2015. The average effective interest rate on the company’s debt was 1.5 percent in 2016, compared with 1.3 percent in 2015.
The company’s financial strength, as evidenced by the above financial ratios, represents a competitive advantage of strategic importance. The company’s sound financial position gives it the opportunity to access capital markets in the full range of market conditions and enables the company to take on large, long-term capital commitments in the pursuit of maximizing shareholder value.
The company does not currently make use of any derivative instruments to offset exposures associated with hydrocarbon prices, currency exchange rates and interest rates that arise from existing assets, liabilities and forecasted transactions. The company does not engage in speculative derivative activities nor does it use derivatives with leveraged features.
Commitments
The following table shows the company’s commitments outstanding at December 31, 2016. It combines data from the consolidated balance sheet and from individual notes to the consolidated financial statements, where appropriate.
| Payment due by period | ||||||||||||||||||||||||
| millions of Canadian dollars | Note reference |
2017 | 2018 to 2019 |
2020 to 2021 |
2022 and beyond |
Total | ||||||||||||||||||
|
|
||||||||||||||||||||||||
| Long-term debt (a) |
14 | - | 54 | 4,478 | 500 | 5,032 | ||||||||||||||||||
| - Due in one year |
27 | 27 | ||||||||||||||||||||||
| Operating leases (b) |
13 | 139 | 129 | 4 | 3 | 275 | ||||||||||||||||||
| Firm capital commitments (c) |
48 | 31 | 71 | - | 150 | |||||||||||||||||||
| Pension and other post-retirement obligations (d) |
4 | 277 | 125 | 131 | 1,170 | 1,703 | ||||||||||||||||||
| Asset retirement obligations (e) |
5 | 55 | 218 | 184 | 1,015 | 1,472 | ||||||||||||||||||
| Other long-term purchase agreements (f) |
844 | 1,467 | 1,233 | 4,716 | 8,260 | |||||||||||||||||||
|
|
||||||||||||||||||||||||
| (a) | Long-term debt includes a long-term loan from an affiliated company of ExxonMobil of $4,447 million and capital lease obligations of $612 million, $27 million of which is due in one year. The payment by period for the related party long-term loan is estimated based on the right of the related party to cancel the loan on at least 370 days advance written notice. |
| (b) | Minimum commitments for operating leases, shown on an undiscounted basis, covers primarily storage tanks, rail cars and marine vessels. |
| (c) | Firm capital commitments represent legally-binding payment obligations to third parties where agreements specifying all significant terms have been executed for the construction and purchase of fixed assets and other permanent investments. In certain cases where the company executes contracts requiring commitments to a work scope, those commitments have been included to the extent that the amounts and timing of payments can be reliably estimated. Firm capital commitments related to capital projects, shown on an undiscounted basis. |
| (d) | The amount by which the benefit obligations exceeded the fair value of fund assets for pension and other post-retirement plans at year-end. The payments by period include expected contributions to funded pension plans in 2017 and estimated benefit payments for unfunded plans in all years. |
43
Table of Contents
| (e) | Asset retirement obligations represent the fair value of legal obligations associated with site restoration on the retirement of assets with determinable useful lives. |
| (f) | Other long-term purchase agreements are non-cancelable, or cancelable only under certain conditions and long-term commitments other than unconditional purchase obligations. They include primarily raw material supply and transportation services agreements. The lower 2016 balance reflects a reduction of transportation service agreements totalling $2.7 billion. In addition, about $636 million of unconditional purchase obligation that existed at year-end 2015 no longer met the conditions for classification as unconditional purchase obligations and are now reported as other long-term purchase agreements. |
Unrecognized tax benefits totaling $106 million have not been included in the company’s commitments table because the company does not expect there will be any cash impact from the final settlements as sufficient funds have been deposited with the Canada Revenue Agency. Further details on the unrecognized tax benefits can be found in note 3 to the financial statements on page 65.
Litigation and other contingencies
As discussed in note 9 to the consolidated financial statements on page 74, a variety of claims have been made against Imperial and its subsidiaries. Based on a consideration of all relevant facts and circumstances, the company does not believe the ultimate outcome of any currently pending lawsuits against the company will have a material adverse effect on the company’s operations, financial condition, or financial statements taken as a whole.
Additionally, as discussed in note 9, Imperial was contingently liable at December 31, 2016, for guarantees relating to performance under contracts of other third-party obligations. These guarantees do not have a material effect on the company’s operations, financial condition, or financial statements taken as a whole.
There are no events or uncertainties beyond those already included in reported financial information that would indicate a material change in future operating results or financial condition.
Capital and exploration expenditures
| millions of Canadian dollars | 2016 | 2015 | ||||||
|
|
||||||||
| Upstream (a) |
896 | 3,135 | ||||||
| Downstream |
190 | 340 | ||||||
| Chemical |
26 | 52 | ||||||
| Other |
49 | 68 | ||||||
|
|
||||||||
| Total |
1,161 | 3,595 | ||||||
|
|
||||||||
| (a) | Exploration expenses included. |
Total capital and exploration expenditures were $1,161 million in 2016, a decrease of $2,434 million from 2015.
For the Upstream segment, capital expenditures were $896 million, compared with $3,135 million in 2015. Investments were primarily in support of completion of upstream projects.
Planned capital and exploration expenditures in the Upstream segment are forecast at about $600 million for 2017. Investments are mainly planned for sustaining activity.
For the Downstream segment, capital expenditures were $190 million in 2016, compared with $340 million in 2015. In 2016, investments were primarily in support of downstream sustaining activity.
Planned capital expenditures for the Downstream segment in 2017 are $350 million and focus on improving the reliability and efficiency of Imperial’s operations, as well as enhancing the company’s environmental and safety performance.
Total capital and exploration expenditures for the company in 2017 are expected to be about $1 billion. Actual spending could vary depending on the progress of individual projects.
Market risks and other uncertainties
Crude oil, natural gas, petroleum product and chemical prices have fluctuated in response to changing market forces. The impacts of these price fluctuations on earnings from Upstream, Downstream and Chemical operations have varied. Industry crude oil and natural gas commodity prices and petroleum and chemical
44
Table of Contents
product prices are commonly benchmarked in U.S. dollars. The majority of Imperial’s sales and purchases are related to these industry U.S. dollar benchmarks. As the company records and reports its financial results in Canadian dollars, to the extent that the Canadian / U.S. dollar exchange rate fluctuates, the company’s earnings will be affected. The company’s potential exposure to commodity price and margin, and Canadian / U.S. dollar exchange rate fluctuations is summarized in the earnings sensitivities table below, which shows the estimated annual effect, under current conditions, on the company’s after-tax net income.
In the competitive downstream and chemical environments, earnings are primarily determined by margin capture rather than absolute price levels on products sold. Refining margins are a function of the difference between what a refiner pays for its raw materials (primarily crude oil) and the market prices for the range of products produced. These prices in turn depend on global and regional supply / demand balances, inventory levels, refinery operations, import / export balances and weather.
Imperial is exposed to changes in interest rates, primarily on its debt which carries floating interest rates. The impact of a quarter percent change in interest rates affecting Imperial’s debt would not be material to earnings, cash flow or fair value. Imperial has access to significant capacity of long-term and short-term liquidity. Internally generated funds are expected to cover the majority of financial requirements, supplemented by long-term and short-term debt as needed.
At this time Imperial is a net consumer of natural gas. It is used in Imperial’s Upstream operations and refineries. A decrease in the value of natural gas reduces Imperial’s operating expenses, thereby increasing Imperial’s earnings.
Earnings sensitivities (a)
| millions of Canadian dollars, after tax | ||||||
|
|
||||||
| One dollar (U.S.) per barrel change in crude oil prices (b) |
+ (-) | 100 | ||||
| Ten cents per thousand cubic feet decrease (increase) in natural gas prices |
+ (-) | 5 | ||||
| One dollar (U.S.) per barrel change in refining 2-1-1 margins (c) |
+ (-) | 140 | ||||
| One cent (U.S.) per pound change in sales margins for polyethylene |
+ (-) | 8 | ||||
| One cent decrease (increase) in the value of the Canadian dollar versus the U.S. dollar |
+ (-) | 85 | ||||
|
|
||||||
| (a) | Each sensitivity calculation shows the impact on net income resulting from a change in one factor, after tax and royalties and holding all other factors constant. These sensitivities have been updated to reflect current conditions. They may not apply proportionately to larger fluctuations. |
| (b) | Impact on Upstream earnings only, after tax and royalties. |
| (c) | The 2-1-1 crack spread is an indicator of the refining margin generated by converting two barrels of crude oil into one barrel of gasoline and one barrel of diesel. |
The sensitivity of net income to changes in the Canadian dollar versus the U.S. dollar increased from 2015 year-end by about $10 million (after tax) a year for each one-cent change. The increase was primarily the result of higher production volumes.
The global energy markets can give rise to extended periods in which market conditions are adverse to one or more of the company’s businesses. Such conditions, along with the capital-intensive nature of the industry and very long lead times associated with many of the company’s projects, underscore the importance of maintaining a strong financial position. Management views the company’s financial strength as a competitive advantage.
In general, segment results are not dependent on the ability to sell and / or purchase products to / from other segments. Instead, where such sales take place, they are the result of efficiencies and competitive advantages of integrated refinery / chemical complexes. Additionally, intersegment sales are at market-based prices. The products bought and sold between segments can also be acquired in worldwide markets that have substantial liquidity, capacity and transportation capabilities. About 65 percent of the company’s intersegment sales are crude oil produced by the Upstream and sold to the Downstream. Other intersegment sales include those between refineries and the chemical plant related to raw materials, feedstocks and finished products.
The company has an active asset management program in which underperforming assets are either improved to acceptable levels or considered for divestment. The asset management program includes a disciplined, regular review to ensure that all assets are contributing to the company’s strategic objectives. The result is an efficient capital base, and the company has seldom had to write-down the carrying value of assets, even during periods of low commodity prices.
45
Table of Contents
Industry bitumen production may be subject to limits on transportation capacity to markets. A significant portion of the company’s upstream production is bitumen. To mitigate uncertainty associated with the timing of industry pipeline projects and pipeline capacity constraints, the company has developed rail infrastructure.
The demand for crude oil, natural gas, petroleum products and petrochemical products correlates closely with general economic growth rates. The occurrence of recessions or other periods of low or negative economic growth will typically have a direct adverse impact on the company’s financial results. In challenging economic times, the company follows the proven approach to continue to focus on the business elements within its control and take a long-term view. Technology improvements have played and will continue to play an important role in the economics and the environmental performance of current operations and future developments.
Risk management
The company’s size, strong capital structure and the complementary nature of the Upstream, Downstream and Chemical businesses reduce the company’s enterprise-wide risk from changes in commodity prices and currency rates. The company’s financial strength and debt capacity give it the opportunity to advance business plans in the pursuit of maximizing shareholder value in the full range of market conditions. As a result, the company does not currently make use of derivative instruments to mitigate the impact of such changes. The company does not engage in speculative derivative activities or derivative trading activities nor does it use derivatives with leveraged features. Although the company does not engage in speculative derivative activities or derivative trading activities, it maintains a system of controls that includes a policy covering the authorization, reporting and monitoring of derivative activity.
The company’s financial statements have been prepared in accordance with United States Generally Accepted Accounting Principles (GAAP). GAAP requires management to make estimates and judgments that affect the reported amounts of assets, liabilities, revenues and expenses and the disclosure of contingent assets and liabilities. The company’s accounting and financial reporting fairly reflect its straightforward business model. Imperial does not use financing structures for the purpose of altering accounting outcomes or removing debt from the balance sheet. The company’s significant accounting policies are summarized in note 1 to the consolidated financial statements on page 58.
Oil and gas reserves
Evaluations of oil and natural gas reserves are important to the effective management of upstream assets. They are an integral part of investment decisions about oil and gas properties such as whether development should proceed.
The estimation of proved reserves, which is based on the requirement of reasonable certainty, is an ongoing process based on rigorous technical evaluations, commercial and market assessments and detailed analysis of well information such as flow rates and reservoir pressure declines. The estimation of proved reserves is controlled by the company through long-standing approval guidelines. Reserve changes are made within a well-established, disciplined process driven by senior level geoscience and engineering professionals, assisted by the reserves management group which has significant technical experience, culminating in reviews with and approval by senior management and the company’s board of directors. Notably, the company does not use specific quantitative reserve targets to determine compensation. Key features of the reserve estimation process are covered in “Disclosure of reserves” in Item 1.
Oil and natural gas reserves include both proved and unproved reserves.
| ● | Proved oil and natural gas reserves are determined in accordance with Securities and Exchange Commission requirements. Proved reserves are those quantities of oil and natural gas which, by analysis of geoscience and engineering data, can be estimated with reasonable certainty to be economically producible under existing economic and operating conditions and government regulations. Proved reserves are determined using the average of first-of-month oil and natural gas prices during the reporting year. |
46
Table of Contents
Proved reserves can be further subdivided into developed and undeveloped reserves. Proved developed reserves include amounts which are expected to be recovered through existing wells with existing equipment and operating methods. Proved undeveloped reserves include amounts expected to be recovered from new wells on undrilled proved acreage or from existing wells where a relatively major expenditure is required for completion. Proved undeveloped reserves are recognized only if a development plan has been adopted indicating that the reserves are scheduled to be drilled within five years, unless specific circumstances support a longer period of time.
The percentage of proved developed reserves was 77 percent of total proved reserves at year-end 2016, a reduction from 88 percent in 2015. Although the company is reasonably certain that proved reserves will be produced, the timing and amount recovered can be affected by a number of factors including completion of development projects, reservoir performance, regulatory approvals and significant changes in long-term oil and natural gas prices.
| ● | Unproved reserves are quantities of oil and natural gas with less than reasonable certainty of recoverability and include probable reserves. Probable reserves are reserves that, together with proved reserves, are as likely as not to be recovered. |
Revisions can include upward or downward changes in previously estimated volumes of proved reserves for existing fields due to the evaluation or re-evaluation of already available geologic, reservoir or production data; new geologic, reservoir or production data; or changes in the average of first-of-the-month prices and year-end costs that are used in the estimation of reserves. Revisions can also result from significant changes in either development strategy or production equipment / facility capacity.
As a result of low prices during 2016, under the U.S. Securities and Exchange Commission definition of proved reserves, certain quantities of bitumen that qualified as proved reserves in prior years did not qualify as proved reserves at year-end 2016. Amounts no longer qualifying as proved reserves include the entire 2.5 billion barrels of bitumen at Kearl and approximately 0.2 billion barrels of bitumen at Cold Lake. Among the factors that would result in these amounts being recognized again as proved reserves at some point in the future are a recovery in average price levels, a further decline in costs, and / or operating efficiencies. Under the terms of certain contractual arrangements or government royalty regimes, lower prices can also increase proved reserves attributable to Imperial. The company does not expect the downward revision of reported proved reserves under the U.S. Securities and Exchange Commission definitions to affect the operation of the underlying projects or to alter its outlook for future production volumes.
Unit-of-production depreciation
The calculation of unit-of-production depreciation is a critical accounting estimate that measures the depreciation of upstream assets. Oil and natural gas reserve quantities are used as the basis to calculate unit-of-production depreciation rates for most upstream assets. Depreciation is calculated by taking the ratio of asset cost to total proved reserves or proved developed reserves applied to the actual cost of production. The volumes produced and asset cost are known, while proved reserves are based on estimates that are subject to some variability.
In the event that the unit-of-production method does not result in an equitable allocation of cost over the economic life of an upstream asset, an alternative method is used. The straight-line method is used in limited situations where the expected life of the asset does not reasonably correlate with that of the underlying reserves. For example, certain assets used in the production of oil and natural gas have a shorter life than the reserves, and as such, the company uses straight-line depreciation to ensure the asset is fully depreciated by the end of its useful life.
To the extent that proved reserves for a property are entirely de-booked and that property continues to produce, assets will be depreciated using a unit-of-production method based on reserves determined at the most recent SEC price which results in a quantity of proved reserves greater than zero, appropriately adjusted for production and technical changes. The effect of this approach on the company’s 2017 depreciation expense versus 2016 is anticipated to be immaterial.
Impact of oil and gas reserves and prices and margins on testing for impairment
The company tests assets or groups of assets for recoverability whenever events or circumstances indicate that the carrying amounts may not be recoverable.
47
Table of Contents
Among the events or changes in circumstances which could indicate that the carrying value of an asset or asset group may not be recoverable are the following:
| ● | A significant decrease in the market price of a long-lived asset; |
| ● | A significant adverse change in the extent or manner in which an asset is being used or in its physical condition including a significant decrease in the company’s current and projected reserve volumes; |
| ● | A significant adverse change in legal factors or in the business climate that could affect the value, including a significant adverse action or assessment by a regulator; |
| ● | An accumulation of project costs significantly in excess of the amount originally expected; |
| ● | A current-period operating loss combined with a history and forecast of operating or cash flow losses; and |
| ● | A current expectation that, more likely than not, a long-lived asset will be sold or otherwise disposed of significantly before the end of its previously estimated useful life. |
The company performs asset valuation analyses on an ongoing basis as a part of its asset management program. These analyses and other profitability reviews assist the company in assessing whether the carrying amounts of any of its assets may not be recoverable.
In general, Imperial does not view temporarily low prices or margins as an indication of impairment. Management does not believe that lower prices are sustainable if energy is to be delivered with supply security to meet global demand over the long term. Although prices will occasionally drop significantly, industry prices over the long term will continue to be driven by market supply and demand. On the supply side, industry production from mature fields is declining, but this is being offset by production from new discoveries and field developments. OPEC production policies also have an impact on world oil supplies. The demand side is largely a function of global economic growth. Because the lifespans of the company’s major assets are measured in decades, the value of these assets is predominantly based on long-term views of future commodity prices and production costs. During the lifespan of these major assets, the company expects that oil and gas prices will experience significant volatility, and consequently these assets will experience periods of higher earnings and periods of lower earnings, or even losses. In assessing whether the events or changes in circumstances indicate the carrying value of an asset may not be recoverable, the company considers recent periods of operating losses in the context of its longer-term view of prices. While near-term prices are subject to wide fluctuations, longer term price views are more stable and meaningful for purposes of assessing future cash flows.
When the industry experiences a prolonged and deep reduction in commodity prices, the market supply and demand conditions may result in changes to the company’s long-term price or margin assumptions it uses for its capital investment decisions. To the extent those changes result in a significant reduction in the mid-point of its long-term oil and natural gas price or margin ranges, the company may consider that situation, in conjunction with other events and changes in circumstances such as a history of operating losses, as an indicator of potential impairment for certain assets.
In the upstream, the standardized measure of discounted cash flows included in the “Supplemental information on oil and gas exploration and production activities” is required to use prices based on the average of first-of-month prices. These prices represent discrete points in time and could be higher or lower than the company’s long-term price assumptions which are used for impairment assessments. The company believes the standardized measure does not provide a reliable estimate of the expected future cash flows to be obtained from the development and production of its oil and gas properties or of the value of its oil and gas reserves and therefore does not consider it relevant in determining whether events or changes in circumstances indicate the need for an impairment assessment.
If events or circumstances indicate that the carrying value may not be recoverable, the company estimates the future undiscounted cash flows of the affected properties to judge the recoverability of carrying amounts. In performing this assessment, assets are grouped at the lowest level for which there are identifiable cash flows that are largely independent of the cash flows of other groups of assets. Cash flows used in recoverability assessments are based on the company’s assumptions which are developed in the annual planning and budgeting process, and are consistent with the criteria management uses to evaluate investment opportunities. These evaluations make use of the company’s assumption of future crude oil and natural gas commodity prices, refining and chemical margins, volumes, costs, and foreign currency exchange rates. Volumes are based on projected field and facility production profiles, throughput, or sales. Where unproved reserves exist, an appropriately risk-adjusted amount of these reserves may be included in the evaluation.
48
Table of Contents
An asset group is impaired if its undiscounted cash flows are less than the asset group’s carrying value. Impairments are measured by the amount by which the carrying value exceeds fair value. Fair value is based on market prices if an active market exists for the asset group or discounted cash flows using a discount rate commensurate with the risk. Significant unproved properties are assessed for impairment individually, and valuation allowances against the capitalized costs would be recorded based on the estimated economic chance of success and the length of time that the company expects to hold the properties. Properties that are not individually significant are aggregated by groups and amortized based on development risk and average holding period.
Continued weakness in the upstream industry environment during 2016 led the company to perform an assessment of its major long-lived assets as part of Imperial’s annual planning and budgeting process, similar to the exercise undertaken in late 2015. The assessment reflected long-term crude and natural gas prices which are consistent with the mid-point of the ranges that management uses to evaluate investment opportunities and which are in the range of long-term price forecasts published by third-party industry experts and government agencies. This assessment indicated that Imperial’s major asset groups have future undiscounted cash flow estimates exceeding carrying values.
Supplemental information regarding oil and gas results of operations, capitalized costs and reserves is provided following the notes to consolidated financial statements.
Inventories
Crude oil, products and merchandise inventories are carried at the lower of current market value or cost (generally determined under the last-in, first-out method – LIFO).
Pension benefits
The company’s pension plan is managed in compliance with the requirements of governmental authorities and meets funding levels as determined by independent third-party actuaries. Pension accounting requires explicit assumptions regarding, among others, the discount rate for the benefit obligations, the expected rate of return on plan assets and the long-term rate of future compensation increases. All pension assumptions are reviewed annually by senior management. These assumptions are adjusted only as appropriate to reflect long-term changes in market rates and outlook. The long-term expected rate of return on plan assets of 5.5 percent used in 2016 compares to actual returns of 5.5 percent and 7.7 percent achieved over the last 10- and 20-year periods respectively, ending December 31, 2016. If different assumptions are used, the expense and obligations could increase or decrease as a result. The company’s potential exposure to changes in assumptions is summarized in note 4 to the consolidated financial statements on page 66. At Imperial, differences between actual returns on plan assets and the long-term expected returns are not recorded in pension expense in the year the differences occur. Such differences are deferred, along with other actuarial gains and losses, and are amortized into pension expense over the expected average remaining service life of employees. Employee benefit expense represented about 2 percent of total expenses in 2016.
Asset retirement obligations and other environmental liabilities
Legal obligations associated with site restoration on the retirement of assets with determinable useful lives are recognized when they are incurred, which is typically at the time the assets are installed. The obligations are initially measured at fair value and discounted to present value. Over time, the discounted asset retirement obligation amount will be accreted for the change in its present value, with this effect included in production and manufacturing expenses. As payments to settle the obligations occur on an ongoing basis and will continue over the lives of the operating assets, which can exceed 25 years, the discount rate will be adjusted only as appropriate to reflect long-term changes in market rates and outlook. For 2016, the obligations were discounted at 6 percent and the accretion expense was $97 million, before tax, which was significantly less than 1 percent of total expenses in the year. There would be no material impact on the company’s reported financial results if a different discount rate had been used.
Asset retirement obligations are not recognized for assets with an indeterminate useful life. Asset retirement obligations for these facilities generally become firm at the time the facilities are permanently shut down and dismantled. These obligations may include the costs of asset disposal and additional soil remediation. However, these sites have indeterminate lives based on plans for continued operations, and as such, the fair value of the conditional legal obligations cannot be measured, since it is impossible to estimate the future settlement dates of such obligations. For these and non-operating assets, the company accrues provisions for environmental liabilities when it is probable that obligations have been incurred and the amount can be reasonably estimated.
49
Table of Contents
Asset retirement obligations and other environmental liabilities are based on engineering estimated costs, taking into account the anticipated method and extent of remediation consistent with legal requirements, current technology and the possible use of the location. Since these estimates are specific to the locations involved, there are many individual assumptions underlying the company’s total asset retirement obligations and provision for other environmental liabilities. While these individual assumptions can be subject to change, none of them is individually significant to the company’s reported financial results.
Suspended exploratory well costs
The company continues capitalization of exploratory well costs when the well has found a sufficient quantity of reserves to justify its completion as a producing well and the company is making sufficient progress assessing the reserves and the economic and operating viability of the project. Exploratory well costs not meeting these criteria are charged to expense. The facts and circumstances that support continued capitalization of suspended wells at year-end are disclosed in note 15 to the consolidated financial statements on page 78.
Tax contingencies
The operations of the company are complex, and related tax interpretations, regulations and legislation are continually changing. Significant management judgment is required in the accounting for income tax contingencies and tax disputes because the outcomes are often difficult to predict.
The benefits of uncertain tax positions that the company has taken or expects to take in its income tax returns are recognized in the financial statements if management concludes that it is more likely than not that the position will be sustained with the tax authorities. For a position that is likely to be sustained, the benefit recognized in the financial statements is measured at the largest amount that is greater than 50 percent likely of being realized. A reserve is established for the difference between a position taken or expected to be taken in an income tax return and the amount recognized in the financial statements. The company’s unrecognized tax benefits and a description of open tax years are summarized in note 3 to the consolidated financial statements on page 65.
Recently issued accounting standards
In May 2014, the Financial Accounting Standards Board (FASB) issued a new standard, Revenue from Contracts with Customers. The standard establishes a single revenue recognition model for all contracts with customers, eliminates industry specific requirements and expands disclosure requirements. The standard will be adopted beginning January 1, 2018. The company expects to adopt the standard using the modified retrospective method, under which prior years’ results are not restated, but supplemental information on the impact of the new standard is provided for in the 2018 results. Imperial continues to evaluate other areas of the standard. The impact from the standard is not expected to have a material effect on the company’s financial statements.
In February 2016, the FASB issued a new standard, Leases. The standard requires all leases with an initial term greater than one year be recorded on the balance sheet as a lease asset and lease liability, with little change to the income and cash flow statements. The standard is required to be adopted beginning January 1, 2019, with early adoption permitted. Imperial is evaluating the standard and its effect on the company’s financial statements and plans to adopt it in 2019.
50
Table of Contents
Management’s report on internal control over financial reporting
Management, including the company’s chief executive officer and principal accounting officer and principal financial officer, is responsible for establishing and maintaining adequate internal control over the company’s financial reporting. Management conducted an evaluation of the effectiveness of internal control over financial reporting based on criteria established in Internal Control – Integrated Framework (2013) issued by the Committee of Sponsoring Organizations of the Treadway Commission. Based on this evaluation, management concluded that Imperial Oil Limited’s internal control over financial reporting was effective as of December 31, 2016.
PricewaterhouseCoopers LLP, an independent registered public accounting firm, audited the effectiveness of the company’s internal control over financial reporting as of December 31, 2016, as stated in their report which is included herein.
/s/ Richard M. Kruger
R.M. Kruger
Chairman, president and
chief executive officer
/s/ Beverley A. Babcock
B.A. Babcock
Senior vice-president,
finance and administration, and controller
(Principal accounting officer and principal financial officer)
February 22, 2017
51
Table of Contents
Report of independent registered public accounting firm
To the Shareholders of Imperial Oil Limited
We have audited the accompanying consolidated balance sheet of Imperial Oil Limited as of December 31, 2016 and December 31, 2015 and the related consolidated statements of income, comprehensive income, shareholders’ equity and cash flows for each of the years in the three-year period ended December 31, 2016.
In addition, we audited Imperial Oil Limited’s internal control over financial reporting as of December 31, 2016, based on criteria established in Internal Control - Integrated Framework (2013) issued by the Committee of Sponsoring Organizations of the Treadway Commission (COSO). Management is responsible for these consolidated financial statements, for maintaining effective internal control over financial reporting and for its assessment of the effectiveness of internal control over financial reporting, included in the accompanying management’s report on internal control over financial reporting. Our responsibility is to express an opinion on these consolidated financial statements and the company’s internal control over financial reporting based on our integrated audits.
We conducted our audits in accordance with the standards of the Public Company Accounting Oversight Board (United States). Those standards require that we plan and perform the audits to obtain reasonable assurance about whether the consolidated financial statements are free of material misstatement and whether effective internal control over financial reporting was maintained in all material respects. Our audits of the consolidated financial statements included examining, on a test basis, evidence supporting the amounts and disclosures in the consolidated financial statements, assessing the accounting principles used and significant estimates made by management, as well as evaluating the overall consolidated financial statement presentation. Our audit of internal control over financial reporting included obtaining an understanding of internal control over financial reporting, assessing the risk that a material weakness exists, and testing and evaluating the design and operating effectiveness of internal control based on the assessed risk. Our audits also included performing such other procedures as we considered necessary in the circumstances. We believe that our audits provide a reasonable basis for our opinions.
A company’s internal control over financial reporting is a process designed to provide reasonable assurance regarding the reliability of financial reporting and the preparation of financial statements for external purposes in accordance with generally accepted accounting principles. A company’s internal control over financial reporting includes those policies and procedures that: (i) pertain to the maintenance of records that, in reasonable detail, accurately and fairly reflect the transactions and dispositions of the assets of the company; (ii) provide reasonable assurance that transactions are recorded as necessary to permit preparation of financial statements in accordance with generally accepted accounting principles, and that receipts and expenditures of the company are being made only in accordance with authorizations of management and directors of the company; and (iii) provide reasonable assurance regarding prevention or timely detection of unauthorized acquisition, use, or disposition of the company’s assets that could have a material effect on the financial statements. Because of its inherent limitations, internal control over financial reporting may not prevent or detect misstatements. Also, projections of any evaluation of effectiveness to future periods are subject to the risk that controls may become inadequate because of changes in conditions, or that the degree of compliance with the policies or procedures may deteriorate.
In our opinion, the consolidated financial statements referred to above present fairly, in all material respects, the financial position of Imperial Oil Limited as of December 31, 2016 and December 31, 2015 and the results of its operations and its cash flows for each of the years in the three-year period ended December 31, 2016 in conformity with accounting principles generally accepted in the United States of America. Also, in our opinion, Imperial Oil Limited maintained, in all material respects, effective internal control over financial reporting as of December 31, 2016, based on criteria established in Internal Control - Integrated Framework (2013) issued by COSO.
/s/ PricewaterhouseCoopers LLP
Chartered Professional Accountants
Calgary, Alberta, Canada
February 22, 2017
52
Table of Contents
Consolidated statement of income (U.S. GAAP)
| millions of Canadian dollars | ||||||||||||
| For the years ended December 31 | 2016 | 2015 | 2014 | |||||||||
|
|
||||||||||||
| Revenues and other income |
||||||||||||
| Operating revenues (a) (b) |
25,049 | 26,756 | 36,231 | |||||||||
| Investment and other income (note 8) |
2,305 | 132 | 735 | |||||||||
|
|
||||||||||||
| Total revenues and other income |
27,354 | 26,888 | 36,966 | |||||||||
|
|
||||||||||||
| Expenses |
||||||||||||
| Exploration (note 15) |
94 | 73 | 67 | |||||||||
| Purchases of crude oil and products (c) |
15,120 | 15,284 | 22,479 | |||||||||
| Production and manufacturing (d) |
5,224 | 5,434 | 5,662 | |||||||||
| Selling and general (d) |
1,129 | 1,117 | 1,075 | |||||||||
| Federal excise tax (a) |
1,650 | 1,568 | 1,562 | |||||||||
| Depreciation and depletion |
1,628 | 1,450 | 1,096 | |||||||||
| Financing costs (note 12) |
65 | 39 | 4 | |||||||||
|
|
||||||||||||
| Total expenses |
24,910 | 24,965 | 31,945 | |||||||||
|
|
||||||||||||
| Income (loss) before income taxes |
2,444 | 1,923 | 5,021 | |||||||||
| Income taxes (note 3) |
279 | 801 | 1,236 | |||||||||
|
|
||||||||||||
| Net income (loss) |
2,165 | 1,122 | 3,785 | |||||||||
|
|
||||||||||||
| Per-share information (Canadian dollars) |
||||||||||||
| Net income (loss) per common share - basic (note 10) |
2.55 | 1.32 | 4.47 | |||||||||
| Net income (loss) per common share - diluted (note 10) |
2.55 | 1.32 | 4.45 | |||||||||
| Dividends per common share |
0.59 | 0.54 | 0.52 | |||||||||
|
|
||||||||||||
| (a) Federal excise tax included in operating revenues. |
1,650 | 1,568 | 1,562 | |||||||||
| (b) Amounts from related parties included in operating revenues (note 16).* |
2,342 | 3,058 | 3,358 | |||||||||
| (c) Amounts to related parties included in purchases of crude oil and products (note 16).* |
2,224 | 2,684 | 3,262 | |||||||||
| (d) Amounts to related parties included in production and manufacturing, and selling and general expenses (note 16). |
533 | 442 | 366 | |||||||||
*Note: Restated 2015 and 2014.
The information in the notes to consolidated financial statements is an integral part of these statements.
53
Table of Contents
Consolidated statement of comprehensive income (U.S. GAAP)
| millions of Canadian dollars | ||||||||||||
| For the years ended December 31 | 2016 | 2015 | 2014 | |||||||||
|
|
||||||||||||
| Net income (loss) |
2,165 | 1,122 | 3,785 | |||||||||
| Other comprehensive income (loss), net of income taxes |
||||||||||||
| Post-retirement benefits liability adjustment (excluding amortization) |
(210 | ) | 64 | (483) | ||||||||
| Amortization of post-retirement benefits liability adjustment |
141 | 167 | 145 | |||||||||
|
|
||||||||||||
| Total other comprehensive income (loss) |
(69 | ) | 231 | (338) | ||||||||
|
|
||||||||||||
|
|
||||||||||||
| Comprehensive income (loss) |
2,096 | 1,353 | 3,447 | |||||||||
|
|
||||||||||||
The information in the notes to consolidated financial statements is an integral part of these statements.
54
Table of Contents
Consolidated balance sheet (U.S. GAAP)
| millions of Canadian dollars | ||||||||
| At December 31 | 2016 | 2015 | ||||||
|
|
||||||||
| Assets |
||||||||
| Current assets |
||||||||
| Cash |
391 | 203 | ||||||
| Accounts receivable, less estimated doubtful accounts (a) |
2,023 | 1,581 | ||||||
| Inventories of crude oil and products (note 11) |
949 | 1,190 | ||||||
| Materials, supplies and prepaid expenses |
468 | 424 | ||||||
| Deferred income tax assets (b) (note 3) |
- | 272 | ||||||
|
|
||||||||
| Total current assets |
3,831 | 3,670 | ||||||
| Investments and long-term receivables |
1,030 | 1,254 | ||||||
| Property, plant and equipment, |
36,333 | 37,799 | ||||||
| Goodwill |
186 | 224 | ||||||
| Other assets, including intangibles, net (b) |
274 | 223 | ||||||
|
|
||||||||
| Total assets (note 2) |
41,654 | 43,170 | ||||||
|
|
||||||||
| Liabilities |
||||||||
| Current liabilities |
||||||||
| Notes and loans payable (c) (note 12) |
202 | 1,952 | ||||||
| Accounts payable and accrued liabilities (a) (b) (note 11) |
3,193 | 2,989 | ||||||
| Income taxes payable |
488 | 452 | ||||||
|
|
||||||||
| Total current liabilities |
3,883 | 5,393 | ||||||
| Long-term debt (d) (note 14) |
5,032 | 6,564 | ||||||
| Other long-term obligations (e) (note 5) |
3,656 | 3,597 | ||||||
| Deferred income tax liabilities (b) (note 3) |
4,062 | 4,191 | ||||||
|
|
||||||||
| Total liabilities |
16,633 | 19,745 | ||||||
|
|
||||||||
| Commitments and contingent liabilities (note 9) |
||||||||
| Shareholders’ equity |
||||||||
| Common shares at stated value (f) (note 10) |
1,566 | 1,566 | ||||||
| Earnings reinvested |
25,352 | 23,687 | ||||||
| Accumulated other comprehensive income (loss) (note 17) |
(1,897 | ) | (1,828) | |||||
|
|
||||||||
| Total shareholders’ equity |
25,021 | 23,425 | ||||||
|
|
||||||||
| Total liabilities and shareholders’ equity |
41,654 | 43,170 | ||||||
|
|
||||||||
| (a) | Accounts receivable, less estimated doubtful accounts included net amounts receivable from related parties of $172 million (2015 - $129 million), (note 16). |
| (b) | Per ASU 2015-17, deferred tax assets and liabilities have been prospectively classified as non-current. Prior periods were not restated (note 1). |
| (c) | Notes and loans payable included amounts to related parties of $75 million (2015 – $75 million), (note 16). |
| (d) | Long-term debt included amounts to related parties of $4,447 million (2015 – $5,952 million), (note 16). |
| (e) | Other long-term obligations included amounts to related parties of $104 million (2015 – $146 million), (note 16). |
| (f) | Number of common shares authorized and outstanding were 1,100 million and 848 million, respectively (2015 – 1,100 million and 848 million, respectively), (note 10). |
The information in the notes to consolidated financial statements is an integral part of these statements.
| Approved by the directors
|
||
| /s/ Richard M. Kruger
R.M. Kruger Chairman, president and chief executive officer |
/s/ Beverley A. Babcock
B.A. Babcock Senior vice-president, finance and administration, and controller |
55
Table of Contents
Consolidated statement of shareholders’ equity (U.S. GAAP)
| millions of Canadian dollars | ||||||||||||
| At December 31 | 2016 | 2015 | 2014 | |||||||||
|
|
||||||||||||
| Common shares at stated value (note 10) |
||||||||||||
| At beginning of year |
1,566 | 1,566 | 1,566 | |||||||||
| Issued under the stock option plan |
- | - | - | |||||||||
| Share purchases at stated value |
- | - | - | |||||||||
|
|
||||||||||||
| At end of year |
1,566 | 1,566 | 1,566 | |||||||||
|
|
||||||||||||
| Earnings reinvested |
||||||||||||
| At beginning of year |
23,687 | 23,023 | 19,679 | |||||||||
| Net income (loss) for the year |
2,165 | 1,122 | 3,785 | |||||||||
| Share purchases in excess of stated value |
- | - | - | |||||||||
| Dividends declared |
(500) | (458) | (441) | |||||||||
|
|
||||||||||||
| At end of year |
25,352 | 23,687 | 23,023 | |||||||||
|
|
||||||||||||
| Accumulated other comprehensive income (loss) (note 17) |
||||||||||||
| At beginning of year |
(1,828) | (2,059) | (1,721) | |||||||||
| Other comprehensive income (loss) |
(69) | 231 | (338) | |||||||||
|
|
||||||||||||
| At end of year |
(1,897) | (1,828) | (2,059) | |||||||||
|
|
||||||||||||
| Shareholders’ equity at end of year |
25,021 | 23,425 | 22,530 | |||||||||
|
|
||||||||||||
The information in the notes to consolidated financial statements is an integral part of these statements.
56
Table of Contents
Consolidated statement of cash flows (U.S. GAAP)
| millions of Canadian dollars |
||||||||||
| Inflow (outflow) | ||||||||||
| For the years ended December 31 | 2016 | 2015 | 2014 | |||||||
|
| ||||||||||
| Operating activities |
||||||||||
| Net income (loss) |
2,165 | 1,122 | 3,785 | |||||||
| Adjustments for non-cash items: |
||||||||||
| Depreciation and depletion |
1,628 | 1,450 | 1,096 | |||||||
| (Gain) loss on asset sales (note 8) |
(2,244 | ) | (97 | ) | (696) | |||||
| Inventory write-down to current market value (note 11) |
- | 59 | - | |||||||
| Deferred income taxes and other |
114 | 367 | 1,123 | |||||||
| Changes in operating assets and liabilities: |
||||||||||
| Accounts receivable |
(442 | ) | (42 | ) | 545 | |||||
| Inventories, materials, supplies and prepaid expenses |
197 | (172 | ) | (129) | ||||||
| Income taxes payable |
36 | 418 | (693) | |||||||
| Accounts payable and accrued liabilities |
237 | (1,030 | ) | (549) | ||||||
| All other items - net (a) |
324 | 92 | (77) | |||||||
|
| ||||||||||
| Cash flows from (used in) operating activities |
2,015 | 2,167 | 4,405 | |||||||
|
| ||||||||||
| Investing activities |
||||||||||
| Additions to property, plant and equipment |
(1,073 | ) | (2,994 | ) | (5,290) | |||||
| Proceeds from asset sales (note 8) |
3,021 | 142 | 851 | |||||||
| Additional investments |
(1 | ) | (32 | ) | (123) | |||||
|
| ||||||||||
| Cash flows from (used in) investing activities |
1,947 | (2,884 | ) | (4,562) | ||||||
|
| ||||||||||
| Financing activities |
||||||||||
| Short-term debt - net |
(1,749 | ) | (32 | ) | 120 | |||||
| Long-term debt - additions (note 14) |
495 | 1,206 | 430 | |||||||
| Long-term debt - reductions (note 14) |
(2,000 | ) | - | - | ||||||
| Reduction in capitalized lease obligations |
(28 | ) | (20 | ) | (9) | |||||
| Dividends paid |
(492 | ) | (449 | ) | (441) | |||||
|
| ||||||||||
| Cash flows from (used in) financing activities |
(3,774 | ) | 705 | 100 | ||||||
|
| ||||||||||
| Increase (decrease) in cash |
188 | (12 | ) | (57) | ||||||
| Cash at beginning of year |
203 | 215 | 272 | |||||||
|
| ||||||||||
| Cash at end of year (b) |
391 | 203 | 215 | |||||||
|
| ||||||||||
| (a) Included contribution to registered pension plans. |
163 | 225 | 362 | |||||||
| (b) Cash is composed of cash in bank and cash equivalents at cost. Cash equivalents are all highly liquid securities with maturity of three months or less when purchased. | ||||||||||
Non-cash transactions
In 2015, a capital lease of approximately $480 million was not included in “Additions to property, plant and equipment” or “Long-term debt issued” lines on the Consolidated statement of cash flows.
The information in the notes to consolidated financial statements is an integral part of these statements.
57
Table of Contents
Notes to consolidated financial statements
The accompanying consolidated financial statements and the supporting and supplemental material are the responsibility of the management of Imperial Oil Limited.
The company’s principal business is energy, involving the exploration, production, transportation and sale of crude oil and natural gas and the manufacture, transportation and sale of petroleum products. The company is also a major manufacturer and marketer of petrochemicals.
The consolidated financial statements have been prepared in accordance with United States Generally Accepted Accounting Principles. GAAP requires management to make estimates and judgments that affect the reported amounts of assets, liabilities, revenues and expenses and the disclosure of contingent assets and liabilities. Actual results could differ from these estimates. Prior years’ data has been reclassified in certain cases to conform to the 2016 presentation basis. All amounts are in Canadian dollars unless otherwise indicated.
1. Summary of significant accounting policies
Principles of consolidation
The consolidated financial statements include the accounts of subsidiaries the company controls. Intercompany accounts and transactions are eliminated. Subsidiaries include those companies in which Imperial has both an equity interest and the continuing ability to unilaterally determine strategic, operating, investing and financing policies. Significant subsidiaries included in the consolidated financial statements include Imperial Oil Resources Limited, Imperial Oil Resources Ventures Limited and McColl-Frontenac Petroleum ULC. All of the above companies are wholly owned. The consolidated financial statements also include the company’s share of the undivided interest in certain upstream assets, liabilities, revenues and expenses, including its 25 percent interest in the Syncrude joint venture and its 70.96 percent interest in the Kearl joint venture.
Inventories
Inventories are recorded at the lower of cost or current market value. The cost of crude oil and products is determined primarily using the last-in, first-out (LIFO) method. LIFO was selected over the alternative first-in, first-out and average cost methods because it provides a better matching of current costs with the revenues generated in the period.
Inventory costs include expenditures and other charges, including depreciation, directly or indirectly incurred in bringing the inventory to its existing condition and final storage prior to delivery to a customer. Selling and general expenses are reported as period costs and excluded from inventory costs.
Investments
The company’s interests in the underlying net assets of affiliates it does not control, but over which it exercises significant influence, are accounted for using the equity method. They are recorded at the original cost of the investment plus Imperial’s share of earnings since the investment was made, less dividends received. Imperial’s share of the after-tax earnings of these investments is included in “investment and other income” in the consolidated statement of income. Other investments are recorded at cost. Dividends from these other investments are included in “investment and other income.”
These investments represent interests in non-publicly traded pipeline companies and a rail loading joint venture that facilitate the sale and purchase of liquids in the conduct of company operations. Other parties who also have an equity interest in these investments share in the risks and rewards according to their percentage of ownership. Imperial does not invest in these investments in order to remove liabilities from its balance sheet.
Property, plant and equipment
Cost basis
Imperial uses the “successful efforts” method to account for its exploration and production activities. Under this method, costs are accumulated on a field-by-field basis. Costs incurred to purchase, lease, or otherwise acquire a property (whether unproved or proved) are capitalized when incurred. Exploratory well costs are carried as an asset when the well has found a sufficient quantity of reserves to justify its completion as a producing well and where the company is making sufficient progress assessing the reserves and the
58
Table of Contents
economic and operating viability of the project. Exploratory well costs that do not meet the criteria are charged to expense. Other exploratory expenditures, including geophysical costs and annual lease rentals, are expensed as incurred. Development costs, including costs of productive wells and development dryholes, are capitalized.
Maintenance and repair costs, including planned major maintenance, are expensed as incurred. Improvements that increase or prolong the service life or capacity of an asset are capitalized.
Depreciation, depletion and amortization
Depreciation, depletion and amortization are primarily determined under either the unit-of-production method or the straight-line method, which is based on estimated asset service life taking obsolescence into consideration. Depreciation and depletion for assets associated with producing properties begin at the time when production commences on a regular basis. Depreciation for other assets begins when the asset is in place and ready for its intended use. Assets under construction are not depreciated or depleted.
Acquisition costs of proved properties are amortized using a unit-of-production method, computed on the basis of total proved oil and gas reserves. Capitalized exploratory drilling and development costs associated with productive depletable extractive properties are amortized using the unit-of-production rates based on the amount of proved developed reserves of oil and gas that are estimated to be recoverable from existing facilities using current operating methods. Under the unit-of-production method, oil and gas volumes are considered produced once they have been measured through meters at custody transfer or sales transaction points at the outlet valve on the lease or field storage tank. In the event that the unit-of-production method does not result in an equitable allocation of cost over the economic life of an upstream asset, an alternative method is used. The straight-line method is used in limited situations where the expected life of the asset does not reasonably correlate with that of the underlying reserves. For example, certain assets used in the production of oil and natural gas have a shorter life than the reserves, and as such, the company uses straight-line depreciation to ensure the asset is fully depreciated by the end of its useful life. Investments in mining heavy equipment and certain ore processing plant assets at oil sands mining properties are depreciated on a straight-line basis over a maximum of 15 years and 50 years respectively. Depreciation of other plant and equipment is calculated using the straight-line method, based on the estimated service life of the asset.
Under the SEC definition of proved reserves, certain quantities of bitumen no longer qualified as proved reserves at year-end 2016, the substantial majority of which relates to the Kearl oil sands operation, where no proved reserves remain. To the extent that proved reserves for a property are entirely de-booked and that property continues to produce, assets will be depreciated using a unit-of-production method based on reserves determined at the most recent SEC price which results in a quantity of proved reserves greater than zero, appropriately adjusted for production and technical changes.
Investments in refinery, chemical process, and lubes basestock manufacturing equipment are generally depreciated on a straight-line basis over a 25-year life. Maintenance and repairs, including planned major maintenance, are expensed as incurred. Major renewals and improvements are capitalized and the assets replaced are retired.
Impairment assessment
The company tests assets or groups of assets for recoverability whenever events or circumstances indicate that the carrying amounts may not be recoverable.
Among the events or changes in circumstances which could indicate that the carrying value of an asset or asset group may not be recoverable are the following:
| ● | A significant decrease in the market price of a long-lived asset; |
| ● | A significant adverse change in the extent or manner in which an asset is being used or in its physical condition including a significant decrease in the company’s current and projected reserve volumes; |
| ● | A significant adverse change in legal factors or in the business climate that could affect the value, including a significant adverse action or assessment by a regulator; |
| ● | An accumulation of project costs significantly in excess of the amount originally expected; |
| ● | A current-period operating loss combined with a history and forecast of operating or cash flow losses; and |
| ● | A current expectation that, more likely than not, a long-lived asset will be sold or otherwise disposed of significantly before the end of its previously estimated useful life. |
59
Table of Contents
The company performs asset valuation analyses on an ongoing basis as a part of its asset management program. These analyses and other profitability reviews assist the company in assessing whether the carrying amounts of any of its assets may not be recoverable.
In general, Imperial does not view temporarily low prices or margins as an indication of impairment. Management does not believe that lower prices are sustainable if energy is to be delivered with supply security to meet global demand over the long term. Although prices will occasionally drop significantly, industry prices over the long term will continue to be driven by market supply and demand. On the supply side, industry production from mature fields is declining, but this is being offset by production from new discoveries and field developments. OPEC production policies also have an impact on world oil supplies. The demand side is largely a function of global economic growth. Because the lifespans of the company’s major assets are measured in decades, the value of these assets is predominantly based on long-term views of future commodity prices and production costs. During the lifespan of these major assets, the company expects that oil and gas prices will experience significant volatility, and consequently these assets will experience periods of higher earnings and periods of lower earnings, or even losses. In assessing whether the events or changes in circumstances indicate the carrying value of an asset may not be recoverable, the company considers recent periods of operating losses in the context of its longer-term view of prices. While near-term prices are subject to wide fluctuations, longer term price views are more stable and meaningful for purposes of assessing future cash flows.
When the industry experiences a prolonged and deep reduction in commodity prices, the market supply and demand conditions may result in changes to the company’s long-term price or margin assumptions it uses for its capital investment decisions. To the extent those changes result in a significant reduction in the mid-point of its long-term oil and natural gas price or margin ranges, the company may consider that situation, in conjunction with other events and changes in circumstances such as a history of operating losses, as an indicator of potential impairment for certain assets.
In the upstream, the standardized measure of discounted cash flows included in the “Supplemental information on oil and gas exploration and production activities” is required to use prices based on the average of first-of-month prices. These prices represent discrete points in time and could be higher or lower than the company’s long-term price assumptions which are used for impairment assessments. The company believes the standardized measure does not provide a reliable estimate of the expected future cash flows to be obtained from the development and production of its oil and gas properties or of the value of its oil and gas reserves and therefore does not consider it relevant in determining whether events or changes in circumstances indicate the need for an impairment assessment.
If events or circumstances indicate that the carrying value may not be recoverable, the company estimates the future undiscounted cash flows of the affected properties to judge the recoverability of carrying amounts. In performing this assessment, assets are grouped at the lowest level for which there are identifiable cash flows that are largely independent of the cash flows of other groups of assets. Cash flows used in recoverability assessments are based on the company’s assumptions which are developed in the annual planning and budgeting process, and are consistent with the criteria management uses to evaluate investment opportunities. These evaluations make use of the company’s assumption of future crude oil and natural gas commodity prices, refining and chemical margins, volumes, costs, and foreign currency exchange rates. Volumes are based on projected field and facility production profiles, throughput, or sales. Where unproved reserves exist, an appropriately risk-adjusted amount of these reserves may be included in the evaluation.
An asset group is impaired if its undiscounted cash flows are less than the asset group’s carrying value. Impairments are measured by the amount by which the carrying value exceeds fair value. Fair value is based on market prices if an active market exists for the asset group or discounted cash flows using a discount rate commensurate with the risk. Significant unproved properties are assessed for impairment individually, and valuation allowances against the capitalized costs would be recorded based on the estimated economic chance of success and the length of time that the company expects to hold the properties. Properties that are not individually significant are aggregated by groups and amortized based on development risk and average holding period.
Gains on sales of proved and unproved properties are only recognized when there is neither uncertainty about the recovery of costs applicable to any interest retained nor any substantial obligation for future performance by the company.
60
Table of Contents
Losses on properties sold are recognized when incurred or when the properties are held for sale and the fair value of the properties is less than the carrying value.
Gains or losses on assets sold are included in “investment and other income” in the consolidated statement of income.
Interest capitalization
Interest costs incurred to finance expenditures during the construction phase of multiyear projects are capitalized as part of property, plant and equipment and are depreciated over the service life of the related assets. The project construction phase commences with the development of the detailed engineering design and ends when the constructed assets are ready for their intended use.
Goodwill and other intangible assets
Goodwill is not subject to amortization. Goodwill is tested for impairment annually or more frequently if events or circumstances indicate it might be impaired. Impairment losses are recognized in current period earnings. The evaluation for impairment of goodwill is based on a comparison of the carrying values of goodwill and associated operating assets with the estimated present value of net cash flows from those operating assets.
Intangible assets with determinable useful lives are amortized over the estimated service lives of the assets. Computer software development costs are amortized over a maximum of 15 years and customer lists are amortized over a maximum of 10 years. The amortization is included in “depreciation and depletion” in the consolidated statement of income.
Asset retirement obligations and other environmental liabilities
Legal obligations associated with site restoration on the retirement of assets with determinable useful lives are recognized when they are incurred, which is typically at the time the assets are installed. These obligations primarily relate to soil reclamation and remediation and costs of abandonment and demolition of oil and gas wells and related facilities. The company uses estimates, assumptions and judgments regarding such factors as the existence of a legal obligation for an asset retirement obligation, technical assessments of the assets, estimated amounts and timing of settlements, the credit-adjusted risk-free rate to be used, and inflation rates. The obligations are initially measured at fair value and discounted to present value. A corresponding amount equal to that of the initial obligation is added to the capitalized costs of the related asset. Over time, the discounted asset retirement obligation amount will be accreted for the change in its present value, and the initial capitalized costs will be depreciated over the useful lives of the related assets.
No asset retirement obligations are set up for those manufacturing, distribution, marketing and office facilities with an indeterminate useful life. Asset retirement obligations for these facilities generally become firm at the time the facilities are permanently shut down and dismantled. These obligations may include the costs of asset disposal and additional soil remediation. However, these sites have indeterminate lives based on plans for continued operations, and as such, the fair value of the conditional legal obligations cannot be measured, since it is impossible to estimate the future settlement dates of such obligations. Provision for environmental liabilities of these assets is made when it is probable that obligations have been incurred and the amount can be reasonably estimated. Provisions for environmental liabilities are determined based on engineering estimated costs, taking into account the anticipated method and extent of remediation consistent with legal requirements, current technology and the possible use of the location. These liabilities are not reduced by possible recoveries from third parties and projected cash expenditures are not discounted.
Foreign-currency translation
Monetary assets and liabilities in foreign currencies have been translated at the rates of exchange prevailing on December 31. Any exchange gains or losses are recognized in income.
Fair value
Fair value is the price that would be received to sell an asset or paid to transfer a liability in an orderly transaction between market participants. Hierarchy Levels 1, 2 or 3 are terms for the priority of inputs to valuation techniques used to measure fair value. Hierarchy Level 1 inputs are quoted prices in active markets for identical assets or liabilities. Hierarchy Level 2 inputs are inputs other than quoted prices included within Level 1 that are directly or indirectly observable for the asset or liability. Hierarchy Level 3 inputs are inputs that are not observable in the market.
61
Table of Contents
Revenues
Revenues associated with sales of crude oil, natural gas, petroleum and chemical products and other items are recorded when the products are delivered. Delivery occurs when the customer has taken title and has assumed the risks and rewards of ownership, prices are fixed or determinable and collectability is reasonably assured. The company does not enter into ongoing arrangements whereby it is required to repurchase its products, nor does the company provide the customer with a right of return.
Revenues include amounts billed to customers for shipping and handling. Shipping and handling costs incurred up to the point of final storage prior to delivery to a customer are included in “purchases of crude oil and products” in the consolidated statement of income. Delivery costs from final storage to customer are recorded as a marketing expense in “selling and general” expenses.
Purchases and sales of inventory with the same counterparty that are entered into in contemplation of one another are combined and recorded as exchanges measured at the book value of the item sold.
Share-based compensation
The company awards share-based compensation to certain employees in the form of restricted stock units. Compensation expense is measured each reporting period based on the company’s current stock price and is recorded as “selling and general” expenses in the consolidated statement of income over the requisite service period of each award. See note 7 to the consolidated financial statements on page 72 for further details.
Consumer taxes
Taxes levied on the consumer and collected by the company are excluded from the consolidated statement of income. These are primarily provincial taxes on motor fuels, the federal goods and services tax and the federal/provincial harmonized sales tax.
Recently issued accounting standards
In May 2014, the Financial Accounting Standards Board (FASB) issued a new standard, Revenue from Contracts with Customers. The standard establishes a single revenue recognition model for all contracts with customers, eliminates industry specific requirements and expands disclosure requirements. The standard will be adopted beginning January 1, 2018. The company expects to adopt the standard using the modified retrospective method, under which prior years’ results are not restated, but supplemental information on the impact of the new standard is provided for in the 2018 results. Imperial continues to evaluate other areas of the standard. The impact from the standard is not expected to have a material effect on the company’s financial statements.
In February 2016, the FASB issued a new standard, Leases. The standard requires all leases with an initial term greater than one year be recorded on the balance sheet as a lease asset and lease liability, with little change to the income and cash flow statements. The standard is required to be adopted beginning January 1, 2019, with early adoption permitted. Imperial is evaluating the standard and its effect on the company’s financial statements and plans to adopt it in 2019.
Effective September 30, 2016, Imperial early adopted Accounting Standards Update (ASU) no. 2015-17 Income Taxes (Topic 740): Balance sheet classification of deferred taxes, on a prospective basis. This update eliminates the requirement to classify deferred tax assets and liabilities as current and non-current, and instead requires all deferred tax assets and liabilities to be classified as non-current.
The balance sheet classification of deferred income tax assets / (liabilities) are shown below.
| millions of Canadian dollars | As at Dec 31 |
As at Dec 31 2015 |
||||||
|
|
||||||||
| Deferred income tax assets |
- | 272 | ||||||
| Other assets, including intangibles, net |
57 | - | ||||||
| Accounts payable and accrued liabilities |
- | (41) | ||||||
| Deferred income tax liabilities |
(4,062) | (4,191) | ||||||
|
|
||||||||
| Net deferred tax liabilities |
(4,005) | (3,960) | ||||||
|
|
||||||||
62
Table of Contents
The company operates its business in Canada. The Upstream, Downstream and Chemical functions best define the operating segments of the business that are reported separately. The factors used to identify these reportable segments are based on the nature of the operations that are undertaken by each segment and the structure of the company’s internal organization. The Upstream segment is organized and operates to explore for and ultimately produce crude oil and its equivalent, and natural gas. The Downstream segment is organized and operates to refine crude oil into petroleum products and to distribute and market these products. The Chemical segment is organized and operates to manufacture and market hydrocarbon-based chemicals and chemical products. The above segmentation has been the long-standing practice of the company and is broadly understood across the petroleum and petrochemical industries.
These functions have been defined as the operating segments of the company because they are the segments (a) that engage in business activities from which revenues are earned and expenses are incurred; (b) whose operating results are regularly reviewed by the company’s chief operating decision maker to make decisions about resources to be allocated to each segment and assess its performance; and (c) for which discrete financial information is available.
Corporate and Other includes assets and liabilities that do not specifically relate to business segments – primarily cash, capitalized interest costs, short-term borrowings, long-term debt and liabilities associated with incentive compensation and post-retirement benefits liability adjustment. Net earnings effects in this segment primarily include debt-related financing costs, interest income and share-based incentive compensation expenses.
Segment accounting policies are the same as those described in the summary of significant accounting policies. Upstream, Downstream and Chemical expenses include amounts allocated from the Corporate and Other segment. The allocation is based on proportional segment expenses. Transfers of assets between segments are recorded at book amounts. Intersegment sales are made essentially at prevailing market prices. Assets and liabilities that are not identifiable by segment are allocated.
63
Table of Contents
| Upstream | Downstream | Chemical | ||||||||||||||||||||||||||||||||||
| millions of Canadian dollars | 2016 | 2015 | 2014 | 2016 | 2015 | 2014 | 2016 | 2015 | 2014 | |||||||||||||||||||||||||||
| Revenues and other income |
||||||||||||||||||||||||||||||||||||
| Operating revenues (a) |
5,492 | 5,776 | 8,408 | 18,511 | 19,796 | 26,400 | 1,046 | 1,184 | 1,423 | |||||||||||||||||||||||||||
| Intersegment sales |
2,215 | 2,486 | 4,087 | 1,007 | 1,019 | 1,359 | 212 | 234 | 381 | |||||||||||||||||||||||||||
| Investment and other income (note 8) |
13 | 22 | 667 | 2,278 | 104 | 65 | - | - | - | |||||||||||||||||||||||||||
| 7,720 | 8,284 | 13,162 | 21,796 | 20,919 | 27,824 | 1,258 | 1,418 | 1,804 | ||||||||||||||||||||||||||||
| Expenses |
||||||||||||||||||||||||||||||||||||
| Exploration (note 15) |
94 | 73 | 67 | - | - | - | - | - | - | |||||||||||||||||||||||||||
| Purchases of crude oil and products |
3,666 | 3,768 | 5,628 | 14,178 | 14,526 | 21,476 | 705 | 725 | 1,196 | |||||||||||||||||||||||||||
| Production and manufacturing |
3,591 | 3,766 | 3,882 | 1,428 | 1,461 | 1,564 | 205 | 207 | 216 | |||||||||||||||||||||||||||
| Selling and general |
(5 | ) | (2 | ) | 3 | 972 | 986 | 887 | 83 | 87 | 70 | |||||||||||||||||||||||||
| Federal excise tax |
- | - | - | 1,650 | 1,568 | 1,562 | - | - | - | |||||||||||||||||||||||||||
| Depreciation and depletion |
1,396 | 1,193 | 857 | 206 | 233 | 216 | 10 | 11 | 12 | |||||||||||||||||||||||||||
| Financing costs (note 12) |
(7 | ) | 5 | 4 | - | - | - | - | - | - | ||||||||||||||||||||||||||
| Total expenses |
8,735 | 8,803 | 10,441 | 18,434 | 18,774 | 25,705 | 1,003 | 1,030 | 1,494 | |||||||||||||||||||||||||||
| Income (loss) before income taxes |
(1,015 | ) | (519 | ) | 2,721 | 3,362 | 2,145 | 2,119 | 255 | 388 | 310 | |||||||||||||||||||||||||
| Income taxes (note 3) |
||||||||||||||||||||||||||||||||||||
| Current |
(491 | ) | (77 | ) | (219 | ) | 674 | 476 | 296 | 68 | 97 | 76 | ||||||||||||||||||||||||
| Deferred |
137 | 262 | 881 | (66 | ) | 83 | 229 | - | 4 | 5 | ||||||||||||||||||||||||||
| Total income tax expense |
(354 | ) | 185 | 662 | 608 | 559 | 525 | 68 | 101 | 81 | ||||||||||||||||||||||||||
| Net income (loss) |
(661 | ) | (704 | ) | 2,059 | 2,754 | 1,586 | 1,594 | 187 | 287 | 229 | |||||||||||||||||||||||||
| Cash flows from (used in) operating activities |
402 | 224 | 2,519 | 1,574 | 1,686 | 1,666 | 203 | 383 | 250 | |||||||||||||||||||||||||||
| Capital and exploration expenditures (b) |
896 | 3,135 | 4,974 | 190 | 340 | 572 | 26 | 52 | 26 | |||||||||||||||||||||||||||
| Property, plant and equipment |
||||||||||||||||||||||||||||||||||||
| Cost |
45,850 | 45,171 | 42,142 | 6,166 | 7,596 | 7,460 | 872 | 857 | 798 | |||||||||||||||||||||||||||
| Accumulated depreciation and depletion |
(12,312 | ) | (11,016 | ) | (10,103 | ) | (4,037 | ) | (4,584 | ) | (4,459 | ) | (629 | ) | (616 | ) | (601 | ) | ||||||||||||||||||
| Net property, plant and equipment (c) |
33,538 | 34,155 | 32,039 | 2,129 | 3,012 | 3,001 | 243 | 241 | 197 | |||||||||||||||||||||||||||
| Total assets |
36,840 | 36,971 | 34,421 | 3,958 | 5,574 | 5,823 | 346 | 394 | 372 | |||||||||||||||||||||||||||
| Corporate and Other | Eliminations | Consolidated | ||||||||||||||||||||||||||||||||||
| millions of Canadian dollars | 2016 | 2015 | 2014 | 2016 | 2015 | 2014 | 2016 | 2015 | 2014 | |||||||||||||||||||||||||||
| Revenues and other income |
||||||||||||||||||||||||||||||||||||
| Operating revenues (a) |
- | - | - | - | - | - | 25,049 | 26,756 | 36,231 | |||||||||||||||||||||||||||
| Intersegment sales |
- | - | - | (3,434 | ) | (3,739 | ) | (5,827 | ) | - | - | - | ||||||||||||||||||||||||
| Investment and other income (note 8) |
14 | 6 | 3 | - | - | - | 2,305 | 132 | 735 | |||||||||||||||||||||||||||
| 14 | 6 | 3 | (3,434 | ) | (3,739 | ) | (5,827 | ) | 27,354 | 26,888 | 36,966 | |||||||||||||||||||||||||
| Expenses |
||||||||||||||||||||||||||||||||||||
| Exploration (note 15) |
- | - | - | - | - | - | 94 | 73 | 67 | |||||||||||||||||||||||||||
| Purchases of crude oil and products |
- | - | - | (3,429 | ) | (3,735 | ) | (5,821 | ) | 15,120 | 15,284 | 22,479 | ||||||||||||||||||||||||
| Production and manufacturing |
- | - | - | - | - | - | 5,224 | 5,434 | 5,662 | |||||||||||||||||||||||||||
| Selling and general |
84 | 50 | 121 | (5 | ) | (4 | ) | (6 | ) | 1,129 | 1,117 | 1,075 | ||||||||||||||||||||||||
| Federal excise tax |
- | - | - | - | - | - | 1,650 | 1,568 | 1,562 | |||||||||||||||||||||||||||
| Depreciation and depletion |
16 | 13 | 11 | - | - | - | 1,628 | 1,450 | 1,096 | |||||||||||||||||||||||||||
| Financing costs (note 12) |
72 | 34 | - | - | - | - | 65 | 39 | 4 | |||||||||||||||||||||||||||
| Total expenses |
172 | 97 | 132 | (3,434 | ) | (3,739 | ) | (5,827 | ) | 24,910 | 24,965 | 31,945 | ||||||||||||||||||||||||
| Income (loss) before income taxes |
(158 | ) | (91 | ) | (129 | ) | - | - | - | 2,444 | 1,923 | 5,021 | ||||||||||||||||||||||||
| Income taxes (note 3) |
||||||||||||||||||||||||||||||||||||
| Current |
(51 | ) | (45 | ) | (47 | ) | - | - | - | 200 | 451 | 106 | ||||||||||||||||||||||||
| Deferred |
8 | 1 | 15 | - | - | - | 79 | 350 | 1,130 | |||||||||||||||||||||||||||
| Total income tax expense |
(43 | ) | (44 | ) | (32 | ) | - | - | - | 279 | 801 | 1,236 | ||||||||||||||||||||||||
| Net income (loss) |
(115 | ) | (47 | ) | (97 | ) | - | - | - | 2,165 | 1,122 | 3,785 | ||||||||||||||||||||||||
| Cash flows from (used in) operating activities |
(143 | ) | (124 | ) | (30 | ) | (21 | ) | (2 | ) | - | 2,015 | 2,167 | 4,405 | ||||||||||||||||||||||
| Capital and exploration expenditures (b) |
49 | 68 | 82 | - | - | - | 1,161 | 3,595 | 5,654 | |||||||||||||||||||||||||||
| Property, plant and equipment |
||||||||||||||||||||||||||||||||||||
| Cost |
627 | 579 | 511 | - | - | - | 53,515 | 54,203 | 50,911 | |||||||||||||||||||||||||||
| Accumulated depreciation and depletion |
(204 | ) | (188 | ) | (174 | ) | - | - | - | (17,182 | ) | (16,404 | ) | (15,337 | ) | |||||||||||||||||||||
| Net property, plant and equipment (c) |
423 | 391 | 337 | - | - | - | 36,333 | 37,799 | 35,574 | |||||||||||||||||||||||||||
| Total assets |
894 | 579 | 565 | (384 | ) | (348 | ) | (351 | ) | 41,654 | 43,170 | 40,830 | ||||||||||||||||||||||||
64
Table of Contents
| (a) | Includes export sales to the United States of $3,612 million (2015 - $4,157 million, 2014 - $5,940 million). Export sales to the United States were recorded in all operating segments, with the largest effects in the Upstream segment. |
| (b) | Capital and exploration expenditures (CAPEX) include exploration expenses, additions to property, plant and equipment, additions to capital leases, additional investments and acquisitions. |
| (c) | Includes property, plant and equipment under construction of $2,705 million (2015 - $3,719 million). |
| millions of Canadian dollars | 2016 | 2015 | 2014 | |||||||||
| Current income tax expense (a) |
200 | 451 | 106 | |||||||||
| Deferred income tax expense (a) (b) |
79 | 350 | 1,130 | |||||||||
| Total income tax expense (a) (c) |
279 | 801 | 1,236 | |||||||||
| Statutory corporate tax rate (percent) |
26.8 | 27.2 | 25.5 | |||||||||
| Increase (decrease) resulting from: |
||||||||||||
| Disposals (d) |
(11.6 | ) | (0.4 | ) | (0.1 | ) | ||||||
| Enacted tax rate change (a) |
- | 16.1 | - | |||||||||
| Other |
(3.8 | ) | (1.2 | ) | (0.8 | ) | ||||||
| Effective income tax rate |
11.4 | 41.7 | 24.6 | |||||||||
| (a) | On June 30, 2015 the Alberta government enacted a 2 percent increase in the provincial tax rate, from 10 percent to 12 percent. |
| (b) | There were no material net (charges) credits for the effect of changes in tax laws and rates included in the provisions for deferred income taxes in 2014 and 2016. |
| (c) | Cash outflow from income taxes, plus investment credits earned, was $172 million (2015 - $202 million, 2014 - $811 million). |
| (d) | 2016 disposals are primarily associated with the sales of company-owned Esso retail sites and the general aviation business. Capital gains tax treatment was applied on the majority of disposals. |
In 2016, the decrease in the statutory tax rate in the other category mainly represents prior year adjustments and re-assessments.
Deferred income taxes are based on differences between the accounting and tax values of assets and liabilities. These differences in value are re-measured at each year-end using the tax rates and tax laws expected to apply when those differences are realized or settled in the future. Components of deferred income tax liabilities and assets as at December 31 were:
| millions of Canadian dollars | 2016 | 2015 | 2014 | |||||||||
| Depreciation and amortization |
5,361 | 4,677 | 3,777 | |||||||||
| Successful drilling and land acquisitions |
891 | 922 | 827 | |||||||||
| Pension and benefits |
(457 | ) | (396 | ) | (438 | ) | ||||||
| Asset retirement obligation |
(396 | ) | (406 | ) | (304 | ) | ||||||
| Capitalized interest |
114 | 104 | 82 | |||||||||
| LIFO inventory valuation (a) |
(240 | ) | - | - | ||||||||
| Tax loss carryforwards |
(1,056 | ) | (610 | ) | (30 | ) | ||||||
| Other (a) |
(212 | ) | (100 | ) | (73 | ) | ||||||
| Net long-term deferred income tax liabilities |
4,005 | 4,191 | 3,841 | |||||||||
| LIFO inventory valuation (a) |
- | (112 | ) | (201 | ) | |||||||
| Other (a) |
- | (160 | ) | (113 | ) | |||||||
| Net current deferred income tax assets |
- | (272 | ) | (314 | ) | |||||||
| Net current deferred income tax liabilities (a) |
- | 41 | - | |||||||||
| Net deferred income tax liabilities |
4,005 | 3,960 | 3,527 | |||||||||
(a) Per ASU 2015-17, deferred tax assets and liabilities have been prospectively classified as non-current. Prior periods were not restated (note 1).
65
Table of Contents
Unrecognized tax benefits
Unrecognized tax benefits reflect the difference between positions taken or expected to be taken on income tax returns and the amounts recognized in the financial statements.
The following table summarizes the movement in unrecognized tax benefits:
| millions of Canadian dollars | 2016 | 2015 | 2014 | |||||||||
| Balance as of January 1 |
132 | 151 | 151 | |||||||||
| Additions based on current year’s tax position |
- | - | 4 | |||||||||
| Additions for prior years’ tax position |
2 | 10 | - | |||||||||
| Reductions for prior years’ tax positions |
(23 | ) | (29 | ) | (4 | ) | ||||||
| Reductions due to lapse of the statute of limitations |
(5 | ) | - | - | ||||||||
| Balance as of December 31 |
106 | 132 | 151 | |||||||||
The unrecognized tax benefit balances shown above are predominately related to tax positions that would reduce the company’s effective tax rate if the positions are favourably resolved. Unfavourable resolution of these tax positions generally would not increase the effective tax rate. The 2016, 2015 and 2014 changes in unrecognized tax benefits did not have a material effect on the company’s net income or cash flow. The company’s tax filings from 2009 to 2016 are subject to examination by the tax authorities. Tax filing from 1994 to 1996, 1998 and 2000 to 2008 have open objections and therefore are also subject to examination by the tax authorities. The Canada Revenue Agency has proposed certain adjustments to the company’s filings. Management is currently evaluating those proposed adjustments and believes that a number of outstanding matters are expected to be resolved in 2017. The impact on unrecognized tax benefits and the company’s effective income tax rate from these matters is not expected to be material.
Resolution of the related tax positions will take many years to complete. It is difficult to predict the timing of resolution for tax positions since such timing is not entirely within the control of the company.
The company classifies interest on income tax related balances as interest expense or interest income and classifies tax related penalties as operating expense.
4. Employee retirement benefits
Retirement benefits, which cover almost all retired employees and their surviving spouses, include pension income and certain health care and life insurance benefits. They are met through funded registered retirement plans and through unfunded supplementary benefits that are paid directly to recipients.
Pension income benefits consist mainly of company-paid defined benefit plans that are based on years of service and final average earnings. The company shares in the cost of health care and life insurance benefits. The company’s benefit obligations are based on the projected benefit method of valuation that includes employee service to date and present compensation levels as well as a projection of salaries to retirement.
The expense and obligations for both funded and unfunded benefits are determined in accordance with accepted actuarial practices and U.S. GAAP. The process for determining retirement-income expense and related obligations includes making certain long-term assumptions regarding the discount rate, rate of return on plan assets and rate of compensation increases. The obligation and pension expense can vary significantly with changes in the assumptions used to estimate the obligation and the expected return on plan assets.
66
Table of Contents
The benefit obligations and plan assets associated with the company’s defined benefit plans are measured on December 31.
| Pension benefits | Other post-retirement benefits |
|||||||||||||||||
| 2016 | 2015 | 2016 | 2015 | |||||||||||||||
| Assumptions used to determine benefit obligations |
||||||||||||||||||
| Discount rate |
3.75 | 4.00 | 3.75 | 4.00 | ||||||||||||||
| Long-term rate of compensation increase |
4.50 | 4.50 | 4.50 | 4.50 | ||||||||||||||
| millions of Canadian dollars | ||||||||||||||||||
| Change in projected benefit obligation |
||||||||||||||||||
| Projected benefit obligation at January 1 |
8,147 | 7,970 | 642 | 634 | ||||||||||||||
| Current service cost |
203 | 211 | 16 | 15 | ||||||||||||||
| Interest cost |
319 | 307 | 27 | 25 | ||||||||||||||
| Actuarial loss (gain) |
157 | 114 | 46 | (2 | ) | |||||||||||||
| Benefits paid (a) |
(470 | ) | (455 | ) | (25 | ) | (30 | ) | ||||||||||
| Projected benefit obligation at December 31 |
8,356 | 8,147 | 706 | 642 | ||||||||||||||
| Accumulated benefit obligation at December 31 |
7,681 | 7,506 | ||||||||||||||||
The discount rate for calculating year-end post-retirement liabilities is based on the yield for high-quality, long-term Canadian corporate bonds at year-end with an average maturity (or duration) approximately that of the liabilities. The measurement of the accumulated post-retirement benefit obligation assumes a health care cost trend rate of 4.50 percent in 2017 and subsequent years.
| Pension benefits | Other post-retirement benefits |
|||||||||||||||||
| millions of Canadian dollars | 2016 | 2015 | 2016 | 2015 | ||||||||||||||
| Change in plan assets |
||||||||||||||||||
| Fair value at January 1 |
7,260 | 6,807 | ||||||||||||||||
| Actual return (loss) on plan assets |
316 | 592 | ||||||||||||||||
| Company contributions |
163 | 225 | ||||||||||||||||
| Benefits paid (b) |
(380 | ) | (364 | ) | ||||||||||||||
| Fair value at December 31 |
7,359 | 7,260 | ||||||||||||||||
| Plan assets in excess of (less than) projected benefit obligation |
||||||||||||||||||
| Funded plans |
(444 | ) | (300 | ) | ||||||||||||||
| Unfunded plans |
(553 | ) | (587 | ) | (706 | ) | (642 | ) | ||||||||||
| Total (c) |
(997 | ) | (887 | ) | (706 | ) | (642 | ) | ||||||||||
| (a) | Benefit payments for funded and unfunded plans. |
| (b) | Benefit payments for funded plans only. |
| (c) | Fair value of assets less projected benefit obligation shown above. |
Funding of registered retirement plans complies with federal and provincial pension regulations, and the company makes contributions to the plans based on an independent actuarial valuation. In accordance with authoritative guidance relating to the accounting for defined pension and other post-retirement benefits plans, the underfunded status of the company’s defined benefit post-retirement plans was recorded as a liability in the balance sheet, and the changes in that funded status in the year in which the changes occurred was recognized through other comprehensive income.
67
Table of Contents
| Pension benefits | Other post-retirement benefits |
|||||||||||||||||
| millions of Canadian dollars | 2016 | 2015 | 2016 | 2015 | ||||||||||||||
| Amounts recorded in the consolidated balance sheet consist of: |
||||||||||||||||||
| Current liabilities |
(29 | ) | (30 | ) | (29 | ) | (29 | ) | ||||||||||
| Other long-term obligations |
(968 | ) | (857 | ) | (677 | ) | (613 | ) | ||||||||||
| Total recorded |
(997 | ) | (887 | ) | (706 | ) | (642 | ) | ||||||||||
| Amounts recorded in accumulated other comprehensive |
||||||||||||||||||
| Net actuarial loss (gain) |
2,461 | 2,382 | 197 | 164 | ||||||||||||||
| Prior service cost |
14 | 23 | - | - | ||||||||||||||
| Total recorded in accumulated other comprehensive income, before tax |
2,475 | 2,405 | 197 | 164 | ||||||||||||||
The company establishes the long-term expected rate of return on plan assets by developing a forward-looking long-term return assumption for each asset class, taking into account factors such as the expected real return for the specific asset class and inflation. A single, long-term rate of return is then calculated as the weighted average of the target asset allocation percentages and the long-term return assumption for each asset class. The 2016 long-term expected return of 5.5 percent used in the calculations of pension expense compares to an actual rate of return of 5.5 percent and 7.7 percent over the last 10- and 20-year periods respectively, ending December 31, 2016.
| Pension benefits | Other post-retirement benefits |
|||||||||||||||||||||||||
| millions of Canadian dollars | 2016 | 2015 | 2014 | 2016 | 2015 | 2014 | ||||||||||||||||||||
| Assumptions used to determine net periodic benefit cost for years ended December 31 (percent) |
||||||||||||||||||||||||||
| Discount rate |
4.00 | 3.75 | 4.75 | 4.00 | 3.75 | 4.75 | ||||||||||||||||||||
| Long-term rate of return on funded assets |
5.50 | 5.75 | 6.25 | - | - | - | ||||||||||||||||||||
| Long-term rate of compensation increase |
4.50 | 4.50 | 4.50 | 4.50 | 4.50 | 4.50 | ||||||||||||||||||||
| millions of Canadian dollars | ||||||||||||||||||||||||||
| Components of net periodic benefit cost |
||||||||||||||||||||||||||
| Current service cost |
203 | 211 | 152 | 16 | 15 | 9 | ||||||||||||||||||||
| Interest cost |
319 | 307 | 322 | 27 | 25 | 26 | ||||||||||||||||||||
| Expected return on plan assets |
(400 | ) | (392 | ) | (369 | ) | - | - | - | |||||||||||||||||
| Amortization of prior service cost |
9 | 16 | 23 | - | - | - | ||||||||||||||||||||
| Amortization of actuarial loss (gain) |
162 | 198 | 166 | 13 | 14 | 7 | ||||||||||||||||||||
| Net periodic benefit cost |
293 | 340 | 294 | 56 | 54 | 42 | ||||||||||||||||||||
| Changes in amounts recorded in accumulated other comprehensive income |
||||||||||||||||||||||||||
| Net actuarial loss (gain) |
241 | (86 | ) | 529 | 46 | (2 | ) | 123 | ||||||||||||||||||
| Amortization of net actuarial (loss) gain included |
(162 | ) | (198 | ) | (166 | ) | (13 | ) | (14 | ) | (7 | ) | ||||||||||||||
| Amortization of prior service cost included in net periodic benefit cost |
(9 | ) | (16 | ) | (23 | ) | - | - | - | |||||||||||||||||
| Total recorded in other comprehensive income |
70 | (300 | ) | 340 | 33 | (16 | ) | 116 | ||||||||||||||||||
| Total recorded in net periodic benefit cost and other comprehensive income, before tax |
363 | 40 | 634 | 89 | 38 | 158 | ||||||||||||||||||||
Costs for defined contribution plans, primarily the employee savings plan, were $44 million in 2016 (2015 - $43 million, 2014 - $40 million).
68
Table of Contents
A summary of the change in accumulated other comprehensive income is shown in the table below:
| Total pension and other post-retirement benefits |
||||||||||||
| millions of Canadian dollars | 2016 | 2015 | 2014 | |||||||||
| (Charge) credit to other comprehensive income, before tax |
(103 | ) | 316 | (456 | ) | |||||||
| Deferred income tax (charge) credit (note 17) |
34 | (85 | ) | 118 | ||||||||
| (Charge) credit to other comprehensive income, after tax |
(69 | ) | 231 | (338 | ) | |||||||
The company’s investment strategy for pension plan assets reflects a long-term view, a careful assessment of the risks inherent in various asset classes and broad diversification to reduce the risk of the portfolio. Consistent with the long-term nature of the liability, the plan assets are primarily invested in global, market-cap-weighted indexed equity and domestic indexed bond funds to diversify risk while minimizing costs. The equity funds hold Imperial Oil Limited stock only to the extent necessary to replicate the relevant equity index. The balance of the plan assets is largely invested in high-quality corporate and government debt securities. Studies are periodically conducted to establish the preferred target asset allocation. The target asset allocation for equity securities is 37 percent. The target allocation for debt securities is 58 percent. Plan assets for the remaining 5 percent are invested in venture capital partnerships that pursue a strategy of investment in U.S. and international early stage ventures.
The 2016 fair value of the pension plan assets, including the level within the fair value hierarchy, is shown in the table below:
| Fair value measurements at December 31, 2016, using: | ||||||||||
| millions of Canadian dollars | Total | Level 1 | Level 2 | Level 3 | Net Asset Value (a) | |||||
| Asset class |
||||||||||
| Equity securities |
- | - | ||||||||
| Canadian |
433 | 433 | ||||||||
| Non-Canadian |
2,448 | 2,448 | ||||||||
| Debt securities - Canadian |
||||||||||
| Corporate |
988 | 988 | ||||||||
| Government |
3,218 | 3,218 | ||||||||
| Asset backed |
- | - | ||||||||
| Equities – Venture capital |
241 | 241 | ||||||||
| Cash |
31 | 6 | 25 | |||||||
| Total plan assets at fair value |
7,359 | 6 | - | - | 7,353 | |||||
| (a) | Per ASU 2015-07, certain investments that are measured at fair value using the Net Asset Value (NAV) per share practical expedient have not been categorized in the fair value hierarchy. The fair value amounts presented in this table are intended to permit reconciliation of the fair value hierarchy to the total value of plan assets. |
69
Table of Contents
The 2015 fair value of the pension plan assets, including the level within the fair value hierarchy, is shown in the table below:
| Fair value measurements at December 31, 2015, using: | ||||||||||
| millions of Canadian dollars | Total | Level 1 | Level 2 | Level 3 | Net Asset Value (a) | |||||
| Asset class |
||||||||||
| Equity securities |
||||||||||
| Canadian |
469 | 469 | ||||||||
| Non-Canadian |
2,267 | 2,267 | ||||||||
| Debt securities - Canadian |
||||||||||
| Corporate |
984 | 984 | ||||||||
| Government |
3,251 | 3,251 | ||||||||
| Asset backed |
4 | 4 | ||||||||
| Equities – Venture capital |
272 | 272 | ||||||||
| Cash |
13 | 13 | ||||||||
| Total plan assets at fair value |
7,260 | 13 | - | - | 7,247 | |||||
| (a) | Per ASU 2015-07, certain investments that are measured at fair value using the Net Asset Value (NAV) per share practical expedient have been re-categorized from the fair value hierarchy. The fair value amounts presented in this table are intended to permit reconciliation of the fair value hierarchy to the total value of plan assets. |
A summary of pension plans with accumulated benefit obligations in excess of plan assets is shown in the table below:
| Pension benefits | ||||||||
| millions of Canadian dollars | 2016 | 2015 | ||||||
| For funded pension plans with accumulated benefit obligations in excess of plan assets: |
||||||||
| Projected benefit obligation |
- | - | ||||||
| Accumulated benefit obligation |
- | - | ||||||
| Fair value of plan assets |
- | - | ||||||
| Accumulated benefit obligation less fair value of plan assets |
- | - | ||||||
| For unfunded plans covered by book reserves: |
||||||||
| Projected benefit obligation |
553 | 587 | ||||||
| Accumulated benefit obligation |
525 | 560 | ||||||
Estimated 2017 amortization from accumulated other comprehensive income
| millions of Canadian dollars | Pension benefits | Other post-retirement benefits | ||||
| Net actuarial loss (gain) (a) |
179 | 14 | ||||
| Prior service cost (b) |
11 | - | ||||
| (a) | The company amortizes the net balance of actuarial loss (gain) as a component of net periodic benefit cost over the average remaining service period of active plan participants. |
| (b) | The company amortizes prior service cost on a straight-line basis. |
70
Table of Contents
Cash flows
Benefit payments expected in:
| millions of Canadian dollars | Pension benefits | Other post-retirement benefits |
||||||
|
|
||||||||
| 2017 |
420 | 30 | ||||||
| 2018 |
425 | 31 | ||||||
| 2019 |
435 | 31 | ||||||
| 2020 |
440 | 32 | ||||||
| 2021 |
440 | 33 | ||||||
| 2022 - 2026 |
2,201 | 175 | ||||||
|
|
||||||||
In 2017, the company expects to make cash contributions of about $217 million to its pension plans.
Sensitivities
A one percent change in the assumptions at which retirement liabilities could be effectively settled is as follows:
| Increase (decrease) millions of Canadian dollars |
One percent increase |
One percent decrease |
||||||
|
|
||||||||
| Rate of return on plan assets: |
||||||||
| Effect on net benefit cost, before tax |
(70) | 70 | ||||||
| Discount rate: |
||||||||
| Effect on net benefit cost, before tax |
(90) | 110 | ||||||
| Effect on benefit obligation |
(1,135) | 1,455 | ||||||
| Rate of pay increases: |
||||||||
| Effect on net benefit cost, before tax |
50 | (40) | ||||||
| Effect on benefit obligation |
230 | (195) | ||||||
|
|
||||||||
A one percent change in the assumed health-care cost trend rate would have the following effects:
| Increase (decrease) millions of Canadian dollars |
One percent increase |
One percent decrease |
||||||
|
|
||||||||
| Effect on service and interest cost components |
7 | (5) | ||||||
| Effect on benefit obligation |
85 | (70) | ||||||
|
|
||||||||
71
Table of Contents
5. Other long-term obligations
| millions of Canadian dollars | 2016 | 2015 | ||||||
|
|
||||||||
| Employee retirement benefits (a) (note 4) |
1,645 | 1,470 | ||||||
| Asset retirement obligations and other environmental liabilities (b) |
1,544 | 1,628 | ||||||
| Share-based incentive compensation liabilities (note 7) |
139 | 134 | ||||||
| Other obligations |
328 | 365 | ||||||
|
|
||||||||
| Total other long-term obligations |
3,656 | 3,597 | ||||||
|
|
||||||||
| (a) | Total recorded employee retirement benefits obligations also included $58 million in current liabilities (2015 – $59 million). |
| (b) | Total asset retirement obligations and other environmental liabilities also included $108 million in current liabilities (2015 – $116 million). |
Asset retirement obligations incurred in the current period were Level 3 fair value measurements. The following table summarizes the activity in the liability for asset retirement obligations:
| millions of Canadian dollars | 2016 | 2015 | ||||||
|
|
||||||||
| Balance as at January 1 |
1,571 | 1,292 | ||||||
| Additions (Deductions) |
(160) | 250 | ||||||
| Reductions due to property sales |
- | (12) | ||||||
| Accretion |
97 | 84 | ||||||
| Settlement |
(36) | (43) | ||||||
|
|
||||||||
| Balance as at December 31 |
1,472 | 1,571 | ||||||
|
|
||||||||
6. Derivatives and financial instruments
The company did not enter into any derivative instruments to offset exposures associated with hydrocarbon prices, foreign currency exchange rates and interest rates that arose from existing assets, liabilities and transactions in the past three years. The company did not engage in speculative derivative activities or derivative trading activities nor did it use derivatives with leveraged features. The company routinely reviews its position on derivatives and maintains a system of controls that includes a policy covering the authorization, reporting and monitoring of derivative activity.
The fair value of the company’s financial instruments is determined by reference to various market data and other appropriate valuation techniques. There are no material differences between the fair values of the company’s financial instruments and the recorded book value. The fair value hierarchy for long-term debt is primarily Level 2.
7. Share-based incentive compensation programs
Share-based incentive compensation programs are designed to retain selected employees, reward them for high performance and promote individual contribution to sustained improvement in the company’s future business performance and shareholder value. The nonemployee directors also participate in share-based incentive compensation programs.
Restricted stock units and deferred share units
Under the restricted stock unit plan, each unit entitles the recipient to the conditional right to receive from the company, upon exercise, an amount equal to the value of one common share of the company, based on the five-day average of the closing price of the company’s common shares on the Toronto Stock Exchange on and immediately prior to the exercise dates. Fifty percent of the units are exercised on the third anniversary of the grant date, and the remainder is exercised on the seventh anniversary of the grant date. The company may also issue units where either 50 percent of the units are exercisable on the fifth anniversary of the grant date and the remainder is exercisable on the tenth anniversary of the grant date, or where 50 percent of the units are exercisable on the fifth anniversary of the grant date and the remainder is exercisable on the tenth anniversary of the grant date, or date of retirement of the recipient, whichever is later.
The deferred share unit plan is made available to nonemployee directors. The nonemployee directors can elect to receive all or part of their eligible directors’ fees in units. The number of units granted is determined at the end of each calendar quarter by dividing the dollar amount of the nonemployee director’s fees for that calendar quarter elected to be received as deferred share units by the average closing price of the company’s shares for the five consecutive trading days (“average closing price”) immediately prior to the last day of the
72
Table of Contents
calendar quarter. Additional units are granted based on the cash dividend payable on the company’s shares divided by the average closing price immediately prior to the payment date for that dividend and multiplying the resulting number by the number of deferred share units held by the recipient, as adjusted for any share splits. Deferred share units cannot be exercised until after termination of service as a director, including termination due to death, and must be exercised in their entirety in one election no later than December 31 of the year following the year of termination of service. On the exercise date, the cash value to be received for the units is determined based on the average closing price immediately prior to the date of exercise, as adjusted for any share splits.
All units require settlement by cash payments with the following exceptions. The restricted stock unit program provides that, for units granted to Canadian residents, the recipient may receive one common share of the company per unit or elect to receive the cash payment for the units to be exercised on the seventh year anniversary of the grant date. For units where 50 percent are exercisable the fifth anniversary of the grant date and the remainder exercisable on either the tenth anniversary of grant, or the later of ten years following the grant date or the retirement date of the recipient, the recipient may receive one common share of the company per unit or elect to receive cash payment for all units to be exercised.
The company accounts for all units by using the fair-value-based method. The fair value of awards in the form of restricted stock and deferred share units is the market price of the company’s stock. Under this method, compensation expense related to the units of these programs is measured each reporting period based on the company’s current stock price and is recorded in the consolidated statement of income over the requisite service period of each award.
The following table summarizes information about these units for the year ended December 31, 2016:
| Restricted stock units |
Deferred share units |
|||||||
|
|
||||||||
| Outstanding at January 1, 2016 |
7,504,493 | 121,369 | ||||||
| Granted |
815,870 | 14,808 | ||||||
| Exercised |
(1,623,337 | ) | - | |||||
| Forfeited and cancelled |
(34,900 | ) | - | |||||
|
|
||||||||
| Outstanding at December 31, 2016 |
6,662,126 | 136,177 | ||||||
|
|
||||||||
In 2016, the compensation expense charged against income for these programs was $59 million (2015 - $35 million, 2014 - $90 million). Income tax benefit recognized in income related to compensation expense for the year was $24 million (2015 - $13 million, 2014 - $31 million). Cash payments of $79 million were made for these programs in 2016 (2015 - $78 million, 2014 - $94 million).
As of December 31, 2016, there was $123 million of total before-tax unrecognized compensation expense related to non-vested restricted stock units based on the company’s share price at the end of the current reporting period. The weighted average vesting period of non-vested restricted stock units is 3.5 years. All units under the deferred share programs have vested as of December 31, 2016.
73
Table of Contents
8. Investment and other income
Investment and other income includes gains and losses on asset sales as follows:
| millions of Canadian dollars | 2016 | 2015 | 2014 | |||||||||
|
|
||||||||||||
| Proceeds from asset sales |
3,021 | 142 | 851 | |||||||||
| Book value of assets sold |
777 | 45 | 155 | |||||||||
|
|
||||||||||||
| Gain (loss) on asset sales, before tax (a) (b) |
2,244 | 97 | 696 | |||||||||
|
|
||||||||||||
| Gain (loss) on asset sales, after tax (a) (b) |
1,908 | 79 | 526 | |||||||||
|
|
||||||||||||
| (a) | 2016 included a gain of $2.0 billion ($1.7 billion, after tax) from the sale of company-owned Esso-branded retail sites; and a gain of $161 million ($134 million, after tax) for the sale of Imperial’s general aviation business. |
| (b) | 2014 included a gain of $638 million ($478 million, after tax) for the sale of the company’s interest in producing conventional assets located in Boundary Lake, Cynthia/West Pembina and Rocky Mountain House. |
On December 20, 2016, the company entered into an agreement which will result in the sale and transition of the Port Credit refinery land. The sale, subject to final closing adjustments and other closing conditions, is expected to close in the first half of 2017.
9. Litigation and other contingencies
A variety of claims have been made against Imperial and its subsidiaries in a number of lawsuits. Management has regular litigation reviews, including updates from corporate and outside counsel, to assess the need for accounting recognition or disclosure of these contingencies. The company accrues an undiscounted liability for those contingencies where the incurrence of a loss is probable and the amount can be reasonably estimated. If a range of amounts can be reasonably estimated and no amount within the range is a better estimate than any other amount, then the minimum of the range is accrued. The company does not record liabilities when the likelihood that the liability has been incurred is probable but the amount cannot be reasonably estimated or when the liability is believed to be only reasonably possible or remote. For contingencies where an unfavourable outcome is reasonably possible and which are significant, the company discloses the nature of the contingency and, where feasible, an estimate of the possible loss. For purposes of the company’s contingency disclosures, “significant” includes material matters as well as other matters which management believes should be disclosed. Based on a consideration of all relevant facts and circumstances, the company does not believe the ultimate outcome of any currently pending lawsuits against the company will have a material adverse effect on the company’s operations, financial condition, or financial statements taken as a whole.
Additionally, the company has other commitments arising in the normal course of business for operating and capital needs, all of which are expected to be fulfilled with no adverse consequences material to the company’s operations or financial condition. Unconditional purchase obligations, as defined by accounting standards, are those long-term commitments that are non-cancelable or cancelable only under certain conditions and that third parties have used to secure financing for the facilities that will provide the contracted goods and services. During 2016, unconditional purchase obligations that existed in prior years no longer met the conditions for classification as unconditional purchase obligations and have been classified as “Other long-term purchase agreements” under “Commitments” in the Financial section on page 43. Total payments under unconditional purchase obligations were $125 million for 2015 and $112 million for 2014.
As a result of the completed sale of Imperial’s remaining company-owned Esso retail sites, the company was contingently liable at December 31, 2016, for guarantees relating to performance under contracts of other third-party obligations totaling $49 million.
74
Table of Contents
| thousands of shares | As at Dec 31 2016 |
As at Dec 31 2015 |
||||||
|
|
||||||||
| Authorized |
1,100,000 | 1,100,000 | ||||||
|
|
||||||||
From 1995 through 2016 the company purchased shares under twenty-one 12-month normal course issuer bid share repurchase programs, as well as an auction tender. Cumulative purchases to date under these programs totalled 906,545 thousand shares and $15,708 million. ExxonMobil’s participation in these programs maintained its ownership interest in Imperial at approximately 69.6 percent. On June 22, 2016, another 12-month normal course issuer bid program was announced with an allowable purchase of up to a maximum of one million shares.
The excess of the purchase cost over the stated value of shares purchased has been recorded as a distribution of earnings reinvested.
The company’s common share activities are summarized below:
| Thousands of shares |
Millions of dollars |
|||||||||||
|
|
||||||||||||
| Balance as at January 1, 2014 |
847,599 | 1,566 | ||||||||||
| Issued under employee share-based awards |
2 | - | ||||||||||
| Purchases at stated value |
(2) | - | ||||||||||
|
|
||||||||||||
| Balance as at December 31, 2014 |
847,599 | 1,566 | ||||||||||
| Issued under employee share-based awards |
1 | - | ||||||||||
| Purchases at stated value |
(1) | - | ||||||||||
|
|
||||||||||||
| Balance as at December 31, 2015 |
847,599 | 1,566 | ||||||||||
| Issued under employee share-based awards |
1 | - | ||||||||||
| Purchases at stated value |
(1) | - | ||||||||||
|
|
||||||||||||
| Balance as at December 31, 2016 |
847,599 | 1,566 | ||||||||||
|
|
||||||||||||
|
The following table provides the calculation of basic and diluted earnings per share:
|
| |||||||||||
| 2016 | 2015 | 2014 | ||||||||||
|
|
||||||||||||
| Net income (loss) per common share – basic |
||||||||||||
| Net income (loss) (millions of Canadian dollars) |
2,165 | 1,122 | 3,785 | |||||||||
| Weighted average number of common shares outstanding (millions of shares) |
847.6 | 847.6 | 847.6 | |||||||||
| Net income (loss) per common share (dollars) |
2.55 | 1.32 | 4.47 | |||||||||
|
|
||||||||||||
| Net income (loss) per common share - diluted |
||||||||||||
| Net income (loss) (millions of Canadian dollars) |
2,165 | 1,122 | 3,785 | |||||||||
| Weighted average number of common shares outstanding (millions of shares) |
847.6 | 847.6 | 847.6 | |||||||||
| Effect of employee share-based awards (millions of shares) |
2.9 | 3.0 | 3.0 | |||||||||
|
|
||||||||||||
| Weighted average number of common shares outstanding, assuming
dilution |
850.5 | 850.6 | 850.6 | |||||||||
| Net income (loss) per common share (dollars) |
2.55 | 1.32 | 4.45 | |||||||||
|
|
||||||||||||
75
Table of Contents
11. Miscellaneous financial information
In 2016, net income included an after-tax gain of $5 million (2015 – $39 million loss, 2014 – $29 million gain) attributable to the effect of changes in last-in, first-out (LIFO) inventories. The replacement cost of inventories was estimated to exceed their LIFO carrying values at December 31, 2016 by about $1 billion (2015 – $427 million). Inventories of crude oil and products at year-end consisted of the following:
| millions of Canadian dollars | 2016 | 2015 | ||||||||||
|
|
||||||||||||
| Crude oil |
558 | 690 | ||||||||||
| Petroleum products |
300 | 443 | ||||||||||
| Chemical products |
51 | 51 | ||||||||||
| Natural gas and other |
40 | 6 | ||||||||||
|
|
||||||||||||
| Total inventories of crude oil and products |
949 | 1,190 | ||||||||||
|
|
||||||||||||
Net research and development costs charged to expenses in 2016 were $152 million (2015 – $149 million, 2014 – $128 million). These costs are included in expenses due to the uncertainty of future benefits.
Accounts payable and accrued liabilities included accrued taxes other than income taxes of $396 million at December 31, 2016 (2015 – $378 million).
12. Financing costs and additional notes and loans payable information
| millions of Canadian dollars | 2016 | 2015 | 2014 | |||||||||
|
|
||||||||||||
| Debt-related interest |
121 | 102 | 82 | |||||||||
| Capitalized interest |
(49 | ) | (68 | ) | (82) | |||||||
|
|
||||||||||||
| Net interest expense |
72 | 34 | - | |||||||||
| Other interest |
(7 | ) | 5 | 4 | ||||||||
|
|
||||||||||||
| Total financing costs (a) |
65 | 39 | 4 | |||||||||
|
|
||||||||||||
| (a) | Cash interest payments in 2016 were $73 million (2015 – $74 million, 2014 – $82 million). The weighted average interest rate on short-term borrowings in 2016 was 0.8 percent (2015 – 0.8 percent, 2014 – 1.1 percent). Average effective rate on the long-term borrowings with ExxonMobil in 2016 was 1.0 percent (2015 - 1.0 percent, 2014 - 1.2 percent). |
As at December 31, 2016, the company had borrowed $75 million under an arrangement with an affiliated company of ExxonMobil that provides for a non-interest bearing, revolving demand loan from ExxonMobil to the company of up to $75 million. The loan represents ExxonMobil’s share of a working capital facility required to support purchasing, marketing and transportation arrangements for crude oil and diluent products undertaken by Imperial on behalf of ExxonMobil.
In October 2016, the company decreased the amount of its unused committed long-term line of credit from $500 million to $250 million and extended the maturity date to November 2018. In December 2016, the company decreased the amount of its unused committed short-term line of credit from $500 million to $250 million and extended the maturity date to December 2017.
At December 31, 2016, the company held non-cancelable operating leases covering primarily storage tanks, rail cars and marine vessels, with minimum undiscounted lease commitments totaling $275 million as indicated in the following table:
| Payments due by period | ||||||||||||||||||||||||||||
| millions of Canadian dollars | 2017 | 2018 | 2019 | 2020 | 2021 | After 2021 |
Total | |||||||||||||||||||||
|
|
||||||||||||||||||||||||||||
| Lease payments under minimum commitments (a) |
139 | 84 | 45 | 2 | 2 | 3 | 275 | |||||||||||||||||||||
|
|
||||||||||||||||||||||||||||
| (a) | Net rental cost under cancelable and non-cancelable operating leases incurred in 2016 was $253 million (2015 - $311 million, 2014 - $315 million). Related rental income was not material. |
76
Table of Contents
| millions of Canadian dollars | As at Dec 31 2016 |
As at Dec 31 2015 |
||||||
|
|
||||||||
| Long-term debt (a) |
4,447 | 5,952 | ||||||
| Capital leases (b) |
585 | 612 | ||||||
|
|
||||||||
| Total long-term debt |
5,032 | 6,564 | ||||||
|
|
||||||||
| (a) | Borrowed under an existing agreement with an affiliated company of ExxonMobil that provides for a long-term, variable-rate loan from ExxonMobil to the company of up to $7.75 billion at interest equivalent to Canadian market rates. The agreement is effective until July 31, 2020, cancelable if ExxonMobil provides at least 370 days advance written notice. |
| (b) | Capital leases are primarily associated with transportation facilities and services agreements. The average imputed rate was 6.9 percent in 2016 (2015 – 5.8 percent). Total capitalized lease obligations also include $27 million in current liabilities (2015 - $28 million). Principal payments on capital leases of approximately $25 million per year are due in each of the next four years after December 31, 2016. |
During 2016, the company decreased its long-term debt by $1,505 million by partially repaying an existing facility with an affiliated company of ExxonMobil.
77
Table of Contents
15. Accounting for suspended exploratory well costs
The company continues capitalization of exploratory well costs when the well has found a sufficient quantity of reserves to justify its completion as a producing well and the company is making sufficient progress assessing the reserves and the economic and operating viability of the project. The term “project” as used in this report can refer to a variety of different activities and does not necessarily have the same meaning as in any government payment transparency reports.
The following two tables provide details of the changes in the balance of suspended exploratory well costs as well as an aging summary of those costs.
Change in capitalized suspended exploratory well costs:
| millions of Canadian dollars | 2016 | 2015 | 2014 | |||||||||
|
|
||||||||||||
| Balance as at January 1 |
167 | 167 | 173 | |||||||||
| Additions pending the determination of proved reserves |
- | - | 5 | |||||||||
| Charged to expense |
(24 | ) | - | - | ||||||||
| Reclassification to wells, facilities and equipment based on the determination |
- | - | (11) | |||||||||
|
|
||||||||||||
| Balance as at December 31 |
143 | 167 | 167 | |||||||||
|
|
||||||||||||
|
Period end capitalized suspended exploratory well costs:
|
||||||||||||
| millions of Canadian dollars | 2016 | 2015 | 2014 | |||||||||
|
|
||||||||||||
| Capitalized for a period of one year or less |
- | - | - | |||||||||
| Capitalized for a period of between one and ten years |
143 | 167 | 167 | |||||||||
|
|
||||||||||||
| Capitalized for a period of greater than one year |
143 | 167 | 167 | |||||||||
|
|
||||||||||||
| Total |
143 | 167 | 167 | |||||||||
|
|
||||||||||||
|
Exploration activity often involves drilling multiple wells, over a number of years, to fully evaluate a project. The table below provides a numerical breakdown of the number of projects with suspended exploratory well costs which had their first capitalized well drilled in the preceding 12 months and those that have had exploratory well costs capitalized for a period greater than 12 months.
|
| |||||||||||
| 2016 | 2015 | 2014 | ||||||||||
|
|
||||||||||||
| Number of projects with first capitalized well drilled in the preceding 12 months |
- | - | - | |||||||||
| Number of projects that have exploratory well costs capitalized for a period |
1 | 1 | 1 | |||||||||
|
|
||||||||||||
| Total |
1 | 1 | 1 | |||||||||
|
|
||||||||||||
Exploration activity on the Horn River project with suspended well costs has been completed and the company continues to evaluate development alternatives to tie into planned infrastructure.
78
Table of Contents
16. Transactions with related parties
Revenues and expenses of the company also include the results of transactions with affiliated companies of ExxonMobil in the normal course of operations. These were conducted on terms comparable to those which would have been conducted with unrelated parties and primarily consisted of the purchase and sale of crude oil, natural gas, petroleum and chemical products, as well as technical, engineering and research and development costs. Transactions with ExxonMobil also included amounts paid and received in connection with the company’s participation in a number of upstream activities conducted jointly in Canada.
In addition, the company has existing agreements with ExxonMobil to:
| a) | Provide computer and customer support services to the company and to share common business and operational support services that allow the companies to consolidate duplicate work and systems; |
| b) | Operate certain western Canada production properties owned by ExxonMobil as well as provide for the delivery of management, business and technical services to ExxonMobil in Canada. These agreements are designed to provide organizational efficiencies and to reduce costs. No separate legal entities were created from these arrangements. Separate books of account continue to be maintained for the company and ExxonMobil. The company and ExxonMobil retain ownership of their respective assets, and there is no impact on operations or reserves; |
| c) | Provide for the delivery of management, business and technical services to Syncrude Canada Ltd. by ExxonMobil; and |
| d) | Provide for the option of equal participation in new upstream opportunities. |
Certain charges from ExxonMobil have been capitalized; they are not material in the aggregate.
The amounts of purchases and sales by Imperial in 2016, with ExxonMobil, were $2,187 million and $2,315 million respectively.
As at December 31, 2016, the company had outstanding long-term loans of $4,447 million (2015 – $5,952 million) and short-term loans of $75 million (2015 – $75 million) from ExxonMobil (see note 14, long-term debt, on page 77 and note 12, financing costs and additional notes and loans payable information, on page 76 for further details).
Imperial has other related party transactions not detailed in note 16, as they are not significant.
79
Table of Contents
17. Other comprehensive income (loss) information
Changes in accumulated other comprehensive income (loss):
| millions of Canadian dollars | 2016 | 2015 | 2014 | |||||||
|
| ||||||||||
| Balance at January 1 |
(1,828 | ) | (2,059 | ) | (1,721) | |||||
| Post-retirement benefits liability adjustment: |
||||||||||
| Current period change excluding amounts reclassified from accumulated other comprehensive income |
(210 | ) | 64 | (483) | ||||||
| Amounts reclassified from accumulated other comprehensive income |
141 | 167 | 145 | |||||||
|
| ||||||||||
| Balance at December 31 |
(1,897 | ) | (1,828 | ) | (2,059) | |||||
|
| ||||||||||
|
Amounts reclassified out of accumulated other comprehensive income (loss) - before-tax income (expense):
| ||||||||||
| millions of Canadian dollars | 2016 | 2015 | 2014 | |||||||
|
| ||||||||||
| Amortization of post-retirement benefits liability adjustment included in |
(184 | ) | (228 | ) | (196) | |||||
|
| ||||||||||
| (a) This accumulated other comprehensive income component is included in the computation of net periodic benefit cost (note 4).
Income tax expense (credit) for components of other comprehensive income (loss):
| ||||||||||
| millions of Canadian dollars | 2016 | 2015 | 2014 | |||||||
|
| ||||||||||
| Post-retirement benefits liability adjustments: |
||||||||||
| Post-retirement benefits liability adjustment (excluding amortization) |
(77 | ) | 24 | (169) | ||||||
| Amortization of post-retirement benefits liability adjustment included in |
43 | 61 | 51 | |||||||
|
| ||||||||||
| Total |
(34 | ) | 85 | (118) | ||||||
|
| ||||||||||
80
Table of Contents
Supplemental information on oil and gas exploration and production activities (unaudited)
The information on pages 81 to 82 excludes items not related to oil and natural gas extraction, such as administrative and general expenses, pipeline operations, gas plant processing fees and gains or losses on asset sales. The company’s 25 percent interest in proved synthetic oil reserves in the Syncrude joint-venture is included as part of the company’s total proved oil and gas reserves and in the calculation of the standardized measure of discounted future cash flows, in accordance with U.S. Securities and Exchange Commission and U.S. Financial Accounting Standards Board rules. Results of operations, costs incurred in property acquisitions, exploration and development activities, and capitalized costs include the company’s share of Syncrude, Kearl and other unproved mineable acreages in the following tables.
Results of operations
| millions of Canadian dollars | 2016 | 2015 | 2014 | |||||||||
|
|
||||||||||||
| Sales to customers (a) |
2,210 | 2,483 | 2,921 | |||||||||
| Intersegment sales (a) (b) |
1,791 | 1,855 | 3,862 | |||||||||
|
|
||||||||||||
| 4,001 | 4,338 | 6,783 | ||||||||||
| Production expenses |
3,657 | 3,727 | 3,860 | |||||||||
| Exploration expenses |
94 | 73 | 67 | |||||||||
| Depreciation and depletion |
1,275 | 1,102 | 789 | |||||||||
| Income taxes |
(366 | ) | 174 | 513 | ||||||||
|
|
||||||||||||
| Results of operations |
(659 | ) | (738 | ) | 1,554 | |||||||
|
|
||||||||||||
The amounts reported as costs incurred in property acquisitions, exploration and development activities include both capitalized costs and costs charged to expense during the year. Costs incurred also include new asset retirement obligations established in the current year, as well as increases or decreases to the asset retirement obligation resulting from changes in cost estimates or abandonment date.
Costs incurred in property acquisitions, exploration and development activities
| millions of Canadian dollars | 2016 | 2015 | 2014 | |||||||||
|
|
||||||||||||
| Property costs (c) |
||||||||||||
| Proved |
1 | - | - | |||||||||
| Unproved |
- | - | - | |||||||||
| Exploration costs |
70 | 76 | 74 | |||||||||
| Development costs |
543 | 3,035 | 4,710 | |||||||||
|
|
||||||||||||
| Total costs incurred in property acquisitions, exploration and development activities |
614 | 3,111 | 4,784 | |||||||||
|
|
||||||||||||
| (a) | Sales to customers or intersegment sales do not include the sale of natural gas and natural gas liquids purchased for resale, as well as royalty payments. These items are reported gross in note 2 in “operating revenues”, “intersegment sales” and in “purchases of crude oil and products”. |
| (b) | Sales of crude oil to consolidated affiliates are at market value, using posted field prices. Sales of natural gas liquids to consolidated affiliates are at prices estimated to be obtainable in a competitive, arm’s-length transaction. |
| (c) | “Property costs” are payments for rights to explore for petroleum and natural gas and for purchased reserves (acquired tangible and intangible assets such as gas plants, production facilities and producing-well costs are included under “producing assets”). “Proved” represents areas where successful drilling has delineated a field capable of production. “Unproved” represents all other areas. |
81
Table of Contents
Capitalized costs
| millions of Canadian dollars | 2016 | 2015 | ||||
|
| ||||||
| Property costs (a) |
||||||
| Proved |
2,194 | 2,172 | ||||
| Unproved |
2,466 | 2,542 | ||||
| Producing assets |
36,827 | 35,769 | ||||
| Incomplete construction |
2,287 | 2,862 | ||||
|
| ||||||
| Total capitalized cost |
43,774 | 43,345 | ||||
| Accumulated depreciation and depletion |
(12,243 | ) | (10,975) | |||
|
| ||||||
| Net capitalized costs |
31,531 | 32,370 | ||||
|
| ||||||
| (a) | “Property costs” are payments for rights to explore for petroleum and natural gas and for purchased reserves (acquired tangible and intangible assets such as gas plants, production facilities and producing-well costs are included under “producing assets”). “Proved” represents areas where successful drilling has delineated a field capable of production. “Unproved” represents all other areas. |
Standardized measure of discounted future cash flows
As required by the U.S. Financial Accounting Standards Board, the standardized measure of discounted future net cash flows is computed by applying first-day-of-the-month average prices, year-end costs and legislated tax rates and a discount factor of 10 percent to net proved reserves. The standardized measure includes costs for future dismantlement, abandonment and remediation obligations. The company believes the standardized measure does not provide a reliable estimate of the company’s expected future cash flows to be obtained from the development and production of its oil and gas properties or of the value of its proved oil and gas reserves. The standardized measure is prepared on the basis of certain prescribed assumptions, including first-day-of-the-month average prices, which represent discrete points in time and therefore may cause significant variability in cash flows from year to year as prices change.
Standardized measure of discounted future net cash flows related to proved oil and gas reserves
| millions of Canadian dollars | 2016 | 2015 | 2014 | |||||||
|
| ||||||||||
| Future cash flows |
53,743 | 168,482 | 292,376 | |||||||
| Future production costs |
(36,100 | ) | (122,188 | ) | (127,070) | |||||
| Future development costs |
(11,917 | ) | (36,048 | ) | (39,814) | |||||
| Future income taxes |
(1,263 | ) | (3,333 | ) | (27,853) | |||||
|
| ||||||||||
| Future net cash flows |
4,463 | 6,913 | 97,639 | |||||||
| Annual discount of 10 percent for estimated timing of cash flows |
(1,717 | ) | (3,683 | ) | (66,582) | |||||
|
| ||||||||||
| Discounted future cash flows |
2,746 | 3,230 | 31,057 | |||||||
|
| ||||||||||
|
Changes in standardized measure of discounted future net cash flows related to proved oil and gas reserves
| ||||||||||
| Balance at beginning of year |
3,230 | 31,057 | 24,910 | |||||||
| Changes resulting from: |
||||||||||
| Sales and transfers of oil and gas produced, net of production costs |
(718 | ) | (1,134 | ) | (3,282) | |||||
| Net changes in prices, development costs and production costs (a) |
(1,468 | ) | (37,945 | ) | 655 | |||||
| Extensions, discoveries, additions and improved recovery, less related costs |
14 | 29 | (374) | |||||||
| Development costs incurred during the year |
651 | 2,250 | 4,414 | |||||||
| Revisions of previous quantity estimates |
56 | 972 | 4,907 | |||||||
| Accretion of discount |
417 | 1,683 | 1,634 | |||||||
| Net change in income taxes |
564 | 6,318 | (1,807) | |||||||
|
| ||||||||||
| Net change |
(484 | ) | (27,827 | ) | 6,147 | |||||
|
| ||||||||||
| Balance at end of year |
2,746 | 3,230 | 31,057 | |||||||
|
| ||||||||||
(a) SEC rules require the company’s reserves to be calculated on the basis of average first-of-month oil and natural gas prices during the reporting year. As a result of low prices during 2016, under the SEC definition of proved reserves, certain quantities of bitumen that qualified as proved reserves in prior years did not qualify as proved reserves at year-end 2016. Future net cash flows for these quantities are excluded from the 2016 “Standardized measure of discounted future cash flows”. Substantially all of this reduction in discounted future net cash flows since December 31, 2015 is reflected in the line “Net change in prices, development costs and production costs”, in the table above.
82
Table of Contents
Net proved reserves (a)
| Liquids (b) | Natural gas | Synthetic oil | Bitumen | Total oil-equivalent |
||||||||||||||||
|
|
|
|||||||||||||||||||
| millions of barrels |
billions of cubic feet |
millions of barrels |
millions of barrels |
millions of barrels |
||||||||||||||||
| Beginning of year 2014 |
62 | 678 | 579 | 2,867 | 3,622 | |||||||||||||||
| Revisions |
1 | 9 | (23 | ) | 466 | 445 | ||||||||||||||
| Improved recovery |
- | - | - | - | - | |||||||||||||||
| (Sale) purchase of reserves in place |
(14 | ) | (48 | ) | - | - | (22) | |||||||||||||
| Discoveries and extensions |
3 | 45 | - | - | 10 | |||||||||||||||
| Production |
(6 | ) | (57 | ) | (22 | ) | (59 | ) | (96) | |||||||||||
|
|
||||||||||||||||||||
| End of year 2014 |
46 | 627 | 534 | 3,274 | 3,959 | |||||||||||||||
| Revisions |
(10 | ) | (28 | ) | 68 | 331 | 384 | |||||||||||||
| Improved recovery |
- | - | - | - | - | |||||||||||||||
| (Sale) purchase of reserves in place |
1 | 11 | - | - | 3 | |||||||||||||||
| Discoveries and extensions |
2 | 18 | - | - | 5 | |||||||||||||||
| Production |
(5 | ) | (45 | ) | (21 | ) | (90 | ) | (124) | |||||||||||
|
|
||||||||||||||||||||
| End of year 2015 |
34 | 583 | 581 | 3,515 | 4,227 | |||||||||||||||
| Revisions |
3 | (58 | ) | 8 | (2,720 | ) | (2,719) | |||||||||||||
| Improved recovery |
- | - | - | - | - | |||||||||||||||
| (Sale) purchase of reserves in place |
- | - | - | - | - | |||||||||||||||
| Discoveries and extensions |
2 | 15 | - | - | 4 | |||||||||||||||
| Production |
(4 | ) | (45 | ) | (25 | ) | (94 | ) | (130) | |||||||||||
|
|
||||||||||||||||||||
| End of year 2016 |
35 | 495 | 564 | 701 | 1,382 | |||||||||||||||
|
|
||||||||||||||||||||
| Net proved developed reserves included above, as of |
| |||||||||||||||||||
| January 1, 2014 |
55 | 368 | 579 | 1,417 | 2,113 | |||||||||||||||
| December 31, 2014 |
36 | 300 | 534 | 1,635 | 2,255 | |||||||||||||||
| December 31, 2015 |
23 | 283 | 581 | 3,063 | 3,714 | |||||||||||||||
| December 31, 2016 |
19 | 263 | 564 | 436 | 1,063 | |||||||||||||||
| Net proved undeveloped reserves included above, as of |
| |||||||||||||||||||
| January 1, 2014 |
7 | 310 | - | 1,450 | 1,509 | |||||||||||||||
| December 31, 2014 |
10 | 327 | - | 1,639 | 1,704 | |||||||||||||||
| December 31, 2015 |
11 | 300 | - | 452 | 513 | |||||||||||||||
| December 31, 2016 |
16 | 232 | - | 265 | 319 | |||||||||||||||
|
|
||||||||||||||||||||
| (a) | Net reserves are the company’s share of reserves after deducting the shares of mineral owners or governments or both. All reported reserves are located in Canada. Reserves of natural gas are calculated at a pressure of 14.73 pounds per square inch at 60°F. |
| (b) | Liquids include crude, condensate and natural gas liquids (NGLs). NGL proved reserves are not material and are therefore included under liquids. |
| (c) | Gas converted to oil-equivalent at six million cubic feet per one thousand barrels. |
The information above describes changes during the years and balances of proved oil and gas reserves at year-end 2014, 2015 and 2016. The definitions used are in accordance with the U.S. Securities and Exchange Commission’s Rule 4-10 (a) of Regulation S-X.
Proved oil and natural gas reserves are those quantities of oil and gas, which, by analysis of geoscience and engineering data, can be estimated with reasonable certainty to be economically producible – from a given date forward, from known reservoirs, and under existing economic conditions, operating methods and government regulations – prior to the time at which contracts providing the right to operate expire. In some cases, substantial new investments in additional wells and other facilities will be required to recover these proved reserves.
In accordance with SEC rules, the year-end reserves volumes as well as the reserves change categories shown in the proved reserves tables are required to be calculated on the basis of average prices during the 12-month period prior to the ending date of the period covered by the report, determined as an unweighted
83
Table of Contents
arithmetic average of the first-day-of-the-month price for each month within such period. These reserves quantities were also used in calculating unit-of-production depreciation rates and in calculating the standardized measure of discounted net cash flow.
Revisions can include upward or downward changes in previously estimated volumes of proved reserves for existing fields due to the evaluation or re-evaluation of already available geologic, reservoir or production data; new geologic, reservoir or production data; or changes in the average of first-of-month oil and natural gas prices and / or costs that are used in the estimation of reserves. Revisions can result from significant changes in either development strategy or production equipment / facility capacity.
In 2014, upward revisions of proved developed and undeveloped bitumen reserves were primarily associated with the conclusion of technical studies supporting lengthening of the expected useful life of Kearl operating assets under routine maintenance and sustaining capital conditions.
In 2015, upward revisions of proved developed bitumen reserves were associated with migration of the Kearl expansion project from proved undeveloped, and improved performance demonstrated at Kearl. As well, upward revision to bitumen and synthetic oil were associated with lower royalty obligations driven by lower pricing.
In 2016, downward revisions of proved developed and undeveloped bitumen reserves were a result of low prices.
As a result of low prices during 2016, under the U.S. Securities and Exchange Commission definition of proved reserves, certain quantities of bitumen that qualified as proved reserves in prior years did not qualify as proved reserves at year-end 2016. Amounts no longer qualifying as proved reserves include the entire 2.5 billion barrels of bitumen at Kearl and approximately 0.2 billion barrels of bitumen at Cold Lake. Among the factors that would result in these amounts being recognized again as proved reserves at some point in the future are a recovery in average price levels, a further decline in costs, and / or operating efficiencies. Under the terms of certain contractual arrangements or government royalty regimes, lower prices can also increase proved reserves attributable to Imperial. The company does not expect the downward revision of reported proved reserves under the U.S. Securities and Exchange Commission definitions to affect the operation of the underlying projects or to alter its outlook for future production volumes.
Net proved reserves are determined by deducting the estimated future share of mineral owners or governments or both. For liquids and natural gas, net proved reserves are based on estimated future royalty rates as of the date the estimate is made incorporating the applicable governments’ oil and gas royalty regimes. For bitumen, net proved reserves are based on the company’s best estimate of average royalty rates over the remaining life of each of the Cold Lake and Kearl fields, and they incorporate the Alberta government’s revised oil sands royalty regime. For synthetic oil, net proved reserves are based on the company’s best estimate of average royalty rates over the remaining life of the project, and they incorporate the Alberta government’s revised oil sands royalty regime. In all cases, actual future royalty rates may vary with production, price and costs.
Net proved developed reserves are those volumes that are expected to be recovered through existing wells and facilities with existing equipment and operating methods or in which the cost of the required equipment is relatively minor compared to the cost of a new well or facility. Net proved undeveloped reserves are those volumes that are expected to be recovered as a result of future investments to drill new wells, to recomplete existing wells and/or to install facilities to collect and deliver the production from existing and future wells and facilities.
No independent qualified reserves evaluator or auditor was involved in the preparation of the reserves data.
84
Table of Contents
Quarterly financial and stock trading data (a)
| 2016 | 2015 | |||||||||||||||||||||||||||||||
| three months ended | three months ended | |||||||||||||||||||||||||||||||
| Dec. 31
|
Sept. 30
|
June 30
|
Mar. 31
|
Dec. 31
|
Sept. 30
|
June 30
|
Mar. 31
|
|||||||||||||||||||||||||
|
|
||||||||||||||||||||||||||||||||
| Financial data (millions of Canadian dollars) |
|
|||||||||||||||||||||||||||||||
| Total revenues and other income |
8,442 | 7,442 | 6,248 | 5,222 | 6,229 | 7,155 | 7,301 | 6,203 | ||||||||||||||||||||||||
| Total expenses |
6,779 | 6,260 | 6,500 | 5,371 | 6,100 | 6,518 | 6,705 | 5,642 | ||||||||||||||||||||||||
|
|
||||||||||||||||||||||||||||||||
| Income (loss) before income taxes |
1,663 | 1,182 | (252 | ) | (149 | ) | 129 | 637 | 596 | 561 | ||||||||||||||||||||||
| Income taxes |
219 | 179 | (71 | ) | (48 | ) | 27 | 158 | 476 | 140 | ||||||||||||||||||||||
|
|
||||||||||||||||||||||||||||||||
| Net income (loss) |
1,444 | 1,003 | (181 | ) | (101 | ) | 102 | 479 | 120 | 421 | ||||||||||||||||||||||
|
|
||||||||||||||||||||||||||||||||
| Segmented net income (loss) (millions of Canadian dollars) |
| |||||||||||||||||||||||||||||||
| Upstream |
103 | (26 | ) | (290 | ) | (448 | ) | (289 | ) | (52 | ) | (174 | ) | (189) | ||||||||||||||||||
| Downstream |
1,361 | 1,002 | 71 | 320 | 352 | 454 | 215 | 565 | ||||||||||||||||||||||||
| Chemical |
27 | 56 | 55 | 49 | 74 | 78 | 69 | 66 | ||||||||||||||||||||||||
| Corporate and Other |
(47 | ) | (29 | ) | (17 | ) | (22 | ) | (35 | ) | (1 | ) | 10 | (21) | ||||||||||||||||||
|
|
||||||||||||||||||||||||||||||||
| Net income (loss) |
1,444 | 1,003 | (181 | ) | (101 | ) | 102 | 479 | 120 | 421 | ||||||||||||||||||||||
|
|
||||||||||||||||||||||||||||||||
| Per-share information (Canadian dollars) |
| |||||||||||||||||||||||||||||||
| Net income (loss) per share - basic |
1.70 | 1.18 | (0.21 | ) | (0.12 | ) | 0.12 | 0.56 | 0.14 | 0.50 | ||||||||||||||||||||||
| Net income (loss) per share - diluted |
1.70 | 1.18 | (0.21 | ) | (0.12 | ) | 0.12 | 0.56 | 0.14 | 0.50 | ||||||||||||||||||||||
| Dividends per share - declared |
0.15 | 0.15 | 0.15 | 0.14 | 0.14 | 0.14 | 0.13 | 0.13 | ||||||||||||||||||||||||
|
|
||||||||||||||||||||||||||||||||
| Share prices (Canadian dollars) (b) |
||||||||||||||||||||||||||||||||
| Toronto Stock Exchange |
||||||||||||||||||||||||||||||||
| High |
48.72 | 42.10 | 43.21 | 46.25 | 46.27 | 49.40 | 55.37 | 52.06 | ||||||||||||||||||||||||
| Low |
40.76 | 38.41 | 38.71 | 37.25 | 39.30 | 40.55 | 46.51 | 44.08 | ||||||||||||||||||||||||
| Close |
46.71 | 41.04 | 40.88 | 43.39 | 45.08 | 42.28 | 48.25 | 50.55 | ||||||||||||||||||||||||
| NYSE MKT (U.S. dollars) (b) |
||||||||||||||||||||||||||||||||
| High |
36.85 | 32.42 | 34.11 | 35.48 | 35.40 | 38.88 | 45.60 | 43.35 | ||||||||||||||||||||||||
| Low |
31.07 | 29.26 | 29.54 | 25.55 | 28.66 | 30.35 | 37.94 | 35.69 | ||||||||||||||||||||||||
| Close |
34.76 | 31.32 | 31.56 | 33.40 | 32.52 | 31.61 | 38.62 | 39.88 | ||||||||||||||||||||||||
|
|
||||||||||||||||||||||||||||||||
| Shares traded (thousands) (c) |
70,560 | 67,098 | 101,121 | 112,059 | 100,077 | 104,678 | 88,186 | 95,600 | ||||||||||||||||||||||||
|
|
||||||||||||||||||||||||||||||||
| (a) | Quarterly data has not been audited by the company’s independent auditors. |
| (b) | Imperial’s shares are listed on the Toronto Stock Exchange. The company’s shares also trade in the United States of America on the NYSE MKT LLC. Imperial has unlisted privileges on the NYSE MKT LLC. The symbol on these exchanges for Imperial’s common shares is IMO. Share prices were obtained from stock exchange records. U.S. dollar share price presented is based on consolidated U.S. market data. |
| (c) | The number of shares traded is based on transactions on the above stock exchanges and through other designated exchanges and published markets in Canada. |
85
Table of Contents
| Table of contents | Page | |||
| 87 | ||||
| 88 | ||||
| 95 | ||||
| 96 | ||||
| 96 | ||||
| 97 | ||||
| 97 | ||||
| 97 | ||||
| 98 | ||||
| 99 | ||||
| 100 | ||||
| 100 | ||||
| 101 | ||||
| 102 | ||||
| 102 | ||||
| 103 | ||||
| 104 | ||||
| 104 | ||||
| 105 | ||||
| 110 | ||||
| 117 | ||||
| 118 | ||||
| 119 | ||||
| 119 | ||||
| 119 | ||||
| 120 | ||||
| 120 | ||||
| 121 | ||||
| 121 | ||||
| 122 | ||||
| Letter to Shareholders from the executive resources committee on executive compensation |
124 | |||
| 126 | ||||
| 127 | ||||
| 130 | ||||
| Compensation decision making process and considerations for named executive officers |
136 | |||
| 142 | ||||
| Appendix |
148 | |||
| 148 | ||||
86
Table of Contents
The director nominee tables on the following pages provide information on the seven nominees proposed for election to the board of directors of the company. All of the nominees are now directors and have been since the dates indicated.
Included in these tables is information relating to the director nominees’ biographies, independence status, expertise, committee memberships, attendance, public board memberships, non-profit sector affiliations and shareholdings in the company, as well as any shareholdings in Exxon Mobil Corporation. The information is as of February 8, 2017, the effective date of this circular, unless otherwise indicated.
For more information on our director nominees, please see the Statement of corporate governance practice starting on page 97.
87
Table of Contents
|
Director Nominee
| ||||||||||||
|
K.T. (Krystyna) Hoeg
Toronto, Ontario, Canada
Age: 67
Current Position: Nonemployee director
Independent
Director since: May 1, 2008
Normally ineligible for re-election in 2022
Skills and experience: ● Leadership of large organizations ● Project management ● Global experience ● Strategy development ● Audit committee financial expert ● Financial expertise ● Executive compensation
Voting Results of 2016 Annual General Meeting: Votes For: 753,651,407 (99.92%) Votes Withheld: 638,787 (0.08%) Total Votes: 754,290,194
|
Ms. Hoeg was the president and chief executive officer of Corby Distilleries Limited from 1996 until her retirement in February 2007. She previously held several positions in the finance and controllers functions of Allied Domecq PLC and Hiram Walker & Sons Limited. Prior to that, she spent five years in public practice as a chartered accountant with the accounting firm of Touche Ross. She is currently a director of New Flyer Industries Inc. and is also a director of Samuel, Son & Co. Limited and Revera Inc., privately owned corporations. Ms. Hoeg is also the chair of the board of the Michael Garron Hospital (formerly known as the Toronto East General Hospital).
| |||||||||||
|
Board and Committee Membership
|
Attendance in 2016 | |||||||||||
|
Imperial Oil Limited board |
7 of 7 |
100% | ||||||||||
| Audit committee |
6 of 6 | 100% | ||||||||||
| Executive resources committee (Chair) |
7 of 7 | 100% | ||||||||||
| Environment, health and safety committee |
3 of 3 | 100% | ||||||||||
| Nominations and corporate governance committee |
4 of 4 | 100% | ||||||||||
| Contributions committee |
3 of 3 | 100% | ||||||||||
| Annual meeting of shareholders |
1 of 1 | 100% | ||||||||||
|
Overall Attendance – 100%
| ||||||||||||
|
Imperial Oil Limited Equity Ownership (a) (b) (c) (d)
| ||||||||||||
| As at |
Common Shares (% of class) |
Deferred Share Units (DSU) |
Total Vested Equity Holdings (DSU and Common) |
Restricted Stock Units (RSU) |
Total Equity Holdings (including RSU’s) | |||||||
|
Holdings as at February 8, 2017 (#)
|
0 | 27,643 | 27,643 | 10,600 | 38,243 | |||||||
|
Total Market Value as at February 8, 2017 ($)
|
0 | 1,169,299 | 1,169,299 | 448,380 | 1,617,679 | |||||||
|
Share ownership guidelines have been met.
| ||||||||||||
|
Change in Ownership from last proxy disclosure in 2016 (a) (b)
| ||||||||||||
| As at | Change in Common Shares Held |
Change in Deferred Share Units Held (DSU) (#) |
Change in Restricted Stock Units Held (RSU) (#) |
Total Year over Year change in Common Shares, DSU and RSU Holdings (#)
| ||||||||
|
Year over year change
|
0 | 3,424 | 600 | 4,024 | ||||||||
|
Exxon Mobil Corporation Equity Ownership (a) (c) (e)
| ||||||||||||
| As at | Common Shares (% of class) |
Restricted Stock |
Total Common Shares and Restricted Stock |
Total Market Value of Common Shares and Restricted Stock ($)
| ||||||||
|
February 8, 2017
|
0 | 0 | 0 | 0 | ||||||||
|
Public Company Directorships in the Past Five Years
| ||||||||||||
|
● New Flyer Industries (2015 – Present) ● Sun Life Financial Inc. (2002 – 2016) ● Canadian Pacific Railway Limited (2007 – 2015) ● Canadian Pacific Railway Company (2007 – 2015)
| ||||||||||||
|
Public Board Interlocks
| ||||||||||||
|
None
| ||||||||||||
|
Other Positions in the Past Five Years (position, date office held and status of employer)
| ||||||||||||
|
No other positions held in the last five years
| ||||||||||||
|
Non-profit sector affiliations
| ||||||||||||
|
● Michael Garron Hospital (formerly Toronto East General Hospital) (Chair of the Board)
| ||||||||||||

88
Table of Contents
|
Director Nominee
| ||||||||||||
|
R.M. (Richard) Kruger
Calgary, Alberta, Canada
Age: 57
Current Position: Chairman, president and chief executive officer, Imperial Oil Limited
Not independent
Director since: March 1, 2013
Skills and experience: ● Leadership of large organizations ● Operations/technical ● Project management ● Global experience ● Strategy development ● Financial expertise ● Government relations ● Executive compensation
Voting Results of 2016 Annual General Meeting: Votes For: 728,252,929 (96.55%) Votes Withheld: 26,037,265 (3.45%) Total Votes: 754,290,194
|
Mr. Kruger was appointed chairman, president and chief executive officer of Imperial Oil Limited effective March 1, 2013. Mr. Kruger has worked for Exxon Mobil Corporation and its predecessor companies since 1981 in various upstream and downstream assignments with responsibilities in the United States, the former Soviet Union, the Middle East, Africa and Southeast Asia. In his previous position, Mr. Kruger was vice-president of Exxon Mobil Corporation and president of ExxonMobil Production Company, a division of Exxon Mobil Corporation, with responsibility for ExxonMobil’s global oil and gas producing operations.
| |||||||||||
|
Board and Committee Membership
|
Attendance in 2016 | |||||||||||
|
Imperial Oil Limited board (Chair) |
7 of 7 |
100% | ||||||||||
| Contributions committee |
3 of 3 | 100% | ||||||||||
| Annual meeting of shareholders
|
1 of 1
|
100%
| ||||||||||
|
Overall Attendance – 100%
| ||||||||||||
|
Imperial Oil Limited Equity Ownership (a) (b) (c) (d)
| ||||||||||||
| As at |
Common Shares (% of class) |
Deferred Share Units (DSU) |
Total Vested Equity Holdings (DSU and Common) |
Restricted Stock Units (RSU) |
Total Equity Holdings (including RSU’s) | |||||||
|
Holdings as at February 8, 2017 (#)
|
0 | 0 | 0 | 393,500 | 393,500 | |||||||
|
Total Market Value as at February 8, 2017 ($)
|
0 | 0 | 0 | 16,645,050 | 16,645,050 | |||||||
|
Share ownership guidelines have been met.
| ||||||||||||
|
Change in Ownership from last proxy disclosure in 2016 (a) (b)
| ||||||||||||
| As at | Change in Common Shares Held |
Change in Deferred Share Units Held (DSU) (#) |
Change in Restricted Stock Units Held (RSU) (#) |
Total Year over Year change in Common Shares, DSU and RSU Holdings (#)
| ||||||||
|
Year over year change
|
0 | 0 | 110,000 | 110,000 | ||||||||
|
Exxon Mobil Corporation Equity Ownership (a) (c) (e)
| ||||||||||||
| As at | Common Shares (% of class) |
Restricted Stock |
Total Common Shares and Restricted Stock |
Total Market Value of Common Shares and Restricted Stock ($)
| ||||||||
| February 8, 2017 |
1,142 (<0.01%)
|
141,350 | 142,492 | 15,275,604 | ||||||||
|
Public Company Directorships in the Past Five Years
| ||||||||||||
|
None
| ||||||||||||
|
Public Board Interlocks
| ||||||||||||
|
None
| ||||||||||||
|
Other Positions in the Past Five Years (position, date office held and status of employer)
| ||||||||||||
|
ExxonMobil Corporation (2008 - 2013) (Affiliate)
| ||||||||||||
|
Non-profit sector affiliations
| ||||||||||||
|
● United Way of Calgary and Area (Board of Directors) ● C.D. Howe Institute (Board of Directors)
| ||||||||||||

89
Table of Contents
|
Director Nominee
| ||||||||||||
|
J.M. (Jack) Mintz
Calgary, Alberta, Canada
Age: 65
Current Position: Nonemployee director
Independent
Director since: April 21, 2005
Normally ineligible for re-election in 2023
Skills and experience: ● Global experience ● Strategy development ● Financial expertise ● Government relations ● Academic/research ● Executive compensation
Voting Results of 2016 Annual General Meeting: Votes For: 753,507,732 (99.90%) Votes Withheld: 782,462 (0.10%) Total Votes: 754,290,194 |
Dr. Mintz is currently the President’s Fellow at the University of Calgary’s School of Public Policy focusing on tax, urban and financial market regulatory policy programs and also serves as the national policy advisor for EY (formerly Ernst & Young). From 2006 to 2015, Dr. Mintz was the founding Director and Palmer Chair in Public Policy for the University of Calgary, and from 1999 to 2006, he was the president and chief executive officer of The C.D. Howe Institute. He has been a member of the board of Morneau Shepell since 2010. He has also been a professor at Queen’s University Economics Department from 1978 to 1989 and the Joseph L. Rotman School of Management at the University of Toronto from 1989 to 2007. Dr. Mintz also has published widely in the fields of public economics and fiscal federalism, has been an advisor to governments throughout the world on fiscal matters, and has frequently published articles in national newspapers and magazines. Dr. Mintz received the Order of Canada in 2015.
| |||||||||||
|
Board and Committee Membership
|
Attendance in 2016 | |||||||||||
|
Imperial Oil Limited board |
7 of 7 |
100% | ||||||||||
| Audit committee |
6 of 6 | 100% | ||||||||||
| Executive resources committee |
7 of 7 | 100% | ||||||||||
| Environment, health and safety committee (Chair) |
3 of 3 | 100% | ||||||||||
| Nominations and corporate governance committee |
4 of 4 | 100% | ||||||||||
| Contributions committee |
3 of 3 | 100% | ||||||||||
| Annual meeting of shareholders |
1 of 1 | 100% | ||||||||||
|
Overall Attendance – 100%
| ||||||||||||
|
Imperial Oil Limited Equity Ownership (a) (b) (c) (d)
| ||||||||||||
| As at | Common Shares (% of class) |
Deferred Share Units (DSU) |
Total Vested Equity Holdings (DSU and Common) |
Restricted Stock Units (RSU) |
Total Equity Holdings (including RSU’s) | |||||||
|
Holdings as at February 8, 2017 (#)
|
1,000 (<0.01%) |
23,590 | 24,590 | 10,600 | 35,190 | |||||||
|
Total Market Value as at February 8, 2017 ($)
|
42,300 | 997,857 | 1,040,157 | 448,380 | 1,488,537 | |||||||
|
Share ownership guidelines have been met.
| ||||||||||||
|
Change in Ownership from last proxy disclosure in 2016 (a) (b)
| ||||||||||||
| As at | Change in Common Shares Held |
Change in Deferred Share Units Held (DSU) (#) |
Change in Restricted Stock Units Held (RSU) (#) |
Total Year over Year change in Common Shares, DSU and RSU Holdings (#)
| ||||||||
|
Year over year change
|
0 | 3,368 | 600 | 3,968 | ||||||||
|
Exxon Mobil Corporation Equity Ownership (a) (c) (e)
| ||||||||||||
| As at | Common Shares (% of class) |
Restricted Stock |
Total Common Shares and Restricted Stock |
Total Market Value of Common Shares and Restricted Stock ($) | ||||||||
|
February 8, 2017
|
0 | 0 | 0 | 0 | ||||||||
|
Public Company Directorships in the Past Five Years
| ||||||||||||
|
| ||||||||||||
|
Public Board Interlocks
| ||||||||||||
|
None
| ||||||||||||
|
Other Positions in the Past Five Years (position, date office held and status of employer)
| ||||||||||||
|
No other positions held in the last five years
| ||||||||||||
|
Non-profit sector affiliations
| ||||||||||||
|
● University of Calgary, School of Public Policy, President’s Fellow ● Social Sciences and Humanities Research Council of Canada (Vice-president and chair of the governing council) ● Literary Review of Canada (Board of Directors) ● Global Risk Institute (Advisory Board) ● Ecofiscal Commission (Advisory Board)
| ||||||||||||

90
Table of Contents
|
Director Nominee
| ||||||||||||
|
D.S. (David) Sutherland
Waterloo, Ontario, Canada
Age: 67
Current Position: Nonemployee director
Independent
Director since: April 29, 2010
Normally ineligible for re-election in 2022
Skills and experience: ● Leadership of large organizations ● Operations/technical ● Global experience ● Strategy development ● Audit committee financial expert ● Financial expertise ● Government relations ● Executive compensation
Voting Results of 2016 Annual General Meeting: Votes For: 753,542,775 (99.90%) Votes Withheld: 747,419 (0.10%) Total Votes: 754,290,194
|
In July 2007, Mr. Sutherland retired as president and chief executive officer of the former IPSCO, Inc. after spending 30 years with the company and more than five years as president and chief executive officer. Mr. Sutherland is the chairman of the board of United States Steel Corporation and lead director of GATX Corporation. Mr. Sutherland is also chairman of Graham Group Ltd., an employee owned corporation and is a director of Steelcraft Inc., a privately owned corporation. Mr. Sutherland is a former chairman of the American Iron and Steel Institute and served as a member of the board of directors of the Steel Manufacturers Association, the International Iron and Steel Institute, the Canadian Steel Producers Association and the National Association of Manufacturers.
| |||||||||||
|
Board and Committee Membership
|
Attendance in 2016
| |||||||||||
|
Imperial Oil Limited board |
7 of 7 |
100% | ||||||||||
| Audit committee | 6 of 6 | 100% | ||||||||||
| Executive resources committee | 7 of 7 | 100% | ||||||||||
| Environment, health and safety committee | 3 of 3 | 100% | ||||||||||
| Nominations and corporate governance committee | 4 of 4 | 100% | ||||||||||
| Contributions committee (Chair) | 3 of 3 | 100% | ||||||||||
| Annual meeting of shareholders
|
1 of 1
|
100%
| ||||||||||
|
Overall Attendance – 100%
| ||||||||||||
|
Imperial Oil Limited Equity Ownership (a) (b) (c) (d)
| ||||||||||||
| As at |
Common Shares (% of class) |
Deferred Share Units (DSU) |
Total Vested Equity Holdings (DSU and Common) |
Restricted Stock Units (RSU) |
Total Equity Holdings (including RSU’s) | |||||||
| Holdings as at February 8, 2017 (#) |
45,000 (<0.01%)
|
21,056 | 66,056 | 10,600 | 76,656 | |||||||
|
Total Market Value as at February 8, 2017 ($)
|
1,903,500 | 890,669 | 2,794,169 | 448,380 | 3,242,549 | |||||||
|
Share ownership guidelines have been met.
| ||||||||||||
|
Change in Ownership from last proxy disclosure in 2016 (a) (b)
| ||||||||||||
| As at |
Change in Common Shares Held |
Change in Deferred Share Units Held (DSU) (#)
|
Change in Restricted Stock Units Held (RSU) (#) | Total Year over Year change in Common Shares, DSU and RSU Holdings (#) | ||||||||
|
Year over year change
|
0 |
3,332 |
1,600 |
4,932 | ||||||||
|
Exxon Mobil Corporation Equity Ownership (a) (c) (e)
| ||||||||||||
| As at |
Common Shares (% of class)
|
Restricted Stock |
Total Common Shares and Restricted Stock | Total Market Value of Common Shares and Restricted Stock ($) | ||||||||
| February 8, 2017 |
5,730 (<0.01%)
|
0 | 5,730 | 614,275 | ||||||||
|
Public Company Directorships in the Past Five Years
| ||||||||||||
|
● GATX Corporation (2007 - Present) ● United States Steel Corporation, (2008 – Present)
| ||||||||||||
|
Public Board Interlocks
| ||||||||||||
|
None
| ||||||||||||
|
Other Positions in the Past Five Years (position, date office held and status of employer)
| ||||||||||||
|
No other positions held in the last five years
| ||||||||||||
|
Non-profit sector affiliations
| ||||||||||||
|
● KidsAbility, Centre for Child Development (Finance Committee)
| ||||||||||||

91
Table of Contents
|
Director Nominee
| ||||||||||||
|
D.G. (Jerry) Wascom
Spring, Texas, United States of America
Age: 60
Current Position: Vice-president, Exxon Mobil Corporation and president ExxonMobil Refining & Supply Company
Not independent
Director since: July 30, 2014
Skills and experience: ● Leadership of large organizations ● Operations/technical ● Project management ● Global experience ● Strategy development ● Financial expertise ● Executive compensation
Voting Results of 2016 Annual General Meeting: Votes For: 726,854,339 (96.36%) Votes Withheld: 27,435,855 (3.64%) Total Votes: 754,290,194
|
Mr. Wascom is a vice-president of Exxon Mobil Corporation and is the president of ExxonMobil Refining & Supply Company, a division of Exxon Mobil Corporation, with responsibility for ExxonMobil’s global refining and supply operations. He is located in Spring, Texas. Mr. Wascom has worked for ExxonMobil in a range of refining operations management assignments, as well as international assignments in Asia Pacific.
| |||||||||||
|
Board and Committee Membership |
Attendance in 2016
| |||||||||||
|
Imperial Oil Limited board |
5 of 7 |
71% | ||||||||||
| Executive resources committee | 5 of 7 | 71% | ||||||||||
| Environment, health and safety committee | 2 of 3 | 67% | ||||||||||
| Nominations and corporate governance committee | 3 of 4 | 75% | ||||||||||
| Contributions committee | 2 of 3 | 67% | ||||||||||
| Annual meeting of shareholders | 1 of 1
|
100% | ||||||||||
|
Overall Attendance – 72%
| ||||||||||||
|
Imperial Oil Limited Equity Ownership (a) (b) (c) (d)
| ||||||||||||
| As at |
Common Shares (% of class) |
Deferred Share Units (DSU) |
Total Vested Equity Holdings (DSU and Common) |
Restricted Stock Units (RSU) |
Total Equity Holdings (including RSU’s) | |||||||
|
Holdings as at February 8, 2017 (#)
|
0 | 0 | 0 | 0 | 0 | |||||||
|
Total Market Value as at February 8, 2017 ($)
|
0 | 0 | 0 | 0 | 0 | |||||||
|
No share ownership guidelines apply.
| ||||||||||||
|
Change in Ownership from last proxy disclosure in 2016 (a) (b)
| ||||||||||||
| As at |
Change in Common Shares Held |
Change in Deferred Share Units Held (DSU) (#)
|
Change in Restricted Stock Units Held (RSU) (#) |
Total Year over Year change in Common Shares, DSU and RSU Holdings (#) | ||||||||
|
Year over year change
|
0 |
0 |
0 |
0 | ||||||||
|
Exxon Mobil Corporation Equity Ownership (a) (c) (e)
| ||||||||||||
| As at |
Common Shares (% of class) |
Restricted Stock |
Total Common Shares and Restricted Stock
|
Total Market Value of Common Shares and Restricted Stock ($) | ||||||||
| February 8, 2017 |
17,405 (<0.01%)
|
177,900 | 195,305 | 20,937,328 | ||||||||
|
Public Company Directorships in the Past Five Years
| ||||||||||||
|
None
| ||||||||||||
|
Public Board Interlocks
| ||||||||||||
|
None
| ||||||||||||
|
Other Positions in the Past Five Years (position, date office held and status of employer)
| ||||||||||||
|
● Director, Refining North America, ExxonMobil Refining & Supply Company (2013 - 2014) (Affiliate) ● Director, Refining Americas, ExxonMobil Refining & Supply Company (2009 - 2013) (Affiliate)
| ||||||||||||
|
Non-profit sector affiliations
| ||||||||||||
|
None
| ||||||||||||

92
Table of Contents
|
Director Nominee
| ||||||||||||
|
S.D. (Sheelagh) Whittaker
London, England
Age: 69
Current Position: Nonemployee director
Independent
Director since: April 19, 1996
Normally ineligible for re-election in 2019
Skills and experience: ● Leadership of large organizations ● Global experience ● Strategy development ● Audit committee financial expert ● Financial expertise ● Government relations ● Information technology ● Executive compensation
Voting Results of 2016 Annual General Meeting: Votes For: 750,654,547 (99.52%) Votes Withheld: 3,635,647 (0.48%) Total Votes: 754,290,194
|
Ms. Whittaker spent much of her early business career as director and partner with The Canada Consulting Group, now Boston Consulting Group. From 1989 she was president and chief executive officer of Canadian Satellite Communications (Cancom). In 1993, Ms. Whittaker joined Electronic Data Systems of Plano, Texas, then one of the world’s foremost providers of information technology services. Initially spending several years as president and chief executive officer of EDS Canada, Ms. Whittaker then undertook other key leadership roles globally, ultimately serving the company as managing director, United Kingdom, Middle East and Africa, until her retirement from EDS in November 2005. | |||||||||||
|
Board and Committee Membership
|
Attendance in 2016 | |||||||||||
|
Imperial Oil Limited board |
7 of 7 |
100% | ||||||||||
| Audit committee | 6 of 6 | 100% | ||||||||||
| Executive resources committee | 7 of 7 | 100% | ||||||||||
| Environment, health and safety committee | 3 of 3 | 100% | ||||||||||
| Nominations and corporate governance committee (Chair) | 4 of 4 | 100% | ||||||||||
| Contributions committee | 3 of 3 | 100% | ||||||||||
| Annual meeting of shareholders | 1 of 1 | 100% | ||||||||||
|
Overall Attendance – 100%
| ||||||||||||
|
Imperial Oil Limited Equity Ownership (a) (b) (c) (d)
| ||||||||||||
| As at |
Common Shares (% of class) |
Deferred Share Units (DSU) | Total Vested Equity Holdings (DSU and Common) |
Restricted Stock Units (RSU) |
Total Equity Holdings (including RSU’s) | |||||||
| Holdings as at February 8, 2017 (#) |
9,350 (<0.01%)
|
50,904 | 60,254 | 10,600 | 70,854 | |||||||
|
Total Market Value as at February 8, 2017 ($)
|
395,505 | 2,153,239 | 2,548,744 | 448,380 | 2,997,124 | |||||||
|
Share ownership guidelines have been met.
| ||||||||||||
|
Change in Ownership from last proxy disclosure in 2016 (a) (b)
| ||||||||||||
| As at |
Change in Common Shares Held |
Change in Deferred Share Units Held (DSU) (#) |
Change in Restricted Stock Units Held (RSU) (#) |
Total Year over Year change in Common Shares, DSU and RSU Holdings (#)
| ||||||||
|
Year over year change
|
0 |
3,744 |
600 |
4,344 | ||||||||
|
Exxon Mobil Corporation Equity Ownership (a) (c) (e)
| ||||||||||||
| As at |
Common Shares (% of class) |
Restricted Stock |
Total Common Shares and Restricted Stock | Total Market Value of Common Shares and Restricted Stock ($) | ||||||||
|
February 8, 2017
|
0 |
0 |
0 |
0 | ||||||||
|
Public Company Directorships in the Past Five Years
| ||||||||||||
|
● Standard Life Canada (2013 – 2015) ● Standard Life plc (2009 – 2013)
| ||||||||||||
|
Public Board Interlocks
| ||||||||||||
|
None
| ||||||||||||
|
Other Positions in the Past Five Years (position, date office held and status of employer)
| ||||||||||||
|
No other positions held in the last five years
| ||||||||||||
|
Non-profit sector affiliations
| ||||||||||||
|
● Nanaimo Child Development Centre (volunteer)
| ||||||||||||

93
Table of Contents
|
Director Nominee
| ||||||||||||
|
V.L. (Victor) Young, O.C.
St. John’s, Newfoundland and Labrador, Canada
Age: 71
Current Position: Nonemployee director
Independent
Director since: April 23, 2002
Normally ineligible for re-election in 2018
Skills and experience: ● Leadership of large organizations ● Strategy development ● Audit committee financial expert ● Financial expertise ● Government relations ● Executive compensation
Voting Results of 2016 Annual General Meeting: Votes For: 752,305,119 (99.74%) Votes Withheld: 1,985,075 (0.26%) Total Votes: 754,290,194 |
From November 1984 until May 2001, Mr. Young served as chairman and chief executive officer of Fishery Products International Limited, a frozen seafood products company. Mr. Young is a director of McCain Foods Limited, a privately owned corporation. Mr. Young was appointed an Officer of the Order of Canada in 1996.
| |||||||||||
|
Board and Committee Membership
|
Attendance in 2016
| |||||||||||
|
Imperial Oil Limited board |
7 of 7 |
100% | ||||||||||
| Audit committee (Chair) |
6 of 6 | 100% | ||||||||||
| Executive resources committee |
7 of 7 | 100% | ||||||||||
| Environment, health and safety committee |
3 of 3 | 100% | ||||||||||
| Nominations and corporate governance committee |
4 of 4 | 100% | ||||||||||
| Contributions committee |
3 of 3 | 100% | ||||||||||
| Annual meeting of shareholders |
1 of 1 | 100% | ||||||||||
|
Overall Attendance – 100%
| ||||||||||||
|
Imperial Oil Limited Equity Ownership (a) (b) (c) (d)
| ||||||||||||
| As at | Common Shares (% of class) |
Deferred Share Units (DSU) |
Total Vested Equity Holdings (DSU and Common) |
Restricted Stock Units (RSU) |
Total Equity Holdings (including RSU’s) | |||||||
|
Holdings as at February 8, 2017 (#)
|
22,500 (<0.01%)
|
12,982 | 35,482 | 10,600 | 46,082 | |||||||
|
Total Market Value as at February 8, 2017 ($)
|
951,750 | 549,139 | 1,500,889 | 448,380 | 1,949,269 | |||||||
|
Share ownership guidelines have been met.
| ||||||||||||
|
Change in Ownership from last proxy disclosure in 2016 (a) (b)
| ||||||||||||
|
As at
|
Change in Common Shares Held
|
Change in Deferred Share Units Held (DSU) (#)
|
Change in Restricted Stock Units Held (RSU) (#)
|
Total Year over Year change in Common Shares, DSU and RSU Holdings (#)
| ||||||||
|
Year over year change
|
0 | 940 | 600 | 1,540 | ||||||||
|
Exxon Mobil Corporation Equity Ownership (a) (c) (e)
| ||||||||||||
|
As at
|
Common Shares (% of class)
|
Restricted Stock
|
Total Common Shares and Restricted Stock
|
Total Market Value of Common Shares and Restricted Stock ($)
| ||||||||
|
February 8, 2017
|
0 | 0 | 0 | 0 | ||||||||
|
Public Company Directorships in the Past Five Years
| ||||||||||||
|
● Royal Bank of Canada (1991 – 2016)
| ||||||||||||
|
Public Board Interlocks
| ||||||||||||
|
None
| ||||||||||||
|
Other Positions in the Past Five Years (position, date office held and status of employer)
| ||||||||||||
|
No other positions held in the last five years
| ||||||||||||
|
Non-profit sector affiliations
| ||||||||||||
|
● Gathering Place (Fundraising committee) | ||||||||||||

94
Table of Contents
Footnotes to Director nominee tables on pages 88 through 94:
| (a) | The information includes the beneficial ownership of common shares of Imperial Oil Limited and shares of Exxon Mobil Corporation, which information not being within the knowledge of the company has been provided by the nominees individually. |
| (b) | The company’s plan for restricted stock units for nonemployee directors is described on page 113. The company’s plan for deferred share units for nonemployee directors is described on page 113. The company’s plan for restricted stock units for selected employees is described on page 132. |
| (c) | The numbers for the company’s restricted stock units represent the total of the outstanding restricted stock units received in 2010 through 2016 and deferred share units received since directors’ appointment. The numbers for Exxon Mobil Corporation restricted stock include outstanding restricted stock and restricted stock units granted under its restricted stock plan which is similar to the company’s restricted stock unit plan. |
| (d) | The value for Imperial Oil Limited common shares, deferred share units and restricted stock units is based on the closing price for Imperial Oil Limited common shares on the Toronto Stock Exchange of $42.30 on February 8, 2017. |
| (e) | The value for Exxon Mobil Corporation common shares and restricted stock is based on the closing price for Exxon Mobil Corporation common shares of $81.48 U.S., which is converted to Canadian dollars at the noon rate of exchange of $1.3157 provided by the Bank of Canada for February 8, 2017. |
In order to better align with the Canadian Coalition for Good Governance’s policy, “Governance Differences of Equity Controlled Corporations” – October, 2011, in 2012, the board of directors of the company passed a resolution adopting a majority voting policy.
As of the date of this circular, Exxon Mobil Corporation holds 69.6% of the company’s shares. If Exxon Mobil Corporation’s shareholdings were ever to fall below 50%, the company’s policy provides that for any non-contested election of directors, any director nominee who receives a greater number of votes “withheld” from his or her election than votes “for” in such election shall tender his or her resignation. Within 90 days after certification of the election results, the board of directors will decide, through a process managed by the nominations and corporate governance committee and excluding the nominee in question, whether to accept the resignation. Absent a compelling reason for the director to remain on the board, the board shall accept the resignation. The board will promptly disclose its decision and, if applicable, the reasons for rejecting the tendered resignation.
95
Table of Contents
Corporate governance disclosure
96
Table of Contents
Statement of corporate governance practice
This section provides information pertaining to our board, the committees of the board, ethics, diversity and shareholder engagement. The company is committed to high corporate governance standards and best practices. The company’s corporate governance policies and practices comply with and in most cases exceed the requirements of National Instrument 52-110 Audit Committees (NI 52-110), National Policy 58-201 Corporate Governance Guidelines (NP 58-201) and National Instrument 58-101 Disclosure of Corporate Governance Practices (NI 58-101). The company’s common shares trade on the Toronto Stock Exchange and the NYSE MKT LLC and our corporate governance practices reflect the corporate governance standards of these exchanges.
Composition of our director nominees:
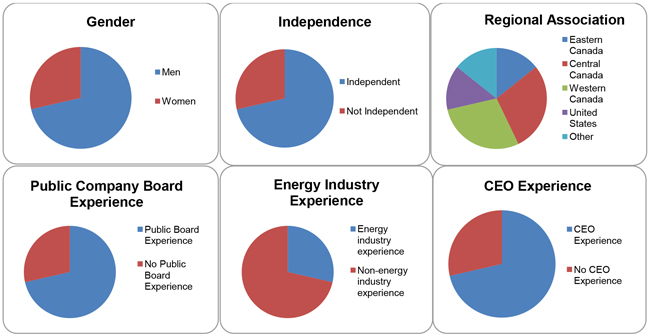
Collectively, the seven nominees for election as directors have 71 years of experience on this company’s board. The board charter provides that incumbent directors will not be renominated if they have attained the age of 72, except under exceptional circumstances and at the request of the chairman. The company does not have term limits for independent directors because it values the comprehensive knowledge of the company that long serving directors possess and independent directors are expected to remain qualified to serve for a minimum of five years. The following chart shows the current years of service of the members of the board of directors and the year they would normally be expected to retire from the board.
| Name of Director | Years of service on the board |
Year of expected retirement from the board for independent directors
| ||
|
K.T. Hoeg
|
9 years
|
2022
| ||
|
R.M. Kruger
|
4 years
|
-
| ||
|
J.M. Mintz
|
12 years
|
2023
| ||
|
D.S. Sutherland
|
7 years
|
2022
| ||
|
D.G. Wascom
|
3 years
|
-
| ||
|
S.D. Whittaker
|
21 years
|
2019
| ||
|
V.L. Young
|
15 years
|
2018
| ||
|
Years of combined experience on the board: 71 years Average tenure on the board: 10 years Average age of directors: 65 years | ||||
97
Table of Contents
Skills and experience of our board nominees
Our directors provide a wide range of skills, diversity and experience.
The current nominees for election as director collectively have experience and expertise required to ensure effective stewardship and governance of the company. The key areas of experience and skills along with individual involvement in the not-for-profit sector for each of the nominees for election as directors can also be found in each of the directors tables on pages 88 through 94 of this circular.
The table below sets out the diverse skill set required of the board and identifies the particular experience, qualifications, attributes, and skills of each director nominee that led the board to conclude that such person should serve as a director of the company.
| K.T. Hoeg | R.M. Kruger | J.M. Mintz |
D.S.
|
D.G.
|
S.D.
|
V.L. Young | ||||||||
|
Leadership of Large Organizations |
✓ | ✓ | ✓ | ✓ | ✓ | ✓ | ||||||||
|
Operations/Technical
|
✓ | ✓ | ✓ | |||||||||||
|
Project Management
|
✓ | ✓ | ✓ | |||||||||||
|
Global Experience
|
✓ | ✓ | ✓ | ✓ | ✓ | ✓ | ||||||||
|
Strategy Development
|
✓ | ✓ | ✓ | ✓ | ✓ | ✓ | ✓ | |||||||
|
Audit Committee Financial Expert
|
✓ | ✓ | ✓ | ✓ | ||||||||||
|
Financial Expertise
|
✓ | ✓ | ✓ | ✓ | ✓ | ✓ | ✓ | |||||||
|
Government Relations
|
✓ | ✓ | ✓ | ✓ | ✓ | |||||||||
|
Academic/Research
|
✓ | |||||||||||||
|
Information Technology
|
✓ | |||||||||||||
|
Executive Compensation
|
✓ | ✓ | ✓ | ✓ | ✓ | ✓ | ✓ |
98
Table of Contents
Independence of our board nominees
Five out of seven of the directors are independent.
The board is composed of seven directors, the majority of whom (five out of seven) are independent. The five independent directors are not employees of the company.
The board determines independence on the basis of the standards specified by Multilateral Instrument
52-110 Audit Committees (NI 52-110), the U.S. Securities and Exchange Commission rules and the listing standards of the NYSE MKT LLC. The board has reviewed relevant relationships between the company and each nonemployee director and director nominee to determine compliance with these standards.
Based on the directors’ responses to an annual questionnaire, the board determined that none of the independent directors has any interest, business or other relationship that could or could reasonably be perceived to constitute a material relationship with the company. R.M. Kruger is a director and chairman, president and chief executive officer of the company and not considered to be independent. The board believes that the extensive knowledge of the business of the company and Exxon Mobil Corporation held by R.M. Kruger is beneficial to the other directors and his participation enhances the effectiveness of the board.
D.G. Wascom is also a non-independent director as he is an officer of Exxon Mobil Corporation. The company believes that D.G. Wascom, although deemed non-independent under the relevant standards by virtue of his employment, can be viewed as independent of the company’s management and that his ability to reflect the perspective of the company’s shareholders enhances the effectiveness of the board.
| Name of director | Management | Independent |
Not independent
|
Reason for non-independent status | ||||
|
K.T. Hoeg
|
✓ |
|||||||
|
R.M. Kruger |
✓ |
✓ |
R.M. Kruger is a director and chairman, president and chief executive officer of Imperial Oil Limited.
| |||||
|
J.M. Mintz
|
✓ |
|||||||
|
D.S. Sutherland
|
✓ |
|||||||
|
D.G. Wascom
|
✓ |
D.G. Wascom is an officer of Exxon Mobil Corporation.
| ||||||
|
S.D. Whittaker
|
✓ |
|||||||
|
V.L. Young
|
✓ |
99
Table of Contents
Committee membership of our board nominees
Each committee is chaired by a different independent director and all
of the five independent directors are members of each committee.
The chart below shows the company’s committee memberships and the chair of each committee.
|
Director
|
Board committees
| |||||||||
|
Nominations
|
Audit (b) |
Environment
|
Executive resources committee |
Contributions committee | ||||||
|
K.T. Hoeg (c)
|
✓ |
✓ | ✓ |
Chair | ✓ | |||||
|
R.M. Kruger (a)
|
- |
- |
- |
- |
✓ | |||||
|
J.M. Mintz
|
✓ |
✓ |
Chair | ✓ |
✓ | |||||
|
D.S. Sutherland (c)
|
✓ |
✓ |
✓ |
✓ |
Chair | |||||
|
D.G. Wascom (a)
|
✓ |
- |
✓ |
✓ |
✓ | |||||
|
S.D. Whittaker (c)
|
Chair | ✓ |
✓ |
✓ |
✓ | |||||
|
V.L. Young (c)
|
✓ |
Chair | ✓ |
✓ |
✓ | |||||
| (a) | Not independent directors. |
| (b) | All members of the audit committee are independent and financially literate within the meaning of Multilateral Instrument 52-110 Audit Committees and the listing standards of the NYSE MKT LLC. |
| (c) | Audit committee financial experts under US regulatory requirements. |
The chart below shows the number of board, committee and annual meetings held in 2016.
|
Board or committee
|
Number of meetings held in 2016
| |
|
Imperial Oil Limited board
|
7 | |
|
Audit committee
|
6 | |
|
Executive resources committee
|
7 | |
|
Environment, health and safety committee
|
3 | |
|
Nominations and corporate governance committee
|
4 | |
|
Contributions committee
|
3 | |
|
Annual meeting of shareholders
|
1 |
100
Table of Contents
Attendance of our board nominees
96% board and committee meeting attendance from all members.
The following chart provides a summary of the attendance record of each of the directors in 2016. The attendance record of each director nominee is also set out in his or her biographical information on pages 88 through 94. The attendance chart also provides an overall view of the attendance per committee. Senior management directors and other members of management periodically attend committee meetings at the request of the committee chair.
| Director | Board | Audit committee |
Executive resources committee |
Environment health and safety committee |
Nominations and corporate governance committee
|
Contributions committee |
Annual meeting |
Total |
Percentage by director | |||||||||
|
K.T. Hoeg
|
7 of 7 | 6 of 6 | 7 of 7 (chair) |
3 of 3 | 4 of 4 | 3 of 3 | 1 of 1 | 31 of 31 | 100% | |||||||||
|
R.M. Kruger
|
7 of 7 (chair) |
- | - | - | - | 3 of 3 | 1 of 1 | 11 of 11 | 100% | |||||||||
|
J.M. Mintz
|
7 of 7 | 6 of 6 | 7 of 7 | 3 of 3 (chair) |
4 of 4 | 3 of 3 | 1 of 1 | 31 of 31 | 100% | |||||||||
|
D.S. Sutherland
|
7 of 7 | 6 of 6 | 7 of 7 | 3 of 3 | 4 of 4 | 3 of 3 (chair) |
1 of 1 | 31 of 31 | 100% | |||||||||
|
D.G. Wascom
|
5 of 7 | - | 5 of 7 | 2 of 3 | 3 of 4 | 2 of 3 | 1 of 1 | 18 of 25 | 72% | |||||||||
|
S.D. Whittaker
|
7 of 7 | 6 of 6 | 7 of 7 | 3 of 3 | 4 of 4 (chair) |
3 of 3 | 1 of 1 | 31 of 31 | 100% | |||||||||
|
V.L. Young
|
7 of 7 | 6 of 6 (chair) |
7 of 7 | 3 of 3 | 4 of 4 | 3 of 3 | 1 of 1 | 31 of 31 | 100% | |||||||||
| Percentage by committee |
95.9% | 100% | 95.2% | 94.4% | 95.8% | 95.2% | 100% | 184/191 |
Overall attendance percentage 96.3%
|
101
Table of Contents
Other public company directorships of our board nominees
No director serves on more than two boards of another reporting issuer.
The following table shows which directors and director nominees serve on the boards of other reporting issuers and the committee membership in those companies.
| Name of director or nominee |
Other reporting
|
Type of company | Stock Exchange |
Committee appointments | ||||
| K.T. Hoeg | New Flyer Industries Inc. | Manufacturer of heavy duty transit buses | NFI: TSX |
Human resources, compensation and corporate governance committee
| ||||
|
R.M. Kruger
|
-- | -- | -- |
--
| ||||
| J.M. Mintz | Morneau Shepell Inc. | Human resources consulting | MSI: TSX |
Governance committee
| ||||
|
Audit committee
| ||||||||
| D.S. Sutherland | GATX Corporation |
Commercial rail vehicles and aircraft engines – shipping
|
GMT: NYSE | Lead director | ||||
|
United States Steel Corporation
|
Iron and steel | X: NYSE | Chairman of the board | |||||
| D.G. Wascom |
--
|
-- | -- | -- | ||||
| S.D. Whittaker |
--
|
-- | -- | -- | ||||
| V.L. Young |
--
|
-- | -- | -- |
Interlocking directorships of our board nominees
As of the date of this proxy circular, there are no interlocking public company directorships among the director nominees listed in this circular.
102
Table of Contents
Director qualification and selection process
The nominations and corporate governance committee is responsible for identifying and recommending new candidates for board nomination. The committee identifies candidates from a number of sources, including executive search firms and referrals from existing directors. The process for selection is described in paragraph 9(a) of the Board of Directors Charter attached as Appendix A. The committee will consider potential future candidates as required.
In considering the qualifications of potential nominees for election as directors, the nominations and corporate governance committee considers the work experience and other areas of expertise of the potential nominees. The following key criteria are considered to be relevant to the work of the board of directors and its committees:
Work Experience
| ● | Experience in leadership of businesses or other large organizations (Leadership of large organizations) |
| ● | Operations/technical experience (Operations/technical) |
| ● | Project management experience (Project management) |
| ● | Experience in working in a global work environment (Global experience) |
| ● | Experience in development of business strategy (Strategy development) |
Other Expertise
| ● | Audit committee financial expert (also see the financial expert section in the audit committee chart starting on page 106) |
| ● | Expertise in financial matters (Financial expertise) |
| ● | Expertise in managing relations with government (Government relations) |
| ● | Experience in academia or in research (Academic/research) |
| ● | Expertise in information technology (Information technology) |
| ● | Expertise in executive compensation policies and practices (Executive compensation) |
With the objective of fostering a diversity of expertise, viewpoint and competencies, the nominations and corporate governance committee may consider the following additional factors in assessing potential nominees:
| ● | possessing expertise in any of the following areas: law, science, marketing, administration, social/political environment or community and civic affairs; |
| ● | individual competencies in business and other areas of endeavour in contributing to the collective experience of the directors; and |
| ● | providing diversity of age, gender and regional association. |
The nominations and corporate governance committee assesses the work experience and other expertise each existing director possesses and whether each nominee is able to fill any gaps in such experience, expertise and diversity of age, gender and regional association. Consideration is also given to whether candidates possess the ability to contribute to the broad range of issues with which the board and its committees must deal, are able to devote the necessary amount of time to prepare for and attend board and committee meetings and are free of any potential legal impediment or conflict of interest. Candidates are expected to remain qualified to serve for a minimum of five years and independent directors are expected to achieve ownership of no less than 15,000 common shares, deferred share units and restricted share units within five years of becoming an independent director.
When the committee is recommending candidates for re-nomination, it assesses such candidates against the criteria for re-nomination as set out in paragraph 9(b) of the Board of Directors Charter found in Appendix A of this circular. Candidates for re-nomination are expected not to change their principal position, the thrust of their involvement or their regional association in a way that would significantly detract from their value as a director of the corporation. They are also expected to continue to be compatible with the criteria that led to their selection as nominees.
103
Table of Contents
Director orientation, education and development
The corporate secretary organizes an orientation program for all new directors. In a series of meetings over several days, new directors are briefed by staff and functional managers on all significant areas of the company’s operations, industry specific topics, risk oversight and regulatory issues. New directors are also briefed on significant company policies, organizational structure, security, information technology management and on critical planning and reserves processes. They also receive key governance and disclosure documents and a comprehensive board manual which contains a record of historical information about the company, by-laws, company policies, the charters of the board and its committees, other relevant company business information, information on directors’ duties and additional board related activities and calendars.
Continuing education is provided to board and committee members through regular presentations by management which focus on providing more in-depth information about key aspects of the business. Each year the board has an extended meeting that focuses on a particular area of the company’s operations and includes a visit to one or more of the company’s operating sites or a site of relevance to the company’s operations. In September, 2016, the board visited Cold Lake, Alberta for an operations tour. The board and the committees received a number of presentations in 2016 focused on performance, strategy and opportunities for the business. Some of these continuing education events included an environmental performance review, upstream and downstream performance and improvement plans, an update on security, a retail assessment, an investor relations review, a review of business controls, a review of the northern Alberta wildfire impacts, a review of business line computing controls, a cybersecurity update, an update on external reporting, an emissions review, a competition and anti-corruption review, an oil sands review, a review of governmental relations and a review of corporate governance and regulatory issues.
Members of ExxonMobil’s management also provide reviews of various aspects of ExxonMobil’s global business. In 2016, the directors received presentations on ExxonMobil’s information technology and cybersecurity and a presentation on ExxonMobil’s global business overview.
Members of the board also receive an extensive package of materials prior to each board meeting that provides a comprehensive summary on each agenda item to be discussed. Similarly, the committee members also receive a comprehensive summary on each agenda item to be discussed by that particular committee. Informational communications and other written publications or reports of interest to the directors are also forwarded routinely.
The board members are canvassed as to whether there are any additional topics relevant to the board or to a specific committee that they would like to see addressed and management schedules presentations covering these areas. In addition, at every meeting the board receives an extensive update from the chairman, president and chief executive officer on business environment trends, relevant geopolitical activities, federal government priorities, key provincial issues and competitor activities, as appropriate.
Directors are encouraged to participate in continuing education programs and events to update their skills and knowledge.
The board and its committees, as well as the performance of the directors, are assessed on an annual basis. In 2016, the directors engaged in a performance assessment with the chairman, president and chief executive officer during which the directors evaluated the board and each committee’s effectiveness in various areas. The chairman, president and chief executive officer also meets regularly with directors individually to discuss any outstanding issues. The nominations and corporate governance committee discussed a summary of these assessment outcomes at its January 2017 meeting.
104
Table of Contents
Leadership structure
The company has chosen to combine the positions of chairman, president and chief executive officer. The board believes the interests of all shareholders are best served at the present time through a leadership model with a combined chairman and chief executive officer position. The company does not have a lead director. While the chairman of the board is not an independent director, S.D. Whittaker, chair of the executive sessions, provides leadership for the independent directors. The duties of the chair of the executive sessions include presiding at executive sessions of the board, and reviewing and modifying, if necessary, the agenda of the meetings of the board in advance to ensure that the board may successfully carry out its duties. The position description of the chair of the executive sessions is described in paragraph 8(3) of the Board of Directors Charter attached as Appendix A.
Independent director executive sessions
The executive sessions of the board are in camera meetings of the independent directors and are held in conjunction with every board meeting. These meetings are held in the absence of management. The independent directors held seven executive sessions in 2016. The purposes of the executive sessions of the board include the following:
| ● | raising substantive issues that are more appropriately discussed in the absence of management; |
| ● | discussing the need to communicate to the chairman of the board any matter of concern raised by any committee or director; |
| ● | addressing issues raised but not resolved at meetings of the board and assessing any follow-up needs with the chairman of the board; |
| ● | discussing the quality, quantity, and timeliness of the flow of information from management that is necessary for the independent directors to effectively and responsibly perform their duties, and advising the chairman of the board of any changes required; and |
| ● | seeking feedback about board processes. |
In camera sessions of the board committees
Various committees also regularly hold in camera sessions without management present. The audit committee regularly holds private sessions of the committee members as well as private meetings of the committee with each of the external auditor, the internal auditor and senior management as part of every regularly scheduled committee meeting.
Committee structure
The board has created five committees to help carry out its duties. Each committee is chaired by a different independent director and all of the five independent directors are members of each committee. D.G. Wascom is also a member of each committee, with the exception of the audit committee, which is composed entirely of independent directors. R.M. Kruger is also a member of the contributions committee. Board committees work on key issues in greater detail than would be possible at full board meetings allowing directors to more effectively discharge their stewardship responsibilities. The five independent chairs of the five committees are able to take a leadership role in executing the board’s responsibility with respect to a specific area of the company’s operations falling within the responsibility of the committee he or she chairs. The board and each committee have a written charter that can be found in Appendix A of this circular. The charters are reviewed and approved by the board annually. The charters set out the structure, position description for the chair and the process and responsibilities of that committee. There are five committees of the board.
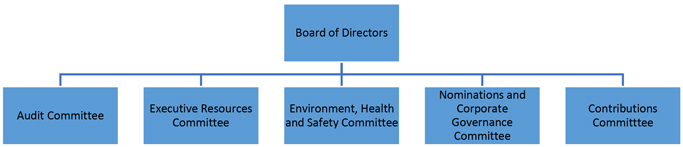
105
Table of Contents
The following table provides additional information about the board and its five committees:
|
Board of Directors
| ||||
| Directors |
● R.M. Kruger (chair) ● K.T. Hoeg ● J.M. Mintz ● D.S. Sutherland
|
● D.G. Wascom ● S.D. Whittaker ● V.L. Young | ||
| Number of meetings in 2016 |
Seven meetings of the board of directors were held in 2016. There were no special meetings held this year. The independent directors hold executive sessions of the board in conjunction with every board meeting. These meetings are held in the absence of management. The independent directors held seven executive sessions in 2016.
| |||
| Mandate |
The board of directors is responsible for the stewardship of the corporation. The stewardship process is carried out by the board directly or through one or more of the committees of the board. The formal mandate of the board can be found within the Board of Directors Charter in Appendix A of this circular.
| |||
| Highlights of 2016 |
● Provided oversight in support of safety and environmental performance. ● Regularly discussed risk management and business controls environment. ● Reviewed cyber security and information technology strategies. ● Extensively discussed business trends and market factors relevant to the company. ● Regularly assessed performance of the Kearl oil sands operations. ● Discussed priorities and plans associated with market access strategy. ● Reviewed strategies and plans associated with in-situ growth projects. ● Conducted site visit to Cold Lake to review operations. ● Reviewed extensive organizational efficiency and productivity initiatives. ● Regularly reviewed progress related to company owned retail site divestment.
| |||
| Role in risk oversight |
The chairman, president and chief executive officer is charged with identifying, for review with the board of directors, the principal risks of the corporation’s business, and ensuring appropriate systems are in place to manage such risks. The company’s financial, execution and operational risk rests with management and the company is governed by well-established risk management systems. The board of directors carefully considers these risks in evaluating the company’s strategic plans and specific proposals for capital expenditures and budget additions.
| |||
| Disclosure policy |
The company is committed to full, true and plain public disclosure of all material information in a timely manner, in order to keep security holders and the investing public informed about the company’s operations. The full details of the corporate disclosure policy can be found on the company’s internet site at www.imperialoil.ca.
| |||
| Independence |
The current board of directors is composed of seven directors, the majority of whom (five out of seven) are independent. The five independent directors are not employees of the company.
| |||
|
Audit Committee
| ||||
| Committee members |
● V.L. Young (chair) ● S.D. Whittaker (vice-chair) ● K.T. Hoeg ● J.M. Mintz ● D.S. Sutherland
| |||
| Number of meetings in 2016 |
Six meetings of the audit committee were held in 2016. The committee members met in camera without management present at every regularly scheduled meeting and also separately with the internal auditor and the external auditor at all regularly scheduled meetings. A pre-audit meeting also occurs prior to every regularly scheduled audit committee meeting with the chair of the audit committee and the chief financial officer and both the internal and external auditors.
| |||
106
Table of Contents
| Mandate |
The role of the audit committee includes selecting and overseeing the independent auditor, reviewing the scope and results of the audit conducted by the independent auditor, assisting the board in overseeing the integrity of the company’s financial statements, the company’s compliance with legal and regulatory requirements and the quality and effectiveness of internal controls, approving any changes in accounting principles and practices, and reviewing the results of monitoring activity under the company’s business ethics compliance program. The formal mandate of the audit committee can be found within the Audit Committee Charter in Appendix A of this circular.
| |||
| Highlights of 2016 |
● Reviewed the interim and full year financial and operating results. ● Reviewed and assessed the results of the internal auditor’s audit program. ● Reviewed and assessed the external auditor plan, performance and fees. ● Reviewed the committee’s mandate and completed the committee self-assessment. ● Reviewed evolving regulations and reporting obligations. ● Reviewed business line and financial systems computing controls. ● Reviewed finance plan. ● Performed external auditor performance evaluation. ● Auditor independence maintained with external auditor managing partner rotation.
| |||
| Financial expertise |
The company’s board of directors has determined that K.T. Hoeg, D.S. Sutherland, S.D. Whittaker and V.L. Young meet the definition of “audit committee financial expert”. The U.S. Securities and Exchange Commission has indicated that the designation of an audit committee financial expert does not make that person an expert for any purpose, or impose any duties, obligations or liability on that person that are greater than those imposed on members of the audit committee and board of directors in the absence of such designation or identification. All members of the audit committee are financially literate within the meaning of Multilateral Instrument 52-110 Audit Committees and the listing standards of the NYSE MKT LLC.
| |||
| Role in risk oversight |
The audit committee also has an important role in risk oversight. It regularly receives updates from management on the company’s risk management systems. The audit committee reviewed the scope of PricewaterhouseCoopers’ audit in light of risks associated with the energy industry, the regulatory environment and company-specific financial audit risks. The committee reviews financial statements and internal and external audit results. It oversees risks associated with financial and accounting matters, including compliance with legal and regulatory requirements, and the company’s financial reporting and internal controls systems.
| |||
| Independence |
The audit committee is composed entirely of independent directors. All members met board approved independence standards, as that term is defined in Multilateral Instrument 52-110 Audit Committees, the U.S. Securities and Exchange Commission rules and the listing standards of the NYSE MKT LLC.
| |||
|
Executive Resources Committee
| ||||
| Committee members |
● K.T. Hoeg (chair) ● V.L. Young (vice-chair) ● J.M. Mintz |
● D.S. Sutherland ● D.G. Wascom ● S.D. Whittaker | ||
|
None of the members of the executive resources committee currently serves as a chief executive officer of another company.
| ||||
|
Number of
|
Seven meetings of the executive resources committee were held in 2016. | |||
| Mandate |
The executive resources committee is responsible for corporate policy on compensation and for specific decisions on the compensation of the chief executive officer and key senior executives and officers reporting directly to that position. In addition to compensation matters, the committee is also responsible for succession plans and appointments to senior executive and officer positions, including the chief executive officer. The formal mandate of the executive resources committee can be found within the Executive Resources Committee Charter in Appendix A of this circular.
| |||
107
Table of Contents
| Highlights of 2016 |
● Reviewed executive compensation program and principles. ● Approved longer restricted stock unit forfeiture periods. ● Appointment of three officers. ● Continued focus on succession planning for senior management positions.
| |||
| Committee members relevant skills and experience |
Ms. Hoeg, Ms. Whittaker, Mr. Wascom, Mr. Sutherland and Mr. Young had extensive and lengthy experience in managing and implementing their respective companies’ compensation policies and practices in their past role as chief executive officers or members of senior management. Ms. Hoeg, Dr. Mintz, Mr. Sutherland and Ms. Whittaker sit or have sat on compensation committees of one or more public companies. Accordingly, committee members are able to use this experience and knowledge derived from their roles with other companies in judging the suitability of the company’s compensation policies and practices.
| |||
| Role in risk oversight |
The executive resources committee oversees the compensation programs and practices that are designed to encourage appropriate risk assessment and risk management.
| |||
| Independence |
The members of the executive resources committee are independent, with the exception of D.G. Wascom, who is not considered to be independent under the rules of the U.S. Securities and Exchange Commission, Canadian securities rules and the rules of the NYSE MKT LLC due to his employment with Exxon Mobil Corporation. However, the Canadian Coalition for Good Governance’s policy, “Governance Differences of Equity Controlled Corporations” – October, 2011, would view Mr. Wascom as a related director and independent of management and who may participate as a member of the company’s executive resources committee. Mr. Wascom’s participation helps to ensure an objective process for determining compensation of the company’s officers and directors and assists the deliberations of this committee by bringing the views and perspectives of the majority shareholder.
| |||
|
Environment, Health and Safety Committee
| ||||
| Committee members |
● J.M. Mintz (chair) ● D.S. Sutherland (vice-chair) ● K.T. Hoeg
|
● D.G. Wascom ● S.D. Whittaker ● V.L. Young | ||
| Number of meetings in 2016 |
Three meetings of the environment, health and safety committee were held in 2016.
| |||
| Mandate |
The role of the environment, health and safety committee is to review and monitor the company’s policies and practices in matters of the environment, health and safety and to monitor the company’s compliance with legislative, regulatory and corporate standards in these areas. The committee monitors trends and reviews current and emerging public policy in this area. The formal mandate of the environment, health and safety committee can be found within the Environment, Health and Safety Committee Charter in Appendix A of this circular.
| |||
| Highlights in 2016 |
● Personnel and process safety review. ● Emission and environmental incident review. ● Operations integrity management system review. ● Alberta and Ontario climate change regulations review.
| |||
| Role in risk oversight |
The environment, health and safety committee reviews and monitors the company’s policies and practices in matters of environment, health and safety, which policies and practices are intended to mitigate and manage risk in these areas. The committee receives regular reports from management on these matters.
| |||
| Independence |
The members of the environment, health and safety committee are independent, with the exception of D.G. Wascom.
| |||
108
Table of Contents
|
Nominations and Corporate Governance Committee
| ||||
| Committee members |
● S.D. Whittaker (chair) ● J.M. Mintz (vice-chair) ● K.T. Hoeg
|
● D.S. Sutherland ● D.G. Wascom ● V.L. Young | ||
|
Number of
|
Four meetings of the nominations and corporate governance committee were held in 2016. | |||
| Mandate | The role of the nominations and corporate governance committee is to oversee issues of corporate governance as they apply to the company, including the overall performance of the board, review potential nominees for directorship and review the charters of the board and any of its committees. The formal mandate of the nominations and corporate governance committee can be found within the Nominations and Corporate Governance Committee Charter in Appendix A of this circular. | |||
| Highlights in 2016 |
● Reviewed and recommended change to compensation paid to nonemployee directors. ● Approved statement of corporate governance practices. ● Completion of board and committee self-assessment. ● Review of board and committee charters. ● Board succession planning. ● Received updates highlighting key Canadian, US and international governance and regulatory developments.
| |||
| Role in risk oversight |
The nominations and corporate governance committee oversees risk by implementing an effective program for corporate governance, including board composition and succession planning.
| |||
| Independence |
The members of the nominations and corporate governance committee are independent, with the exception of D.G. Wascom, who is not considered to be independent under the rules of the U.S. Securities and Exchange Commission, Canadian securities rules and the rules of the NYSE MKT LLC due to his employment with Exxon Mobil Corporation. However, the Canadian Coalition for Good Governance’s policy, “Governance Differences of Equity Controlled Corporations” – October, 2011, would view Mr. Wascom as a related director and independent of management and who may participate as a member of the company’s nominations and corporate governance committee. Mr. Wascom’s participation helps to ensure an objective nominations process and assists the deliberations of this committee by bringing the views and perspectives of the majority shareholder.
| |||
|
Contributions Committee
| ||||
| Committee members |
● D.S. Sutherland (chair) ● K.T. Hoeg (vice-chair) ● R.M. Kruger ● J.M. Mintz
|
● D.G. Wascom ● S.D. Whittaker ● V.L. Young | ||
|
Number of
|
Three meetings of the contributions committee were held in 2016. | |||
| Mandate |
The role of the contributions committee is to oversee all of the company’s community investment activities, including charitable donations which are presently made through the Imperial Oil Foundation. The formal mandate of the contributions committee can be found within the Contributions Committee Charter in Appendix A of this circular.
| |||
| Highlights in 2016 |
● Reviewed London Benchmarking Standards (LBG) assessment showing Imperial’s overall value to the community of $27 million due to continued investment in research and further improvement to program management costs. ● Contributed $4.2 million in 2016 to support Imperial’s United Way partners across Canada. ● Took steps to reduce administration costs and simplify the process for community partners to apply for funding. ● Supported Fort McMurrary fire response effort with $100 thousand of direct funding and ongoing support of Regional Municipality of Wood Buffalo organizations.
| |||
| Independence |
The majority of the members of the contributions committee are independent (five out of seven) with the exception of R.M. Kruger and D.G. Wascom.
| |||
109
Table of Contents
Board of director compensation
Director compensation discussion and analysis
Changes to directors’ compensation in July 2016 better align the long-term
financial interests of the directors with those of the shareholders
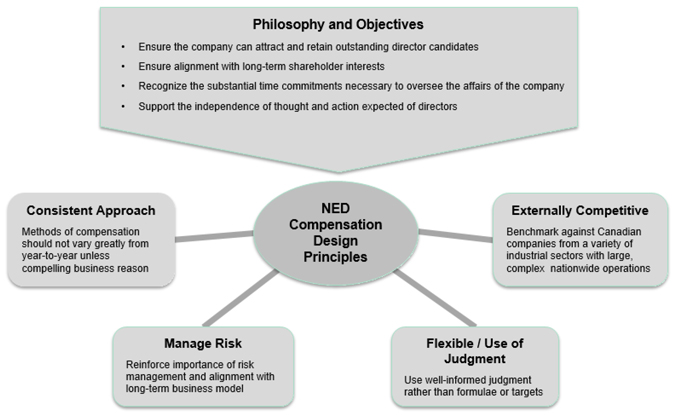
Nonemployee director compensation levels are reviewed by the nominations and corporate governance committee each year, and resulting recommendations are presented to the full board for approval. The nominations and corporate governance committee decided not to use an external research firm to assemble the comparator data to determine compensation for the July 1, 2016 - June 30, 2017 period. The committee relied instead on an internally-led assessment to provide competitive compensation and market data for directors’ compensation, which assisted the committee in making a compensation recommendation for the company’s directors. The internal assessment maintained the compensation design philosophy, objectives and principles and was consistent with previous methodology used in this analysis.
Employees of the company or Exxon Mobil Corporation receive no extra pay for serving as directors. Nonemployee directors receive compensation consisting of cash and restricted stock units. Since 1999, the nonemployee directors have been able to receive all or part of their cash directors’ fees in the form of deferred share units. The purpose of the deferred share unit plan for nonemployee directors is to provide them with additional motivation to promote sustained improvement in the company’s business performance and shareholder value by allowing them to have all or part of their directors’ fees tied to the future growth in value of the company’s common shares. The deferred share unit plan is described in more detail on page 113.
110
Table of Contents
Compensation decision making process and considerations
The nominations and corporate governance committee relies on market comparisons with a group of 21 major Canadian companies with national and international scope and complexity. The company draws its nonemployee directors from a wide variety of industrial sectors and, as such, a broad sample is appropriate for this purpose. The nominations and corporate governance committee does not target any specific percentile among comparator companies at which to align compensation for this group. The 21 comparator companies included in the benchmark sample are as follows:
|
Comparator companies for nonemployee director compensation analysis
| ||
|
Company name
|
Primary industry
| |
|
Bank of Montreal
|
Financial Services | |
|
Bank of Nova Scotia
|
Financial Services | |
|
BCE Inc.
|
Communication Services | |
|
Bombardier Inc.
|
Aerospace & Defence | |
|
Canadian Imperial Bank of Commerce
|
Financial Services | |
|
Canadian National Railway Company
|
Transportation & Logistics | |
|
Canadian Natural Resources Limited
|
Oil & Gas – Exploration & Production | |
|
Canadian Pacific Railway Limited
|
Transportation & Logistics | |
|
Cenovus Energy Inc.
|
Oil & Gas - Integrated | |
|
Encana Corporation
|
Oil & Gas – Exploration & Production | |
|
Husky Energy Inc.
|
Oil & Gas - Integrated | |
|
Manulife Financial Corporation
|
Financial Services | |
|
Potash Corporation of Saskatchewan Inc.
|
Agriculture | |
|
Power Financial Corporation
|
Financial Services | |
|
Royal Bank of Canada
|
Financial Services | |
|
Sun Life Financial Inc.
|
Financial Services | |
|
Suncor Energy Inc.
|
Oil & Gas - Integrated | |
|
TELUS Corporation
|
Communication Services | |
|
Thomson Reuters Corporation
|
Business Support Services | |
|
The Toronto-Dominion Bank
|
Financial Services | |
|
TransCanada Corporation
|
Oil & Gas - Midstream | |
Hedging policy
Company policy prohibits all employees, including executives, and directors, from purchasing or selling puts, calls, other options or futures contracts on the company or Exxon Mobil Corporation stock.
For a discussion on the process by which the compensation of the company’s executive officers is determined, see the Compensation discussion and analysis section starting on page 126.
111
Table of Contents
Director compensation details and tables
Compensation details
Board and Committee Retainer
The compensation of the nonemployee directors is assessed annually. Effective July 1, 2015, the annual retainer for board memberships was $110,000 per year. The nonemployee directors were also paid $20,000 for membership on all board committees. Additionally, each board committee chair received a retainer of $10,000 for each committee chaired. Nonemployee directors were not paid a fee for attending board and committee meetings for each of the seven regularly-scheduled meetings. However, they were eligible to receive a fee of $2,000 per board or committee meeting occurring on any other day. There were no other meetings that occurred outside of the regularly-scheduled meeting dates eligible for this additional fee payment.
In July 2016, the nominations and corporate governance committee recommended, and the board subsequently approved, a change in the compensation paid to the nonemployee directors to better align the long-term financial interests of the directors with those of the shareholders. Effective July 1, 2016, the nonemployee directors received an annual retainer for board membership of $110,000 per year and each board committee chair also received a retainer of $10,000 for each committee chaired. Effective July 1, 2016, the committee membership retainer and the fee for meetings that occur outside of the regularly-scheduled meeting dates were eliminated. The grant of restricted stock units was also increased for 2016 as discussed below.
The following table summarizes the changes that occurred to the director compensation terms in 2016.
|
Director compensation
| ||||
| Annual retainer terms: |
From July 1, 2015 to June 30, 2016
|
Effective July 1, 2016 | ||
|
Cash retainer: (a)
| ||||
|
Board membership
|
$110,000 annually | $110,000 annually | ||
|
Committee membership
|
$ 20,000 annually | None | ||
|
Committee chair
|
$ 10,000 annually | $ 10,000 annually | ||
|
Unscheduled meeting fee
|
$ 2,000 per occurrence if any | None | ||
|
Equity based compensation:
| ||||
| Restricted stock units |
2,000 units (which vest on the 3rd and 7th anniversary of date of grant)
|
2,600 units (which vest on the 5th and 10th anniversary of date of grant) | ||
| (a) | The nonemployee directors may elect to take all or a portion of the cash retainer in the form of deferred share units. |
112
Table of Contents
Equity based compensation
Deferred share units
In 1999, an additional form of long-term incentive compensation (“deferred share units”) was made available to nonemployee directors. Nonemployee directors may elect to receive all or a portion of their cash compensation in the form of deferred share units.
The following table shows the portion of the retainer each nonemployee director elected to receive in cash and deferred share units in 2016.
| Director |
Election for 2016 director’s fees in cash (%) |
Election for 2016 director’s fees in deferred share units (%) | ||
|
K.T. Hoeg
|
0 | 100 | ||
|
J.M. Mintz
|
0 | 100 | ||
|
D.S. Sutherland
|
0 | 100 | ||
|
S.D. Whittaker
|
0 | 100 | ||
|
V.L. Young
|
75 | 25 |
The number of deferred share units granted to a nonemployee director is determined at the end of each calendar quarter for that year by dividing (i) the dollar amount of the nonemployee director’s fees for that calendar quarter that the director elected to receive as deferred share units by (ii) the average of the closing price of the company’s shares on the Toronto Stock Exchange for the five consecutive trading days (“average closing price”) immediately prior to the last day of that calendar quarter. Those deferred share units are granted effective the last day of that calendar quarter.
A nonemployee director is granted additional deferred share units in respect of the unexercised deferred share units on the dividend payment dates for the common shares of the company. The number of such additional deferred share units is determined for each cash dividend payment date by (i) dividing the cash dividend payable for a common share of the company by the average closing price immediately prior to the payment date for that dividend and then (ii) multiplying that resultant number by the number of unexercised deferred share units held by the nonemployee directors on the record date for the determination of shareholders entitled to receive payment of such cash dividend.
A nonemployee director may only exercise these deferred share units by the end of the calendar year following the year of termination of service as a director of the company, including termination of service due to death. No deferred share units granted to a nonemployee director may be exercised unless all of the deferred share units are exercised on the same date.
Restricted stock units
In addition to the cash fees described above, the company pays a significant portion of director compensation in restricted stock units to align director compensation with the long-term interests of shareholders. An award of 2,000 restricted stock units was awarded annually up until 2015 with 50 percent vesting in cash three years from the date of grant and the remaining 50 percent vesting on the seventh anniversary of the grant date. Directors could elect to receive one common share for each unit or a cash payment for the units to be exercised on the seventh anniversary of the date of grant of the restricted stock units.
In 2016, in order to better align the long-term financial interests of the directors with those of the shareholders, the vesting period of the restricted stock units was increased such that 50 percent vests on the fifth anniversary of the date of grant and the remaining 50 percent vests on the tenth anniversary of the date of grant. In addition, the number of units awarded was changed to a grant of 2,600 restricted stock units. Directors may receive one common share or elect to receive a cash payment for all units to be exercised. The vesting periods are not accelerated upon separation or retirement from the board, except in the event of death. The restricted stock unit plan is described in more detail beginning on page 132.
113
Table of Contents
In contrast to the forfeiture provisions for restricted stock units held by employees of the company, the restricted stock units awarded to nonemployee directors are not subject to risk of forfeiture at the time a director leaves the company’s board. This provision is designed to reinforce the independence of these board members. However, while on the board and for a 24-month period after leaving the company’s board, restricted stock units may be forfeited if the nonemployee director engages in direct competition with the company or otherwise engages in any activity detrimental to the company. The board agreed that the word “detrimental” shall not include any actions taken by a nonemployee director or former nonemployee director who acted in good faith and in the best interest of the company.
Prior to vesting of the restricted stock units, the nonemployee directors receive amounts equivalent to the cash dividends paid to holders of regular common stock. The amount is determined for each cash dividend payment date by (i) dividing the cash dividend payable for a common share of the company by the average closing price immediately prior to the payment date for that dividend, and then (ii) multiplying that resultant number by the number of unvested restricted stock units held by the nonemployee directors on the record date of the determination of shareholders entitled to receive payment of such cash dividend.
Other reimbursement
Nonemployee directors are also reimbursed for travel and other expenses incurred for attendance at board and committee meetings.
Components of director compensation
The following table sets out the details of compensation paid to the nonemployee directors in 2016.
|
Director |
Annual retainer for board membership ($) |
Annual retainer for committee membership ($) |
Annual retainer for committee chair ($) |
Restricted stock units (RSU) (#) |
Fee for board and committee meetings not regularly scheduled |
Total fees paid in cash ($) (a) |
Total value of units (DSU) ($) (b) |
Total value of units (RSU) ($) (c) |
All other ($) (d) |
Total ($) | ||||||||||||
|
Number of non- regularly (#) |
Fee ($2,000 x non- regularly ($) |
|||||||||||||||||||||
|
K.T. Hoeg
|
110,000 | 10,000 | 10,000 (ERC) |
2,600 | 0 | 0 | 0 | 130,000 | 117,702 | 20,907 | 268,609 | |||||||||||
|
J.M. Mintz
|
110,000 | 10,000 | 10,000 (EH&S) |
2,600 | 0 | 0 | 0 | 130,000 | 117,702 | 19,271 | 266,973 | |||||||||||
|
D.S. Sutherland
|
110,000 | 10,000 | 10,000 (CC) |
2,600 | 0 | 0 | 0 | 130,000 | 117,702 | 16,334 | 264,036 | |||||||||||
|
S.D. Whittaker
|
110,000 | 10,000 | 10,000 (N&CG) |
2,600 | 0 | 0 | 0 | 130,000 | 117,702 | 34,514 | 282,216 | |||||||||||
|
V.L. Young
|
110,000 | 10,000 | 10,000 (AC) |
2,600 | 0 | 0 | 97,500 | 32,500 | 117,702 | 13,128 | 260,830 | |||||||||||
| (a) | “Total fees paid in cash” is the portion of the “Annual retainer for board membership”, ”Annual retainer for committee membership” and “Annual retainer for committee chair” which the director elected to receive as cash, plus the “Fee for board and committee meetings not regularly scheduled”. This amount is reported as “Fees earned” in the Director compensation table on page 115. |
| (b) | “Total value of deferred share units” is the portion of the “Annual retainer for board membership”, “Annual retainer for committee membership”, and “Annual retainer for committee chair”, which the director elected to receive as deferred share units, as set out in the previous table on page 113. This amount plus the “Total value of restricted stock units” amount is shown as “Share-based awards” in the Director compensation table on page 115. |
| (c) | The values of the restricted stock units shown are the number of units multiplied by the closing price of the company’s shares on the date of grant, which was $45.27. |
| (d) | Amounts under “All other compensation” consist of dividend equivalent payments on unexercised restricted stock units, the value of additional deferred share units granted in lieu of dividends on unexercised deferred share units and security provided for certain directors. In 2016, K.T. Hoeg received $5,800 in dividend equivalent payments on restricted stock units and additional deferred share units valued at $15,107 in lieu of dividends on deferred share units. J.M. Mintz received $5,800 in dividend equivalent payments on restricted stock units and additional deferred share units valued at $12,736 in lieu of dividends on deferred share units. D.S. Sutherland received $5,080 in dividend equivalent payments on restricted stock units and additional deferred share units valued at $11,254 in lieu of dividends on deferred share units. S.D. Whittaker received $5,800 in dividend equivalent payments on restricted stock units and additional deferred share units valued at $28,714 in lieu of dividends on deferred share units. V.L. Young received $5,800 in dividend equivalent payments on restricted stock units and additional deferred share units valued at $7,328 in lieu of dividends on deferred share units. |
114
Table of Contents
Director compensation table
The following table summarizes the compensation paid, payable, awarded or granted for 2016 to each of the nonemployee directors of the company.
| Name (a) |
Fees ($) (c) |
Share- ($) (d) |
Option- ($) |
Non-equity ($) |
Pension (#) |
All
other ($) (e) |
Total ($) | |||||||
|
K.T. Hoeg (b)
|
0 | 247,702 | - | - | - | 20,907 | 268,609 | |||||||
|
J.M. Mintz (b)
|
0 | 247,702 | - | - | - | 19,271 | 266,973 | |||||||
|
D.S. Sutherland (b)
|
0 | 247,702 | - | - | - | 16,334 | 264,036 | |||||||
|
S.D. Whittaker (b)
|
0 | 247,702 | - | - | - | 34,514 | 282,216 | |||||||
|
V.L. Young (b)
|
97,500 | 150,202 | - | - | - | 13,128 | 260,830 |
| (a) | As directors employed by the company or Exxon Mobil Corporation in 2016, R.M. Kruger and D.G. Wascom did not receive compensation for acting as directors. |
| (b) | Starting in 1999, the nonemployee directors have been able to receive all or part of their directors’ fees in the form of deferred share units. |
| (c) | Represents all fees awarded, earned, paid or payable in cash for services as a director, including retainer fees, committee, chair and meeting fees. |
| (d) | The values of the restricted stock units shown are the number of units multiplied by the closing price of the company’s shares on the date of grant. The dollar value of deferred share units shown is the value of the portion of the “Annual retainer for board membership”, “Annual retainer for committee membership” and “Annual retainer for committee chair” which the director elected to receive as deferred share units as noted on page 113. |
| (e) | Amounts under “All other compensation” consist of dividend equivalent payments on unexercised restricted stock units, the value of additional deferred share units granted in lieu of dividends on unexercised deferred share units and security provided for certain directors. In 2016, K.T. Hoeg received $5,800 in dividend equivalent payments on restricted stock units and additional deferred share units valued at $15,107 in lieu of dividends on deferred share units. J.M. Mintz received $5,800 in dividend equivalent payments on restricted stock units and additional deferred share units valued at $12,736 in lieu of dividends on deferred share units. D.S. Sutherland received $5,080 in dividend equivalent payments on restricted stock units and additional deferred share units valued at $11,254 in lieu of dividends on deferred share units. S.D. Whittaker received $5,800 in dividend equivalent payments on restricted stock units and additional deferred share units valued at $28,714 in lieu of dividends on deferred share units. V.L. Young received $5,800 in dividend equivalent payments on restricted stock units and additional deferred share units valued at $7,328 in lieu of dividends on deferred share units. |
|
Five-year look back at total compensation paid to nonemployee directors
| ||
|
Year
|
Amount
| |
|
2012
|
$1,176,166 | |
|
2013
|
$1,245,529 | |
|
2014
|
$1,326,687 | |
|
2015
|
$1,206,084 | |
|
2016
|
$1,342,664 | |
115
Table of Contents
Outstanding share-based awards and option-based awards for directors
The following table sets forth all outstanding awards held by nonemployee directors of the company as at December 31, 2016 and does not include common shares owned by the director.
|
Option-based awards
|
Share-based awards
| |||||||||||
| Name (a) |
Number
of (#) |
Option ($) |
Option expiration date |
Value of money options ($) |
Number of have not vested (#) (b) |
Market
or ($) (c) | ||||||
|
K.T. Hoeg
|
- | - | - | - | 38,243 | 1,786,331 | ||||||
|
J.M. Mintz
|
- | - | - | - | 34,190 | 1,597,015 | ||||||
|
D.S. Sutherland
|
- | - | - | - | 31,656 | 1,478,652 | ||||||
|
S.D. Whittaker
|
- | - | - | - | 61,504 | 2,872,852 | ||||||
|
V.L. Young
|
- | - | - | - | 23,582 | 1,101,515 | ||||||
| (a) | As directors employed by the company or Exxon Mobil Corporation in 2016, R.M. Kruger and D.G. Wascom did not receive compensation for acting as directors. |
| (b) | Represents restricted stock units and deferred share units held as of December 31, 2016. |
| (c) | Value is based on the closing price of the company’s shares on December 31, 2016, which was $46.71. |
Incentive plan awards for directors – Value vested or earned during the year
The following table sets forth the value of the awards that vested or were earned by each nonemployee director of the company in 2016.
|
Name (a) |
Option-based awards – the year ($) |
Share-based awards – Value vested during the year ($) (d) |
Non-equity incentive plan earned during the year ($) | |||
|
K.T. Hoeg (b)
|
- | 89,840 | - | |||
|
J.M. Mintz (b)
|
- | 89,840 | - | |||
|
D.S. Sutherland (c)
|
- | 44,920 | - | |||
|
S.D. Whittaker (b)
|
- | 89,840 | - | |||
|
V.L. Young (b)
|
- | 89,840 | - |
| (a) | As directors employed by the company or Exxon Mobil Corporation in 2016, R.M. Kruger and D.G. Wascom did not receive compensation for acting as directors. |
| (b) | Represents restricted stock units granted in 2009 and 2013, which vested in 2016. |
| (c) | Represents restricted stock units granted in 2013 and vested in 2016. |
| (d) | Value is based on the average of the weighted average price (as determined by the Toronto Stock Exchange) of common shares of the company on the exercise date and the four consecutive trading days immediately prior to the exercise date. |
116
Table of Contents
Share ownership guidelines of independent directors and chairman, president and chief executive officer
Independent directors are required to hold the equivalent of at least 15,000 shares of Imperial Oil Limited, including common shares, deferred share units and restricted stock units. Independent directors are expected to reach this level within five years from the date of appointment to the board. The chairman, president and chief executive officer has separate share ownership requirements and must, within three years of his appointment, acquire shares of the company, including common shares and restricted stock units, of a value of no less than five times his base salary. The board of directors believes that these share ownership guidelines will result in an alignment of the interests of board members with the interests of all other shareholders. As of the date of this circular, the independent directors currently have holdings in excess of 267,000 shares which is more than three times the required guideline.
|
Minimum share ownership
|
Time to fulfill | |||
|
Chairman, president and chief executive officer
|
5 x base salary | Within 3 years of appointment | ||
|
Independent directors
|
15,000 shares | Within 5 years of initial appointment |
The chart below shows the shareholdings of the independent directors and the chairman, president and chief executive officer of the company as of February 8, 2017, the record date of the management proxy circular.
| Director | Director since |
Amount (#) |
Total holdings (includes common shares, deferred share (#) |
Value of total holdings (a) ($) |
Minimum shareholding requirement |
Minimum requirement met or date required to achieve minimum requirement | ||||||
|
K.T. Hoeg |
May 1, 2008
|
4,024 | 38,243 | 1,617,679 | 15,000 | Yes | ||||||
| R.M. Kruger |
March 1, 2013
|
110,000 | 393,500 | 16,645,050 | Five times base salary | Yes | ||||||
|
J.M. Mintz |
April 21, 2005
|
3,968 | 35,190 | 1,488,537 | 15,000 | Yes | ||||||
| D.S. Sutherland |
April 29, 2010
|
4,932 | 76,656 | 3,242,549 | 15,000 | Yes | ||||||
|
S.D. Whittaker |
April 19, 1996
|
4,344 | 70,854 | 2,997,124 | 15,000 | Yes | ||||||
| V.L. Young |
April 23, 2002
|
1,540 | 46,082 | 1,949,269 | 15,000 | Yes | ||||||
| Total accumulated holdings (#) and value of directors’ holdings ($) | 660,525 | 27,940,208 |
| (a) | The amount shown in the column “Value of total holdings” is equal to the “Total holdings” multiplied by the closing price of the company’s shares on February 8, 2017 ($42.30). |
For information relating to compensation of the company’s named executive officers, see the Compensation discussion and analysis section starting on page 126.
117
Table of Contents
The company is committed to high ethical standards through its policies and practices.
The board has adopted a written code of ethics and business conduct (“Code”) which can be found on the company’s website at www.imperialoil.ca.
The Code is applicable to each of the company’s directors, officers and employees, and consists of the ethics policy, the conflicts of interest policy, the corporate assets policy, the directorships policy and the procedures and open door communication. There have been no material change reports filed in the past 12 months pertaining to conduct of a director or executive officer that constitute a departure from the Code. Under the company’s procedures and open door communication, employees are encouraged and expected to refer suspected violations of the law, company policy or internal controls procedures to their supervisors. Suspected violations involving a director or executive officer, as well as any concern regarding questionable accounting or auditing matters are to be referred directly to the internal auditor. The audit committee initially reviews all issues involving directors or executive officers, and then refers all issues to the board of directors. In the alternative, employees may also address concerns to individual nonemployee directors or to nonemployee directors as a group. In addition, the directors of the company must comply with the conflict of interest provisions of the Canada Business Corporations Act, as well as the relevant securities regulatory instruments, in order to ensure that the directors exercise independent judgment in considering transactions and agreements in respect of which such director has a material interest.
Management provides the board of directors with a review of corporate ethics and conflicts of interest on an annual basis. Directors, officers and employees review the company’s standards of business conduct (which includes the Code) on an annual basis, with independent directors and employees in positions where there is a higher risk of exposure to ethical or conflict of interest situations being required to sign a declaration card confirming that they have read and are familiar with the standards of business conduct. In addition, every four years a business practices review is conducted in which managers review the standards of business conduct with employees in their respective work units.
The board, through its audit committee, examines the effectiveness of the company’s internal control processes and management information systems. The board consults with the external auditor, the internal auditor and the management of the company to ensure the integrity of the systems.
There are a number of structures and processes in place to facilitate the functioning of the board independently of management. The board has a majority of independent directors. Each committee is chaired by a different independent director and all of the five independent directors are members of each committee. The audit committee is composed entirely of independent directors. Each other committee (except the contributions committee) is composed entirely of the independent directors and D.G. Wascom, who is an officer of Exxon Mobil Corporation, and is, therefore, independent of the company’s management. The agendas of each of the board and its committees are not set by management alone, but by the board as a whole and by each committee. A significant number of agenda items are mandatory and recurring. Board meetings are scheduled at least one full year in advance. Any director may call a meeting of the board or a meeting of a committee of which the director is a member. There is a board-prescribed flow of financial, operating and other corporate information to all directors.
The independent directors conduct executive sessions in the absence of members of management. These meetings are chaired by S.D. Whittaker, the independent director designated by the independent directors to chair and lead these discussions. Seven executive sessions were held in 2016.
The company’s delegation of authority guide provides that certain matters of the company are reviewed by functional contacts within ExxonMobil. The company’s employees are regularly reminded that they are expected to act in the best interests of the company, and are reminded of their obligation to identify any instances where the company’s general interest may not be consistent with ExxonMobil’s priorities. If such situations ever occurred, employees are expected to escalate such issues with successive levels of the company’s management. Final resolution of any such issues is made by the company’s chairman, president and chief executive officer.
118
Table of Contents
Restrictions on insider trading
Commitment to stringent safeguards with trading restrictions and reporting for company insiders.
Structures and processes are in place to caution, track and monitor reporting insiders, nonemployee directors and key employees with access to sensitive information with respect to personal trading in the company’s shares. Nonemployee directors are required to pre-clear any trades in the company’s shares. Reporting insiders are required to advise within five days of any trades in the company’s shares. Reporting insiders are required, under securities regulations, to publically disclose all transactions in the company’s shares on the System for Electronic Disclosure by Insiders (SEDI).
From time to time, the company advises its directors and officers, and those of Exxon Mobil Corporation, and employees in certain positions not to trade in the company’s shares or to exercise restricted stock units. Trading bans occur in connection with the director’s pending consideration of the financial statements of the company, including the unaudited financial statements for each quarter, and in connection with undisclosed pending events that constitute material information about the business affairs of the company.
The company has a long history of diversity on the board.
Board diversity
The company has a longstanding commitment to diversity amongst its directors. The board composition charts on page 97 show the show the diversity of our board nominees with respect to gender, experience and regional association. The company has had a woman on its board continuously since 1977. Today, two of the seven directors are women, representing 29% of the board and 40% of its independent directors. The company has not adopted a target regarding women on its board. With the objective of fostering a diversity of expertise, viewpoint and competencies, the board charter provides that the nominations and corporate governance committee may consider a number of factors, including gender, in assessing potential nominees. The nominations and corporate governance committee assesses the work experience, other expertise, individual competencies and diversity of age, gender and regional association each existing director possesses and whether each nominee is able to fill any gaps amongst the existing directors. The company does not believe that any one of these dimensions should be considered, without due regard to all of these other factors, in determining the ability of potential directors to contribute to the work of the board of directors.
Executive officer diversity
In considering potential nominees for executive officer appointments, the executive resources committee considers diversity of gender, work experience, other expertise, individual competencies and other dimensions of diversity in addition to the other factors described on page 129. The company has not adopted a target regarding women in executive officer positions. The company does not believe that any one of these dimensions should be considered, without due regard to all of these other factors, in determining the ability of potential nominees to fill executive officers positions. Four executive officers of the company are women, representing 33% of the group.
Shareholder engagement strategy focuses on wide-ranging dialogue between shareholders and management.
The company’s senior management regularly meet with institutional investors and shareholders through industry conferences and roadshows. Materials from these roadshows are available on our website. For shareholders that are not able to attend our annual meeting in person, the company offers a webcast of the event. The webcast is available on the company website along with speeches and presentations from the annual general meeting and the outcome of the voting on each resolution. The company annually solicits questions and comments from registered shareholders on the proxy form. The comments received are reviewed by senior management providing them with an indication of areas of interest to our shareholders and those requiring a response are answered individually.
119
Table of Contents
Exxon Mobil Corporation is the majority shareholder of the company, holding 69.6% of the company’s shares.
To the knowledge of the directors and executive officers of the company, the only shareholder who, as of February 8, 2017, owned beneficially, or exercised control or direction over, directly or indirectly, more than 10 percent of the outstanding common shares of the company is Exxon Mobil Corporation, 5959 Las Colinas Boulevard, Irving, Texas 75039-2298, which owns beneficially 589,928,303 common shares, representing approximately 69.6 percent of the outstanding voting shares of the company. As a consequence, the company is a “controlled company” for purposes of the listing standards of the NYSE MKT LLC and a “majority controlled company” for purposes of the TSX Company Manual.
Transactions with Exxon Mobil Corporation
The company has written procedures that provide that any transactions between the company and Exxon Mobil Corporation and its subsidiaries are subject to review by the chairman, president, and chief executive officer. The board of directors receive an annual review of related party transactions with Exxon Mobil Corporation and its subsidiaries.
On June 25, 2015, the company implemented a 12-month “normal course” share purchase program under which it purchased 925 shares during the program between June 25, 2015 and June 24, 2016, and none from Exxon Mobil Corporation outside of this program. On June 25, 2016, a further 12-month share purchase program was implemented under which the company may purchase up to 1,000,000 of its outstanding shares. In 2016, under the current program, the company purchased 1,050 shares and none from Exxon Mobil Corporation outside of this program.
The amounts of purchases and sales by the company and its subsidiaries for other transactions in 2016 with Exxon Mobil Corporation and affiliates of Exxon Mobil Corporation were $2,187 million and $2,315 million, respectively. These transactions were conducted on terms as favourable as they would have been with unrelated parties, and primarily consisted of the purchase and sale of crude oil, natural gas, petroleum and chemical products, as well as technical, engineering and research and development services. Transactions with Exxon Mobil Corporation also included amounts paid and received in connection with the company’s participation in a number of upstream activities conducted jointly in Canada. In addition, the company has existing agreements with affiliates of Exxon Mobil Corporation to provide computer and customer support services to the company and to share common business and operational support services to allow the companies to consolidate duplicate work and systems. The company has a contractual agreement with an affiliate of Exxon Mobil Corporation in Canada to operate certain Western Canada production properties owned by ExxonMobil. There are no asset ownership changes. The company and that affiliate also have a contractual agreement to provide for equal participation in new upstream opportunities. During 2007, the company entered into agreements with Exxon Mobil Corporation and one of its affiliated companies that provide for the delivery of management, business and technical services to Syncrude Canada Ltd. by ExxonMobil.
As at December 31, 2016, the company had an outstanding loan of $4,447 million under an existing agreement with an affiliated company of Exxon Mobil Corporation that provides for a long term, variable rate loan from ExxonMobil to the company of up to $7.75 billion (Canadian) at market interest rates. The agreement is effective until July 31, 2020, cancellable if ExxonMobil provides at least 370 days advance written notice. Additionally, the company had outstanding short-term loans of $75 million from an affiliated company of ExxonMobil. This loan is borrowed under an arrangement with ExxonMobil that provides for a non-interest bearing, revolving demand loan from ExxonMobil to the company of up to $75 million and represents ExxonMobil’s share of a working capital facility required to support purchasing, marketing and transportation arrangements for crude oil and diluent products undertaken by the company on behalf of ExxonMobil.
120
Table of Contents
Company executives and executive compensation
Named executive officers of the company
The named executive officers of the company at the end of 2016 were:
| Name |
Age (as of February 8, 2017) |
Position held at end of 2016 (date office held) |
Other positions in the past five years (position, date office held and status of employer) | |||||
|
Richard M. Kruger
Calgary, Alberta, Canada |
57 |
Chairman, president and chief executive officer (2013 - Present) |
• |
Vice-president, Exxon Mobil Corporation and president, ExxonMobil Production Company (2008 - 2013) (Affiliate) | ||||
|
Beverley A. Babcock
Calgary, Alberta, Canada |
55 |
Senior vice-president, finance and administration, and controller (2015 – Present) |
• |
Vice-president, corporate financial services, Exxon Mobil Corporation (2013 - 2015) (Affiliate) | ||||
|
• |
Assistant controller, corporate accounting services, Exxon Mobil Corporation (2011 - 2013) (Affiliate) | |||||||
|
Bart P. Cahir
Calgary, Alberta, Canada |
44 |
Senior vice-president, upstream (2015 – Present) |
• |
Production manager and lead country manager, ExxonMobil Qatar Inc. (2011 - 2014) (Affiliate) | ||||
|
William J. Hartnett
Calgary, Alberta, Canada |
67 |
Vice-president and general counsel (2014 – December 2016) |
• |
Assistant general counsel (1992 – 2013) | ||||
|
Theresa B. Redburn
Calgary, Alberta, Canada |
55 |
Vice-president, upstream commercial (2014 – December 2016)
Senior vice-president, commercial and corporate development (January 2017 – Present) |
• |
Commercial manager, upstream ventures Exxon Mobil Corporation (2011 - 2014) (Affiliate) | ||||


121
Table of Contents
Other executive officers of the company
| Name |
Age (as
of |
Position held at end of 2016 (date office held) |
Other positions in the past five years (position, date office held and status of employer) | |||||
|
Tim J. Adams
Calgary, Alberta, Canada
|
56 |
Manager, supply and manufacturing (2015 – Present) |
• |
Supply manager (2012 - 2015) | ||||
|
David G. Bailey
Calgary, Alberta, Canada
|
47 |
Treasurer (2013 – Present) |
• |
Manager, Dallas treasury centre Exxon Mobil Corporation (2010 - 2013) (Affiliate) | ||||
|
Jim E. Burgess
Calgary, Alberta, Canada
|
42 |
Assistant controller (2016 – Present) |
• |
Lead controller and financial accounting process manager, Bangkok business support centre ExxonMobil Limited (2014 – 2016) (Affiliate)
| ||||
| • |
Senior financial advisor Exxon Mobil Corporation (2012 - 2014) (Affiliate) | |||||||
|
Andrew K. Mackay
Calgary, Alberta, Canada
|
49 |
Manager, retail fuels (2011 – Present) |
No other positions held in the last five years | |||||
|
Denise H. Hughes
Calgary, Alberta, Canada
|
49 |
Vice-president, human resources (2013 – Present) |
• |
Manager, executive development, education compensation and benefits (2010 - 2013) | ||||


122
Table of Contents
| Name |
Age (as of February 8, 2017) |
Position held at end of 2016 (date office held) |
Other positions in the past five years (position, date office held and status of employer) | |||||
| Marvin E. Lamb
Calgary, Alberta, Canada
|
61 | Director, corporate tax (2001 – Present) |
No other positions held in the last five years | |||||
|
Lara H. Pella
Calgary, Alberta, Canada
|
47 |
Assistant general counsel and corporate secretary (2013 – Present) |
• |
Assistant general counsel (2010 - 2013) | ||||


123
Table of Contents
Letter to Shareholders from the executive resources committee on executive compensation
Dear Fellow Shareholders:
The executive resources committee (“committee”) would like to outline for you the role of the committee in ensuring good governance in the management of executive compensation within the company.
Compensation governance
The committee is responsible for corporate policy on compensation and for specific decisions on the compensation of the chief executive officer, key senior executives and officers of the company. In exercising this responsibility, the committee views long-term orientation and the management of risk as integral elements of the compensation policies and practices of the company. These policies and practices are designed to keep management, including named executive officers, focused on the strategic objectives of the company over the long term and to effectively assess and mitigate risk in the execution of these objectives. The committee exercises oversight of a compensation program that supports the company’s objective to attract, develop and retain key talent needed to achieve its strategic objectives.
The compensation discussion and analysis (“CD&A”) section that follows describes the compensation program for the company’s named executive officers and how the program supports the business goals of the company. The company’s compensation program is designed to:
| ● | align the interests of its executives with long-term shareholder interests; |
| ● | encourage executives to manage risk and take a long-term view when making investments and managing the assets of the business; |
| ● | reinforce the company’s philosophy that the experience, skill and motivation of the company’s executives are significant determinants of future business success; and |
| ● | promote career orientation and strong individual performance. |
The compensation program design is aligned with the core elements of the majority shareholder’s compensation program, including linkage to short and mid-term aspects of incentive pay, long vesting periods, risk of forfeiture and alignment with the shareholder experience.
We execute our oversight responsibilities in this regard by ensuring the company’s program is built on sound principles of compensation design, including an annual assessment with comparator companies, appropriate risk assessment and risk management practices, sound governance principles, and linkage to the company’s business model. In exercising our oversight and decision making roles, the committee balances many factors each year in terms of impact on compensation decisions relative to the company’s performance.
2016 Business Performance Results
The committee considers both business results and individual performance in its decisions. In 2016 financial performance continued to be affected by lower global crude prices. Notwithstanding the difficult business environment, the committee evaluated the company’s performance relative to its proven business model and strategies to deliver long-term shareholder value. Key 2016 business results include:
| ● | best-ever safety and environmental performance; |
| ● | continued strong risk management and operational integrity; |
| ● | $2.2 billion net income; $2.0 billion cash flow from operations; |
| ● | strong results on cost reduction and prudent cash management: |
| ● | $1.3 billion reduction in operating and capital costs relative to earlier plans |
| ● | 10 percent reduction in upstream unit cash costs year-over-year |
| ● | $3.3 billion reduction in total debt to $5.2 billion |
| ● | $492 million in dividends to shareholders, 22nd consecutive year of growth; |
| ● | production increase at all major upstream assets, record high liquids production: |
| ● | rapid response and strong recovery from Fort McMurray wildfires |
| ● | strong operating performance across downstream businesses: |
| ● | $2.8 billion sale of company-owned Esso retail sites completed as planned |
| ● | record high fuels marketing and lubricants sales volumes |
| ● | excellent refinery capacity utilization excluding turnaround impacts, and |
| ● | completion of the Calgary main campus and upstream research centre. |
124
Table of Contents
Collectively these factors had an impact on 2016 compensation decisions for the named executive officers. The individual committee members, through their experience in compensation and their participation on board committees, are able to understand the company’s overall objectives, operating risks and financial risks. This understanding of the company’s objectives and range of business risks allows an appropriate calibration to the company’s compensation policies and practices.
The committee’s assessment is that the company’s compensation program is working as intended and has been effectively integrated over the long term with the company’s business model. The committee has recommended to the board that the CD&A be included in the company’s management proxy circular for the 2017 annual meeting of shareholders. We encourage you to read the comprehensive disclosure in the CD&A that follows. The committee is committed to overseeing all aspects of the executive compensation program in the best interests of the company and all shareholders.
Submitted on behalf of the executive resources committee,
Original signed by
K.T. Hoeg,
Chair, executive resources committee
V.L. Young, Vice-chair
J.M. Mintz
D.S. Sutherland
S.D. Whittaker
D.G. Wascom
125
Table of Contents
Compensation discussion and analysis
126
Table of Contents
The company takes a long-term view to managing its business.
Providing energy to help meet the demands of both Canada and the rest of North America is a complex business. The company meets this challenge by taking a long-term view to managing its business rather than reacting to short-term business cycles. As such, the compensation program of the company aligns with this long-term business outlook and supports key business strategies as outlined below.
| ● | Large, accessible upstream resources |
| ● | Mature, competitive downstream markets |
| ● | Evolving environmental and fiscal policies impacting global competitiveness |
| ● | Market access limitations, uncertainties |
| ● | Long-life, competitively advantaged assets |
| ● | Disciplined investment and cost management |
| ● | Value-chain integration and synergies |
| ● | High-impact technologies and innovation |
| ● | Operational excellence and responsible growth |
| ● | Personnel safety and operational excellence |
| ● | Grow profitable production and sales volumes |
| ● | Disciplined and long-term focus on improving the productivity of the company’s asset mix |
| ● | Best-in-class cost structure to support industry-leading returns on capital and superior cash flow |
Focus on these key business strategies is a company priority and supports long-term growth in shareholder value.
Key elements of the compensation program
The key elements of the company’s compensation program that align with the business model and support key business strategies are:
| ● | long-term career orientation with high individual performance standards (see page 130); |
| ● | base salary that rewards individual performance and experience (see page 131); |
| ● | annual bonus grants to select executives based on company performance, as well as individual performance and experience (see page 131); |
| ● | payment of a large portion of executive compensation in the form of restricted stock units with long vesting periods and risk of forfeiture (see page 132 through 135); and |
| ● | retirement benefits (pension and savings plans) that provide for financial security after employment (see pages 135 through 136). |
The company operates in an industry environment in which effective risk management is critical. For this reason, the company places a high premium on managing risks, including safety, security, health, environmental, financial, operational and reputational risks. The company’s success in managing risk over time has been achieved through emphasis on execution of a disciplined management framework called the Operations Integrity Management System (OIMS), which has been in place since the early 1990’s. The OIMS framework establishes common expectations for addressing risks inherent in our business and takes priority over other business and financial objectives. The company also has strong controls and compliance programs to manage other types of risk, including fraud, regulatory compliance and litigation risks.
127
Table of Contents
The company’s long-term orientation and compensation program design encourage the highest performance standards and discourage inappropriate risk taking. The compensation program design features described below work together to ensure executives have a clear and strong financial incentive to protect the safety and security of our employees and the communities and environment in which we operate, to effectively manage risk and operate the business with effective business controls, as well as to create value for company shareholders through their actions by increasing shareholder return, net income, return on capital employed, and advancing the long-term strategic direction of the company.
Compensation components
A substantial portion of total compensation (excluding compensatory pension value) to senior executives is in the form of an annual bonus and restricted stock units. In the judgment of the committee, the mix of short, medium and long-term incentives strikes an appropriate balance in aligning the interests of the senior executives with the business priorities of the company and sustainable growth in long-term shareholder value. Ongoing reviews of our compensation program, including incentives, ensure continued relevance of this mix and ongoing applicability for the company.
Annual bonus
| ● | Delayed payout – Payout of 50 percent of the annual bonus is delayed. The timing of the delayed payout is determined by earnings performance. This is a unique feature of the company’s program relative to many comparator companies and further discourages inappropriate risk taking. |
| ● | Recoupment (“claw-back”) and forfeiture – The entire annual bonus is subject to recoupment (“claw-back”) and the delayed portion of the annual bonus is subject to forfeiture in the event of material negative restatement of the company’s reported financial or operating results. This reinforces the importance of the company’s financial controls and compliance programs. Claw-back and forfeiture provisions also apply if an executive resigns or engages in detrimental activity. |
| ● | The company’s annual bonus program is described in more detail on pages 131 and 134. |
Restricted stock units
| ● | Long holding periods – To further reinforce the importance of risk management and a long-term investment orientation, senior executives are required to hold a substantial portion of their equity incentive award for periods that typically far exceed the holding periods of competitor stock programs. The lengthy holding periods are tailored to the company’s business model. |
| ● | Risk of forfeiture – During these long holding periods, the restricted stock units are at risk of forfeiture for resignation or detrimental activity. The long vesting periods on restricted stock units and the risk of forfeiture together support an appropriate risk/reward profile that reinforces the long-term orientation expected of senior executives. |
| ● | The company’s restricted stock unit program is described in more detail on pages 132 through 135. |
Common programs
All executives of the company, including the named executive officers, participate in common programs (the same salary, incentive and retirement programs). Inappropriate risk taking is discouraged at all levels of the company through similar compensation design features and allocation of awards. Within these programs, the compensation of executives is differentiated based on individual performance assessment, level of responsibility and individual experience. All executives on expatriate assignment from Exxon Mobil Corporation, including named executive officers, also participate in common programs, which are administered by Exxon Mobil Corporation. The named executive officers on assignment from Exxon Mobil Corporation receive the company’s restricted stock units. The executive resources committee reviews and approves compensation recommendations for each named executive officer prior to implementation.
Pension
The company’s defined benefit pension plan and supplemental pension arrangements are highly dependent on executives remaining with the company for a career and performing at the highest levels until retirement. This dimension of total compensation encourages executives to take a long-term view when making business decisions and to focus on achieving sustainable growth for shareholders.
128
Table of Contents
Other supporting compensation and staffing practices
| ● | A long established program of management development and succession planning is in place to reinforce a career orientation and ensure continuity of leadership. |
| ● | The use of perquisites at the company is very limited, and mainly composed of financial planning for senior executives and the selective use of club memberships which are largely tied to building business relationships. |
| ● | Tax assistance is provided for employees on expatriate assignment. This assistance consists primarily of a tax equalization component designed to maintain the employees’ overall income tax burden at approximately the same level it would have otherwise been, had they remained in their home country. The expatriate relocation program is broad-based and applies to all executive, management, professional and technical transferred employees. |
Company policy prohibits all employees, including executives, and directors, from purchasing or selling puts, calls, other options or futures contracts on the company or Exxon Mobil Corporation stock.
Business performance and basis for compensation
The assessment of individual performance is conducted through the company’s employee appraisal program. Conducted annually, the appraisal process assesses performance against relevant business performance measures and objectives, including the means by which performance is achieved. These business performance measures may include:
| ● | safety, health and environmental performance; |
| ● | risk management; |
| ● | total shareholder return; |
| ● | net income; |
| ● | return on capital employed; |
| ● | cash distribution to shareholders; |
| ● | operating performance of the upstream, downstream and chemical segments; and |
| ● | effectiveness of actions that support the long-term strategic direction of the company. |
The appraisal process involves comparative assessment of employee performance using a standard process throughout the organization and at all levels. This process is integrated with the compensation program which results in significant pay differentiation between higher and lower performers. The appraisal process is also integrated with the executive development process. Both have been in place for many years and are the basis for planning individual development and succession for management positions. The decision-making process with respect to compensation requires judgment, taking into account business and individual performance and responsibility. Quantitative targets or formulae are not used to assess individual performance or determine the amount of compensation.
The succession planning process fosters the company’s approach to a career orientation and promotion from within. This approach strengthens continuity of leadership and supports ongoing alignment with our long-term business model. This process helps to assess the competence and readiness of individuals for senior executive positions. The executive resources committee is responsible for approving specific succession plans for the position of chairman, president and chief executive officer and key senior executive positions reporting to him, including all officers of the company.
The executive resources committee regularly reviews the company’s succession plans for key senior executive positions. It considers candidates for these positions from within the company and certain candidates from ExxonMobil. This is an in-depth review of succession plans, which includes the consideration of various aspects of diversity as well as plans to address gaps, if any, for key executives. For example, the company has had a long-standing practice to regularly review with senior management the progress of women, which includes topics such as recruitment, attrition, relocation, training and development. There continues to be growth in the representation of female company executives, which is now approximately one third. The chairman, president and chief executive officer also discusses the strengths, progress and development needs of key succession candidates each year. This provides the board an opportunity to confirm a pipeline of key and diverse talent exists to enable achievement of long-term strategic objectives. The executive resources committee makes recommendations to the board of directors for selection of all officers of the company, as well as other key senior executive positions reporting to the chairman, president and chief executive officer.
129
Table of Contents
The company’s compensation program is designed to reward outstanding performance,
promote retention, and encourage long-term business decisions.
The company’s objective is to attract, develop and retain over a career the best talent available. It takes a long period of time and significant investment to develop the experienced executive talent necessary to succeed in the company’s business; senior executives must have experience with all phases of the business cycle to be effective leaders. The company’s compensation program elements are designed to encourage a career orientation among employees at all levels of the company. Career orientation among a dedicated and highly skilled workforce, combined with the highest performance standards, contributes to the company’s leadership in the industry and serves the interests of shareholders in the long term. The company service of the named executive officers reflects this on-going strategy. As of February 8, 2017, their career service ranges from approximately 23 to 36 years.
Consistent with the company’s long-term career orientation, high-performing executives typically earn substantially higher levels of compensation in the final years of their careers than in the earlier years. This pay practice reinforces the importance of a long-term focus in making decisions that are key to business success.
The compensation program emphasizes individual experience and sustained performance; executives holding similar positions may receive substantially different levels of compensation.
The company’s executive compensation program is composed of base salaries, cash bonuses and medium and long-term incentive compensation. The company does not have written employment contracts or any other agreement with its named executive officers providing for payments on change of control or termination of employment. The following chart provides an overview of the combined elements of the compensation program for executives, including the ‘pay at risk’ horizon for the executives.
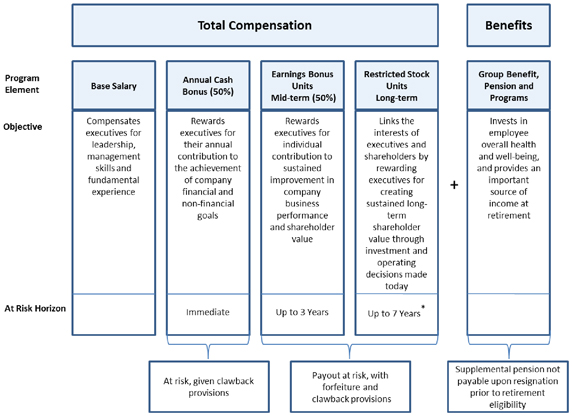
* For the chairman, president and chief executive officer, at risk horizon is up to 10 years or retirement, whichever is later
130
Table of Contents
Salaries provide executives with a base level of income. The level of annual salary is based on the executive’s responsibility, performance assessment and career experience. Individual salary increases vary depending on each executive’s performance assessment and other factors such as time in position and potential for advancement. Salary decisions also directly affect the level of retirement benefits since salary is included in the retirement benefit calculation. Thus, the level of retirement benefits is also performance-based, like other elements of compensation. The salary program in 2016 maintained the company’s desired competitive orientation in the marketplace.
The bonus program is established annually by the executive resources committee based on financial and operating performance, and can be highly variable depending on these results.
In establishing the annual bonus program, the executive resources committee:
| ● | considers input from the chairman, president and chief executive officer on the performance of the company and from the company’s internal compensation advisors regarding compensation trends as obtained from external consultants; |
| ● | considers annual net income of the company and other key business performance indicators as described on page 129; |
| ● | uses judgment to manage the overall size of the annual bonus program taking into consideration the cyclical nature and long-term orientation of the business; and |
| ● | considers a comparison with the majority shareholder. |
The annual bonus program incorporates unique elements to further reinforce retention and recognize performance. Awards under this program are generally delivered as:

The cash component is intended to be a short-term incentive, while the earnings bonus unit plan is intended to be a medium-term incentive. Earnings bonus units are made available to eligible executives to promote individual contribution to sustained improvement in the company’s business performance and shareholder value. Earnings bonus units are generally equal to and granted in tandem with cash bonuses. Individual bonus awards vary depending on each executive’s performance assessment.
Specifically, earnings bonus units are cash awards that are tied to future cumulative earnings per share, which aligns the interests of executives with those of long-term shareholders. Earnings bonus units pay out when a specified level of cumulative earnings per share (or trigger) is achieved or in three years at a reduced level. The trigger is intentionally set at a level that is expected to be achieved within the three-year period and reinforces the company’s principle of continuous improvement in business performance.
If cumulative earnings per share do not reach the trigger within three years, the payment with respect to the earnings bonus units will be reduced to an amount equal to the number of units times the actual cumulative earnings per share over the three-year period.
The annual bonus includes the combined value of the cash bonus and delayed earnings bonus unit portion and is intended to be competitive with the annual bonus awards of other major comparator companies adjusted to reflect the company’s performance relative to its comparators. The amount of the award, once vested, will never exceed the original grant value. In so doing, the delayed portion of the annual bonus, that is the earnings bonus unit, puts part of the annual bonus at risk of forfeiture and thus reinforces the performance basis of the annual bonus grant.
In 2016, an annual bonus was granted to approximately 65 executives to reward their contributions to the business during the past year. The cost of the 2016 annual bonus program was $3.0 million versus $4.4 million in 2015. For earnings bonus units granted in 2016, the maximum settlement value (trigger) or cumulative earnings per share required for payout remained at $3.50.
131
Table of Contents
Long-term incentive compensation – Restricted stock units
The vesting periods of the company’s long-term incentive program are greater
than those in use by comparator companies.
The company’s only long-term incentive compensation plan is a restricted stock unit plan, in place since December 2002. The current plan’s vesting periods are as follows:
| ● | for the chairman, president and chief executive officer: |
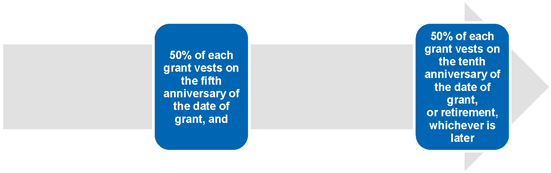
| ● | for all other executives: |
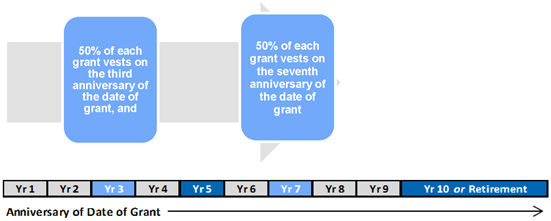
Granting compensation in the form of restricted stock units with long vesting periods as described above is aligned with the long-term nature of the company’s business. This stock program design helps keep executives focused on the key premise that decisions made today affect the performance of the organization and company stock for many years to come. This practice supports a risk/reward model that reinforces a long-term view, which is critical to the company’s business success, and discourages inappropriate risk taking.
The basis for the grant includes an annual assessment of individual performance including a review of business performance results as noted on page 138. The amount granted is intended to provide an incentive to promote individual contribution to the company’s performance and to remain with the company. Grant level guidelines for the restricted stock unit program award the same number of shares for the same level of individual performance and classification or level of responsibility, and may be adjusted periodically based on an assessment of the program’s competitive orientation. An individual’s grant amount may be reduced at time of grant, if near-term performance is deemed to have changed significantly at that time. As a matter of principle, the company does not offset losses on prior grants with higher share awards in subsequent grants, nor does the company re-price restricted stock units. Restricted stock units are not included in pension calculations.
132
Table of Contents
The vesting periods, which are typically greater than those in use by other companies, reinforce the company’s focus on growing shareholder value over the long term by linking a large percentage of executive compensation and the shareholding net worth of executives to the return on the company’s stock realized by shareholders. The vesting period for restricted stock unit awards is not subject to acceleration, except in the case of death. The long vesting periods ensure that a substantial portion of the compensation received by the chairman, president and chief executive officer, as well as other key senior executives, will be received subsequent to retirement. The value of this compensation is at risk in the event that their decisions prior to retirement negatively impact share market value after retirement. The objective of these aforementioned vesting periods is to hold senior executives accountable for many years into the future, and even into retirement, for investment and operating decisions made today. This type of compensation design removes employee discretion in the timing of exercising restricted stock units, supports alignment with the long-term interests of shareholders, and reinforces retention objectives.
In 2016, after an analysis of the competitive orientation of the company’s restricted stock unit program, it was determined that current levels of restricted stock units were appropriate and that the program continues to align with the design of the majority shareholder’s program. In 2016, 421 recipients, including 58 executives, were granted 815,870 restricted stock units.
Exercise of restricted stock units
Restricted stock units will be exercised pursuant to the vesting provisions described in the previous section. Restricted stock units cannot be assigned.
Upon vesting, each restricted stock unit entitles the recipient to the right to receive an amount equal to the value of one common share of the company, based on the five day average closing price of the company’s shares on the vesting date and the four preceding trading days. For units granted to senior executives other than the chairman, president and chief executive officer, 50 percent of the units will be exercised as a cash payment on the third and seventh anniversary of the grant date, with the following exception: for units granted to Canadian residents, the recipient may receive one common share of the company per unit or elect to receive a cash payment for the units to be exercised on the seventh anniversary. For all units granted to the chairman, president and chief executive officer, upon vesting, the recipient may receive one common share of the company per unit or elect to receive a cash payment for the units to be exercised on the vesting date. During the restricted period, the recipient will also receive cash payments equivalent to the cash dividends paid to holders of regular common stock.
As of February 8, 2017 there are 3,549,133 common shares that may be issued in the future with respect to outstanding restricted stock units that represent about 0.42 percent of the company’s currently outstanding common shares. The company’s directors, officers and vice-presidents as a group hold approximately 15 percent of the unexercised restricted stock units that give the recipient the right to receive common shares that represent about 0.06 percent of the company’s outstanding common shares. Currently, the maximum number of common shares that any one person may receive from the exercise of restricted stock units is 393,500 common shares, which is about 0.05 percent of the outstanding common shares. In the case of any subdivision, consolidation, or reclassification of the shares of the company or other relevant change in the capitalization of the company, the company, in its discretion, may make appropriate adjustments in the number of common shares to be issued and the calculation of the cash amount payable per restricted stock unit.
Exxon Mobil Corporation has a plan similar to the company’s restricted stock unit plan, under which grantees may receive restricted stock or restricted stock units, both of which are referred to herein as Exxon Mobil Corporation restricted stock. R.M. Kruger holds Exxon Mobil Corporation restricted stock granted in 2012 and previous years, as well as the company’s restricted stock units granted since 2013. B.P. Cahir also holds Exxon Mobil Corporation restricted stock granted in 2014 and previous years, as well as the company’s restricted stock units granted since 2015.
133
Table of Contents
Amendments to the restricted stock unit plan
In 2008, the company’s restricted stock unit plan was amended to provide that the number of common shares of the company issuable under the plan to any insiders (as defined by the Toronto Stock Exchange) cannot exceed 10 percent of the issued and outstanding common shares, whether at any time or as issued in any one year. The Toronto Stock Exchange advised that this amendment did not require shareholder approval. Additionally, shareholders approved the following changes to the restricted stock unit plan:
| ● | In addition to the existing three and seven year vesting provisions, include an additional vesting period option for 50 percent of restricted stock units to vest on the fifth anniversary of the date of grant, with the remaining 50 percent of the grant to vest on the later of the tenth anniversary of the date of grant or the date of retirement of the grantee. The recipient of such restricted stock units may receive one common share of the company per unit or elect to receive the cash payment for all units to be exercised. The choice of which vesting period provision to use will be at the discretion of the company. |
| ● | Set out which amendments in the future will require shareholder approval, and which amendments will only require director approval and to set an exercise price based on the weighted average price of the company’s shares on the exercise date and the four consecutive trading days immediately prior to the exercise date. |
As of November 2011, the restricted stock unit plan was amended to include language confirming the long-standing practice of not forfeiting any restricted stock units in the event that grantee’s continued employment terminates on or after the date grantee reaches the age of 65 in circumstances where grantee becomes entitled to an annuity under the company’s retirement plan.
As of October 2016, the restricted stock unit plan was amended to update provisions regarding forfeiture of restricted stock units in the event of detrimental activity and to provide a new vesting option in addition to the existing vesting options previously described, such that the second 50 percent of the restricted stock units may vest on the tenth anniversary following the grant date.
The company’s incentive plans include forfeiture and claw-back provisions that discourage
employees from taking inappropriate risks and engaging in detrimental activities.
The annual bonus is subject to forfeiture and claw-back if:
| ● | An executive retires or terminates employment with the company. |
| ● | The company has indicated its intention not to forfeit outstanding awards of employees who retire at age 65. In other circumstances, where a recipient retires or terminates employment, the company may determine that awards shall not be forfeited. |
| ● | Risk of forfeiture and claw-back continues to exist for detrimental activity. |
| ● | An executive, without the consent of the company, engages in any activity, during employment or after retirement or the termination of employment, which is detrimental to the company, including working for a competitor. |
| ● | In 2016, the plan was amended to extend the forfeiture period for detrimental activity from two years to the life of the award. |
| ● | There is a material negative restatement of the company’s reported financial or operating results. For executive officers of the company, some or all of any unvested earnings bonus units granted in the three years prior to the restatement are subject to forfeiture. In addition, any cash amounts received from bonus or earnings bonus units that were paid out up to five years prior to the restatement are subject to claw-back. |
134
Table of Contents
Restricted stock units are subject to forfeiture and claw-back if:
| ● | A recipient retires or terminates employment with the company. |
| ● | The company has indicated its intention not to forfeit restricted stock units of employees who retire at age 65. In other circumstances, where a recipient retires or terminates employment, the company may determine that restricted stock units shall not be forfeited. |
| ● | Risk of forfeiture and claw-back continues to exist for detrimental activity. |
| ● | A recipient, without the consent of the company, engages in any activity, during employment or after retirement or termination of employment, which is detrimental to the company, including working for a competitor. |
| ● | With respect to executives, at any time prior to vesting of the outstanding awards. |
| ● | With respect to all other employees, for a period of up to three years after retirement or the termination of employment. |
| ● | In 2016, the plan was amended to extend the forfeiture period for detrimental activity from two years to the periods noted above. |
Named executive officers participate in the same pension plan, including supplemental pension arrangements outside the registered plan, as other employees, except for R.M. Kruger and B.P. Cahir who participate in the Exxon Mobil Corporation pension plans (both tax-qualified and non-qualified).
The estimated annual benefits that would be payable to each named executive officer of the company upon retirement under the company’s pension plan and the supplemental pension arrangements, or under Exxon Mobil Corporation’s tax-qualified and non-qualified pension plans, and the change in the defined benefit obligation for each named executive officer of the company in 2016 can be found in the pension plan benefits table beginning on page 146.
The company’s defined benefit plan was amended in 2015 to provide a single 1.5 percent accrual formula for employees hired on and after September 1, 2015. All plan participants employed prior to the date of the change will continue to accrue pension benefits based on accrual formulae in place prior to September 1, 2015. The company’s supplemental pension arrangements address any portions of the defined benefit that cannot be paid from the registered plan. Any amounts paid to an eligible employee, in this regard, are subject to the employee meeting the terms of the registered pension plan and the criteria of the supplemental pension arrangements, as applicable. The company does not grant additional pension service credit.
Predecessor plans have been in place since 1919, including a historic provision with a 1.6 percent accrual formula that was closed to new participants at the end of 1997. All named executive officers, except those who are participants in Exxon Mobil Corporation’s plans (R.M. Kruger and B.P. Cahir), are participants in this historic 1.6 percent provision of the plan. It can provide an annual benefit of 1.6 percent of final three-year average earnings per each year of service, with a partial offset for applicable government pension benefits. An employee participating in this provision may elect to forego a portion of the company’s matching contributions to the savings plan to receive additional pension value equal to 0.4 percent of the employee’s final three-year average earnings, multiplied by the employee’s years of service, while foregoing such company contributions. For participants of this provision, earnings, for the purpose of the company’s registered pension plan, include average base salary over the highest 36 consecutive months in the 10 years of service prior to retirement. The company’s supplemental pension arrangements address any portions of the formula that cannot be paid from the registered plan due to tax regulations.
For the named executive officers, the company’s supplemental pension arrangements similarly provide an annual benefit of 1.6 percent of final average bonus earnings times years of service. Earnings, for the purpose of the supplemental pension arrangement related to cash bonus and earnings bonus units, include the average annual bonus for the highest three of the last five years prior to retirement for eligible executives, but do not include restricted stock units. By limiting inclusion of bonuses only to those granted in the five years prior to retirement, there is a strong incentive for executives to continue to perform at a high level. Annual bonus includes the cash amounts that are paid at grant and the value of any earnings bonus units received, as described on page 131. The aggregate maximum settlement value that could be paid for earnings bonus units is included in the employee’s final three year average earnings for the year of grant of such units. The value of the earnings bonus units are expected to pay out, subject to forfeiture provisions, and are included for supplemental pension arrangement purposes in the year of grant rather than the year of payment.
135
Table of Contents
The remuneration used to determine the payments on retirement to the individuals named in the summary compensation table on page 142 corresponds generally to the salary, bonus and earnings bonus units received in the current year, as previously described. As of February 8, 2017, the number of completed years of service with the company was 29.8 for B.A. Babcock and 31.7 for T.B. Redburn. W.J. Hartnett retired on December 31, 2016 with 36.7 years of completed service.
R.M. Kruger and B.P. Cahir are not participants in the company’s pension plan, but are participants in Exxon Mobil Corporation’s pension plans. Under those plans, as of February 8, 2017, R.M. Kruger had 35.6 years of credited service and B.P. Cahir had 22.6 years of credited service. Their respective pensions are payable in U.S. dollars. Pay for the purpose of the pension calculation is based on final average base salary over the highest 36 consecutive months in the 10 years of service prior to retirement, and the average annual bonus for the three highest grants out of the last five grants prior to retirement.
The company maintains a savings plan into which career employees with more than one year of service may contribute between one and 30 percent of normal earnings. The company provides contributions which vary depending on the amount of employee contributions and in which defined-benefit pension arrangement the employee participates. All named executive officers are eligible to receive a company matching contribution of up to six percent, except for R.M. Kruger and B.P. Cahir, who participate in the Exxon Mobil Corporation savings plan, which has provisions different from the company plan.
Employee and company contributions can be allocated in any combination to a non-registered (tax-paid) account, a registered (tax-deferred) group retirement savings plan (RRSP) or a tax-free savings account (TFSA), subject to contribution limits under the Income Tax Act, as applicable.
Available investment options include cash savings, a money market mutual fund, a suite of four index-based equity or bond mutual funds and company shares. As of February 8, 2017, employees hold 7,448,430 shares through the company savings plan and the employees are allowed to vote these shares.
During employment, withdrawals are only permitted from employee contributions within the tax-paid account, to a maximum of three withdrawals per year. Lump-sum transfers are permitted to the TFSA from employee contributions to the tax-paid account. These transfers are considered a withdrawal and are included in the three-per-year withdrawal limit for the tax-paid account. Unlimited withdrawals are permitted from the TFSA. Assets in the RRSP account, and company contributions to the tax-paid account, may only be withdrawn upon retirement or termination of employment, reinforcing the company’s long-term approach to total compensation. Income tax regulations require RRSPs to be converted into an eligible form of retirement income by the end of the calendar year in which the individual reaches age 71.
Compensation decision making process and considerations for named executive officers
In addition to the assessment of business performance, individual performance and level of responsibility, the executive resources committee relies on market comparisons to a group of 22 major Canadian companies whose revenues (or the revenues of their parent companies) exceed $1 billion a year.
The following criteria are used to select comparator companies:
| ● | Canadian companies; |
| ● | large operating scope and complexity; |
| ● | capital intensive; and |
| ● | proven sustainability. |
136
Table of Contents
The 22 companies benchmarked are as follows:
|
Comparator companies for named executive officers compensation analysis
| ||
|
Company Name
|
Primary Industry
| |
| Agrium Inc. | Agriculture | |
| BP Canada Energy Group ULC | Oil & Gas – Exploration & Production | |
| BCE Inc. | Communication Services | |
| Canadian Pacific Railway Limited | Transportation & Logistics | |
| Canadian Tire Corporation Limited | Retail – Apparel & Specialty | |
| Cenovus Energy Inc. | Oil & Gas – Integrated | |
| Chevron Canada Limited | Oil & Gas – Integrated | |
| ConocoPhillips Canada | Oil & Gas – Exploration & Production | |
| Devon Canada Corporation | Oil & Gas – Exploration & Production | |
| Enbridge Inc. | Oil & Gas – Midstream | |
| Encana Corporation | Oil & Gas – Exploration & Production | |
| General Electric Canada | Industrial Products | |
| Husky Energy Inc. | Oil & Gas – Integrated | |
| IBM Canada Ltd. | Information Technology | |
| Nexen Energy ULC | Oil & Gas – Exploration & Production | |
| NOVA Chemicals Corporation | Industrial Products – Chemicals and fertilizers | |
| Procter & Gamble Inc. | Consumer Staples – Household Products | |
| Repsol (formerly Talisman Energy Inc.) | Oil & Gas – Exploration & Production | |
| Royal Bank of Canada | Financial Services | |
| Shell Canada Limited | Oil & Gas – Integrated | |
| Suncor Energy Inc. | Oil & Gas – Integrated | |
| TransCanada Corporation | Oil & Gas – Midstream | |
The company is a national employer drawing from a wide range of disciplines. It is important to understand its competitive orientation relative to a variety of oil and non-oil employers. Compensation trends across industries, based on survey data, are prepared annually by an independent external consultant with additional analysis and recommendation provided by the company’s internal compensation advisors. Consistent with the executive resources committee’s practice of using well-informed judgment rather than formulae to determine executive compensation, the committee does not target any specific percentile among comparator companies to align compensation. The focus is on a broader and more flexible orientation, generally a range around the median of the comparator companies’ compensation. This approach applies to salaries and the annual incentive program that includes bonus and restricted stock units.
As a secondary source of data, the executive resources committee also considers a comparison with the majority shareholder when it determines the annual bonus program. For the restricted stock unit program, the executive resources committee also reviews a summary of data of the comparator companies provided by the same external consultant in order to assist in assessing total value of long-term compensation grants. As a result, grant level guidelines may be adjusted periodically to maintain the program’s competitive orientation. As a matter of principle, the company does not offset losses on prior grants with higher share awards in subsequent grants, nor does the company re-price restricted stock units.
137
Table of Contents
This overall approach provides the company with the ability to:
| ● | better respond to changing business conditions; |
| ● | manage salaries based on a career orientation; |
| ● | minimize potential for automatic increasing of salaries, which could occur with an inflexible and narrow target among benchmarked companies; and |
| ● | differentiate salaries based on performance and experience levels among executives. |
Details of the compensation assessment for the named executive officers are outlined below and on page 139.
Analytical tools – Compensation summary sheets
The compensation summary sheet is a matrix used by the executive resources committee that shows the individual elements and total compensation for each senior executive. The summary sheet is used to understand how decisions on each individual element of compensation affect total compensation for each senior executive. The committee considers both current compensation recommendations and prior compensation results in its final determination.
The elements of the Exxon Mobil Corporation compensation program, including salary and annual bonus and equity (long-term) compensation considerations for R.M. Kruger and B.P. Cahir, are similar to those of the company. The data used for long-term compensation determination for R.M. Kruger and B.P. Cahir is as described above, as they received company restricted stock units in 2016. The executive resources committee reviews and approves recommendations for each named executive officer prior to implementation. R.M. Kruger’s compensation determination is described in more detail starting on page 139.
2016 named executive officer compensation assessment
When determining the annual compensation for the named executive officers, the executive resources committee has reflected on the following business performance result indicators in its determination of 2016 salary and incentive compensation.
Business performance results for consideration
The operating and financial performance measurements listed below and the company’s continued maintenance of sound business controls and a strong corporate governance environment formed the basis for the salary and incentive award decisions made by the executive resources committee in 2016. The executive resources committee considered the results over multiple years, relative to the company’s proven business model and strategies, to deliver long-term shareholder value.
| ● | Best-ever safety and environmental performance |
| ● | Continued strong risk management and operational integrity |
| ● | $2.2 billion net income; $2.0 billion cash flow from operations |
| ● | Strong results on cost reduction and prudent cash management |
| ● | $1.3 billion reduction in operating and capital costs relative to earlier plans |
| ● | 10 percent reduction in upstream unit cash costs year-over-year |
| ● | $3.3 billion reduction in total debt to $5.2 billion |
| ● | $492 million in dividends to shareholders, 22nd consecutive year of growth |
| ● | Production increase at all major upstream assets, record high liquids production |
| ● | rapid response and strong recovery from Fort McMurray wildfires |
| ● | Strong operating performance across downstream businesses |
| ● | $2.8 billion sale of company-owned Esso retail sites completed as planned |
| ● | record high fuels marketing and lubricants sales volumes |
| ● | excellent refinery capacity utilization excluding turnaround impacts |
| ● | Completion of the Calgary main campus and upstream research centre |
138
Table of Contents
Performance assessment considerations
The preceding results form the context in which the committee assesses the individual performance of each senior executive, taking into account experience and level of responsibility.
Annually, the chairman, president and chief executive officer reviews the performance of the senior executives in achieving business results and individual development needs.
The same long-term key business strategies noted on page 127 and results noted on page 138 are key elements in the assessment of the chairman, president and chief executive officer’s performance by the executive resources committee.
The performance of all named executive officers is also assessed by the board of directors throughout the year during specific business reviews and board committee meetings that provide information on strategy development; operating and financial results; safety, health, and environmental results; business controls; and other areas pertinent to the general performance of the company.
The executive resources committee does not use quantitative targets or formulae to assess individual executive performance or determine compensation. The executive resources committee does not assign weights to the factors considered. Formula-based performance assessments and compensation typically require emphasis on two or three business metrics. For the company to be an industry leader and effectively manage the technical complexity and integrated scope of its operations, most senior executives must advance multiple strategies and objectives in parallel, versus emphasizing one or two at the expense of others that require equal attention.
Senior executives and officers are expected to perform at the highest level or they are replaced. If it is determined that another executive is ready and would make a stronger contribution than one of the current incumbents, a replacement plan is implemented.
2016 chief executive officer compensation assessment
R.M. Kruger was appointed chairman, president and chief executive officer of the company on March 1, 2013. Mr. Kruger has worked for Exxon Mobil Corporation and its predecessor companies since 1981 in various upstream and downstream assignments with responsibilities in the United States, the former Soviet Union, the Middle East, Africa and Southeast Asia. Prior to his assignment with the company, Mr. Kruger was vice-president of Exxon Mobil Corporation and president of ExxonMobil Production Company, a division of Exxon Mobil Corporation, with responsibility for ExxonMobil’s global oil and gas producing operations. His level of salary was determined by the executive resources committee based on his individual performance and to align with that of his peers in ExxonMobil. It was also the objective of the executive resources committee to ensure appropriate internal alignment with senior management in the company. The committee approved a salary increase of $10,000 U.S. to $870,000 U.S., effective January 1, 2017.
Mr. Kruger’s 2016 annual bonus was based on his performance as assessed by the executive resources committee since his appointment to the position of chairman, president and chief executive officer. His long-term incentive award was granted in the form of company restricted stock units, not Exxon Mobil Corporation restricted stock, to reinforce alignment of his interests with that of the company’s shareholders. His company restricted stock units are subject to vesting periods longer than those applied by most companies conducting business in Canada. Fifty percent of the restricted stock units awarded vest in five years and the other 50 percent vest on the later of 10 years from the date of grant or the date of retirement. The purpose of these long vesting periods is to reinforce the long investment lead times in the business and to link a substantial portion of Mr. Kruger’s shareholding net worth to the performance of the company. As such, the payout value of the long-term incentive grants may differ from the amounts shown in the summary compensation table, depending on how the company actually performs at time of future vesting. During these vesting periods, the awards are subject to risk of forfeiture based on detrimental activity or leaving the company before normal retirement.
The executive resources committee has determined that the overall compensation of Mr. Kruger is appropriate based on the company’s financial and operating performance and its assessment of his effectiveness in leading the organization.
139
Table of Contents
Key factors considered by the committee in determining his overall compensation level include:
| ● | safety metrics and environmental performance; |
| ● | risk management; |
| ● | progress on advancing long-term strategic interests; |
| ● | financial results; |
| ● | government relations; |
| ● | productivity; |
| ● | leadership; |
| ● | cost effectiveness; and |
| ● | asset management. |
Taking all factors into consideration, the committee’s decisions on compensation of the chief executive officer reflect judgment, rather than the application of formulae or targets. The higher level of pay for Mr. Kruger, compared to the other named executive officers, reflects his greater level of responsibility, including his ultimate responsibility for the performance of the company, and oversight of the other senior executives.
Pay awarded to other named executive officers
Within the context of the compensation program structure and performance assessment processes previously described, the value of 2016 incentive awards and salary adjustments align with:
| ● | performance of the company; |
| ● | individual performance; |
| ● | long-term strategic plan of the business; and |
| ● | annual compensation of comparator companies. |
Taking all factors into consideration, the executive resources committee’s decisions on pay awarded to other named executive officers reflect judgment, rather than the application of formulae or targets. The executive resources committee approved the individual elements of compensation and the total compensation as shown in the summary compensation table on page 142.
In fulfilling its responsibilities during 2016, the executive resources committee did not retain an independent consultant or advisor in determining compensation for any of the company’s officers or any other senior executives. The company’s management retained an independent consultant to provide an assessment of competitive compensation and market data for all salaried levels of employees of the company. While providing this data, they did not provide individual compensation recommendations or advice for the compensation of the chairman, president and chief executive officer or other senior executives.
140
Table of Contents
The following graph shows changes over the past 10 years in the value of $100 invested in (i) Imperial Oil Limited common shares, (ii) the S&P/TSX Composite Index, and (iii) the S&P/TSX Composite Energy Index. The S&P/TSX Composite Energy Index is currently made up of share performance data for 50 oil and gas companies including integrated oil companies, oil and gas producers and oil and gas service companies.
The year-end values in the graph represent appreciation in share price and the value of dividends paid and reinvested. The calculations exclude trading commissions and taxes. Total shareholder returns from each investment, whether measured in dollars or percent, can be calculated from the year-end investment values shown beneath the graph.
During the past 10 years, the company’s cumulative total shareholder return was 21 percent, for an average annual return of 2 percent. Over the past five years, the cumulative total shareholder return was 9 percent. Total direct compensation for named executive officers generally reflects the trend in total shareholder returns as the largest single component of executive compensation is awarded in the form of restricted stock units with long holding periods. This design reinforces the company’s focus on growing shareholder value over the long term by linking executive compensation and the shareholding net worth of executives to the return on the company’s stock realized by shareholders. Total direct compensation includes salary, the annual bonus (cash and earnings bonus unit awards), and the grant date fair value of the restricted stock unit award which is equal to the price for the company’s stock on the date of grant.
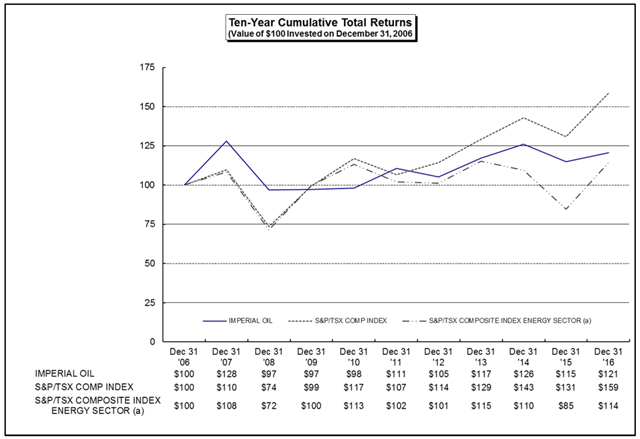
| (a) | Effective December 21, 2012, S&P discontinued the S&P/TSX Equity Energy Index. This was replaced with the S&P/TSX Composite Energy Index (STENRSR). |
141
Table of Contents
Executive compensation tables and narratives
The following table shows the compensation for the chairman, president and chief executive officer; the senior vice-president, finance and administration, and controller and the three other most highly compensated executive officers of the company who were serving as at the end of 2016. This information includes the Canadian dollar value of base salaries, cash bonus awards and earnings bonus unit payments, long-term incentive compensation and certain other compensation. Amounts in the Summary compensation table pertain to the named executive officers’ respective periods of assignment with the company.
|
Name and principal position at the end of 2016 |
Year |
Salary ($) |
Share- based awards ($) (b) |
Option- based awards ($) (c) |
Non-equity incentive plan compensation ($) |
Pension value ($) (f) |
All other compensation ($) (g) |
Total ($) (h) | ||||||||||||||
| Annual incentive (d)
|
Long- term (e)
|
|||||||||||||||||||||
|
R.M. Kruger (a) Chairman, president and chief executive officer |
2016
|
1,139,328 | 4,979,700 | - | 356,371 | 0 | (379,289) | 1,481,708 | 7,577,818 | |||||||||||||
|
2015
|
1,062,600 | 4,224,365 | - | 444,348 | 611,219 | (353,857) | 3,022,231 | 9,010,906 | ||||||||||||||
|
2014
|
881,391 | 4,837,802 | - | 527,951 | 659,828 | (593,013) | 579,018 | 6,892,977 | ||||||||||||||
|
B.A. Babcock Senior vice-president, finance and administration, and controller (since September 1, 2015) |
2016
|
495,750 | 995,940 | - | 74,700 | 0 | (12,700) | 113,294 | 1,666,984 | |||||||||||||
|
2015
|
163,333 | 922,900 | - | 106,900 | 0 | (656,200) | 80,770 | 617,703 | ||||||||||||||
|
B.P. Cahir (a) Senior vice-president, upstream (since January 1, 2015) |
2016
|
646,502 | 733,374 | - | 76,838 | 0 | 79,797 | 1,126,871 | 2,663,382 | |||||||||||||
|
2015
|
604,825 | 679,590 | - | 106,132 | 88,230 | 249,944 | 1,035,220 | 2,763,941 | ||||||||||||||
|
W.J. Hartnett Vice-president and general counsel |
2016
|
475,967 | 995,940 | - | 73,300 | 0 | (329,100) | 145,712 | 1,361,819 | |||||||||||||
|
2015
|
459,167 | 922,900 | - | 104,500 | 0 | 180,300 | 63,631 | 1,730,498 | ||||||||||||||
|
2014
|
434,333 | 1,037,428 | - | 145,900 | 293,114 | 309,900 | 59,478 | 2,280,153 | ||||||||||||||
|
T.B. Redburn Vice-president, upstream commercial (since August 1, 2014) |
2016
|
444,167 | 733,374 | - | 57,600 | 0 | (136,000) | 60,241 | 1,159,382 | |||||||||||||
|
2015
|
427,167 | 679,590 | - | 82,500 | 0 | (589,100) | 55,689 | 655,846 | ||||||||||||||
|
2014
|
174,167 | 878,638 | - | 128,500 | 115,018 | (375,000) | 18,434 | 939,757 | ||||||||||||||
142
Table of Contents
Footnotes to the Summary compensation table for named executive officers
| (a) | R.M. Kruger and B.P. Cahir have been on an expatriate assignment from Exxon Mobil Corporation since March 1, 2013 and January 1, 2015 respectively. Their compensation is paid directly by Exxon Mobil Corporation in U.S. dollars, but is disclosed in Canadian dollars. The company pays them directly with respect to the vesting of the company’s restricted stock units and dividend equivalents on outstanding restricted stock units. They also receive employee benefits under Exxon Mobil Corporation’s employee benefit plans, and not under the company’s employee benefit plans. The company reimburses Exxon Mobil Corporation for applicable compensation paid and employee benefits provided to them. The company does not reimburse Exxon Mobil Corporation for the cost of incentive awards granted by Exxon Mobil Corporation. All amounts paid to R.M. Kruger and B.P. Cahir in U.S. dollars were converted to Canadian dollars at the average 2016 exchange rate of 1.3248. In 2015 and 2014 the average exchange rate was 1.2787 and 1.1045 respectively. |
| (b) | The grant date fair value equals the number of restricted stock units multiplied by the closing price of the company’s shares on the date of grant. The closing price of the company’s shares on the grant date in 2016 was $45.27, which is the same as the accounting fair value for the restricted stock units on the date of grant. The closing price of the company’s shares on the grant date in 2015 was $41.95 and in 2014 was $52.93, which is the same as the accounting fair value for the restricted stock units on the date of grant. The company chose this method of valuation as it believes it results in the most accurate representation of fair value. |
| (c) | The company has not granted stock options since 2002. The stock option plan expired in 2012. |
| (d) | The amounts listed in the “Annual incentive plans” column for each named executive officer represent their 2016 cash bonus. R.M. Kruger and B.P. Cahir participate in Exxon Mobil Corporation’s annual cash bonus program, which is similar to the company’s plan. |
| (e) | The amounts listed in the “Long-term incentive plans” column represent earnings bonus unit payouts related to prior year grants. These are paid when the maximum settlement value (trigger) or cumulative earnings per share is achieved or after three years if such value is not achieved. The plan is described on page 131. R.M. Kruger and B.P. Cahir participate in Exxon Mobil Corporation’s earnings bonus unit program, which is similar to the company’s plan. Their payouts are also subject to a maximum settlement value (trigger) or cumulative earnings per share. In 2016, no earnings bonus units paid out. |
| (f) | “Pension value” is the “Compensatory change” in pensions as of December 31, 2016 as set out in the “Pension plan benefits” table on page 146. |
| (g) | Amounts under “All other compensation” include dividend equivalent payments on restricted stock units granted, savings plans contributions, expatriate assignment costs, parking and the cost of perquisites including financial planning and business club memberships, as well as security costs and costs associated with participation in Exxon Mobil Corporation’s executive life insurance benefit plan, as applicable. |
| ● | For each named executive officer, the aggregate value of perquisites received was not greater than $50,000 or 10 percent of the named executive officer’s base salary. |
| ● | It is noted that in 2016, the actual dividend equivalent payments on company restricted stock units were $150,332 for R.M. Kruger, $64,827 for B.A. Babcock, $7,128 for B.P. Cahir, $50,773 for W.J. Hartnett and $43,194 for T.B. Redburn. The dividend equivalent payments on Exxon Mobil Corporation restricted stock granted in previous years were $658,510 for R.M. Kruger and $76,195 for B.P. Cahir. These amounts were converted to Canadian dollars at the average 2016 exchange rate of 1.3248. In 2015 and 2014, the average exchange rate was 1.2787 and 1.1045, respectively. |
| ● | For the named executive officers on expatriate assignment from Exxon Mobil Corporation (R.M. Kruger and B.P. Cahir), “All other compensation” also includes expatriate assignment costs which consist of expatriate allowances and the net effect of tax equalization costs in the year. Tax equalization costs include the net effect of taxes paid by the companies to local taxing authorities on behalf of the named executive officer offset by a withholding from their income that approximates the amount of tax they would pay if they had not gone on expatriate assignment. Tax equalization is an integral part of the expatriate relocation program and is designed to maintain an individual’s overall tax burden at approximately the same level it would have otherwise been, had they remained in their home country. Due largely to tax timing and rate differences between Canada and the U.S., tax equalization amounts vary from one year to the next and the net impact may be positive or negative in the year. |
| (h) | “Total compensation” for 2016 consists of the total dollar value of “Salary”, “Share-based awards”, “Option-based awards”, “Non-equity incentive plan compensation”, “Pension value” and “All other compensation”. |
143
Table of Contents
Outstanding share-based awards and option-based awards for named executive officers
The following table sets forth all share-based and option-based awards outstanding for each of the named executive officers of the company as at December 31, 2016.
|
Option-based awards
|
Share-based awards
| |||||||||||||
| Name | Number
of (#) |
Option exercise price ($) |
Option date |
Value
of money options ($) |
Number
of (#) (c) |
Market
or vested ($) (c) |
Market or based awards ($) | |||||||
|
R.M. Kruger (a)
|
- |
-
|
-
|
-
|
393,500
|
18,380,385
|
-
| |||||||
|
B.A. Babcock
|
-
|
-
|
-
|
-
|
111,500
|
5,208,165
|
-
| |||||||
|
B.P. Cahir (b)
|
-
|
-
|
-
|
-
|
32,400
|
1,513,404
|
-
| |||||||
|
W.J. Hartnett
|
-
|
-
|
-
|
-
|
96,800
|
4,521,528
|
-
| |||||||
|
T.B. Redburn
|
-
|
-
|
-
|
-
|
76,950
|
3,594,335
|
-
| |||||||
| (a) | R.M. Kruger was granted restricted stock units from 2013 to 2016 under the company’s plan. With respect to previous years, R.M. Kruger participated in Exxon Mobil Corporation’s restricted stock plan, which is similar to the company’s restricted stock unit plan. Under that plan, R.M. Kruger held 141,350 Exxon Mobil Corporation restricted stock whose value on December 31, 2016 was $17,130,504 based on a closing price for Exxon Mobil Corporation shares on December 31, 2016 of $90.26 U.S., which was converted to Canadian dollars at the noon-rate for December 31, 2016 of 1.3427 provided by the Bank of Canada. |
| (b) | B.P. Cahir was granted restricted stock units in 2015 and 2016 under the company’s plan. With respect to previous years, B.P. Cahir participated in Exxon Mobil Corporation’s restricted stock plan, which is similar to the company’s restricted stock unit plan. Under that plan, B.P. Cahir held 15,600 Exxon Mobil Corporation restricted stock whose value on December 31, 2016 was $1,890,597 based on a closing price for Exxon Mobil Corporation shares on December 31, 2016 of $90.26 U.S., which was converted to Canadian dollars at the noon-rate for December 31, 2016 of 1.3427 provided by the Bank of Canada. |
| (c) | Represents the total of the outstanding restricted stock units received from the company plan in 2010 through 2016. The value is based on the closing price of the company’s shares on December 31, 2016 of $46.71. |
144
Table of Contents
Incentive plan awards for named executive officers – Value vested or earned during the year
The following table sets forth the value of the incentive plan awards that vested for each named executive officer of the company for the year.
| Name | Option-based awards – Value vested during the year ($) |
Share-based awards – Value ($) (c) |
Non-equity incentive plan ($) (d) | |||
|
R.M. Kruger (a)
|
- | - | - | |||
|
B.A. Babcock
|
- | 1,010,700 | 74,700 | |||
|
B.P. Cahir (b)
|
- | - | - | |||
|
W.J. Hartnett
|
- | 668,185 | 73,300 | |||
|
T.B. Redburn
|
- | 644,602 | 57,600 |
| (a) | Although R.M. Kruger received restricted stock units under the company’s plan from 2013 to 2016, these restricted stock units have not vested. In previous years, R.M. Kruger participated in Exxon Mobil Corporation’s restricted stock plan, which is similar to the company’s restricted stock unit plan, under which the grantee may receive Exxon Mobil Corporation restricted stock. In 2016, restrictions were removed on 25,450 Exxon Mobil Corporation restricted stock having a value as at December 31, 2016 of $3,084,339 based on the closing price of Exxon Mobil Corporation common shares of $90.26 U.S., which was converted to Canadian dollars at the noon-rate for December 31, 2016 of 1.3427 provided by the Bank of Canada. R.M. Kruger received an annual bonus from Exxon Mobil Corporation in 2016 and participates in Exxon Mobil Corporation’s earnings bonus unit plan, which is similar to the company’s earnings bonus unit plan. R.M. Kruger received $356,371 with respect to the annual cash bonus received in 2016, which amount was paid in U.S. dollars and is converted to Canadian dollars at the average 2016 exchange rate of 1.3248. In 2016, no earnings bonus units paid out. |
| (b) | Although B.P. Cahir received restricted stock units under the company’s plan in 2015 and 2016, these restricted stock units have not vested. In previous years, B.P. Cahir participated in Exxon Mobil Corporation’s restricted stock plan, which is similar to the company’s restricted stock unit plan, under which the grantee may receive Exxon Mobil Corporation restricted stock. In 2016, restrictions were removed on 3,700 Exxon Mobil Corporation restricted stock having a value as at December 31, 2016 of $448,411 based on the closing price of Exxon Mobil Corporation common shares of $90.26 U.S., which was converted to Canadian dollars at the noon-rate for December 31, 2016 of 1.3427 provided by the Bank of Canada. B.P. Cahir received an annual bonus from Exxon Mobil Corporation in 2016 and participates in Exxon Mobil Corporation’s earnings bonus unit plan, which is similar to the company’s earnings bonus unit plan. B.P. Cahir received $76,838 with respect to the annual cash bonus received in 2016, which amount was paid in U.S. dollars and is converted to Canadian dollars at the average 2016 exchange rate of 1.3248. In 2016, no earnings bonus units paid out. |
| (c) | These values show restricted stock units granted by the company that vested in 2016. The value is based on the five day average closing price of the company’s shares, which includes the vesting date and the four preceding trading days. For B.A. Babcock, W.J. Hartnett and T.B. Redburn the value represents restricted stock units granted in 2009 and 2013, which vested in 2016. |
| (d) | These values include the annual cash bonus received in 2016 and any earnings bonus unit payouts related to prior year grants. In 2016, no earnings bonus units paid out. |
145
Table of Contents
Equity compensation plan information
The following table provides information on the common shares of the company that may be issued as of the end of 2016 pursuant to compensation plans of the company.
| Plan category |
Number of securities to of outstanding options, (#) (c) |
Weighted average exercise price of warrants and rights ($) |
Number of securities remaining (#) (c) | |||
|
Equity compensation plans approved by security holders (a)
|
- | - | - | |||
|
Equity compensation plans not approved by security holders (b)
|
3,552,383 | - | 6,933,879 | |||
|
Total
|
3,552,383 | 6,933,879 |
| (a) | The company’s stock option plan expired in 2012. |
| (b) | This is a restricted stock unit plan, which is described starting on page 132. |
| (c) | The number of securities reserved for the restricted stock unit plan represents the securities reserved for restricted stock units issued in 2008 through 2016 and still outstanding. |
| Name |
Number of
years (as of December 31, (#) |
Annual benefits payable ($) |
Opening value
of benefit ($) (e) |
Compensatory ($) (f) |
Non- compensatory ($) (g) |
Closing value of benefit ($) (h) | ||||||||
|
At year- end (c)
|
At age 65 (d)
|
|||||||||||||
|
R.M. Kruger (a)
|
-
|
-
|
-
|
-
|
-
|
-
|
-
| |||||||
|
B.A. Babcock (b)
|
29.7
|
392,700
|
512,500
|
5,893,500
|
(12,700)
|
492,100
|
6,372,900
| |||||||
|
B.P. Cahir (a)
|
-
|
-
|
-
|
-
|
-
|
-
|
-
| |||||||
|
W.J. Hartnett (b)
|
36.7
|
478,100
|
478,100
|
6,681,200
|
(329,100)
|
2,509,000
|
8,861,100
| |||||||
|
T.B. Redburn (b)
|
31.6
|
350,800
|
474,700
|
5,495,000
|
(136,000)
|
562,300
|
5,921,300
| |||||||
| (a) | Member of the Exxon Mobil Corporation pension plans, including tax-qualified and non-qualified plans. As of December 31, 2016, R.M. Kruger had 35.5 years of credited service and B.P. Cahir had 22.5 years of credited service. All amounts referenced were converted from U.S. dollars to Canadian dollars at the average 2016 exchange rate of 1.3248. |
| (b) | Member of the company’s 1.6 percent pension plan as supplemented by payments from the company for amounts beyond the regulatory limits for the registered plan. |
| (c) | For members of the company’s pension plan, the annual benefits include the amount of the accrued annual lifetime pension from the company’s registered pension plan and supplemented by payments from the company. For members of the Exxon Mobil Corporation pension plans, the annual benefits include the accrued annual lifetime pension from the Exxon Mobil Corporation tax-qualified plan and the accrued annual amount calculated under the Exxon Mobil Corporation non-qualified plans. For R.M. Kruger this value was $1,387,130 and for B.P. Cahir this value was $297,943. Non-qualified plan benefits are payable only as a lump sum equivalent upon retirement. |
146
Table of Contents
| (d) | For members of the company’s pension plan, the annual benefits include the amount of the accrued annual lifetime pension from the company’s registered pension plan and supplemented by payments from the company that would be earned to age 65 assuming final average earnings as at December 31, 2016. For members of the Exxon Mobil Corporation pension plans, the annual benefits include the annual lifetime pension from Exxon Mobil Corporation’s tax-qualified plan and the annual amount calculated under the Exxon Mobil Corporation non-qualified plans that would be earned to age 65 assuming final average earnings as at December 31, 2016. For R.M. Kruger this value was $1,670,490 and for B.P. Cahir this value was $585,540. Non-qualified plan benefits are payable only as a lump sum equivalent upon retirement. |
| (e) | For members of the company’s pension plan, the “Opening present value of defined benefit obligation” is defined for purposes of authoritative guidance under U.S. generally accepted accounting principles (GAAP) for defined benefit pension plans and is calculated based on earnings eligible for pension as described previously and Yearly Maximum Pensionable Earnings (YMPE) as defined by the Canada Revenue Agency, projected to retirement and pro-rated on service to the date of valuation, December 31, 2015. The calculations assume that the Canada Pension Plan offset is based on the annual maximum benefit at retirement and the Old Age Security (OAS) offset is based on the OAS benefit in the fourth quarter of 2015 projected to retirement. For members of the Exxon Mobil Corporation pension plans, the “Opening present value of defined benefit obligation” is defined under GAAP and is calculated based on earnings eligible for pension as described previously. The calculations assume that the U.S. Social Security offset against the Exxon Mobil Corporation qualified plan benefit is calculated on the basis of the Social Security law in effect as of year-end 2015. For R.M. Kruger this value was $17,530,923 and for B.P. Cahir this value was $3,160,377. |
| (f) | The value for “Compensatory change” includes service cost for 2016 and the impact of change in earnings on the projected benefit obligation. For members of the company’s plan, these values are calculated using the individual’s additional pensionable service in 2016 and the actual salary and bonus received in 2016 as described previously. For members of the Exxon Mobil Corporation pension plans, these values are calculated using the individual’s additional pensionable service in 2016 and the projected salary and bonus. There were no plan amendments in 2016 that affected these benefits. These values are calculated on a basis that is consistent with GAAP and with the valuation that was performed for accounting purposes for the plans. For R.M. Kruger this value was ($379,289) and for B.P. Cahir this value was $79,797. |
| (g) | The value for “Non-compensatory change” includes the impact of experience not related to earnings, benefit payments and change in measurement assumptions. With respect to the company pension plan, the discount rate used to determine the closing present value of defined benefit obligation at the end of 2016 decreased to 3.75 percent, from 4.0 percent at the end of 2015, which had a positive impact on the non-compensatory change element. For members of the Exxon Mobil Corporation pension plans, the value for “Non-compensatory change” includes the impact of experience not related to earnings or service. This includes the effect of interest based on a discount rate of 4.25 percent at the end of 2016, unchanged from the end of 2015, and operation of the plan’s rules for converting annuities to lump sums upon retirement. For R.M. Kruger this value was $1,757,045 and for B.P. Cahir this value was $160,971. |
| (h) | For members of the company’s pension plan, the “Closing present value of defined benefit obligation” is defined under GAAP and is calculated based on earnings eligible for pension as described previously and YMPE, projected to retirement and pro-rated on service to the date of valuation, December 31, 2016. The calculations assume that the Canada Pension Plan offset is based on the annual maximum benefit at retirement and the OAS offset is based on the OAS benefit in the fourth quarter of 2016 projected to retirement. For members of the Exxon Mobil Corporation pension plans, the “Closing present value of defined benefit obligation” is defined under GAAP and is calculated based on earnings eligible for pension as described previously. The calculations assume that the U.S. Social Security offset against the Exxon Mobil Corporation qualified plan benefit is calculated on the basis of the Social Security law in effect as of year-end 2016. For R.M. Kruger this value was $18,908,679 and for B.P. Cahir this value was $3,401,145. |
Status of prior long-term incentive compensation plans
The company’s only long-term incentive compensation plan is the restricted stock unit plan described on pages 132 through 133. There are no units outstanding for any historical plan.
147
Table of Contents
Appendix A – Board of Director and Committee Charters
Board of Directors Charter
The structure, process and responsibilities of the board of directors of the corporation shall include the following items and matters:
1. Responsibility
The directors shall be responsible for the stewardship of the corporation.
2. Duty of care
The directors, in exercising their powers and discharging their duties, shall:
| (a) | act honestly and in good faith with a view to the best interests of the corporation; and |
| (b) | exercise the care, diligence and skill that a reasonably prudent person would exercise in comparable circumstances. |
3. Stewardship process
| 1) | In order to carry out their responsibility for stewardship within their duty of care, the directors shall, directly or through one or more committees of directors, |
| (a) | contribute to the formulation of and approve strategic plans on at least an annual basis; |
| (b) | identify the principal risks of the corporation’s business where identifiable and oversee the implementation of appropriate systems to manage such risks; |
| (c) | oversee succession planning for senior management, including the appointing, training and monitoring thereof; |
| (d) | approve the corporate disclosure policy and monitor the external communications of the corporation; |
| (e) | monitor the integrity of the corporation’s internal control and management information systems; |
| (f) | consider management’s recommendations regarding major corporation decisions and actions, which have significant societal implications; |
| (g) | monitor compliance with major corporate policies; |
| (h) | charge the chief executive officer of the corporation with the general management and direction of the business and affairs of the corporation; |
| (i) | monitor the performance of the chief executive officer; |
| (j) | satisfy itself as to the integrity of the chief executive officer and other executive officers and ensure that the chief executive officer and the other executive officers create a culture of integrity throughout the company; |
| (k) | approve the corporation’s code of ethics and business conduct; |
| (l) | monitor compliance with the code of ethics and business conduct, provided that any waivers from the code that are granted for the benefit of the issuer’s directors or executive officers should be granted by the board only; |
148
Table of Contents
| (m) | meet with the frequency necessary to consider the range of items listed below; |
| (n) | by appropriate charter resolutions, establish the audit, executive resources, nominations and corporate governance, environment, health and safety, and contributions committees of the board with specific duties defined; |
| (o) | direct the distribution to them by management of information that will enhance their familiarity with the corporation’s activities and the environment in which it operates, as set out in clause 5; |
| (p) | review the mandates of the board and of the committees and their effectiveness at least annually; and, |
| (q) | undertake such additional activities within the scope of their responsibilities as may be deemed appropriate in their discretion. |
4. Range of items to be considered by the board
| 1) | The following categories and specific items shall be referred to the board for information or decision on a regularly scheduled basis, to the extent appropriate: |
Organization/legal
| ● | fixing of the number of directors |
| ● | director appointments to fill interim vacancies |
| ● | director slate for election by the shareholders |
| ● | officer appointments |
| ● | board governance processes |
| ● | by-laws and administrative resolutions |
| ● | changes in fundamental structure of the corporation |
| ● | shareholder meeting notice and materials |
| ● | nonemployee director compensation |
| ● | policies adopted by the board |
| ● | investigations and litigation of a material nature |
Financial
| ● | equity or debt financing |
| ● | dividend declarations |
| ● | financial statements and the related management discussion and analysis, annual and quarterly |
| ● | status of the corporation’s retirement plan and employee savings plan |
Strategic/investment/operating plans/performance
| ● | near-term and long-range outlooks |
| ● | capital, lease, loan and contributions budgets annually |
| ● | budget additions over $250 million individually |
| ● | quarterly updates of actual and projected capital expenditures |
| ● | capital expenditures or dispositions in excess of $250 million individually |
| ● | entering into any venture that is outside of the corporation’s existing businesses |
| ● | financial and operating results quarterly |
| ● | Canadian and world economic outlooks |
| ● | regional socio-economic reviews |
| 2) | In addition to the items which are specific to the categories identified above, the chief executive officer shall refer to the board for information or decision all other items of corporate significance; and any member of the board may request a review of any such item. Items to be referred to the committees of the board are specified in their respective charters. |
149
Table of Contents
5. Information to be received by the board
| 1) | Material under the following general headings, including the specific items listed below and only other similar items, shall be distributed to directors on a regular basis: |
Information manual (Directors’ Digest)
| ● | articles of incorporation, by-laws and administrative resolutions |
| ● | corporate policies |
| ● | corporate data |
| ● | board and management processes |
| ● | financial and operating report |
| ● | organization outline |
Social/political/economic environment
| ● | public issues updates |
| ● | economic outlook |
| ● | external communications packages |
Major announcements
| ● | press releases |
| ● | speeches by management |
| ● | organization changes |
Communications to shareholders
Other significant submissions, studies and reports
| 2) | All material distributed to employee directors shall be through normal corporation channels. All material distributed to nonemployee directors shall be through the office of the corporate secretary. |
6. Unrelated and independent directors
| 1) | Subject to occasions when there is a temporary vacancy in respect of a director who is unrelated and independent or when there is a need to accommodate succession for one or more senior executives who are directors, the board intends to be composed of a majority of unrelated and independent directors. |
| 2) | In respect of each director to be appointed to fill a vacancy and each director to be nominated for election or re-election by the shareholders, the board shall make an express determination as to whether he or she is an unrelated or an independent director and, for a director who may become a member of the audit committee, whether he or she is an audit committee financial expert or financially literate. |
| 3) | The term “unrelated director”, as defined by the Toronto Stock Exchange, means a director who is independent of management and is free from any interest and any business or other relationship which could, or could reasonably be perceived to, materially interfere with the director’s ability to act with a view to the best interests of the corporation, other than interests and relationships arising from shareholding. |
| 4) | The term “independent”, within the meaning of applicable law, means that the director may not, other than in his or her capacity as a member of the board of directors, or any other board committee, |
(i) accept any consulting, advisory, or other compensatory fee from the issuer; or
(ii) be an affiliated person of the issuer or any subsidiary thereof.
150
Table of Contents
7. Independent legal or other advice
The board and, with the approval of the board, any director, may engage independent counsel and other advisors at the expense of the corporation.
8. Meetings of the unrelated and independent directors in the absence of members of management
| 1) | Meetings of the unrelated and independent directors (“executive sessions of the board”) shall be held in conjunction with all board meetings including unscheduled telephonic board meetings. |
| 2) | The chair of the executive sessions of the board shall be chosen by the unrelated and independent directors. |
| 3) | The chair of the executive sessions of the board, or in the chair’s absence an unrelated and independent director chosen by the unrelated and independent directors, shall |
| (a) | preside at executive sessions of the board; |
| (b) | ensure that meetings of the unrelated and independent directors are held in accordance with this charter; and |
| (c) | review, and modify if necessary the agenda of the meetings of the board in advance to ensure that the board may successfully carry out its duties. |
| 4) | The purposes of the executive sessions of the board shall include the following: |
| (a) | to raise substantive issues that are more appropriately discussed in the absence of management; |
| (b) | to discuss the need to communicate to the chairman of the board any matter of concern raised by any committee or any director; |
| (c) | to address issues raised but not resolved at meetings of the board and assess any follow-up needs with the chairman of the board; |
| (d) | to discuss the quality, quantity, and timeliness of the flow of information from management that is necessary for the unrelated and independent directors to effectively and responsibly perform their duties, and advise the chairman of the board of any changes required; and |
| (e) | to seek feedback about board processes. |
9. Selection and tenure of directors
The guidelines for selection and tenure of directors shall be as follows:
| (a) | Selection |
In considering the qualifications of potential nominees for election as directors, the nominations and corporate governance committee considers the work experience and other areas of expertise of the potential nominees with the objective of providing for diversity among non-employee directors. The following key criteria are considered to be relevant to the work of the board of directors and its committees:
Work Experience
| ● | Experience in leadership of businesses or other large organizations (Leadership of large organizations) |
151
Table of Contents
| ● | Operations/technical experience (Operations/technical) |
| ● | Project management experience (Project management) |
| ● | Experience in working in a global work environment (Global experience) |
| ● | Experience in development of business strategy (Strategy development) |
Other Expertise
| ● | Audit committee financial expert |
| ● | Expertise in financial matters (Financial expertise) |
| ● | Expertise in managing relations with government (Government relations) |
| ● | Experience in academia or in research (Academic/research) |
| ● | Expertise in information technology (Information technology) |
| ● | Expertise in executive compensation policies and practices (Executive compensation) |
In addition, the nominations and corporate governance committee may consider the following additional factors:
| ● | possessing expertise in any of the following areas: law, science, marketing, administration, social/political environment or community and civic affairs; |
| ● | individual competencies in business and other areas of endeavour in contributing to the collective experience of the directors; and |
| ● | providing diversity in age, gender or regional association. |
The nominations and corporate governance committee shall then assess what work experience and other expertise each existing director possesses. The nominations and corporate governance committee shall identify individuals qualified to become new board members and recommend to the board the new director nominees. In making its recommendations, the nominations and corporate governance committee shall consider the work experience and other expertise that the board considers each existing director to possess and which each new nominee will bring. The nominations and corporate governance committee may also consider the additional factors noted above and any other factors which it believes to be relevant.
A candidate may be nominated for directorship after consideration has been given as to his or her degree of compatibility with the following criteria, i.e., as to whether he or she:
| ● | will not adversely affect the requirements with respect to citizenship and residency for the directors imposed by the Canada Business Corporations Act; |
| ● | possesses the ability to contribute to the broad range of issues with which the directors and any one or all of the committees of directors must deal; |
| ● | is able to devote the necessary amount of time to prepare for and attend all meetings of the directors and committees of directors, and to keep abreast of significant corporate developments; |
| ● | is free of any present or apparent potential legal impediment or conflict of interest, such as: |
| Ø | serving as an employee or principal of any organization presently providing a significant level of service to the corporation or which might so provide to the corporation, for example, institutions engaged in commercial banking, underwriting, law, management consulting, insurance, or trust companies; or of any substantial customer or supplier of the corporation; |
| Ø | serving as an employee or director of a competitor of the corporation, such as petroleum or chemical businesses, or of a significant competitor of corporations represented by a director of this corporation; |
| Ø | serving as the chief executive officer or a top administrator of an organization that has the chief executive officer or a top administrator of this corporation serving as director; |
152
Table of Contents
| ● | is expected to remain qualified to serve for a minimum of five years; |
| ● | will not, at the time that he or she stands for election or appointment, have attained the age of 72; |
| ● | if an independent director, is, or will become within a period of five years of becoming a director, the beneficial owner, directly or indirectly, of not less than 15,000 common shares, deferred share units or restricted stock units of the corporation. |
| (b) | Tenure |
| (i) | Re-nomination |
An incumbent director shall be supported for re-nomination as long as he or she:
| ● | does not suffer from any disability that would prevent the effective discharge of his or her responsibilities as a director; |
| ● | makes a positive contribution to the effective performance of the directors; |
| ● | regularly attends directors’ and committee meetings; |
| ● | has not made a change with respect to principal position or thrust of involvement or regional association that would significantly detract from his or her value as a director of the corporation; |
| ● | is not otherwise, to a significant degree, incompatible with the criteria established for use in the selection process; |
| ● | in a situation where it is known that a director will become incompatible with the criteria established for use in the selection process within a three-month period of election, such as retirement from principal position at age 65, this information would be included in the management proxy circular, and where possible, information regarding the proposed replacement would also be included; |
| ● | will not, at the time that he or she stands for re-election, have attained the age of 72; however, under exceptional circumstances, at the request of the chairman, the nominations and corporate governance committee may continue to support the nomination. |
| (ii) | Resignation |
An incumbent director will resign in the event that he or she:
| ● | experiences a change in circumstances such as a change in his or her principal occupation, but not merely a change in geographic location; |
| ● | displays a change in the exercise of his or her powers and in the discharge of duties that, in the opinion of at least 75 percent of the directors, is incompatible with the duty of care of a director as defined in the Canada Business Corporations Act; |
| ● | has made a change in citizenship or residency that will adversely affect the requirements for directors with respect to those areas imposed by the Canada Business Corporations Act; |
| ● | develops a conflict of interest, such as |
| Ø | assuming a position as an employee or principal with any organization providing a significant level of service to the corporation, for example, institutions engaged in commercial banking, underwriting, law, management consulting, insurance, or trust companies; or with any substantial customer or supplier of the corporation; |
153
Table of Contents
| Ø | assuming a position as an employee or director of any competitor of the corporation, such as petroleum or chemical businesses, or of a competitor of corporations represented by a director of this corporation; |
| Ø | assuming the position of chief executive officer or a top administrator of an organization that has the chief executive officer or a top administrator of this corporation serving as a director; |
| Ø | becomes unable to devote the necessary amount of time to prepare for and regularly attend meetings of the directors and committees of directors, and to keep abreast of significant corporate developments, |
and the nominations and corporate governance committee will make a recommendation to the board as to whether to accept or reject such resignation.
10. Chairman and chief executive officer
| (a) | Position description |
The chairman and chief executive officer shall
| 1. | Plan and organize all activities of the board of directors; |
| 2. | Ensure that the Board receives sufficient, timely information on all material aspects of the corporation’s operations and financial affairs; |
| 3. | Chair annual and special meetings of the shareholders; |
| 4. | Conduct the general management and direction of the business and affairs of the corporation; |
| 5. | Recommend to the board of directors a strategic plan for the corporation’s business and, when approved by the board of directors, implement this strategic plan and report to the board of directors on the implementation of this strategic plan; |
| 6. | Develop and implement operational policies to guide the corporation within the limits prescribed by the corporation’s by-laws and the directions adopted by the board of directors; |
| 7. | Identify, for review with the board of directors, the principal risks of the corporation’s business, where identifiable, and develop appropriate systems to manage such risks; |
| 8. | Under the oversight of the board of directors, develop plans for succession planning for senior management, including the appointing, training and monitoring thereof, and implement those plans; |
| 9. | Ensure compliance with the corporation’s code of ethics and business conduct so as to foster a culture of integrity throughout the company; and |
| 10. | Ensure effective internal controls and management information systems are in place. |
| (b) | Minimum shareholding requirements. The chairman and chief executive officer shall hold, or shall, within three years after his appointment as chairman and chief executive officer, acquire shares of the corporation, including common shares, deferred share units and restricted stock units, of a value no less than five times his base salary. |
154
Table of Contents
Audit Committee Charter
The structure, process and responsibilities of the audit committee shall include the following items and matters:
| 1. | (1) | The committee shall consist of five members, to be appointed by the board of directors from among the unrelated and independent directors, who shall serve during the pleasure of the board but only so long as they continue to be directors of the corporation and are unrelated and independent. | ||
| (2) | The committee shall, if possible, have one or more members who is an “audit committee financial expert” within the meaning of applicable law. | |||
| (3) | Each member of the committee shall be able to read and understand fundamental financial statements, including a company’s balance sheet, income statement, and cash flow statement. | |||
| (4) | No committee member shall serve on the audit committee of more than two other public companies, unless the Board of Directors determines that such simultaneous service would not impair the ability of such director to effectively serve on the audit committee. | |||
| 2. | The chair and vice-chair shall be appointed by the board from among the members of the committee. The chair, or in that person’s absence, the vice-chair or in the vice-chair’s absence, an alternate designated by the committee, shall: | |||
| (a) | preside at committee meetings; | |||
| (b) | ensure that meetings of the audit committee are held in accordance with this charter; and | |||
| (c) | review, and modify if necessary the agenda of the meetings of this committee in advance to ensure that the committee may effectively carry out its duties. | |||
| 3. | The committee shall designate its secretariat. | |||
| 4. | A quorum for the meetings of the committee shall be three members. | |||
| 5. | Meetings of the committee may be called by any member or by the external auditors of the corporation, and notice of every meeting shall be given to the external auditors. | |||
| 6. | The committee and, with the approval of the committee, any member, may engage independent counsel and other advisors at the expense of the corporation. | |||
| 7. | The external auditors and the internal auditor of the corporation shall report directly to the audit committee. | |||
| 8. | The committee shall: | |||
| (a) | recommend the external auditors to be appointed by the shareholders, fix their remuneration, which shall be paid by the corporation, and oversee their work. | |||
| (b) | approve the proposed current year audit program of the external auditors and assess the results of the program after the end of the program period. | |||
| (c) | approve in advance any non-audit services that are permitted by applicable law to be performed by the external auditors after considering the effect of such services on their independence. | |||
155
Table of Contents
| (d) | receive from the external auditors a formal written statement delineating all relationships between the external auditor and the corporation consistent with Independence Standards Board Standard 1, and shall actively engage in a dialogue with the external auditor with respect to any disclosed relationships or services that may impact the objectivity and independence of the external auditor and shall recommend that the board take any appropriate action to oversee the independence of the external auditor. | |||
| (e) | establish procedures for the receipt, retention and treatment of complaints received by the corporation regarding accounting, internal accounting controls, or auditing matters and the confidential, anonymous submission by employees of the corporation of concerns regarding questionable accounting or auditing matters. | |||
| (f) | approve the proposed current year audit program of the internal auditors and assess the results of the program after the end of each quarter. | |||
| (g) | review annually the adequacy of the corporation’s liability and property insurance program. | |||
| (h) | review the adequacy of the corporation’s system of internal controls and auditing procedures. | |||
| (i) | review the accounting and financial reporting processes of the corporation. | |||
| (j) | approve changes proposed by management in accounting principles and practices, and review changes proposed by the accounting profession or other regulatory bodies which impact directly on such principles and practices. | |||
| (k) | review the annual and quarterly financial statements of the corporation, accounting items affecting the statements and the overall format and content of the statements, and the related management discussion and analysis, prior to approval of such financial statements by the board of directors. | |||
| (l) | review the results of the monitoring activity under the corporation’s business ethics compliance program. | |||
| (m) | review annually a summary of senior management expense accounts. | |||
| (n) | require attendances at its meetings by members of management, as the committee may direct. | |||
| (o) | review its mandate and its effectiveness at least annually. | |||
| (p) | undertake such additional activities within the scope of its responsibilities as may be deemed appropriate in its discretion. | |||
| (q) | evaluate, along with the other members of the board, management, the controller, and the general auditor, the qualifications, performance and independence of the independent auditors, including the performance of the lead audit partner. | |||
156
Table of Contents
Environment, Health and Safety Committee Charter
The structure, process and responsibilities of the environment, health and safety committee shall include the following items and matters:
| 1. | The committee shall consist of no fewer than five members, to be appointed by the board of directors from among (a) the unrelated and independent directors; and (b) the non-independent directors who are not members of the corporation’s management, who shall serve during the pleasure of the board but only so long as they continue to be directors of the corporation. |
| 2. | The chair and vice-chair shall be appointed by the board from among the members of the committee. The chair, or in that person’s absence, the vice-chair or in the vice-chair’s absence, an alternate designated by the committee, shall: |
| (a) | preside at committee meetings; |
| (b) | ensure that meetings of the environment health and safety committee are held in accordance with this charter; and |
| (c) | review, and modify if necessary the agenda of the meetings of this committee in advance to ensure that the committee may effectively carry out its duties. |
| 3. | The committee shall designate its secretariat. |
| 4. | A quorum for the meetings of the committee shall be three members. |
| 5. | Meetings of the committee may be called by any member. |
| 6. | The committee and, with the approval of the committee, any member, may engage independent counsel and other advisors at the expense of the corporation. |
| 7. | The committee shall: |
| (a) | review and monitor the corporation’s policies and practices in matters of the environment, health and safety. |
| (b) | monitor the corporation’s compliance with legislative, regulatory and corporation standards for environmental, health and safety practices and matters, and advise the directors on the results and adequacy thereof. |
| (c) | monitor trends and review current and emerging public policy issues in matters of the environment, health and safety as they may impact the corporation’s operations. |
| (d) | review the impact of proposed legislation in matters of the environment, health and safety on the operations of the corporation and advise the directors and management as to the appropriate response of the corporation thereto. |
| (e) | recommend to the directors and management desirable policies and actions arising from its review and monitoring activity. |
| (f) | require attendances at its meetings by members of management, as the committee may direct. |
| (g) | review its mandate and its effectiveness at least annually. |
| (h) | undertake such additional activities within the scope of its responsibilities as may be deemed appropriate in its discretion. |
157
Table of Contents
Executive Resources Committee Charter
The structure, process and responsibilities of the executive resources committee shall include the following items and matters:
| 1. | The committee shall consist of no fewer than five members, to be appointed by the board of directors from among the (a) unrelated and independent directors; and (b) the non-independent members who are not members of the corporation’s management, who shall serve during the pleasure of the board but only so long as they continue to be directors of the corporation. |
| 2. | The chair and vice-chair shall be appointed by the board from among the members of the committee. The chair, or in that person’s absence, the vice-chair or in the vice-chair’s absence, an alternate designated by the committee, shall: |
| (a) | preside at committee meetings; |
| (b) | ensure that meetings of the executive resources committee are held in accordance with this charter; and |
| (c) | review, and modify if necessary the agenda of the meetings of this committee in advance to ensure that the committee may effectively carry out its duties. |
| 3. | The committee shall designate its secretariat. |
| 4. | A quorum for the meetings of the committee shall be three members. |
| 5. | Meetings of the committee may be called by any member. |
| 6. | The committee and, with the approval of the committee, any member, may engage independent counsel, compensation consultants or other advisors at the expense of the corporation. The committee shall be directly responsible for the appointment, compensation and oversight of the work of any independent legal counsel, compensation consultant or other advisor retained by the committee. The committee may select outside legal counsel, a compensation consultant or other advisor (an “Advisor”) to the committee only after taking into consideration all factors relevant to the Advisor’s independence from management, including the following: |
| ● | the provision of other services to the corporation by the person that employs the Advisor; |
| ● | the amount of fees received from the corporation by the person that employs the Advisor as a percentage of such that person’s total revenue; |
| ● | the policies and procedures of the person that employs the Advisor that are designed to prevent conflicts of interest; |
| ● | any business or personal relationship of the Advisor with a member of the committee; |
| ● | any stock of the corporation owned by the Advisor; and |
| ● | any business or personal relationship of the Advisor or the person employing the Advisor with an executive officer of the corporation. |
158
Table of Contents
| 7. | The committee shall: |
| (a) | monitor the performance of the chief executive officer. |
| (b) | review and approve corporate goals and objectives relevant to compensation of the chief executive officer and evaluate his performance in light of those goals and objectives. |
| (c) | review data on competitive compensation practices and review and evaluate policies and programs through which the corporation compensates its employees. |
| (d) | approve salaries and other compensation (including supplemental compensation such as cash bonuses and IEBU’s, long-term incentive compensation such as RSU’s, and any other payments for service), for the chief executive officer and other key senior executive management positions reporting directly to the chief executive officer, including all officers of the corporation. |
| (e) | produce an annual report on compensation for inclusion in the corporation’s management proxy circular in accordance with applicable legal requirements. |
| (f) | review the executive development system to ensure that it: |
| i. | foresees the company’s senior management requirements; |
| ii. | provides for early identification and development of key resources. |
| (g) | approve specific succession plans for the chief executive officer and other key senior executive management positions reporting directly to the chief executive officer, including all officers of the corporation. |
| (h) | review the company’s process in respect of employee conflicts of interest and directorships in non-affiliated commercial, financial and industrial organizations and the disclosures thereof. |
| (i) | require attendance at its meetings by members of management, as the committee may direct. |
| (j) | review its mandate and its effectiveness at least annually. |
| (k) | undertake such additional activities within the scope of its responsibilities as may be deemed appropriate in its discretion. |
159
Table of Contents
Nominations and Corporate Governance Committee Charter
The structure, process and responsibilities of the nominations and corporate governance committee shall include the following items and matters:
| 1. | The committee shall consist of no fewer than five members, to be appointed by the board of directors from among (a) the unrelated and independent directors; and the (b) the non-independent directors who are not members of the company’s management, who shall serve during the pleasure of the board but only so long as they continue to be directors of the corporation. |
| 2. | The chair and vice-chair shall be appointed by the board from among the members of the committee. The chair, or in that person’s absence, the vice-chair or in the vice-chair’s absence, an alternate designated by the committee, shall: |
| (a) | preside at committee meetings; |
| (b) | ensure that meetings of the nominations and corporate governance committee are held in accordance with this charter; and |
| (c) | review, and modify if necessary the agenda of the meetings of this committee in advance to ensure that the committee may effectively carry out its duties. |
| 3. | The committee shall designate its secretariat. |
| 4. | A quorum for the meetings of the committee shall be three members. |
| 5. | Meetings of the committee may be called by any member. |
| 6. | The committee and, with the approval of the committee, any member, may engage independent counsel and other advisors at the expense of the corporation. |
| 7. | The committee shall: |
| (a) | oversee issues of corporate governance as they apply to the corporation, including the effectiveness of the system of corporate governance, the evaluation of the overall performance of the board, and the board’s relationship with management, and to report to the board on such matters. |
| (b) | make recommendations to the board as to the appropriate size of the board with a view to facilitating effective decision-making. |
| (c) | review and recommend to the board of directors the procedure for identifying potential nominees for directorships, including guidelines to be used in the selection process. |
| (d) | review and recommend to the board of directors any modifications to the charters of the board or any of its committees. |
| (e) | review and recommend to the board of directors guidelines to be adopted relating to tenure of directors. |
| (f) | assist the chief executive officer to assess potential candidates for directorships and recommend to the board of directors proposed candidates for board membership to fill anticipated vacancies. |
| (g) | apply guidelines for board membership to incumbent directors and recommend to the chief executive officer and to the board of directors the slate of director candidates to be proposed for election by the shareholders at the annual meeting. |
160
Table of Contents
| (h) | review and recommend the nonemployee directors’ compensation. |
| (i) | require attendances at its meetings by members of management, as the committee may direct. |
| (j) | review its mandate and its effectiveness at least annually. |
| (k) | undertake such additional activities within the scope of its responsibilities as may be deemed appropriate in its discretion. |
| (l) | make a recommendation to the board of directors as to whether to accept or reject any resignation tendered by a director as provided in subclause 9(b)(ii) of the board of directors charter. |
161
Table of Contents
Contributions Committee Charter
The structure, process and responsibilities of the contributions and community investment committee shall include the following items and matters:
| 1. | The committee shall consist of no fewer than five members, to be appointed by the board of directors from among the directors, who shall serve during the pleasure of the board but only so long as they continue to be directors of the corporation. |
| 2. | The chair and vice-chair shall be appointed by the board from among the members of the committee. The chair, or in that person’s absence, the vice-chair or in the vice-chair’s absence, an alternate designated by the committee, shall: |
| (a) | preside at committee meetings; |
| (b) | ensure that meetings of the contributions and community investment committee are held in accordance with this charter; and |
| (c) | review, and modify if necessary the agenda of the meetings of this committee in advance to ensure that the committee may effectively carry out its duties. |
| 3. | The committee shall designate its secretariat. |
| 4. | A quorum for the meetings of the committee shall be three members. |
| 5. | Meetings of the committee may be called by any member. |
| 6. | The committee and, with the approval of the committee, any member, may engage independent counsel and other advisors at the expense of the corporation. |
| 7. | The committee shall: |
| (a) | review and monitor the corporation’s policies and practices in matters relating to “Community Investment”, which Community Investment shall consist of: |
| (i) | charitable contributions, including those made by means of the Imperial Oil Foundation; |
| (ii) | local community contributions by business units on community-serving projects that also benefit the corporation, which are charitable in nature; |
| (iii) | the corporation’s share of community-serving projects described in subparagraph 7(a)(ii) above by joint ventures operated by other companies; |
| (iv) | funding for public policy groups; |
| (v) | university research awards; |
| (vi) | sponsorships whose primary purpose is to promote brand recognition, product sales or business development; and |
| (vii) | expenditures required under socio-economic agreements to gain access to resources; |
162
Table of Contents
| (b) | review each year, prior to the development of the following year’s budget for Community Investment, proposed overall contributions objectives, policies and programs, including, as appropriate, goals and criteria, the level of corporate contributions, the subject areas to which contributions are to be made and the relative weighting thereof, and the need to make such contributions to gain access to resources or otherwise advance the business objectives of the company, and make such recommendations to the Board with respect thereto as it may deem advisable; |
| (c) | approve the proposed budget for charitable contributions and local community contributions, as described in subparagraphs 7(a)(i) and (ii), of the corporation and its consolidated affiliates, and review the proposed budget for charitable contributions for the Imperial Oil Foundation prior to the meeting of the Imperial Oil Foundation to approve such budget, and to review such budgets for charitable contributions and local community contributions as to the consistency of such budgets with the contributions objectives, policies and programs established in respect of each year; |
| (d) | review the proposed budget for Community Investment other than as described in subparagraphs 7(a)(i) and (ii) of the corporation and its consolidated affiliates, as to the consistency of such budgets with the contributions objectives, policies and programs established in respect of each year, and possible contributions of an unusual amount; |
| (e) | approve all grants or contributions for charitable contributions and local community contributions as described in subparagraphs 7(a)(i) and (ii) above $300,000; |
| (f) | require attendances at its meetings by members of management, as the committee may direct; |
| (g) | review its mandate and its effectiveness at least annually; and |
| (h) | undertake such additional activities within the scope of its responsibilities as may be deemed appropriate in its discretion. |
163