Attached files
Table of Contents
UNITED STATES SECURITIES AND EXCHANGE COMMISSION
WASHINGTON, D.C. 20549
FORM 10-K
ANNUAL REPORT PURSUANT TO SECTION 13 OR 15 (d) OF THE
SECURITIES EXCHANGE ACT OF 1934
| For the fiscal year-ended December 31, 2009 | Commission file number: 0-12014 |
IMPERIAL OIL LIMITED
(Exact name of registrant as specified in its charter)
| CANADA | 98-0017682 | |||
| (State or other jurisdiction of incorporation or organization) |
(I.R.S. Employer Identification No.) | |||
| 237 FOURTH AVENUE S.W., CALGARY, AB, CANADA | T2P 3M9 | |||
| (Address of principal executive offices) | (Postal Code) | |||
Registrant’s telephone number, including area code:
1-800-567-3776
Securities registered pursuant to Section 12(b) of the Act:
| Title of each class
|
Name of each exchange on
which registered
| |||
| None |
None |
Securities registered pursuant to Section 12(g) of the Act:
Common Shares (without par value)
(Title of Class)
Indicate by check mark if the registrant is a well-known seasoned issuer (as defined in Rule 405 of the Securities Exchange Act of 1934).
Yes ü No......
Indicate by check mark if the registrant is not required to file reports pursuant to Section 13 or Section 15(d) of the Securities Exchange Act of 1934.
Yes ......No ü
Indicate by check mark whether the registrant (1) has filed all reports required to be filed by Section 13 or 15(d) of the Securities Exchange Act of 1934 during the preceding 12 months (or for such shorter period that the registrant was required to file such reports), and (2) has been subject to such filing requirements for the past 90 days.
Yes ü No......
Indicate by check mark whether the registrant has submitted electronically and posted on its corporate web site, if any, every interactive data file required to be submitted and posted pursuant to Rule 405 of Regulation S-T during the preceding 12 months (or for such shorter period that the registrant was required to submit and post such files).
Yesü No......
Indicate by check mark if disclosure of delinquent filers pursuant to Item 405 of Regulation S-K is not contained herein, and will not be contained, to the best of registrant’s knowledge, in definitive proxy or information statements incorporated by reference in Part III of this Form 10-K or any amendment to this Form 10-K.
Yes ü No......
Indicate by check mark whether the registrant is a large accelerated filer, an accelerated filer, a non-accelerated filer, or a smaller reporting company (see the definitions of “large accelerated filer”, “accelerated filer” and “smaller reporting company” in Rule 12b-2 of the Securities Exchange Act of 1934).
Large accelerated filer ü Accelerated filer...... Non-accelerated filer...... Smaller reporting company......
Indicate by check mark whether the registrant is a shell company (as defined in Rule 12 b-2 of the Securities Exchange Act of 1934).
Yes ......No ü
As of the last business day of the 2009 second fiscal quarter, the aggregate market value of the voting stock held by non-affiliates of the registrant was Canadian $11,626,102,344 based upon the reported last sale price of such stock on the Toronto Stock Exchange on that date.
The number of common shares outstanding, as of February 12, 2010, was 847,602,581.
Table of Contents
All dollar amounts set forth in this report are in Canadian dollars, except where otherwise indicated.
Note that numbers may not add due to rounding.
The following table sets forth (i) the rates of exchange for the Canadian dollar, expressed in United States (U.S.) dollars, in effect at the end of each of the periods indicated, (ii) the average of exchange rates in effect on the last day of each month during such periods, and (iii) the high and low exchange rates during such periods, in each case based on the noon buying rate in New York City for wire transfers in Canadian dollars as certified for customs purposes by the Federal Reserve Bank of New York.
| dollars | 2009 | 2008 | 2007 | 2006 | 2005 | |||||||||||||
| Rate at end of period |
0.9559 | 0.8170 | 1.0120 | 0.8582 | 0.8579 | |||||||||||||
| Average rate during period |
0.8793 | 0.9335 | 0.9376 | 0.8844 | 0.8276 | |||||||||||||
| High |
0.9719 | 1.0291 | 1.0908 | 0.9100 | 0.8690 | |||||||||||||
| Low |
0.7695 | 0.7710 | 0.8437 | 0.8528 | 0.7872 | |||||||||||||
On February 12, 2010, the noon buying rate in New York City for wire transfers in Canadian dollars as certified for customs purposes by the Federal Reserve Bank of New York was $0.9499 U.S. = $1.00 Canadian.
2
Table of Contents
Forward-looking statements
Statements in this report regarding expectations, plans and future events or conditions are forward-looking statements. Actual future results, including demand growth and energy source mix; production growth and mix; project start-ups; the effect of changes in prices and other market conditions; financing sources; and capital and environmental expenditures could differ materially depending on a number of factors, such as changes in the supply of and demand for crude oil, natural gas, and petroleum and petrochemical products; political or regulatory events; project schedules; commercial negotiations; and other factors discussed in Item 1A of this annual report on Form 10-K and in the management’s discussion and analysis of financial condition and results of operations contained in Item 7.
PART I
| Item 1. | Business |
Imperial Oil Limited was incorporated under the laws of Canada in 1880 and was continued under the Canada Business Corporations Act (the “CBCA”) by certificate of continuance dated April 24, 1978. The head and principal office of the company is located at 237 Fourth Avenue S.W. Calgary, Alberta, Canada T2P 3M9; telephone 1-800-567-3776. Exxon Mobil Corporation owns approximately 69.6 percent of the outstanding shares of the company. In this report, unless the context otherwise indicates, reference to “the company” or “Imperial” includes Imperial Oil Limited and its subsidiaries.
The company is one of Canada’s largest integrated oil companies. It is active in all phases of the petroleum industry in Canada, including the exploration for, and production and sale of, crude oil and natural gas. In Canada, it is a major producer of crude oil and natural gas and the largest petroleum refiner and a leading marketer of petroleum products. It is also a major supplier of petrochemicals.
Financial information by operating segments (under U.S. GAAP)
| millions of dollars | 2009 | 2008 | 2007 | 2006 | 2005 | |||||
| External sales (a): |
||||||||||
| Upstream |
3,552 | 5,819 | 4,539 | 4,619 | 4,702 | |||||
| Downstream |
16,793 | 24,049 | 19,230 | 18,527 | 21,793 | |||||
| Chemical |
947 | 1,372 | 1,300 | 1,359 | 1,302 | |||||
| 21,292 | 31,240 | 25,069 | 24,505 | 27,797 | ||||||
| Intersegment sales: |
||||||||||
| Upstream |
3,328 | 5,403 | 4,146 | 3,837 | 3,487 | |||||
| Downstream |
1,535 | 2,892 | 2,305 | 2,256 | 2,224 | |||||
| Chemical |
289 | 460 | 335 | 345 | 363 | |||||
| Net income (b): |
||||||||||
| Upstream |
1,324 | 2,923 | 2,369 | 2,376 | 2,008 | |||||
| Downstream |
278 | 796 | 921 | 624 | 694 | |||||
| Chemical |
46 | 100 | 97 | 143 | 121 | |||||
| Corporate and other (c) |
(69) | 59 | (199) | (99) | (223) | |||||
| 1,579 | 3,878 | 3,188 | 3,044 | 2,600 | ||||||
| Identifiable assets at December 31 (d): |
||||||||||
| Upstream |
10,663 | 8,758 | 8,171 | 7,513 | 7,289 | |||||
| Downstream |
6,183 | 6,038 | 6,727 | 6,450 | 6,257 | |||||
| Chemical |
428 | 431 | 476 | 504 | 500 | |||||
| Corporate and other/eliminations |
199 | 1,808 | 913 | 1,674 | 1,536 | |||||
| 17,473 | 17,035 | 16,287 | 16,141 | 15,582 | ||||||
| Capital and exploration expenditures: |
||||||||||
| Upstream |
2,167 | 1,110 | 744 | 787 | 937 | |||||
| Downstream |
251 | 232 | 187 | 361 | 478 | |||||
| Chemical |
15 | 13 | 11 | 13 | 19 | |||||
| Corporate and other |
5 | 8 | 36 | 48 | 41 | |||||
| 2,438 | 1,363 | 978 | 1,209 | 1,475 | ||||||
3
Table of Contents
Footnotes to the Financial information by operating segments on the preceding page:
| a) | Export sales are reported in note 3 to the consolidated financial statements starting on page 87. Total external sales include $4,894 million for 2005 for purchases/sales contracts with the same counterparty. Associated costs were included in “purchases of crude oil and products”. Effective January 1, 2006, these purchases/sales were recorded on a net basis. |
| b) | These amounts are presented as if each segment were a separate business entity and, accordingly, include the financial effect of transactions between the segments. Intersegment sales are made essentially at prevailing market prices. |
| c) | Primarily includes interest charges on the debt obligations of the company, interest income and share based incentive compensation expenses. |
| d) | The identifiable assets in each operating segment represent the net book value of the tangible and intangible assets attributed to such segment. Net intangible assets representing unrecognized prior service costs associated with the recognition of the additional minimum pension liability in 2005 have been reclassified from the operating segments to the corporate and other segment. Amounts reclassified into the corporate and other segment were $92 million for 2005. This change has no impact on total identifiable assets at December 31, 2005. |
The company’s operations are conducted in three main segments: Upstream, Downstream and Chemical. Upstream operations include the exploration for, and production of, conventional crude oil, natural gas, synthetic oil and bitumen. Downstream operations consist of the transportation and refining of crude oil, blending of refined products, and the distribution and marketing thereof. Chemical operations consist of the manufacturing and marketing of various petrochemicals.
Summary of oil and gas reserves at year-end
The table below summarizes the net oil-equivalent proved reserves for the company, as at December 31, 2009, as detailed in the “Oil and gas reserves” part of the Financial section, starting on page 107 of this report.
All of the company’s reported reserves are located in Canada. The company has reported proved reserves based on the average of the first-day-of-the-month price for each month during the last 12-month period ending December 31. Natural gas is converted to an oil-equivalent basis at six million cubic feet per one thousand barrels. No major discovery or other favorable or adverse event has occurred since December 31, 2009 that would cause a significant change in the estimated proved reserves as of that date.
| Liquids (a) | Natural gas |
Synthetic oil | Bitumen | Total oil- equivalent basis | ||||||
| millions of barrels |
billions of cubic feet |
millions of barrels |
millions of barrels |
millions of barrels | ||||||
| Net proved reserves: |
||||||||||
| Developed |
62 | 526 | 691 | 468 | 1,309 | |||||
| Undeveloped |
1 | 64 | – | 1,193 | 1,204 | |||||
| Total net proved |
63 | 590 | 691 | 1,661 | 2,513 |
| a) | Liquids include crude oil, condensate and natural gas liquids (NGLs). |
The estimation of proved reserves, which is based on the requirement of reasonable certainty, is an ongoing process based on rigorous technical evaluations, commercial and market assessments and detailed analysis of well information such as flow rates and reservoir pressure declines. Furthermore, the company only records proved reserves for projects which have received significant funding commitments by management made toward the development of the reserves. Although the company is reasonably certain that proved reserves will be produced, the timing and amount recovered can be affected by a number of factors including completion of development projects, reservoir performance, regulatory approvals and significant changes in projections of long-term oil and gas price levels.
Technologies used in establishing proved reserves estimates
Additions to Imperial’s proved reserves in 2009 were based on estimates generated through the integration of available and appropriate data, utilizing well established technologies that have been demonstrated in the field to yield repeatable and consistent results.
4
Table of Contents
Data used in these integrated assessments included information obtained directly from the subsurface via wellbores, such as well logs, reservoir core samples, fluid samples, static and dynamic pressure information, production test data, and surveillance and performance information. The data utilized also included subsurface information obtained through indirect measurements, including high-quality 2-D and 3-D seismic data, calibrated with available well control. Where applicable, surface geological information was also utilized. The tools used to interpret the data included proprietary seismic processing software, proprietary reservoir modeling and simulation software and commercially available data analysis packages.
In some circumstances, where appropriate analog reservoirs were available, reservoir parameters from these analogs were used to increase the quality of and confidence in the reserves estimates.
Preparation of reserves estimates
Imperial has a dedicated reserves management group that is separate from the base operating organization. Primary responsibilities of this group include oversight of the reserves estimation process for compliance with Securities and Exchange Commission (SEC) rules and regulations, review of annual changes in reserves estimates, and the reporting of Imperial’s proved reserves. This group also maintains the official company reserve estimates for Imperial’s proved reserves of crude oil and natural gas liquids, synthetic oil, bitumen, and natural gas. In addition, this group provides training to personnel involved in the reserve estimation and reporting processes within Imperial.
Key components of the reserves estimation process include technical evaluations and analysis of well and field performance and a rigorous peer review. The reserves management group maintains a central computerized database containing the official company reserves estimates and production data. Appropriate controls, including limitations on database access and update capabilities, are in place to ensure data integrity within this central computerized database. An annual review of the system’s controls is performed by internal audit. No changes may be made to reserves estimates in the central database, including the addition of any new initial reserves estimates or subsequent revisions, unless those changes have been thoroughly reviewed and evaluated by duly authorized personnel within the base operating organization. In addition, changes to reserves estimates that exceed certain thresholds will require further review and approval of the appropriate level of management within the operating organization, culminating in reviews with and approval by senior management and the company’s board of directors.
The Operations Technical Subsurface Engineering Manager, who is an employee of the company, has evaluated the company’s reserves data and filed a report to the Canadian securities regulatory authorities. Our internal reserves evaluation staff consists of about 63 persons with an average of approximately 16 years of relevant experience in evaluating reserves, of whom about 36 persons are qualified reserves evaluators for purposes of Canadian securities regulatory requirements. Our internal reserves evaluation management team is made up of about 18 persons with an average of approximately 16 years of relevant experience in evaluating and managing the evaluation of reserves. No independent qualified reserves evaluator or auditor was involved in the preparation of the company’s reserves data.
As of December 31, 2009, approximately 48 percent of the company’s proved reserves were proved undeveloped reserves reflecting volumes of 1,204 million oil-equivalent barrels. Nearly all of those undeveloped reserves are associated with either the Kearl project or Cold Lake field.
One of the company’s requirements to report resources as proved reserves is that management has made significant funding commitments towards the development of the reserves. Imperial has a disciplined investment strategy and many major fields require a significant lead-time in order to be developed. Imperial made investments of about $1.4 billion during the year to progress the development of reported proved undeveloped reserves. Notably, the company spent about $1.1 billion on progressing the Kearl project in 2009.
Imperial has had a significant ongoing drilling program at Cold Lake since 1978, and in 2009 made investments of about $250 million to progress the development of proved undeveloped reserves. Proved undeveloped reserves at Cold Lake are associated with the ongoing drilling program.
5
Table of Contents
Oil and gas production, production prices and production costs
The company’s average daily oil production by final products sold during the three years ended December 31, 2009, was as follows. All reported production volumes were from Canada.
| thousands of barrels a day | 2009 | 2008 | 2007 | |||||
| Liquids: | - gross (a) | 33 | 37 | 45 | ||||
| - net (b) | 26 | 27 | 33 | |||||
| Bitumen (c): | - gross (a) | 141 | 147 | 154 | ||||
| - net (b) | 120 | 124 | 130 | |||||
| Synthetic oil (d): | - gross (a) | 70 | 72 | 76 | ||||
| - net (b) | 65 | 62 | 65 | |||||
| Total: | - gross (a) | 244 | 256 | 275 | ||||
| - net (b) | 211 | 213 | 228 | |||||
| a) | Gross production is the company’s share of production (excluding purchases) before deduction of the mineral owners’ or governments’ share or both. |
| b) | Net production is gross production less the mineral owners’ or governments’ share or both. |
| c) | All of the company’s bitumen production volumes were from the Cold Lake production operation. |
| d) | All of the company’s synthetic oil production volumes were from the company’s share of production volumes in the Syncrude joint venture. |
In 2009, the most significant reason for lower liquids production volume was natural decline in Western Canada reservoirs. Bitumen production at Cold Lake declined due to the cyclic nature of production and well repairs in the northern part of the field. Drilling and steaming activities have since resumed in this area, and production is expected to return to normal levels. Gross synthetic oil production at Syncrude was also lower as planned maintenance activities in the first half of 2009, which included design modifications to improve long-term operational performance, contributed to the reduced production for the full year in 2009. Net synthetic oil production at Syncrude was higher due to lower royalties.
In 2008, the liquids production volume was lower primarily due to the completion of the Wizard Lake blow down. Bitumen production at Cold Lake declined due to steam cycle timing and higher royalties. Synthetic oil production at Syncrude declined primarily due to increased planned and unplanned maintenance activities, including continuing work to improve reliability performance.
The company’s average daily production and sales of natural gas during the three years ended December 31, 2009 are set forth below. All reported production volumes were from Canada. All gas volumes in this report are calculated at a pressure base of 14.73 pounds per square inch absolute at 60 degrees Fahrenheit.
Average daily production and sales of natural gas
| millions of cubic feet a day | 2009 | 2008 | 2007 | |||
| Gross production (a) (b): |
295 | 310 | 458 | |||
| Net production (c): |
274 | 249 | 404 | |||
| Sales (d): |
272 | 288 | 407 |
| a) | Gross production is the company’s share of production (excluding purchases) before deduction of the mineral owners’ or governments’ share or both. |
| b) | Production of natural gas includes amounts used for internal consumption with the exception of the amounts reinjected. |
| c) | Net production is gross production less the mineral owners’ or governments’ share or both. |
| d) | Sales are sales of the company’s share of production (before deduction of the mineral owners’ and/or governments’ share) and sales of gas purchased, processed and/or resold. |
In 2009, the lower gross gas production volume was primarily a result of natural reservoir decline. Net production volumes were higher due to lower royalties.
In 2008, the most significant reason for lower natural gas production volume was the completion of the Wizard Lake blow down.
6
Table of Contents
The company’s total average daily production expressed in oil-equivalent basis is set forth below, with natural gas converted to an oil-equivalent basis at six million cubic feet per one thousand barrels.
Total average daily oil-equivalent basis production
| thousands of barrels a day | 2009 | 2008 | 2007 | |||||
| Total production oil-equivalent basis: |
||||||||
| - gross (a) |
293 | 308 | 351 | |||||
| - net (b) |
257 | 255 | 295 |
| a) | Gross production is the company’s share of production (excluding purchases) before deduction of the mineral owners’ or governments’ share or both. |
| b) | Net production is gross production less the mineral owners’ or governments’ share or both. |
The company’s average unit sales price and average unit production costs by product type for the three years ended December 31, 2009, were as follows:
Average unit sales price
| dollars a barrel | 2009 | 2008 | 2007 | |||
| Liquids |
53.91 | 84.67 | 62.31 | |||
| Synthetic oil |
69.69 | 106.61 | 79.10 | |||
| Bitumen |
51.81 | 69.04 | 39.77 | |||
| dollars per thousand cubic feet |
||||||
|
Natural gas |
4.11 | 8.69 | 6.95 |
Average unit production costs
| dollars a barrel | 2009 | 2008 | 2007 | |||
| Bitumen |
17.17 | 21.09 | 14.44 | |||
| Total oil-equivalent basis (a) |
23.66 | 25.25 | 17.10 |
| a) | Includes liquids, bitumen, synthetic oil and natural gas. |
Canadian crude oil prices are mainly determined by international crude oil markets and the impact of foreign exchange rates.
Canadian natural gas prices are determined by North American gas markets and the impact of foreign exchange rates.
In 2009, unit production costs decreased on a net basis. Higher net volumes due to lower price sensitive royalties more than offset increased spending.
In 2008, unit production costs were higher, primarily as a result of lower gas and liquids volumes due to production decline at Wizard Lake and the unfavorable impact on higher prices on royalty rates and net volumes.
7
Table of Contents
Drilling and other exploratory and development activities
The company has been involved in the exploration for and development of petroleum and natural gas in Canada only.
The following table sets forth the conventional and bitumen net exploratory and development wells that were drilled or participated in by the company during the three years ending December 31, 2009.
| wells | 2009 | 2008 | 2007 | |||
| Net productive exploratory: |
||||||
| Oil and gas |
2 | – | – | |||
| Bitumen |
– | – | – | |||
| Net dry exploratory: |
||||||
| Oil and gas |
– | – | – | |||
| Bitumen |
– | – | – | |||
| Net productive development: |
||||||
| Oil and gas |
218 | 147 | 183 | |||
| Bitumen |
60 | 70 | 188 | |||
| Net dry development: |
||||||
| Oil and gas |
– | – | – | |||
| Bitumen |
– | – | – | |||
| Total |
280 | 217 | 371 |
In 2009, 60 bitumen development wells were drilled to add new productive capacity from undeveloped areas of existing phases at Cold Lake. In addition, 216 gas development wells were drilled in 2009 adding productivity primarily in the shallow gas area. Additionally, two oil development wells were drilled in Norman Wells.
Also in 2009, two net exploratory gas wells were drilled in the Horn River shale gas play as part of the company’s ongoing evaluation of its holdings in the area.
In 2008, 70 bitumen development wells were drilled to add new productive capacity from undeveloped areas of existing phases at Cold Lake. In addition, 146 gas development wells were drilled in 2008 adding productivity primarily in the shallow gas area. Additionally, one oil development well was drilled in Norman Wells. In 2007, 188 bitumen development wells were drilled to add new productive capacity from undeveloped areas of existing phases at Cold Lake. In addition, 183 gas development wells were drilled in 2007 adding productivity primarily in the shallow gas area.
Wells drilling
At December 31, 2009, the company was participating in the drilling of the following exploratory and development wells. All wells were located in Canada.
| 2009 | ||||
| wells | Gross | Net | ||
| Oil and gas |
3 | 2 | ||
| Bitumen |
20 | 20 | ||
| Total |
23 | 22 | ||
Exploratory and development activities regarding oil and gas resources
Cold Lake
In 2009, the company spent about $300 million on capital and exploration expenditures at Cold Lake. To maintain production at Cold Lake, capital expenditures for additional production wells and associated facilities will be required periodically. In 2009, the company executed a development drilling program of 60 wells on existing phases. In 2010, a development drilling program is planned within the approved development area to add productive capacity from undeveloped areas of existing Cold Lake phases. In addition, planning and design work is progressing on the Nabiye project, the next phase of expansion at Cold Lake that has the potential to add about 30,000 barrels a day of production before royalties.
8
Table of Contents
The company also conducts experimental pilot operations to improve recovery of bitumen from wells by means of new drilling and production techniques.
Western provinces
A four-well (gross) winter exploration drilling program at the company’s Horn River shale gas acreage was completed in 2009. Work is underway on a production pilot to evaluate reservoir productivity and scale.
Mackenzie Delta
In 1999, the company and three other companies entered into an agreement to study the feasibility of developing Mackenzie Delta gas, anchored by three large onshore natural gas fields. The company retains a 100 percent interest in the largest of these fields.
The commercial viability of these natural gas resources, and the pipeline required to transport this natural gas to markets, is dependent on a number of factors. These factors include natural gas markets, support from northern parties, regulatory approvals, environmental considerations, pipeline participation, fiscal framework, and the cost of constructing, operating and abandoning the field production and pipeline facilities.
In October 2004, the company and its co-venturers filed regulatory applications and environmental impact statements for the project with the National Energy Board (NEB) and other boards, panels and agencies responsible for assessing and regulating energy developments in the Northwest Territories. All the scheduled public hearings by the Joint Review Panel (JRP) and the NEB were concluded in late 2007. The JRP report was released in late 2009 with an NEB decision expected in 2010.
Beaufort Sea
In 2007, the company acquired a 50 percent interest in an exploration licence in the Beaufort Sea. As part of the evaluation, a 3-D seismic survey was conducted in 2008. In 2009, the company began a data collection program to support environmental studies and safe exploration drilling operations.
Atlantic offshore
The company holds a 15 percent interest in deepwater exploration blocks in the Orphan Basin, located off the east coast of Newfoundland. In 2004 and 2005, the company participated in 3-D seismic surveys in this area. Drilling of an exploration well was concluded in early 2007. In 2009, the company participated in a remote reservoir resistivity survey of the area. A second exploration well has been approved by co-venturers for drilling in 2010.
Other oil sands activity
The company also has interests in other oil sands leases in the Athabasca and Peace River areas of northern Alberta. Evaluation wells completed on these leased areas established the presence of heavy oil. The company continues to evaluate these leases to determine their potential for future development.
Exploratory and development activities regarding oil and gas resources extracted by mining methods
Kearl project
The company holds a 70.96 percent participating interest in the Kearl project, a joint venture with ExxonMobil Canada Properties, a subsidiary of Exxon Mobil Corporation. The Kearl project will recover shallow deposits of oil sands using open-pit mining methods. The project is located approximately 40 miles north of Fort McMurray, Alberta.
Kearl will be developed in phases. Bitumen will be extracted from oil sands produced from open-pit mining operations, and processed through a bitumen extraction and froth treatment plant. The product, a blend of bitumen and diluent, will be shipped via pipelines for distribution to North American markets. Diluent is natural gas condensate or other light hydrocarbons added to the crude bitumen to facilitate transportation to market by pipeline.
The Kearl project received approvals from the Province of Alberta in 2007 and the Government of Canada in 2008. The Province of Alberta issued an operating and construction license in 2008, which permits the project to mine oil sands and produce bitumen from approved development areas on oil sands leases.
9
Table of Contents
The first phase of the Kearl project was approved by the company’s board in May 2009. Production from the first phase is expected to be at an initial rate of approximately 110,000 barrels of bitumen a day, before royalties, of which the company’s share would be about 78,000 barrels a day. Start up is expected in 2012. About $2 billion had been spent on the project as at the end of 2009, of which the company’s share was about $1.5 billion. In 2009, pipeline transportation was secured, infrastructure construction continued and more than half of the detailed engineering was completed.
Kearl will be subject to the revised Alberta generic oil sands royalty regime, which took effect in 2009. Royalty rates are based upon a sliding scale, determined by the price of crude oil.
Other oil sands activity
The company is continuing to evaluate other undeveloped, mineable oil sands acreage in the Athabasca region.
Review of principal ongoing activities
Cold Lake
During 2009, average net production at Cold Lake was about 120,000 barrels per day and gross production was about 141,000 barrels per day.
Most of the production from Cold Lake is sold to refineries in the northern U.S. The majority of the remainder of Cold Lake production is shipped to certain of the company’s refineries and to a third-party crude bitumen upgrader in Lloydminster, Saskatchewan.
The Province of Alberta, in its capacity as lessor of Cold Lake oil sands leases, is entitled to a royalty on production at Cold Lake. Cold Lake is subject to the revised Alberta generic oil sand royalty regime, which took effect in 2009. Royalty rates are based upon a sliding scale, determined by the price of crude oil.
Syncrude operations
The company holds a 25 percent participating interest in Syncrude, a joint venture established to recover shallow deposits of oil sands using open-pit mining methods to extract the crude bitumen, and to produce a high-quality, light (32 degree API), sweet, synthetic crude oil. The Syncrude operation, located near Fort McMurray, Alberta, mines a portion of the Athabasca oil sands deposit. The produced synthetic crude oil is shipped from the Syncrude site to Edmonton, Alberta by Alberta Oil Sands Pipeline Ltd. In 2009, Syncrude’s net production of synthetic crude oil was about 259,000 barrels per day and gross production was about 280,000 barrels per day. The company’s share of net production in 2009 was about 65,000 barrels per day.
There are no approved plans for major future expansion projects.
In November 2008, Imperial, along with the other Syncrude joint-venture owners, signed an agreement with the Government of Alberta to amend the existing Syncrude Crown Agreement. Under the amended agreement, starting in 2010 and through 2015 Syncrude will pay the existing Crown royalty rates plus an incremental royalty, the amount of which will be subject to minimum production thresholds, before transitioning to the new royalty framework in 2016. Also, beginning January 1, 2009, Syncrude’s royalty is based on bitumen value with upgrading costs and revenues excluded from the calculation.
The Government of Canada had issued an order that expired at the end of 2003, which provided for the remission of any federal income tax otherwise payable by the joint venture owners as the result of the non-deductibility from the income of the joint venture owners of amounts receivable by the Province of Alberta as a royalty or otherwise with respect to Syncrude. That remission order excluded royalty payable on production for the Aurora project. The final determination of the remission amount applicable to Syncrude operations up to 2003 is a matter currently being litigated with the Government of Canada.
On May 1, 2007, the company implemented a management services agreement under which Syncrude will be provided with operational, technical and business management services from Imperial and Exxon Mobil Corporation. The agreement has an initial term of 10 years, automatically renews for successive five-year periods and may be terminated with at least two years prior written notice.
10
Table of Contents
Conventional oil and gas
The company’s largest conventional oil producing asset is the Norman Wells oil field in the Northwest Territories, which currently accounts for approximately 56 percent of the company’s net production of conventional crude oil (approximately 60 percent of gross production). In 2009, net production of crude oil was about 11,000 barrels per day and gross production was about 15,000 barrels per day. The Government of Canada has a one-third carried interest and receives a production royalty of five percent in the Norman Wells oil field. The Government of Canada’s carried interest entitles it to receive payment of a one-third share of an amount based on revenues from the sale of Norman Wells production, net of operating and capital costs. Under a shipping agreement, the company pays for the construction, operating and other costs of the 540-mile pipeline, which transports the crude oil and natural gas liquids from the project. In 2009, those costs were about $33 million.
Most of the company’s larger oil fields in the Western provinces have been in production for several decades, and the amount of oil that is produced from conventional fields is declining.
The company produces natural gas from a large number of gas fields located in the Western provinces, primarily in Alberta. The company also has a nine percent interest in a project to develop and produce natural gas reserves in the Sable Island area off the coast of the Province of Nova Scotia.
The company has no material commitments to provide a fixed and determinable quantity of oil or gas in the near future under existing contracts or agreements.
Oil and gas properties, wells, operations, and acreage
Production wells
The company’s production of liquids, bitumen and natural gas is derived from wells located exclusively in Canada. The total number of wells capable of production, in which the company had interests at December 31, 2009 and 2008, is set forth in the following table. The statistics in the table are determined in part from information received from other operators.
| Year-ending December 31, 2009 | Year-ending December 31, 2008 | |||||||||||||||
| Crude oil | Natural gas | Crude oil | Natural gas | |||||||||||||
| wells | Gross (a) | Net (b) | Gross (a) | Net (b) | Gross (a) | Net (b) | Gross (a) | Net (b) | ||||||||
| Oil and gas (c) |
937 | 627 | 5,479 | 2,894 | 906 | 601 | 5,186 | 2,768 | ||||||||
| Bitumen (c) |
4,028 | 4,028 | – | – | 4,243 | 4,243 | – | – | ||||||||
| a) | Gross wells are wells in which the company owns a working interest. |
| b) | Net wells are the sum of the fractional working interests owned by the company in gross wells, rounded to the nearest whole number. |
| c) | Multiple completion wells are permanently equipped to produce separately from two or more distinctly different geological formations. At year-end 2009, the company had an interest in four gross wells with multiple completions. |
11
Table of Contents
Land holdings
At December 31, 2009 and 2008, the company held the following oil and gas rights, bitumen and synthetic oil leases, all of which are located in Canada, specifically in the Western provinces, in the Canada lands and in the Atlantic offshore:
| Acres | ||||||||||||||
| Developed | Undeveloped | Total | ||||||||||||
| thousands of acres | 2009 | 2008 | 2009 | 2008 | 2009 | 2008 | ||||||||
| Western provinces: | ||||||||||||||
| Liquids and gas |
- gross (a) | 2,590 | 2,566 | 568 | 435 | 3,158 | 3,001 | |||||||
| - net (b) | 986 | 1,004 | 318 | 251 | 1,304 | 1,255 | ||||||||
| Bitumen |
- gross (a) | 103 | 103 | 645 | 612 | 748 | 715 | |||||||
| - net (b) | 103 | 103 | 373 | 364 | 476 | 467 | ||||||||
| Synthetic oil |
- gross (a) | 114 | 114 | 139 | 137 | 253 | 251 | |||||||
| - net (b) | 28 | 28 | 35 | 35 | 63 | 63 | ||||||||
| Canada lands (c): | ||||||||||||||
| Liquids and gas |
- gross (a) | 37 | 37 | 1,343 | 1,343 | 1,380 | 1,380 | |||||||
| - net (b) | 5 | 5 | 499 | 499 | 504 | 504 | ||||||||
| Atlantic offshore: | ||||||||||||||
| Liquids and gas |
- gross (a) | 65 | 65 | 4,469 | 6,012 | 4,534 | 6,077 | |||||||
| - net (b) | 6 | 6 | 673 | 1,308 | 679 | 1,314 | ||||||||
| Total (d): | - gross (a) | 2,909 | 2,885 | 7,164 | 8,539 | 10,073 | 11,424 | |||||||
| - net (b) | 1,128 | 1,146 | 1,898 | 2,457 | 3,026 | 3,603 | ||||||||
| a) | Gross acres include the interests of others. |
| b) | Net acres exclude the interests of others. |
| c) | Canada lands include the Arctic Islands, Beaufort Sea/Mackenzie Delta, and other Northwest Territories, Nunavut and Yukon regions. |
| d) | Certain land holdings are subject to modification under agreements whereby others may earn interests in the company’s holdings by performing certain exploratory work (farm-out) and whereby the company may earn interests in others’ holdings by performing certain exploratory work (farm-in). |
Western provinces
The company’s bitumen leases include about 194,000 net acres of oil sands leases near Cold Lake and an area of about 48,000 net acres at Kearl. In 2009, the company acquired approximately 8,000 net acres of additional undeveloped bitumen acreage adjacent to the company’s existing Firebag North lands in the Athabasca area. The company now has about 77,000 net acres of undeveloped, mineable oil sands acreage in the Athabasca region. In addition, the company also has interests in other bitumen oil sands leases in the Athabasca and Peace River areas totaling about 170,000 net acres.
The company’s share of Syncrude joint-venture leases covering about 63,000 net acres accounts for the entire synthetic oil acreage.
The company holds interest in an additional 1,304,000 net acres of developed and undeveloped land in Western Canada related to conventional oil and natural gas. Included in this number is approximately 79,000 net acres acquired in 2009 in the natural gas prone Horn River area of British Columbia, creating a total net acreage position of about 155,000 acres at Horn River.
Canada lands
In the Arctic Islands, the company has an interest in 16 Significant Discovery Licences and one production licence granted by the Government of Canada. These licences are managed by another company on behalf of all participants and total 387,000 gross acres. The company has not participated in wells drilled in this area since 1984.
12
Table of Contents
Also within the Canada lands, the company holdings in the Mackenzie Delta include majority interests in 21, and minority interests in six, Significant Discovery Licences granted by the Government of Canada, as the result of previous oil and gas discoveries, all of which are managed by the company, and majority interests in two, and minority interests in 17, other Significant Discovery Licences managed by others. Total gross acres held in the Mackenzie Delta are 421,000.
In 2007, the company acquired a 50 percent interest in an exploration licence in the Beaufort Sea of about 507,000 gross acres.
Atlantic offshore
The company manages five Significant Discovery Licences granted by the Government of Canada in the Atlantic offshore. The company also has minority interests in 27 Significant Discovery Licences, and six production licences, managed by others.
In 2008, one exploration licence in the Sable Island area, in which the company had a 20 percent interest, for about 52,000 gross acres was allowed to expire. Also in 2008, one exploration licence in which the company had a 70 percent interest for about 279,000 gross acres farther offshore in deeper water was allowed to expire. The company is not planning further exploration in these areas.
In early 2004, the company acquired a 25 percent interest in eight deep-water exploration licences offshore Newfoundland in the Orphan Basin for about 5,251,000 gross acres. In February 2005, the company reduced its interest to 15 percent through an agreement with another company. In early 2009, one exploration licence in its entirety and most of a second exploration licence, for about 1,069,000 gross acres, expired. The remaining exploration licences were consolidated into two exploration licences, for a total of about 4.2 million gross acres.
In 2009, in the Laurentian Basin area, offshore Newfoundland and Labrador, a single exploration licence of 474,000 gross acres was allowed to expire. The company held a 100 percent interest.
To supply the requirements of its own refineries and condensate requirements for blending with crude bitumen, the company supplements its own production with substantial purchases from others.
The company purchases domestic crude oil at freely negotiated prices from a number of sources. Domestic purchases of crude oil are generally made under renewable contracts with 30 to 60 day cancellation terms.
Crude oil from foreign sources is purchased by the company at market prices mainly through Exxon Mobil Corporation (which has beneficial access to major market sources of crude oil throughout the world).
The company owns and operates four refineries. Two of these, the Sarnia refinery and the Strathcona refinery, have lubricating oil production facilities. The Strathcona refinery processes Canadian crude oil, and the Dartmouth, Sarnia and Nanticoke refineries process a combination of Canadian and foreign crude oil. In addition to crude oil, the company purchases finished products to supplement its refinery production.
In 2009, capital expenditures of about $160 million were made at the company’s refineries. About 70 percent of those expenditures were on environmental and safety initiatives with the remaining expenditures being primarily on capacity and efficiency improvements.
13
Table of Contents
The approximate average daily volumes of refinery throughput during the five years ended December 31, 2009, and the daily rated capacities of the refineries at December 31, 2009 and 2004, were as follows:
| Average daily volumes of refinery throughput (a) |
Daily rated capacities at (b) | |||||||||||||||
| Year-ended December 31 | December 31 | |||||||||||||||
| thousands of barrels | 2009 | 2008 | 2007 | 2006 | 2005 | 2009 | 2004 | |||||||||
| Strathcona, Alberta |
145 | 155 | 170 | 160 | 174 | 187 | 187 | |||||||||
| Sarnia, Ontario |
100 | 108 | 103 | 111 | 106 | 121 | 121 | |||||||||
| Nanticoke, Ontario |
94 | 107 | 100 | 94 | 108 | 112 | 112 | |||||||||
| Dartmouth, Nova Scotia |
74 | 76 | 69 | 77 | 79 | 82 | 82 | |||||||||
| Total |
413 | 446 | 442 | 442 | 466 | 502 | 502 | |||||||||
| a) | Refinery throughput is the volume of crude oil and feedstocks that is processed in the refinery atmospheric distillation units. |
| b) | Rated capacities are based on definite specifications as to types of crude oil and feedstocks that are processed in the refinery atmospheric distillation units, the products to be obtained and the refinery process, adjusted to include an estimated allowance for normal maintenance shutdowns. Accordingly, actual capacities may be higher or lower than rated capacities due to changes in refinery operation and the type of crude oil available for processing. |
Refinery throughput was 82 percent of capacity in 2009, seven percent lower than the previous year. Production gains from operating and reliability improvements through the year were offset by the impact of declining economic conditions that did not support running the refineries to full capacity.
The company maintains a nation-wide distribution system, including 24 primary terminals, to handle bulk and packaged petroleum products moving from refineries to market by pipeline, tanker, rail and road transport. The company owns and operates crude oil, natural gas liquids and products pipelines in Alberta, Manitoba and Ontario and has interests in the capital stock of one crude oil and two products pipeline companies.
The company markets more than 650 petroleum products throughout Canada under well known brand names, most notably Esso and Mobil, to all types of customers.
The company sells to the motoring public through Esso retail service stations. On average during the year, there were about 1,850 retail service stations, of which about 540 were company owned or leased, but none of which were company operated. The company continues to improve its Esso retail service station network, providing more customer services such as car washes and convenience stores, primarily at high volume sites in urban centres.
The Canadian farm, residential heating and small commercial markets are served through about 85 sales facilities. The company also sells petroleum products to large industrial and commercial accounts as well as to other refiners and marketers.
14
Table of Contents
The approximate daily volumes of net petroleum products (excluding purchases/sales contracts with the same counterparty) sold during the five years ended December 31, 2009, are set out in the following table:
| thousands of barrels a day | 2009 | 2008 | 2007 | 2006 | 2005 | |||||
| Gasolines |
200 | 204 | 208 | 206 | 210 | |||||
| Heating, diesel and jet fuels |
143 | 157 | 164 | 166 | 169 | |||||
| Heavy fuel oils |
27 | 30 | 33 | 32 | 38 | |||||
| Lube oils and other products |
39 | 47 | 43 | 49 | 48 | |||||
| Net petroleum product sales |
409 | 438 | 448 | 453 | 465 | |||||
| The total domestic sales of petroleum products, as a percentage of total sales of petroleum products during the five years ended December 31, 2009, were as follows:
| ||||||||||
| percentage | 2009 | 2008 | 2007 | 2006 | 2005 | |||||
| Domestic petroleum product sales as a percentage of total petroleum product sales |
90.3 |
93.0 |
94.8 |
95.1 |
95.3 | |||||
The company continues to evaluate and adjust its Esso retail service station and distribution system to increase productivity and efficiency. During 2009, the company closed or debranded about 80 Esso retail service stations, about 25 of which were company owned, and added about 50 sites. The company’s average annual throughput in 2009 per Esso retail service station was about 25 thousand barrels (3.9 million litres), an increase of about one thousand barrels (0.2 million litres). Average throughput per company owned or leased Esso retail service station was about 44 thousand barrels (7.0 million litres) in 2009, an increase of about two thousand barrels (0.3 million litres) from 2008.
The company’s Chemical operations manufacture and market ethylene, benzene, aromatic and aliphatic solvents, plasticizer intermediates and polyethylene resin. Its major petrochemical and polyethylene manufacturing operations are located in Sarnia, Ontario, adjacent to the company’s petroleum refinery. There is also a heptene and octene plant located in Dartmouth, Nova Scotia.
The company’s average daily sales of petrochemicals during the five years ended December 31, 2009, were as follows:
| thousands of tonnes a day | 2009 | 2008 | 2007 | 2006 | 2005 | |||||
| Total average daily sales of petrochemicals |
2.8 | 2.8 | 3.1 | 3.0 | 3.0 |
In 2009, the company’s research expenditures in Canada, before deduction of investment tax credits, were $78 million, as compared with $117 million in 2008, and $83 million in 2007. Those funds were used mainly for developing improved crude bitumen recovery methods and refinery processes, and supporting the lubricants business.
A research facility to support the company’s Upstream operations is located in Calgary, Alberta. Research in these laboratories is aimed at developing new technology for the production and processing of crude bitumen. About 40 people were involved in this type of research in 2009. The company also participated in bitumen recovery and processing research for oil sands development through its interest in Syncrude, which maintains research facilities in Edmonton, Alberta and through research arrangements with others.
15
Table of Contents
In company laboratories in Sarnia, Ontario, research and advanced technical support is mainly conducted on the development and support of lubricants and fuels products and processes. About 105 people were employed in this type of research and advanced technical support at the end of 2009. Also in Sarnia, there are about eight people engaged in new product development for the company’s and Exxon Mobil Corporation’s polyethylene injection and rotational molding businesses.
The company has scientific research agreements with affiliates of Exxon Mobil Corporation, which provide for technical and engineering work to be performed by all parties, the exchange of technical information and the assignment and licensing of patents and patent rights. These agreements provide mutual access to scientific and operating data related to nearly every phase of the petroleum and petrochemical operations of the parties.
The company is concerned with and active in protecting the environment in connection with its various operations. The company works in cooperation with government agencies, industry associations and communities to deal with existing, and to anticipate potential, environmental protection issues. In the past five years, the company has made capital and operating expenditures of about $3.0 billion on environmental protection and facilities. In 2009, the company’s environmental capital and operating expenditures totaled approximately $770 million, which was spent primarily on emissions reductions at company owned facilities and Syncrude, remediation of idled facilities and operations, as well as on protection of freshwater near Imperial facilities. Capital and operating expenditures relating to environmental protection are expected to be about $790 million in 2010.
At December 31, 2009, the company employed 5,015 persons on a full-time basis, compared with about 4,850 at the end of 2008 and 4,800 at the end of 2007. About nine percent of the company’s employees are members of unions. The company continues to maintain a broad range of benefits, including health, dental, disability and survivor benefits, vacation, savings plan and pension plan.
The Canadian petroleum, natural gas and chemical industries are highly competitive. Competition exists in the search for and development of new sources of supply, the construction and operation of crude oil, natural gas and refined products pipelines and facilities and the refining, distribution and marketing of petroleum products and chemicals. The petroleum industry also competes with other industries in supplying energy, fuel and other needs of consumers.
Petroleum and natural gas rights
Most of the company’s petroleum and natural gas rights were acquired from governments, either federal or provincial. Reservations, permits or licences are acquired from the provinces for cash and entitle the holder to obtain leases upon completing specified work. Leases may also be acquired for cash. A lease entitles the holder to produce petroleum and/or natural gas from the leased lands. The holder of a licence relating to Canada lands and the Atlantic Offshore is generally required to make cash payments or to undertake specified work or amounts of exploration expenditures in order to retain the holder’s interest in the land and may become entitled to produce petroleum or natural gas from the licenced land.
Crude oil
Production
The maximum allowable gross production of crude oil from wells in Canada is subject to limitation by various regulatory authorities on the basis of engineering and conservation principles.
16
Table of Contents
Exports
Export contracts of more than one year for light crude oil and petroleum products and two years for heavy crude oil (including crude bitumen) require the prior approval of the NEB and the Government of Canada.
Natural gas
Production
The maximum allowable gross production of natural gas from wells in Canada is subject to limitations by various regulatory authorities. These limitations are to ensure oil recovery is not adversely impacted by accelerated gas production practices. These limitations do not impact gas reserves, only the timing of production of the reserves, and did not have a significant impact on 2009 gas production rates.
Exports
The Government of Canada has the authority to regulate the export price for natural gas and has a gas export pricing policy, which accommodates export prices for natural gas negotiated between Canadian exporters and U.S. importers.
Exports of natural gas from Canada require approval by the NEB and the Government of Canada. The Government of Canada allows the export of natural gas by NEB order without volume limitation for terms not exceeding 24 months.
Royalties
The Government of Canada and the provinces in which the company produces crude oil and natural gas impose royalties on production from lands where they own the mineral rights. Some producing provinces also receive revenue by imposing taxes on production from lands where they do not own the mineral rights.
Different royalties are imposed by the Government of Canada and each of the producing provinces. Royalties imposed on crude oil, natural gas and natural gas liquids vary depending on a number of parameters, including well production volumes, selling prices and recovery methods. For information with respect to royalty rates for Norman Wells, Cold Lake, Syncrude and Kearl, see “Upstream” section under Item 1.
Investment Canada Act
The Investment Canada Act requires Government of Canada approval, in certain cases, of the acquisition of control of a Canadian business by an entity that is not controlled by Canadians. The acquisition of natural resource properties may, in certain circumstances, be considered a transaction that constitutes an acquisition of control of a Canadian business requiring Government of Canada approval.
The Act also requires notification of the establishment of new unrelated businesses in Canada by entities not controlled by Canadians, but does not require Government of Canada approval except when the new business is related to Canada’s cultural heritage or national identity. The Government of Canada is also authorized, through recent amendments to the Act, to take any measures that it considers advisable to protect national security, including the outright prohibition of a foreign investment in Canada. By virtue of the majority stock ownership of the company by Exxon Mobil Corporation, the company is considered to be an entity which is not controlled by Canadians.
The company’s website www.imperialoil.ca contains a variety of corporate and investor information which is available free of charge, including the company’s annual report on Form 10-K, quarterly reports on Form 10-Q and current reports on Form 8-K and amendments to these reports, as well as required interactive data filings. These reports are made available as soon as reasonably practicable after they are filed or furnished to the U.S. SEC.
17
Table of Contents
| Item 1A. | Risk factors |
Volatility of oil and natural gas prices
The company’s results of operations and financial condition are dependent on the prices it receives for its oil and natural gas production. Crude oil and natural gas prices are determined by global and North American markets and are subject to changing supply and demand conditions. These can be influenced by a wide range of factors including economic conditions, international political developments and weather. In the past, crude oil and natural gas prices have been volatile, and the company expects that volatility to continue. Any material decline in oil or natural gas prices could have a material adverse effect on the company’s operations, financial condition, proven reserves and the amount spent to develop oil and natural gas reserves.
A significant portion of the company’s production is bitumen. The market prices for bitumen differ from the established market indices for light and medium grades of oil principally due to the higher transportation and refining costs associated with bitumen and limited refining capacity capable of processing bitumen. As a result, the price received for bitumen is generally lower than the price for medium and light oil. Future differentials are uncertain and increases in the bitumen differentials could have a material adverse effect on the company’s business.
Industry crude oil and natural gas commodity prices and petroleum and chemical product prices are commonly benchmarked in U.S. dollars. The majority of Imperial’s sales and purchases are related to these industry U.S. dollar benchmarks. As the company records and reports its financial results in Canadian dollars, to the extent that the Canadian/U.S. dollar exchange rate fluctuates, the company’s earnings will be affected.
The company does not use derivative instruments to speculate on the future direction of currency or commodity prices.
Competitive factors
The oil and gas industry is highly competitive, particularly in the following areas: searching for and developing new sources of supply; constructing and operating crude oil, natural gas and refined products pipelines and facilities; and the refining, distribution and marketing of petroleum products and chemicals. The company’s competitors include major integrated oil and gas companies and numerous other independent oil and gas companies. The petroleum industry also competes with other industries in supplying energy, fuel and related products to customers.
Competitive forces may result in shortages of prospects to drill, services to carry out exploration, development or operating activities and infrastructure to produce and transport production. It may also result in an oversupply of crude oil, natural gas, petroleum products and chemicals. Each of these factors could have a negative impact on costs and prices and, therefore, the company’s financial results.
18
Table of Contents
Environmental risks
All phases of the Upstream, Downstream and Chemical businesses are subject to environmental regulation pursuant to a variety of Canadian federal, provincial and municipal laws and regulations, as well as international conventions (collectively, “environmental legislation”).
Environmental legislation imposes, among other things, restrictions, liabilities and obligations in connection with the generation, handling, storage, transportation, treatment and disposal of hazardous substances and waste and in connection with spills, releases and emissions of various substances to the environment. As well, environmental regulations are imposed on the qualities and compositions of the products sold and imported. Environmental legislation also requires that wells, facility sites and other properties associated with the company’s operations be operated, maintained, abandoned and reclaimed to the satisfaction of applicable regulatory authorities. In addition, certain types of operations, including exploration and development projects and significant changes to certain existing projects, may require the submission and approval of environmental impact assessments. Compliance with environmental legislation can require significant expenditures and failure to comply with environmental legislation may result in the imposition of fines and penalties and liability for clean up costs and damages. The company cannot assure that the costs of complying with environmental legislation in the future will not have a material adverse effect on its financial condition or results of operations. The company anticipates that changes in environmental legislation may require, among other things, reductions in emissions to the air from its operations and result in increased capital expenditures. Future changes in environmental legislation could occur and result in stricter standards and enforcement, larger fines and liability, and increased capital expenditures and operating costs, which could have a material adverse effect on the company’s financial condition or results of operations.
Climate change
In April 2007, the Government of Canada announced its intent to introduce a set of regulations to limit emissions of greenhouse gas and air pollutants from major industrial facilities in Canada, although the details of the regulations have not been finalized. In the fall of 2009, the Government further expressed its intent that Canadian policy in this area be aligned with that of the U.S., which also remains under development. Consequently, attempts to assess the impact on the company are premature. The company will continue to monitor the development of legal requirements in this area.
In the Province of Alberta, regulations governing greenhouse gas emissions from large industrial facilities came into effect July 1, 2007. These regulations cover industrial facilities emitting more than 100,000 tonnes (carbon dioxide equivalent) of greenhouse gas emissions annually and require a reduction by 12 percent in the greenhouse gas emissions per unit of production from each facility’s average annual intensity over the period 2003 through 2005. Allowed compliance measures include participation in an Alberta emission-trading system or payment (at a rate of $15 per excess tonne of emissions) to Alberta’s Climate Change and Emissions Management Fund. Impact on the overall operations of the company has not been material.
The Province of British Columbia introduced a carbon tax in 2008 applying to purchases of hydrocarbon fuels and emissions of greenhouse gases. The applicable tax rate was increased from $10 per tonne of carbon dioxide to $15 in 2009, and further annual increases of $5 a tonne to a level of $30 a tonne are planned. It is the current policy of the government of British Columbia. to offset revenues from this tax by reductions in corporate and personal income taxes. Impacts on the company and its operations have not been and are not expected to be material.
The provinces of Ontario and Quebec have passed legislation authorizing the issuing of regulations for the creation of a provincial cap-and-trade system controlling greenhouse gas emissions from industrial facilities. However, details on such possible regulations have not been provided and consequently attempts to assess any impacts on the company are premature.
19
Table of Contents
The Province of British Columbia has introduced Low Carbon Fuel Standard (LCFS) regulations requiring suppliers of transportation fuels to report the life cycle greenhouse gas emissions per unit of energy of fuels sold in British Columbia, and beginning in 2011 to reduce these emissions by an increasing amount each year. California has introduced similar requirements and some other U.S. states are considering comparable measures. Such measures may have implications for the company’s marketing in British Columbia or the U.S. of oil sands production or of products derived from them, but the impact cannot be determined at this time.
The U.S. Energy Independence and Security Act of 2007 precludes agencies of the U.S. federal government from procuring motive fuels from non-conventional petroleum sources that have lifecycle greenhouse gas emissions greater than equivalent conventional fuel. This may have implications for the company’s marketing in the U.S. of some oil sands production, but the impact cannot be determined at this time. To date, sales of the company’s oil sands production have not been affected by this Act.
Further federal or provincial legislation or regulation controlling greenhouse gas emissions could occur and result in increased capital expenditures and operating costs, affect demand and have a material adverse effect on the company’s financial condition or results of operations, but any potential impact cannot be estimated at this time.
Other regulatory risk
The company is subject to a wide range of legislation and regulation governing its operations over which it has no control. Changes may affect every aspect of the company’s operations and financial performance.
Need to replace reserves
The company’s future liquids, bitumen, synthetic oil and natural gas reserves and production, and therefore cash flows, are highly dependent upon the company’s success in exploiting its current reserve base and acquiring or discovering additional reserves. Without additions to the company’s reserves through exploration, acquisition or development activities, reserves and production will decline over time as reserves are depleted. The business of exploring for, developing or acquiring reserves is capital intensive. To the extent cash flows from operations are insufficient to fund capital expenditures and external sources of capital become limited or unavailable, the company’s ability to make the necessary capital investments to maintain and expand oil and natural gas reserves will be impaired. In addition, the company may be unable to find and develop or acquire additional reserves to replace oil and natural gas production at acceptable costs.
Other business risks
Exploring for, producing and transporting petroleum substances involve many risks, which even a combination of experience, knowledge and careful evaluation may not be able to mitigate. These activities are subject to a number of hazards, which may result in fires, explosions, spills, blow-outs or other unexpected or dangerous conditions causing personal injury, property damage, environmental damage and interruption of operations. The company’s insurance may not provide adequate coverage in certain unforeseen circumstances.
20
Table of Contents
Uncertainty of reserve estimates
There are numerous uncertainties inherent in estimating quantities of reserves, including many factors beyond the company’s control. In general, estimates of economically recoverable oil and natural gas reserves and the future net cash flow are based upon a number of factors and assumptions made as of the date on which the reserve estimates were determined, such as geological and engineering estimates which have inherent uncertainties, the assumed effects of regulation by governmental agencies and future commodity prices and operating costs, all of which may vary considerably from actual results. All such estimates are, to some degree, uncertain and classifications of reserves are only attempts to define the degree of uncertainty involved. For these reasons, estimates of the economically recoverable oil and natural gas reserves, the classification of such reserves based on risk of recovery and estimates of future net revenues expected therefrom, prepared by different engineers or by the same engineers at different times, may vary substantially. Actual production, revenues, taxes and development, abandonment and operating expenditures with respect to its reserves will likely vary from such estimates, and such variances could be material.
Estimates with respect to reserves that may be developed and produced in the future are often based upon volumetric calculations and upon analogy to similar types of reserves, rather than upon actual production history. Estimates based on these methods generally are less reliable than those based on actual production history. Subsequent evaluation of the same reserves based upon production history will result in variations, which may be material, in the estimated reserves.
Project factors
The company’s results depend on its ability to develop and operate major projects and facilities as planned. The company’s results will, therefore, be affected by events or conditions that affect the advancement, operation, cost or results of such projects or facilities. These risks include the company’s ability to obtain the necessary environmental and other regulatory approvals; changes in resources and operating costs including the availability and cost of materials, equipment and qualified personnel; the impact of general economic, business and market conditions; and the occurrence of unforeseen technical difficulties.
| Item 1B. | Unresolved staff comments |
Not applicable.
| Item 2. | Properties |
Reference is made to Item 1 above.
| Item 3. | Legal proceedings |
Not applicable.
| Item 4. | Submission of matters to a vote of security holders |
Not applicable.
21
Table of Contents
PART II
| Item 5. | Market for registrant’s common equity, related stockholder matters and issuer purchases of equity securities |
Information for security holders outside Canada
Cash dividends paid to shareholders resident in countries with which Canada has an income tax convention are usually subject to a Canadian nonresident withholding tax of 15 percent.
The withholding tax is reduced to five percent on dividends paid to a corporation resident in the U.S. that owns at least 10 percent of the voting shares of the company.
Imperial is a qualified foreign corporation for purposes of the reduced U.S. capital gains tax rates (15 percent and as low as zero percent for certain individuals), which are applicable to dividends paid by U.S. domestic corporations and qualified foreign corporations.
There is no Canadian tax on gains from selling shares or debt instruments owned by nonresidents not carrying on business in Canada.
Reference is made to the “Quarterly financial and stock trading data” portion of the Financial section on page 109 of this report.
As of February 12, 2010 there were 13,123 holders of record of common shares of the company.
During the period October 1, 2009 to December 31, 2009, the company issued 16,350 common shares to employees or former employees outside the U.S. for $15.50 per share upon the exercise of stock options. During the period October 1, 2009 to December 31, 2009, the company issued 4,320 shares to employees or former employees outside the U.S. under its restricted stock unit plan. These issuances were not registered under the Securities Act in reliance on Regulation S thereunder.
On June 23, 2009, the company announced by news release that it had received final approval from the Toronto Stock Exchange for a new normal course issuer bid and will continue its share repurchase program. The new program enables the company to repurchase up to a maximum of 42,380,326 common shares, including common shares purchased for the company’s employee savings plan and the company’s employee retirement plan and from Exxon Mobil Corporation during the period of June 25, 2009 to June 24, 2010. If not previously terminated, the program will end on June 24, 2010.
Issuer purchases of equity securities
| period | Total of shares purchased |
Average price ($) |
Total number of shares purchased as part of publicly announced plans or programs |
Maximum number (or approximate dollar value) | ||||
| October 2009 (October 1 - October 31) |
– |
n/a |
– |
42,037,559 | ||||
| November 2009 (November 1 - November 30) |
9,000 |
40.89 |
9,000 |
41,946,887 | ||||
| December 2009 (December 1 - December 31) |
27,420 |
40.25 |
27,420 |
41,835,978 |
22
Table of Contents
| Item 6. | Selected financial data |
| millions of dollars | 2009 | 2008 | 2007 | 2006 | 2005 | |||||
| Operating revenues (a) |
21,292 | 31,240 | 25,069 | 24,505 | 27,797 | |||||
| Net income |
1,579 | 3,878 | 3,188 | 3,044 | 2,600 | |||||
| Total assets at year-end |
17,473 | 17,035 | 16,287 | 16,141 | 15,582 | |||||
| Long term debt at year-end |
31 | 34 | 38 | 359 | 863 | |||||
| Total debt at year-end |
140 | 143 | 146 | 1,437 | 1,439 | |||||
| Other long term obligations at year-end |
2,839 | 2,254 | 1,914 | 1,683 | 1,728 | |||||
| dollars |
||||||||||
|
Net income/share – basic (b) |
1.86 | 4.39 | 3.43 | 3.12 | 2.54 | |||||
| Net income/share – diluted (b) |
1.84 | 4.36 | 3.41 | 3.11 | 2.53 | |||||
| Dividends/share (b) |
0.40 | 0.38 | 0.35 | 0.32 | 0.31 |
| a) | Operating revenues include $4,894 million for 2005 for purchases/sales contracts with the same counterparty. Associated costs were included in “purchases of crude oil and products”. Effective January 1, 2006, these purchases/sales were recorded on a net basis. |
| b) | Adjusted to reflect the May 2006 three-for-one share split. |
Reference is made to the table setting forth exchange rates for the Canadian dollar, expressed in U.S. dollars, on page 2 of this report.
| Item 7. | Management’s discussion and analysis of financial condition and results of operations |
Reference is made to the section entitled “Management discussion and analysis of financial condition and results of operations” in the Financial section, starting on page 63 of this report.
| Item 7A. | Quantitative and qualitative disclosures about market risks |
Reference is made to the section entitled “Market risks and other uncertainties” in the Financial section of this report, page 73. All statements other than historical information incorporated in this Item 7A are forward-looking statements. The actual impact of future market changes could differ materially due to, among other things, factors discussed in this report.
| Item 8. | Financial statements and supplementary data |
Reference is made to the following financial information in the Financial section of this report:
Consolidated financial statements, together with the report thereon of PricewaterhouseCoopers LLP (PwC) dated February 26, 2010, beginning with the section entitled “Independent auditors’ report” on page 78 and continuing through note 15, “Transactions with related parties” on page 103; “Supplemental information on oil and gas exploration and production activities” (unaudited) starting on page 104, and “Quarterly financial and stock trading data” (unaudited) on page 109.
| Item 9. | Changes in and disagreements with accountants on accounting and financial disclosure |
None.
23
Table of Contents
| Item 9A. | Controls and procedures |
As indicated in the certifications in Exhibit 31 of this report, the company’s principal executive officer and principal financial officer have evaluated the company’s disclosure controls and procedures as of December 31, 2009. Based on that evaluation, these officers have concluded that the company’s disclosure controls and procedures are effective in ensuring that information required to be disclosed by the company in the reports that it files or submits under the Securities Exchange Act of 1934, as amended, is accumulated and communicated to them in a manner that allows for timely decisions regarding required disclosures and are effective in ensuring that such information is recorded, processed, summarized and reported within the time periods specified in the SEC’s rules and forms.
Reference is made to page 77 of this report for “Management’s report on internal control over financial reporting” and page 78 for the “Independent auditors’ report” of the independent registered public accounting firm on the company’s internal control over financial reporting as of December 31, 2009.
There has not been any change in the company’s internal control over financial reporting during the last fiscal quarter that has materially affected, or is reasonably likely to materially affect, the company’s internal control over financial reporting.
| Item 9B. | Other information |
None.
24
Table of Contents
PART III
| Item 10. | Directors, executive officers and corporate governance |
The company currently has eight directors. Each director is elected to hold office until the close of the next annual meeting. Each of the seven individuals listed below have been nominated for election at the annual meeting of shareholders to be held April 29, 2010. All of the nominees, except for D.S. Sutherland, are now directors and have been since the dates indicated. R. Phillips is currently a director and is not standing for re-election in 2010 as he will reach the company’s mandatory retirement age for directors in 2010. R. Phillips is currently a member of audit committee; member of executive resources committee; member of environment, health and safety committee; member of nominations and corporate governance committee and a member of the Imperial Oil Foundation board of directors. P.A. Smith is currently a director and is not standing for re-election in 2010, as he has announced he will be retiring from the company effective April 30, 2010. P.A. Smith is currently a member of the Imperial Oil Foundation board of directors.
The following chart provides information on the seven nominees proposed for election to the board of directors of the company.
| Name and current principal occupation or employment |
Last major position or office with the company or Exxon Mobil Corporation |
Director since | Holdings (d)(e)(f) | |||||
| K.T. (Krystyna) Hoeg Retired president and chief executive officer, Corby Distilleries Limited (a)(c) |
– | May 1, 2008 | Common shares of Imperial Oil Limited |
0 | ||||
| Deferred share units of Imperial Oil Limited |
5,005 | |||||||
| Restricted stock units of Imperial Oil Limited |
4,000 | |||||||
| Shares of Exxon Mobil Corporation
|
0
| |||||||
| B.H. (Bruce) March Chairman, president and chief executive officer, Imperial Oil Limited |
President, Imperial Oil Limited, Calgary, Alberta |
January 1, 2008 | Common shares of Imperial Oil Limited |
5,000 | ||||
| Deferred share units of Imperial Oil Limited |
0 | |||||||
| Restricted stock units of Imperial Oil Limited |
86,600 | |||||||
| Shares of Exxon Mobil Corporation (g)
|
71,066
| |||||||
| J.M. (Jack) Mintz Palmer Chair in Public Policy for the University of Calgary (a)(c) |
– | April 21, 2005 | Common shares of Imperial Oil Limited |
1,000 | ||||
| Deferred share units of Imperial Oil Limited |
6,147 | |||||||
| Restricted stock units of Imperial Oil Limited | 9,000 | |||||||
| Shares of Exxon Mobil Corporation
|
0
| |||||||
| R.C. (Robert) Olsen Executive vice-president, ExxonMobil Production Company (b)(c) |
Chairman and production director, ExxonMobil International Limited, London, England |
May 1, 2008 | Common shares of Imperial Oil Limited |
6,000 | ||||
| Deferred share units of Imperial Oil Limited |
0 | |||||||
| Restricted stock units of Imperial Oil Limited | 0 | |||||||
| Shares of Exxon Mobil Corporation (g)
|
307,562
| |||||||
| (Table continued on next page) | ||||||||
25
Table of Contents
| Name and current principal occupation or employment |
Last major position or office with the company or Exxon Mobil Corporation |
Director since | Holdings (d)(e)(f) | |||||
| D.S. (David) Sutherland Retired president and chief executive officer, IPSCO Inc. (steel manufacturing) |
– | – | Common shares of Imperial Oil Limited |
15,000 | ||||
| Deferred share units of Imperial Oil Limited | 0 | |||||||
| Restricted stock units of Imperial Oil Limited |
0 | |||||||
| Shares of Exxon Mobil Corporation
|
5,450
| |||||||
|
S.D. (Sheelagh) Whittaker Corporate director (a)(c) |
– | April 19, 1996 | Common shares of Imperial Oil Limited |
9,000 | ||||
| Deferred share units of Imperial Oil Limited |
36,795 | |||||||
| Restricted stock units of Imperial Oil Limited |
12,000 | |||||||
| Shares of Exxon Mobil Corporation
|
0
| |||||||
|
V.L. (Victor) Young Corporate director (a)(c) |
– | April 23, 2002 | Common shares of Imperial Oil Limited |
12,750 | ||||
| Deferred share units of Imperial Oil Limited |
6,864 | |||||||
| Restricted stock units of Imperial Oil Limited |
12,000 | |||||||
| Shares of Exxon Mobil Corporation
|
0
| |||||||
| a) | Member of audit committee; member of executive resources committee; member of environment, health and safety committee; and member of nominations and corporate governance committee. |
| b) | Member of executive resources committee; member of environment health and safety committee; and member of nominations and corporate governance committee. |
| c) | Member of Imperial Oil Foundation board of directors. |
| d) | The information includes the beneficial ownership of common shares of Imperial Oil Limited and shares of Exxon Mobil Corporation, which information not being within the knowledge of the company, has been provided by the nominees individually. |
| e) | The company’s plans for restricted stock units and deferred share units is described starting on pages 47 and 46 for nonemployee directors and on pages 32 and 34 for selected employees. |
| f) | The numbers for the company’s restricted stock units and deferred share units represent the total of the restricted stock units and deferred share units received in 2006, 2007, 2008 and 2009 after the three-for-one share split in May 2006, plus three times the number of restricted stock units and deferred share units granted before the share split and still held by the director. The numbers for Exxon Mobil Corporation restricted stock include restricted stock and restricted stock units granted under its restricted stock plan, which is similar to the company’s restricted stock unit plan. |
| g) | B.H. March holds 35,516 common shares and 35,550 restricted shares and restricted stock units of Exxon Mobil Corporation. R.C. Olsen holds 125,562 common shares and 182,000 restricted shares and restricted stock units of Exxon Mobil Corporation. |
The ages of the directors, nominees for election as directors, and the named executive officers of the company are: R.L. Broiles 52, C.W. Erickson 50, K.T. Hoeg 60, B.H. March 53, J.M. Mintz 58, R.C. Olsen 59, R. Phillips 70, P.A. Smith 56, S.M. Smith 52, D.S. Sutherland 60, S.D. Whittaker 62, V.L. Young 64.
26
Table of Contents
Certain of the directors and nominees for election as directors hold positions as directors of other Canadian and U.S. reporting issuers as follows:
| Name | Other reporting issuers of which director is also a director | |
| K.T. Hoeg | Sun Life Financial Inc. Shoppers Drug Mart Corporation Canadian Pacific Railway Limited Canadian Pacific Railway Company Cineplex Galaxy Income Fund | |
| J.M. Mintz | Brookfield Asset Management Inc. Morneau Sobeco Income Fund | |
| R. Phillips | Canadian Pacific Railway Limited Canadian Pacific Railway Company Cliffs Natural Resources Inc. The Toronto-Dominion Bank | |
| D.S. Sutherland | GATX Corporation United States Steel Corporation ZCL Composites Inc. | |
| S.D. Whittaker | Standard Life plc | |
| V.L. Young | Bell Aliant Regional Communications Income Fund BCE Inc. Royal Bank of Canada | |
All of the directors and nominees for election as directors, except for K.T. Hoeg, J.M. Mintz, and D.S. Sutherland have been engaged for more than five years in their present principal occupations or in other executive capacities with the same firm or affiliated firms. During the five preceding years, K.T. Hoeg was president and chief executive officer of Corby Distilleries Limited until she retired in February 2007, J.M. Mintz was president and chief executive officer of The C.D. Howe Institute until he retired in July 2006 and D.S. Sutherland was president and chief executive officer of Ipsco Inc. until he retired in July 2007.
In addition to the named executive officers listed on page 28, the following are also executive officers of the company as of February 12, 2010.
| Name and office | Office held since | Age | ||||
| Sean R. Carleton Controller |
February 1, 2008 | 51 | ||||
| Phil Dranse Assistant treasurer |
August 1, 2008 | 56 | ||||
| Marvin E. Lamb Director, corporate tax |
December 1, 2001 | 54 | ||||
| Brian W. Livingston Vice-president, general counsel and corporate secretary |
August 1, 2004 | 55 | ||||
All of the above executive officers have been engaged for more than five years at their current occupations or in other executive capacities with the company or its affiliates. All executive officers hold office until their appointment is rescinded by the board of directors or by the chief executive officer.
Audit committee
The company has an audit committee of the board of directors. The following directors are the members of the audit committee: K.T. Hoeg, J.M. Mintz, R. Phillips, S.D. Whittaker and V.L. Young (chair).
27
Table of Contents
Audit committee financial expert
The company’s board of directors has determined that K.T. Hoeg, R. Phillips, S.D. Whittaker and V.L. Young meet the definition of “audit committee financial expert” and that they and J.M. Mintz are independent, as that term is defined in Multilateral Instrument 52-110 Audit Committees, the SEC rules and the listing standards of the NYSE Amex LLC, a subsidiary of NYSE Euronext and the New York Stock Exchange. The Securities and Exchange Commission has indicated that the designation of an audit committee financial expert does not make that person an expert for any purpose, or impose any duties, obligations or liability on that person that are greater than those imposed on members of the audit committee and board of directors in the absence of such designation or identification.
Code of ethics
The company has a code of ethics that applies to all employees, including its principal executive officer, principal financial officer and principal accounting officer. The code of ethics consists of the company’s ethics policy, conflicts of interest policy, corporate assets policy, directorships policy, and procedures and open door communication. Those documents are available at the company’s web site www.imperialoil.ca.
| Item 11. | Executive compensation |
Named executive officers of the company
The named executive officers of the company at the end of 2009 were:
B.H. (Bruce) March, Chairman, president and chief executive officer;
P.A. (Paul) Smith, Senior vice-president, finance and administration, and treasurer;
R.L. (Randy) Broiles, Senior vice-president, resources division;
C.W. (Chris) Erickson, Vice-president and general manager, refining and supply; and
S.M. (Simon) Smith, Vice-president and general manager, fuels marketing.
Executive resources committee
The executive resources committee of the board of directors is composed of the five independent directors and R.C. Olsen, who is employed by ExxonMobil Production Company. The executive resources committee is responsible for corporate policy on compensation and for specific decisions on the compensation of the chief executive officer and key senior executives and officers reporting directly to that position. In addition to compensation matters, the committee is also responsible for succession plans and appointments to senior executive and officer positions, including the chief executive officer.
During 2009, the membership of the executive resources committee was as follows: R. Phillips (chair), V.L. Young (vice-chair), K.T. Hoeg, J.M. Mintz, R.C. Olsen and S.D. Whittaker.
B.H. March periodically attends meetings at the request of the committee.
Report of executive resources committee on executive compensation
The executive resources committee of the board of directors has reviewed and discussed the “Compensation discussion and analysis” for 2009 with management of the company. Based on that review and discussion, the committee recommended to the board that the “Compensation discussion and analysis” be included in the company’s management proxy circular for the 2010 annual meeting of shareholders.
Submitted on behalf of the executive resources committee:
| R. Phillips (chair) | J.M. Mintz | |
| V.L. Young (vice-chair) | R.C. Olsen | |
| K.T. Hoeg | S.D. Whittaker |
28
Table of Contents
Compensation discussion and analysis
Overview
Providing energy to meet Canada’s demands is a complex business. The company meets this challenge by taking a long-term view to managing its business rather than reacting to short-term business cycles. As such, the compensation program of the company aligns with this long-term business approach and key business strategies as outlined below.
Business environment
| • | Large capital expenditures with long investment periods; |
| • | Complex operating and financial risks; |
| • | National scope of company operations; and |
| • | Commodity-based cyclical product prices. |
Key business strategies
| • | Grow profitable sales volumes; |
| • | Disciplined, selective and long-term focus on improving the productivity of the company’s asset mix; |
| • | Flawless execution; and |
| • | Best-in-class cost structure to ensure industry-leading returns on capital and superior cash flow. |
Focus on these key strategies for the business is a company priority and ensures long-term growth in shareholder value.
Key elements of the compensation program
The key elements of the company’s compensation program and staffing objectives that support the business environment and key business strategies are:
| • | long-term career orientation with high individual performance standards (see page 30); |
| • | base salary that rewards individual performance and experience (see page 31); |
| • | annual bonus grants based on business performance, as well as individual performance and experience (starting on page 31); |
| • | payment of a large portion of executive compensation in the form of restricted stock units with lengthy vesting periods (starting on page 32); and |
| • | retirement benefits (pension and savings plans) that provide for financial security after employment (starting on page 34). |
The company’s executive compensation program is designed to:
| • | reinforce the company’s orientation toward career employment and individual performance; |
| • | acknowledge the long-term nature of the company’s business; |
| • | reinforce its philosophy that the experience, skill and motivation of the company’s executives are significant determinants of future business success; and |
| • | ensure alignment with long-term shareholder interests. |
The compensation program emphasizes competitive salaries and performance-based incentives as the primary instruments to attract, develop and retain key personnel.
Other supporting compensation and staffing practices
| • | A long established program of management development and succession planning is in place to reinforce a career orientation and ensure continuity of leadership. |
| • | All executives participate in common programs (the same salary, incentive and retirement programs). Within these programs, the compensation of executives is differentiated based on individual performance assessment, level of responsibility and individual experience. All senior executives on loan assignment from ExxonMobil participate in common programs, as well, which are administered by ExxonMobil. |
| • | Substantial amounts of executive compensation for the named executive officers are at risk of forfeiture if the executive engages in activity that is detrimental to the company, including material negative restatement of financial or operating results. |
29
Table of Contents
| • | Inappropriate risk taking is discouraged by requiring senior executives to hold a substantial portion of their equity incentive award for a long period of time and in some cases beyond retirement. These lengthy holding periods are tailored to our business model. Furthermore, payout of 50 percent of the annual bonus is delayed and subject to risk of forfeiture. The timing of the payout is determined by earnings performance. |
| • | The use of perquisites at the company is very limited, and mainly composed of only two elements, financial planning for senior executives, and the use of club memberships for select executives which are largely tied to building business relationships. |
| • | No tax assistance is provided by the company on any elements of executive officer compensation or perquisites other than relocation. The relocation program is broad-based and applies to all management, professional, technical and executive transferred employees. |
Employee appraisal and ranking process
The assessment of individual performance is conducted through the company’s employee appraisal program. Conducted annually, the appraisal process assesses performance against business performance measures and objectives relevant to each employee, including the means by which performance is achieved. These business performance measures include:
| • | total shareholder return; |
| • | net income; |
| • | return on capital employed; |
| • | cash distribution to shareholders; |
| • | safety, health, and environmental performance; |
| • | operating performance of the Upstream, Downstream, and Chemical segments; |
| • | business controls; and |
| • | effectiveness of actions that support the long-term strategic direction of the company. |
The ranking process, which is an integral part of the appraisal process, involves comparative assessment of employee performance using a standard process throughout the organization and at all levels. The appraisal process is integrated with the compensation program and also with the executive development process. Both have been in place for many years and are the basis for planning individual development and succession planning for management positions. The decision-making process with respect to compensation requires judgment, taking into account business and individual performance and responsibility. Quantitative targets or formulae are not used to assess individual performance or determine the amount of compensation.
Compensation program
Career orientation
The company’s objective is to attract, develop and retain over a career the best talent available. It takes a long period of time and significant investment to develop the experienced executive talent necessary to succeed in the company’s business; senior executives must have experience with all phases of the business cycle to be effective leaders. The company’s compensation program elements reinforce the long-term approach. Career orientation among a dedicated and highly skilled workforce, combined with the highest performance standards, contributes to the company’s leadership in the industry and serves the interests of shareholders in the long term. The company service of the named executive officers reflects this strategy. Their career service ranges from approximately 28 to over 30 years.
Consistent with the company’s long-term career orientation, high-performing executives typically earn substantially higher levels of compensation in the final years of their careers than in the earlier years. This pay practice reinforces the importance of a long-term focus in making decisions that are key to business success.
The compensation program emphasizes individual experience and sustained performance, executives holding similar positions may receive substantially different levels of compensation.
The company’s executive compensation program is composed of base salaries, cash bonuses and medium and long-term incentive compensation. The company does not have written employment contracts or any other agreement with its named executive officers providing for payments on change of control or termination of employment.
30
Table of Contents
Base salary
Salaries provide executives with a base level of income. The level of annual salary is based on the executive’s responsibility, performance assessment and career experience. The salary program in 2009 maintained the company’s competitive position on salaries in the marketplace. Individual salary increases vary depending on each executive’s performance assessment and other factors such as time in position and potential for advancement. Salary decisions also directly affect the level of retirement benefits since salary is included in the retirement benefit calculation. Thus, the level of retirement benefits is also performance-based like other elements of compensation.
Annual bonus
Annual bonuses are typically granted to approximately 90 executives to reward their contributions to the business during the past year. Bonuses are drawn from an aggregate bonus pool established annually by the executive resources committee based on the company’s financial and operating performance, and can be highly variable depending on annual financial and operating results.
In setting the size of the annual bonus pool and individual executive awards, the executive resources committee:
| • | considers input from the chairman, president and chief executive officer on the performance of the company and from the company’s internal compensation advisors regarding compensation trends as obtained from external consultants; |
| • | considers total shareholder return, annual net income of the company and the other key business performance indicators as described on page 30; and |
| • | uses judgment to manage the overall size of the annual bonus pool taking into consideration the cyclical nature and long-term orientation of the business. |
The 2009 annual bonus pool was approximately $7.05 million versus $11.9 million in 2008. Given the challenging global economic downturn in 2009, the company’s earnings declined under these difficult conditions. The 2009 annual bonus pool was reduced by 40 percent from the previous year, reflecting the decline in shareholder return and annual income. This bonus reflects the combined value at grant of annual cash bonus and earnings bonus units. In relation to this, the company’s net income for 2009 was approximately $1.6 billion (down by 59 percent), return on shareholders’ equity was approximately 17 percent, return on capital employed was approximately 17 percent and total annual shareholders’ return was 0.2 percent. Changes in individual cash bonus awards vary depending on each executive’s performance assessment.
The annual bonus program incorporates unique elements to further reinforce retention and recognize performance. Awards under this program are generally delivered as:
| • | 50 percent cash paid in the year of grant; and |
| • | 50 percent earnings bonus units with a delayed payout based on cumulative earnings performance. |
The cash component is intended to be a short-term incentive, while the earnings bonus unit plan is intended to be a medium-term incentive. Earnings bonus units are made available to selected executives to promote individual contribution to sustained improvement in the company’s business performance and shareholder value. Earnings bonus units are generally equal to and granted in tandem with cash bonuses.
Specifically, earnings bonus units are cash awards that are tied to future cumulative earnings per share. Earnings bonus units pay out when a specified level of cumulative earnings per share is achieved or within three years, whichever is earlier.
For earnings bonus units granted in 2009, the maximum settlement value (trigger) or cumulative earnings per share required for payout remained at $2.75 in 2009, reinforcing the company’s principle of continuous improvement in business performance and to reflect the reduction in the number of outstanding shares pursuant to the company’s share purchase program. The trigger of $2.75 is intentionally set at a level that is expected to be achieved within the three-year period.
If cumulative earnings per share did not reach $2.75 within three years, the payment with respect to the earnings bonus unit would be reduced to an amount equal to the number of units times the actual cumulative earnings per share over the period.
31
Table of Contents
The annual bonus includes the combined value of the cash bonus and delayed earnings bonus unit portion and is intended to be competitive with the annual bonus awards of other major comparator companies adjusted to reflect the company’s performance relative to its comparators. The earnings bonus units are designed such that the timing of the payout is tied to the rate of the company’s future earnings; however, it is not intended to vary the amount of the award based on future earnings. In so doing, the delayed portion of the annual bonus, that is the earnings bonus unit, puts part of the annual bonus at risk of forfeiture and thus reinforces the performance basis of the annual bonus grant.
Prior to payment, the earnings bonus units may be forfeited if the executive leaves the company before age 65, or engages in activity that is detrimental to the company.
Long-term incentive compensation
Restricted stock units
In December 2002, the company introduced a restricted stock unit plan, which is the company’s primary long-term incentive compensation plan. Given the long-term nature of the company’s business, granting compensation in the form of restricted stock units with long vesting periods keeps executives focused on the key premise that decisions made today affect the performance of the organization and company stock for many years to come. This practice supports a risk/reward model that reinforces a long-term view, which is critical to the company’s business success, and discourages inappropriate risk taking. The amount granted is intended to provide an incentive to promote individual contribution to the company’s performance and motivation to remain with the company. The amount is computed by reference to the most recent ranking of performance as an indication of future potential, but may also be considered for an adjustment at time of grant, if near-term performance is deemed to have changed significantly at time of grant. This type of compensation removes employee discretion in the exercise of restricted stock units, ensures alignment with the long-term interests of shareholders and reinforces retention objectives. The company does not re-price restricted stock awards. The utilization of restricted stock units, instead of stock options, and the determination of annual grants on a share-denominated versus price-denominated basis help reinforce this practice. Restricted stock units are not included in pension calculations.
The restricted stock unit plan is a straightforward, primarily cash-based approach to long-term incentive compensation. Grant level guidelines for the restricted stock unit program are generally held constant for long periods of time. The intent of the plan is not to frequently change the number of shares awarded for the same level of individual performance and classification or level of responsibility. A change may be required as a result of periodic checks against the market every three to five years or as a result of any subdivision, consolidation, or reclassification of the shares of the company or other relevant change in the capitalization of the company. The company does not offset losses on prior grants with higher share awards in subsequent grants, nor does the company re-price restricted stock units.
In 2006, the guidelines were reviewed in light of the company’s three-for-one share split. Given the significant appreciation in the company’s share price over the previous several years, restricted stock unit guidelines were adjusted on a two-for-one basis rather than the three-for-one share split. This had the effect of reducing grant values in 2006, 2007 and 2008 compared to 2005 and earlier years. In 2009, after an analysis of the competitive positioning of the company’s restricted stock unit program, the executive resources committee determined that current levels of restricted stock units appropriately position the plan. In 2009, 722 recipients were granted 1,748,448 restricted stock units, including 95 executives and B.H. March.
Exercise of restricted stock units and amendments to the restricted stock unit plan
Restricted stock units will be exercised only during employment, except in the event of death, disability or retirement. Restricted stock units cannot be assigned. In the case of any subdivision, consolidation, or reclassification of the shares of the company or other relevant change in the capitalization of the company, the company, in its discretion, may make appropriate adjustments in the number of common shares to be issued and the calculation of the cash amount payable per restricted stock unit.
32
Table of Contents
Each restricted stock unit entitles the recipient the right to receive from the company, upon exercise, an amount equal to the five day average closing price of the company’s shares on the exercise date and the four preceding trading days. Fifty percent of the units will be exercised on the third anniversary of the grant date, and the remainder will be exercised on the seventh anniversary of the grant date. The company will pay the recipients cash with respect to each unexercised unit granted to the recipient corresponding in time and amount to the cash dividend that is paid by the company on a common share of the company. The restricted stock unit plan was amended for units granted in 2002 and future years by providing that the recipient may receive one common share of the company per unit or elect to receive the cash payment for the units to be exercised on the seventh anniversary of the grant date.
There are 7,661,950 common shares that may be issued in the future with respect to outstanding restricted stock units that represent about 0.90 percent of the company’s currently outstanding common shares. The company’s directors, officers and vice-presidents as a group hold 9.80 percent of the unexercised restricted stock units that give the recipient the right to receive common shares. The maximum number of common shares that any one person may receive from the exercise of restricted stock units is 413,200 common shares, which is about 0.05 percent of the currently outstanding common shares. R.L. Broiles and C.W. Erickson hold Exxon Mobil Corporation restricted stock units. B.H. March also holds Exxon Mobil Corporation restricted stock units granted in 2007 and previous years, as well as the company’s restricted stock units granted in 2008 and 2009.
In 2008, the restricted stock unit plan was also amended by the company to provide that the number of common shares of the company issuable under the plan to any insiders (as defined by the Toronto Stock Exchange) cannot exceed 10 percent of the issued and outstanding common shares, whether at any time or as issued in any one year. The Toronto Stock Exchange advised that this amendment did not require shareholder approval.
In 2008, shareholders approved the following changes to the restricted stock unit plan:
| • | Include an additional vesting period option for 50 percent of restricted stock units to vest on the fifth anniversary of the date of grant, with the remaining 50 percent of the grant to vest on the later of the tenth anniversary of the date of grant or the date of retirement of the grantee. The recipient of such restricted stock units may receive one common share of the company per unit or elect to receive the cash payment for all units to be exercised. The choice of which vesting period to use will be at the discretion of the company. |
| • | Set out which amendments in the future will require shareholder approval, and which amendments will only require director approval and to set an exercise price based on the weighted average price of the company’s shares on the exercise date and the four consecutive trading days immediately prior to the exercise date. |
In respect of restricted stock units granted in 2009:
| • | to the chairman, president and chief executive officer: |
| • | 50 percent of each grant is exercisable on the fifth anniversary of the date of grant; and |
| • | the balance is exercisable on the tenth anniversary of the date of grant or the date of retirement, whichever is later; and |
| • | to all other senior executives: |
| • | 50 percent of each grant is exercisable on the third anniversary of the date of grant; and |
| • | the balance is exercisable on the seventh anniversary of the date of grant. |
The long vesting periods, which are longer than those in use by many other companies, reinforce the company’s focus on growing shareholder value over the long term by subjecting a large percentage of executive compensation and the personal net worth of senior executives to the long-term return on the company’s stock realized by shareholders. The vesting period for restricted stock unit awards is not subject to acceleration, except in the case of death.
33
Table of Contents
Forfeiture risk
Restricted stock units are subject to forfeiture if:
| • | A recipient retires or terminates employment with the company. The company has indicated its intention not to forfeit restricted stock units of employees who retire at age 65. In other circumstances, where a recipient retires or terminates employment, the company may determine that restricted stock units shall not be forfeited. |
| • | During employment or during the period of 24 months after the termination of employment, the recipient, without the consent of the company, engaged in any business that was in competition with the company or otherwise engaged in any activity that was detrimental to the company. |
Deferred share units
In 1998, an additional form of long-term incentive compensation (“deferred share units”) was made available to nonemployee directors (as described starting on page 46) and to selected executives whose decisions are considered to have a direct effect on the long-term financial performance of the company. The selected executives could elect to receive all or part of their cash bonus compensation in the form of such units. In recent years, the use of the deferred share unit plan by eligible employees has been very low. Effective February 2, 2010, the deferred share unit plan for selected executives was terminated to further align the company’s desire to have a uniform compensation program for all executives. There were no active employee participants in the plan at the time of plan termination. The plan remains in force for nonemployee directors.
Retirement benefits
Named executive officers participate in the same pension plan, including a supplemental retirement arrangement, as other employees. B.H. March, R.L. Broiles and C.W. Erickson participate in the Exxon Mobil Corporation pension plans (both tax-qualified and non-qualified).
Pension plan benefits
The table on the following page sets forth the estimated annual benefits that would be payable to each named executive officer of the company upon retirement under the company’s pension plan and the supplemental retirement arrangement and Exxon Mobil Corporation’s tax-qualified and non-qualified pension plans, and the change in the accrued obligation for each named executive officer of the company in 2009.
The current version of the company’s historic 1.6 percent defined benefit plan has been in place since 1976; predecessor plans have been in place since 1919. This version of the plan was available to all employees including executives, with pre-1998 service.
34
Table of Contents
Pension plan benefits table
|
Name |
Number service |
Annual
benefits ($) |
Accrued year |
Compensatory change ($) (f) |
Non- compensatory change ($) (g) |
Accrued ($) (h) |
||||||||||||||||||||||
| (as of 31, 2009) (#) |
At
year (c)
|
At age (d)
|
($) (e) | |||||||||||||||||||||||||
| B.H. March (a) |
– | – | – | – | – | – | – | |||||||||||||||||||||
| P.A. Smith (b) |
29.9 | 378,400 | 483,600 | 3,038,700 | (433,300) | 802,200 | 3,407,600 | |||||||||||||||||||||
| R.L. Broiles (a) |
– | – | – | – | – | – | – | |||||||||||||||||||||
| C.W. Erickson (a) |
– | – | – | – | – | – | – | |||||||||||||||||||||
| S.M. Smith (b) |
28.1 | 326,500 | 474,700 | 2,510,400 | (442,100) | 846,200 | 2,914,500 | |||||||||||||||||||||
| a) | Member of the Exxon Mobil Corporation pension plans, including tax-qualified and non-qualified plans. As of December 31, 2009, B.H. March had 29.5 years of credited service, R.L. Broiles had 30.6 years and C.W. Erickson had 28.5 years. All amounts referenced were converted from U.S. dollars to Canadian dollars at the average 2009 exchange rate of 1.142. |
| b) | Member of the company’s 1.6 percent pension plan as supplemented by payments from the company for amounts beyond the regulatory limits for the registered plan. |
| c) | For members of the company pension plan, the annual benefits include the amount of the accrued annual lifetime pension from the company’s registered pension plan and supplemented by payments from the company. For members of the Exxon Mobil Corporation pension plans, the annual benefits include the accrued annual lifetime pension from the Exxon Mobil Corporation tax-qualified plan and the accrued annual amount calculated under the Exxon Mobil Corporation non-qualified plan. For B.H. March, this value was $449,445, for R.L. Broiles, this value was $382,061 and for C.W. Erickson, this value was $361,271. Non-qualified plan benefits are payable only as a lump sum equivalent upon retirement. |
| d) | For members of the company pension plan, the annual benefits include the amount of the accrued annual lifetime pension from the company’s registered pension plan and supplemented by payments from the company that would be earned to age 65 assuming final average earnings as at December 31, 2009. For members of the Exxon Mobil Corporation pension plan, the annual benefits include the annual lifetime pension from Exxon Mobil Corporation’s tax-qualified plan and the annual amount calculated under the Exxon Mobil Corporation non-qualified plan that would be earned to age 65 assuming final average earnings as at December 31, 2009. For B.H. March, this value was $666,729, for R.L. Broiles, this value was $586,331 and for C.W. Erickson, this value was $584,889. Non-qualified plan benefits are payable only as a lump sum equivalent upon retirement. |
| e) | For members of the company’s pension plan, the “Accrued obligation at start of year” is defined for purposes of authoritative guidance under U.S. generally accepted accounting principles (GAAP) for defined benefit pension plans and is calculated based on earnings eligible for pension as described on page 36 and Yearly Maximum Pensionable Earnings (YMPE) as defined by the Canada Revenue Agency, projected to retirement and pro-rated on service to the date of valuation, December 31, 2008. The calculations assume that the Canada Pension Plan offset is based on the annual maximum benefit at retirement and the Old Age Security (OAS) offset is based on the OAS benefit in the fourth quarter of 2008 projected to retirement. For members of the Exxon Mobil Corporation pension plans, the “Accrued obligation at start of year” is defined under GAAP and is calculated based on earnings eligible for pension as described on page 36. The calculations assume that the U.S. Social Security offset against the Exxon Mobil Corporation qualified plan benefit is calculated on the basis of the Social Security law in effect as of year end 2008. For B.H. March, this value was $3,659,282, for R.L. Broiles, this value was $3,048,578 and for C.W. Erickson, this value was $2,251,070. |
| f) | The value for “Compensatory change” includes service cost for 2009 and impact of change in earnings on projected benefit obligation. Service cost for 2009 is calculated by using the individual’s additional pensionable service in 2009 and the actual salary and bonus received in 2009 as described on page 36. There were no plan amendments in 2009 that affected these benefits. The service cost is calculated on a basis that is consistent with GAAP and with the valuation that was performed as at that date for accounting purposes for the plan as a whole. For B.H. March, this value was $649,756, for R.L. Broiles, this value was $496,030 and for C.W. Erickson, this value was $401,449. |
| g) | The value for “Non-compensatory change” includes impact of experience not related to earnings, benefit payments and change in measurement assumptions. With respect to the company pension plan, the discount rate used to determine the accrued obligation at the end of 2009 decreased to 6.25 percent, down from 7.50 percent at the end of 2008, thereby causing the Non-compensatory change to be positive. For members of the Exxon Mobil Corporation pension plans, the value for “Non-compensatory change” includes the impact of experience not related to earnings or service. This includes the effect of interest, based on a discount rate of 6.25 percent in 2008 and 6.00 percent in 2009, and operation of the plan’s rules for converting annuities to lump sums upon retirement. For B.H. March, this value was $180,209, for R.L. Broiles, this value was $90,698 and for C.W. Erickson, this value was $94,551. |
| h) | For members of the company’s pension plan, the “Accrued obligation at year end” is defined under GAAP and is calculated based on earnings eligible for pension as described on page 36 and YMPE, projected to retirement and pro-rated on service to the date of valuation, December 31, 2009. The calculations assume that the Canada Pension Plan offset is based on the annual maximum benefit at retirement and the OAS offset is based on the OAS benefit in the fourth quarter of 2009 projected to retirement. For members of the Exxon Mobil Corporation pension plans, the “Accrued obligation at year end” is defined under GAAP and is calculated based on earnings eligible for pension as described on page 36. The calculations assume that the U.S. Social Security offset against the Exxon Mobil Corporation qualified plan benefit is calculated on the basis of the Social Security law in effect as of year end 2009. For B.H. March, this value was $4,489,247, for R.L. Broiles, this value was $3,635,306 and for C.W. Erickson, this value was $2,747,070. |
35
Table of Contents
The registered pension plan and supplemental retirement arrangement provide an annual benefit of 1.6 percent of earnings per each year of service with respect to the named executive officers, with an offset for government benefits. Earnings, for this purpose, include average base salary during the last 36 consecutive months of service prior to retirement or the highest consecutive three calendar years of earnings in the last 10 years of service prior to retirement and the average annual bonus for the highest three of the last five years prior to retirement for eligible executives, but do not include long-term compensation, including restricted stock units. By limiting inclusion of bonuses in pensionable earnings to those granted in the five years prior to retirement, there is a strong motivation for executives to continue to perform at a high level. Annual bonus includes the cash amounts that are paid at grant and the value of any earnings bonus units received, as described starting on page 31. The aggregate maximum settlement value that could be paid for earnings bonus units is included in the employee’s final three year average earnings for the year of grant of such units. The value of the earnings bonus units are expected to pay out subject to forfeiture provisions and are included for pension purposes in the year of grant rather than the year of payment. An employee may also elect to forego three of the six percent of the company’s contributions to the savings plan under one of the options of that plan (except for B.H. March, R.L. Broiles and C.W. Erickson), to receive additional pension value equal to 0.4 percent of the employee’s “final three year average earnings”, multiplied by the employee’s years of service, while foregoing such company contributions. In addition to the pension payable under the plan, the company has paid and may continue to use a supplemental retirement arrangement for employees who have earned a pension in excess of the maximum pension under the Income Tax Act.
The remuneration used to determine the payments on retirement to the individuals named in the summary compensation table on page 41 corresponds generally to the salary, bonus and earnings bonus units received in the current year, as described in the previous paragraph. As of February 12, 2010, the number of completed years of service with Imperial Oil Limited used to determine payments on retirement was 30.0 for P.A. Smith and 28.2 for S.M. Smith.
B.H. March, R.L. Broiles and C.W. Erickson are not members of the company’s pension plan, but are members of Exxon Mobil Corporation’s pension plans. Under those plans, B.H. March has 29.6 years of credited service, R.L. Broiles has 30.7 years of credited service and C.W. Erickson has 28.6 years of credited service. Their respective pensions are payable in U.S. dollars. Pay for the purpose of the pension calculation is based on final average base salary over the highest 36 consecutive months in the 10 years of service prior to retirement, and the average annual bonus for the three highest grants out of the last five grants prior to retirement.
Savings plan benefits
The company maintains a savings plan into which career employees with more than one year of service may contribute between one and 30 percent of normal earnings. The company provides contributions which vary depending on the amount of employee contributions and on which defined-benefit pension arrangement the employee participates in. All named executive officers are members of the historic 1.6 percent defined-benefit pension plan, and are receiving a six percent company matching contribution, except for B.H. March, R.L. Broiles and C.W. Erickson, who participate in the Exxon Mobil Corporation savings plan and tax-qualified and non-qualified pension plans.
Employee and company contributions can be allocated in any combination to a non-registered (tax-paid) account or a registered (tax-deferred) group retirement savings plan (Registered Retirement Savings Plan (RRSP)) account, subject in the latter case to contribution limits under the Income Tax Act.
Available investment options include cash savings, a money market mutual fund, a suite of four index-based equity or bond mutual funds and company shares. Company matching contributions must be allocated to company shares initially, and remain in that investment for a minimum of 24 months, after which they can be redeemed for other investment options. As of February 12, 2010, employees hold 10,666,783 shares through the company savings plan and the employees are allowed to vote these shares.
During employment, withdrawals are only permitted from employee contributions and investment earnings within the tax-paid account, to a maximum of three withdrawals per year. Assets in the RRSP account, and company contributions to the tax-paid account, may only be withdrawn upon retirement or termination of employment, reinforcing the company’s long-term approach to total compensation. Income Tax regulations require RRSP’s to be closed by the end of the year in which the individual reaches age 71.
36
Table of Contents
Named executive officer compensation
Compensation decision making process and considerations
Benchmarking
In addition to the assessment of business performance, individual performance and level of responsibility, the executive resources committee relies on market comparisons to a group of 24 major Canadian companies with revenues in excess of $1 billion a year. Canadian companies are selected on the basis of being large in scope and complexity, capital intensive and having proven sustainability.
The 24 companies benchmarked are as follows:
| Comparator companies – Named executive officers | ||||
| Agrium Inc. | Enbridge Inc. | Nova Chemicals Corporation | ||
| BCE Inc. | EnCana Corporation | Petro-Canada | ||
| BP Canada Energy Company | General Electric Canada | Procter & Gamble Inc. | ||
| Canadian Tire Corporation Limited | Husky Energy Inc. | Royal Bank of Canada | ||
| Chevron Canada Limited | IBM Canada Ltd. | Shell Canada Limited | ||
| Canadian Natural Resources Limited | Irving Oil Limited | Suncor Energy Inc. | ||
| ConocoPhillips Canada | Lafarge Canada Inc. | Talisman Energy Inc. | ||
| Canadian Pacific Railway Limited | Nexen Inc. | TransCanada Corporation | ||
The company is a national employer drawing from a wide range of disciplines. It is important to understand its competitive position relative to a variety of oil and non-oil employers. Annual market comparisons, based on survey data, are prepared by independent external compensation consultant, Towers Watson, with additional analysis and recommendation provided by the company’s internal compensation advisors. Consistent with the executive resources committee’s practice of using well-informed judgment rather than formulae to determine executive compensation, the committee does not target any specific percentile among comparator companies to align compensation. Rather, on a case-by-case basis, depending on the scope of market coverage represented by a particular comparison, total compensation (excluding perquisites) is targeted to a range between the mid-point and the upper quartile of comparable employers, reflecting the company’s emphasis on quality management. This approach applies to salaries and the annual bonus.
As a secondary source of data, the company also considers a comparison with Exxon Mobil Corporation, when it determines the annual bonus program. For the restricted stock unit program, the executive resources committee also reviews a summary of data for a subset of the comparator companies provided by the same external consultant above in order to assist in assessing total value of long-term compensation grants. This approach provides the company with the ability to better respond to changing business conditions, manage salaries based on a career orientation, minimize potential for automatic increasing of salaries, which could occur with an inflexible and narrow target among benchmarked companies, and finally to differentiate salaries based on performance and experience levels among executives.
The elements of the Exxon Mobil Corporation compensation program including salary and annual bonus and equity (long-term) compensation considerations for B.H. March, R.L. Broiles and C.W. Erickson, are similar to those of the company. The data used for long-term compensation determination for B.H. March is as described above, as he received Imperial Oil Limited restricted stock units in 2009. The executive resources committee reviews and approves recommendations for each named executive officer prior to implementation. B.H. March’s compensation determination is described in more detail starting on page 39.
37
Table of Contents
2009 Named executive officer compensation assessment
When determining the annual compensation for the named executive officers, the executive resources committee has reflected on the following business performance result indicators in its determination of 2009 salary and incentive compensation.
Business performance results for consideration
The operating and financial performance measurements listed below, best ever safety results and the company’s continued maintenance of sound business controls and a strong corporate governance environment formed the basis for the salary and incentive award decisions made by the executive resources committee in 2009. The executive resources committee considered the results over multiple years, in recognition of the long-term nature of the company’s business.
| • | Total shareholder return of approximately 0.2 percent. Ten-year annual average of approximately 16 percent. |
| • | Net income of approximately $1.6 billion, down by 59 percent. Five-year annual average income of $2.9 billion. |
| • | In addition to safety, strong results in the areas of health and environment. |
| • | Industry-leading return on average capital employed of approximately 17 percent, with an average of approximately 29 percent since the beginning of 2000. |
| • | $341 million distributed to shareholders as dividends in 2009. |
| • | Approximately $0.5 billion distributed to shareholders through the share purchase program in 2009 and approximately $15.5 billion since 1995. |
| • | Effective business controls and corporate governance. |
Performance assessment considerations
The above results form the context in which the committee assesses the individual performance of each senior executive, taking into account experience and level of responsibility.
Annually, the chairman, president and chief executive officer reviews the performance of the senior executives in achieving business results and individual development needs.
The same long-term key business strategies noted on page 29 and results noted above are key elements in the assessment of the chairman, president and chief executive officer’s performance by the executive resources committee.
The performance of all named executive officers is also assessed by the board of directors throughout the year during specific business reviews and board committee meetings that provide reports on strategy development; operating and financial results; safety, health, and environmental results; business controls; and other areas pertinent to the general performance of the company.
The executive resources committee does not use quantitative targets or formulae to assess executive performance or determine compensation. The executive resources committee does not assign weights to the factors considered. Formula-based performance assessments and compensation typically require emphasis on two or three business metrics. For the company to be an industry leader and effectively manage the technical complexity and integrated scope of its operations, most senior executives must advance multiple strategies and objectives in parallel, versus emphasizing one or two at the expense of others that require equal attention.
Senior executives and officers are expected to perform at the highest level or they are replaced. If it is determined that another executive is ready and would make a stronger contribution than one of the current incumbents, a replacement plan is implemented.
38
Table of Contents
2009 Chief executive officer compensation assessment
B.H. March was appointed chairman, president and chief executive officer of the company on April 1, 2008. Mr. March is a 30-year veteran of ExxonMobil, including service with heritage Mobil Corporation before the merger with Exxon Corporation on November 30, 1999. Mr. March has extensive operating and management experience in the oil and gas business, including assignments in multiple locations in the United States, as well as experience working in London and Brussels. His level of salary was determined by the executive resources committee based on his individual performance and to align with that of his peers in ExxonMobil. It was also the objective of the executive resources committee to ensure appropriate internal alignment with senior management in the company. The committee also approved a salary increase of $25,000 U.S. to $510,000 U.S., effective January 1, 2010.
Mr. March’s 2009 annual bonus was based on his performance as assessed by the executive resources committee since his appointment to the position of chairman, president and chief executive officer. His long-term incentive award was paid in the form of company restricted stock units, not Exxon Mobil Corporation restricted stock, to reinforce alignment of his interests with that of the company’s shareholders. His company restricted stock units are subject to vesting periods longer than those applied by most companies conducting business in Canada. Fifty percent of the restricted stock units awarded vest in five years and the other 50 percent vest on the later of 10 years from the date of grant or the date of retirement. The purpose of these long vesting periods is to reinforce the long investment lead times in the business and to link a substantial portion of Mr. March’s net worth to the performance of the company. During these vesting periods, the awards are subject to risk of forfeiture based on detrimental activity, or if Mr. March should leave the company before normal retirement.
The executive resources committee has determined that the overall compensation of Mr. March is appropriate based on the company’s financial and operating performance and their assessment of his effectiveness in leading the organization. Key factors considered by the committee in determining his overall compensation level include continuing progress on advancing key strategic interests, financial results, safety metrics, environmental performance, government relations, productivity, cost effectiveness and asset management. Taking all factors into consideration, the committee’s decisions on compensation of the chief executive officer, reflect judgment, rather than the application of formulae or targets. The higher level of pay for Mr. March, compared to the other named executive officers, reflects his greater level of responsibility, including his ultimate responsibility for the performance of the company, and oversight of the other senior executives.
Pay awarded to other named executive officers
Within the context of the compensation program structure and performance assessment processes described above, the value of 2009 incentive awards and salary adjustments align with:
| • | performance of the company; |
| • | individual performance; |
| • | long-term strategic plan of the business; and |
| • | annual compensation of comparator companies. |
Taking all factors into consideration, the executive resources committee’s decisions on pay awarded to other named executive officers, reflect judgment, rather than the application of formulae or targets. The executive resources committee approved the individual elements of compensation and the total compensation as shown in the summary compensation table on page 41.
Independent consultant
In fulfilling its responsibilities during 2009, the executive resources committee did not retain an independent consultant or advisor in determining compensation for any of the company’s directors or officers or any other senior executives. The company’s management retained Towers Watson, an independent consultant, to provide an assessment of competitive compensation and market data for all salaried levels of employees of the company. Towers Watson was not retained to provide any other compensation determinations or advice for the company or committee in determining the compensation of the chief executive officer or long-term incentive compensation levels for senior executives.
39
Table of Contents
Performance graph
The following graph shows changes over the past 10 years in the value of $100 invested in (1) Imperial Oil Limited common shares, (2) the S&P/TSX Composite Index, and (3) the S&P/TSX Equity Energy Index. The S&P/TSX Equity Energy Index is made up of share performance data for 31 oil and gas companies including integrated oil companies, oil and gas producers and oil and gas service companies.
The year-end values in the graph represent appreciation in share price and the value of dividends paid and reinvested. The calculations exclude trading commissions and taxes. Total shareholder returns from each investment, whether measured in dollars or percent, can be calculated from the year-end investment values shown beneath the graph.
During the past 10 years, the company’s cumulative total shareholder return was approximately 450 percent, for an average annual return of approximately 16 percent. During that same 10-year period, the company’s compensation (which compensation excludes the compensatory change in pension value) of its named executive officers increased by approximately 129 percent for an average annual increase of approximately three percent.
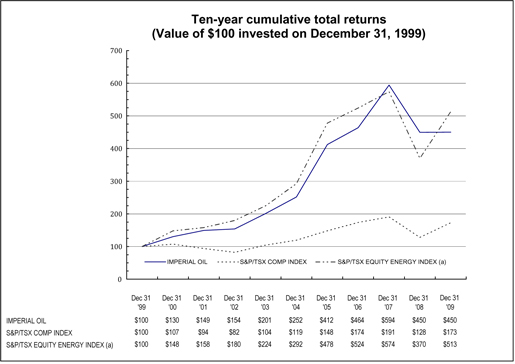
| a) | Prior to December 2005, the S&P/TSX Energy Index and the S&P/TSX Composite Energy Index were used for comparison purposes. |
40
Table of Contents
Summary compensation table and other tables for named executive officers
The following table shows the compensation for the chairman, president and chief executive officer; the senior vice-president, finance and administration, and treasurer and the three other most highly compensated executive officers of the company who were serving as at the end of 2009. This information includes the Canadian dollar value of base salaries, cash bonus awards and units of other long-term incentive compensation and certain other compensation.
|
Name and principal position at the end of 2009 |
Year |
Salary ($) |
Share- ($) (b) |
Option- ($) (c) |
Non-equity incentive plan ($) |
Pension ($) (f) |
All
other ($) (g) |
Total ($) (h) | |||||||||||||||||||||||||
|
Annual (d)
|
Long-term (e)
|
||||||||||||||||||||||||||||||||
|
B.H. March (a) Chairman, president and chief executive officer
|
2009
|
553,870
|
1,706,020
|
–
|
183,862
|
0
|
649,756
|
|
881,422
|
3,974,930
| |||||||||||||||||||||||
|
2008
|
479,700
|
1,584,780
|
–
|
286,114
|
207,870
|
611,774
|
|
821,511
|
3,991,749
| ||||||||||||||||||||||||
|
P.A. Smith Senior vice- president, finance and administration, and treasurer
|
2009
|
431,250
|
756,480
|
–
|
106,513
|
0
|
(433,300
|
)
|
131,259
|
992,202
| |||||||||||||||||||||||
|
2008
|
420,833
|
702,720
|
–
|
177,128
|
181,125
|
(13,100
|
)
|
135,187
|
1,603,893
| ||||||||||||||||||||||||
|
R.L. Broiles (a) Senior Vice-president, resources division
|
2009
|
462,510
|
954,335
|
–
|
119,910
|
0
|
496,030
|
|
1,073,903
|
3,106,688
| |||||||||||||||||||||||
|
2008
|
398,418
|
915,918
|
–
|
186,443
|
169,494
|
254,286
|
|
506,051
|
2,430,610
| ||||||||||||||||||||||||
|
C.W. Erickson (a) Vice-president and general manager, refining and supply
|
2009
|
452,232
|
954,335
|
–
|
119,910
|
0
|
401,449
|
|
813,627
|
2,741,553
| |||||||||||||||||||||||
|
2008
|
394,864
|
999,183
|
–
|
196,144
|
187,147
|
234,192
|
|
413,604
|
2,425,134
| ||||||||||||||||||||||||
|
S.M. Smith Vice-president and general manager, fuels marketing
|
2009
|
397,750
|
1,158,360
|
–
|
129,555
|
0
|
(442,100
|
)
|
167,790
|
1,411,355
| |||||||||||||||||||||||
|
2008
|
374,000
|
1,006,500
|
–
|
197,899
|
162,675
|
350,200
|
|
117,394
|
2,208,668
| ||||||||||||||||||||||||
41
Table of Contents
Footnotes to the Summary compensation table for named executive officers on the preceding page
| a) | B.H. March, R.L. Broiles and C.W. Erickson have been on a loan assignment from Exxon Mobil Corporation since January 1, 2008, July 1, 2005 and June 1, 2007 respectively. Their compensation is paid directly by Exxon Mobil Corporation in U.S. dollars, but is disclosed in Canadian dollars. They also receive employee benefits under Exxon Mobil Corporation’s employee benefit plans, and not under the company’s employee benefit plans. The company reimburses Exxon Mobil Corporation for the compensation paid and employee benefits provided to them. All amounts paid to B.H. March, R.L. Broiles and C.W. Erickson in U.S. dollars were converted to Canadian dollars at the average 2009 exchange rate of 1.142. In 2008, the average exchange rate was 1.066. |
| b) | The grant date fair value equals the number of restricted stock units multiplied by the closing price of the company’s shares on the date of grant. The closing price of the company’s shares on the grant date in 2009 was $39.40, which is the same as the accounting fair value for the restricted stock units on the date of grant. The closing price of the company’s shares on the grant date in 2008 was $36.60, which is the same as the accounting fair value for the restricted stock units on the date of grant. The company chose this method of valuation as it believes it results in the most accurate representation of fair value. In 2009, R.L. Broiles and C.W. Erickson, received Exxon Mobil Corporation restricted stock units. These values are based on the closing price of Exxon Mobil Corporation shares on the date of grant ($75.97 U.S.), multiplied by the number of units granted. This amount was converted to Canadian dollars at the average 2009 exchange rate of 1.142. In 2008, the average exchange rate was 1.066 and the closing price of Exxon Mobil Corporation shares on the date of grant was $78.11 U.S. |
| c) | The company has not granted stock options since 2002. The stock option plan is described starting on page 44. |
| d) | The amounts listed in “Annual incentive plans” column for each named executive officer represent their 2009 cash bonus. Any part of bonus elected to be received as deferred share units would be excluded, although no named executive officers so elected. |
| e) | The amounts listed in the “Long-term incentive plans” column represent earnings bonus units payout. These are paid when the maximum settlement value (trigger) or cumulative earnings per share is achieved or after three years if such value is not achieved. The plan is described starting on page 32. B.H. March, R.L. Broiles and C.W. Erickson received earnings bonus units under Exxon Mobil Corporation’s program, which is similar to the company’s plan. Their payouts are also subject to the maximum settlement value (trigger) or cumulative earnings per share. There was no earnings bonus unit payout in 2009 for any named executive officer. |
| f) | “Pension value” is the “Compensatory change” in pensions as of December 31, 2009 as set out in the “Pension plan benefits” table on page 35. |
| g) | Amounts under “All other compensation”, include dividend equivalent payments on restricted stock units granted, company savings plans contributions, other compensation and cost of perquisites including club memberships, financial counselling allowance (for P.A. Smith and S.M. Smith only), any costs associated with the personal use of the company aircraft, parking and security. There was no personal use of the company aircraft in 2009. The financial counselling allowance in 2009 was $25,000 for P.A. Smith and $20,000 for S.M. Smith. For each named executive officer, the aggregate value of perquisites received was not greater than $50,000 or 10 percent of the named executive officer’s base salary. While already factored into valuation of share-based awards, it is noted that in 2009, the actual dividend equivalent payments made were $73,580 for P.A. Smith, $62,925 for S.M. Smith and $12,990 for B.H. March. The dividend equivalent payments on restricted stock granted by Exxon Mobil Corporation in previous years were $84,833 for B.H. March, $102,369 for R.L. Broiles and $101,374 for C.W. Erickson. These amounts were converted to Canadian dollars at the average 2009 exchange rate of 1.142. In 2008, the average exchange rate was 1.066. The total under the “All other compensation’ column for B.H. March, R.L. Broiles and C.W. Erickson consists mainly of expatriate allowances and tax reimbursement costs associated with their assignment in Canada. The latter were higher in 2009 as a result of differences in timing of the amounts paid resulting from the adoption in 2009 of a revised method of tax equalization. |
| h) | “Total compensation” for 2009 consists of the total dollar value of “Salary”, “Share-based awards”, “Option-based awards”, “Non-equity incentive plan compensation”, “Pension value” and “All other compensation”. |
42
Table of Contents
Outstanding share-based awards and option-based awards for named executive officers
The following table sets forth all share-based and option-based awards outstanding as at December 31, 2009 for each of the named executive officers of the company.
| Option-based awards | Share-based awards | |||||||||||||||||||||||
|
Name |
Number
of (#) (d) |
Option ($) |
Option |
Value of the-money ($) |
Number of (#) (e)
|
Market
or ($) (e)
|
||||||||||||||||||
| B.H. March (a) |
– | – | – | – | 86,600 | 3,521,156 | ||||||||||||||||||
| P.A. Smith |
75,000 | 15.50 | April 29, 2012 | 1,887,000 | 164,750 | 6,698,735 | ||||||||||||||||||
| R.L. Broiles (b) |
– | – | – | – | – | – | ||||||||||||||||||
| C.W. Erickson (c) |
– | – | – | – | – | – | ||||||||||||||||||
| S.M. Smith |
0 | – | – | 0 | 159,250 | 6,475,105 | ||||||||||||||||||
| a) | In 2001 and previous years, B.H. March participated in Exxon Mobil Corporation’s stock option plan. Under that plan, at December 31, 2009, B.H. March held options to acquire 18,549 Exxon Mobil Corporation shares, of which all options were exercisable. The value of B.H. March’s exercisable options was $542,578 as at December 31, 2009, based on the closing price of Exxon Mobil Corporation common shares of $68.19 U.S., which was converted to Canadian dollars at the noon-rate for December 31, 2009 of 1.0466 provided by the Bank of Canada. B.H. March was granted restricted stock units in 2008 and 2009 under the company’s plan. With respect to previous years, B.H. March participated in Exxon Mobil Corporation’s restricted stock plan, which is similar to the company’s restricted stock unit plan. Under that plan, B.H. March held 35,550 restricted shares whose value on December 31, 2009 was $2,537,120 based on a closing price for Exxon Mobil Corporation shares on December 31, 2009 of $68.19 U.S., which was converted to Canadian dollars at the noon-rate for December 31, 2009 of 1.0466 provided by the Bank of Canada. |
| b) | In 2001 and previous years, R.L. Broiles participated in Exxon Mobil Corporation’s stock option plan. Under that plan, at December 31, 2009, R.L. Broiles held options to acquire 56,398 Exxon Mobil Corporation shares, of which all options were exercisable. The value of R.L. Broiles’ exercisable options was $1,610,172 as at December 31, 2009, based on the closing price of Exxon Mobil Corporation common shares of $68.19 U.S., which was converted to Canadian dollars at the noon-rate for December 31, 2009 of 1.0466 provided by the Bank of Canada. R.L. Broiles participates in Exxon Mobil Corporation’s restricted stock plan, which is similar to the company’s restricted stock unit plan. Under that plan, R.L. Broiles held 54,500 restricted shares whose value on December 31, 2009 was $3,889,537 based on a closing price for Exxon Mobil Corporation shares on December 31, 2009 of $68.19 U.S., which was converted to Canadian dollars at the noon-rate for December 31, 2009 of 1.0466 provided by the Bank of Canada. |
| c) | In 2001 and previous years, C.W. Erickson participated in Exxon Mobil Corporation’s stock option plan. Under that plan, at December 31, 2009, C.W. Erickson held options to acquire 8,810 Exxon Mobil Corporation shares, of which all options were exercisable. The value of C.W. Erickson’s exercisable options was $240,711 as at December 31, 2009, based on the closing price of Exxon Mobil Corporation common shares of $68.19 U.S., which was converted to Canadian dollars at the noon-rate for December 31, 2009 of 1.0466 provided by the Bank of Canada. C.W. Erickson participates in Exxon Mobil Corporation’s restricted stock plan, which is similar to the company’s restricted stock unit plan. Under that plan, C.W. Erickson holds 55,275 restricted shares whose value on December 31, 2009 was $3,944,847 based on a closing price for Exxon Mobil Corporation shares on December 31, 2009 of $68.19 U.S., which was converted to Canadian dollars at the noon-rate for December 31, 2009 of 1.0466 provided by the Bank of Canada. |
| d) | Represents the number of shares underlying options and three times the number of stock options granted in 2002 before the three-for-one share split in May 2006 and still held by the employee. |
| e) | Represents the total of the restricted stock units received in 2006, 2007, 2008 and 2009 after the three-for-one share split in May 2006, plus three times the number of restricted stock units received before the share split and still held by the employee. The value is based on the closing price of the company’s shares on December 31, 2009 of $40.66. |
43
Table of Contents
Incentive plan awards for named executive officers – Value vested or earned during the year
The following table sets forth the value of the incentive plan awards that vested for each named executive officer of the company for the year.
|
Name |
Option-based awards – Value vested during the year ($) |
Share-based awards – Value ($) (d) |
Non-equity incentive plan earned during the year ($) (e)
|
|||||||||
| B.H. March (a) |
– | 0 | – | |||||||||
| P.A. Smith |
– | 1,454,178 | 106,513 | |||||||||
| R.L. Broiles (b) |
– | – | – | |||||||||
| C.W. Erickson (c) |
– | – | – | |||||||||
| S.M. Smith |
– | 1,163,743 | 129,555 |
| a) | Although B.H. March received restricted stock units under the company’s plan in 2008 and 2009, none of these restricted stock units have vested. In previous years B.H. March participated in Exxon Mobil Corporation’s restricted stock plan under which the grantee may receive restricted stock or restricted stock units (both of which are referred to herein as restricted stock or restricted shares), which plan is similar to the company’s restricted stock unit plan. In 2009, restrictions were removed on 9,200 restricted stock having a value as at December 31, 2009 of $656,582 based on the closing price of Exxon Mobil Corporation common shares of $68.19 U.S., which was converted to Canadian dollars at the noon-rate for December 31, 2009 of 1.0466 provided by the Bank of Canada. B.H. March received an annual bonus from Exxon Mobil Corporation in 2009 and participates in Exxon Mobil Corporation’s earnings bonus unit plan, which is similar to the company’s earnings bonus unit plan. B.H. March received $183,862 with respect to annual bonus awarded in 2009 which amount was paid in U.S. dollars and is converted to Canadian dollars at the average 2009 exchange rate of 1.142. |
| b) | R.L. Broiles participates in Exxon Mobil Corporation’s restricted stock plan under which the grantee may receive restricted stock, which plan is similar to the company’s restricted stock unit plan. In 2009, restrictions were removed on 10,500 restricted stock having a value as at December 31, 2009 of $749,360 based on the closing price of Exxon Mobil Corporation common shares of $68.19 U.S., which was converted to Canadian dollars at the noon-rate for December 31, 2009 of 1.0466 provided by the Bank of Canada. R.L. Broiles received an annual bonus from Exxon Mobil Corporation in 2009 and participates in Exxon Mobil Corporation’s earnings bonus unit plan, which is similar to the company’s earnings bonus unit plan. R.L. Broiles received $119,910 with respect to annual bonus awarded in 2009, which amount was paid in U.S. dollars and is converted to Canadian dollars at the average 2009 exchange rate of 1.142. |
| c) | C.W. Erickson participates in Exxon Mobil Corporation’s restricted stock plan under which the grantee may receive restricted stock, which plan is similar to the company’s restricted stock unit plan. In 2009, restrictions were removed on 9,200 restricted stock having a value as at December 31, 2009 of $656,582 based on the closing price of Exxon Mobil Corporation common shares of $68.19 U.S., which was converted to Canadian dollars at the noon-rate for December 31, 2009 of 1.0466 provided by the Bank of Canada. C.W. Erickson received an annual bonus from Exxon Mobil Corporation in 2009 and participates in Exxon Mobil Corporation’s earnings bonus unit plan, which is similar to the company’s earnings bonus unit plan. C.W. Erickson received $119,910 with respect to annual bonus awarded in 2009, which amount was paid in U.S. dollars and is converted to Canadian dollars at the average 2009 exchange rate of 1.142. |
| d) | These values show restricted stock units that vested in 2009. |
| e) | These values show annual bonus received in 2009. |
Details of former long-term incentive compensation plans
The following describes forms of long-term incentive compensation formerly used by the company. While incentive share units and stock options are no longer granted, incentive share units and stock options formerly granted continue to remain outstanding and are referenced in the foregoing tables.
Incentive share units
The company’s incentive share units give the recipient a right to receive cash equal to the amount by which the market price of the company’s common shares at the time of exercise exceeds the issue price of the units. These units were granted prior to 2002. The issue price of the units granted to executives was the closing price of the company’s shares on the Toronto Stock Exchange on the grant date. Incentive share units are eligible for exercise up to 10 years from issuance. The last grant expires in 2011.
Stock option plan
Under the stock option plan adopted by the company in April 2002, a total of 9,630,600 options, on a post share split basis, were granted to select key employees on April 30, 2002 for the purchase of the company’s common shares at an exercise price of $15.50 per share on a post share split basis. All of the options are exercisable. Any unexercised options expire on April 29, 2012. As of February 12, 2010, there have been 5,393,340 common shares issued upon exercise of stock options and 4,237,260 common shares are issuable upon future exercise of stock options. The common shares that were issued and those that may be issued in the future represent about 1.1 percent of the company’s currently outstanding common shares. The company’s directors, officers and vice-presidents as a group hold 4.6 percent of the unexercised stock options.
44
Table of Contents
The maximum number of common shares that any one person may receive from the exercise of stock options is 150,000 common shares, which is about 0.02 percent of the currently outstanding common shares. Stock options may be exercised only during employment with the company except in the event of death, disability or retirement. Also, stock options may be forfeited if the company believes that the employee intends to terminate employment or if during employment or during the period of 24 months after the termination of employment the employee, without the consent of the company, engaged in any business that was in competition with the company or otherwise engaged in any activity that was detrimental to the company. The company may determine that stock options will not be forfeited after the cessation of employment. Stock options cannot be assigned except in the case of death.
The company may amend or terminate the incentive stock option plan as it, in its sole discretion, determines appropriate. No such amendment or termination can be made to impair any rights of stock option holders under the incentive stock option plan unless the stock option holder consents, except in the event of (a) any adjustments to the share capital of the company or (b) a take-over bid, amalgamation, combination, merger or other reorganization, sale or lease of assets, or any liquidation, dissolution, or winding-up, involving the company. Appropriate adjustments may be made by the company to: (i) the number of common shares that may be acquired on the exercise of outstanding stock options; (ii) the exercise price of outstanding stock options; or (iii) the class of shares that may be acquired in place of common shares on the exercise of outstanding stock options in order to preserve proportionately the rights of the stock option holders and give proper effect to the event.
Directors’ compensation program
Philosophy and objectives
Director compensation elements are designed to:
| • | ensure alignment with long-term shareholder interests; |
| • | provide motivation to promote sustained improvement in the company’s business performance and shareholder value; |
| • | ensure the company can attract and retain outstanding director candidates who meet the selection criteria outlined in Section 9 of the Board of Directors Charter; |
| • | recognize the substantial time commitments necessary to oversee the affairs of the company; and |
| • | support the independence of thought and action expected of directors. |
Nonemployee director compensation levels are reviewed by the nominations and corporate governance committee each year, and resulting recommendations are presented to the full board for approval.
Employees of the company or Exxon Mobil Corporation receive no extra pay for serving as directors. Nonemployee directors receive compensation consisting of cash and restricted stock units. Since 1999, the nonemployee directors have been able to receive all or part of their cash directors’ fees in the form of deferred share units. The purpose of the deferred share unit plan for nonemployee directors is to provide them with additional motivation to promote sustained improvement in the company’s business performance and shareholder value by allowing them to have all or part of their directors’ fees tied to the future growth in value of the company’s common shares. The deferred share unit plan is described in more detail on page 46.
45
Table of Contents
Compensation decision making process and considerations
The nominations and corporate governance committee relies on market comparisons with a group of 21 major Canadian companies with national and international scope and complexity. The company draws its nonemployee directors from a wide variety of industrial sectors, so a broad sample is appropriate for this purpose. The nominations and corporate governance committee does not target any specific percentile among comparator companies at which to align compensation for this group, but rather considers current developments and practices in director compensation elements based on analysis of published management proxy circulars completed every two years. The 21 comparator companies included in the benchmark sample are as follows:
| Comparator companies – Nonemployee directors | ||||
| Bank of Montreal | Canadian Pacific Railway Limited | Royal Bank of Canada | ||
| Bank of Nova Scotia | EnCana Corporation | Sun Life Financial Inc. | ||
| BCE Inc. | George Weston Limited | Suncor Energy Inc. | ||
| Bombardier Inc. | Manulife Financial Corporation | TELUS Corporation | ||
| Canadian Imperial Bank of Commerce | Petro-Canada | Thomson Reuters Corporation | ||
| Canadian National Railway Company | Potash Corporation | The Toronto-Dominion Bank | ||
| Canadian Natural Resources Limited | Power Financial Corporation | TransCanada Corporation | ||
Directors’ compensation details and components
In 2009, the base cash retainer for nonemployee directors was $100,000 per year. Nonemployee directors were paid $20,000 for membership on all board committees. Additionally, each board committee chair received a retainer of $10,000 for each committee chaired. Nonemployee directors were not paid a fee for attending board and committee meetings on each of the eight regularly-scheduled meeting days. However, they were eligible to receive a fee of $2,000 per board or committee meeting occurring on any other day. Two board meetings occurred outside of the eight regularly-scheduled meeting days.
The following table shows the portion of the annual retainer for board membership, annual retainer for committee membership and annual retainer for committee chair which each nonemployee director elected to receive in cash and deferred share units in 2009.
| percent | Election for 2009 director fees in cash |
Election for 2009 director fees in deferred share units | ||
| K.T. Hoeg |
0 | 100 | ||
| J.M. Mintz |
0 | 100 | ||
| R. Phillips |
0 | 100 | ||
| S.D. Whittaker |
0 | 100 | ||
| V.L. Young |
75 | 25 | ||
The number of deferred share units granted to a nonemployee director is determined at the end of each calendar quarter for that year by dividing (i) the dollar amount of the nonemployee director’s fees for that calendar quarter that the director elected to receive as deferred share units by (ii) the average of the closing price of the company’s shares on the Toronto Stock Exchange for the five consecutive trading days (“average closing price”) immediately prior to the last day of that calendar quarter. Those deferred share units are granted effective the last day of that calendar quarter.
A nonemployee director is granted additional deferred share units in respect of the unexercised deferred share units on the dividend payment dates for the common shares of the company. The number of such additional deferred share units is determined for each cash dividend payment date by (i) dividing the cash dividend payable for a common share of the company by the average closing price immediately prior to the payment date for that dividend and then (ii) multiplying that resultant number by the number of unexercised deferred share units held by the nonemployee directors on the record date for the determination of shareholders entitled to receive payment of such cash dividend.
A nonemployee director may only exercise these deferred share units after termination of service as a director of the company, including termination of service due to death. No deferred share units, granted to a nonemployee director, may be exercised unless all of the deferred share units are exercised on the same date.
46
Table of Contents
In addition to the cash fees described above, the company pays a significant portion of director compensation in restricted stock units to align director compensation with the long-term interests of shareholders. Restricted stock units are awarded annually with 50 percent vesting in cash three years from the date of grant and the remaining 50 percent vesting on the seventh anniversary of the grant date. Directors can elect to receive one common share for each unit or a cash payment for the units to be exercised on the seventh anniversary of the date of grant of the restricted stock units. The vesting periods are not accelerated upon separation or retirement from the board, except in the event of death. The restricted stock unit plan is described in more detail starting on page 32. In 2009, each nonemployee director received an annual grant of 2,000 restricted stock units.
In contrast to the forfeiture provisions for restricted stock units held by employees of the company, the restricted stock units awarded to nonemployee directors are not subject to risk of forfeiture at the time a director leaves the company’s board. This provision is designed to reinforce the independence of these board members. However, while on the board and for a 24-month period after leaving the company’s board, restricted stock units may be forfeited if the nonemployee director engages in direct competition with the company or otherwise engages in any activity detrimental to the company. The board agreed that the word “detrimental” shall not include any actions taken by a nonemployee director or former nonemployee director who acted in good faith and in the best interest of the company.
Components of directors’ compensation
|
Director |
Annual retainer for ($) |
Annual retainer for ($) |
Annual retainer for ($) |
Restricted (RSU) (#) |
Fee for board
and committee |
Total ($) (a) |
Total (DSU) ($) (b)
|
Total ($) (c) |
All
other ($) (d) |
Total ($) |
||||||||||||||||||||||||||||||||||||
|
Number
of (#) |
Fee ($2,000 x ($) |
|||||||||||||||||||||||||||||||||||||||||||||
|
K.T. Hoeg
|
100,000 | 20,000 | 10,000 (IOF) |
2,000 | 2 | 4,000 | 4,000 | 130,000 | 78,800 | 1,816 | 214,616 | |||||||||||||||||||||||||||||||||||
|
J.M. Mintz
|
100,000 | 20,000 | 10,000 (EH&S) |
2,000 | 2 | 4,000 | 4,000 | 130,000 | 78,800 | 5,731 | 218,531 | |||||||||||||||||||||||||||||||||||
|
R. Phillips
|
100,000 | 20,000 | 10,000 (ERC) |
2,000 | 2 | 4,000 | 4,000 | 130,000 | 78,800 | 12,560 | 225,360 | |||||||||||||||||||||||||||||||||||
|
S.D. Whittaker
|
100,000 | 20,000 | 10,000 (N&CG) |
2,000 | 2 | 4,000 | 4,000 | 130,000 | 78,800 | 18,857 | 231,657 | |||||||||||||||||||||||||||||||||||
|
V.L. Young
|
100,000 | 20,000 | 10,000 (AC) |
2,000 | 2 | 4,000 | 101,500 | 32,500 | 78,800 | 7,536 | 220,336 | |||||||||||||||||||||||||||||||||||
| a) | “Total cash” is the portion of the “Annual retainer for board membership”, “Annual retainer for committee membership” and “Annual retainer for committee chair” which the director elected to receive as cash, plus the “Fee for board and committee meetings not regularly scheduled”. This amount is reported as “Fees earned” in the Director compensation table on page 48. |
| b) | “Total deferred share units” is the portion of the “Annual retainer for board membership”, “Annual retainer for committee membership”, and “Annual retainer for committee chair”, which the director elected to receive as deferred share units, as set out in the previous table on page 46. This amount plus the “Total restricted stock units” amount is shown as “Share-based awards” in the Director compensation table on page 48. |
| c) | The values of the restricted stock units shown are the number of units multiplied by the closing price of the company’s shares on the date of grant, which was $39.40. |
| d) | Amounts under “All other compensation” consist of dividend equivalent payments on unexercised restricted stock units, the value of additional deferred share units granted in lieu of dividends on unexercised deferred share units and security provided for directors. In 2009, K.T. Hoeg received $600 in dividend equivalent payments on restricted stock units and additional deferred share units valued at $1,216 in lieu of dividends on deferred share units. J.M. Mintz received $3,350 in dividend equivalent payments on restricted stock units and additional deferred share units valued at $1,670 in lieu of dividends on deferred share units. R. Phillips received $5,000 in dividend equivalent payments on restricted stock units and additional deferred share units valued at $7,560 in lieu of dividends on deferred share units. S.D. Whittaker received $5,000 in dividend equivalent payments on restricted stock units and additional deferred share units valued at $13,857 in lieu of dividends on deferred share units. V.L. Young received $5,000 in dividend equivalent payments on restricted stock units and additional deferred share units valued at $2,536 in lieu of dividends on deferred share units. |
47
Table of Contents
Director compensation table
The following table summarizes the compensation paid, payable, awarded or granted for 2009 to each of the nonemployee directors of the company.
|
Name (a) |
Fees |
Share- ($) (d)
|
Option-
|
Non-equity ($) |
Pension (#) |
All
other ($) (e) |
Total ($) |
|||||||||||||||||||||
| K.T. Hoeg (b) |
4,000 | 208,800 | – | – | – | 1,816 | 214,616 | |||||||||||||||||||||
| J.M. Mintz (b) |
4,000 | 208,800 | – | – | – | 5,731 | 218,531 | |||||||||||||||||||||
| R. Phillips (b) |
4,000 | 208,800 | – | – | – | 12,560 | 225,360 | |||||||||||||||||||||
| S.D. Whittaker (b) |
4,000 | 208,800 | – | – | – | 18,857 | 231,657 | |||||||||||||||||||||
| V.L. Young (b) |
101,500 | 111,300 | – | – | – | 7,536 | 220,336 |
| a) | As directors employed by the company or Exxon Mobil Corporation, B.H. March, P.A. Smith and R.C. Olsen did not receive compensation for acting as directors. |
| b) | Starting in 1999, the nonemployee directors have been able to receive all or part of their directors’ fees in the form of deferred share units. |
| c) | Represents all fees awarded, earned, paid or payable in cash for services as a director, including retainer fees, committee, chair and meeting fees. |
| d) | The values of the restricted stock units shown are the number of units multiplied by the closing price of the company’s shares on the date of grant. The dollar value of deferred share units shown is the value of the portion of the “Annual retainer for board membership”, “Annual retainer for committee membership” and “Annual retainer for committee chair” which the director elected to receive as deferred share units as noted on page 46. |
| e) | Amounts under “All other compensation” consist of dividend equivalent payments on unexercised restricted stock units, the value of additional deferred share units granted in lieu of dividends on unexercised deferred share units and security provided for directors. In 2009, K.T. Hoeg received $600 in dividend equivalent payments on restricted stock units and additional deferred share units valued at $1,216 in lieu of dividends on deferred share units. J.M. Mintz received $3,350 in dividend equivalent payments on restricted stock units and additional deferred share units valued at $1,670 in lieu of dividends on deferred share units. R. Phillips received $5,000 in dividend equivalent payments on restricted stock units and additional deferred share units valued at $7,560 in lieu of dividends on deferred share units. S.D. Whittaker received $5,000 in dividend equivalent payments on restricted stock units and additional deferred share units valued at $13,857 in lieu of dividends on deferred share units. V.L. Young received $5,000 in dividend equivalent payments on restricted stock units and additional deferred share units valued at $2,536 in lieu of dividends on deferred share units. |
48
Table of Contents
Outstanding share-based awards and option-based awards for directors
The following table sets forth all outstanding awards held by nonemployee directors of the company as at December 31, 2009 and does not include common shares owned by the director.
| Option-based awards | Share-based awards | |||||||||||||||||||||||
|
Name (a) |
Number
of (#) |
Option ($) |
Option |
Value
of ($) |
Number
of (#) (b) |
Market or ($) (c)
|
||||||||||||||||||
| K.T. Hoeg |
– | – | – | – | 9,005 | 366,143 | ||||||||||||||||||
| J.M. Mintz |
– | – | – | – | 15,147 | 615,877 | ||||||||||||||||||
| R. Phillips |
– | – | – | – | 32,958 | 1,340,072 | ||||||||||||||||||
| S.D. Whittaker |
– | – | – | – | 48,795 | 1,984,005 | ||||||||||||||||||
| V.L. Young |
– | – | – | – | 18,864 | 767,010 | ||||||||||||||||||
| a) | As directors employed by the company or Exxon Mobil Corporation, B.H. March, P.A. Smith and R.C. Olsen did not receive compensation for acting as directors. |
| b) | Includes restricted stock units and deferred share units held as of December 31, 2009. |
| c) | Value is based on the closing price of the company’s shares on December 31, 2009, which was $40.66. |
Incentive plan awards for directors – Value vested or earned during the year
The following table sets forth the value of the awards that vested or were earned by each nonemployee director of the company in 2009.
|
Name (a) |
Option-based awards – Value vested during the ($) |
Share-based awards
– ($) |
Non-equity incentive plan ($)
|
|||||||||
| K.T. Hoeg |
– | 0 | – | |||||||||
| J.M. Mintz (b) |
– | 60,090 | – | |||||||||
| R. Phillips (c) |
– | 105,158 | – | |||||||||
| S.D. Whittaker (c) |
– | 105,158 | – | |||||||||
| V.L. Young (c) |
– | 105,158 | – |
| a) | As directors employed by the company or Exxon Mobil Corporation, B.H. March, P.A. Smith and R.C. Olsen did not receive compensation for acting as directors. |
| b) | Includes restricted stock units granted in 2006 and vesting in 2009. |
| c) | Includes restricted stock units granted in 2002 and vesting in 2009 and restricted stock units granted in 2006 and vesting in 2009. |
49
Table of Contents
Share ownership guidelines for directors
Directors are required to hold the equivalent of at least 15,000 shares of Imperial Oil Limited, including common shares, deferred share units and restricted stock units. Directors are expected to reach this level within five years from the date of appointment to the board. The board of directors believes that the share ownership guideline will result in an alignment of the interest of board members with the interests of all other shareholders.
|
Director |
Director |
Amount (February 14,
|
Total holdings |
Total at-risk total (b) |
Minimum requirement |
Minimum |
||||||||||||||||||
| K.T. Hoeg |
May 1, 2008 |
5,074 | 9,005 | 355,157 | 15,000 | May 1, 2013 | ||||||||||||||||||
| B.H. March (a) |
January 1, 2008 |
43,300 | 91,600 | 3,612,704 | 15,000 | Minimum requirement met |
||||||||||||||||||
| J.M. Mintz |
April 21, 2005 |
3,584 | 16,147 | 636,838 | 15,000 | Minimum requirement met |
||||||||||||||||||
| R.C. Olsen |
May 1, 2008 |
3,000 | 6,000 | 236,640 | 15,000 | May 1, 2013 | ||||||||||||||||||
| R. Phillips |
April 23, 2002 |
2,597 | 41,958 | 1,654,824 | 15,000 | Minimum requirement met |
||||||||||||||||||
| P.A. Smith |
February 1, 2002 |
2,577 | 197,486 | 7,788,848 | 15,000 | Minimum requirement met |
||||||||||||||||||
| S.D. Whittaker |
April 19, 1996 |
2,744 | 57,795 | 2,279,435 | 15,000 | Minimum requirement met |
||||||||||||||||||
| V.L. Young |
April 23, 2002 |
1,696 | 31,614 | 1,246,856 | 15,000 | Minimum requirement met |
| a) | Paragraph 10(b) of the board of directors also provides that B.H. March, as chairman, president and chief executive officer shall, within three years of his appointment as chairman and chief executive officer, acquire shares of the company, including common shares, deferred share units and restricted stock units, of a value of no less than five times his base salary. B.H. March has achieved this requirement. |
| b) | The amount shown in the column “Total at-risk value of total holdings” is equal to the “Total holdings” multiplied by the closing price of the company’s shares on February 12, 2010 ($39.44). |
50
Table of Contents
| Item 12. | Security ownership of certain beneficial owners and management and related stockholder matters |
To the knowledge of the directors and executive officers of the company, the only shareholder who, as of February 12, 2010, owned beneficially, or exercised control or direction over, directly or indirectly, more than 10 percent of the outstanding common shares of the company is Exxon Mobil Corporation, 5959 Las Colinas Boulevard, Irving, Texas 75039-2298, which owns beneficially 589,928,303 common shares, representing 69.6 percent of the outstanding voting shares of the company.
Reference is made to the security ownership information under the preceding Items 10 and 11. As of February 12, 2010, S.M. Smith was the owner of 4,147 common shares of the company and held 159,250 restricted stock units of the company.
The executive officers and the directors of the company, whose compensation for the year-ended December 31, 2009 is described on pages 28 through 50, consist of 15 persons, who, as a group, own beneficially 96,694 common shares of the company, being approximately 0.01 percent of the total number of outstanding shares of the company, and 573,427 shares of Exxon Mobil Corporation (including 350,305 restricted shares). This information not being within the knowledge of the company has been provided by the directors and the executive officers individually. As a group, the directors and executive officers of the company held options to acquire 145,500 common shares of the company and held restricted stock units to acquire 541,500 common shares of the company, as of February 12, 2010.
Equity compensation plan Information
The following table provides information on the common shares of the company that may be issued as of the end of 2009 pursuant to compensation plans of the company.
|
Plan category |
Number of securities to be (c) |
Weighted-average ($) (d) |
Number of securities remaining (c)
|
|||||||||
| Equity compensation plans approved by security holders (a) |
4,240,830 | 15.50 | – | |||||||||
| Equity compensation plans not approved by security holders (b) |
7,661,950 | – | 2,838,050 | |||||||||
|
Total
|
11,902,780 | 15.50 | 2,838,050 |
| a) | This is a stock option plan, which is described starting on page 44. |
| b) | This is a restricted stock unit plan, which is described starting on page 32. |
| c) | The number of securities reserved for the stock option plan represents three times the number of stock options granted in 2002 before the three-for-one share split in May 2006 and still outstanding. The number of securities reserved for the restricted stock unit plan represents the securities reserved for restricted stock units issued in 2006, 2007, 2008 and 2009 after the three-for-one share split in May 2006, plus three times the number of securities reserved for restricted stock units issued before the share split and still outstanding. |
| d) | The weighted average exercise price of the outstanding stock options of $15.50 was determined on a post share split basis. |
51
Table of Contents
| Item 13. | Certain relationships and related transactions, and director independence |
On June 25, 2008, the company implemented a 12-month “normal course” share-purchase program under which it purchased 35,723,819 of its outstanding shares between June 25, 2008 and June 24, 2009. On June 25, 2009, a 12-month share purchase program was implemented under which the company may purchase up to 42,380,326 of its outstanding shares, less any shares purchased by the employee savings plan and company pension fund. Exxon Mobil Corporation participated by selling shares to maintain its ownership at 69.6 percent. In 2009, such share purchases cost $491.7 million, of which $340.5 million was received by Exxon Mobil Corporation.
The amounts of purchases and sales by the company and its subsidiaries for other transactions in 2009 with Exxon Mobil Corporation and affiliates of Exxon Mobil Corporation were $3,328 million and $1,699 million, respectively. These transactions were conducted on terms as favourable as they would have been with unrelated parties, and primarily consisted of the purchase and sale of crude oil, natural gas, petroleum and chemical products, as well as transportation, technical and engineering services. Transactions with Exxon Mobil Corporation also included amounts paid and received in connection with the company’s participation in a number of upstream activities conducted jointly in Canada. In addition, the company has existing agreements with affiliates of Exxon Mobil Corporation to provide computer and customer support services to the company and to share common business and operational support services to allow the companies to consolidate duplicate work and systems. The company has a contractual agreement with an affiliate of Exxon Mobil Corporation in Canada to operate the Western Canada production properties owned by ExxonMobil. There are no asset ownership changes. The company and that affiliate also have a contractual agreement to provide for equal participation in new upstream opportunities. During 2007, the company entered into agreements with Exxon Mobil Corporation and one of its affiliated companies that provide for the delivery of management, business and technical services to Syncrude Canada Ltd. by ExxonMobil.
In 2009, the company entered into an agreement with ExxonMobil that provides for a long-term variable-rate loan from ExxonMobil to the company of up to $5 billion (Canadian) at interest equivalent to Canadian market rates. The company has not drawn on this agreement.
R.C Olsen is a non-independent member of the executive resources committee, environmental, health and safety committee and nominations and corporate governance committee and a non-independent director of the board of the Imperial Oil Foundation. As an employee of ExxonMobil Production Company, R.C. Olsen is independent of the company’s management and is able to assist these committees by reflecting the perspective of the company’s shareholders.
52
Table of Contents
| Item 14. | Principal accountant fees and services |
Auditor fees
The aggregate fees of PwC for professional services rendered for the audit of the company’s financial statements and other services for the fiscal years ended December 31, 2009 and December 31, 2008 were as follows:
| thousands of dollars | 2009 | 2008 | ||||
| Audit fees |
1,140 | 1,140 | ||||
| Audit-related fees |
62 | 62 | ||||
| Tax fees |
0 | 176 | ||||
| All other fees |
0 | 0 | ||||
| Total fees |
1,202 | 1,378 | ||||
Audit fees include the audit of the company’s annual financial statements and internal control over financial reporting, and a review of the first three quarterly financial statements in 2009. Audit-related fees include other assurance services including the audit of the company’s retirement plan and royalty statement audits for oil and gas producing entities. Tax fees are mainly tax services for employees on foreign loan assignments. 2008 was the final year of PwC providing tax services for the company’s employees on foreign loan assignment. The company did not engage the auditor for any other services.
The audit committee recommends the external auditor to be appointed by the shareholders, fixes its remuneration and oversees its work. The audit committee also approves the proposed current year audit program of the external auditor, assesses the results of the program after the end of the program period and approves in advance any non-audit services to be performed by the external auditor after considering the effect of such services on their independence.
All of the services rendered by the auditor to the company were approved by the audit committee.
53
Table of Contents
PART IV
| Item 15. | Exhibits and financial statement schedules |
Reference is made to the table of content in the Financial section on page 59 of this report.
The following exhibits numbered in accordance with Item 601 of Regulation S-K are filed as part of this report:
| (3) | (i) | Restated certificate and articles of incorporation of the company (Incorporated herein by reference to Exhibit (3.1) to the company’s Form 8-Q filed on May 3, 2006 (File No. 0-12014)). | ||||
| (ii) | By-laws of the company (Incorporated herein by reference to Exhibit (3)(ii) to the company’s Quarterly Report on Form 10-Q for the quarter ended March 31, 2003 (File No. 0-12014)). | |||||
| (4) | The company’s long-term debt authorized under any instrument does not exceed 10 percent of the company’s consolidated assets. The company agrees to furnish to the Commission upon request a copy of any such instrument. | |||||
| (10) | (ii) | (1) | Alberta Crown Agreement, dated February 4, 1975, relating to the participation of the Province of Alberta in Syncrude (Incorporated herein by reference to Exhibit 13(a) of the company’s Registration Statement on Form S-1, as filed with the Securities and Exchange Commission on August 21, 1979 (File No. 2-65290)). | |||
| (2) | Amendment to Alberta Crown Agreement, dated January 1, 1983 (Incorporated herein by reference to Exhibit (10)(ii)(2) of the company’s Annual Report on Form 10-K for the year ended December 31, 1983 (File No. 2-9259)). | |||||
| (3) | Syncrude Ownership and Management Agreement, dated February 4, 1975 (Incorporated herein by reference to Exhibit 13(b) of the company’s Registration Statement on Form S-1, as filed with the Securities and Exchange Commission on August 21, 1979 (File No. 2-65290)). | |||||
| (4) | Letter Agreement, dated February 8, 1982, between the Government of Canada and Esso Resources Canada Limited, amending Schedule “C” to the Syncrude Ownership and Management Agreement filed as Exhibit (10)(ii)(2) (Incorporated herein by reference to Exhibit (20) of the company’s Annual Report on Form 10-K for the year ended December 31, 1981 (File No. 2-9259)). | |||||
| (5) | Norman Wells Pipeline Agreement, dated January 1, 1980, relating to the operation, tolls and financing of the pipeline system from the Norman Wells field (Incorporated herein by reference to Exhibit 10(a)(3) of the company’s Annual Report on Form 10-K for the year ended December 31, 1981 (File No. 2-9259)). | |||||
| (6) | Norman Wells Pipeline Amending Agreement, dated April 1, 1982 (Incorporated herein by reference to Exhibit (10)(ii)(5) of the company’s Annual Report on Form 10-K for the year ended December 31, 1982 (File No. 2-9259)). | |||||
| (7) | Letter Agreement clarifying certain provisions to the Norman Wells Pipeline Agreement, dated August 29, 1983 (Incorporated herein by reference to Exhibit (10)(ii)(7) of the company’s Annual Report on Form 10-K for the year ended December 31, 1983 (File No. 2-9259)). | |||||
| (8) | Norman Wells Pipeline Amending Agreement, made as of February 1, 1985, relating to certain amendments ordered by the National Energy Board (Incorporated herein by reference to Exhibit (10)(ii)(8) of the company’s Annual Report on Form 10-K for the year ended December 31, 1986 (File No. 0-12014)). | |||||
| (9) | Norman Wells Pipeline Amending Agreement, made as of April 1, 1985, relating to the definition of “Operating Year” (Incorporated herein by reference to Exhibit (10)(ii)(9) of the company’s Annual Report on Form 10-K for the year ended December 31, 1986 (File No. 0-12014)). | |||||
| (10) | Norman Wells Expansion Agreement, dated October 6, 1983, relating to the prices and royalties payable for crude oil production at Norman Wells (Incorporated herein by reference to Exhibit (10)(ii)(8) of the company’s Annual Report on Form 10-K for the year ended December 31, 1983 (File No. 2-9259)). | |||||
| (11) | Alberta Cold Lake Crown Agreement, dated June 25, 1984, relating to the royalties payable and the assurances given in respect of the Cold Lake production project (Incorporated herein by reference to Exhibit (10)(ii)(11) of the company’s Annual Report on Form 10-K for the year ended December 31, 1986 (File No. 0-12014)). | |||||
| (12) | Amendment to Alberta Crown Agreement, dated January 1, 1986 (Incorporated herein by reference to Exhibit (10)(ii)(12) of the company’s Annual Report on Form 10-K for the year ended | |||||
54
Table of Contents
| December 31, 1987 (File No. 0-12014)). | ||||||
| (13) | Amendment to Alberta Crown Agreement, dated November 25, 1987 (Incorporated herein by reference to Exhibit (10)(ii)(13) of the company’s Annual Report on Form 10-K for the year ended December 31, 1987 (File No. 0-12014)). | |||||
| (14) | Amendment to Syncrude Ownership and Management Agreement, dated March 10, 1982 (Incorporated herein by reference to Exhibit (10)(ii)(14) of the company’s Annual Report on Form 10-K for the year ended December 31, 1989 (File No. 0-12014)). | |||||
| (15) | Amendment to Alberta Crown Agreement, dated August 1, 1991 (Incorporated herein by reference to Exhibit (10)(ii)(15) of the company’s Annual Report on Form 10-K for the year ended December 31, 1991 (File No. 0-12014)). | |||||
| (16) | Norman Wells Settlement Agreement, dated July 31, 1996. (Incorporated herein by reference to Exhibit (10)(ii)(16) of the company’s Annual Report on Form 10-K for the year ended December 31, 1996 (File No. 0-12014)). | |||||
| (17) | Amendment to Alberta Crown Agreement, dated January 1, 1997. (Incorporated herein by reference to Exhibit (10)(ii)(17) of the company’s Annual Report on Form 10-K for the year ended December 31, 1996 (File No. 0-12014)). | |||||
| (18) | Norman Wells Pipeline Amending Agreement, dated December 12, 1997. (Incorporated herein by reference to Exhibit (10)(ii)(18) of the company’s Annual Report on Form 10-K for the year ended December 31, 1998 (File No. 0-12014)). | |||||
| (19) | Norman Wells Pipeline 1999 Amending Agreement, dated May 1, 1999. (Incorporated herein by reference to Exhibit (10)(ii)(19) of the company’s Annual Report on Form 10-K for the year ended December 31, 1999 (File No. 0-12014)). | |||||
| (20) | Alberta Cold Lake Transition Agreement, effective January 1, 2000, relating to the royalties payable in respect of the Cold Lake production project and terminating the Alberta Cold Lake Crown Agreement. (Incorporated herein by reference to Exhibit (10)(ii)(20) of the company’s Annual Report on Form 10-K for the year ended December 31, 2001 (File No. 0-12014)). | |||||
| (21) | Amendment to Alberta Crown Agreement effective January 1, 2001 (Incorporated herein by reference to Exhibit (10)(ii)(21) of the company’s Quarterly Report on Form 10-Q for the quarter ended June 30, 2002 (File No. 0-12014)). | |||||
| (22) | Amendment to Syncrude Ownership and Management Agreement effective January 1, 2001 (Incorporated herein by reference to Exhibit (10)(ii)(22) of the company’s Quarterly Report on Form 10-Q for the quarter ended June 30, 2002 (File No. 0-12014)). | |||||
| (23) | Amendment to Syncrude Ownership and Management Agreement effective September 16, 1994 (Incorporated herein by reference to Exhibit (10)(ii)(23) of the company’s Quarterly Report on Form 10-Q for the quarter ended June 30, 2002 (File No. 0-12014)). | |||||
| (24) | Amendment to Alberta Crown Agreement dated November 29, 1995 (Incorporated herein by reference to Exhibit (10)(ii)(24) of the company’s Quarterly Report on Form 10-Q for the quarter ended June 30, 2002 (File No. 0-12014)). | |||||
| (25) | Syncrude Royalty Amending Agreement, dated November 18, 2008, setting out various items, including the amount of additional royalties that are to be paid to the Province of Alberta in the period from January 1, 2010 to December 31, 2015 in return for certain assurances from the Government of Alberta (Incorporated herein by reference to Exhibit 1.01(10)(ii)(1) of the company’s Form 8-K filed on November 19, 2008 (File No. 0-12014)). | |||||
| (26) | Syncrude Bitumen Royalty Option Agreement, dated November 18, 2008, setting out the terms of the exercise by the Syncrude Joint Venture owners of the option contained in the existing Crown Agreement to convert to a royalty payable on the value of bitumen, effective January 1, 2009 (Incorporated herein by reference to Exhibit 1.01(10)(ii)(2) of the company’s Form 8-K filed on November 19, 2008 (File No. 0-12014)). | |||||
| (27) | Project Approval Order No. OSR045 made under the Alberta Mines and Minerals Act and Oil Sands Royalty Regulation, 1997 in respect of the Syncrude Project (Incorporated herein by reference to Exhibit 1.01(10)(ii)(3) of the company’s Form 8-K filed on November 19, 2008 (File No. 0-12014)). | |||||
| (iii)(A) | (1) | Form of Letter relating to Supplemental Retirement Income (Incorporated herein by reference to Exhibit (10)(c)(3) of the company’s Annual Report on Form 10-K for the year ended December 31, 1980 (File No. 2-9259)). | ||||
| (2) | Incentive Share Unit Plan and Incentive Share Units granted in 2001 are incorporated herein by reference to Exhibit (10)(iii)(A)(2) of the company’s Annual Report on Form 10-K
for | |||||
55
Table of Contents
| the year - ended December 31, 2001. Units granted in 2000 are incorporated herein by reference to Exhibit (10)(iii)(A)(2) of the company’s Annual Report on Form 10-K for the year ended December 31, 2000 (File No. 0-12014); units granted in 1999 are incorporated herein by reference to Exhibit (10)(iii)(A)(3) of the company’s Annual Report on Form 10-K for the year ended December 31, 1999 (File No. 0-12014); units granted in 1998 are incorporated herein by reference to Exhibit (10)(iii)(A)(3) of the company’s Annual Report on Form 10-K for the year ended December 31, 1998 (File No. 0-12014). | ||||||
| (3) | Deferred Share Unit Plan. (Incorporated herein by reference to Exhibit(10)(iii)(A)(5) of the company’s Annual Report on Form 10-K for the year ended December 31, 1998 (File No. 0-12014)). | |||||
| (4) | Deferred Share Unit Plan for Nonemployee Directors. (Incorporated herein by reference to Exhibit (10)(iii)(A)(6) of the company’s Annual Report on Form 10-K for the year ended December 31, 1998 (File No. 0-12014)). | |||||
| (5) | Form of Earnings Bonus Units (Incorporated herein by reference to Exhibit (10)(iii)(A)(5) of the company’s Annual Report on Form 10-K for the year ended December 31, 2003 (File No. 0-12014)) and Earnings Bonus Unit Plan (Incorporated herein by reference to Exhibit (10)(iii)(A)(5) of the company’s Annual Report on Form 10-K for the year ended December 31, 2002 (File No. 0-12014)). | |||||
| (6) | Incentive Stock Option Plan and Incentive Stock Options granted in 2002 (Incorporated herein by reference to Exhibit (10)(iii)(A)(6) of the company’s Quarterly Report on Form 10-Q for the quarter ended June 30, 2002 (File No. 0-12014)). | |||||
| (7) | Restricted Stock Unit Plan and Restricted Stock Units granted in 2002 (Incorporated herein by reference to Exhibit (10)(iii)(A)(7) of the company’s Annual Report on Form 10-K for the year ended December 31, 2002 (File No. 0-12014)). | |||||
| (8) | Restricted Stock Unit Plan and Restricted Stock Units granted in 2003 (Incorporated herein by reference to Exhibit (10)(iii)(A)(8) of the company’s Annual Report on Form 10-K for the year ended December 31, 2003 (File No. 0-12014)). | |||||
| (9) | Restricted Stock Unit Plan and general form for Restricted Stock Units, as amended effective December 31, 2004 (Incorporated herein by reference to Exhibit 99.1 of the company’s Form 8-K dated December 31, 2004 (File No. 0-12014)). | |||||
| (10) | Amended Restricted Stock Unit Plan with respect to Restricted Stock Units granted in 2002, as amended effective August 4, 2006 (Incorporated herein by reference to Exhibit 99.10(III)(A)(1) of the company’s Quarterly Report on Form 10-Q for the quarter ended September 30, 2006 (File No. 0-12014)). | |||||
| (11) | Amended Restricted Stock Unit Plan with respect to Restricted Stock Units granted in 2003, as amended effective August 4, 2006 (Incorporated herein by reference to Exhibit 99.10(III)(A)(2) of the company’s Quarterly Report on Form 10-Q for the quarter ended September 30, 2006 (File No. 0-12014)). | |||||
| (12) | Amended Restricted Stock Unit Plan with respect to Restricted Stock Units granted in 2004 and 2005, as amended effective August 4, 2006 (Incorporated herein by reference to Exhibit 99.10(III)(A)(3) of the company’s Quarterly Report on Form 10-Q for the quarter ended September 30, 2006 (File No. 0-12014)). | |||||
| (13) | Amended Restricted Stock Unit Plan with respect to Restricted Stock Units granted in 2006 and subsequent years, as amended effective August 4, 2006 (Incorporated herein by reference to Exhibit 99.10(III)(A)(4) of the company’s Quarterly Report on Form 10-Q for the quarter ended September 30, 2006 (File No. 0-12014)). | |||||
| (14) | Amended Restricted Stock Unit Plan with respect to Restricted Stock Units granted in 2002, as amended effective February 1, 2007 (Incorporated herein by reference to Exhibit 99.1 of the company’s Form 8-K filed on February 2, 2007 (File No. 0-12014)). | |||||
| (15) | Amended Restricted Stock Unit Plan with respect to Restricted Stock Units granted in 2002, as amended effective February 26, 2008 and May 1, 2008 (Incorporated herein by reference to Exhibit 6 [10(iii)(A)(15)] of the company’s Quarterly Report on Form 10-Q for the quarter ended March 31, 2008 (File No. 0-12014)). | |||||
| (16) | Amended Restricted Stock Unit Plan with respect to Restricted Stock Units granted in 2003, as amended effective February 26, 2008 and May 1, 2008 (Incorporated herein by reference to Exhibit 6 [10(iii)(A)(16)] of the company’s Quarterly Report on Form 10-Q for the quarter ended March 31, 2008 (File No. 0-12014)). |
56
Table of Contents
| (17) | Amended Restricted Stock Unit Plan with respect to Restricted Stock Units granted in 2004 and 2005, as amended effective February 26, 2008 and May 1, 2008 (Incorporated herein by reference to Exhibit 6 [10(iii)(A)(17)] of the company’s Quarterly Report on Form 10-Q for the quarter ended March 31, 2008 (File No. 0-12014)). | |||||
| (18) | Amended Restricted Stock Unit Plan with respect to Restricted Stock Units granted in 2006 and 2007, as amended effective February 26, 2008 and May 1, 2008 (Incorporated herein by reference to Exhibit 6 [10(iii)(A)(18)] of the company’s Quarterly Report on Form 10-Q for the quarter ended March 31, 2008 (File No. 0-12014)). | |||||
| (19) | Amended Restricted Stock Unit Plan with respect to Restricted Stock Units granted in 2008 and subsequent years, as amended effective February 26, 2008 and May 1, 2008 (Incorporated herein by reference to Exhibit 6 [10(iii)(A)(19)] of the company’s Quarterly Report on Form 10-Q for the quarter ended March 31, 2008 (File No. 0-12014)). | |||||
| (20) | Amended Restricted Stock Unit Plan with respect to Restricted Stock Units granted in 2002, as amended effective November 20, 2008 (Incorporated herein by reference to Exhibit 9.01(c)[10(iii)(A)(1)] of the company’s Form 8-K filed on November 25, 2008 (File No. 0-12014)). | |||||
| (21) | Amended Restricted Stock Unit Plan with respect to Restricted Stock Units granted in 2003, as amended effective November 20, 2008 (Incorporated herein by reference to Exhibit 9.01(c)[10(iii)(A)(2)] of the company’s Form 8-K filed on November 25, 2008 (File No. 0-12014)). | |||||
| (22) | Amended Restricted Stock Unit Plan with respect to Restricted Stock Units granted in 2004 and 2005, as amended effective November 20, 2008 (Incorporated herein by reference to Exhibit 9.01(c)[10(iii)(A)(3)] of the company’s Form 8-K filed on November 25, 2008 (File No. 0-12014)). | |||||
| (23) | Amended Restricted Stock Unit Plan with respect to Restricted Stock Units granted in 2006 and 2007, as amended effective November 20, 2008 (Incorporated herein by reference to Exhibit 9.01(c)[10(iii)(A)(4)] of the company’s Form 8-K filed on November 25, 2008 (File No. 0-12014)). | |||||
| (24) | Amended Restricted Stock Unit Plan with respect to Restricted Stock Units granted in 2008 and subsequent years, as amended effective November 20, 2008 (Incorporated herein by reference to Exhibit 9.01(c)[10(iii)(A)(5)] of the company’s Form 8-K filed on November 25, 2008 (File No. 0-12014)). | |||||
| (25) | Amended Deferred Share Unit Plan for selected executives effective November 20, 2008 (Incorporated herein by reference to Exhibit 15(10)(iii)(A)(25) of the company’s Form 10-K filed on February 27,2009). (File No. 0-12014)) | |||||
| (26) | Termination of Deferred Share Unit Plan for selected executives effective February 2, 2010 (Reference is made to the company’s Form 8-K filed on February 3, 2010 (File No. 0-12014)) | |||||
| (21) | Imperial Oil Resources Limited, McColl-Frontenac Petroleum Inc., Imperial Oil Resources N.W.T. Limited and Imperial Oil Resources Ventures Limited, all incorporated in Canada, are wholly-owned subsidiaries of the company. The names of all other subsidiaries of the company are omitted because, considered in the aggregate as a single subsidiary, they would not constitute a significant subsidiary as of December 31, 2009. | |||||
| (23) (ii) | (A) | Consent of Independent Registered Public Accounting Firm (PricewaterhouseCoopers LLP). | ||||
| (31.1) | Certification by principal executive officer of Periodic Financial Report pursuant to Rule 13a-14(a). | |||||
| (31.2) | Certification by principal financial officer of Periodic Financial Report pursuant to Rule 13a-14(a). | |||||
| (32.1) | Certification by chief executive officer of Periodic Financial Report pursuant to Rule 13a-14(b) and 18 U.S.C. Section 1350. | |||||
| (32.2) | Certification by chief financial officer of Periodic Financial Report pursuant to Rule 13a-14(b) and 18 U.S.C. Section 1350. | |||||
Copies of Exhibits may be acquired upon written request of any shareholder to the investor relations manager, Imperial Oil Limited, 237 Fourth Avenue S.W., Calgary, Alberta, Canada T2P 3M9, and payment of processing and mailing costs.
57
Table of Contents
SIGNATURES
Pursuant to the requirements of Section 13 or 15(d) of the Securities Exchange Act of 1934, the registrant has duly caused this report to be signed on its behalf on February 26, 2010 by the undersigned, thereunto duly authorized.
| Imperial Oil Limited |
| By /s/ Bruce H. March |
| (Bruce H. March, Chairman of the Board, President and Chief Executive Officer) |
Pursuant to the requirements of the Securities Exchange Act of 1934, this report has been signed below on February 26, 2010 by the following persons on behalf of the registrant and in the capacities indicated.
| Signature | Title | |
| /s/ Bruce H. March (Bruce H. March) |
Chairman of the Board, President and Chief Executive Officer and Director (Principal Executive Officer) | |
| /s/ Paul A. Smith (Paul A. Smith) |
Senior Vice-President, Finance and Administration, and Treasurer and Director (Principal Accounting Officer and Principal Financial Officer) | |
| /s/ Krystyna T. Hoeg |
Director | |
| (Krystyna T. Hoeg) | ||
| /s/ Jack M. Mintz |
Director | |
| (Jack M. Mintz) | ||
| /s/ Robert C. Olsen |
Director | |
| (Robert C. Olsen) | ||
| /s/ Roger Phillips |
Director | |
| (Roger Phillips) | ||
| /s/ Sheelagh D. Whittaker |
Director | |
| (Sheelagh D. Whittaker) | ||
| /s/ Victor L. Young |
Director | |
| (Victor L. Young ) | ||
58
Table of Contents
Financial section
59
Table of Contents
| millions of dollars |
2009 | 2008 | 2007 | 2006 | 2005 | |||||
| Operating revenues (a) |
21,292 | 31,240 | 25,069 | 24,505 | 27,797 | |||||
| Net income by segment: |
||||||||||
| Upstream |
1,324 | 2,923 | 2,369 | 2,376 | 2,008 | |||||
| Downstream |
278 | 796 | 921 | 624 | 694 | |||||
| Chemical |
46 | 100 | 97 | 143 | 121 | |||||
| Corporate and other |
(69) | 59 | (199) | (99) | (223) | |||||
| Net income |
1,579 | 3,878 | 3,188 | 3,044 | 2,600 | |||||
| Cash and cash equivalents at year-end |
513 | 1,974 | 1,208 | 2,158 | 1,661 | |||||
| Total assets at year-end |
17,473 | 17,035 | 16,287 | 16,141 | 15,582 | |||||
| Long-term debt at year-end |
31 | 34 | 38 | 359 | 863 | |||||
| Total debt at year-end |
140 | 143 | 146 | 1,437 | 1,439 | |||||
| Other long-term obligations at year-end |
2,839 | 2,254 | 1,914 | 1,683 | 1,728 | |||||
| Shareholders’ equity at year-end |
9,439 | 9,065 | 7,923 | 7,406 | 6,633 | |||||
| Cash flow from operating activities |
1,591 | 4,263 | 3,626 | 3,587 | 3,451 | |||||
| Per-share information (dollars) (b) |
||||||||||
| Net income per share – basic |
1.86 | 4.39 | 3.43 | 3.12 | 2.54 | |||||
| Net income per share – diluted |
1.84 | 4.36 | 3.41 | 3.11 | 2.53 | |||||
| Dividends |
0.40 | 0.38 | 0.35 | 0.32 | 0.31 | |||||
| a) | Operating revenues include $4,894 million for 2005 for purchases/sales contracts with the same counterparty. Associated costs were included in “purchases of crude oil and products”. Effective January 1, 2006, these purchases/sales were recorded on a net basis. |
| b) | Adjusted to reflect the May 2006 three-for-one share split. |
60
Table of Contents
Listed below are definitions of three of Imperial’s frequently used financial performance measures. The definitions are provided to facilitate understanding of the terms and how they are calculated.
Capital employed
Capital employed is a measure of net investment. When viewed from the perspective of how capital is used by the business, it includes the company’s property, plant and equipment and other assets, less liabilities, excluding both short-term and long-term debt. When viewed from the perspective of the sources of capital employed for the whole company, it includes total debt and equity. Both of these views include the company’s share of amounts applicable to equity companies.
| millions of dollars |
2009 | 2008 | 2007 | |||
| Business uses: asset and liability perspective |
||||||
| Total assets |
17,473 | 17,035 | 16,287 | |||
| Less: total current liabilities excluding short-term debt and current portion of long-term debt |
(3,659) | (4,084) | (4,833) | |||
| Less: total long-term liabilities excluding long-term debt |
(4,235) | (3,743) | (3,385) | |||
| Add: Imperial’s share of equity company debt |
36 | 40 | 50 | |||
| Total capital employed |
9,615 | 9,248 | 8,119 | |||
| millions of dollars |
2009 | 2008 | 2007 | |||
| Total company sources: debt and equity perspective |
||||||
| Short-term debt and current portion of long-term debt |
109 | 109 | 108 | |||
| Long-term debt |
31 | 34 | 38 | |||
| Shareholders’ equity |
9,439 | 9,065 | 7,923 | |||
| Add: Imperial’s share of equity company debt |
36 | 40 | 50 | |||
| Total capital employed |
9,615 | 9,248 | 8,119 | |||
Return on average capital employed (ROCE)
ROCE is a financial performance ratio. For each of the company’s business segments, ROCE is annual business-segment net income divided by average business-segment capital employed (an average of the beginning-and end-of-year amounts). Segment net income includes Imperial’s share of segment net income of equity companies, consistent with the definition used for capital employed, and excludes the cost of financing. The company’s total ROCE is net income excluding the after-tax cost of financing divided by total average capital employed. The company has consistently applied its ROCE definition for many years and views it as the best measure of historical capital productivity in a capital-intensive, long-term industry to both evaluate management’s performance and demonstrate to shareholders that capital has been used wisely over the long-term. Additional measures, which tend to be more cash flow based, are used to make investment decisions.
| millions of dollars |
2009 | 2008 | 2007 | |||
| Net income |
1,579 | 3,878 | 3,188 | |||
| Financing costs (after tax), including Imperial’s share of equity companies |
2 | 2 | 18 | |||
| Net income excluding financing costs |
1,581 | 3,880 | 3,206 | |||
| Average capital employed |
9,432 | 8,684 | 8,509 | |||
| Return on average capital employed (percent) – corporate total |
16.8 | 44.7 | 37.7 | |||
61
Table of Contents
Cash flow from operating activities and asset sales
Cash flow from operating activities and asset sales is the sum of the net cash provided by operating activities and proceeds from asset sales reported in the consolidated statement of cash flows. This cash flow is the total source of cash both from operating the company’s assets and from the divesting of assets. The company employs a long-standing, disciplined regular review process to ensure that all assets are contributing to the company’s strategic and financial objectives. Assets are divested when they no longer meet these objectives or are worth considerably more to others. Because of the regular nature of this activity, management believes it is useful for investors to consider sales proceeds together with cash provided by operating activities when evaluating cash available for investment in the business and financing activities, including shareholder distributions.
| millions of dollars |
2009 | 2008 | 2007 | |||
| Cash from operating activities |
1,591 | 4,263 | 3,626 | |||
| Proceeds from asset sales |
67 | 272 | 279 | |||
| Total cash flow from operating activities and asset sales |
1,658 | 4,535 | 3,905 |
62
Table of Contents
Management’s discussion and analysis of financial condition and results of operations
The following discussion and analysis of Imperial’s financial results, as well as the accompanying financial statements and related notes to consolidated financial statements to which they refer, are the responsibility of the management of Imperial Oil Limited.
The company’s accounting and financial reporting fairly reflect its straightforward business model involving the extracting, refining and marketing of hydrocarbons and hydrocarbon-based products. The company’s business involves the production (or purchase), manufacture and sale of physical products, and all commercial activities are directly in support of the underlying physical movement of goods.
Imperial, with its resource base, financial strength, disciplined investment approach and technology portfolio, is well-positioned to participate in substantial investments to develop new Canadian energy supplies. While commodity prices remain volatile on a short-term basis depending upon supply and demand, Imperial’s investment decisions are based on its long-term business outlook, using a disciplined approach in selecting and pursuing the most attractive investment opportunities. The corporate plan is a fundamental annual management process that is the basis for setting near-term operating and capital objectives, in addition to providing the longer-term economic assumptions used for investment evaluation purposes. Potential investment opportunities are tested over a wide range of economic scenarios to establish the resiliency of each opportunity. Once investments are made, a reappraisal process is completed to ensure relevant lessons are learned and improvements are incorporated into future projects.
Business environment and risk assessment
Long-term business outlook
Economic and population growth are expected to remain the primary drivers of energy demand, globally and in North America. The company expects the global economy to grow at an average rate of close to three percent per year through 2030. The combination of population and economic growth should lead to an increase in demand for primary energy at an average rate of 1.2 percent annually. The vast majority of this increase is expected to occur in developing countries.
Oil, gas and coal are expected to remain the predominant energy sources with approximately an 80 percent share of total energy. Oil and gas alone are expected to maintain close to a 60 percent share.
Over the same period, the Canadian economy is expected to grow at an average rate of about 2.4 percent per year, and Canadian demand for energy at about 0.8 percent per year. Oil and gas are expected to continue to supply about two-thirds of Canadian energy demand. It is expected that Canada will also be a growing supplier of energy to U.S. markets through this period.
Oil products are the transportation fuel of choice for the world’s fleet of cars, trucks, trains, ships and airplanes. Primarily because of increased demand in developing countries, oil consumption is expected to increase by about 25 percent or over 20 million barrels a day by 2030. Canada’s oil resources, second only to Saudi Arabia, represent an important potential additional source of supply.
Natural gas is expected to be a major primary energy source globally, capturing about 35 percent of all incremental energy growth and approaching one-quarter of global energy supplies. Natural gas production from conventional sources in mature established regions in the United States and Canada is not expected to meet increasing demand, strengthening the market opportunities for new gas supply from Canada’s frontier areas and unconventional resources.
63
Table of Contents
Management’s discussion and analysis of financial condition and results of operations (continued)
Upstream
Imperial produces crude oil and natural gas for sale into large North American markets. Crude oil and natural gas prices are determined by global and North American markets and are subject to changing supply and demand conditions. These can be influenced by a wide range of factors, including economic conditions, international political developments and weather.
The global economic recession in 2009 challenged the oil and gas industry globally and in Canada. Imperial responded to the uncertainty associated with the economic downturn by following the company’s proven approach of focusing on those elements of the business within its control and taking a long-term view of development. The focus on prudent financial management and disciplined capital investment enabled the company to progress several key growth projects in a challenging business environment, while capitalizing on lower costs and higher productivity.
Imperial’s fundamental Upstream business strategies guide the company’s exploration, development, production and gas marketing activities. These strategies include identifying and pursuing all attractive exploration opportunities, investing in projects that deliver superior returns and maximizing profitability of existing oil and gas production. These strategies are underpinned by a relentless focus on operational excellence, commitment to innovative technologies, development of employees and investment in the communities in which the company operates.
Imperial has a large portfolio of oil and gas resources in Canada, both developed and undeveloped, which helps reduce the risks of dependence on potentially limited supply sources in the Upstream. With the relative maturity of conventional production in the established producing areas of Western Canada, Imperial’s production is expected to come increasingly from unconventional and frontier sources, particularly oil sands, unconventional natural gas and from Canada’s North, where Imperial has large undeveloped resource opportunities.
Downstream
The downstream industry environment remains very competitive. Refining margins are the difference between what a refinery pays for its raw materials (primarily crude oil) and the wholesale market prices for the range of products produced (primarily gasoline, diesel fuel, heating oil, jet fuel and heavy fuel oil). Refining margins have been flat, over the past 20 years in inflation adjusted terms, with the recent prior years’ stronger margins offsetting the longer-term trend of declining margins. Intense competition in the retail fuels market has tended to drive down real margins over time. Crude oil and many products are widely traded with published international prices. Prices for those commodities are determined by the marketplace, often an international marketplace, and are affected by many factors, including global and regional supply/demand balances, inventory levels, refinery operations, import/export balances, transportation logistics, seasonality and weather. Canadian wholesale prices in particular are largely determined by wholesale prices in adjacent U.S. regions. These prices and factors are continually monitored and provide input to operating decisions about which raw materials to buy, facilities to operate and products to make. In 2009, the global economic recession had a significant negative impact on the demand for refined products, and thus put considerable downward pressure on worldwide and North American refining margins. However, there are no reliable indicators of future market factors that accurately predict changes in margins from period to period.
The company will continue to focus on the business elements within its control. Imperial’s Downstream strategies are to provide customers with quality service and products at the lowest total cost offer, have the lowest unit costs among industry competitors, ensure efficient and effective use of capital and capitalize on integration with the company’s other businesses.
Imperial owns and operates four refineries in Canada, with distillation capacity of 502,000 barrels a day and lubricant manufacturing capacity of 8,000 barrels a day. Imperial’s fuels marketing business includes retail operations across Canada serving customers through about 1,850 Esso-branded retail service stations, of which about 540 are company-owned or leased, and wholesale and industrial operations through a network of 24 primary distribution terminals, as well as a secondary distribution network.
64
Table of Contents
Management’s discussion and analysis of financial condition and results of operations (continued)
Chemical
The North American petrochemical industry was weak in 2009 as a result of the slow global economy. The company’s strategy for its Chemical business is to reduce costs and maximize value by continuing to increase the integration of its chemical plants at Sarnia and Dartmouth with the refineries. The company also benefits from its integration within ExxonMobil’s North American chemical businesses, enabling Imperial to maintain a leadership position in its key market segments.
Consolidated
| millions of dollars |
2009 | 2008 | 2007 | |||
| Net income |
1,579 | 3,878 | 3,188 |
2009
Net income in 2009 was $1,579 million or $1.84 a share on a diluted basis, a decrease of $2,299 million or $2.52 a share from 2008. Earnings decreased primarily due to the unfavourable impact of lower crude oil and natural gas commodity prices, which were a result of the global economic downturn. Also impacting 2009 earnings were lower overall downstream margins and product demand. These factors were partially offset by lower royalty costs and the impact of a lower Canadian dollar. Earnings in the full year of 2008 included a gain of $187 million from the sale of Rainbow Pipe Line Co. Ltd.
2008
Net income in 2008 of $3,878 million or $4.36 a share on a diluted basis was the best on record, exceeding the previous record achieved in 2007 of $3,188 million or $3.41 a share. Earnings increased primarily due to the favourable impact of higher crude oil and natural gas commodity prices. Improved upstream realizations were partially offset by the negative impacts of lower upstream volumes, higher royalties, higher energy and maintenance costs and lower overall downstream margins.
Upstream
| millions of dollars |
2009 | 2008 | 2007 | |||
| Net income |
1,324 | 2,923 | 2,369 |
2009
Net income for the year was $1,324 million, down $1,599 million from 2008. Lower crude oil and natural gas commodity prices in 2009 reduced revenues, impacting earnings by about $2,400 million as a result of the global economic downturn. Earnings were also negatively impacted by lower Cold Lake bitumen production of about $100 million and lower conventional volumes from expected reservoir decline of about $60 million. These factors were partially offset by lower royalty costs due to lower commodity prices of about $600 million and the impact of a lower Canadian dollar of about $325 million.
2008
Net income was $2,923 million versus $2,369 million in 2007. Earnings benefited from higher overall crude oil and natural gas commodity prices totaling about $2,100 million. Their positive impact on earnings was partially offset by lower conventional volumes from expected reservoir decline of about $420 million, lower Syncrude volumes of about $135 million and lower cyclical Cold Lake bitumen production of about $105 million. Earnings were also negatively impacted by higher royalties of about $310 million, higher energy, Syncrude maintenance, and other production costs totaling about $290 million, the absence of favourable effects of tax rate changes of about $170 million and lower gains from asset divestments of about $140 million.
65
Table of Contents
Management’s discussion and analysis of financial condition and results of operations (continued)
| Average realizations and prices |
||||||
| Canadian dollars |
2009 | 2008 | 2007 | |||
| Conventional crude oil realizations (a barrel) |
60.32 | 95.76 | 71.70 | |||
| Natural gas liquids realizations (a barrel) |
41.19 | 59.35 | 47.92 | |||
| Natural gas realizations (a thousand cubic feet) |
4.11 | 8.69 | 6.95 | |||
| Syncrude realizations (a barrel) |
69.69 | 106.61 | 79.10 | |||
| Western Canada Select heavy oil (a barrel) |
58.67 | 82.96 | 52.91 |
2009
The average price of Brent crude oil in U.S. dollars, a common benchmark for world oil markets, at $61.61 a barrel, declined about 36 percent from 2008. The company’s realizations on sales of Canadian conventional crude oil and synthetic crude oil from Syncrude production mirrored the same trend as world prices.
Prices for Canadian heavier crude oil also declined along with the lighter crude oil. The company’s average realizations for Cold Lake bitumen fell about 25 percent for the full year in 2009, compared to 2008, reflecting the narrowing price spread between light crude oil and Cold Lake bitumen.
Canadian natural gas prices in 2009 were lower than in the previous year. The average of 30-day spot prices for natural gas in Alberta decreased to $4.39 a thousand cubic feet, a decline of about 49 percent from 2008. The company’s realizations for natural gas averaged $4.11 a thousand cubic feet, down about 53 percent from 2008.
2008
World crude oil prices ended 2008 much lower than the record levels reached earlier in the year. The price of Brent crude oil, a common benchmark of world oil markets, declined from a high of $144.22 (U.S.) a barrel in July to a low of $33.65 (U.S.) in December. For the year, the average price of Brent crude oil was $96.99 (U.S.) a barrel, up about 34 percent from 2007. The company’s realizations on sales of Canadian conventional crude oil mirrored the same trends as world prices, ending 2008 at a level much lower than the average of the year.
Prices for Canadian heavy oil, including the company’s bitumen at Cold Lake, moved generally in line with that of the lighter crude oil. The price of Western Canada Select, a benchmark for heavy oil, increased by about 57 percent in 2008 from 2007 and fell much below the year’s average by the end of the year.
Prices for Canadian natural gas in 2008 were higher than in the previous year. The average of 30-day spot prices for natural gas in Alberta was about $8.61 a thousand cubic feet in 2008, compared with $7.01 in 2007. The company’s average realizations on natural gas sales were $8.69 a thousand cubic feet, compared with $6.95 in 2007.
| Crude oil and NGLs - production and sales (a) |
||||||||||||
|
thousands of barrels a day |
2009 | 2008 | 2007 | |||||||||
| gross | net | gross | net | gross | net | |||||||
| Cold Lake |
141 | 120 | 147 | 124 | 154 | 130 | ||||||
| Syncrude |
70 | 65 | 72 | 62 | 76 | 65 | ||||||
| Conventional crude oil |
25 | 20 | 27 | 19 | 29 | 21 | ||||||
| Total crude oil production |
236 | 205 | 246 | 205 | 259 | 216 | ||||||
| NGLs available for sale |
8 | 6 | 10 | 8 | 16 | 12 | ||||||
| Total crude oil and NGL production |
244 | 211 | 256 | 213 | 275 | 228 | ||||||
| Cold Lake sales, including diluent (b) |
184 | 191 | 200 | |||||||||
| NGL sales |
10 | 11 | 20 | |||||||||
66
Table of Contents
Management’s discussion and analysis of financial condition and results of operations (continued)
| Natural gas - production and sales (a) |
||||||||||||
|
millions of cubic feet a day |
2009 | 2008 | 2007 | |||||||||
| gross | net | gross | net | gross | net | |||||||
| Production (c) |
295 | 274 | 310 | 249 | 458 | 404 | ||||||
| Sales |
272 | 288 | 407 | |||||||||
| a) | Daily volumes are calculated by dividing total volumes for the year by the number of days in the year. Gross production is the company’s share of production (excluding purchases) before deducting the share of mineral owners or governments or both. Net production excludes those shares. |
| b) | Diluent is natural gas condensate or other light hydrocarbons added to Cold Lake bitumen to facilitate transportation to market by pipeline. |
| c) | Production of natural gas includes amounts used for internal consumption with the exception of the amounts reinjected. |
2009
Gross production of bitumen at the company’s wholly owned facilities at Cold Lake was 141,000 barrels a day this year, about 6,000 barrels a day lower than 2008. Lower production volumes in 2009 were due to the cyclic nature of production at Cold Lake and well repairs in the northern part of the field. Drilling and steaming activities have since resumed in this area, and production is expected to return to normal levels.
The company’s share of Syncrude’s gross production of synthetic crude oil was 70,000 barrels a day, a decrease of 2,000 barrels a day from 2008. Planned maintenance activities in the first half of 2009, which included design modifications to improve long-term operational performance, contributed to the reduced production in the year.
Gross production of conventional crude oil decreased to 25,000 barrels a day in 2009, down 2,000 barrels a day from 2008 as a result of natural decline in Western Canadian reservoirs.
Gross production of natural gas was 295 million cubic feet a day, down from 310 million cubic feet in 2008. The lower production volume was primarily a result of natural reservoir decline.
2008
Gross production of bitumen at the company’s wholly owned facilities at Cold Lake was 147,000 barrels a day, compared with 154,000 barrels in 2007. Lower production was due to the cyclic nature of production at Cold Lake.
The company’s share of Syncrude’s gross production of synthetic crude oil was 72,000 barrels a day versus 76,000 barrels in 2007. Lower volumes were primarily the result of planned and unplanned maintenance activities during the year, including work to improve reliability performance.
Gross production of conventional oil decreased to 27,000 barrels a day from 29,000 barrels in 2007 as a result of natural decline in Western Canadian reservoirs.
Gross production of natural gas decreased to 310 million cubic feet a day from 458 million in 2007. The most significant reason for the lower production volumes was the completion of production, as expected, from the Wizard Lake gas cap blowdown.
Gross production of NGLs available for sale averaged 10,000 barrels a day in 2008, down from 16,000 barrels in 2007, mainly due to the completion of production from Wizard Lake.
Downstream
| millions of dollars |
2009 | 2008 | 2007 | |||
| Net income |
278 | 796 | 921 |
2009
Net income was $278 million in 2009, $518 million lower than 2008. Earnings in 2008 included a gain of $187 million from the sale of Rainbow Pipe Line Co. Ltd. Also impacting earnings in 2009 were lower overall margins of about $270 million and lower sales volumes of about $70 million due to the slowdown in the economy. These factors were partially offset by the favourable impact of a weaker Canadian dollar of about $40 million.
67
Table of Contents
Management’s discussion and analysis of financial condition and results of operations (continued)
2008
Net income was $796 million, compared with $921 million in 2007. Earnings decreased primarily due to lower overall downstream margins and unfavourable inventory effects totaling about $230 million. Earnings were also lower due to higher planned maintenance costs of about $40 million and lower sales volumes of about $40 million. These factors were partially offset by a gain of $187 million from the sale of the company’s equity investment in Rainbow Pipe Line Co. Ltd. Industry refining margins were lower in 2008, compared with those in 2007, reflecting weakening demand and higher inventory levels. Marketing margins in 2008 were higher than those in 2007.
| Refinery utilization |
||||||
| thousands of barrels a day (a) |
2009 | 2008 | 2007 | |||
| Total refinery throughput (b) |
413 | 446 | 442 | |||
| Refinery capacity at December 31 |
502 | 502 | 502 | |||
| Utilization of total refinery capacity (percent) |
82 | 89 | 88 | |||
| Sales thousands of barrels a day (a) |
2009 | 2008 | 2007 | |||
| Gasolines |
200 | 204 | 208 | |||
| Heating, diesel and jet fuels |
143 | 157 | 164 | |||
| Heavy fuel oils |
27 | 30 | 33 | |||
| Lube oils and other products |
39 | 47 | 43 | |||
| Net petroleum product sales |
409 | 438 | 448 | |||
| Total domestic sales of petroleum products (percent) |
90.3 | 93.0 | 94.8 | |||
| a) | Volumes a day are calculated by dividing total volumes for the year by the number of days in the year. |
| b) | Crude oil and feedstocks sent directly to atmospheric distillation units. |
2009
Total refinery throughput was 413,000 barrels a day, down from 2008, and average refinery capacity utilization was 82 percent. Production gains from operating and reliability improvements through the year were offset by the impact of declining economic conditions that did not support running the refineries to full capacity, and also resulted in lower net petroleum product sales of 409,000 barrels a day.
2008
Refinery throughput was 89 percent of capacity in 2008, one percent higher than the previous year. Reliability improvements through the year were partially offset by the impact of declining economic conditions that did not support running the refineries to full capacity. Lower net petroleum product sales were due mainly to lower industry demand.
Chemical
| millions of dollars |
2009 | 2008 | 2007 | |||
| Net income |
46 | 100 | 97 | |||
| Sales thousands of tonnes a day (a) |
2009 | 2008 | 2007 | |||
| Polymers and basic chemicals |
2.1 | 2.1 | 2.2 | |||
| Intermediate and others |
0.7 | 0.7 | 0.9 | |||
| Total petrochemical sales |
2.8 | 2.8 | 3.1 | |||
| a) | Calculated by dividing total volumes for the year by the number of days in the year. |
68
Table of Contents
Management’s discussion and analysis of financial condition and results of operations (continued)
2009
Net income was $46 million, $54 million lower than 2008. Earnings were negatively impacted by lower overall margins as a result of the slow economy. Sales volumes of chemical products continued to be impacted by weak industry demand.
2008
Net income was $100 million, compared with $97 million in 2007. Higher margins for polyethylene products were essentially offset by lower margins for intermediate products and lower sales volumes for both polyethylene and intermediate products.
Corporate and other
| millions of dollars |
2009 | 2008 | 2007 | |||
| Net income |
(69) | 59 | (199) |
2009
Net income effects were negative $69 million, versus $59 million in 2008. Unfavourable effects in 2009 were primarily due to changes in share-based compensation charges and lower interest income from lower yields on cash balances.
2008
Net income effects were $59 million, versus negative $199 million last year. Favourable effects were primarily due to lower share-based compensation charges and the absence of unfavourable effects of tax rate changes reported in 2007.
Liquidity and capital resources
| Sources and uses of cash |
||||||
| millions of dollars |
2009 | 2008 | 2007 | |||
| Cash provided by / (used in ) |
||||||
| Operating activities |
1,591 | 4,263 | 3,626 | |||
| Investing activities |
(2,216) | (961) | (620) | |||
| Financing activities |
(836) | (2,536) | (3,956) | |||
| Increase/(decrease) in cash and cash equivalents |
(1,461) | 766 | (950) | |||
| Cash and cash equivalents at end of year |
513 | 1,974 | 1,208 | |||
Although the company issues long-term debt from time to time and maintains a revolving commercial paper program, internally generated funds normally cover the majority of its financial requirements. The management of cash that may be temporarily available as surplus to the company’s immediate needs is carefully controlled to ensure that it is secure and readily available to meet the company’s cash requirements and to optimize returns on cash balances.
Cash flows from operating activities are highly dependent on crude oil and natural gas prices and product margins. In addition, to support cash flows in future periods, the company will need to continually find and develop new resources, and continue to develop and apply new technologies to existing fields, in order to maintain or increase production. Projects are in place or underway to increase production capacity. However, these volume increases are subject to a variety of risks, including project execution, operational outages, reservoir performance and regulatory changes.
The company’s financial strength enables it to make large, long-term capital expenditures. Imperial’s portfolio of development opportunities and the complementary nature of its business segments help mitigate the overall risks of the company and associated cash flow. Further, due to its financial strength, debt capacity and portfolio of opportunities, the risk associated with failure or delay of any single project would not have a significant impact on the company’s liquidity or ability to generate sufficient cash flows for its operations and fixed commitments.
69
Table of Contents
Management’s discussion and analysis of financial condition and results of operations (continued)
The company’s registered pension plan is subject to an independent actuarial valuation that is required at least once every three years. The next such valuation will be completed in 2010 and could require that Imperial increase its contributions to the plan over the next five years. The company expects that it will meet these funding requirements without affecting current or future investment plans.
Cash flow from operating activities
2009
Cash provided by operating activities was $1,591 million, a decrease of $2,672 million from 2008. Lower cash flow was primarily due to lower net income and timing of scheduled income tax payments.
2008
Cash provided by operating activities was $4,263 million, versus $3,626 million in 2007. Higher cash flow in 2008 was primarily due to higher net income.
Cash flow from investing activities
2009
Investing activities used net cash of $2,216 million in 2009, an increase of $1,255 million from 2008. Additions to property, plant and equipment were $2,285 million, compared with $1,231 million last year. Proceeds from asset sales were $67 million in 2009, compared with $272 million in 2008. The 2008 results included proceeds from the sale of the Rainbow pipeline.
2008
Cash used in investing activities totaled $961 million in 2008, compared with $620 million in 2007. Higher spending on property, plant and equipment contributed to the increase.
Cash flow from financing activities
2009
Cash used in financing activities was $836 million in 2009, $1,700 million lower than in 2008.
During 2009, share repurchases were reduced to about 12 million shares for $492 million, including shares purchased from ExxonMobil, compared to about 44 million shares purchased in 2008 for $2,210 million. Imperial did not make any significant share repurchases after the second quarter of 2009, as cash flow from operations was used to fund growth projects such as Kearl. The company will continue to evaluate its share-purchase program in the context of its overall capital activities.
In the third quarter, the company entered into a floating rate loan agreement with an affiliated company of Exxon Mobil Corporation that provides for borrowings of up to $5 billion (Canadian) at interest equivalent to Canadian market rates. This facility will enable Imperial to efficiently access funds as necessary in the future. The company has not drawn on this agreement.
The company paid dividends totaling 40 cents a share in 2009, up from 37 cents in 2008.
Total debt outstanding at the end of 2009, excluding the company’s share of equity company debt, was $140 million, compared with $143 million at the end of 2008.
2008
Cash used in financing activities was $2,536 million in 2008, compared with $3,956 million in 2007.
In June 2008, another 12-month share repurchase program was implemented. During 2008, the company purchased 44.3 million shares for $2,210 million, including shares purchased from ExxonMobil. Shares outstanding were reduced by five percent from 903 million at the end of 2007 to 859 million at the end of 2008.
The company paid dividends totaling 37 cents a share in 2008, up from 34 cents in 2007.
Total debt outstanding at the end of 2008, excluding the company’s share of equity company debt, was $143 million, compared with $146 million at the end of 2007.
70
Table of Contents
Management’s discussion and analysis of financial condition and results of operations (continued)
| Financial percentages, ratios and credit rating |
||||||
| 2009 | 2008 | 2007 | ||||
| Total debt as a percentage of capital (a) |
2 | 2 | 2 | |||
| Interest coverage ratio – earnings basis (b) |
276 | 481 | 67 |
| a) | Current and long-term debt (page 80) and the company’s share of equity company debt, divided by debt and shareholders’ equity (page 80). |
| b) | Net income (page 79), debt-related interest before capitalization, including the company’s share of equity company interest, and income taxes (page 79), divided by debt-related interest before capitalization, including the company’s share of equity company interest. |
Debt represented two percent of the company’s capital structure at the end of 2009, unchanged from the end of 2008.
Debt-related interest incurred in 2009, before capitalization of interest, was $5 million, compared with $8 million in 2008. The average effective interest rate on the company’s debt was 3.3 percent in 2009, compared with 5.5 percent in 2008.
The company’s financial strength, as evidenced by the above financial ratios, represents a competitive advantage of strategic importance. The company’s sound financial position gives it the opportunity to access capital markets in the full range of market conditions and enables the company to take on large, long-term capital commitments in the pursuit of maximizing shareholder value.
Commitments
The following table shows the company’s commitments outstanding at December 31, 2009. It combines data from the consolidated balance sheet and from individual notes to the consolidated financial statements.
| Financial statement note reference |
Payment due by period | |||||||||
| millions of dollars | 2010 | 2011 to 2014 |
2015 and beyond |
Total Amount | ||||||
| Capitalized lease obligations (a) |
Note 14 | 4 | 15 | 15 | 34 | |||||
| Operating leases (b) |
Note 14 | 72 | 229 | 114 | 415 | |||||
| Unconditional purchase obligations (c) |
Note 10 | 55 | 159 | 192 | 406 | |||||
| Firm capital commitments (d) |
1,294 | 598 | – | 1,892 | ||||||
| Pension and other post-retirement obligations (e) |
Note 5 | 479 | 199 | 1,051 | 1,729 | |||||
| Asset retirement obligations (f) |
Note 6 | 72 | 421 | 317 | 810 | |||||
| Other long-term purchase agreements (g) |
213 | 541 | 1,267 | 2,021 | ||||||
| a) | Capital leaseobligations primarily relate to the capital lease for marine services. | |||
| b) | Minimum commitments for operating leases, shown on an undiscounted basis, primarily cover office buildings, rail cars and service stations. | |||
| c) | Unconditional purchase obligations are those long-term commitments that are non-cancelable and that third parties have used to secure financing for the facilities that will provide the contracted goods and services. They mainly pertain to pipeline throughput agreements. | |||
| d) | Firm capital commitments related to capital projects, shown on an undiscounted basis. The largest commitments outstanding at year-end 2009 were $1,498 million associated with the company’s share of the Kearl project. | |||
| e) | The amount by which the benefit obligations exceeded the fair value of fund assets for pension and other post-retirement plans at year-end. The payments by period include expected contributions to funded pension plans in 2010 and estimated benefit payments for unfunded plans in all years. | |||
| f) | Asset retirement obligations represent the fair value of legal obligations associated with site restoration on the retirement of assets with determinable useful lives. | |||
| g) | Other long-term purchase agreements are non-cancelable, long-term commitments other than unconditional purchase obligations. They include primarily raw material supply and transportation services agreements. | |||
| Unrecognized tax benefits totaling $165 million have not been included in the company’s commitments table because the company does not expect there will be any cash impact from the final settlements as sufficient funds have been deposited with the Canada Revenue Agency. Further details on the unrecognized tax benefits can be found in note 4 to the financial statements on page 90. | ||||
71
Table of Contents
Management’s discussion and analysis of financial condition and results of operations (continued)
Litigation and other contingencies
As discussed in note 10 to the consolidated financial statements on page 100, a variety of claims have been made against Imperial Oil Limited and its subsidiaries. Based on a consideration of all relevant facts and circumstances, the company does not believe the ultimate outcome of any currently pending lawsuits against the company will have a material adverse effect on the company’s operations or financial condition.
Capital and exploration expenditures
| millions of dollars | 2009 | 2008 | ||
| Upstream (a) |
2,167 | 1,110 | ||
| Downstream |
251 | 232 | ||
| Chemical |
15 | 13 | ||
| Other |
5 | 8 | ||
| Total |
2,438 | 1,363 |
| a) | Exploration expenses included. |
Total capital and exploration expenditures were $2,438 million in 2009, an increase of $1,075 million from 2008.
The funds were used mainly to advance the Kearl oil sands project, maintain Cold Lake production capacity, advance other major Upstream projects and invest in environmental initiatives. About $360 million was spent on projects related to reducing the environmental impact of the company’s operations and improving safety.
For the Upstream segment, capital expenditures were $2,167 million, compared with $1,110 million in 2008. Expenditures were primarily for advancing the Kearl oil sands project. Other Upstream investments included development drilling at Cold Lake, facilities improvements at Syncrude, exploration drilling at Horn River, unproved acreage acquisitions and development drilling at conventional fields in Western Canada.
The company had spent about $1,500 million on the Kearl project by the end of 2009. In 2009, pipeline transportation agreements were concluded and infrastructure construction continued. More than half of the detailed engineering work was completed.
Planned capital and exploration expenditures in the Upstream segment are about $2.9 billion in 2010. Investments are mainly planned for the Kearl oil sands project. Other investments will include development drilling at Cold Lake, facilities improvements at Syncrude and development drilling at conventional oil and gas operations in Western Canada.
For the Downstream segment, capital expenditures were $251 million in 2009, compared with $232 million in 2008. In 2009, Downstream capital expenditures focused mainly on refinery projects to reduce sulphur dioxide emissions, upgrade water management systems as well as enhance feedstock flexibility and improve energy efficiency.
Planned capital expenditures for the Downstream segment in 2010 are about $290 million. Refining investments will be focused on reliability, feedstock flexibility, air quality and water management system upgrades and energy efficiency initiatives. Capital investment in the retail chain will continue, including further advancement of the new point-of-sale payment system.
Of the capital expenditures for the Chemical segment in 2009, the major investment was directed to increasing feedstock flexibility and further upgrades to water management and safety systems.
Planned capital expenditures for Chemical in 2010 are about $20 million and will include completion of the feedstock flexibility project and continued investment in energy efficiency initiatives and water management and safety enhancements.
Total capital and exploration expenditures for the company in 2010 are expected to total about $3.2 billion.
72
Table of Contents
Management’s discussion and analysis of financial condition and results of operations (continued)
Market risks and other uncertainties
Crude oil, natural gas, petroleum product and chemical prices have fluctuated in response to changing market forces. The impacts of these price fluctuations on earnings from Upstream, Downstream and Chemical operations have varied. In addition, industry crude oil and natural gas commodity prices and petroleum and chemical product prices are commonly benchmarked in U.S. dollars. The majority of Imperial’s sales and purchases are related to these industry U.S. dollar benchmarks. As the company records and reports its financial results in Canadian dollars, to the extent that the Canadian/U.S. dollar exchange rate fluctuates, the company’s earnings will be affected. The company’s potential exposure to commodity price and margin and Canadian/U.S. dollar exchange rate fluctuations is summarized in the earnings sensitivities table below, which shows the estimated annual effect, under current conditions, of the company’s after-tax net income.
| Earnings sensitivities (a) |
||||
| millions of dollars after tax |
||||
| Seven dollars (U.S.) a barrel change in crude oil prices |
+(-) | 260 | ||
| Fifty cents a thousand cubic feet change in natural gas prices |
+(-) | 4 | ||
| One dollar (U.S.) a barrel change in sales margins for total petroleum products |
+(-) | 130 | ||
| One cent (U.S.) a pound change in sales margins for polyethylene |
+(-) | 6 | ||
| Ten cents decrease (increase) in the value of the Canadian dollar versus the U.S. dollar |
+(-) | 400 |
| a) | The amount quoted to illustrate the impact of each sensitivity represents a change of about 10 percent in the value of the commodity or rate in question at the end of 2009. Each sensitivity calculation shows the impact on net income that results from a change in one factor, after tax and royalties and holding all other factors constant. While these sensitivities are applicable under current conditions, they may not apply proportionately to larger fluctuations. |
The sensitivity to changes in crude oil prices decreased from 2008 year-end by about $13 million (after tax) for each one U.S.-dollar difference. An increase in the value of the Canadian dollar has lessened the impact of U.S. dollar denominated crude oil prices on the company’s revenues and earnings.
The global energy markets can give rise to extended periods in which market conditions are adverse to one or more of the company’s businesses. Such conditions, along with the capital-intensive nature of the industry and very long lead times associated with many of our projects, underscore the importance of maintaining a strong financial position. Management views the company’s financial strength as a competitive advantage.
In general, segment results are not dependent on the ability to sell and/or purchase products to/from other segments. Instead, where such sales take place, they are the result of efficiencies and competitive advantages of integrated refinery/chemical complexes. Additionally, intersegment sales are at market-based prices. The products bought and sold between segments can also be acquired in worldwide markets that have substantial liquidity, capacity and transportation capabilities. About 60 percent of the company’s intersegment sales are crude oil produced by the Upstream and sold to the Downstream. Other intersegment sales include those between refineries and chemical plants related to raw materials, feedstocks and finished products.
Although price levels of crude oil and natural gas may rise or fall significantly over the short to medium term, industry economics over the long-term will continue to be driven by market supply and demand. Accordingly, the company tests the viability of all of its investments over a broad range of future prices. The company’s assessment is that its operations will continue to be successful in a variety of market conditions. This is the outcome of disciplined investment and asset management programs. Investment opportunities are tested against a variety of market conditions, including low-price scenarios.
The company has an active asset management program in which underperforming assets are either improved to acceptable levels or considered for divestment. The asset management program includes a disciplined, regular review to ensure that all assets are contributing to the company’s strategic objectives. The result is an efficient capital base, and the company has seldom had to write down the carrying value of assets, even during periods of low commodity prices.
73
Table of Contents
Management’s discussion and analysis of financial condition and results of operations (continued)
Risk management
The company’s size, strong capital structure and the complementary nature of the Upstream, Downstream and Chemical businesses reduce the company’s enterprise-wide risk from changes in commodity prices and currency rates. As well, the company progresses large capital projects in a phased manner so that adjustments can be made when significant changes in market conditions occur. As a result, the company does not make use of derivative instruments to mitigate the impact of such changes. The company does not engage in speculative derivative activities or derivative trading activities nor does it use derivatives with leveraged features. The company maintains a system of controls that includes the authorization, reporting and monitoring of derivative activity.
Recently issued statements of financial accounting standards
Variable-interest entities
In 2009, the U.S. Financial Accounting Standards Board (FASB) issued an accounting standard for variable-interest entities (VIEs), which became effective January 1, 2010. The standard requires the enterprise to qualitatively assess if it is the primary beneficiary of the VIE and, if so, the VIE must be consolidated. The company does not expect the adoption of this standard to have a material impact on the company’s financial statements.
The company’s financial statements have been prepared in accordance with United States generally accepted accounting principles (GAAP) and include estimates that reflect management’s best judgment. The company’s accounting and financial reporting fairly reflect its straightforward business model. Imperial does not use financing structures for the purpose of altering accounting outcomes or removing debt from the balance sheet. The following summary provides further information about the critical accounting policies and the estimates that are made by the company to apply those policies. It should be read in conjunction with note 1 to the consolidated financial statements on page 83.
Oil and gas reserves
Evaluations of oil and gas reserves are important to the effective management of upstream assets. They are integral to making investment decisions about oil and gas properties such as whether development should proceed.
Oil and gas reserve quantities are also used as the basis for calculating unit-of-production depreciation rates and for evaluating impairment. Proved oil and gas reserve estimates are based on geological and engineering data, which have demonstrated with reasonable certainty that these reserves are economically producible in future years from known reservoirs under existing economic and operating conditions, operating methods and government regulations.
The estimation of proved reserves is controlled by the company through long-standing approval guidelines. Reserve changes are made within a well-established, disciplined process driven by senior-level geoscience and engineering professionals, culminating in reviews with and approval by senior management and the company’s board of directors. Notably, the company does not use specific quantitative reserve targets to determine compensation. Key features of the estimation include a rigorous peer review, technical evaluations, analysis of well and field performance information and a requirement that management make significant funding commitments toward the development of the reserves prior to reporting as proved.
Although the company is reasonably certain that proved reserves will be produced, the timing and amount recovered can be affected by a number of factors, including completion of development projects, reservoir performance, regulatory approvals and significant changes in long-term oil and gas price levels.
Revisions can include upward or downward changes in previously estimated volumes of proved reserves for existing fields due to the evaluation or revaluation of already available geologic, reservoir or production data; new geologic, reservoir or production data; or changes in prices and costs that are used in the estimation of reserves. This category can also include significant changes in either development strategy or production equipment/facility capacity.
74
Table of Contents
Management’s discussion and analysis of financial condition and results of operations (continued)
The company uses the successful-efforts method to account for its exploration and production activities. Under this method, costs are accumulated on a field-by-field basis with certain exploratory expenditures and exploratory dry holes being expensed as incurred. Costs of productive wells and development dry holes are capitalized and amortized using the unit-of-production method. The company uses this accounting policy instead of the full-cost method because it provides a more timely accounting of the success or failure of the company’s exploration and production activities.
Impact of reserves on depreciation
The calculation of unit-of-production depreciation is a critical accounting estimate that measures the depreciation of upstream assets. It is the ratio of actual volumes produced to total proved developed reserves (those reserves recoverable through existing wells with existing equipment and operating methods) applied to the asset cost. The volumes produced and asset cost are known and, while proved developed reserves have a high probability of recoverability, they are based on estimates that are subject to some variability. While the revisions the company has made in the past are an indicator of variability, they have had little impact on the unit-of-production rates of depreciation.
Impact of reserves and prices on testing for impairment
Proved oil and gas properties held and used by the company are reviewed for impairment whenever events or circumstances indicate that the carrying amounts may not be recoverable. Assets are grouped at the lowest level for which there are identifiable cash flows that are largely independent of the cash flows of other groups of assets.
The company estimates the future undiscounted cash flows of the affected properties to judge the recoverability of carrying amounts. In general, impairment analyses are based on proved reserves. Where probable reserves exist, an appropriately risk-adjusted amount of these reserves may be included in the impairment evaluation. An asset would be impaired if the undiscounted cash flows were less than its carrying value. Impairments are measured by the amount by which the asset’s carrying value exceeds its fair value.
The company performs asset valuation analyses on an ongoing basis as a part of its asset management program. These analyses monitor the performance of assets against corporate objectives. They also assist the company in assessing whether the carrying amounts of any of its assets may not be recoverable. In addition to estimating oil and gas reserve volumes in conducting these analyses, it is also necessary to estimate future oil and gas prices. Trigger events for impairment evaluations include a significant decrease in current and projected prices or reserve volumes, an accumulation of project costs significantly in excess of the amount originally expected and historical and forecast operating losses.
In general, the company does not view temporarily low oil prices as a triggering event for conducting impairment tests. The markets for crude oil and natural gas have a history of significant price volatility. Although prices will occasionally drop significantly, the relative growth/decline in supply versus demand will determine industry prices over the long-term, and these cannot be accurately predicted. Accordingly, any impairment tests that the company performs make use of the company’s price assumptions developed in the annual planning and budgeting process for crude oil and natural gas markets, petroleum products and chemicals. These are the same price assumptions that are used for capital investment decisions. Volumes are based on individual field production profiles, which are also updated annually.
Supplemental information regarding oil and gas results of operations, capitalized costs and reserves is provided following the notes to the consolidated financial statements. Future prices used for any impairment tests will vary from the one used in the supplemental oil and gas disclosure and could be lower or higher for any given year.
75
Table of Contents
Management’s discussion and analysis of financial condition and results of operations (continued)
Pension benefits
The company’s pension plan is managed in compliance with the requirements of governmental authorities and meets funding levels as determined by independent third-party actuaries. Pension accounting requires explicit assumptions regarding, among others, the discount rate for the benefit obligations, the expected rate of return on plan assets and the long-term rate of future compensation increases. All pension assumptions are reviewed annually by senior management. These assumptions are adjusted only as appropriate to reflect long-term changes in market rates and outlook. The long-term expected rate of return on plan assets of 8.00 percent used in 2009 compares to actual returns of 5.1 percent and 8.4 percent achieved over the last 10- and 20-year periods ending December 31, 2009. If different assumptions are used, the expense and obligations could increase or decrease as a result. The company’s potential exposure to changes in assumptions is summarized in note 5 to the consolidated financial statements on page 91. At Imperial, differences between actual returns on plan assets and the long-term expected returns are not recorded in pension expense in the year the differences occur. Such differences are deferred, along with other actuarial gains and losses, and are amortized into pension expense over the expected remaining service life of employees. Employee benefit expense represented less than two percent of total expenses in 2009.
Asset retirement obligations and other environmental liabilities
Legal obligations associated with site restoration on the retirement of assets with determinable useful lives are recognized when they are incurred, which is typically at the time the assets are installed. The obligations are initially measured at fair value and discounted to present value. Over time, the discounted asset retirement obligation amount will be accreted for the change in its present value, with this effect included in operating expense. As payments to settle the obligations occur on an ongoing basis and will continue over the lives of the operating assets, which can exceed 25 years, the discount rate will be adjusted only as appropriate to reflect long-term changes in market rates and outlook. For 2009, the obligations were discounted at six percent and the accretion expense was $42 million, before tax, which was significantly less than one percent of total expenses in the year. There would be no material impact on the company’s reported financial results if a different discount rate had been used.
Asset retirement obligations are not recognized for assets with an indeterminate useful life. Asset retirement obligations for these facilities generally become firm at the time the facilities are permanently shut down and dismantled. These obligations may include the costs of asset disposal and additional soil remediation. However, these sites have indeterminate lives based on plans for continued operations, and as such, the fair value of the conditional legal obligations cannot be measured, since it is impossible to estimate the future settlement dates of such obligations. For these and non-operating assets, the company accrues provisions for environmental liabilities when it is probable that obligations have been incurred and the amount can be reasonably estimated.
Asset retirement obligations and other environmental liabilities are based on engineering estimated costs, taking into account the anticipated method and extent of remediation consistent with legal requirements, current technology and the possible use of the location. Since these estimates are specific to the locations involved, there are many individual assumptions underlying the company’s total asset retirement obligations and provision for other environmental liabilities. While these individual assumptions can be subject to change, none of them is individually significant to the company’s reported financial results.
Tax contingencies
The operations of the company are complex, and related tax interpretations, regulations and legislation are continually changing. Significant management judgment is required in the accounting for income tax contingencies and tax disputes because the outcomes are often difficult to predict.
GAAP requires recognition and measurement of uncertain tax positions that the company has taken or expects to take in its income tax returns. The benefit of an uncertain tax position can only be recognized in the financial statements if management concludes that it is more likely than not that the position will be sustained with the tax authorities. For a position that is likely to be sustained, the benefit recognized in the financial statements is measured at the largest amount that is greater than 50 percent likely of being realized. A reserve is established for the difference between a position taken in an income tax return and the amount recognized in the financial statements. The company’s unrecognized tax benefits and a description of open tax years are summarized in note 4 to the consolidated financial statements on page 90.
76
Table of Contents
Management’s report on internal control over financial reporting
Management, including the company’s chief executive officer and principal accounting officer and principal financial officer, is responsible for establishing and maintaining adequate internal control over the company’s financial reporting. Management conducted an evaluation of the effectiveness of internal control over financial reporting based on the Internal Control - Integrated Framework issued by the Committee of Sponsoring Organizations of the Treadway Commission. Based on this evaluation, management concluded that Imperial Oil Limited’s internal control over financial reporting was effective as of December 31, 2009.
PricewaterhouseCoopers LLP, an independent registered public accounting firm, audited the effectiveness of the company’s internal control over financial reporting as of December 31, 2009, as stated in their report which is included herein.
/s/ Bruce H. March
B.H. March
Chairman, president and
chief executive officer
/s/ Paul A. Smith
P.A. Smith
Senior vice-president,
finance and administration, and treasurer
(Principal accounting officer and principal financial officer)
February 26, 2010
77
Table of Contents
To the Shareholders of Imperial Oil Limited
We have completed integrated audits of Imperial Oil Limited’s 2009, 2008 and 2007 consolidated financial statements and of its internal control over financial reporting as of December 31, 2009. Our opinions, based on our audits, are presented below.
Consolidated financial statements
In our opinion, the accompanying consolidated financial statements in the Form 10-K present fairly, in all material respects, the financial position of Imperial Oil Limited and its subsidiaries at December 31, 2009 and December 31, 2008, and the results of their operations and their cash flows for each of the years in the three year period ended December 31, 2009 in conformity with accounting principles generally accepted in the United States of America. These financial statements are the responsibility of the Company’s management. Our responsibility is to express an opinion on these financial statements based on our audits. We conducted our audits of these statements in accordance with the standards of the Public Company Accounting Oversight Board (United States). Those standards require that we plan and perform the audit to obtain reasonable assurance about whether the financial statements are free of material misstatement. An audit of financial statements includes examining, on a test basis, evidence supporting the amounts and disclosures in the financial statements, assessing the accounting principles used and significant estimates made by management, and evaluating the overall financial statement presentation. We believe that our audits provide a reasonable basis for our opinion.
Internal control over financial reporting
Also, in our opinion, the Company maintained, in all material respects, effective internal control over financial reporting as of December 31, 2009, based on criteria established in Internal Control - Integrated Framework issued by the Committee of Sponsoring Organizations of the Treadway Commission (COSO). The Company’s management is responsible for maintaining effective internal control over financial reporting and for its assessment of the effectiveness of internal control over financial reporting, included in the accompanying Management’s report on internal control over financial reporting. Our responsibility is to express an opinion on the effectiveness of the Company’s internal control over financial reporting based on our audit. We conducted our audit of internal control over financial reporting in accordance with the standards of the Public Company Accounting Oversight Board (United States). Those standards require that we plan and perform the audit to obtain reasonable assurance about whether effective internal control over financial reporting was maintained in all material respects. An audit of internal control over financial reporting includes obtaining an understanding of internal control over financial reporting, assessing the risk that a material weakness exists, testing and evaluating the design and operating effectiveness of internal control based on the assessed risk, and performing such other procedures as we consider necessary in the circumstances. We believe that our audit provides a reasonable basis for our opinion.
A company’s internal control over financial reporting is a process designed to provide reasonable assurance regarding the reliability of financial reporting and the preparation of financial statements for external purposes in accordance with generally accepted accounting principles. A company’s internal control over financial reporting includes those policies and procedures that (i) pertain to the maintenance of records that, in reasonable detail, accurately and fairly reflect the transactions and dispositions of the assets of the company; (ii) provide reasonable assurance that transactions are recorded as necessary to permit preparation of financial statements in accordance with generally accepted accounting principles, and that receipts and expenditures of the company are being made only in accordance with authorizations of management and directors of the company; and (iii) provide reasonable assurance regarding prevention or timely detection of unauthorized acquisition, use, or disposition of the company’s assets that could have a material effect on the financial statements.
Because of its inherent limitations, internal control over financial reporting may not prevent or detect misstatements. Also, projections of any evaluation of effectiveness to future periods are subject to the risk that controls may become inadequate because of changes in conditions, or that the degree of compliance with the policies or procedures may deteriorate.
/s/ PricewaterhouseCoopers LLP
Chartered Accountants
Calgary, Alberta, Canada
February 26, 2010
78
Table of Contents
Consolidated statement of income (U.S. GAAP)
| millions of Canadian dollars | ||||||
| For the years ended December 31 | 2009 | 2008 | 2007 | |||
| Revenues and other income |
||||||
| Operating revenues (a)(b) |
21,292 | 31,240 | 25,069 | |||
| Investment and other income (note 9) |
106 | 339 | 374 | |||
| Total revenues and other income |
21,398 | 31,579 | 25,443 | |||
| Expenses |
||||||
| Exploration |
153 | 132 | 106 | |||
| Purchases of crude oil and products (c) |
11,934 | 18,865 | 14,026 | |||
| Production and manufacturing (d) |
3,951 | 4,228 | 3,474 | |||
| Selling and general |
1,106 | 1,038 | 1,335 | |||
| Federal excise tax (a) |
1,268 | 1,312 | 1,307 | |||
| Depreciation and depletion |
781 | 728 | 780 | |||
| Financing costs (note 13) |
5 | – | 36 | |||
| Total expenses |
19,198 | 26,303 | 21,064 | |||
| Income before income taxes |
2,200 | 5,276 | 4,379 | |||
| Income taxes (note 4) |
621 | 1,398 | 1,191 | |||
| Net income |
1,579 | 3,878 | 3,188 | |||
| Per-share information (Canadian dollars) |
||||||
| Net income per common share - basic (note 11) |
1.86 | 4.39 | 3.43 | |||
| Net income per common share - diluted (note 11) |
1.84 | 4.36 | 3.41 | |||
| Dividends |
0.40 | 0.38 | 0.35 | |||
| a) | Operating revenues include federal excise tax of $1,268 million (2008 - $1,312 million, 2007 - $1,307 million). | |||
| b) | Operating revenues include amounts from related parties of $1,699 million (2008 - $2,150 million, 2007 - $1,772 million), (note 15). | |||
| c) | Purchases of crude oil and products include amounts from related parties of $3,111 million (2008 - $4,729 million, 2007 - $3,331 million), (note 15). | |||
| d) | Production and manufacturing expenses include amounts to related parties of $217 million (2008 - $169 million, 2007 - $154 million), (note 15). | |||
| The information in the Notes to Consolidated Financial Statements is an integral part of these statements. | ||||
79
Table of Contents
Consolidated balance sheet (U.S. GAAP)
| millions of Canadian dollars | ||||
| At December 31 | 2009 | 2008 | ||
| Assets |
||||
| Current Assets |
||||
| Cash |
513 | 1,974 | ||
| Accounts receivable, less estimated doubtful amounts |
1,714 | 1,455 | ||
| Inventories of crude oil and products (note 12) |
564 | 673 | ||
| Materials, supplies and prepaid expenses |
247 | 180 | ||
| Deferred income tax assets (note 4) |
467 | 361 | ||
| Total current assets |
3,505 | 4,643 | ||
| Long-term receivables, investments and other long-term assets |
854 | 881 | ||
| Property, plant and equipment, |
12,852 | 11,248 | ||
| Goodwill (note 3) |
204 | 204 | ||
| Other intangible assets, net |
58 | 59 | ||
| Total assets (note 3) |
17,473 | 17,035 | ||
| Liabilities |
||||
| Current liabilities |
||||
| Notes and loans payable (note 13) |
109 | 109 | ||
| Accounts payable and accrued liabilities (a) |
2,811 | 2,586 | ||
| Income taxes payable |
848 | 1,498 | ||
| Total current liabilities |
3,768 | 4,193 | ||
| Capitalized lease obligations (note 14) |
31 | 34 | ||
| Other long-term obligations (note 6) |
2,839 | 2,254 | ||
| Deferred income tax liabilities (note 4) |
1,396 | 1,489 | ||
| Total liabilities |
8,034 | 7,970 | ||
| Commitments and contingent liabilities (note 10) |
||||
| Shareholders’ equity |
||||
| Common shares at stated value (note 11)(b) |
1,508 | 1,528 | ||
| Earnings reinvested |
9,252 | 8,484 | ||
| Accumulated other comprehensive income |
(1,321) | (947) | ||
| Total shareholders’ equity |
9,439 | 9,065 | ||
| Total liabilities and shareholders’ equity |
17,473 | 17,035 | ||
| a | ) | Accounts payable and accrued liabilities include amounts to related parties of $59 million (2008 - $127 million), (note 15). | |||
| b | ) | Number of common shares outstanding was 848 million (2008 - 859 million), (note 11). | |||
| The information in the Notes to Consolidated Financial Statements is an integral part of these statements. | |||||
|
Approved by the directors
| ||||
| /s/ Bruce H. March |
/s/ Paul A. Smith | |||
| B.H. March |
P.A. Smith | |||
| Chairman, president and |
Senior vice-president, | |||
| chief executive officer |
finance and administration, and treasurer | |||
80
Table of Contents
Consolidated statement of shareholders’ equity (U.S. GAAP)
| millions of Canadian dollars | ||||||
| At December 31 |
2009 | 2008 | 2007 | |||
| Common shares at stated value (note 11) |
||||||
| At beginning of year |
1,528 | 1,600 | 1,677 | |||
| Issued under the stock option plan |
1 | 7 | 12 | |||
| Share purchases at stated value |
(21) | (79) | (89) | |||
| At end of year |
1,508 | 1,528 | 1,600 | |||
| Earnings reinvested |
||||||
| At beginning of year |
8,484 | 7,071 | 6,462 | |||
| Cumulative effect of accounting change (note 4) |
– | – | 14 | |||
| Net income for the year |
1,579 | 3,878 | 3,188 | |||
| Share purchases in excess of stated value |
(471) | (2,131) | (2,269) | |||
| Dividends |
(340) | (334) | (324) | |||
| At end of year |
9,252 | 8,484 | 7,071 | |||
| Accumulated other comprehensive income |
||||||
| At beginning of year |
(947) | (748) | (733) | |||
| Post-retirement benefits liability adjustment (note 5) |
(468) | (283) | (87) | |||
| Amortization of post-retirement benefits liability adjustment |
94 | 84 | 72 | |||
| At end of year |
(1,321) | (947) | (748) | |||
| Shareholders’ equity at end of year |
9,439 | 9,065 | 7,923 | |||
| Comprehensive income for the year |
||||||
| Net income for the year |
1,579 | 3,878 | 3,188 | |||
| Other comprehensive income |
||||||
| Post-retirement benefits liability adjustment |
(374) | (199) | (15) | |||
| Total comprehensive income for the year |
1,205 | 3,679 | 3,173 | |||
The information in the Notes to Consolidated Financial Statements is an integral part of these statements.
81
Table of Contents
Consolidated statement of cash flows (U.S. GAAP)
| millions of Canadian dollars | ||||||
| Inflow/(outflow) | ||||||
| For the years ended December 31 |
2009 | 2008 | 2007 | |||
| Operating activities |
||||||
| Net income |
1,579 | 3,878 | 3,188 | |||
| Adjustments for non-cash items: |
||||||
| Depreciation and depletion |
781 | 728 | 780 | |||
| (Gain)/loss on asset sales |
(45) | (241) | (215) | |||
| Deferred income taxes and other |
(61) | 387 | 75 | |||
| Changes in operating assets and liabilities: |
||||||
| Accounts receivable |
(261) | 679 | (261) | |||
| Inventories and prepaids |
42 | (159) | 13 | |||
| Income taxes payable |
(650) | – | (77) | |||
| Accounts payable |
271 | (798) | 250 | |||
| All other items - net (a) |
(65) | (211) | (127) | |||
| Cash from operating activities |
1,591 | 4,263 | 3,626 | |||
| Investing activities |
||||||
| Additions to property, plant and equipment and intangibles |
(2,285) | (1,231) | (899) | |||
| Proceeds from asset sales |
67 | 272 | 279 | |||
| Loans to equity company |
2 | (2) | – | |||
| Cash from (used in) investing activities |
(2,216) | (961) | (620) | |||
| Financing activities |
||||||
| Short-term debt - net |
– | – | (65) | |||
| Repayment of long-term debt |
– | – | (1,722) | |||
| Long-term debt issued |
– | – | 500 | |||
| Reduction in capitalized lease obligations |
(4) | (3) | (4) | |||
| Issuance of common shares under stock option plan |
1 | 7 | 12 | |||
| Common shares purchased (note 11) |
(492) | (2,210) | (2,358) | |||
| Dividends paid |
(341) | (330) | (319) | |||
| Cash from (used in) financing activities |
(836) | (2,536) | (3,956) | |||
| Increase (decrease) in cash |
(1,461) | 766 | (950) | |||
| Cash at beginning of year |
1,974 | 1,208 | 2,158 | |||
| Cash at end of year (b) |
513 | 1,974 | 1,208 | |||
| a) | Includes contribution to registered pension plans of $180 million (2008 - $165 million, 2007 - $163 million). |
| b) | Cash is composed of cash in bank and cash equivalents at cost. Cash equivalents are all highly liquid securities with maturity of three months or less when purchased. |
The information in the Notes to Consolidated Financial Statements is an integral part of these statements.
82
Table of Contents
Notes to consolidated financial statements
The accompanying consolidated financial statements and the supporting and supplemental material are the responsibility of the management of Imperial Oil Limited.
The company’s principal business is energy, involving the exploration, production, transportation and sale of crude oil and natural gas and the manufacture, transportation and sale of petroleum products. The company is also a major manufacturer and marketer of petrochemicals.
The consolidated financial statements have been prepared in accordance with generally accepted accounting principles in the United States of America. The financial statements include certain estimates that reflect management’s best judgment. Certain reclassifications to prior years have been made to conform to the 2009 presentation. All amounts are in Canadian dollars unless otherwise indicated.
1. Summary of significant accounting policies
Principles of consolidation
The consolidated financial statements include the accounts of Imperial Oil Limited and its subsidiaries. Intercompany accounts and transactions are eliminated. Subsidiaries include those companies in which Imperial has both an equity interest and the continuing ability to unilaterally determine strategic, operating, investing and financing policies. Significant subsidiaries included in the consolidated financial statements include Imperial Oil Resources Limited, Imperial Oil Resources N.W.T. Limited, Imperial Oil Resources Ventures Limited and McColl-Frontenac Petroleum Inc. All of the above companies are wholly owned. A significant portion of the company’s Upstream activities is conducted jointly with other companies. The accounts reflect the company’s share of undivided interest in such activities, including its 25 percent interest in the Syncrude joint venture and its nine percent interest in the Sable offshore energy project.
Inventories
Inventories are recorded at the lower of cost or current market value. The cost of crude oil and products is determined primarily using the last-in, first-out (LIFO) method. LIFO was selected over the alternative first-in, first-out and average cost methods because it provides a better matching of current costs with the revenues generated in the period.
Inventory costs include expenditures and other charges, including depreciation, directly or indirectly incurred in bringing the inventory to its existing condition and final storage prior to delivery to a customer. Selling and general expenses are reported as period costs and excluded from inventory costs.
Investments
The principal investments in companies other than subsidiaries are accounted for using the equity method. They are recorded at the original cost of the investment plus Imperial’s share of earnings since the investment was made, less dividends received. Imperial’s share of the after-tax earnings of these companies is included in “investment and other income” in the consolidated statement of income. Other investments are recorded at cost. Dividends from these other investments are included in “investment and other income.”
These investments represent interests in non-publicly traded pipeline companies that facilitate the sale and purchase of crude oil and natural gas in the conduct of company operations. Other parties who also have an equity interest in these companies share in the risks and rewards according to their percentage of ownership. Imperial does not invest in these companies in order to remove liabilities from its balance sheet.
83
Table of Contents
Notes to consolidated financial statements (continued)
Property, plant and equipment
Property, plant and equipment are recorded at cost. Investment tax credits and other similar grants are treated as a reduction of the capitalized cost of the asset to which they apply.
The company uses the successful-efforts method to account for its exploration and development activities. Under this method, costs are accumulated on a field-by-field basis with certain exploratory expenditures and exploratory dry holes being expensed as incurred. Costs of productive wells and development dry holes are capitalized and amortized using the unit-of-production method. The company carries as an asset exploratory well costs if (a) the well found a sufficient quantity of reserves to justify its completion as a producing well and (b) the company is making sufficient progress assessing the reserves and the economic and operating viability of the project. Exploratory well costs not meeting these criteria are charged to expense.
Acquisition costs of proved properties are amortized using a unit-of-production method, computed on the basis of total proved oil and gas reserves. Unproved properties are assessed for impairment individually and valuation allowances against the capitalized costs are recorded based on the estimated economic chance of success and the length of time the company expects to hold the properties. The valuation allowances are reviewed at least annually. Other exploratory expenditures, including geophysical costs and other dry hole costs, are expensed as incurred.
Maintenance and repair costs, including planned major maintenance, are expensed as incurred. Improvements that increase or prolong the service life or capacity of an asset are capitalized.
Production costs are expensed as incurred. Production involves lifting the oil and gas to the surface and gathering, treating, field processing and field storage of the oil and gas. The production function normally terminates at the outlet valve on the lease or field production storage tank. Production costs are those incurred to operate and maintain the company’s wells and related equipment and facilities. They become part of the cost of oil and gas produced. These costs, sometimes referred to as lifting costs, include such items as labour cost to operate the wells and related equipment; repair and maintenance costs on the wells and equipment; materials, supplies and energy costs required to operate the wells and related equipment; and administrative expenses related to the production activity.
Depreciation and depletion for assets associated with producing properties begin at the time when production commences on a regular basis. Depreciation for other assets begins when the asset is in place and ready for its intended use. Assets under construction are not depreciated or depleted. Unit-of-production depreciation is applied to those wells, plant and equipment assets associated with productive depletable properties, and the unit-of-production rates are based on the amount of proved developed reserves of oil and gas. Depreciation of other plant and equipment is calculated using the straight-line method, based on the estimated service life of the asset. In general, refineries are depreciated over 25 years; other major assets, including chemical plants and service stations, are depreciated over 20 years.
Proved oil and gas properties held and used by the company are reviewed for impairment whenever events or changes in circumstances indicate that the carrying amounts may not be recoverable. Assets are grouped at the lowest level for which there are identifiable cash flows that are largely independent of the cash flows of other groups of assets.
The company estimates the future undiscounted cash flows of the affected properties to judge the recoverability of carrying amounts. Cash flows used in impairment evaluations are developed using annually updated corporate plan investment evaluation assumptions for crude oil and natural gas commodity prices and foreign-currency exchange rates. Annual volumes are based on individual field production profiles, which are also updated annually.
In general, impairment analyses are based on proved reserves. Where probable reserves exist, an appropriately risk-adjusted amount of these reserves may be included in the impairment evaluation. An asset would be impaired if the undiscounted cash flows were less than its carrying value. Impairments are measured by the amount by which the carrying value exceeds its fair value.
Acquisition costs for the company’s oil sands mining properties are capitalized as incurred. Oil sands mining exploration costs are expensed as incurred. The capitalization of project development costs begins when there
84
Table of Contents
Notes to consolidated financial statements (continued)
are no major uncertainties that exist which would preclude management from making a significant funding commitment within a reasonable time period. Stripping costs of the company’s oil sands mining operation during the production phase are expensed as incurred. With the consistently low level of inventory, recognizing stripping costs during the production phase as inventory costs would not have a significant impact on earnings or inventory value.
Depreciation of oil sands mining and extraction assets begins when bitumen ore is produced on a sustained basis, and depreciation of bitumen upgrading assets begins when feed is introduced to the upgrading unit and maintained on a continuous basis. Assets under construction are not depreciated. Investments in extraction facilities, which separate the crude from sand, as well as the upgrading facilities, are depreciated on a unit-of-production method based on proven reserves. Investments in mining and transportation systems are generally depreciated on a straight-line basis over a 15-year life. Other mining related infrastructure costs that are of a long-term nature intended for continued use in or to provide long-term benefit to the operation, such as pre-production stripping, certain roads, etc., are depreciated on a unit-of-production basis based on proven reserves.
Oil sands mining assets held and used by the company are reviewed for impairment whenever events or changes in circumstances indicate that the carrying amounts are not recoverable. The impairment evaluation for oil sands mining assets is based on a comparison of undiscounted cash flows to book carrying value.
Gains or losses on assets sold are included in “investment and other income” in the consolidated statement of income.
Interest capitalization
Interest costs relating to major capital projects under construction are capitalized as part of property, plant and equipment. The project construction phase commences with the development of the detailed engineering design and ends when the constructed assets are ready for their intended use.
Goodwill and other intangible assets
Goodwill is not subject to amortization. Goodwill is tested for impairment annually or more frequently if events or circumstances indicate it might be impaired. Impairment losses are recognized in current period earnings. The evaluation for impairment of goodwill is based on a comparison of the carrying values of goodwill and associated operating assets with the estimated present value of net cash flows from those operating assets.
Intangible assets with determinable useful lives are amortized over the estimated service lives of the assets. Computer software development costs are amortized over a maximum of 15 years and customer lists are amortized over a maximum of 10 years. The amortization is included in “depreciation and depletion” in the consolidated statement of income.
Asset retirement obligations and other environmental liabilities
Legal obligations associated with site restoration on the retirement of assets with determinable useful lives are recognized when they are incurred, which is typically at the time the assets are installed. These obligations primarily relate to soil remediation and decommissioning and removal costs of oil and gas wells and related facilities. The company uses estimates, assumptions and judgments regarding such factors as the existence of a legal obligation for an asset retirement obligation, technical assessments of the assets, estimated amounts and timing of settlements, the credit-adjusted risk-free rate to be used, and inflation rates. The obligations are initially measured at fair value and discounted to present value. A corresponding amount equal to that of the initial obligation is added to the capitalized costs of the related asset. Over time, the discounted asset retirement obligation amount will be accreted for the change in its present value, and the initial capitalized costs will be depreciated over the useful lives of the related assets.
No asset retirement obligations are set up for those manufacturing, distribution and marketing facilities with an indeterminate useful life. Asset retirement obligations for these facilities generally become firm at the time the facilities are permanently shut down and dismantled. These obligations may include the costs of asset disposal and additional soil remediation. However, these sites have indeterminate lives based on plans for continued operations, and as such, the fair value of the conditional legal obligations cannot be measured, since it is impossible to estimate the future settlement dates of such obligations. Provision for environmental liabilities of these assets is made when it is probable that obligations have been incurred and the amount can be reasonably estimated. Provisions for environmental liabilities
85
Table of Contents
Notes to consolidated financial statements (continued)
are determined based on engineering estimated costs, taking into account the anticipated method and extent of remediation consistent with legal requirements, current technology and the possible use of the location. These liabilities are not discounted.
Foreign-currency translation
Monetary assets and liabilities in foreign currencies have been translated at the rates of exchange prevailing on December 31. Any exchange gains or losses are recognized in income.
Financial instruments
The fair values of cash, accounts receivable and current liabilities approximate recorded amounts because of the short period to receipt or payment of cash. The fair values of the company’s other financial instruments, which are mainly long-term receivables, are estimated primarily by discounting future cash flows, using current rates for similar financial instruments under similar credit risk and maturity conditions.
The company does not use financing structures for the purpose of altering accounting outcomes or removing debt from the balance sheet. The company does not use derivative instruments to speculate on the future direction of currency or commodity prices.
Revenues
Revenues associated with sales of crude oil, natural gas, petroleum and chemical products and other items are recorded when the products are delivered. Delivery occurs when the customer has taken title and has assumed the risks and rewards of ownership, prices are fixed or determinable and collectibility is reasonably assured. The company does not enter into ongoing arrangements whereby it is required to repurchase its products, nor does the company provide the customer with a right of return.
Revenues include amounts billed to customers for shipping and handling. Shipping and handling costs incurred up to the point of final storage prior to delivery to a customer are included in “purchases of crude oil and products” in the consolidated statement of income. Delivery costs from final storage to customer are recorded as a marketing expense in “selling and general” expenses.
Purchases and sales of inventory with the same counterparty that are entered into in contemplation of one another are combined and recorded as exchanges measured at the book value of the item sold.
Share-based compensation
The company awards share-based compensation to employees in the form of restricted stock units. Compensation expense is measured each reporting period based on the company’s current stock price and is recorded as “selling and general” expenses in the consolidated statement of income over the requisite service period of each award. See note 8 to the consolidated financial statements on page 98 for further details.
Consumer taxes
Taxes levied on the consumer and collected by the company are excluded from the consolidated statement of income. These are primarily provincial taxes on motor fuels and the federal goods and services tax.
Fair value measurements
Effective January 1, 2009, the company adopted the authoritative guidance for fair value measurements as they relate to nonfinancial assets and liabilities that are measured at fair value on a nonrecurring basis. The guidance defines fair value, establishes a framework for measuring fair value when an entity is required to use a fair value measure for recognition or disclosure purposes and expands the disclosures about fair value measures. The adoption did not have a material impact on the company’s financial statements. The company previously adopted the guidance as it relates to financial assets and liabilities that are measured at fair value and for nonfinancial assets and liabilities that are measured at fair value on a recurring basis.
Oil and gas reserves
Effective December 31, 2009, the company adopted the authoritative guidance for estimating and disclosing oil and gas reserve quantities. Year-end 2009 proved reserve volumes as well as the 2009 reserve change categories were calculated using average prices during the 12-month period ending December 31, 2009. Year-end 2008 and 2007 reserve volumes were calculated using December 31 prices. The effect on unit-of- production depreciation rates
86
Table of Contents
Notes to consolidated financial statements (continued)
of using 12-month average versus December 31 year-end prices will be applied prospectively commencing in 2010. Additionally, the definition of “oil and gas producing activities” has been expanded to include bitumen extracted through mining activities and hydrocarbons from other non-traditional resources. The amended rules also adopted a reliable technology definition that permits reserves to be added based on field-tested technologies. The adoption of this guidance is not expected to have a material impact on the company’s consolidated financial position or results of operations.
The company operates its business in Canada. The Upstream, Downstream and Chemical functions best define the operating segments of the business that are reported separately. The factors used to identify these reportable segments are based on the nature of the operations that are undertaken by each segment and the structure of the company’s internal organization. The Upstream segment is organized and operates to explore for and ultimately produce crude oil and its equivalent, and natural gas. The Downstream segment is organized and operates to refine crude oil into petroleum products and the distribution and marketing of these products. The Chemical segment is organized and operates to manufacture and market hydrocarbon-based chemicals and chemical products. The above segmentation has been the long-standing practice of the company and is broadly understood across the petroleum and petrochemical industries.
These functions have been defined as the operating segments of the company because they are the segments (a) that engage in business activities from which revenues are earned and expenses are incurred; (b) whose operating results are regularly reviewed by the company’s chief operating decision maker to make decisions about resources to be allocated to each segment and assess its performance; and (c) for which discrete financial information is available.
Corporate and other includes assets and liabilities that do not specifically relate to business segments – primarily cash, capitalized interest costs, long-term debt and liabilities associated with incentive compensation and post-retirement benefits liability adjustment. Net income in this segment primarily includes financing costs, interest income and share-based incentive compensation expenses.
Segment accounting policies are the same as those described in the summary of significant accounting policies. Upstream, Downstream and Chemical expenses include amounts allocated from the Corporate and other segment. The allocation is based on a combination of fee for service, proportional segment expenses and a three-year average of capital expenditures. Transfers of assets between segments are recorded at book amounts. Intersegment sales are made essentially at prevailing market prices. Assets and liabilities that are not identifiable by segment are allocated.
87
Table of Contents
Notes to consolidated financial statements (continued)
| Upstream (a) | Downstream | Chemical | ||||||||||||||||
| millions of dollars |
2009 | 2008 | 2007 | 2009 | 2008 | 2007 | 2009 | 2008 | 2007 | |||||||||
| Revenues and other income |
||||||||||||||||||
| External sales (b) |
3,552 | 5,819 | 4,539 | 16,793 | 24,049 | 19,230 | 947 | 1,372 | 1,300 | |||||||||
| Intersegment sales |
3,328 | 5,403 | 4,146 | 1,535 | 2,892 | 2,305 | 289 | 460 | 335 | |||||||||
| Investment and other income |
39 | 18 | 233 | 53 | 271 | 52 | – | 1 | – | |||||||||
| 6,919 | 11,240 | 8,918 | 18,381 | 27,212 | 21,587 | 1,236 | 1,833 | 1,635 | ||||||||||
| Expenses |
||||||||||||||||||
| Exploration |
153 | 132 | 106 | – | – | – | – | – | – | |||||||||
| Purchases of crude oil and products |
2,024 | 3,995 | 3,113 | 14,164 | 22,223 | 16,469 | 898 | 1,401 | 1,230 | |||||||||
| Production and manufacturing |
2,385 | 2,569 | 2,057 | 1,372 | 1,452 | 1,232 | 194 | 208 | 185 | |||||||||
| Selling and general (c) |
4 | 6 | 8 | 952 | 998 | 987 | 67 | 72 | 71 | |||||||||
| Federal excise tax |
– | – | – | 1,268 | 1,312 | 1,307 | – | – | – | |||||||||
| Depreciation and depletion |
536 | 474 | 519 | 225 | 234 | 244 | 12 | 12 | 12 | |||||||||
| Financing costs (note 13) |
1 | 2 | 4 | 2 | (5) | 1 | – | – | – | |||||||||
| Total expenses |
5,103 | 7,178 | 5,807 | 17,983 | 26,214 | 20,240 | 1,171 | 1,693 | 1,498 | |||||||||
| Income before income taxes |
1,816 | 4,062 | 3,111 | 398 | 998 | 1,347 | 65 | 140 | 137 | |||||||||
| Income taxes (note 4) |
||||||||||||||||||
| Current |
475 | 1,051 | 682 | 234 | (56) | 491 | 20 | 37 | 42 | |||||||||
| Deferred |
17 | 88 | 60 | (114) | 258 | (65) | (1) | 3 | (2) | |||||||||
| Total income tax expense |
492 | 1,139 | 742 | 120 | 202 | 426 | 19 | 40 | 40 | |||||||||
| Net income |
1,324 | 2,923 | 2,369 | 278 | 796 | 921 | 46 | 100 | 97 | |||||||||
| Cash flow from (used in) operating activities |
972 | 3,699 | 2,411 | 658 | 280 | 1,151 | 67 | 183 | 109 | |||||||||
| Capital and exploration expenditures |
2,167 | 1,110 | 744 | 251 | 232 | 187 | 15 | 13 | 11 | |||||||||
| Property, plant and equipment |
||||||||||||||||||
| Cost |
18,455 | 16,344 | 15,285 | 6,901 | 6,776 | 6,655 | 748 | 732 | 718 | |||||||||
| Accumulated depreciation and depletion |
(9,340) | (8,832) | (8,474) | (3,572) | (3,452) | (3,320) | (530) | (514) | (496) | |||||||||
| Net property, plant and equipment (d) |
9,115 | 7,512 | 6,811 | 3,329 | 3,324 | 3,335 | 218 | 218 | 222 | |||||||||
| Total assets (e) |
10,663 | 8,758 | 8,171 | 6,183 | 6,038 | 6,727 | 428 | 431 | 476 | |||||||||
| Corporate and other | Eliminations | Consolidated | ||||||||||||||||
| millions of dollars |
2009 | 2008 | 2007 | 2009 | 2008 | 2007 | 2009 | 2008 | 2007 | |||||||||
| Revenues and other income |
||||||||||||||||||
| External sales (b) |
– | – | – | – | – | – | 21,292 | 31,240 | 25,069 | |||||||||
| Intersegment sales |
– | – | – | (5,152) | (8,755) | (6,786) | – | – | – | |||||||||
| Investment and other income |
14 | 49 | 89 | – | – | – | 106 | 339 | 374 | |||||||||
| 14 | 49 | 89 | (5,152) | (8,755) | (6,786) | 21,398 | 31,579 | 25,443 | ||||||||||
| Expenses |
||||||||||||||||||
| Exploration |
– | – | – | – | – | – | 153 | 132 | 106 | |||||||||
| Purchases of crude oil and products |
– | – | – | (5,152) | (8,754) | (6,786) | 11,934 | 18,865 | 14,026 | |||||||||
| Production and manufacturing |
– | – | – | – | (1) | – | 3,951 | 4,228 | 3,474 | |||||||||
| Selling and general (c) |
83 | (38) | 269 | – | – | – | 1,106 | 1,038 | 1,335 | |||||||||
| Federal excise tax |
– | – | – | – | – | – | 1,268 | 1,312 | 1,307 | |||||||||
| Depreciation and depletion |
8 | 8 | 5 | – | – | – | 781 | 728 | 780 | |||||||||
| Financing costs (note 13) |
2 | 3 | 31 | – | – | – | 5 | – | 36 | |||||||||
| Total expenses |
93 | (27) | 305 | (5,152) | (8,755) | (6,786) | 19,198 | 26,303 | 21,064 | |||||||||
| Income before income taxes |
(79) | 76 | (216) | – | – | – | 2,200 | 5,276 | 4,379 | |||||||||
| Income taxes (note 4) |
||||||||||||||||||
| Current |
(35) | (27) | (52) | – | – | – | 694 | 1,005 | 1,163 | |||||||||
| Deferred |
25 | 44 | 35 | – | – | – | (73) | 393 | 28 | |||||||||
| Total income tax expense |
(10) | 17 | (17) | – | – | – | 621 | 1,398 | 1,191 | |||||||||
| Net income |
(69) | 59 | (199) | – | – | – | 1,579 | 3,878 | 3,188 | |||||||||
| Cash flow from (used in) operating activities |
(106) | 101 | (45) | – | – | – | 1,591 | 4,263 | 3,626 | |||||||||
| Capital and exploration expenditures |
5 | 8 | 36 | – | – | – | 2,438 | 1,363 | 978 | |||||||||
| Property, plant and equipment |
||||||||||||||||||
| Cost |
317 | 313 | 304 | – | – | – | 26,421 | 24,165 | 22,962 | |||||||||
| Accumulated depreciation and depletion |
(127) | (119) | (111) | – | – | – | (13,569) | (12,917) | (12,401) | |||||||||
| Net property, plant and equipment (d) |
190 | 194 | 193 | – | – | – | 12,852 | 11,248 | 10,561 | |||||||||
| Total assets (e) |
546 | 1,982 | 1,251 | (347) | (174) | (338) | 17,473 | 17,035 | 16,287 | |||||||||
88
Table of Contents
Notes to consolidated financial statements (continued)
| a) | A significant portion of activities in the Upstream segment is conducted jointly with other companies. The segment includes the company’s share of undivided interest in such activities as follows: |
| millions of dollars |
2009 | 2008 | 2007 | |||||||
| Total external and intersegment sales |
2,584 | 4,766 | 3,923 | |||||||
| Total expenses |
2,174 | 3,002 | 2,394 | |||||||
| Net income, after tax |
329 | 1,302 | 1,224 | |||||||
| Total current assets |
1,228 | 758 | 1,043 | |||||||
| Long-term assets |
6,787 | 5,380 | 4,868 | |||||||
| Total current liabilities |
443 | 659 | 705 | |||||||
| Other long-term obligations |
630 | 619 | 460 | |||||||
| Cash flow from operating activities |
(163) | 1,891 | 865 | |||||||
| Cash (used in) investing activities |
(1,782) | (685) | (131) | |||||||
| b) | Includes export sales to the United States, as follows: |
| millions of dollars |
2009 | 2008 | 2007 | |||||||
| Upstream |
1,671 | 3,095 | 2,013 | |||||||
| Downstream |
1,266 | 1,685 | 922 | |||||||
| Chemical |
518 | 844 | 768 | |||||||
| Total export sales |
3,455 | 5,624 | 3,703 |
| c) | Consolidated selling and general expenses include delivery costs from final storage areas to customers of $276 million in 2009 (2008 - $314 million, 2007 - $318 million). |
| d) | Includes property, plant and equipment under construction of $2,927 million (2008 - $1,523 million). |
| e) | All goodwill has been assigned to the Downstream segment. There have been no goodwill acquisitions, impairment losses or write-offs due to sales in the past three years. |
89
Table of Contents
Notes to consolidated financial statements (continued)
| millions of dollars |
2009 | 2008 | 2007 | |||||||
| Current income tax expense |
694 | 1,005 | 1,163 | |||||||
| Deferred income tax expense (a) |
(73) | 393 | 28 | |||||||
| Total income tax expense (b) |
621 | 1,398 | 1,191 | |||||||
| Statutory corporate tax rate (percent) |
28.7 | 29.5 | 30.1 | |||||||
| Increase/(decrease) resulting from: |
||||||||||
| Enacted tax rate change |
0.2 | – | (2.2) | |||||||
| Other |
(0.7) | (3.0) | (0.7) | |||||||
| Effective income tax rate |
28.2 | 26.5 | 27.2 |
| a) | The provisions for deferred income taxes in 2009 include net (charges)/credits for the effect of changes in tax laws and rates of $(4) million (2008 - $1 million, 2007 - $90 million). |
| b) | Cash outflow from income taxes, plus investment credits earned, was $1,330 million in 2009 (2008 - $1,101 million, 2007 - $1,395 million). |
Income taxes (charged)/credited directly to shareholders’ equity were:
| millions of dollars |
2009 | 2008 | 2007 | |||||||
| Post-retirement benefits liability adjustment: |
||||||||||
| Net actuarial loss/(gain) |
160 | 102 | 21 | |||||||
| Amortization of net actuarial (loss)/gain |
(29) | (26) | (24) | |||||||
| Prior service cost |
– | – | 13 | |||||||
| Amortization of prior service cost |
(4) | (5) | (6) | |||||||
| Total post-retirement benefits liability adjustment |
127 | 71 | 4 |
Deferred income taxes are based on differences between the accounting and tax values of assets and liabilities. These differences in value are re-measured at each year-end using the tax rates and tax laws expected to apply when those differences are realized or settled in the future. Components of deferred income tax liabilities and assets as at December 31 were:
| millions of dollars |
2009 | 2008 | 2007 | |||||||
| Depreciation and amortization |
1,691 | 1,685 | 1,624 | |||||||
| Successful drilling and land acquisitions |
305 | 258 | 276 | |||||||
| Pension and benefits |
(427) | (312) | (249) | |||||||
| Site restoration |
(233) | (202) | (156) | |||||||
| Net tax loss carryforwards (a) |
– | (2) | (37) | |||||||
| Capitalized interest |
49 | 53 | 49 | |||||||
| Other |
11 | 9 | (36) | |||||||
| Deferred income tax liabilities |
1,396 | 1,489 | 1,471 | |||||||
| LIFO inventory valuation |
(403) | (301) | (547) | |||||||
| Other |
(64) | (60) | (113) | |||||||
| Deferred income tax assets |
(467) | (361) | (660) | |||||||
| Valuation allowance |
– | – | – | |||||||
| Net deferred income tax liabilities |
929 | 1,128 | 811 | |||||||
| a) | Tax losses can be carried forward indefinitely. |
90
Table of Contents
Notes to consolidated financial statements (continued)
Unrecognized tax benefits
As of January 1, 2007, the company adopted the authoritative guidance on accounting for uncertainty in income taxes. The cumulative adjustment for the accounting change reported in 2007 was an after-tax gain of $14 million. The gain reflected the recognition of several refund claims with associated interest, partly offset by increased income tax reserves.
Unrecognized tax benefits reflect the difference between positions taken on tax returns and the amounts recognized in the financial statements. Resolution of the related tax positions will take many years to complete. It is difficult to predict the timing of resolution for individual tax positions, since such timing is not entirely within the control of the company. The company’s effective tax rate will be reduced if any of these tax benefits are subsequently recognized.
The following table summarizes the movement in unrecognized tax benefits:
| millions of dollars |
2009 | 2008 | 2007 | |||||||
| January 1 balance |
150 | 170 | 142 | |||||||
| Additions for prior years’ tax positions |
17 | 9 | 28 | |||||||
| Reductions for prior years’ tax positions |
(2) | (29) | – | |||||||
| December 31 balance |
165 | 150 | 170 |
The 2009, 2008 and 2007 changes in unrecognized tax benefits did not have a material effect on the company’s net income or cash flow. The company’s tax filings from 2005 to 2008 are subject to examination by the tax authorities. The Canada Revenue Agency has proposed certain adjustments to the company’s filings for several years in the period 1994 to 2004. Management is currently evaluating those proposed adjustments. Management believes that a number of outstanding matters before 2005 are expected to be resolved in 2010. The impact on unrecognized tax benefits and the company’s effective income tax rate from these matters is not expected to be material.
The company classifies interest on income tax related balances as interest expense or interest income and classifies tax related penalties as operating expense.
5. Employee retirement benefits
Retirement benefits, which cover almost all retired employees and their surviving spouses, include pension income and certain health care and life insurance benefits. They are met through funded registered retirement plans and through unfunded supplementary benefits that are paid directly to recipients.
Pension income benefits consist mainly of company-paid defined benefit plans that are based on years of service and final average earnings. The company shares in the cost of health care and life insurance benefits. The company’s benefit obligations are based on the projected benefit method of valuation that includes employee service to date and present compensation levels as well as a projection of salaries to retirement.
The expense and obligations for both funded and unfunded benefits are determined in accordance with United States generally accepted accounting principles and actuarial procedures. The process for determining retirement-income expense and related obligations includes making certain long-term assumptions regarding the discount rate, rate of return on plan assets and rate of compensation increases. The obligation and pension expense can vary significantly with changes in the assumptions used to estimate the obligation and the expected return on plan assets.
The benefit obligations and plan assets associated with the company’s defined benefit plans are measured on December 31.
91
Table of Contents
Notes to consolidated financial statements (continued)
| Pension benefits | Other post-retirement benefits | |||||||||
| 2009 | 2008 | 2009 | 2008 | |||||||
| Assumptions used to determine benefit obligations at December 31 (percent) |
||||||||||
| Discount rate |
6.25 | 7.50 | 6.25 | 7.50 | ||||||
| Long-term rate of compensation increase |
4.50 | 4.50 | 4.50 | 4.50 | ||||||
| millions of dollars |
||||||||||
| Change in projected benefit obligation |
||||||||||
| Projected benefit obligation at January 1 |
4,136 | 4,685 | 372 | 426 | ||||||
| Current service cost |
80 | 94 | 4 | 6 | ||||||
| Interest cost |
303 | 271 | 26 | 25 | ||||||
| Actuarial loss/(gain) |
834 | (583) | 47 | (61) | ||||||
| Benefits paid (a) |
(297) | (331) | (23) | (24) | ||||||
| Projected benefit obligation at December 31 |
5,056 | 4,136 | 426 | 372 | ||||||
| Accumulated benefit obligation at December 31 |
4,520 | 3,719 | ||||||||
|
The discount rate for calculating year-end post-retirement liabilities is based on the yield for high quality, long-term Canadian corporate bonds at year-end with an average maturity (or duration) approximately that of the liabilities. The measurement of the accumulated post-retirement benefit obligation assumes a health care cost trend rate of 5.50 percent in 2010 that declines to 4.50 percent by 2011.
| ||||||||||
| Pension benefits | Other post-retirement benefits | |||||||||
| millions of dollars | 2009 | 2008 | 2009 | 2008 | ||||||
| Change in plan assets |
||||||||||
| Fair value at January 1 |
3,312 | 4,098 | ||||||||
| Actual return/(loss) on plan assets |
520 | (699) | ||||||||
| Company contributions |
180 | 165 | ||||||||
| Benefits paid (b) |
(259) | (252) | ||||||||
| Fair value at December 31 |
3,753 | 3,312 | ||||||||
| Plan assets in excess of/(less than) projected benefit obligation at December 31 |
||||||||||
| Funded plans |
(880) | (488) | ||||||||
| Unfunded plans |
(423) | (336) | (426) | (372) | ||||||
| Total (c) |
(1,303) | (824) | (426) | (372) | ||||||
| a) | Benefit payments for funded and unfunded plans. |
| b) | Benefit payments for funded plans only. |
| c) | Fair value of assets less projected benefit obligation shown above. |
Funding of registered retirement plans complies with federal and provincial pension regulations, and the company makes contributions to the plans based on an independent actuarial valuation. In accordance with authoritative guidance relating to the accounting for defined pension and other post-retirement benefits plans, the underfunded status of the company’s defined benefit post-retirement plans was recorded as a liability in the balance sheet, and the changes in that funded status in the year in which the changes occurred was recognized through other comprehensive income.
92
Table of Contents
Notes to consolidated financial statements (continued)
| Pension benefits | Other post-retirement benefits | |||||||||||||||||||||
| millions of dollars |
2009 | 2008 | 2007 | 2009 | 2008 | 2007 | ||||||||||||||||
| Amounts recorded in the consolidated balance sheet consist of: |
||||||||||||||||||||||
| Current liabilities |
(23) | (22) | (34) | (24) | (23) | (25) | ||||||||||||||||
| Other long-term obligations |
(1,280) | (802) | (553) | (402) | (349) | (401) | ||||||||||||||||
| Total recorded |
(1,303) | (824) | (587) | (426) | (372) | (426) | ||||||||||||||||
| Amounts recorded in accumulated other comprehensive income consist of: |
||||||||||||||||||||||
| Net actuarial loss/(gain) |
1,801 | 1,331 | 977 | 24 | (25) | 42 | ||||||||||||||||
| Prior service cost |
59 | 77 | 95 | – | – | – | ||||||||||||||||
| Total recorded in accumulated
other |
1,860 | 1,408 | 1,072 | 24 | (25) | 42 | ||||||||||||||||
|
The company establishes the long-term expected rate of return on plan assets by developing a forward-looking long-term return assumption for each asset class, taking into account factors such as the expected real return for the specific asset class and inflation. A single long-term rate of return is then calculated as the weighted average of the target asset allocation and the long-term return assumption for each asset class. The 2009 long-term expected return of 8.00 percent used in the calculations of pension expense compares to an actual rate of return of 5.1 percent and 8.4 percent over the last 10- and 20-year periods ending December 31, 2009. | ||||||||||||||||||||||
| Pension benefits | Other post-retirement benefits | |||||||||||||||||||||
| millions of dollars |
2009 | 2008 | 2007 | 2009 | 2008 | 2007 | ||||||||||||||||
| Assumptions used to determine net periodic benefit cost for years ended December 31 (percent) |
||||||||||||||||||||||
| Discount rate |
7.50 | 5.75 | 5.25 | 7.50 | 5.75 | 5.25 | ||||||||||||||||
| Long-term rate of return on funded assets |
8.00 | 8.00 | 8.00 | – | – | – | ||||||||||||||||
| Long-term rate of compensation increase |
4.50 | 3.50 | 3.50 | 4.50 | 3.50 | 3.50 | ||||||||||||||||
| millions of dollars |
||||||||||||||||||||||
| Components of net periodic benefit cost |
||||||||||||||||||||||
| Current service cost |
80 | 94 | 100 | 4 | 6 | 6 | ||||||||||||||||
| Interest cost |
303 | 271 | 246 | 27 | 25 | 23 | ||||||||||||||||
| Expected return on plan assets |
(267) | (330) | (329) | – | – | – | ||||||||||||||||
| Amortization of prior service cost |
17 | 19 | 20 | – | – | – | ||||||||||||||||
| Recognized actuarial loss/(gain) |
112 | 91 | 76 | (2) | 6 | 6 | ||||||||||||||||
| Net periodic benefit cost |
245 | 145 | 113 | 29 | 37 | 35 | ||||||||||||||||
| Changes in amounts recorded in accumulated |
||||||||||||||||||||||
| Net actuarial loss/(gain) |
581 | 446 | 105 | 47 | (61) | (25) | ||||||||||||||||
| Amortization of net actuarial (loss)/gain included in |
(112) | (91) | (76) | 2 | (5) | (6) | ||||||||||||||||
| Prior service cost |
– | – | 41 | – | – | – | ||||||||||||||||
| Amortization of prior service cost included in net |
(17) | (19) | (20) | – | – | – | ||||||||||||||||
| Total recorded in accumulated
other |
452 | 336 | 50 | 49 | (66) | (31) | ||||||||||||||||
| Total recorded in net periodic benefit cost and |
697 | 481 | 163 | 78 | (29) | 4 | ||||||||||||||||
93
Table of Contents
Notes to consolidated financial statements (continued)
Costs for defined contribution plans, primarily the employee savings plan, were $36 million in 2009 (2008 - $33 million, 2007 - $31 million).
A summary of the change in accumulated other comprehensive income is shown in the table below:
| Total pension and other post-retirement benefits | ||||||||||
| millions of dollars |
2009 | 2008 | 2007 | |||||||
| (Charge)/credit to accumulated other comprehensive income, before tax |
(501) | (270) | (19) | |||||||
| Deferred income tax (charge)/credit (note 4) |
127 | 71 | 4 | |||||||
| (Charge)/credit to accumulated other comprehensive income, after tax |
(374) | (199) | (15) | |||||||
The company’s investment strategy for pension plan assets reflects a long-term view, a careful assessment of the risks inherent in various asset classes and broad diversification to reduce the risk of the portfolio. Consistent with the long-term nature of the liability, the plan assets are primarily invested in global, market-cap-weighted indexed equity and domestic indexed bond funds to diversify risk while minimizing costs. The equity funds hold Imperial Oil stock only to the extent necessary to replicate the relevant equity index. The balance of the plan assets is largely invested in high-quality corporate and government debt securities. Studies are periodically conducted to establish the preferred target asset allocation. The target asset allocation for equity securities is 56 percent. The target allocation for debt securities is 39 percent. Plan assets for the remaining five percent are invested in venture capital partnerships that pursue a strategy of investment in U.S. and international early stage ventures.
The authoritative guidance for fair value measurements establishes a framework for measuring fair value. The framework establishes a three-level fair value hierarchy based on the nature of the information used to measure fair value. The terms “Level 1”, “Level 2” and “Level 3” are accounting terms that refer to different methods of valuing assets. The terms do not represent the relative risk or credit quality of an investment.
94
Table of Contents
Notes to consolidated financial statements (continued)
The fair value of the pension plan assets, including the level within the fair value hierarchy, is shown in the table below:
| Fair value measurements at December 31, 2009, using: | ||||||||||||
| millions of dollars Asset category: |
Total | Quoted prices in active markets for identical (Level 1) |
Significant other observable inputs (Level 2) |
Significant unobservable inputs (Level 3) |
||||||||
| Equity securities |
||||||||||||
| Canadian |
918 | 918 | (a) | |||||||||
| Non-Canadian |
1,218 | 1,218 | (a) | |||||||||
| Debt securities - Canadian |
||||||||||||
| Corporate |
386 | 386 | (b) | |||||||||
| Government |
1,102 | 1,102 | (b) | |||||||||
| Asset backed |
20 | 20 | (b) | |||||||||
| Private mortgages |
2 | 2 | (c) | |||||||||
| Equities – Venture capital |
95 | 95 | (d) | |||||||||
| Cash |
12 | 9 | 3 | (e) | ||||||||
| Total plan assets at fair value |
3,753 | 9 | 3,647 | 97 | ||||||||
| a) | For company equity securities held in the form of fund units that are redeemable at the measurement date, the unit value is treated as a Level 2 input. The fair value of the securities owned by the funds is based on observable quoted prices on active exchanges which are Level 1 inputs. |
| b) | For corporate, government and asset-backed debt securities, fair value is based on observable inputs of comparable market transactions. |
| c) | For private mortgages, fair value is based on market data and year-end surveys of active brokers. |
| d) | For venture capital partnership investments, fair value is generally established by using revenue or earnings multiples or other relevant market data including Initial Public Offerings. |
| e) | For cash balances that are held in Level 2 funds prior to investment in those fund units, the cash value is treated as a Level 2 input. |
The change in the fair value of Level 3 assets which use significant unobservable inputs to measure fair value is shown in the table below:
| millions of dollars |
Private mortgages |
Venture capital | ||
| Fair value at January 1, 2009 |
2 | 112 | ||
| Net realized gains/(losses) |
– | (9) | ||
| Net unrealized gains/(losses) |
– | (20) | ||
| Net purchases/(sales) |
– | 12 | ||
| Fair value at December 31, 2009 |
2 | 95 |
95
Table of Contents
Notes to consolidated financial statements (continued)
A summary of pension plans with accumulated benefit obligations in excess of plan assets is shown in the table below:
| Pension benefits | ||||||
| millions of dollars |
2009 | 2008 | ||||
| For funded pension plans with accumulated benefit obligations in excess of plan assets: |
||||||
| Projected benefit obligation |
4,633 | 3,800 | ||||
| Accumulated benefit obligation |
4,155 | 3,420 | ||||
| Fair value of plan assets |
3,753 | 3,312 | ||||
| Accumulated benefit obligation less fair value of plan assets |
402 | 108 | ||||
| For unfunded plans covered by book reserves: |
||||||
| Projected benefit obligation |
423 | 336 | ||||
| Accumulated benefit obligation |
365 | 299 | ||||
Estimated 2010 amortization from accumulated other comprehensive income
| millions of dollars |
Pension benefits | Other post-retirement benefits | ||||
| Net actuarial loss/(gain) (a) |
146 | 3 | ||||
| Prior service cost (b) |
16 | – |
| a) | The company amortizes the net balance of actuarial loss/(gain) over the average remaining service period of active plan participants. |
| b) | The company amortizes prior service cost on a straight-line basis. |
Cash flows
Benefit payments expected in:
| millions of dollars |
Pension benefits | Other post-retirement benefits | ||||
| 2010 |
280 | 27 | ||||
| 2011 |
286 | 27 | ||||
| 2012 |
294 | 26 | ||||
| 2013 |
303 | 26 | ||||
| 2014 |
313 | 26 | ||||
| 2015 - 2019 |
1,726 | 136 |
In 2010, the company expects to make cash contributions of about $430 million to its pension plans.
Sensitivities
A one percent change in the assumptions at which retirement liabilities could be effectively settled is as follows:
| Increase/(decrease) millions of dollars |
One percent increase |
One percent decrease | ||||
| Rate of return on plan assets: |
||||||
| Effect on net benefit cost, before tax |
(35) | 35 | ||||
| Discount rate: |
||||||
| Effect on net benefit cost, before tax |
(45) | 50 | ||||
| Effect on benefit obligation |
(590) | 720 | ||||
| Rate of pay increases: |
||||||
| Effect on net benefit cost, before tax |
25 | (25) | ||||
| Effect on benefit obligation |
150 | (135) | ||||
96
Table of Contents
Notes to consolidated financial statements (continued)
A one percent change in the assumed health-care cost trend rate would have the following effects:
| Increase/(decrease) millions of dollars |
One percent increase |
One percent decrease | ||
| Effect on service and interest cost components |
3 | (2) | ||
| Effect on benefit obligation |
34 | (28) |
6. Other long-term obligations
| millions of dollars | 2009 | 2008 | ||||
| Employee retirement benefits (note 5) (a) |
1,682 | 1,151 | ||||
| Asset retirement obligations and other environmental liabilities (b) |
806 | 728 | ||||
| Share-based incentive compensation liabilities (note 8) |
144 | 159 | ||||
| Other obligations |
207 | 216 | ||||
| Total other long-term obligations |
2,839 | 2,254 | ||||
| a) | Total recorded employee retirement benefit obligations also include $47 million in current liabilities (2008 – $45 million). | |||||
| b) | Total asset retirement obligations and other environmental liabilities also include $114 million in current liabilities (2008 – $83 million). | |||||
| Asset retirement obligations incurred in the current period were “Level 3” (unobservable inputs) fair value measurements. The following table summarizes the activity in the liability for asset retirement obligations: | ||||||
| millions of dollars | 2009 | 2008 | ||||
| January 1 balance | 711 | 488 | ||||
| Additions | 135 | 232 | ||||
| Accretion | 42 | 29 | ||||
| Settlement | (78) | (38) | ||||
| December 31 balance | 810 | 711 |
7. Derivatives and financial instruments
The company did not enter into any energy derivatives, foreign-exchange forward contracts or currency and interest-rate swaps in the past three years. The company maintains a system of controls that includes a policy covering the authorization, reporting and monitoring of derivative activity.
The fair value of the company’s financial instruments is determined by reference to various market data and other appropriate valuation techniques. There are no material differences between the fair values of the company’s financial instruments and the recorded book value.
97
Table of Contents
Notes to consolidated financial statements (continued)
8. Share-based incentive compensation programs
Share-based incentive compensation programs are designed to retain selected employees, reward them for high performance and promote individual contribution to sustained improvement in the company’s future business performance and shareholder value.
Incentive share units, deferred share units and restricted stock units
Incentive share units have value if the market price of the company’s common shares when the unit is exercised exceeds the market value when the unit was issued, as adjusted for any share splits. The issue price of incentive share units is the closing price of the company’s shares on the Toronto Stock Exchange on the grant date. Up to 50 percent of the units may be exercised after one year from issuance; an additional 25 percent may be exercised after two years; and the remaining 25 percent may be exercised after three years. Incentive share units are eligible for exercise up to ten years from issuance. The last grant expires in 2011. The units may expire earlier if employment is terminated other than by retirement, death or disability.
The deferred share unit plan is made available to selected executives and nonemployee directors. The selected executives can elect to receive all or part of their performance bonus compensation in units, and the nonemployee directors can elect to receive all or part of their directors’ fees in units. The number of units granted to executives is determined by dividing the amount of the bonus elected to be received as deferred share units by the average of the closing prices of the company’s shares on the Toronto Stock Exchange for the five consecutive trading days immediately prior to the date that the bonus would have been paid. The number of units granted to a nonemployee director is determined at the end of each calendar quarter by dividing the amount of director’s fees for the calendar quarter that the nonemployee director elected to receive as deferred share units by the average closing price of the company’s shares for the five consecutive trading days immediately prior to the last day of the calendar quarter. Additional units are granted based on the cash dividend payable on the company’s shares divided by the average closing price immediately prior to the payment date for that dividend and multiplying the resulting number by the number of deferred share units held by the recipient, as adjusted for any share splits. In February 2010, the company announced that the deferred share unit plan for selected executives was terminated.
Deferred share units cannot be exercised until after termination of employment with the company or resignation as a director and must be exercised no later than December 31 of the year following termination or resignation. On the exercise date, the cash value to be received for the units is determined based on the average closing price of the company’s shares for the five consecutive trading days immediately prior to the date of exercise, as adjusted for any share splits.
Under the restricted stock unit plan, each unit entitles the recipient to the conditional right to receive from the company, upon exercise, an amount equal to the five-day average of the closing price of the company’s common shares on the Toronto Stock Exchange on and immediately prior to the exercise dates. Fifty percent of the units are exercised three years following the grant date, and the remainder are exercised seven years following the grant date. The company may also issue units where 50 percent of the units are exercisable five years following the grant date and the remainder are exercisable on the later of ten years following the grant date or the retirement date of the recipient. For units granted in 2003 to 2005, the exercise date has been changed from December 31 to December 4 for units exercised in 2006 and subsequent years. For units granted in 2003, 2004 and 2005 to be exercised subsequent to the company’s May 2006 three-for-one share split, the company has indicated that it will increase the cash payment or number of shares issued per unit, as the case may be, by a factor of three.
All units require settlement by cash payments with the following exceptions. The restricted stock unit program was amended for units granted in 2002 and subsequent years by providing that the recipient may receive one common share of the company per unit or elect to receive the cash payment for the units to be exercised in the seventh year following the grant date. For units where 50 percent are exercisable five years following the grant date and the remainder exercisable on the later of ten years following the grant date or the retirement date of the recipient, the recipient may receive one common share of the company per unit or elect to receive cash payment for all units to be exercised.
The company accounts for these units by using the fair-value-based method. The fair value of awards in the form of incentive share, deferred share and restricted stock units is the market price of the company’s stock.
98
Table of Contents
Notes to consolidated financial statements (continued)
Under this method, compensation expense related to the units of these programs is measured each reporting period based on the company’s current stock price and is recorded in the consolidated statement of income over the requisite service period of each award.
The following table summarizes information about these units for the year ended December 31, 2009:
| Incentive share units |
Deferred share units |
Restricted stock units | ||||||||
| Outstanding at January 1, 2009 |
5,511,015 | 86,371 | 10,596,563 | |||||||
| Granted |
– | 13,572 | 1,758,448 | |||||||
| Exercised |
(1,087,320) | (24,173) | (2,124,089) | |||||||
| Cancelled or adjusted |
– | – | (945) | |||||||
| Outstanding at December 31, 2009 |
4,423,695 | 75,770 | 10,229,977 |
The compensation expense charged against income for these programs was $59 million and $202 million for the years ended December 31, 2009 and 2007, respectively, and there was a $33 million favourable adjustment to previously recorded compensation expenses for these programs in the year ended December 31, 2008. Income tax benefit recognized in income related to compensation expense for the years ended December 31, 2009 and 2007 was $24 million and $67 million, respectively, and income tax expense associated with the favourable adjustment to compensation expense for the year ended December 31, 2008 was $5 million. Cash payments of $126 million, $115 million and $159 million for these programs were made in 2009, 2008 and 2007, respectively.
As of December 31, 2009, there was $199 million of total before-tax unrecognized compensation expense related to nonvested restricted stock units based on the company’s share price at the end of the current reporting period. The weighted average vesting period of nonvested restricted stock units is 3.9 years. All units under the incentive share and deferred share programs have vested as of December 31, 2009.
Incentive stock options
In April 2002, incentive stock options were granted for the purchase of the company’s common shares. For units exercised subsequent to the company’s May 2006 three-for-one split, the company has indicated that it will give the option holders the right to purchase three shares for each original stock option granted. The exercise price is $15.50 per share (adjusted to reflect the three-for-one share split). All options have vested as of December 31, 2009. Any unexercised options expire after April 29, 2012. The company has not issued incentive stock options since 2002 and has no plans to issue incentive stock options in the future.
Since incentive stock option awards vested prior to the effective date of current authoritative guidance relating to accounting for stock-based compensation, they continue to be accounted for under the prior prescribed method. Under this method, compensation expense of incentive stock option awards is not recognized, as the exercise price of the option is equal to the market price of the stock on the date of grant.
The aggregate intrinsic value of stock options exercised was $1 million, $17 million and $25 million in the years ended December 31, 2009, 2008 and 2007, respectively, and for the outstanding stock options was $107 million as at December 31, 2009.
The average fair value of each option granted during 2002 was $4.23 (adjusted to reflect the three-for-one share split). The fair value was estimated at the grant date using an option-pricing model with the following weighted average assumptions: risk-free interest rate of 5.7 percent, expected life of five years, volatility of 25 percent and a dividend yield of 1.9 percent.
The company has purchased shares on the market to fully offset the dilutive effects from the exercise of stock options. Purchase may be discontinued at any time without prior notice.
99
Table of Contents
Notes to consolidated financial statements (continued)
The following table summarizes information about stock options for the year ended December 31, 2009:
| Units | Exercise (dollars) |
Remaining contractual | ||||||||
| Incentive stock options |
||||||||||
| Outstanding at January 1, 2009 |
4,294,635 | 15.50 | ||||||||
| Granted |
– | – | ||||||||
| Exercised |
(53,805) | 15.50 | ||||||||
| Cancelled or adjusted |
– | |||||||||
| Outstanding at December 31, 2009 |
4,240,830 | 15.50 | 2.3 | |||||||
9. Investment and other income
Investment and other income includes gains and losses on asset sales as follows:
| millions of dollars | 2009 | 2008 | 2007 | |||||||
| Proceeds from asset sales |
67 | 272 | 279 | |||||||
| Book value of assets sold |
22 | 31 | 64 | |||||||
| Gain/(loss) on asset sales, before tax (a) (b) |
45 | 241 | 215 | |||||||
| Gain/(loss) on asset sales, after tax (a) (b) |
38 | 209 | 156 |
| a) | 2007 included a gain of $200 million ($142 million, after tax) from the sale of the company’s interests in a natural gas producing property in British Columbia and in the Willesden Green producing property. |
| b) | 2008 included a gain of $219 million ($187 million, after tax) from the sale of the company’s equity investment in Rainbow Pipe Line Co. Ltd. |
10. Litigation and other contingencies
A variety of claims have been made against Imperial Oil Limited and its subsidiaries in a number of lawsuits. Management has regular litigation reviews, including updates from corporate and outside counsel, to assess the need for accounting recognition or disclosure of these contingencies. The company accrues an undiscounted liability for those contingencies where the incurrence of a loss is probable and the amount can be reasonably estimated. If a range of amounts can be reasonably estimated and no amount within the range is a better estimate than any other amount, then the minimum of the range is accrued. The company does not record liabilities when the likelihood that the liability has been incurred is probable but the amount cannot be reasonably estimated or when the liability is believed to be only reasonably possible or remote. For contingencies where an unfavourable outcome is reasonably possible and which are significant, the company discloses the nature of the contingency and, where feasible, an estimate of the possible loss. Based on a consideration of all relevant facts and circumstances, the company does not believe the ultimate outcome of any currently pending lawsuits against the company will have a material adverse effect on the company’s operations or financial condition.
Additionally, the company has other commitments arising in the normal course of business for operating and capital needs, all of which are expected to be fulfilled with no adverse consequences material to the company’s operations or financial condition. Unconditional purchase obligations, as defined by accounting standards, are those long-term commitments that are non-cancelable or cancelable only under certain conditions and that third parties have used to secure financing for the facilities that will provide the contracted goods and services.
| Payments due by period | ||||||||||||||||||||||||||
| millions of dollars | 2010 | 2011 | 2012 | 2013 | 2014 | After 2014 |
Total | |||||||||||||||||||
| Unconditional purchase obligations (a) |
55 | 64 | 32 | 32 | 31 | 192 | 406 | |||||||||||||||||||
| a) | Undiscounted obligations of $406 million mainly pertain to pipeline throughput agreements. Total payments under unconditional purchase obligations were $74 million (2008 - $117 million, 2007 - $94 million). The present value of these commitments, excluding imputed interest of $98 million, totaled $308 million. |
100
Table of Contents
Notes to consolidated financial statements (continued)
| thousands of shares |
As at Dec. 31 2009 |
As at Dec. 31 2008 | ||||
| Authorized |
1,100,000 | 1,100,000 |
From 1995 through 2008, the company purchased shares under fourteen 12-month normal course issuer bid share repurchase programs, as well as an auction tender. On June 25, 2009, another 12-month normal course issuer bid program was implemented with an allowable purchase of 42.4 million shares (five percent of the total on June 15, 2009), less shares purchased from Exxon Mobil Corporation and shares purchased by the employee savings plan and company pension fund. The results of these activities are as shown below.
| Year |
Purchased shares (thousands) |
Millions of dollars | ||||
| 1995 to 2007 |
846,139 | 12,811 | ||||
| 2008 |
44,295 | 2,210 | ||||
| 2009 |
11,856 | 492 | ||||
| Cumulative purchases to date |
902,290 | 15,513 | ||||
Exxon Mobil Corporation’s participation in the above maintained its ownership interest in Imperial at 69.6 percent.
The excess of the purchase cost over the stated value of shares purchased has been recorded as a distribution of earnings reinvested.
The company’s common share activities are summarized below:
| Thousands of shares | Millions of dollars | |||||
| Balance as at January 1, 2007 |
952,988 | 1,677 | ||||
| Issued for cash under the stock option plan |
791 | 12 | ||||
| Purchases at stated value |
(50,516) | (89) | ||||
| Balance as at December 31, 2007 |
903,263 | 1,600 | ||||
| Issued for cash under the stock option plan |
434 | 7 | ||||
| Purchases at stated value |
(44,295) | (79) | ||||
| Balance as at December 31, 2008 |
859,402 | 1,528 | ||||
| Issued under employee share-based awards |
54 | 1 | ||||
| Purchases at stated value |
(11,856) | (21) | ||||
| Balance as at December 31, 2009 |
847,600 | 1,508 | ||||
101
Table of Contents
Notes to consolidated financial statements (continued)
The following table provides the calculation of basic and diluted earnings per share:
| a) | Cash interest payments in 2009 were $8 million (2008 – $6 million, 2007 – $80 million). The weighted average interest rate on short-term borrowings in 2009 was 0.7 percent (2008 – 3.5 percent). |
102
Table of Contents
Notes to consolidated financial statements (continued)
14. Leased facilities and capitalized lease obligations
At December 31, 2009, the company held non-cancelable operating leases covering office buildings, rail cars, service stations and other properties with minimum undiscounted lease commitments totaling $415 million as indicated in the following table:
| Payments due by period | ||||||||||||||
| millions of dollars | 2010 | 2011 | 2012 | 2013 | 2014 | After 2014 |
Total | |||||||
| Lease payments under minimum commitments (a) |
72 | 68 | 59 | 53 | 49 | 114 | 415 | |||||||
| a) | Total rental expenditures incurred for operating leases in 2009 was $129 million (2008 – $149 million, 2007 – $98 million), which included minimum rental expenditures of $128 million (2008 - $140 million, 2007 - $86 million). Related rental income was not material. |
Capitalized lease obligations primarily relate to the capital lease for marine services, which are provided by the lessor commencing in 2004 for a period of 10 years, extendable for an additional five years. The average imputed rate was 11.1 percent in 2009 (2008 – 11.0 percent). Total capitalized lease obligations also include $4 million in current liabilities (2008 - $4 million).
Principal payments on capital leases of approximately $4 million a year are due in each of the next five years.
15. Transactions with related parties
Revenues and expenses of the company also include the results of transactions with Exxon Mobil Corporation and affiliated companies (ExxonMobil) in the normal course of operations. These were conducted on terms as favourable as they would have been with unrelated parties and primarily consisted of the purchase and sale of crude oil, natural gas, petroleum and chemical products, as well as transportation, technical and engineering services. Transactions with ExxonMobil also included amounts paid and received in connection with the company’s participation in a number of upstream activities conducted jointly in Canada.
In addition, the company has existing agreements with ExxonMobil to:
| a) | provide computer and customer support services to the company and to share common business and operational support services that allow the companies to consolidate duplicate work and systems; |
| b) | operate the Western Canada production properties owned by ExxonMobil. This contractual agreement is designed to provide organizational efficiencies and to reduce costs. No separate legal entities were created from this arrangement. Separate books of account continue to be maintained for the company and ExxonMobil. The company and ExxonMobil retain ownership of their respective assets, and there is no impact on operations or reserves; |
| c) | provide for the delivery of management, business and technical services to Syncrude Canada Ltd. by ExxonMobil; and |
| d) | provide for equal participation in new upstream opportunities. |
Certain charges from ExxonMobil have been capitalized; they are not material in the aggregate.
In 2009, the company entered into an agreement with ExxonMobil that provides for a long-term variable-rate loan from ExxonMobil to the company of up to $5 billion (Canadian) at interest equivalent to Canadian market rates. The company has not drawn on this agreement.
As at December 31, 2009, the company had outstanding loans of $33 million (2008 - $35 million) to Montreal Pipe Line Limited, in which the company has an equity interest, for financing of the equity company’s capital expenditure programs and working capital requirements.
103
Table of Contents
Supplemental information on oil and gas exploration and production activities
(unaudited)
The information on pages 104 to 106 excludes items not related to oil and natural gas extraction such as administrative and general expenses, pipeline operations, gas plant processing fees and gains or losses on asset sales.
Beginning in 2009, the company’s 25 percent interest in proved synthetic oil reserves in the Syncrude joint-venture and 70.96 percent interest in proved bitumen reserves in the Kearl project are included as part of the company’s total proved oil and gas reserves in accordance with revised U.S. Securities and Exchange Commission (SEC) and U.S. Financial Accounting Standards Board (FASB) rules. These reserves were reported as mining proven reserves, separate from proved oil and gas reserves, prior to 2009. Similarly, the company’s share of proved synthetic oil reserves from Syncrude and proved bitumen reserves from Kearl are included in the calculation of the standard measure of discounted future cash flows beginning in 2009. They were excluded in the 2007 and 2008 calculations. Beginning in 2009, results of operations, costs incurred in property acquisitions, exploration and development activities, and capitalized costs include the company’s share of Syncrude, Kearl and other unproved mineable acreages in the following tables. They were excluded in 2007 and 2008.
Results of operations
| millions of dollars | 2009 | 2008 | 2007 | |||
| Sales to customers (a) |
1,887 | 3,343 | 2,383 | |||
| Intersegment sales (a) (b) |
2,822 | 1,297 | 1,131 | |||
| 4,709 | 4,640 | 3,514 | ||||
| Production expenses |
2,212 | 1,335 | 1,074 | |||
| Exploration expenses |
151 | 122 | 100 | |||
| Depreciation and depletion |
540 | 337 | 371 | |||
| Income taxes |
489 | 814 | 526 | |||
| Results of operations (c) |
1,317 | 2,032 | 1,443 | |||
|
Costs incurred in property acquisitions, exploration and development activities
| ||||||
| millions of dollars | 2009 | 2008 | 2007 | |||
| Property costs (d) |
||||||
| Proved |
– | – | – | |||
| Unproved |
191 | 66 | 47 | |||
| Exploration costs |
233 | 133 | 74 | |||
| Development costs |
1,878 | 631 | 460 | |||
| Total costs incurred in property acquisitions, exploration and development activities (e) |
2,302 | 830 | 581 | |||
The amounts reported as costs incurred in property acquisitions, exploration and development activities include both capitalized costs and costs charged to expense during the year. Costs incurred also include new asset retirement obligations established in the current year, as well as increases or decreases to the asset retirement obligation resulting from changes in cost estimates or abandonment date.
104
Table of Contents
Supplemental information on oil and gas exploration and production activities (unaudited) (continued)
Capitalized costs
| millions of dollars | 2009 | 2008 | ||
| Property costs (d) |
||||
| Proved |
3,170 | 3,168 | ||
| Unproved |
482 | 214 | ||
| Producing assets |
11,847 | 7,253 | ||
| Support facilities |
237 | 181 | ||
| Incomplete construction |
2,710 | 691 | ||
| Total capitalized cost (f) |
18,446 | 11,507 | ||
| Accumulated depreciation and depletion |
(9,332) | (7,832) | ||
| Net capitalized costs (f) |
9,114 | 3,675 |
| a) | Sales to customers or intersegment sales do not include the sale of natural gas and natural gas liquids purchased for resale, as well as royalty payments. These items are reported gross in note 3 in “external sales”, “intersegment sales” and in “purchases of crude oil and products”. |
| b) | Sales of crude oil to consolidated affiliates are at market value, using posted field prices. Sales of natural gas liquids to consolidated affiliates are at prices estimated to be obtainable in a competitive, arm’s-length transaction. |
| c) | In 2009, the impact of including the company’s interests in Syncrude, Kearl and other unproved mineable acreages in results of operations was $1,625 million in sales and $308 million in earnings. |
| d) | “Property costs” are payments for rights to explore for petroleum and natural gas and for purchased reserves (acquired tangible and intangible assets such as gas plants, production facilities and producing-well costs are included under “producing assets”). “Proved” represents areas where successful drilling has delineated a field capable of production. “Unproved” represents all other areas. |
| e) | In 2009, costs incurred in property acquisitions, exploration and development activities included $1,464 million from the company’s interests in Syncrude, Kearl and other unproved mineable acreages. |
| f) | In 2009, the impact of including the company’s interests in Syncrude, Kearl and other unproved mineable acreages in capitalized costs was $6,265 million in total capitalized costs and $5,153 million in net capitalized costs. |
105
Table of Contents
Supplemental information on oil and gas exploration and production activities (unaudited) (continued)
Standardized measure of discounted future cash flows
As required by the FASB, the standardized measure of discounted future net cash flows was computed through 2008 by applying year-end prices, costs and legislated tax rates and a discount factor of 10 percent to net proved reserves. Beginning in 2009, the standardized measure of discounted future net cash flows was computed by applying first-day-of-the-month average prices, year-end costs and legislated tax rates and a discount factor of 10 percent to net proved reserves. The standardized measure includes costs for future dismantlement, abandonment and remediation obligations. The company believes the standardized measure does not provide a reliable estimate of the company’s expected future cash flows to be obtained from the development and production of its oil and gas properties or of the value of its proved oil and gas reserves. The standardized measure is prepared on the basis of certain prescribed assumptions, including first-day-of-the-month average prices, which represent discrete points in time and therefore may cause significant variability in cash flows from year to year as prices change.
Standardized measure of discounted future net cash flows related to proved oil and gas reserves
| millions of dollars | 2009 | 2008 | 2007 | |||
| Future cash flows |
138,279 | 18,956 | 32,415 | |||
| Future production costs |
(58,057) | (13,558) | (14,475) | |||
| Future development costs |
(20,893) | (4,642) | (3,548) | |||
| Future income taxes |
(14,307) | (111) | (3,655) | |||
| Future net cash flows |
45,022 | 645 | 10,737 | |||
| Annual discount of 10 percent for estimated timing of cash flows |
(31,647) | 613 | (4,487) | |||
| Discounted future cash flows |
13,375 | 1,258 | 6,250 | |||
|
Changes in standardized measure of discounted future net cash flows related to proved oil and gas reserves
| ||||||
| Balance at beginning of year |
1,258 | 6,250 | 6,415 | |||
| Changes resulting from: |
||||||
| Sales and transfers of oil and gas produced, net of production costs |
(2,658) | (3,422) | (2,430) | |||
| Net changes in prices, development costs and production costs |
9,856 | (6,016) | (625) | |||
| Extensions, discoveries, additions and improved recovery, less related costs |
1 | 25 | 164 | |||
| Development costs incurred during the year |
1,802 | 438 | 412 | |||
| Revisions of previous quantity estimates (a) |
7,265 | 1,460 | 1,285 | |||
| Accretion of discount |
178 | 689 | 710 | |||
| Net change in income taxes |
(4,327) | 1,834 | 319 | |||
| Net change |
12,117 | (4,992) | (165) | |||
| Balance at end of year |
13,375 | 1,258 | 6,250 | |||
| a) | Discounted future net cash flows associated with the first time reporting of the company’s share of proved reserves from Syncrude and Kearl in 2009 were $6,149 million. |
106
Table of Contents
Supplemental information on oil and gas exploration and production activities (unaudited) (continued)
Net Proved Reserves (a)
| Liquids (b) | Natural gas |
Synthetic oil |
Bitumen | Total oil-equivalent | ||||||
| millions of barrels |
billions of cubic feet |
millions of barrels |
millions of barrels |
millions of barrels | ||||||
| Beginning of year 2007 |
71 | 710 | – | 741 | 930 | |||||
| Revisions |
24 | 75 | – | (27) | 10 | |||||
| Improved recovery |
– | 1 | – | 6 | 6 | |||||
| (Sale)/purchase of reserves in place |
(1) | (12) | – | – | (3) | |||||
| Discoveries and extensions |
– | 8 | – | 44 | 45 | |||||
| Production |
(12) | (147) | – | (47) | (83) | |||||
| End of year 2007 |
82 | 635 | – | 717 | 905 | |||||
| Revisions |
(8) | 45 | – | (66) | (67) | |||||
| Improved recovery |
– | – | – | (1) | (1) | |||||
| (Sale)/purchase of reserves in place |
– | – | – | – | – | |||||
| Discoveries and extensions |
– | 4 | – | 25 | 26 | |||||
| Production |
(10) | (91) | – | (45) | (70) | |||||
| End of year 2008 |
64 | 593 | – | 630 | 793 | |||||
| Revisions |
8 | 98 | 715 | 1,075 | 1,814 | |||||
| Improved recovery |
– | – | – | – | – | |||||
| (Sale)/purchase of reserves in place |
– | (1) | – | – | – | |||||
| Discoveries and extensions |
– | – | – | – | – | |||||
| Production |
(9) | (100) | (24) | (44) | (94) | |||||
| End of year 2009 |
63 | 590 | 691 | 1,661 | 2,513 | |||||
| Net Proved Developed Reserves included above, as of | ||||||||||
| January 1, 2007 |
71 | 608 | – | 501 | 673 | |||||
| December 31, 2007 |
82 | 539 | – | 483 | 655 | |||||
| December 31, 2008 |
63 | 513 | – | 425 | 574 | |||||
| December 31, 2009 |
62 | 526 | 691 | 468 | 1,309 | |||||
| Net Proved Undeveloped Reserves included above, as of | ||||||||||
| December 31, 2009 |
1 | 64 | – | 1,193 | 1,204 | |||||
| a) | Net reserves are the company’s share of reserves after deducting the shares of mineral owners or governments or both. All reported reserves are located in Canada. Reserves of natural gas are calculated at a pressure of 14.73 pounds per square inch at 60°F. | |||
| b) | Liquids include crude, condensate and natural gas liquids (NGLs). | |||
| c) | Gas converted to oil-equivalent at 6 million cubic feet per one thousand barrels. | |||
| The information above describes changes during the years and balances of proved oil and gas reserves at year-end 2007, 2008 and 2009. 2009 year-end oil and gas reserves are
reported in accordance with the revised definitions under the U.S. Securities and Exchange Commission’s (SEC) Rule 4-10 (a) of Regulation S-X.
Proved oil and gas reserves are those quantities of oil and gas, which, by analysis of geoscience and engineering data, can be estimated with reasonable certainty to be economically producible – from a given date forward, from known reservoirs, and under existing economic conditions, operating methods and government regulations – prior to the time at which contracts providing the right to operate expire. In some cases, substantial new investments in additional wells and other facilities will be required to recover these proved reserves. | ||||
107
Table of Contents
Supplemental information on oil and gas exploration and production activities (unaudited) (continued)
In accordance with SEC amended rules, the 2009 year-end oil and gas reserves volumes as well as the reserves change categories shown in the proved reserves tables were calculated using average prices during the 12-month period prior to the ending date of the period covered by the report, determined as an unweighted arithmetic average of the first-day-of-the-month price for each month within such period. The year-end oil and gas reserves volumes for 2007 and 2008 as well as the reserve change categories for 2007 and 2008 shown in the reserves table were calculated using December 31 prices and costs. These reserves quantities were also used in calculating unit-of-production depreciation rates and in calculating the standardized measure of discounted net cash flow.
Revisions can include upward or downward changes in previously estimated volumes of proved reserves for existing fields due to the evaluation or revaluation of already available geologic, reservoir or production data; new geologic, reservoir or production data; or changes in prices and costs that are used in the determination of reserves. This category can also include significant changes in either development strategy or production equipment/facility capacity.
Net proved reserves are determined by deducting the estimated future share of mineral owners or governments or both. For liquids and natural gas, net proved reserves are based on estimated future royalty rates as of the date the estimate is made incorporating the Alberta government’s revised oil and gas royalty regime. For bitumen, net proved reserves are based on the company’s best estimate of average royalty rates over the life of each of the Cold Lake and Kearl projects and incorporate the Alberta government’s revised oil sands royalty regime. For synthetic oil, net proved reserves are based on the company’s best estimate of average royalty rates over the life of the project and incorporate amendments to the Syncrude Crown Agreement. In all cases, actual future royalty rates may vary with production, price and costs.
Net proved developed reserves are those volumes that are expected to be recovered through existing wells and facilities with existing equipment and operating methods or in which the cost of the required equipment is relatively minor compared to the cost of a new well or facility. Undeveloped reserves are those volumes that are expected to be recovered as a result of future investments to drill new wells, to recomplete existing wells and/or to install facilities to collect and deliver the production from existing and future wells and facilities.
As a result of the SEC’s amended Rule 4-10, bitumen extracted through mining activities and hydrocarbons from other non-traditional resources are permitted to be reported as oil and gas reserves. Included in the 2009 reported proved reserves for the first time are synthetic oil reserves of 691 million barrels, representing the company’s interest in the Syncrude joint-venture and bitumen reserves of 962 million barrels, representing the company’s interest in the Kearl project.
The amended rules also adopted a reliable technology definition that permits reserves to be added based on technologies that have been field tested and have been demonstrated to provide reasonably certain results with consistency and repeatability in the formation being evaluated.
The estimated impact of changing to an average of the first-day-of-the-month prices and the use of reliable technology was de minimis on the company’s proved reserves volumes in 2009.
No independent qualified reserves evaluator or auditor was involved in the preparation of the reserves data.
108
Table of Contents
Quarterly financial and stock trading data (a)
| 2009 | 2008 | ||||||||||||||||||||
| three months ended | three months ended | ||||||||||||||||||||
| Mar. 31 | June 30 | Sept. 30 | Dec. 31 | Mar. 31 | June 30 | Sept. 30 | Dec. 31 | ||||||||||||||
| Financial data (millions of dollars) | |||||||||||||||||||||
| Total revenues and other income |
4,670 | 5,303 | 5,561 | 5,864 | 7,263 | 8,859 | 9,515 | 5,942 | |||||||||||||
| Total expenses |
4,268 | 5,009 | 4,802 | 5,119 | 6,298 | 7,276 | 7,558 | 5,171 | |||||||||||||
| Income before income taxes |
402 | 294 | 759 | 745 | 965 | 1,583 | 1,957 | 771 | |||||||||||||
| Income taxes |
113 | 85 | 212 | 211 | 284 | 435 | 568 | 111 | |||||||||||||
| Net income |
289 | 209 | 547 | 534 | 681 | 1,148 | 1,389 | 660 | |||||||||||||
| Segmented net income (millions of dollars) | |||||||||||||||||||||
| Upstream |
142 | 252 | 439 | 491 | 650 | 938 | 999 | 336 | |||||||||||||
| Downstream |
202 | (38 | ) | 62 | 52 | 30 | 239 | 270 | 257 | ||||||||||||
| Chemical |
3 | 8 | 19 | 16 | 24 | 10 | 38 | 28 | |||||||||||||
| Corporate and other |
(58 | ) | (13 | ) | 27 | (25 | ) | (23 | ) | (39 | ) | 82 | 39 | ||||||||
| Net income |
289 | 209 | 547 | 534 | 681 | 1,148 | 1,389 | 660 | |||||||||||||
| Per-share information (dollars) |
|||||||||||||||||||||
| Net earnings - basic |
0.34 | 0.25 | 0.64 | 0.63 | 0.76 | 1.29 | 1.57 | 0.77 | |||||||||||||
| Net earnings - diluted |
0.33 | 0.25 | 0.64 | 0.62 | 0.75 | 1.28 | 1.57 | 0.76 | |||||||||||||
| Dividends (declared quarterly) |
0.10 | 0.10 | 0.10 | 0.10 | 0.09 | 0.09 | 0.10 | 0.10 | |||||||||||||
| Share prices (dollars) (b) |
|||||||||||||||||||||
| Toronto Stock Exchange |
|||||||||||||||||||||
| High |
46.48 | 49.11 | 44.33 | 44.80 | 58.09 | 62.54 | 57.80 | 46.43 | |||||||||||||
| Low |
35.95 | 40.35 | 38.35 | 38.50 | 45.80 | 52.41 | 41.60 | 28.79 | |||||||||||||
| Close |
45.80 | 45.12 | 40.75 | 40.66 | 53.80 | 56.16 | 45.58 | 40.99 | |||||||||||||
| NYSE Amex (U.S. dollars) (b) |
|||||||||||||||||||||
| High |
38.00 | 42.98 | 40.93 | 43.13 | 58.91 | 63.08 | 56.89 | 43.66 | |||||||||||||
| Low |
28.44 | 33.61 | 34.61 | 36.16 | 44.30 | 51.24 | 40.00 | 23.84 | |||||||||||||
| Close |
36.05 | 38.46 | 38.03 | 38.66 | 52.26 | 55.07 | 42.60 | 33.72 | |||||||||||||
| Shares traded (thousands) (c) |
107,148 | 88,093 | 62,764 | 60,050 | 98,531 | 101,826 | 129,650 | 147,567 | |||||||||||||
| a) | Quarterly data has not been audited by the company’s independent auditors. | |||
| b) | Imperial’s shares are listed on the Toronto Stock Exchange. The company’s shares also trade in the United States of America on the NYSE Amex LLC. Imperial has unlisted privileges on the NYSE Amex LLC, a subsidiary of NYSE Euronext. The symbol on these exchanges for Imperial’s common shares is IMO. Share prices were obtained from stock exchange records. U.S. dollar share price presented is based on consolidated U.S. market data. | |||
| c) | The number of shares traded is based on transactions on the above stock exchanges. |
109