Attached files
| file | filename |
|---|---|
| EX-99.1 - EX-99.1 - US BANCORP \DE\ | c62385exv99w1.htm |
| 8-K - FORM 8-K - US BANCORP \DE\ | c62385e8vk.htm |
Exhibit 99.2

| U.S. Bancorp 4Q10 Earnings Conference Call January 19, 2011 Richard K. Davis Chairman, President and CEO Andy Cecere Vice Chairman and CFO |

| 2 Forward-looking Statements and Additional Information The following information appears in accordance with the Private Securities Litigation Reform Act of 1995: This presentation contains forward-looking statements about U.S. Bancorp. Statements that are not historical or current facts, including statements about beliefs and expectations, are forward-looking statements and are based on the information available to, and assumptions and estimates made by, management as of the date made. These forward-looking statements cover, among other things, anticipated future revenue and expenses and the future plans and prospects of U.S. Bancorp. Forward-looking statements involve inherent risks and uncertainties, and important factors could cause actual results to differ materially from those anticipated. Global and domestic economies could fail to recover from the recent economic downturn or could experience another severe contraction, which could adversely affect U.S. Bancorp's revenues and the values of its assets and liabilities. Global financial markets could experience a recurrence of significant turbulence, which could reduce the availability of funding to certain financial institutions and lead to a tightening of credit, a reduction of business activity, and increased market volatility. Stress in the commercial real estate markets, as well as a delay or failure of recovery in the residential real estate markets, could cause additional credit losses and deterioration in asset values. In addition, U.S. Bancorp's business and financial performance is likely to be impacted by effects of recently enacted and future legislation and regulation. U.S. Bancorp's results could also be adversely affected by continued deterioration in general business and economic conditions; changes in interest rates; deterioration in the credit quality of its loan portfolios or in the value of the collateral securing those loans; deterioration in the value of securities held in its investment securities portfolio; legal and regulatory developments; increased competition from both banks and non-banks; changes in customer behavior and preferences; effects of mergers and acquisitions and related integration; effects of critical accounting policies and judgments; and management's ability to effectively manage credit risk, residual value risk, market risk, operational risk, interest rate risk and liquidity risk. For discussion of these and other risks that may cause actual results to differ from expectations, refer to U.S. Bancorp's Annual Report on Form 10-K for the year ended December 31, 2009, on file with the Securities and Exchange Commission, including the sections entitled "Risk Factors" and "Corporate Risk Profile" contained in Exhibit 13, and all subsequent filings with the Securities and Exchange Commission under Sections 13(a), 13(c), 14 or 15(d) of the Securities Exchange Act of 1934. Forward-looking statements speak only as of the date they are made, and U.S. Bancorp undertakes no obligation to update them in light of new information or future events. This presentation includes non-GAAP financial measures to describe U.S. Bancorp's performance. The reconciliations of those measures to GAAP measures are provided within or in the appendix of the presentation. These disclosures should not be viewed as a substitute for operating results determined in accordance with GAAP, nor are they necessarily comparable to non-GAAP performance measures that may be presented by other companies. |
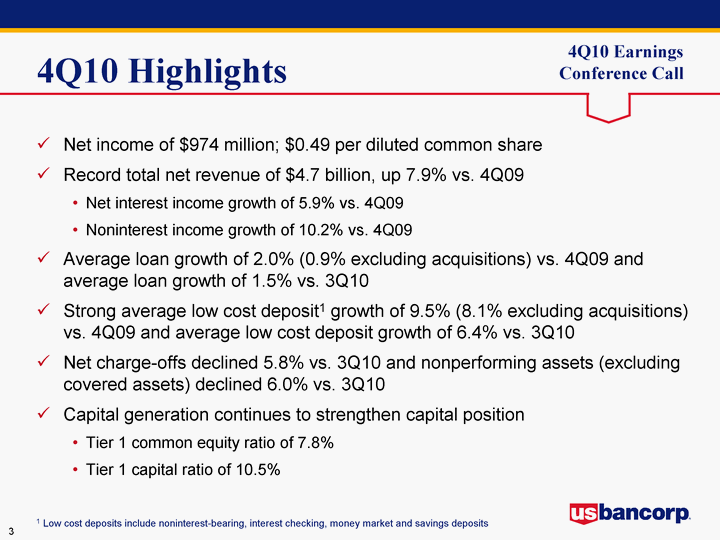
| 4Q10 Highlights Net income of $974 million; $0.49 per diluted common share Record total net revenue of $4.7 billion, up 7.9% vs. 4Q09 Net interest income growth of 5.9% vs. 4Q09 Noninterest income growth of 10.2% vs. 4Q09 Average loan growth of 2.0% (0.9% excluding acquisitions) vs. 4Q09 and average loan growth of 1.5% vs. 3Q10 Strong average low cost deposit1 growth of 9.5% (8.1% excluding acquisitions) vs. 4Q09 and average low cost deposit growth of 6.4% vs. 3Q10 Net charge-offs declined 5.8% vs. 3Q10 and nonperforming assets (excluding covered assets) declined 6.0% vs. 3Q10 Capital generation continues to strengthen capital position Tier 1 common equity ratio of 7.8% Tier 1 capital ratio of 10.5% 1 Low cost deposits include noninterest-bearing, interest checking, money market and savings deposits |

| Performance Ratios 4Q09 1Q10 2Q10 3Q10 4Q10 Return on Avg Common Equity 0.096 0.105 0.134 0.128 0.137 Return on Avg Common Equity 0.096 0.105 0.118 0.128 0.137 Return on Avg Assets 0.0086 0.0096 0.0109 0.0126 0.0131 4Q09 1Q10 2Q10 3Q10 4Q10 Efficiency Ratio 0.491 0.49 0.524 0.519 0.525 Net Interest Margin 0.0383 0.039 0.039 0.0391 0.0383 ROCE and ROA Efficiency Ratio and Net Interest Margin Return on Avg Common Equity Return on Avg Assets Efficiency Ratio Net Interest Margin Efficiency ratio computed as noninterest expense divided by the sum of net interest income on a taxable-equivalent basis and noninterest income excluding securities gains (losses) net * Adjusted for ITS transaction (reported net income $862 million - $118 million ITS transaction equity impact + $13 million debt extinguishment costs (net of tax) = adjusted net income of $757 million; see slide 13) |

| Capital Position $ in billions |

| 4Q09 1Q10 2Q10 3Q10 4Q10 Loans 191.6 192.9 191.2 192.5 195.5 Deposits 180.9 182.5 183.3 182.7 190.3 Loan and Deposit Growth Average Balances Year-Over-Year Growth 4Q10 Acquisition Adjusted Loan Growth = 0.9% Deposit Growth = 5.1% 8.2% $191.6 3.9% $192.9 4.0% $191.2 5.8% $192.5 2.0% $195.5 25.2% $180.9 13.7% $182.5 12.3% $183.3 9.8% $182.7 5.2% $190.3 $ in billions |
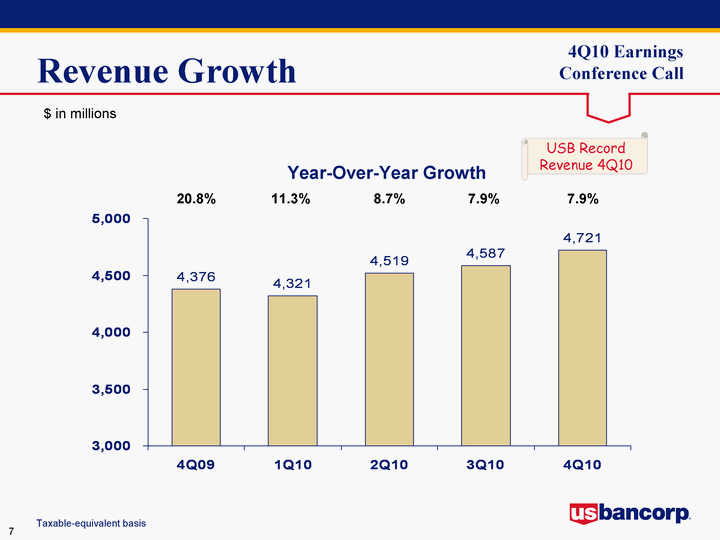
| Taxable-equivalent basis Revenue Growth Year-Over-Year Growth 20.8% 11.3% 8.7% 7.9% 7.9% $ in millions 4Q09 1Q10 2Q10 3Q10 4Q10 Reported 4376 4321 4519 4587 4721 USB Record Revenue 4Q10 |
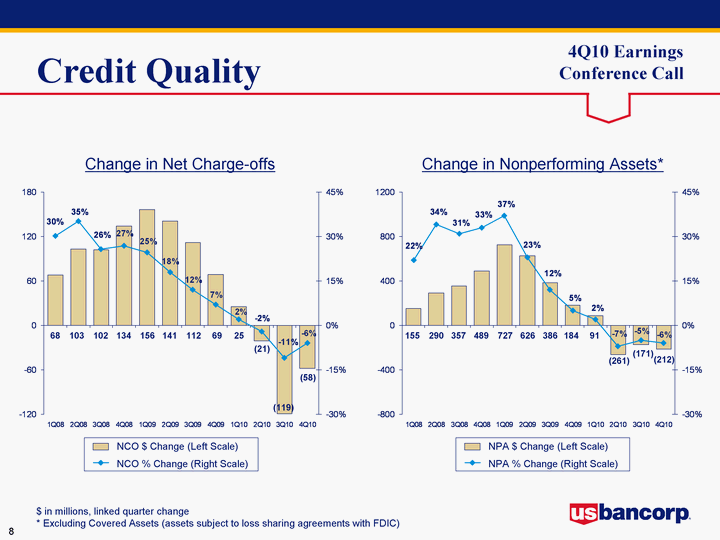
| 3Q07 4Q07 1Q08 2Q08 3Q08 4Q08 1Q09 2Q09 3Q09 4Q09 1Q10 2Q10 3Q10 4Q10 NPA $ Change 76 49 155 290 357 489 727 626 386 184 91 -261 -171 -212 NPA % Change 0.13 0.08 0.22 0.34 0.31 0.33 0.37 0.23 0.12 0.05 0.02 -0.07 -0.05 -0.06 3Q07 4Q07 1Q08 2Q08 3Q08 4Q08 1Q09 2Q09 3Q09 4Q09 1Q10 2Q10 3Q10 4Q10 NCO $ Change 8 26 68 103 102 134 156 141 112 69 25 -21 -119 -58 NCO % Change 0.041884817 0.130653266 0.302222222 0.351535836 0.257575758 0.269076305 0.246835443 0.17893401 0.12056 0.07 0.02 -0.02 -0.11 -0.06 Credit Quality $ in millions, linked quarter change * Excluding Covered Assets (assets subject to loss sharing agreements with FDIC) Change in Net Charge-offs Change in Nonperforming Assets* NCO $ Change (Left Scale) NCO % Change (Right Scale) NPA $ Change (Left Scale) NPA % Change (Right Scale) 103 68 (21) 25 69 112 141 156 134 102 155 290 91 184 386 626 727 489 357 (261) (119) (171) (58) (212) |

| Credit Quality - Outlook The Company expects the level of Net Charge-offs and Nonperforming Assets, excluding covered assets, to trend lower during 1Q11 1Q08 2Q08 3Q08 4Q08 1Q09 2Q09 3Q09 4Q09 1Q10 2Q10 3Q10 4Q10 30 to 89 % 0.010601156 0.0103876 0.011833483 0.016222915 0.017008547 0.014526577 0.014428656 0.014800805 0.013381895 0.011072197 0.01 0.0104 90+ % 0.004270373 0.004141298 0.004633146 0.005564539 0.006834344 0.007245829 0.00775995 0.008820331 0.007760089 0.007220238 0.0066 0.0061 1Q08 2Q08 3Q08 4Q08 1Q09 2Q09 3Q09 4Q09 1Q10 2Q10 3Q10 4Q10 Chg Criticized Assets 0.181945238 0.228090362 0.156114108 0.359501198 0.275796154 0.002013557 0.057701718 0.001878723 -0.012658584 -0.159651986 -0.08 -0.09 Delinquencies* Changes in Criticized Assets* * Excluding Covered Assets (assets subject to loss sharing agreements with FDIC) |
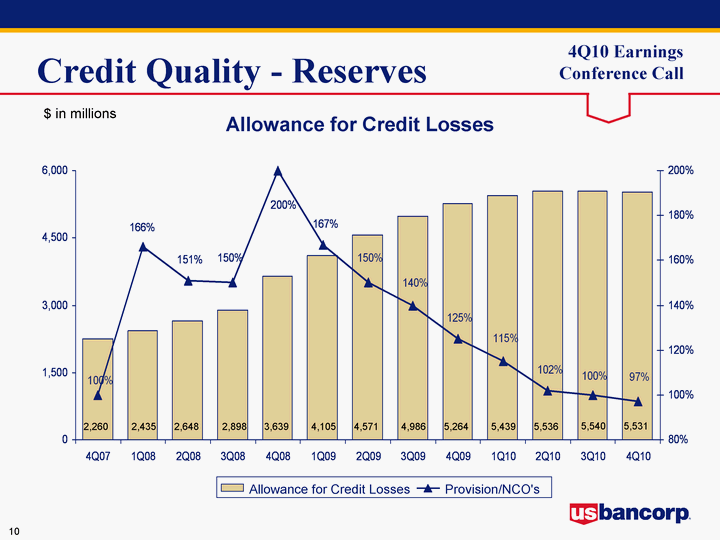
| Credit Quality - Reserves 4Q07 1Q08 2Q08 3Q08 4Q08 1Q09 2Q09 3Q09 4Q09 1Q10 2Q10 3Q10 4Q10 Allowance 2260 2435 2648 2898 3639 4105 4571 4986 5264 5439 5536 5540 5531 Provision/NCO's 1 1.66 1.51 1.5 2 1.67 1.5 1.4 1.25 1.15 1.02 1 0.97 Allowance for Credit Losses Allowance for Credit Losses Provision/NCO's $ in millions 5,536 5,439 5,264 4,986 4,571 4,105 3,639 2,898 2,648 2,435 2,260 5,540 5,531 |
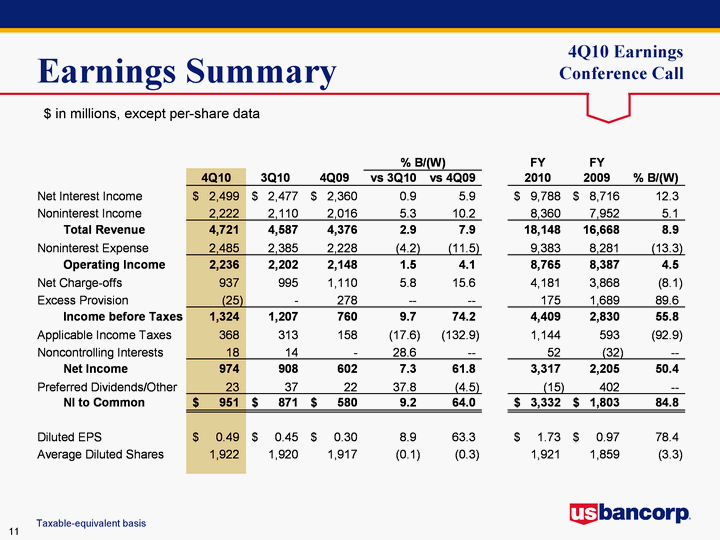
| Earnings Summary $ in millions, except per-share data Taxable-equivalent basis |

| 4Q10 Results - Key Drivers vs. 4Q09 Net Revenue growth of 7.9% (2.2% excluding significant items) Net interest income growth of 5.9%; net interest margin of 3.83% vs. 3.83% Noninterest income growth of 10.2% (decline of 1.9% excluding significant items) Significant items: net change of $247 million Noninterest expense growth of 11.5% Provision for credit losses lower by $476 million Net charge-offs lower by $173 million Provision lower than NCOs by $25 million; provision in excess of NCOs by $278 million in 4Q09 vs. 3Q10 Net Revenue growth of 2.9% (0.8% excluding significant items) Net interest income growth of 0.9%; net interest margin of 3.83% vs. 3.91% Noninterest income growth of 5.3% (growth of 0.7% excluding significant items) Significant items: net change of $98 million Noninterest expense growth of 4.2% Provision for credit losses lower by $83 million Net charge-offs lower by $58 million Provision lower than NCOs by $25 million; provision equal to NCOs in 3Q10 |
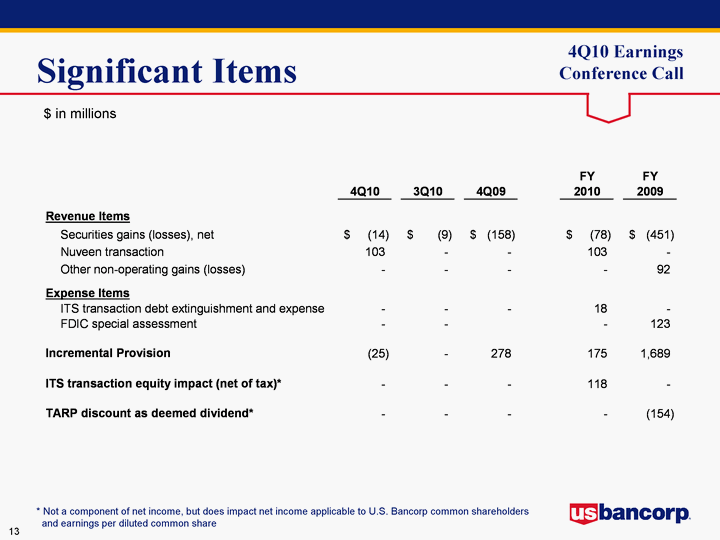
| Significant Items $ in millions * Not a component of net income, but does impact net income applicable to U.S. Bancorp common shareholders and earnings per diluted common share |
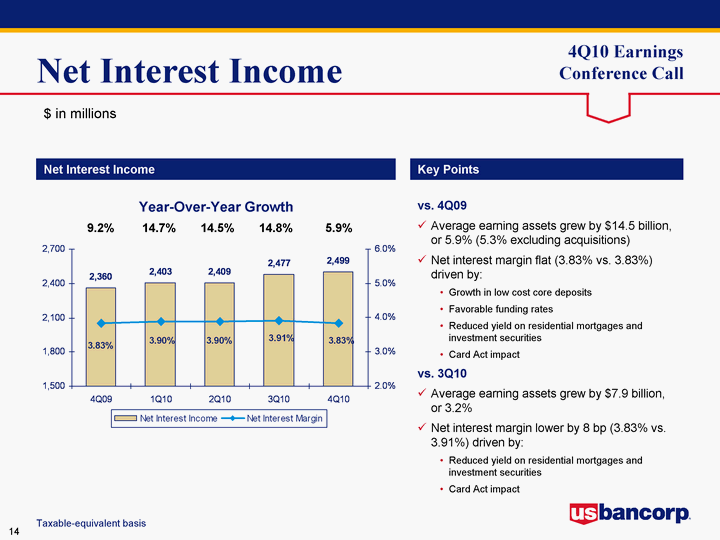
| Net Interest Income 4Q09 1Q10 2Q10 3Q10 4Q10 Net Interest Income 2360 2403 2409 2477 2499 Net Interest Margin 0.0383 0.039 0.039 0.0391 0.0383 Net Interest Income Key Points $ in millions Taxable-equivalent basis vs. 4Q09 Average earning assets grew by $14.5 billion, or 5.9% (5.3% excluding acquisitions) Net interest margin flat (3.83% vs. 3.83%) driven by: Growth in low cost core deposits Favorable funding rates Reduced yield on residential mortgages and investment securities vs. 3Q10 Average earning assets grew by $7.9 billion, or 3.2% Net interest margin lower by 8 bp (3.83% vs. 3.91%) driven by: Reduced yield on residential mortgages and investment securities Card Act impact Year-Over-Year Growth 9.2% 14.7% 14.5% 14.8% 5.9% |

| Average Loans 4Q09 1Q10 2Q10 3Q10 4Q10 Covered 18.504 21.415 20.454 19.308 18.572 Commercial 49.979 47.282 46.34 46.784 47.712 CRE 34.044 34.151 34.164 34.19 34.577 Res Mtg 25.621 26.408 26.821 27.89 29.659 Retail 63.5 63.622 63.382 64.369 64.964 Average Loans Key Points $ in billions Year-Over-Year Growth 8.2% 3.9% 4.0% 5.8% 2.0% $191.2 $192.5 $195.5 $191.6 $192.9 Retail Res Mtg Covered CRE Commercial vs. 4Q09 Average total loans grew by $3.9 billion, or 2.0% (increased by 0.9% excluding acquisitions) Average total commercial loans declined $2.3 billion, or 4.5%, primarily due to reduction in utilization of revolving lines of credit (26% 4Q10 vs. 30% 4Q09) and reduced demand for new loans vs. 3Q10 Average total loans grew by $3.0 billion, or 1.5% Average total commercial loans grew by $0.9 billion, or 2.0%, due to rise in demand for new loans |

| Average Deposits 4Q09 1Q10 2Q10 3Q10 4Q10 Time 45.774 45.606 43.607 43.607 42.388 Money Market 38.485 40.902 40.256 38.005 39.585 Checking & Savings 55.64 58.023 59.538 61.316 65.39 Noninterest-bearing 40.99 38 39.917 39.732 42.95 Average Deposits Key Points $ in billions Year-Over-Year Growth 25.2% 13.7% 12.3% 9.8% 5.2% $183.3 $182.7 $190.3 $180.9 $182.5 Noninterest -bearing Checking & Savings Time Money Market vs. 4Q09 Average total deposits grew by $9.4 billion, or 5.2% (5.1% excluding acquisitions) Average low cost deposits (NIB, interest checking, money market and savings), grew by $12.8 billion, or 9.5% (8.1% excluding acquisitions) vs. 3Q10 Average total deposits increased by $7.6 billion, or 4.2% Average low cost deposits increased by $8.9 billion, or 6.4%, primarily due to higher corporate trust and broker dealer balances and increased balances in Consumer and Small Business Banking |
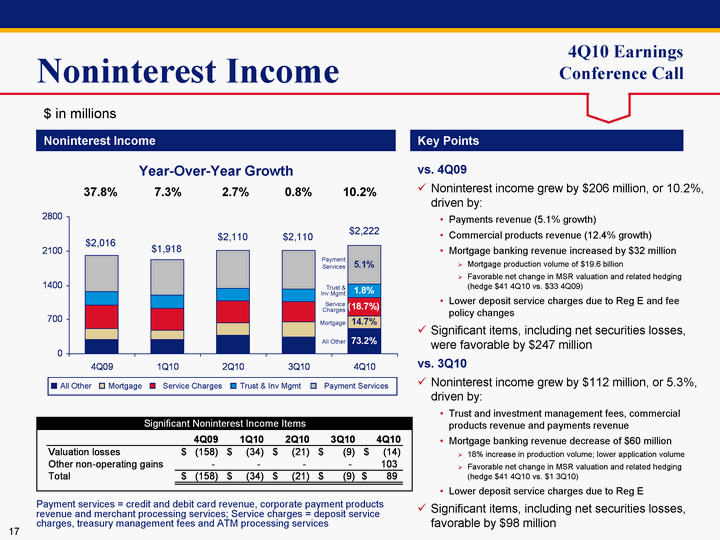
| Noninterest Income 4Q09 1Q10 2Q10 3Q10 4Q10 All Other 299 287 384 346 518 Mortgage 218 200 243 310 250 Service Charges 471 449 452 404 383 Trust & Inv Mgmt 277 264 267 267 282 Payment Services 751 718 764 783 789 Noninterest Income Key Points $ in millions Year-Over-Year Growth 37.8% 7.3% 2.7% 0.8% 10.2% $1,918 $2,110 $2,110 $2,222 $2,016 Trust & Inv Mgmt Service Charges All Other Mortgage Payment Services Payment services = credit and debit card revenue, corporate payment products revenue and merchant processing services; Service charges = deposit service charges, treasury management fees and ATM processing services All Other Mortgage Service Charges Trust & Inv Mgmt Payment Services vs. 4Q09 Noninterest income grew by $206 million, or 10.2%, driven by: Payments revenue (5.1% growth) Commercial products revenue (12.4% growth) Mortgage banking revenue increased by $32 million Mortgage production volume of $19.6 billion Favorable net change in MSR valuation and related hedging (hedge $41 4Q10 vs. $33 4Q09) Lower deposit service charges due to Reg E and fee policy changes Significant items, including net securities losses, were favorable by $247 million vs. 3Q10 Noninterest income grew by $112 million, or 5.3%, driven by: Trust and investment management fees, commercial products revenue and payments revenue Mortgage banking revenue decrease of $60 million 18% increase in production volume Favorable net change in MSR valuation and related hedging (hedge $41 4Q10 vs. $1 3Q10) Lower deposit service charges due to Reg E Significant items, including net securities losses, favorable by $98 million |
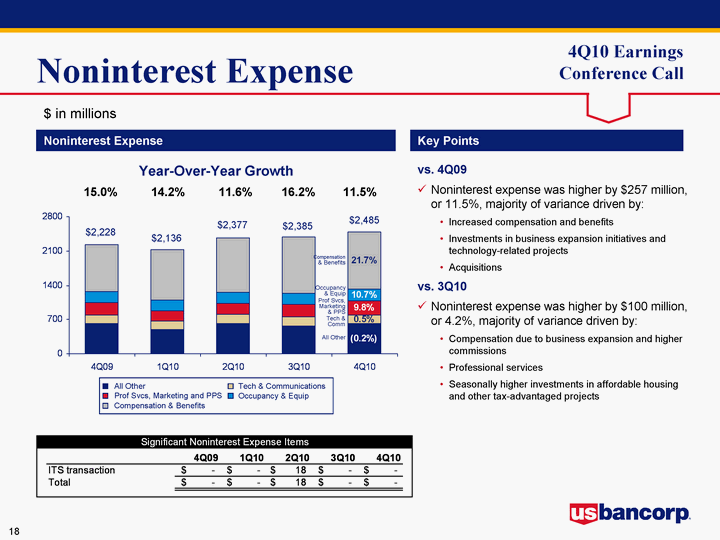
| Noninterest Expense 4Q09 1Q10 2Q10 3Q10 4Q10 All Other 611 491 613 566 610 Tech & Communications 186 185 186 186 187 Prof Svcs, Marketing and PPS 256 192 234 260 281 Occupancy & Equip 214 227 226 229 237 Compensation & Benefits 961 1041 1118 1144 1170 Noninterest Expense Key Points $ in millions Year-Over-Year Growth 15.0% 14.2% 11.6% 16.2% 11.5% $2,136 $2,377 $2,385 $2,485 $2,228 Occupancy & Equip Prof Svcs, Marketing & PPS All Other Tech & Comm Compensation & Benefits Occupancy & Equip All Other Tech & Communications Prof Svcs, Marketing and PPS Compensation & Benefits vs. 4Q09 Noninterest expense was higher by $257 million, or 11.5%, majority of variance driven by: Increased compensation and benefits Investments in business expansion initiatives and technology-related projects Acquisitions vs. 3Q10 Noninterest expense was higher by $100 million, or 4.2%, majority of variance driven by: Compensation due to business expansion and higher commissions Professional services Seasonally higher investments in affordable housing and other tax-advantaged projects |

| Mortgage Repurchase Mortgages Repurchased and Make-whole Payments Mortgage Representation and Warranties Reserve $ in millions 4Q10 3Q10 2Q10 1Q10 4Q09 Beginning Reserve $147 $101 $73 $72 $52 Net Realized Losses (27) (24) (20) (22) (6) Additions to Reserve 60 70 48 23 26 Ending Reserve $180 $147 $101 $73 $72 Mortgages repurchased and make-whole payments $69 $53 $27 $23 $35 Repurchase activity lower than peers due to: Conservative credit and underwriting culture Disciplined origination process Repurchase requests expected to remain slightly elevated over the next few quarters |

| Role of the Trustee in MBS Trustee role and responsibilities The Trustee: Performs administrative functions for the transaction such as maintaining bank accounts and holder records, receiving payments from servicers, and distributing funds and reports to investors as directed The Trustee does not: Initiate, and has no authority over, the foreclosure process Under standard trust agreements, have any duty to investigate on its own for the purpose of detecting defaults, fraud, or other breaches by the servicer; but will do so on behalf of the investors if given authority per terms established by the documents Servicer role and responsibilities The Servicer is appointed in the transaction document to collect payments on the loans and maintain loan level detail for the investors The Servicer is responsible for enforcing the terms of each mortgage loan, including declaring default and foreclosing on the property, and has the ability to modify terms within limitations specified by the transaction documents |

| Positioned to Win USB is well-positioned to produce industry-leading performance with... a strong foundation, including excellent credit and risk management, a diversified business mix and prudent capital management a proven track record initiatives to build relevant, profitable scale in each of our business lines investments in new technology to increase revenue, improve efficiency and enhance service strategies to provide the highest quality customer experience and maintain a highly engaged employee base ...creating superior shareholder value |

| Appendix |

| Credit Quality - Commercial Loans 4Q09 1Q10 2Q10 3Q10 4Q10 Average Loans 43490 40837 40095 40726 41700 Net Charge-offs Ratio 0.0228 0.0241 0.0223 0.0149 0.0111 Average Loans and Net Charge-offs Ratios Key Statistics Comments Overall delinquencies continue to decline significantly Nonperforming loans and net charge-offs both showed substantial improvement again this quarter Commercial utilization remains low but has stabilized 4Q09 3Q10 4Q10 Average Loans 43,490 40,726 41,700 30-89 Delinquencies 1.02% 0.76% 0.57% 90+ Delinquencies 0.25% 0.22% 0.15% Nonperforming Loans 2.05% 1.43% 1.23% 4Q08 1Q09 2Q09 3Q09 4Q09 1Q10 2Q10 3Q10 4Q10 Utilization 0.3762 0.3716 0.3538 0.3197 0.3007 0.2798 0.27 0.2646 0.2608 Revolving Line Utilization Trend $ in millions |

| EF ST Balance 2469 3663 Credit Quality - Commercial Leases 4Q09 1Q10 2Q10 3Q10 4Q10 Average Loans 6489 6445 6245 6058 6012 Net Charge-offs Ratio 0.0202 0.0214 0.0141 0.0118 0.0112 Average Loans and Net Charge-offs Ratios Key Statistics Comments Net charge-offs declined slightly while early stage delinquencies continue to improve Nonperforming loans improved significantly this quarter 4Q09 3Q10 4Q10 Average Loans 6,489 6,058 6,012 30-89 Delinquencies 2.07% 1.45% 1.34% 90+ Delinquencies --% 0.02% 0.02% Nonperforming Loans 1.91% 1.83% 1.27% $ in millions Equipment Finance $2,349 Small Ticket $3,663 |

| Multi-Family Retail Res Construction Condo Construction A&D Commercial Office Other balance 1894 1086 1203 487 930 877 1350 Inv Owner balance 15545 11205 Credit Quality - Commercial Real Estate 4Q09 1Q10 2Q10 3Q10 4Q10 Avg Loans 34044 34151 34164 34190 34577 NCO Ratio 0.0203 0.0228 0.0267 0.024 0.0251 NCO Ratio - Mtg 0.0048 0.0073 0.0111 0.0172 0.0133 NCO Ratio - Construction 0.0624 0.068 0.0731 0.0456 0.0654 Average Loans and Net Charge-offs Ratios Key Statistics Comments Nonperforming loans continue to trend lower Net charge-offs on construction loans remain high while net charge-offs on commercial mortgages have stabilized Early stage delinquencies increased during the quarter as the portfolio remains under stress 4Q09 3Q10 4Q10 Average Loans 34,044 34,190 34,577 30-89 Delinquencies 1.49% 0.50% 1.20% 90+ Delinquencies 0.02% 0.05% --% Nonperforming Loans 5.20% 4.15% 3.73% Performing TDRs 110 70 15 $ in millions Multi-family $1,894 Other $1,350 Office $877 A&D Construction $930 Retail $1,086 Condo Construction $487 Residential Construction $1,203 Investor $15,545 Owner Occupied $11,205 CRE Mortgage CRE Construction Average Loans Net Charge-offs Ratio NCO Ratio - Comm Mtg NCO Ratio - Construction |

| 4Q09 1Q10 2Q10 3Q10 4Q10 Restructured 1354 1560 1672 1747 1804 Credit Quality - Residential Mortgage 4Q09 1Q10 2Q10 3Q10 4Q10 Average Loans 25621 26408 26821 27890 29659 Net Charge-offs Ratio 0.0237 0.0223 0.0206 0.0188 0.0175 Average Loans and Net Charge-offs Ratios Key Statistics Comments Strong growth in new originations (weighted average FICO 763, weighted average LTV 66%) as average loans increased 6.3% vs. 3Q10 driven by demand for refinancing Delinquencies, nonperforming loans, and net charge-offs continuing to decline Continue to help home owners by successfully modifying 1,306 loans under the HAMP program (owned & serviced) in 4Q10, representing $261 million in balances 4Q09 3Q10 4Q10 Average Loans 25,621 27,890 29,659 30-89 Delinquencies 2.36% 1.65% 1.48% 90+ Delinquencies 2.80% 1.75% 1.63% Nonperforming Loans 1.79% 2.15% 2.07% Residential Mortgage Performing TDRs $ in millions |

| Credit Quality - Home Equity 4Q09 1Q10 2Q10 3Q10 4Q10 Average Loans 19444 19402 19332 19289 19119 Net Charge-offs Ratio 0.0196 0.0188 0.0164 0.0162 0.0172 Average Loans and Net Charge-offs Ratios Key Statistics Comments Strong credit quality portfolio (weighted average FICO 746, weighted average CLTV 72%) originated primarily through the retail branch network to existing bank customers on their primary residence Loan demand remains soft for home equity products Delinquencies and nonperforming loans remain relatively stable 4Q09 3Q10 4Q10 Average Loans 19,444 19,289 19,119 30-89 Delinquencies 0.93% 0.93% 0.93% 90+ Delinquencies 0.78% 0.73% 0.78% Nonperforming Loans 0.17% 0.18% 0.19% Traditional: 87% Wtd Avg LTV: 71% NCO: 1.27% Consumer Finance: 13% Wtd Avg LTV: 81% NCO: 4.70% $ in millions Traditional Consumer Finance Balance 87 13 |
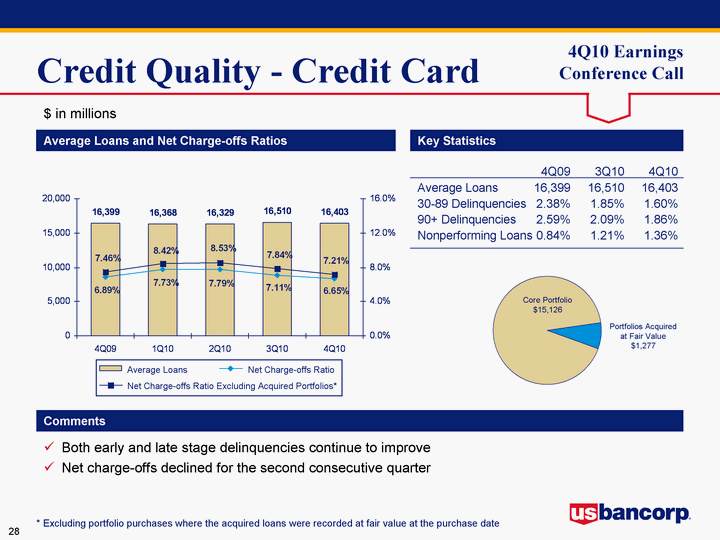
| Traditional Consumer Finance Balance 15126 1277 4Q09 3Q10 4Q10 Average Loans 16,399 16,510 16,403 30-89 Delinquencies 2.38% 1.85% 1.60% 90+ Delinquencies 2.59% 2.09% 1.86% Nonperforming Loans 0.84% 1.21% 1.36% Credit Quality - Credit Card 4Q09 1Q10 2Q10 3Q10 4Q10 Average Loans 16399 16368 16329 16510 16403 Net Charge-offs Ratio 0.0689 0.0773 0.0779 0.0711 0.0665 Net Charge-offs Ratio Excluding Acquired Portfolios* 0.0746 0.0842 0.0853 0.0784 0.0721 Average Loans and Net Charge-offs Ratios Key Statistics Comments Both early and late stage delinquencies continue to improve Net charge-offs declined for the second consecutive quarter $ in millions * Excluding portfolio purchases where the acquired loans were recorded at fair value at the purchase date 2Q09 Average Loans Net Charge-offs Ratio Net Charge-offs Ratio Excluding Acquired Portfolios* Core Portfolio $15,126 Portfolios Acquired at Fair Value $1,277 |

| Credit Quality - Retail Leasing 4Q09 1Q10 2Q10 3Q10 4Q10 Average Loans 4620 4509 4364 4289 4459 Net Charge-offs Ratio 0.0043 0.0045 0.0037 0.0019 0.0009 Average Loans and Net Charge-offs Ratios Key Statistics Comments Average loans increased during the quarter as demand for new auto leases increased Retail leasing net charge-offs and delinquencies continue to improve, reaching pre-recession levels Strong used auto values continue to reduce end of term risk and net charge-offs 4Q09 3Q10 4Q10 Average Loans 4,620 4,289 4,459 30-89 Delinquencies 0.74% 0.46% 0.37% 90+ Delinquencies 0.11% 0.05% 0.05% Nonperforming Loans --% --% --% $ in millions 4Q08 1Q09 2Q09 3Q09 4Q09 1Q10 2Q10 3Q10 4Q10 Index 102.8 102.8 109 116.1 117.7 118.3 120.5 119.2 123.9 Manheim Used Vehicle Value Index* * Manheim Used Vehicle Value Index source: www.manheimconsulting.com, January 1995 = 100, quarter value = average monthly ending value |

| Auto Install Student Revolving Balance 10823 5537 5104 3519 Credit Quality - Other Retail 4Q09 1Q10 2Q10 3Q10 4Q10 Average Loans 23037 23343 23357 24281 24983 Net Charge-offs Ratio 0.0191 0.0193 0.017 0.0165 0.0145 Average Loans and Net Charge-offs Ratios Key Statistics Comments Average balances increased as demand for auto loans increased during the quarter Net charge-offs continue to decline Delinquencies and nonperforming loans remain stable 4Q09 3Q10 4Q10 Average Loans 23,037 24,281 24,983 30-89 Delinquencies 1.10% 0.81% 0.85% 90+ Delinquencies 0.40% 0.28% 0.26% Nonperforming Loans 0.13% 0.11% 0.12% Installment $5,537 Auto Loans $10,823 Revolving Credit $3,519 Student Lending $5,104 $ in millions 30 |

| 4Q09 1Q10 2Q10 3Q10 4Q10 Foreclosure Starts - Insured/Serviced 7160 7632 7738 7778 7835 Foreclosure Starts - Portfolio 2413 2231 1659 1717 1757 Average per Day 154 162 147 148 152 Foreclosures Number of Foreclosure Starts Judicial Non Mix 63 37 Judicial 63% Non Judicial 37% Primary goal is to keep borrowers in their homes Actively participate in programs designed to assist homeowners and prevent foreclosures Manageable size and quality of portfolio allow effective internal management and control Internal assessment and review of policies and procedures confirmed quality of processes and controls U.S. Bank does not plan to halt foreclosures Foreclosure Starts - Portfolio Foreclosure Starts - Serviced/Insured Average per Day Active Foreclosures 31,931 Average Days in Foreclosure 267 days Judicial 302 days Non-Judicial 206 days 9,573 9,863 9,397 9,495 9,592 |

| Non-Regulatory Capital Ratios $ in millions |

| U.S. Bancorp 4Q10 Earnings Conference Call January 19, 2011 |
