Attached files
| file | filename |
|---|---|
| 8-K - FORM 8-K - JONES SODA CO | v57917e8vk.htm |
Exhibit 99.1

| Jones Soda Co. Annual Shareholder Meeting May 27, 2009 ICR XChange Conference - January 13, 2011 |
| Safe Harbor Language Certain statements in this presentation are "forward-looking statements" within the meaning of the Private Securities Litigation Reform Act of 1995, including, without limitation, statements regarding our expected cash balance as of December 31, 2010 and statements that address future operating performance, events or developments that management expects or anticipates will or may occur in the future, including statements related to distributor channels, volume growth, revenues, profitability, new products and adequacy of funds from operations. Words such as "aim," "believe," "expect," "intend," "anticipate," "estimate," "may," "will," "can," "plan," "predict," "could," "future," variations of such words, and similar expressions identify forward-looking statements, but are not the exclusive means of identifying such statements. Forward-looking statements are subject to risks and uncertainties that could cause actual results to differ materially from those anticipated in such forward-looking statements. Factors that could affect our actual results include, among others, our ability to successfully execute on our 2011 operating plan; our ability to secure additional financing; our ability to use the net proceeds from future financings to improve our financial condition or market value; our inability to increase points of distribution for our products or to successfully innovate new products and product extensions; our inability to establish distribution arrangements with distributors, retailers or national retail accounts; our inability to receive returns on our trade spending and slotting fee expenditures; our inability to maintain brand image and product quality; our inability to develop new products to satisfy customer preferences and the impact of intense competition from other beverage suppliers. More information about factors that potentially could affect our financial results is included in our current and periodic reports filed with the Securities and Exchange Commission, including our most recent annual report on Form 10-K and quarterly reports on Form 10-Q filed in 2010. You are cautioned not to place undue reliance upon these forward-looking statements, which speak only as to the date of this presentation. Except as required by law, we undertakes no obligation to update any forward-looking or other statements in this presentation, whether as a result of new information, future events or otherwise. |
| Jones Soda Introduction Core focus Product portfolio Key performance indicators 2010 Key Events 3 contents |
|
2010
-
2008
2007
2006
2003
2001
2000
1996
2004
2009
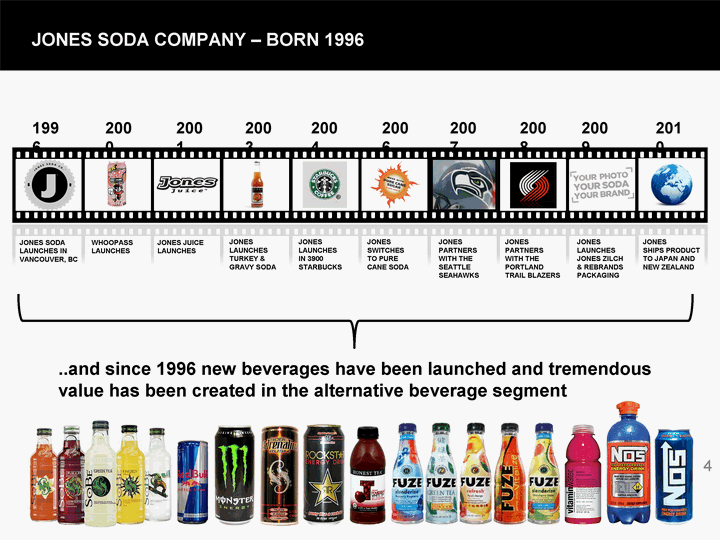
Jones soda company - born 1996
Jones Soda
launches in
Vancouver, BC
Whoopass
Launches
Jones juice
launches
Jones
Launches
Turkey &
Gravy soda
Jones
Launches
In 3900
starbucks
Jones
switches
To pure
cane soda
Jones
partners
With the
seattle
seahawks
Jones
partners
With the
portland
Trail blazers
Jones
Launches
Jones zilch
& rebrands
packaging
Jones
Ships product
to japan and
new zealand
..and since 1996 new beverages have been launched and tremendous value has been created in the alternative beverage segment 4 |
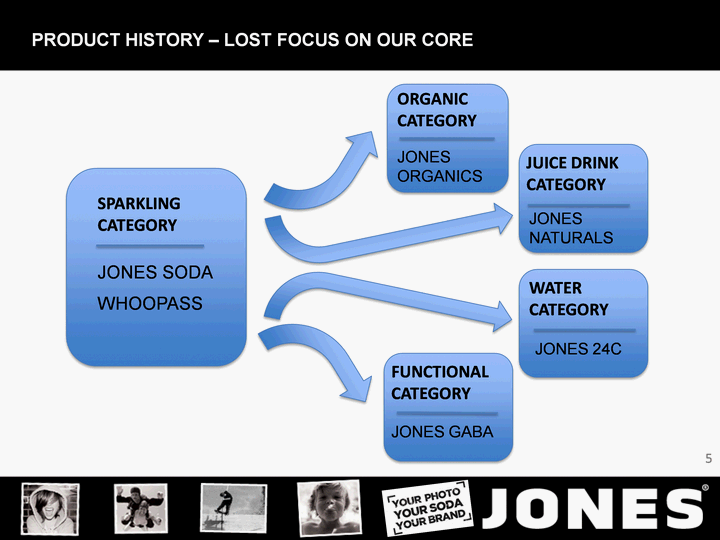
| Jones Soda WhoopAss Jones Organics ORGANIC CATEGORY Jones GABA FUNCTIONAL CATEGORY SPARKLING CATEGORY Product history - Lost focus on our core 5 |
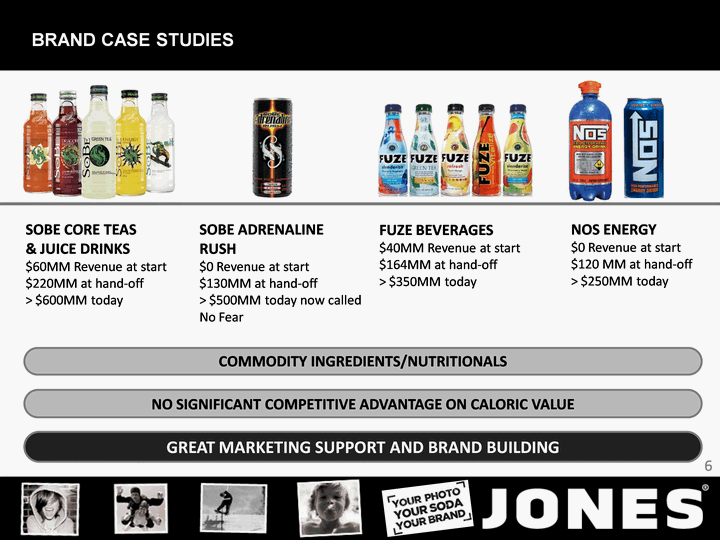
| SoBe Core Teas & Juice Drinks $60MM Revenue at start $220MM at hand-off > $600MM today SoBe Adrenaline Rush $0 Revenue at start $130MM at hand-off > $500MM today now called No Fear FUZE Beverages $40MM Revenue at start $164MM at hand-off > $350MM today Commodity Ingredients/Nutritionals No Significant Competitive Advantage on Caloric Value Great Marketing Support and Brand Building Brand case studies 6 |
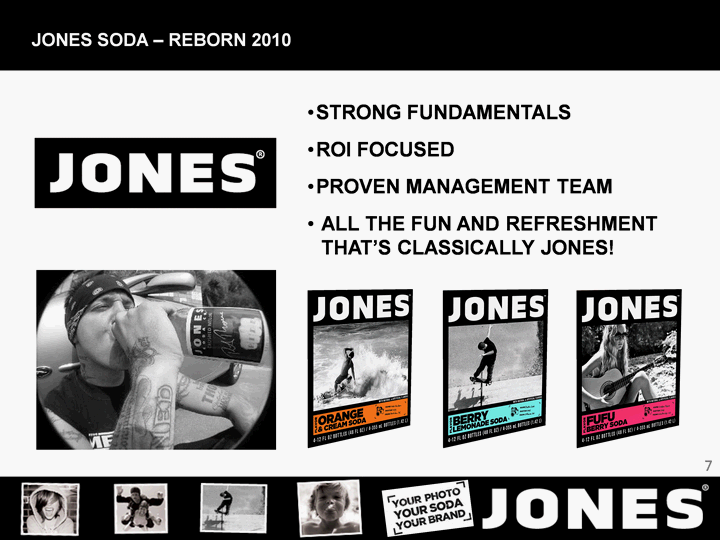
| Strong fundamentals ROI focused Proven management team All the fun and refreshment that's classically JONES! Jones soda - reborn 2010 7 |
| 1. Growing our core business - 12 oz Cane Soda 2. Participating at a high-level in 2 to 3 other product lines that are in high-growth categories Building a great management team Establishing stable financials with a profit plan designed to increase long-term sustained shareholder value Our focus 8 |
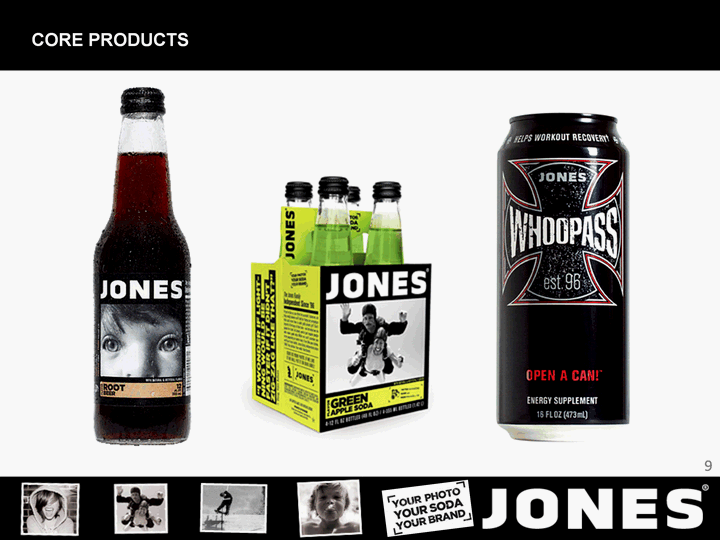
| 9 Core products |
| Reinstatement of Volume-Oriented Pricing Strategies New pricing matrix that utilizes periods of Trade Spend as a partner to our retailers. Focus on flavors that consumers are looking for Jones will always be about unique innovative flavors but we will emphasize and feature our flavors that have greater consumer appeal. Overhaul of our sales force Sales team was depleted in early 2010, lacking leadership and direction. Bring leadership into the group and add accountability and bodies. Move toward hybrid distribution system Our distribution decisions going forward will be what works best for the retailer, which means a mix between DSD and direct distribution of our Products. Growing our core product Line Jones 12 oz. Glass 10 |
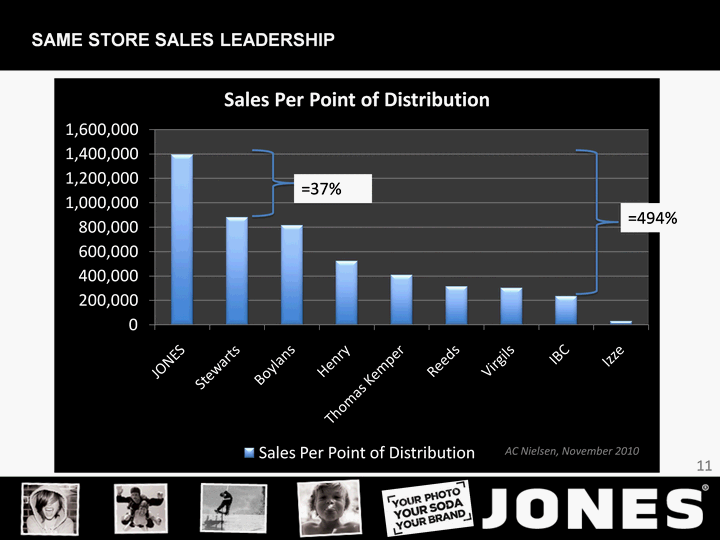
| Same Store Sales Leadership (CHART) AC Nielsen, November 2010 =37% =494% 11 |
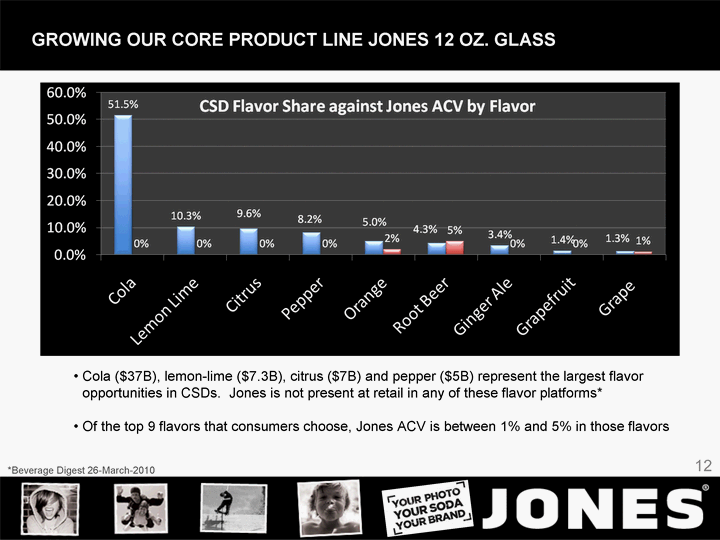
| (CHART) Growing our core product Line Jones 12 oz. Glass *Beverage Digest 26-March-2010 Cola ($37B), lemon-lime ($7.3B), citrus ($7B) and pepper ($5B) represent the largest flavor opportunities in CSDs. Jones is not present at retail in any of these flavor platforms* Of the top 9 flavors that consumers choose, Jones ACV is between 1% and 5% in those flavors 12 |
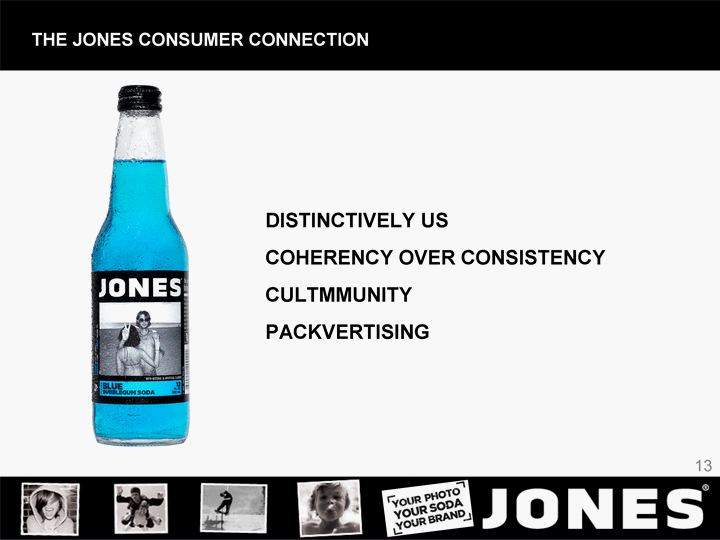
| 13 The jones consumer connection Distinctively us Coherency over consistency Cultmmunity packvertising |
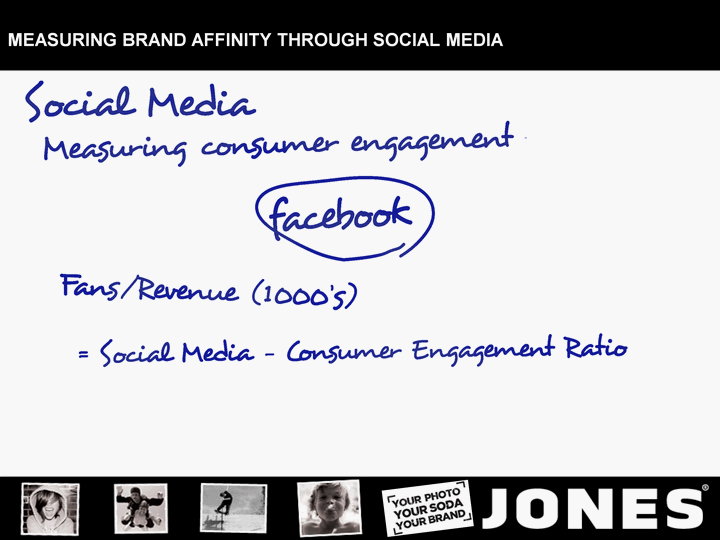
| Measuring Brand Affinity Through Social Media |
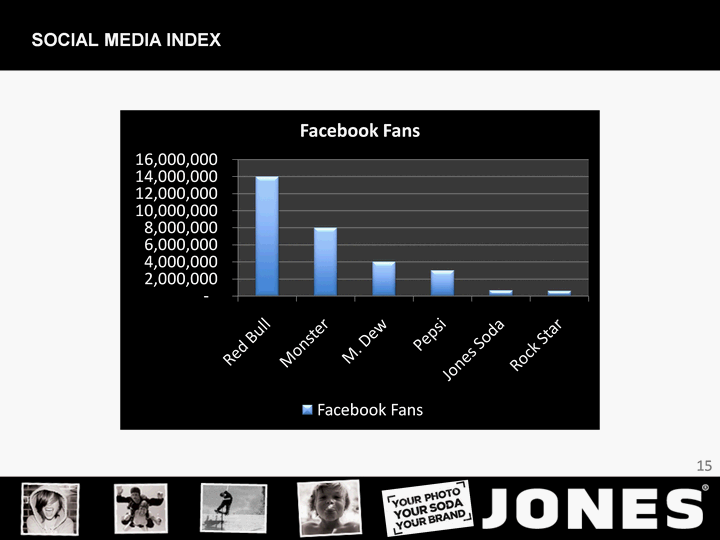
| 15 Social media index (CHART) |
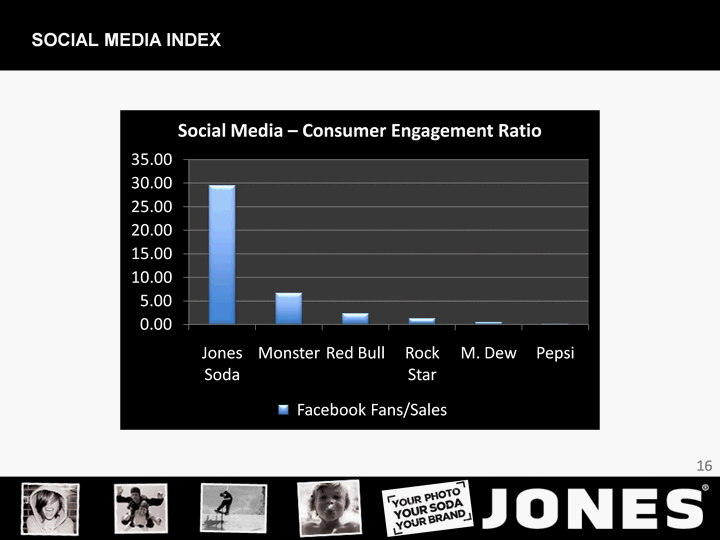
| 16 Social media index (CHART) |
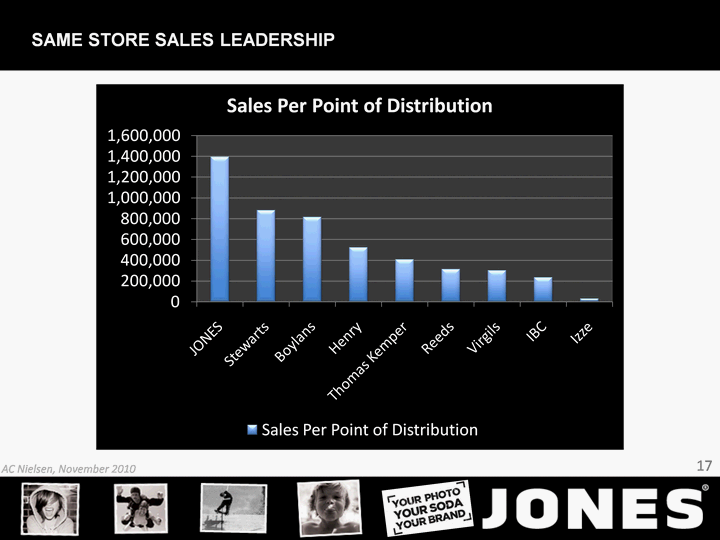
| Same Store Sales Leadership (CHART) AC Nielsen, November 2010 17 |
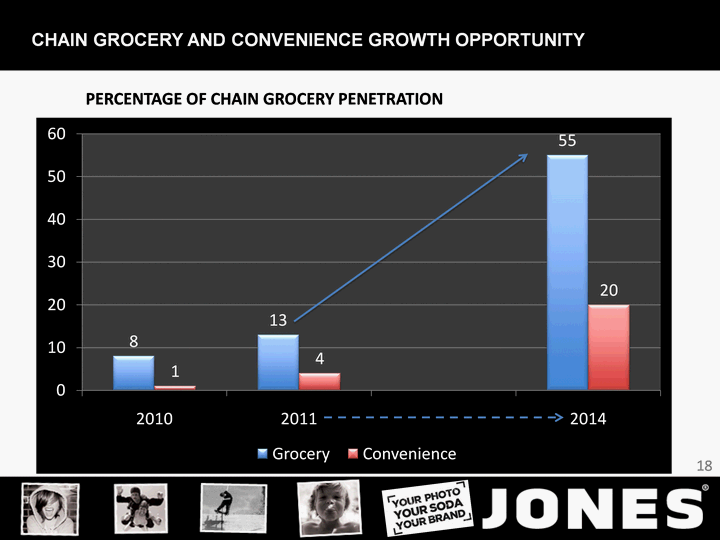
| Percentage of Chain Grocery Penetration 18 Chain grocery and convenience growth opportunity |
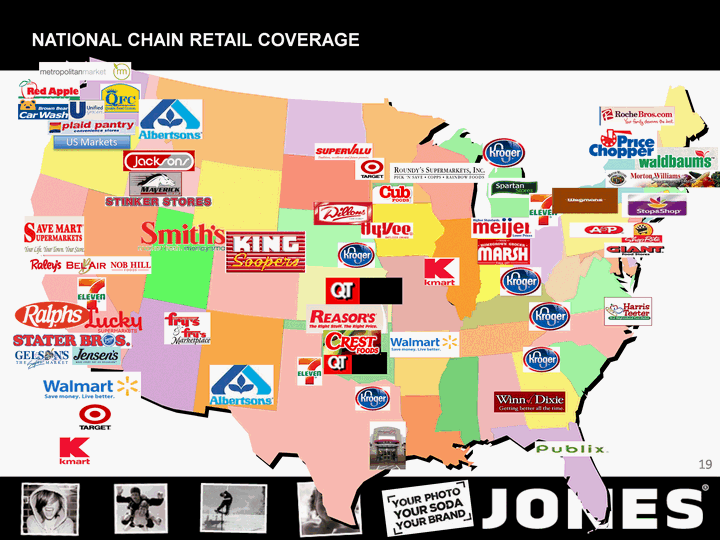
| US Markets 19 National chain retail coverage |
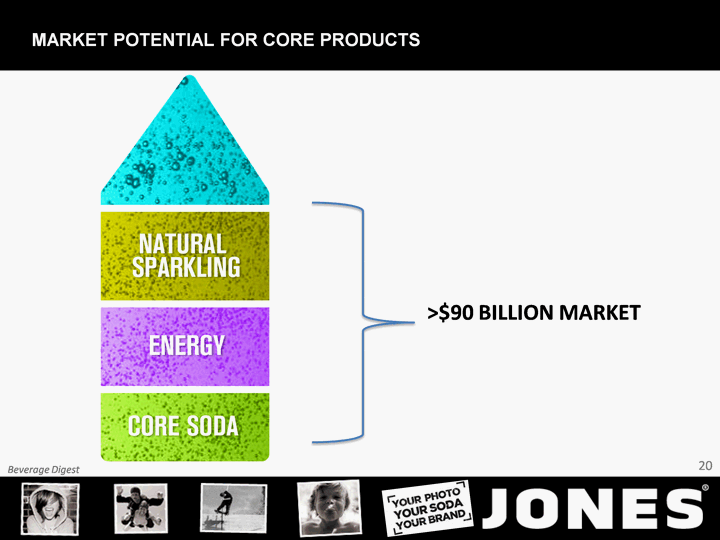
| >$90 Billion Market Beverage Digest 20 Market potential for core products |
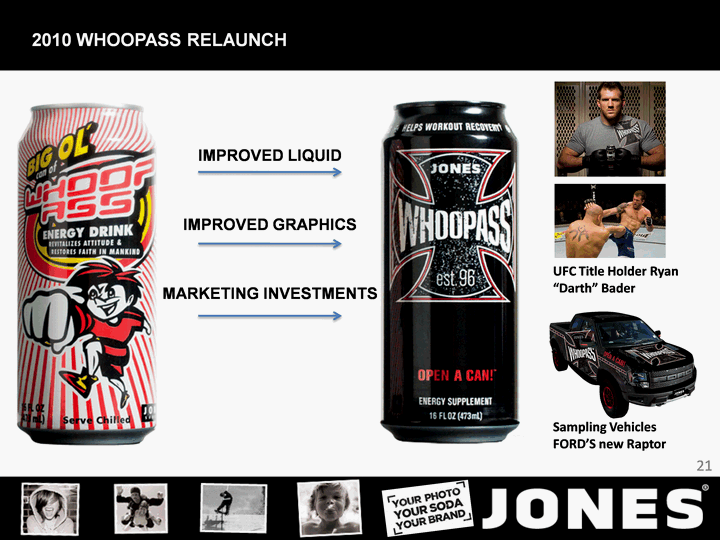
| UFC Title Holder Ryan "Darth" Bader Sampling Vehicles FORD'S new Raptor 21 2010 whoopass relaunch Improved Liquid Improved Graphics Marketing Investments |
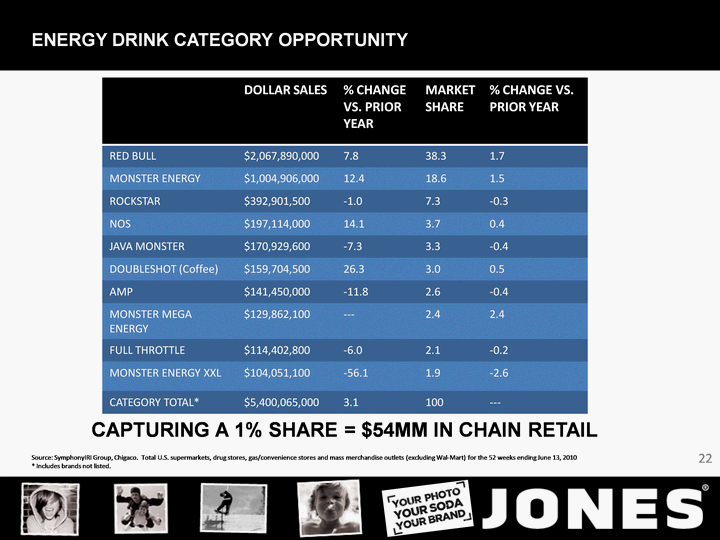
| 22 Capturing a 1% Share = $54MM in chain retail DOLLAR SALES % CHANGE VS. PRIOR YEAR MARKET SHARE % CHANGE VS. PRIOR YEAR RED BULL $2,067,890,000 7.8 38.3 1.7 MONSTER ENERGY $1,004,906,000 12.4 18.6 1.5 ROCKSTAR $392,901,500 -1.0 7.3 -0.3 NOS $197,114,000 14.1 3.7 0.4 JAVA MONSTER $170,929,600 -7.3 3.3 -0.4 DOUBLESHOT (Coffee) $159,704,500 26.3 3.0 0.5 AMP $141,450,000 -11.8 2.6 -0.4 MONSTER MEGA ENERGY $129,862,100 --- 2.4 2.4 FULL THROTTLE $114,402,800 -6.0 2.1 -0.2 MONSTER ENERGY XXL $104,051,100 -56.1 1.9 -2.6 CATEGORY TOTAL* $5,400,065,000 3.1 100 --- Source: SymphonyIRI Group, Chigaco. Total U.S. supermarkets, drug stores, gas/convenience stores and mass merchandise outlets (excluding Wal-Mart) for the 52 weeks ending June 13, 2010 * Includes brands not listed. Energy drink category opportunity |
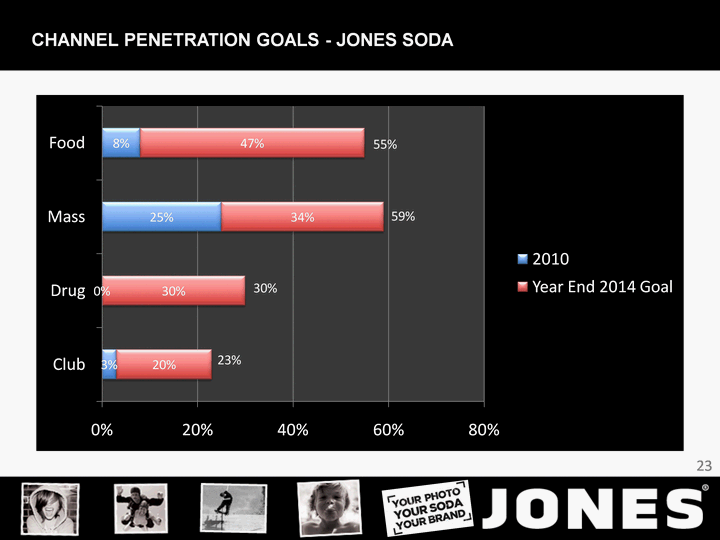
| 23 Channel penetration goals - Jones Soda 30% 23% 59% 55% |
| 24 Experienced management |
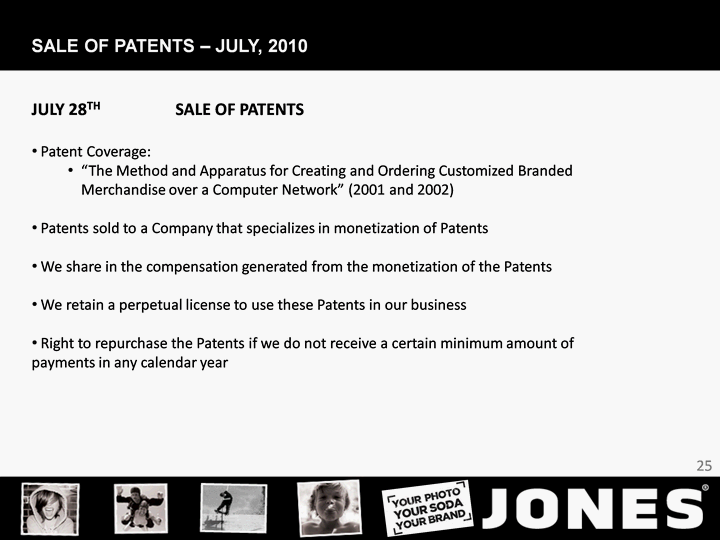
| July 28th Sale of Patents Patent Coverage: "The Method and Apparatus for Creating and Ordering Customized Branded Merchandise over a Computer Network" (2001 and 2002) Patents sold to a Company that specializes in monetization of Patents We share in the compensation generated from the monetization of the Patents We retain a perpetual license to use these Patents in our business Right to repurchase the Patents if we do not receive a certain minimum amount of payments in any calendar year Sale of patents - july, 2010 25 |
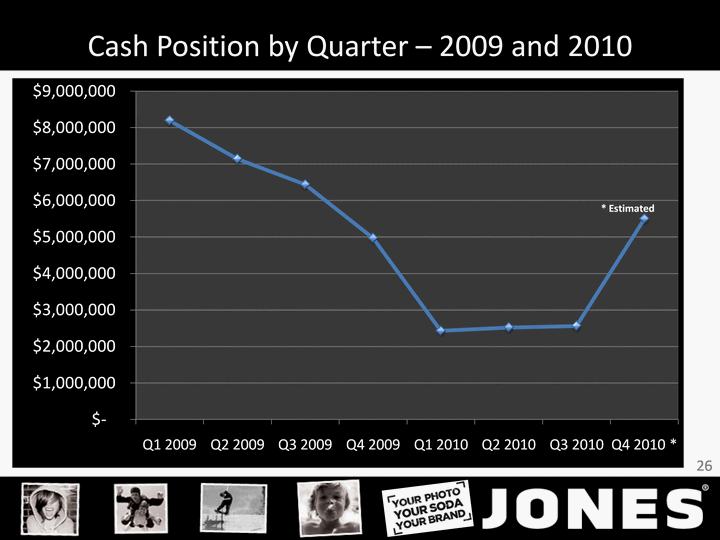
| Cash Position by Quarter - 2009 and 2010 26 (CHART) |
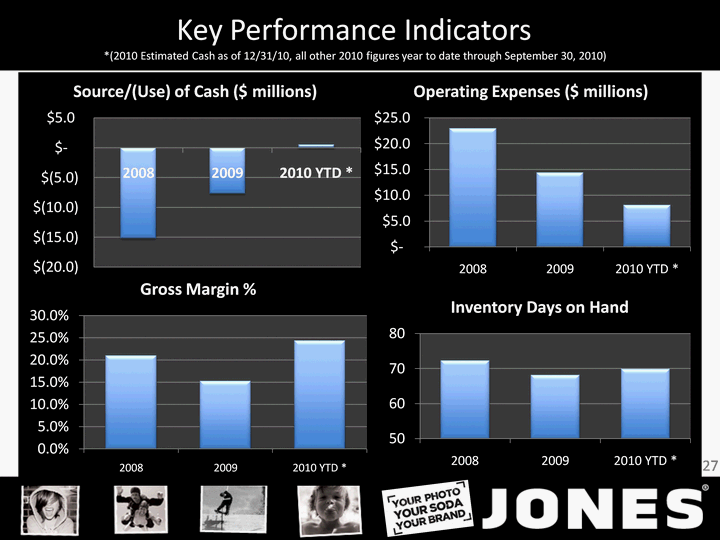
| Key Performance Indicators *(2010 Estimated Cash as of 12/31/10, all other 2010 figures year to date through September 30, 2010) 27 (CHART) (CHART) (CHART) (CHART) |
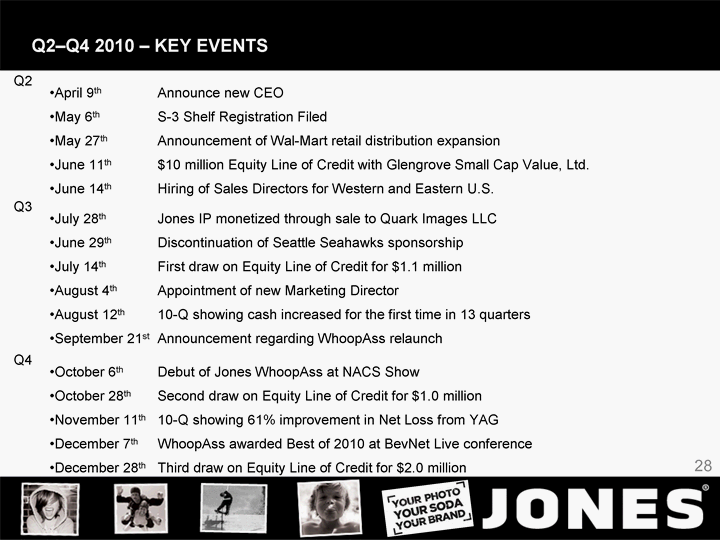
| Q2 April 9th Announce new CEO May 6th S-3 Shelf Registration Filed May 27th Announcement of Wal-Mart retail distribution expansion June 11th $10 million Equity Line of Credit with Glengrove Small Cap Value, Ltd. June 14th Hiring of Sales Directors for Western and Eastern U.S. 28 Q2-q4 2010 - key events Q4 October 6th Debut of Jones WhoopAss at NACS Show October 28th Second draw on Equity Line of Credit for $1.0 million November 11th 10-Q showing 61% improvement in Net Loss from YAG December 7th WhoopAss awarded Best of 2010 at BevNet Live conference December 28th Third draw on Equity Line of Credit for $2.0 million Q3 July 28th Jones IP monetized through sale to Quark Images LLC June 29th Discontinuation of Seattle Seahawks sponsorship July 14th First draw on Equity Line of Credit for $1.1 million August 4th Appointment of new Marketing Director August 12th 10-Q showing cash increased for the first time in 13 quarters September 21st Announcement regarding WhoopAss relaunch |
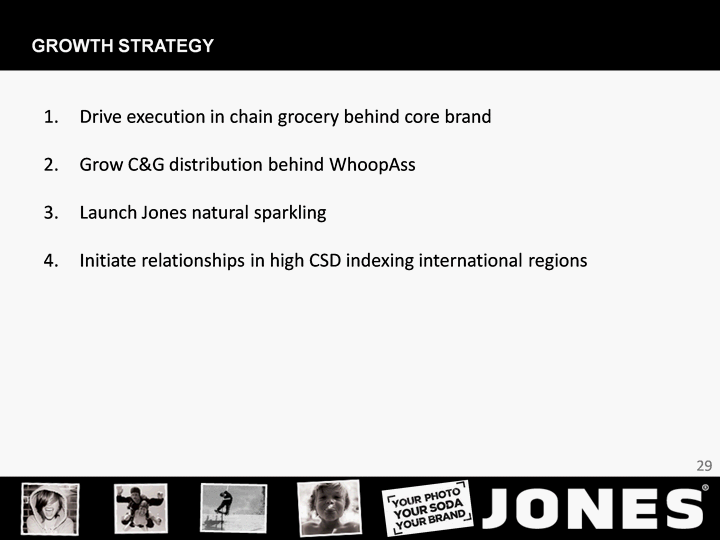
| Drive execution in chain grocery behind core brand Grow C&G distribution behind WhoopAss Launch Jones natural sparkling Initiate relationships in high CSD indexing international regions Growth strategy 29 |
| Avg. Share Price Oct 2009 - Mar 2010 Avg. Share Price Apr 2010 - Dec 2010 $0.64 $1.15 ^ 80% 31 jsda |
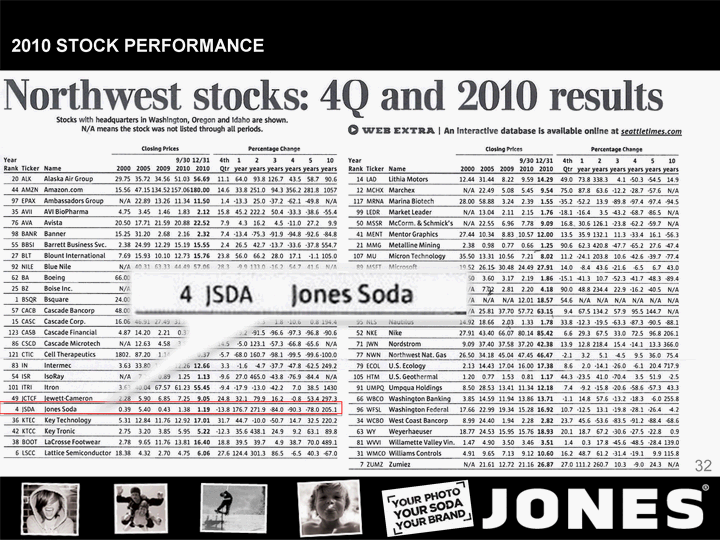
| 2010 Stock Performance 32 |
