Attached files
| file | filename |
|---|---|
| 8-K - FORM 8-K - VISTEON CORP | k49950e8vk.htm |
Exhibit 99.1

| Visteon Corporation Deutsche Bank Global Automotive Industry Conference January 2011 |
| Page 2 Forward-Looking Information This presentation contains "forward-looking statements" within the meaning of the Private Securities Litigation Reform Act of 1995. Forward-looking statements are not guarantees of future results and conditions but rather are subject to various factors, risks and uncertainties that could cause our actual results to differ materially from those expressed in these forward-looking statements, including, but not limited to, Caution should be taken not to place undue reliance on our forward-looking statements, which represent our view only as of the date of this presentation, and which we assume no obligation to update. our ability to satisfy future capital and liquidity requirements; including our ability to access the credit and capital markets at the times and in the amounts needed and on terms acceptable to us; our ability to comply with financial and other covenants in our credit agreements; and the continuation of acceptable supplier payment terms; our ability to satisfy pension and other post-employment benefit obligations; our ability to access funds generated by foreign subsidiaries and joint ventures on a timely and cost effective basis; conditions within the automotive industry, including (i) the automotive vehicle production volumes and schedules of our customers, and in particular Ford's and Hyundai-Kia's vehicle production volumes, (ii) the financial condition of our customers or suppliers and the effects of any restructuring or reorganization plans that may be undertaken by our customers or suppliers or work stoppages at our customers or suppliers, and (iii) possible disruptions in the supply of commodities to us or our customers due to financial distress or work stoppages; new business wins and re-wins do not represent firm orders or firm commitments from customers, but are based on various assumptions, including the timing and duration of product launches, vehicle productions levels, customer price reductions and currency exchange rates; general economic conditions, including changes in interest rates and fuel prices; the timing and expenses related to internal restructurings, employee reductions, acquisitions or dispositions and the effect of pension and other post-employment benefit obligations; increases in raw material and energy costs and our ability to offset or recover these costs, increases in our warranty, product liability and recall costs or the outcome of legal or regulatory proceedings to which we are or may become a party; and those factors identified in our filings with the SEC (including our Annual Report on Form 10-K for the fiscal year ended Dec. 31, 2009). |

| Page 3 Visteon Overview Product Line Portfolio Leading provider of value-added components / systems to a diverse set of global OEMs Approximately 26,500 employees operating in 26 countries 87 manufacturing and 31 engineering / customer service center facilities Successful restructuring positioning the business for future growth Strong Q3 2010 YTD financial performance NYSE listing - symbol "VC" #2 Market Position #5 Market Position #6 Market Position #3 Market Position Climate HVAC Systems Powertrain Cooling Compressors Fluid Transport Interiors Cockpit Modules Instrument Panels Consoles Door Trim Modules Electronics Audio / Infotainment Driver Information Center Stack Electronics Feature Control Modules Lighting Front/Rear Lighting AFS Projectors LDM Modules LED Arrays Visteon Today Please see important disclosures regarding "Forward Looking Information" and "Use of Non-GAAP Financial Information" |
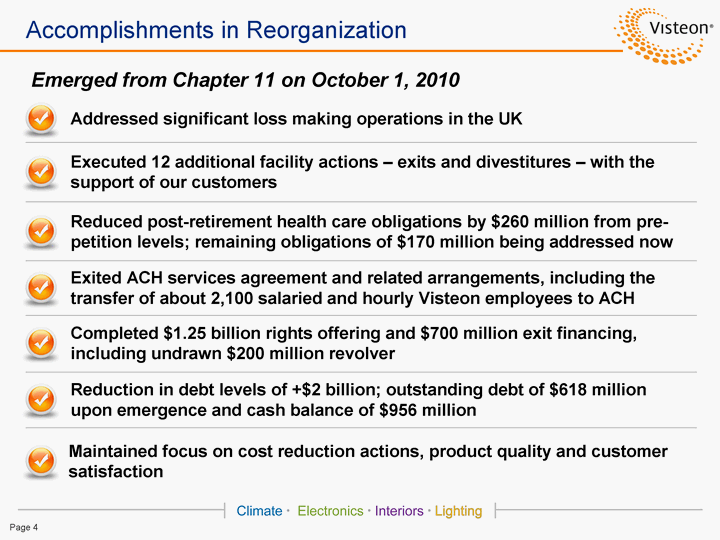
| Page 4 Accomplishments in Reorganization Emerged from Chapter 11 on October 1, 2010 Addressed significant loss making operations in the UK Executed 12 additional facility actions - exits and divestitures - with the support of our customers Reduced post-retirement health care obligations by $260 million from pre- petition levels; remaining obligations of $170 million being addressed now Completed $1.25 billion rights offering and $700 million exit financing, including undrawn $200 million revolver Reduction in debt levels of +$2 billion; outstanding debt of $618 million upon emergence and cash balance of $956 million Exited ACH services agreement and related arrangements, including the transfer of about 2,100 salaried and hourly Visteon employees to ACH Maintained focus on cost reduction actions, product quality and customer satisfaction |
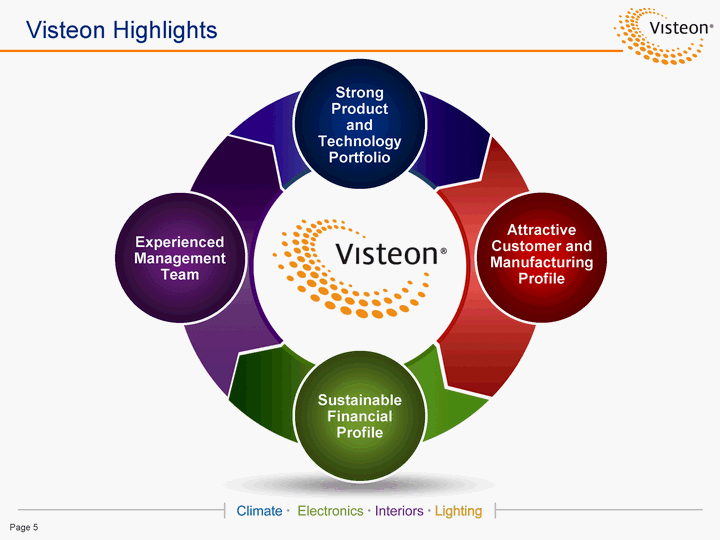
| Page 5 Visteon Highlights Sustainable Financial Profile Attractive Customer and Manufacturing Profile Experienced Management Team Strong Product and Technology Portfolio |
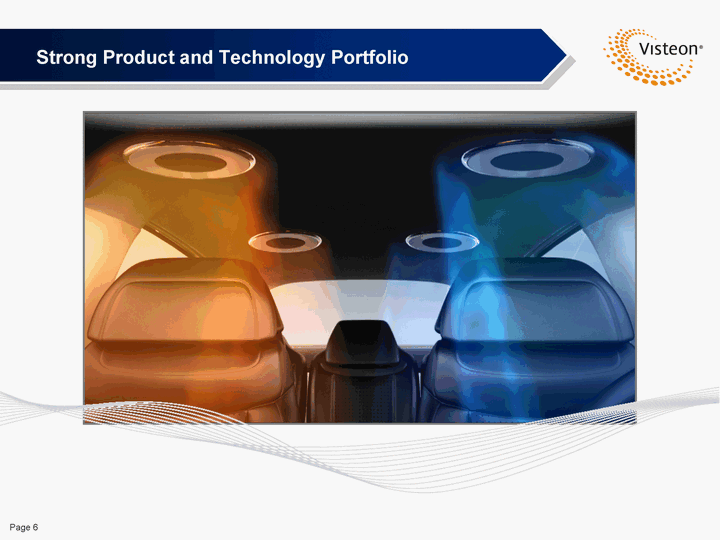
| Page 6 Strong Product and Technology Portfolio |

| Page 7 Product Portfolio Today Focused Product Line Offering With Extensive Capabilities Interiors #2 position in European market Full systems capabilities - proven global design and manufacturing capabilities Manufacturing footprint extending across emerging markets and #1 market position in China via Yanfeng Visteon Automotive Trim joint venture Electronics #5 market position - Global footprint to service customers in all markets Successful integrator of consumer technologies through eco-system of partners and suppliers High value solutions for low cost and small vehicles Climate #2 market position - Full climate systems product offering Balanced global mix with unique strengths in key markets Strength in compressors and fluid transport A leader in environmentally-friendly alternative refrigerants and electric vehicle / hybrid applications Lighting (1) #6 market position Full product line portfolio with key technologies such as affordable LED solutions, AFS and adaptive high beams Lowest cost footprint among major competitors with operations in Asia, Mexico and Eastern Europe Visteon's Product Portfolio Note: Visteon market positions and market sizes based on Visteon estimates. (1) Lighting product line is included in Electronics product group for SEC segment reporting. Please see important disclosures regarding "Forward Looking Information" |

| Page 8 Extensive Capabilities Volkswagen Polo Instrument Panel Nissan Pathfinder (EU) Full Cockpit Greatwall Hover Series Audio Head Unit Jaguar Land Rover Reconfigurable Cluster Ford Focus (EU) Tail Lamp GM Camaro RS Headlamp Projector Bentley Continental GT Headlamp Hyundai Santa Fe Climate System BMW 7 - Series HEV Electric Compressor Ford Fiesta Compact HVAC Lincoln MKS Integrated Center Panel |

| Page 9 Product innovations such as compact HVAC and integrated Audio Climate Driver Information enhance driver comfort Rapidly expanding cockpit technologies, integrating consumer electronics Ability to customize interiors to suit consumer tastes Lower weight components through non-conventional design / engineering Electric compressors, controls and lithium-ion battery cooling capabilities for hybrid and electric vehicles LED technology requiring lower power consumption and enhancing fuel efficiency Global scale with regional adaptations Lower cost components given commonality with multiple platforms across regions Ability to design / develop low-cost and premium product offerings for market requirements Product Portfolio Aligned with Market Trends Consumer Experience Fuel Efficiency and Reduced Emissions Manufacturing and Product Development Scale Visteon Advantage Resulting Automotive Trends Macro Changes Climate Change and Regulatory Environment Customers' Cost Competitiveness Consumer Experience / Product Differentiation Please see important disclosures regarding "Forward Looking Information" |

| Page 10 C-Beyond Demonstration Vehicle - Mature Markets Integrated concept vehicle showcasing innovation in climate, electronics, interior packaging and lighting technologies Highlights Visteon's design and product capabilities targeted primarily to mature automotive markets Connectivity, sustainability and improved user experience |

| Page 11 Growth Market Car - Emerging Markets Concept vehicle developed in collaboration with 3M Introduced at the 2011 International Consumer Electronics Show Innovations for fast-growing markets patterned on India customer preferences Focus on delivering customers regional differentiation, offering system modularity and scalability on global platforms |

| Page 12 Page 12 NAIAS Highlights Audi A6 Radiator, Low Temperature Radiator BMW 7-Series Active Hybrid Electric Compressor Chevrolet Camaro Coupe/Convertible Headlamp Projector, CHMSL, Premium Audio - 8 Channel Amplifier and Speaker Assembly, A/C Lines Chevrolet Cruze Center High Mount Stop Lamp (CHMSL), Side Marker Lamps Chevrolet Volt Vehicle Integration Control Module Ford Explorer "Dual Plane" Combination Cooler (Industry First), HVAC Heat Exchangers, A/C Underbody Lines, Touch Panel and Multi-Function Displays Ford Focus Audio Head Unit, Digital Radio, Premium Amplifier, Multi- Function Display, DEATC Climate Controls, HVAC Module, Compressor, A/C Lines, Head Lamps (Halogen, HID Bi-functional with LED Daylight Running Lamps) and Rear Lamps (EU), Instrument Panel and Trim (EU) Focus Electric (unique content) Battery Chiller, Battery Conditioning Lines, A/C Lines Ford C-Max Audio Head Unit, Multi-Function Display, Dual Zone Electronic Automatic Temp Controls (DEATC), Compressor, HVAC Module, A/C Lines, Internal Heat Exchanger, Head Lamps (EU) Hyundai Veloster Coupe Cockpit Module, Door Trim Tesla Model S Head and Rear Lamps, CHMSL, Side Marker, Fog Lamps, HVAC Module, A/C Lines, Condenser Kia Optima Hybrid Electric Compressor, HVAC Module, A/C Lines, Condenser, Radiator Ford Escape/Kuga (Vertrek Concept Vehicle) Compressor, HVAC Module, A/C Lines (Industry First Metal Seal Fittings), Internal Heat Exchanger, Climate Controls, Cluster, Multi-Function Display |
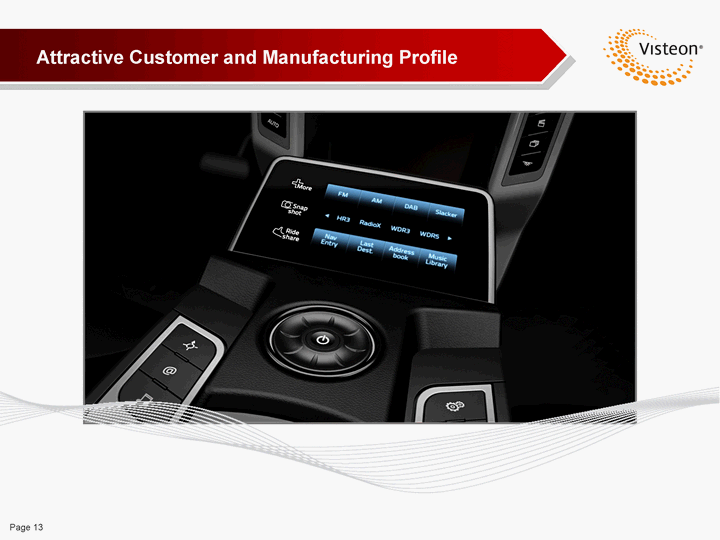
| Page 13 Attractive Customer and Manufacturing Profile |
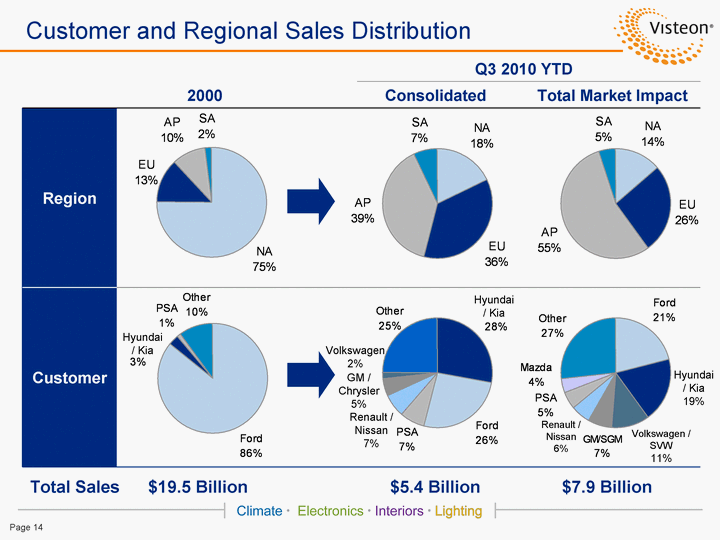
| Page 14 Q3 2010 YTD Q3 2010 YTD 2000 Consolidated Total Market Impact Region Customer NA EU AP SA East 75 13 10 2 Total Sales $19.5 Billion $5.4 Billion $7.9 Billion NA EU AP SA East 18 36 39 7 Hyund. / Kia Ford PSA R / N GM / Chrysler VW Other East 28 26 7 7 5 2 25 NA EU AP SA East 14 26 55 5 Ford Hyund. / Kia VW / SVW GM/SGM R / N PSA Mazda Other East 21 19 11 7 6 5 4 27 Customer and Regional Sales Distribution Ford Hyund. / Kia PSA Other East 85 3 1 10 Hyundai / Kia Hyundai / Kia Renault / Nissan 7% GM / Chrysler 5% Volkswagen 2% Renault / Nissan 6% Hyundai / Kia 19% Volkswagen / SVW 11% |
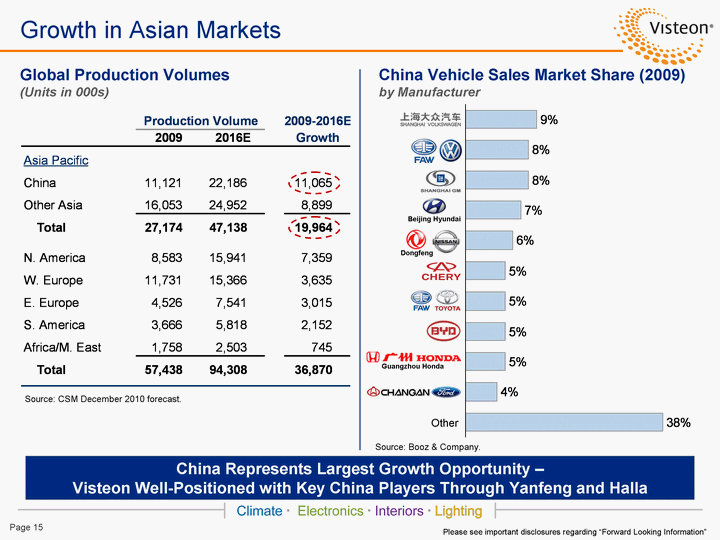
| Page 15 SVW FAW-VW SGM Beijing Hyundai Dongfeng Nissan Chery FAW-Toyota BYD Guangzhou Honda Changan Ford Others 9 8 8 7 6 5 5 5 5 4 25 Growth in Asian Markets China Represents Largest Growth Opportunity - Visteon Well-Positioned with Key China Players Through Yanfeng and Halla Global Production Volumes (Units in 000s) Source: CSM December 2010 forecast. China Vehicle Sales Market Share (2009) by Manufacturer Source: Booz & Company. Guangzhou Honda Dongfeng Beijing Hyundai Other Please see important disclosures regarding "Forward Looking Information" |

| Page 16 Visteon Asia Pacific Customers |

| Page 17 Van Buren, MI Chelmsford, UK Shanghai, China Operate 118 Facilities in 26 Countries Broad Manufacturing and Engineering Capabilities Some facilities support multiple product groups. Climate Electronics Interiors Lighting Tech Center # of Locations |
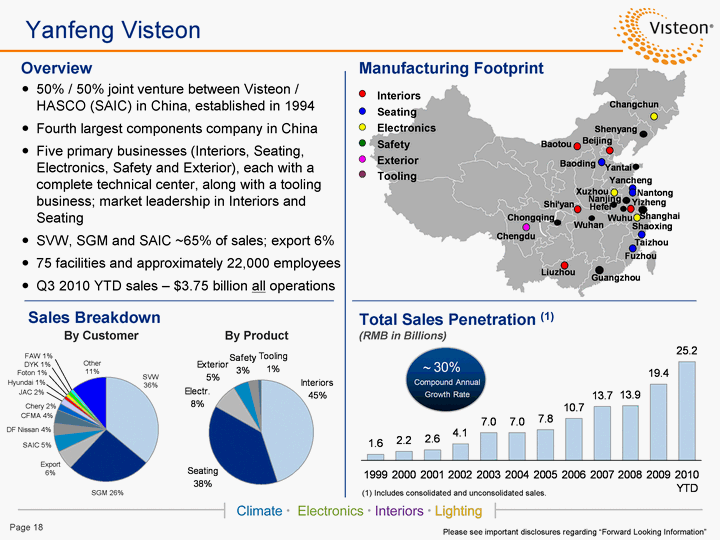
| Page 18 1999 2000 2001 2002 2003 2004 2005 2006 2007 2008 2009 2010 YTD 1.6 2.2 2.6 4.1 7 7 7.8 10.7 13.7 13.9 19.4 25.2 Overview Yanfeng Visteon Sales Breakdown SVW SGM Export SAIC East 36 26 6 5 4 4 2 2 1 1 1 1 11 By Customer By Product Interiors Seating Electr. Exterior Safety Tooling East 45 38 8 5 3 1 SVW 36% SGM 26% Export 6% Other 11% SAIC 5% DF Nissan 4% CFMA 4% Chery 2% JAC 2% Hyundai 1% Foton 1% DYK 1% FAW 1% 50% / 50% joint venture between Visteon / HASCO (SAIC) in China, established in 1994 Fourth largest components company in China Five primary businesses (Interiors, Seating, Electronics, Safety and Exterior), each with a complete technical center, along with a tooling business; market leadership in Interiors and Seating SVW, SGM and SAIC ~65% of sales; export 6% 75 facilities and approximately 22,000 employees Q3 2010 YTD sales - $3.75 billion all operations Total Sales Penetration (1) (RMB in Billions) Manufacturing Footprint Interiors Seating Electronics Safety Exterior Tooling Please see important disclosures regarding "Forward Looking Information" ~ (1) Includes consolidated and unconsolidated sales. |
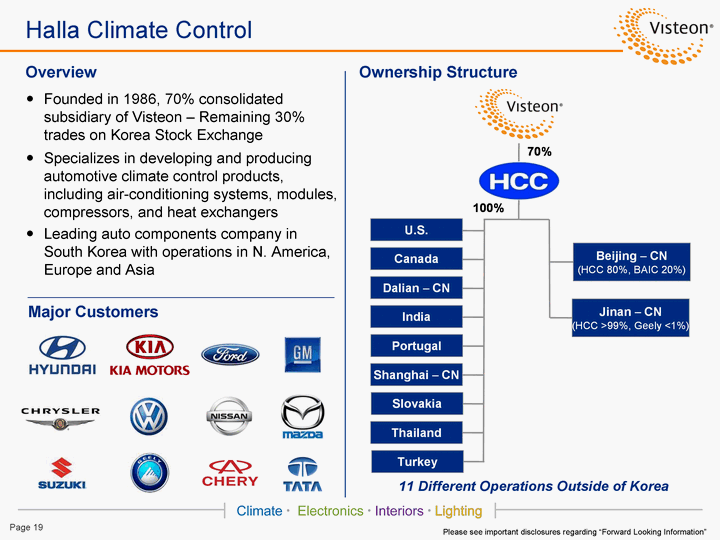
| Page 19 Overview Ownership Structure Halla Climate Control Major Customers Founded in 1986, 70% consolidated subsidiary of Visteon - Remaining 30% trades on Korea Stock Exchange Specializes in developing and producing automotive climate control products, including air-conditioning systems, modules, compressors, and heat exchangers Leading auto components company in South Korea with operations in N. America, Europe and Asia 11 Different Operations Outside of Korea Please see important disclosures regarding "Forward Looking Information" |

| Page 20 Proven and Experienced Team Proven and Experienced Team Board of Directors Experience Donald J. Stebbins Chairman, CEO and President Duncan H. Cocroft Former Executive Vice President and Treasurer, Cendant CorporationDirector - GEO Specialty Chemicals; SBA Communications; Wellman, Inc. Philippe Guillemot CEO, EuropcarFormer Chairman / CEO of AREVA T&D Holdings SA Herbert L. Henkel Former Chairman, Ingersoll-Rand plcDirector - 3M Company; C.R. Bard, Inc. Mark T. Hogan Chairman, Toyota North American Advisory CommitteeFormer President / CEO - The Vehicle Production Group, LLCFormer President - Magna International Jeffrey D. Jones Attorney, Kim & Chang - Seoul, Korea Karl J. Krapek Former President / COO, United Technologies Corp.Director - Northrop Grumman Corporation; Prudential Financial, Inc.; The Connecticut Bank and Trust Co. Timothy D. Leuliette Chairman / CEO - Leuliette Partners LLCFormer President and CEO, Dura Automotive, LLC William E. Redmond, Jr. CEO, General Chemical Corp.CEO, GT TechnologiesDirector - Amports, Inc.; Source Interlink Comps, Inc. |

| Page 21 Sustainable Financial Profile |

| Page 22 Financial Profile - 2005 FY vs. Q3 2010 YTD Financial Profile - 2005 FY vs. Q3 2010 YTD Actions Have Resulted in Markedly Improved Financial Results and Leverage Position (1) As of October 1, 2010 (post-emergence). (1) (1) Please see important disclosures regarding "Forward Looking Information" and "Use of Non-GAAP Financial Information" |

| Page 23 Headcount (Global) 2005 2006 2007 2008 2009 2010E PPM 1652 1226 1118 956 693 658 2005 2006 2007 2008 2009 9/1/2010 PPM 48000 44000 40650 33350 29400 26500 Facilities Fixed, Closed or Sold (#) (Cumulative actions) 2006 2007 2008 2009 2010 PPM 11 18 38 45 50 Overhead Cost ($M) (Engineering and Admin.) Personnel Location (%) 2005 2009 9/10/2010 0.4 0.54 0.6 0.6 0.46 0.4 Significantly Improved Cost Structure 45% Reduction $994M Reduction Please see important disclosures regarding "Forward Looking Information" |

| Page 24 2005 2006 2007 2008 2009 Q3 2010 YTD Sales 16586 10706 10721 9077 6420 5437 EBITDA Margin 1.2 4.3 3.9 3.9 7.1 8.8 Product Sales and Adjusted EBITDA Margin Improving Adjusted EBITDA Margins (Dollars in Millions) ACH Transaction 23 North America facilities returned to Ford, including UAW workforce Three Year Restructuring Plan 2006-2009 Exited / addressed 38 non-core / underperforming facilities Significant cost structure reductions C11 Emergence Further facility restructurings Legacy liability reductions Deleveraged capital structure Margins Significantly Improved on Core Product Sales Please see important disclosures regarding "Forward Looking Information" and "Use of Non-GAAP Financial Information" |

| Page 25 Sales and Adjusted EBITDA - Q3 2010 YTD Sales and Adjusted EBITDA - Q3 2010 YTD 2009 YTD Climate Electronics Interiors Lighting Elims/Other 2010 YTD 4453 4453 5114 5210 5365 5437 5437 661 96 155 137 65 Note: Product Group pie chart for Product Sales excludes central / elims / other. Climate Electronics Interiors Lighting 43 19 29 9 $2,421M $1,065M $1,612M $541M $5,437 Million $984M Increase Product Sales 2009 YTD Volume Divest. & Clos. Currency Net Cost Prf. Eq. in Aff. 2010 YTD 224 224 486 403 403 449 476 306 44 83 46 27 $252M Increase Adjusted EBITDA 2009 YTD Volume Divest. & Clos. Currency Pricing / Other 2010 YTD 4453 4453 5262 5262 5434 5437 1103 294 172 3 $984M Increase Please see important disclosures regarding "Forward Looking Information" and "Use of Non-GAAP Financial Information" |

| Page 26 Strong Balance Sheet Strong Balance Sheet Visteon Cash / Debt / Legacy Liabilities Strong Balance Sheet and Global Cash Position - No Material Near-Term Maturities Moody's S&P Corporate Family Rating B1 B+ Long Term Debt Rating Ba1 BB- Outlook Stable Stable 2010 2011 2012 2013 2014 2015+ Corporate 1 5 5 5 5 475 Affiliate 62 95 1 1 - 10 Total 63 100 6 6 5 485 Corp. $1 $5 $5 $5 $5 $475 Affil. 62 95 1 1 - 10 Total $63 $100 $6 $6 $5 $485 (1) (2) (1) Primarily comprises $60 million Halla Korea bond paid in full in Nov. 2010. (2) Affiliate debt is primarily working capital and other short-term facilities that renew annually. Debt Maturity Schedule (Dollars in Millions) Recent Ratings Annual working capital facility renewals Please see important disclosures regarding "Forward Looking Information" and "Use of Non-GAAP Financial Information" |

| Page 27 Summary Focused product portfolio, recognized technology positions and market breadth Ford and Hyundai / Kia - Strong positions Low-cost manufacturing / engineering footprint Lean overhead cost structure Delevered capital structure Extensive presence in China and other emerging markets leveraging management, technology and innovations developed in mature markets Significant restructuring behind; shareholder value focused going forward Business Operations and Financial Profile Positioned to Provide Long-term Value to Shareholders Sustainable Financial Profile Attractive Customer and Manufacturing Profile Experienced Management Team Strong Product and Technology Portfolio Well Positioned to Compete in Global Auto Industry Please see important disclosures regarding "Forward Looking Information" |
| Page 28 Throughout this presentation, the Company has provided information regarding certain non-GAAP financial measures. These measures include "free cash flow" and "Adjusted EBITDA." Free cash flow represents cash flow from operating activities less capital expenditures. Adjusted EBITDA represents net income (loss) attributable to Visteon, plus net interest expense, provision for income taxes and depreciation and amortization, as further adjusted to eliminate the impact of asset impairments, gains or losses on divestitures, net restructuring expenses and other reimbursable costs, certain non-recurring employee charges and benefits, reorganization items, and other non-operating gains and losses. Management believes that free cash flow is useful in analyzing the Company's ability to service and repay its debt, and it uses the measure for planning and forecasting in future periods, as well as in management compensation decisions. Free cash flow is not a recognized term under accounting principles generally accepted in the United States ("GAAP") and does not reflect cash used to service debt and does not reflect funds available for investment or other discretionary uses. Management believes Adjusted EBITDA is useful to investors because it provides meaningful supplemental information regarding the Company's operating results because the excluded items may vary significantly in timing or amounts and/or may obscure trends useful in evaluating and comparing the Company's continuing operating activities. Management uses this measure for planning and forecasting in future periods. Adjusted EBITDA is not a recognized term under GAAP and does not purport to be an alternative to net earnings (losses) as an indicator of operating performance or to cash flows from operating activities as a measure of liquidity. Because not all companies use identical calculations, this presentation of Adjusted EBITDA may not be comparable to other similarly titled measures of other companies. Additionally, Adjusted EBITDA is not intended to be a measure of cash flow available for management's discretionary use, as it does not consider certain cash requirements such as interest payments, tax payments and debt service requirements. Use of Non-GAAP Financial Information |
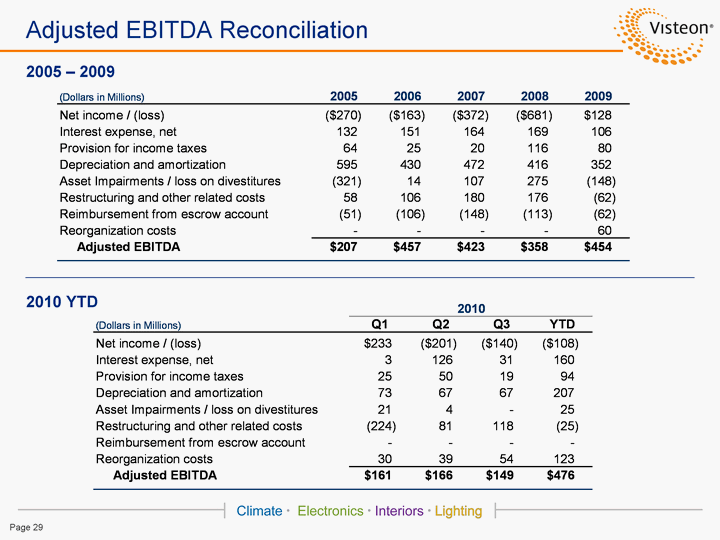
| Page 29 Adjusted EBITDA Reconciliation 2005 - 2009 2010 YTD |

| Page 30 www.visteon.com |
