Attached files
| file | filename |
|---|---|
| 8-K - FORM 8-K - REX ENERGY CORP | d8k.htm |
 January,
2011 January, 2011
Corporate Presentation
Corporate Presentation
Exhibit 99.1 |
 Forward Looking Statements &
Hydrocarbon Volume Estimates
Hydrocarbon Volume Estimates
2
Forward Looking Statements
Except for historical information, statements made in this document, including those relating
to significant potential, future earnings, cash flow, capital expenditures, production
growth and planned number of wells, are forward-looking statements within the meaning of Section 27A of the Securities Act of 1933 and Section 21E of
the Securities Exchange Act of 1934. These statements are based on assumptions and estimates
that management believes are reasonable based on currently available information;
however, management's assumptions and the company's future performance are subject to a wide range of business risks and uncertainties, and there is no
assurance that these goals and projections can or will be met. Any number of factors could
cause actual results to differ materially from those in the forward-looking
statements, including, but not limited to, uncertainties regarding the economic conditions in
the United States and globally; domestic and global demand for oil and natural gas;
volatility in the prices the company receives for its oil and natural gas; the effects of government regulation, permitting and other legal requirements; the
quality of the company’s properties with regard to, among other things, the existence of
reserves in economic quantities; uncertainties about the estimates of the
company’s oil and natural gas reserves; the company’s ability to increase its
production and oil and natural gas income through exploration and development; the
company’s ability to successfully apply horizontal drilling techniques and tertiary
recovery methods; the number of well locations to be drilled, the cost to drill and the
time frame within which they will be drilled; drilling and operating risks; the availability
of equipment, such as drilling rigs and transportation pipelines; changes in the
company’s drilling plans and related budgets; the adequacy of the company’s capital
resources and liquidity including, but not limited to, access to additional
borrowing capacity; uncertainties associated with the company’s legal proceedings and
their outcome; and other factors discussed under “Risk Factors” in Item 1A of Rex
Energy’s Annual Report on Form 10-K for the year ended December 31, 2009 filed with
the U.S. Securities and Exchange Commission. The company undertakes no obligation to
publicly update or revise any forward-looking statements. Further information on risks and uncertainties is available in the company's filings with the
Securities and Exchange Commission, which are incorporated by reference. The company's
internal estimates of reserves may be subject to revision and may be different from
estimates by the company's external reservoir engineers at year end. Although the company believes the expectations and forecasts reflected in these and other
forward-looking statements are reasonable, it can give no assurance they will prove to
have been correct. They can be affected by inaccurate assumptions or by known or unknown
risks and uncertainties. Hydrocarbon Volume Estimates
This presentation includes management’s estimates of Marcellus Shale potential
recoverable resources, per well EUR (estimated ultimate recovery of resources) and
upside potential of recoverable resources. Except as noted, these have been estimated
internally by the Company without review by independent engineers and do not
necessarily constitute reserves. These estimates are included to demonstrate the
potential for future drilling by the Company. Actual recovery of these potential
volumes is inherently more speculative than recovery of estimated proved reserves.
Estimates of potential recoverable resources, per well EURs and upside potential for
Company oil and gas shale acreage are particularly speculative due to the limited experience
in Marcellus Shale horizontal development, with its limited production history.
Ultimate recoveries will be dependent upon numerous factors including actual encountered geological conditions, the impact of future oil and gas pricing and
exploration costs, and our future drilling decisions and budgets based upon our future
evaluation of risk, returns and the availability of capital and, in many areas, the
outcome of negotiation of drilling arrangements with holders of adjacent or fractional
interest leases. In addition, potential recoverable resources are based on
undesignated future well locations under assumed acreage spacing which may not have been
specifically included in any definitive development plan and ultimately may not be
drilled. Accordingly, such estimates may differ significantly from the hydrocarbon quantities that are ultimately recovered.
SEC rules prohibit a publicly-reporting oil and gas company from including oil and gas
resource estimates in their filings with the SEC, except proved, probable and possible
reserves that meet the SEC’s definitions of such terms. Illinois Basin estimates (including Lawrence Field) of oil in place and other resource volumes, oil in place
and other reserve volumes indicated herein are not based on SEC definitions and
guidelines. Unless otherwise indicated, estimates of non-proved reserves and other
hydrocarbons included herein may not meet specific definitions of reserves or resource
categories within the meaning of the SPE/SPEE/WPC Petroleum Resource Management System.
|
    Rex
Energy Overview Rex Energy Overview
3
•
Significant upside in two high growth shale
plays and tertiary oil recovery
o
1.2 –
1.7 Tcfe
in non-proven Marcellus Shale
resource
potential
(1)
o
16 –
27 Mmboe
in non-proven Niobrara Shale
resource
potential
(1)
o
22 –
50 Mmbls
in non-proven Tertiary Recovery
oil resource
potential
(1)
•
Liquids Rich Production & Proven Reserves
o
3,391 BOE
per
day
(20.3
Mmcfe/d)
(2)
–
59% oil and NGLs
o
29.5 Mmbls
proven reserves (177 Bcfe)
(3)
–
48% oil and NGLs
•
Strong
Balance
Sheet
&
Liquidity
(4)
o
Estimated $10.0 million cash
o
$40.9
million
in
Marcellus
drilling
carries
(5)
o
$10 million in debt
o
$125 million line of credit
1. Assumptions based on full development program. Actual results may vary significantly. Not
proved. See “Hydrocarbon Volume Estimates” on page 2. 2. As of Third Quarter
2010. 3. As of June 30, 2010. Mid-year 2010 reserves are internally calculated,
adjusted for the Sumitomo JV, and have not been audited by an independent, third
party. Actual reserves may vary.
4. Estimated as of 12/31/2010
5. Actual as of 11/30/2010 |
    Areas of Operation
4
•
Appalachian Region
o
55,000 Net Acres in Marcellus Shale
Fairway
(1)
–
64% of acreage in liquids rich portion
of the play
–
Total un-risked resource potential of
1.2 –
1.7 Tcfe
(2)
–
$40.9
million
in
drilling
carries
(3)
•
Rockies Region
o
40,000 Net Acres in Niobrara Shale
Fairway
–
100% of acres in oil window of the
Niobrara fairway in the DJ Basin
–
Total un-risked resource potential of
16 –
27 MMBoe
(2)
•
Illinois Region
o
Tertiary Recovery Oil Projects
–
Total un-risked resource potential of
22
–
50
MMBbls
from
ASP
flooding
in
the Lawrence Field
(2)
1. Excludes approx. 22,000 net acres assigned to Williams and approx. 13,000 net acres
assigned to Sumitomo. 2. Assumptions based on full development program. Actual results
may vary significantly. Not proved. See “Hydrocarbon Volume Estimates” on page 2.
3. Drilling carry as of 11/30/2010 |
 Reserve Growth Summary
Proved Reserve & PV-10 Growth
5
•
Mid-Year 2010
(1)
o
29.5 Mmboe
(177.0 Bcfe)
o
$357.2 million PV-10
–
50% Proved Developed
–
48% Oil & NGLs
•
Year-End 2009
(2)
o
20.9 Mmboe
(125.2 Bcfe)
o
$190.5 million PV-10
–
54% Proved Developed
–
55% Oil & NGLs
•
Year-End 2008
(3)
o
11.0 Mmboe
(66.0 Bcfe)
o
$84.0 million PV-10
–
65% Proved Developed
–
55% Oil
1. Mid-year 2010 reserves are internally calculated, adjusted for the Sumitomo JV, and
have not been audited by an independent, third party. Actual reserves may vary. Mid-
year 2010 reserves calculated using $ 72.25 per Bbl and $4.10 per Mcf.
2. Year-end 2009 reserves calculated using $57.65 per Bbl and $3.87 per
Mcf. 3.
Year-end 2008 reserves calculated using $41.00 per Bbl and $5.71 per
Mcf. |
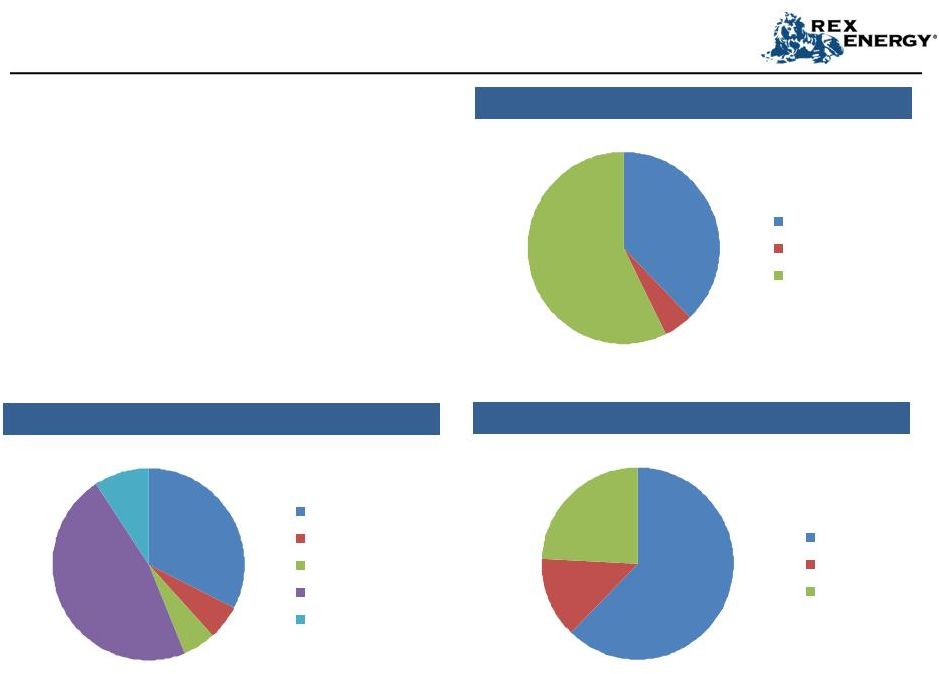    2010 Capital Budget
6
•
$130.7 million net capital budget
o
95% allocated to oil or liquids rich gas
o
95% allocated to operated properties
o
Capital budget is net of drilling carries
•
Budget funded with cash from
o
1
st
quarter 2010 offering
o
Cash from Sumitomo joint venture
o
Cash flow
32%
6%
6%
47%
9%
Drilling
Tertiary
Facilities & Equip
Land
Midstream
38%
5%
57%
Oil
Dry Gas
Liquids Rich Gas
14%
24%
62%
Appalachia
Illinois
Rockies
Capital Allocation by Activity Type
Capital Allocation by Region
Capital Allocation by Commodity |
 2010
2010
Projected
Projected
Production
Production
Profile
Profile
•
2010 Significant Assumptions:
o
3-rig Marcellus horizontal rig program
drilling 26 gross (15 net) wells
o
Butler cryogenic plant commissioned in
4 quarter 2010
o
3 horizontal Niobrara oil wells drilled
in Rockies Region
+44%
7
Projected Daily Exit Production
Daily Average Production
+24%
+43%
Projected Annual Daily Average Production
(1)
Projected Exit Rate Daily Production
(1)
1. Internally estimated projected production. Actual results may vary.
2. Average daily production for month of December 2009. th
|
    Current Hedging Summary
Crude Oil & NGLs
% of Current
with Floor
% of Current
with Ceiling
Avg. Floor
Price
Avg. Ceiling
Price
2011
75%
75%
$ 68.54
$ 104.69
2012
47%
47%
$ 68.00
$ 112.90
2013
N/A
N/A
N/A
N/A
8
Natural Gas
% of Current
with Floor
% of Current
with Ceiling
Avg. Floor
Price
Avg. Ceiling
Price
2011
(2)
108%
63%
$ 5.75
$ 6.51
2012
67%
67%
$ 5.41
$ 5.62
2013
N/A
N/A
N/A
N/A
Current Production Hedged
1. Based on September 2010 average daily production of 21.9 MMcfe/d. Actual results may vary.
2. ~22% of current natural gas production covered in 2011 by put spread with a $3.68
short put price for a $1.32 put spread. |
 Marcellus Overview
•
~98,000 gross (55,000 net) acres, all in Pennsylvania
o
64% of net acreage operated by Rex Energy in liquids rich
portion of the play
o
34% of net acreage operated by Williams in dry gas
portion of the shale play
•
3 gross (1.5 net) rigs currently drilling in the play
o
13 gross wells drilled and completed in 2010 (8 operated /
5 non-operated)
o
13 gross wells awaiting completion (7 operated/ 6 non-
operated)
•
Joint Ventures
o
Butler County, PA
–
70% Rex /30% Sumitomo joint venture in Butler County
–
$21.9 million in Sumitomo drilling carries remaining
o
Westmoreland, Clearfield and Centre, PA
–
50% Williams/ 40% Rex/10% Sumitomo joint venture in
Westmoreland, Clearfield and Centre counties
–
JV includes interest in gathering and transportation
–
$19.0 million in Sumitomo drilling carries remaining
o
Butler Midstream
–
60% Stonehenge/28% Rex/ 12% Sumitomo joint venture
–
Operation of
40
Mmcf/d
cryogenic
plant
–
Pipeline infrastructure
Magill 1H
Peak Rate:
3.4 Mmcfe/d
Panizzi
4H
Peak Rate:
4.6 Mmcf/d
Alder Run 1H
Peak Rate:
4.6 Mmcf/d
Marcellus “Fairway”
in Pennsylvania
Resource Potential
Low Case
High Case
Net Acres
~55k
(1)
Assumed % Drilled
75%
Well Spacing
80 acres
Net Potential Wells
515
EUR (Bcfe)
(1)
3.0
4.0
Royalties
15%
Upside Potential (Tcfe)
(2)
1.2
1.7
9
Shannon 1H:
2.2 Mmcfe/d
@
5% load recovery
1. Assumptions based on full development program. Individual well results may vary
significantly. Not proved. See “Hydrocarbon Volume Estimates” on page 2. 2.
Excludes approximately 100 Bcfe of Marcellus Shale proved reserves as of June 30, 2010. |
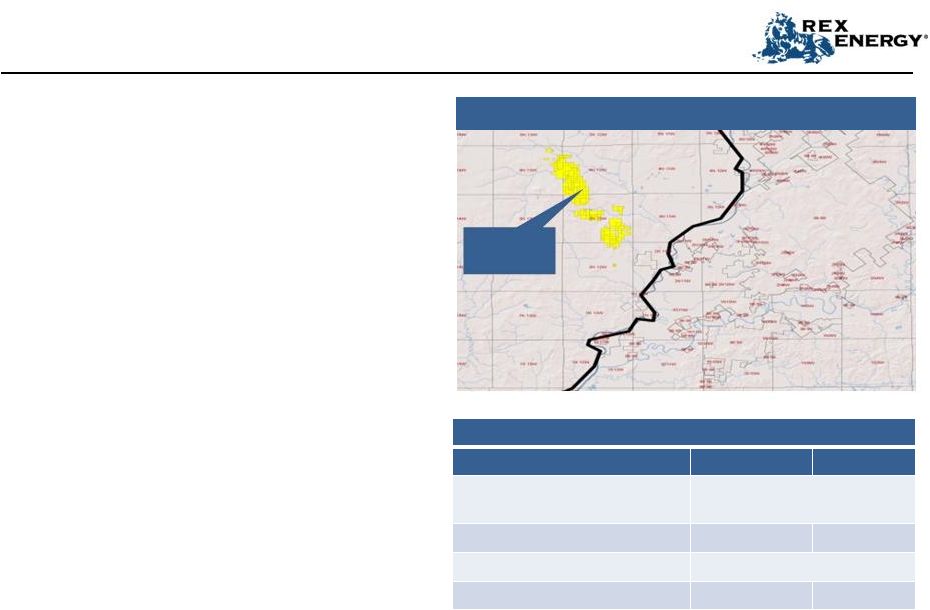
 Marcellus Operated Overview
Butler County, PA
o
Contiguous acreage position 40,000 gross (34,000 net)
acres
–
Allows for minimal rig movement
–
Decreases in drilling time
–
Maximizes unitized acreage
–
Access to infrastructure and pipelines
o
2010 Operational Highlights
–
Currently have 5 gross (3.5 net) wells placed in service
–
Drilled 15 (10.5 net) wells
•
8 gross (6 net) wells fractured and completed
•
7 gross (5 net) wells awaiting fracture & completion
•
Rig in transit to the 3 well Talarico
pad
–
Sarsen
Cryogenic plant operational
•
Current capacity at 24.0 Mmcf/d
•
By the end of January, 2011 expected capacity will be at
32.0 Mmcf/d
•
Expect to be at 40.0 Mmcf/d
by April 30
–
Phase
I
Leasing
–
Sumitomo
Joint
Venture
•
Estimate having 6,500 of the 9,000 acres leased by
12/31
o
2011 Operational Assumptions
–
Drilling the full year with one rig, and second rig by
mid year
–
Construction
of
the
second
40.0
Mmcf/d
cryogenic
plant, proposed commissioning 1 quarter of 2012
–
Primary leasing strategy will fill in future drilling units,
and other contiguous acreage blocks within the core
operational area
Marcellus Operated Area in Pennsylvania
10
th
st |
 Marcellus Non Operated Overview
Westmoreland, Clearfield and Centre
Counties, PA
oSizeable acreage position with 48,800 gross
(14,860 net) acres o2010
Operational Highlights –
Currently have 12 gross (4.8 net) wells placed in service
(curtailed at 15.0 Mmcf/d)
–
Drilled 11 gross (4.4 net) wells
•
5 gross (2.0 net) wells fractured and completed
•
6 gross (2.4 net) wells awaiting fracture &
completion
–
Two
rigs
currently
drilling
the
Androstic
3
well
pad
and
the
second
Uschack
4
well
pad
–
Transportation & Gathering
•
Westmoreland
o
14.0 Mmcf/d
current capacity through
Dominion at the Ecker
tap
o
Additional 24.0 Mmcf/d
capacity to the
Equitrans
expected May 1
•
Clearfield
o
Firm 10.0 Mmcf/d
transportation with Columbia
Gas in Clearfield. An additional 30.0 Mmcf/day
through Columbia is also available
o2011 Operational Assumptions
–
Two rig program for the full year
–
Primary leasing strategy will fill in future drilling units,
and other contiguous acreage blocks within the core
operational area
Marcellus Non Operated Area in Pennsylvania
11
st |
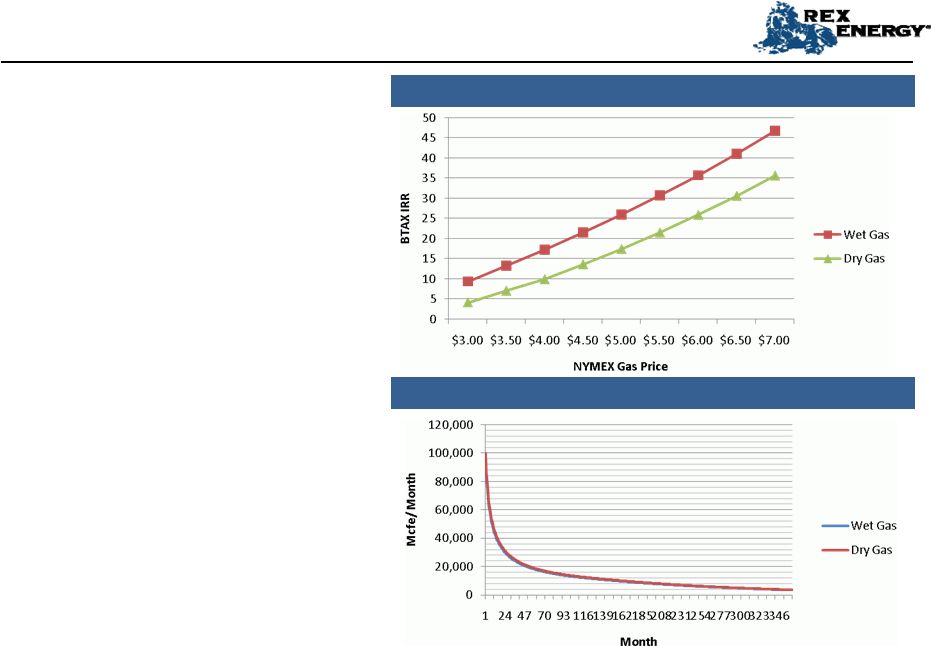 Conceptual
Marcellus
Marcellus
Economics
Economics
(1)
(1)
1. Assumptions
based
on
full
development
program.
Individual
well
results
may
vary
significantly.
Not
proved.
See
“Hydrocarbon
Volume
Estimates”
on
page 2.
•
Butler County (Wet Gas) Assumptions
o
2.5 MMcf/d
initial 30-day rate
o
4.3 Bcfe
gross EUR
o
$4.7 million D&C Costs
o
15% royalties
o
Gas Price Basis Adjustment: $0.15/Mcf
o
NGL & Condensate Volumes: 1.8 Gallons per
Mcf
(~46 Bbls
per MMcf)
o
NGL Price Assumptions: $0.90/gal
o
Gathering Transportation & Operating
Expenses: $1.48/Mcf
o
Gas Price BTU Adjustment: +10% (Based on
1,100 BTU post processing gas)
•
Westmoreland & Central PA (Dry Gas)
Assumptions
o
3.5 MMcf/d
initial 30-day rate
o
3.0 Bcf
gross EUR
o
$4.7 million D&C Costs
o
15% royalties
o
Gas Price Basis Adjustment: $0.15/Mcf
o
Gathering Transportation & Operating
Expenses: $0.58/Mcf
12
Before Tax IRR
Type Curves |
    Niobrara Overview
•
~56,000 gross (40,000 net) acres
o
3 horizontal wells drilled, fractured
and recovering load
o
4 additional wells permitted
•
DJ Basin Niobrara Summary
o
Thick “Source Rock”
–
300+ ft.
o
High Total Organic Content (TOC’s) of
2-10%
o
Strong matrix contribution from high
porosity chalks
o
Production likely influenced by faults
and fractures
o
Mature over large areal extent
o
Expected
well
costs
of
$3.5
-
$4.2
MM
DJ Basin
13
SM Energy
Atlas 1-19H
Peak Rate: 1,000+
Bbls/d
EOG
Elmber
8-31H
Peak Rate: 730
Bbls/d
EOG
Red Poll 10-16H
Peak Rate: 730
Bbls/d
EOG
Jake 2-1H
Peak Rate: 1,500+
Bbls/d
Rex Energy
Silo State 41-22H
Recovering Load
Rex Energy
Herrington Farms 1H
Drilled and Completed,
Recovering Load
Rex Energy
BJB #1H
Drilled and Completed,
Recovering Load
Resource Potential
(1)
Low Case
High Case
Net Acres
~40k
Assumed % Drilled
75%
Well Spacing
320 acres
Net Potential Wells
94
EUR (MBoe)
(1)
200
350
Royalties
17%
Upside Potential (MMBoe)
15.6
27.3
1.
Assumptions
based
on
full
development
program.
Actual
results
may
vary
significantly.
Not
proved.
See
“Hydrocarbon
Volume
Estimates”
on
page
2. |
 Conceptual
Niobrara
Niobrara
Economics
Economics
(1)
(1)
14
Before Tax IRR
Type Curve
•
Niobrara Horizontal Well Assumptions
o
300 Bbls/d
IP
o
Gas not included in economics
o
$4.2 million D&C Costs
o
17% royalties
o
Oil Price Basis Adjustment: -$11.00/Bbls
o
Gathering Transportation & Operating
Expenses: $13.00/Bbls
o
Severance & Ad Valorem Taxes: 13%
1. Assumptions based on full development program. Individual well results may vary
significantly. Not proved. See “Hydrocarbon Volume Estimates” on page 2. |
    Lawrence Field ASP Overview
•
~13,000 gross (13,000 net) acres in Lawrence Field
o
1 Billion Barrels of Original-Oil-in-Place
o
Field has produced 400 MMBbls
since 1906
o
Wateflooded
in the 1950’s
o
Two successful surfactant-polymer flood pilots
completed by Marathon with 15-20% of OOIP recovered
o
Field currently produces ~1,500 gross barrels per day
under waterflood
•
ASP Project Summary
o
ASP stands for Alkali-Surfactant-Polymer flood
o
Alkali-Surfactant mix reduces interfacial tension allowing
remaining oil to flow easier through the formation
o
Polymer improves sweep efficiency by forcing fluid into
parts of the field not effectively swept by the waterflood
o
Based on a geological analysis and high grading of the
acreage, 27 separate ASP units have been designed to
date.
o
Laboratory analysis on the effect of ASP flooding of cores
from the field recovered 23% of original-oil-in-place (16%
PV Recovery)
o
Single well pilot test of ASP flooding in the field
recovered 27% of original-oil-in-place (20% PV Recovery)
o
Injecting chemicals on 15-acre unit with initial response
expected in late first quarter 2011 to early second
quarter 2011
o
Currently at 25% of pore volume injected ASP slug,
currently injecting Polymer Push
Lawrence
Field
Illinois Basin
Indiana
Illinois
15
Resource Potential
Low Case
High Case
Residual Oil in Designed Units
(MMBls)
~311
PV Recovery Assumed
(1)
8%
20%
Royalties
22%
Upside Potential (MMBls)
~22
~50
1. Assumptions based on full development program. Individual ASP unit results may vary
significantly. Not proved. See “Hydrocarbon Volume Estimates” on page 2. |
    ASP Conceptual Economics
Potential: (Netherland, Sewell & Associates
ASP Evaluation, December 2009)
o
Rex Energy and Netherland, Sewell &
Associates have built a 3-dimensional
geological model over 5,000 well logs from
the field and reservoir simulator to identify
ASP units and estimate recoverable ASP
reserves.
o
North & Central areas of the field have been
analyzed to date (~75% of the field)
•
Identified 18 target continuous
sandbodies
and broke these down into 27
separate flood units (15 Bridgeport/12
Cypress)
•
Base Case Potential Reserves in Identified
Floodable Sands: 39.4 MMBbls
(1)
in the
Northern & Central areas of the field at a
13% PV Recovery
16
Typical ASP Flood IRR vs
Oil Price at Various PV Recoveries
Total ASP Potential Reserves at Various PV Recoveries
1. Estimated by Netherland, Sewell & Associates, Inc. Does not represent proved reserves.
See “Hydrocarbon Volume Estimates” on page 2. |