Attached files
| file | filename |
|---|---|
| EX-21 - EXHIBIT 21 - LEGEND INTERNATIONAL HOLDINGS INC | a6552226ex21.htm |
| EX-31.2 - EXHIBIT 31.2 - LEGEND INTERNATIONAL HOLDINGS INC | a6552226ex31_2.htm |
| EX-32.2 - EXHIBIT 32.2 - LEGEND INTERNATIONAL HOLDINGS INC | a6552226ex32_2.htm |
| EX-31.1 - EXHIBIT 31.1 - LEGEND INTERNATIONAL HOLDINGS INC | a6552226ex31_1.htm |
| EX-32.1 - EXHIBIT 32.1 - LEGEND INTERNATIONAL HOLDINGS INC | a6552226ex32_1.htm |
UNITED STATES
SECURITIES AND EXCHANGE COMMISSION
Washington, D.C. 20549
FORM 10-K/A
(Amendment no 1)
|
x
|
ANNUAL REPORT PURSUANT TO SECTION 13 OR 15(d) OF THE SECURITIES EXCHANGE
|
|
ACT OF 1934
|
|
|
For the fiscal year ended: December 31, 2009
|
|
|
or
|
|
| o |
TRANSITION REPORT PURSUANT TO SECTION 13 OR 15(d) OF THE SECURITIES EXCHANGE
|
|
ACT OF 1934
|
|
|
For the transition period from: _____________ to _____________
|
|
Commission File Number 000-32551
LEGEND INTERNATIONAL HOLDINGS, INC.
(Exact name of registrant as specified in its charter)
|
Delaware
|
23-3067904
|
|
|
(State or Other Jurisdiction
|
(I.R.S. Employer
|
|
|
of Incorporation or Organization)
|
Identification No.)
|
Level 8, 580 St Kilda Road Melbourne, Victoria, 3004, Australia
(Address of Principal Executive Office) (Zip Code)
011 (613) 8532 2866
(Registrant’s telephone number, including area code)
N/A
(Former name or former address, if changed since last report)
|
Securities registered pursuant to Section 12(b) of the Act: None
|
||
|
Securities registered pursuant to Section 12(g) of the Act:
|
||
|
Title of each class
|
||
|
Common Stock, par value $.001 per share
|
||
|
Indicate by check mark if the registrant is a well-known seasoned issuer, as defined in Rule 405 of the Securities Act.
|
||||
| o |
Yes
|
x
|
No
|
|
|
Indicate by check mark if the registrant is not required to file reports pursuant to Section 13 or Section 15(d) of the Act.
|
||||
| o |
Yes
|
x
|
No
|
|
|
Indicate by check mark whether the registrant (1) has filed all reports required to be filed by Section 13 or 15(d) of the Securities Exchange Act of 1934 during the preceding 12 months (or for such shorter period that the registrant was required to file such reports), and (2) has been subject to such filing requirements for the past 90 days.
|
||||
|
x
|
Yes
|
o |
No
|
|
|
Indicate by check mark if disclosure of delinquent filers pursuant to Item 405 of Regulation S-K (§229.405 of this chapter) is not contained herein, and will not be contained, to the best of registrant’s knowledge, in definitive proxy or information statements incorporated by reference in Part III of this Form 10-K or any amendment to this Form 10-K.
|
||
| o | ||
|
Indicate by check mark whether the registrant is a large accelerated filer, an accelerated filer, a non-accelerated filer, or a smaller reporting company.
|
||||||
|
Large accelerated filer
|
o |
Accelerated filer
|
x
|
|||
|
Non-accelerated filer
|
o |
Smaller reporting company
|
o | |||
|
Indicate by check mark whether the registrant is a shell company (as defined in Rule 12b-2 of the Act).
|
||||
| o |
Yes
|
x
|
No
|
|
|
State the aggregate market value of the voting and non-voting common equity held by non-affiliates computed by reference to the price at which the common equity was last sold, or the average bid and asked price of such common equity, as of the last business day of the registrant’s most recently completed second fiscal quarter.
|
||||
|
The aggregate market value based on the average bid and asked price on the over-the-counter market of the Registrant’s common stock, (“Common Stock”) held by non-affiliates of the Company was US$115,089,366 as at June 30, 2009.
There were 226,333,392 outstanding shares of Common Stock as of March 15, 2010.
|
||||
|
APPLICABLE ONLY TO REGISTRANTS INVOLVED IN BANKRUPTCY
|
||||
|
PROCEEDINGS DURING THE PRECEDING FIVE YEARS:
|
||||
|
Indicate by check mark whether the registrant has filed all documents and reports required to be filed by Section 12, 13 or 15(d) of the Securities Exchange Act of 1934 subsequent to the distribution of securities under a plan confirmed by a court.
|
||||
| o |
Yes
|
o |
No
|
|
|
DOCUMENTS INCORPORATED BY REFERENCE
|
||||
|
Not Applicable
|
||||
EXPLANATORY NOTE
We are filing this Amendment to our Form 10-K for the fiscal year ended December 31, 2009 in response to a comment letter from the staff of the Securities and Exchange Commission. In response to the staff’s comments, we have amended certain disclosure in Item 1 (Business) to revise and expand the disclosure concerning the Company’s exploration activities in accordance with SEC Guide 7; Item 1A (Risk Factors)to provide disclosure concerning potential risks associated with the concentration of stock ownership by certain principal stockholders and the Company’s service agreement with AXIS; Item 7A (Quantitative and Qualitative Disclosures About Market Risks) to provide additional information concerning market risks associated with the Company’s foreign currency positions; Item 8 (Financial Statements) to clarify the description of the Company retained deficit and to provide additional information concerning the Company’s relationship with AXIS; Item 10 (Management) to expand the disclosure concerning the qualification of the Company’s directors; Item 11 (Executive Compensation) to expand the discussion of the Company’s executive compensation practices; Item 13 (Certain Relationships and Related Transactions and Director Independence) to provide additional information concerning the Company’s relationship with AXIS and Item 16 (Exhibits) to correct certain references in the Exhibit list.
Except as described above, the remainder of the Form 10-K is unchanged and does not reflect events occurring after the original filing of the Form 10-K with the SEC on March 16, 2010.
| INDEX | ||
|
1
|
||
|
38
|
||
|
42
|
||
|
42
|
||
|
42
|
||
|
43
|
||
|
48
|
||
|
49
|
||
|
58
|
||
|
58
|
||
|
58
|
||
|
58
|
||
|
60
|
||
|
61
|
||
|
65
|
||
|
71
|
||
|
73
|
||
|
76
|
||
|
77
|
||
|
78
|
Information Regarding Forward Looking Statements
This report and other reports, as well as other written and oral statements made or released by us, may contain forward looking statements. Forward looking statements are statements that describe, or that are based on, our current expectations, estimates, projections and beliefs. Forward looking statements are based on assumptions made by us, and on information currently available to us. Forward-looking statements describe our expectations today of what we believe is most likely to occur or may be reasonably achievable in the future, but such statements do not predict or assure any future occurrence and may turn out to be wrong. You can identify forward-looking statements by the fact that they do not relate strictly to historical or current facts. The words "believe," "anticipate," "intend," "expect," "estimate," "project", "predict", "hope", "should", "may", and "will", other words and expressions that have similar meanings, and variations of such words and expressions, among others, usually are intended to help identify forward-looking statements.
Forward-looking statements are subject to both known and unknown risks and uncertainties and can be affected by inaccurate assumptions we might make. Risks, uncertainties and inaccurate assumptions could cause actual results to differ materially from historical results or those currently anticipated. Consequently, no forward-looking statement can be guaranteed. The potential risks and uncertainties that could affect forward looking statements include, but are not limited to:
|
§
|
the risks of mineral exploration stage projects,
|
|
§
|
political risks in foreign countries,
|
|
§
|
risks associated with environmental and other regulatory matters,
|
|
§
|
exploration risks and competitors,
|
|
§
|
the volatility of phosphate, diamond and other mineral prices,
|
|
§
|
movements in foreign exchange rates,
|
|
§
|
increased competition, governmental regulation,
|
|
§
|
performance of information systems,
|
|
§
|
ability of the Company to hire, train and retain qualified employees,
|
|
§
|
the availability of sufficient, transportation, power and water resources, and
|
|
§
|
our ability to enter into key exploration and supply agreements and the performance of contract counterparties.
|
In addition, other risks, uncertainties, assumptions, and factors that could affect the Company's results and prospects are described in this report, including under the heading “Risk Factors” and elsewhere and may further be described in the Company's prior and future filings with the Securities and Exchange Commission and other written and oral statements made or released by the Company.
We caution you not to place undue reliance on any forward-looking statements, which speak only as of the date of this document. The information contained in this report is current only as of its date, and we assume no obligation to update any forward-looking statements.
|
Business.
|
General
The terms “Legend,” “Company,” “we,” “our,” and “us” refer to Legend International Holdings, Inc. unless the context suggests otherwise.
We are an exploration stage company. Our objective is to exploit our interest in certain exploration tenements which are in Queensland and the Northern Territory of Australia. Our principal exploration target is for phosphate, base metals and diamonds and we are seeking to determine whether they are present in commercially economic quantities on our tenements to develop an operating mine.
1
Currency
We use the Australian dollar as our reporting currency, since we are headquartered in Australia and our administrative expenses are incurred in Australian dollars. References to dollars are to Australian dollars (A$) unless otherwise indicated as being United States dollars (US$). For the convenience of the reader, the Australian Dollar figures for the year ended December 31, 2009 have been translated into United States Dollars (“US$”) using the rate of exchange at December 31, 2009 of A$1.00=US$0.8931.
History
Legend was incorporated in the State of Delaware on January 5, 2001 under the name Sundew International, Inc., to engage in the business of selling compatible inkjet cartridges and refill kits on the Internet.
On March 13, 2003, Legend filed for an Amendment to its Certificate of Incorporation (the "Amendment") pursuant to which the name of Sundew International, Inc. was changed to "Legend International Holdings, Inc."
In November 2004, Renika Pty Ltd, an Australian corporation (“Renika”) acquired an 88% interest in Legend from William and Michael Tay (the “Tays”), the Tays resigned as Directors and Officers of Legend, Joseph Gutnick was appointed President, Chief Executive Officer and a Director and Peter Lee was appointed Secretary. The Tays also granted Renika an option to acquire an additional 578,240 shares of Common Stock that Renika exercised in 2005. Commencing in fiscal 2005, Legend has decided to focus its business on mineral exploration activities.
Effective as of March 3, 2006, the Company entered into a Contract for the Sale of Mining Tenements (“Contract”) with Astro Diamond Mines N.L. (“Astro”) an Australian company pursuant to which the Company shall acquire certain diamond exploration tenements in Northern Australia from Astro, which is described above.
In November 2007, Legend acquired a number of phosphate exploration interests in the State of Queensland in Australia.
In August 2009, Legend acquired a controlling interest in North Australian Diamonds Limited (“NADL”), an Australian company with diamond interests in the Northern Territory of Australia.
Legend is an exploration stage company. Legend has not been involved in any bankruptcy, receivership or similar proceeding. Legend has not been involved in any material reclassification, merger consolidation, or purchase or sale of a significant amount of assets not in the ordinary course of business.
SEC Reports
We file annual, quarterly, current and other reports and information with the SEC. These filings can be viewed and downloaded from the Internet at the SEC’s website at www.sec.gov. In addition, these SEC filings are available at no cost as soon as reasonably practicable after the filing thereof on our website at www.lgdi.net. These reports are also available to be read and copied at the SEC’s public reference room located at Judiciary Plaza, 100 F Street, N.E., Washington, D.C. 20549. The public may obtain information on the operation of the public reference room by calling the SEC at 1-800-SEC-0330.
Description of Business
Business
The Company has never generated any significant revenues from operations and is still considered an exploration stage company. The Company was initially formed to engage in the business of selling compatible inkjet cartridges and refill kits on the Internet for the consumer printer market. In March 2003, management of the Company decided to engage in the business of building and acquiring controlling or other interests in one or more companies engaged in the contract sales and distribution of specialty medical products, and raise additional capital for this purpose. Neither business was successful and operations of both were eventually discontinued. During fiscal 2004, management of the Company developed a plan of operations to acquire income-producing real property. The Company did not acquire any properties pursuant to such plan.
2
Following the change of management in November 2004, the Company developed a new plan of operations, which was to engage in mineral exploration activities. Legend's business plan calls for the identification of mineral properties where it can obtain secure title to exploration, development and mining interests.
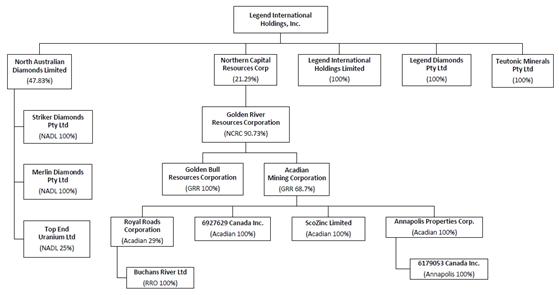
The following chart sets forth the Company’s corporate organization as of December 31, 2009:
2009 Highlights
|
Ø
|
Granting of Exploration Permits for Legend’s flagship phosphate projects at Paradise North and South.
|
|
Ø
|
High grade mineralization defined at both Paradise North and D-Tree phosphate projects.
|
|
Ø
|
Successful progess of phosphate flotation beneficiation flow sheet through bench scale testwork.
|
|
Ø
|
Successful operation of a continuous 4 week pilot plant operation for phosphate flotation beneficiation on bulk samples from Paradise and D-Tree deposits.
|
|
Ø
|
Phosphate rock proven to acidulate to phosphoric acid successfully and make a world class fertilizer product such as DAP, MAP, SSP or TSP etc.
|
|
Ø
|
Strong government support with the granting of industrial zoned land in Mt Isa for the building of a phosphoric acid plant. The land has power, water, relevant permits and is situated on the rail line.
|
|
Ø
|
Memorandum of Understanding signed with P&O Trans Australia for haulage and handling services associated with Legend’s Georgina Basin Phosphate project.
|
|
Ø
|
The Indian Farmers Fertiliser Cooperative (‘IFFCO’), India’s single largest phosphate fertilizer consumer, increases its equity stake in Legend to 15.2%.
|
|
Ø
|
Legend forms a strategic alliance with Wengfu (Group) Co. Ltd, one of China’s largest phosphate fertilizer producers, whereby Wengfu will conduct a feasibility study on all aspects of the project with a view to becoming an equity partner with Legend.
|
Project Strategy
Legend is primarily focused on advancing its significant phosphate deposits in the Georgina Basin of Queensland, Australia (See Figure A) with the aim of becoming a major Australian phosphate rock and phosphate fertilizer producer. Non reserve mineralized material has already been defined and feasibility studies are currently underway. These studies have made significant progress in determining the mining, metallurgical, economic, marketing, legal, environmental, social and governmental factors which will modify the non reserve mineralized material estimates into future estimates of potential Mineral Reserves. These modifiying factors will inform the Company as to which parts of the currently defined non reserve mineralized material will be able to be legally and economically extracted in the future. Currently the Company has no Mineral Reserves as defined by the U.S SEC Industry Guide 7 however the Company’s Phosphate Development Team is working towards this goal. Important strategic alliances have been made with the Indian Farmers Fertiliser Cooperative (IFFCO) and Wengfu (Group) Co. Ltd (Wengfu) to achieve this goal.
3
IFFCO is the single largest consumer of phosphate fertilizers in India and have agreed, subject to the negotiation and execution of a definitive off-take agreement, to offtake up to 5 million tonnes of phosphate rock per year from Legend’s future potential production. IFFCO and Legend have extended the date of executing a definitive rock off-take agreement by a further 2 years to mid 2012. Wengfu is one of China’s largest phosphate fertilizer producers and have significant expertise in developing phosphate deposits and maximizing value through the development of many downstream products. Wengfu currently market their products to over 20 countries worldwide. Wengfu have agreed to conduct a feasibility study on the potential mining, beneficiation, phosphoric acid and phosphate fertilizer production from Legend’s phosphate deposits with a view to becoming an equity partner in Legends Phosphate Project.
Legend, in accordance with its initial strategy of exploration for various mineral commodities across northern Australia (with a focus on diamond exploration) also controls and maintains landholdings in the Northern Territory of Australia (See Figure A). These interests are managed by Legend through a separate Exploration Team not involved with the Phosphate Project.
During the economic downturn of 2008, Legend also decided that part of the Company strategy should be to invest into undervalued mining projects should opportunities arise. This investment would not detract from Legends primary goal of advancing the Phosphate Project and had the aim of diversifying interests to dilute the effect of identified potential project risks. This was seen as necessary by the Company due to the obviously volatile and unpredictable nature of the commodity markets at the time. Some of these investments include taking a major stake in North Australian Diamonds Ltd (NADL) which controls the Merlin Diamond Mine and includes NADL’s 25% interest (increased to 28% since December 31, 2009) in Top End Uranium Ltd in the Northern Territory, Australia and an investment in Northern Capital Resources Corporation which controls gold and zinc assets in Nova Scotia, Canada. These are outlined in further detail below.
Legend Georgina Basin Phosphate Project
Legend’s initial plan was to advance the phosphate deposits with a staged approach. The initial stage was to focus on phosphate rock material which requires little to no beneficiation, then move towards upgrading the rock to a higher grade concentrate through flotation beneficiation and finally using this material to create value added phosphate fertilizer products. Legend formed a strategic alliance with Wengfu in November 2009 and based on initial recommendations from the work they have conducted so far, the Company will be issuing a revised project timeline and strategy upon completion of the feasibility study in the second quarter of fiscal 2010 which is being conducted by Wengfu. The revised strategy and timeline may involve a different combination or prioritization of the various stages currently being assessed.
Legend’s Land Holdings and Projects
The Legend landholdings, both granted and under application, prospective for phosphate, diamonds and base metals cover 523,170 acres in Queensland, Australia and over 4,725,098 million acres in the Northern Territory, Australia (refer to tables A,B,C and D). Areas under application are not considered as currently under Legend’s control. Granted landholdings consist of 457,200 acres in Queensland and 1,472,309 acres in the Northern Territory (refer to tables A and C). In Queensland, Legend’s holdings are historical phosphate deposits located in the Mt. Isa district, along the margin of the Georgina Basin which is host to major base metal and phosphate deposits.
4
Legend’s exploration tenements are divided into the following project areas (See Figure A below):
|
●
|
Phosphate Projects:
|
|
§
|
Paradise Phosphate Project, Queensland
|
|
§
|
D-Tree Phosphate Project, Queensland
|
|
§
|
King Eagle Phosphate Project, Queensland
|
|
●
|
Diamond and Phosphate Projects:
|
|
§
|
Barr Creek Project, Queensland
|
|
●
|
Diamond Projects:
|
|
§
|
Glyde River, Northern Territory.
|
|
§
|
Foelsche, Northern Territory
|
|
§
|
Abner Range, Northern Territory.
|
|
§
|
Cox, Northern Territory.
|
|
§
|
Gravity Project, Northern Territory
|
|
●
|
Diamonds and Base Metals
|
|
§
|
McArthur River, Northern Territory
|
|
§
|
Selby Project, Northern Territory
|
The exploration tenements of North Australian Diamonds are discussed separately below.
5
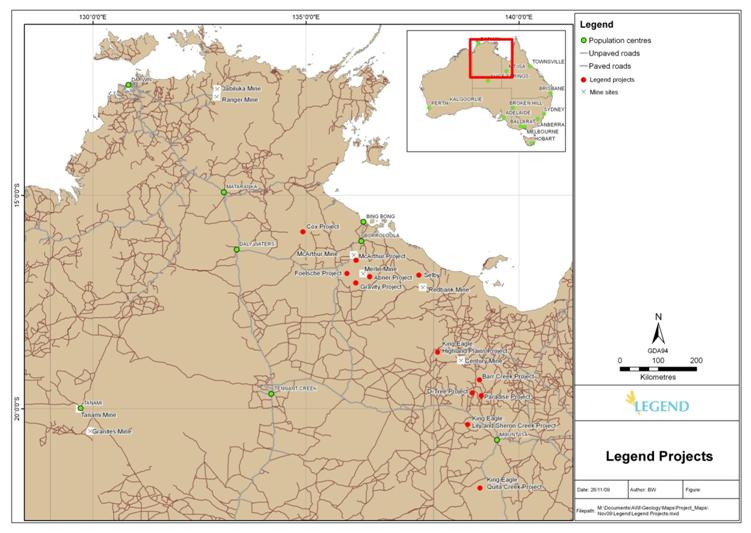
Figure A: Projects in Northern Territory and Queensland, Australia
6
Queensland Projects
Tenement Status, Details & Commitments (Projected) Queensland and Northern Territory, Australia
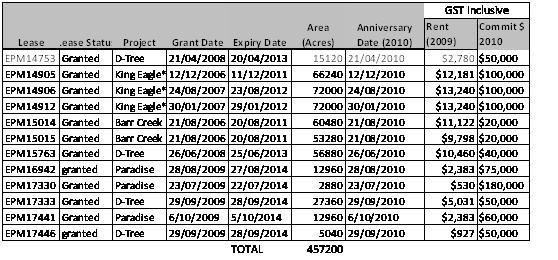
Table A. Granted Tenements for Queensland Projects
* earning 80% interest
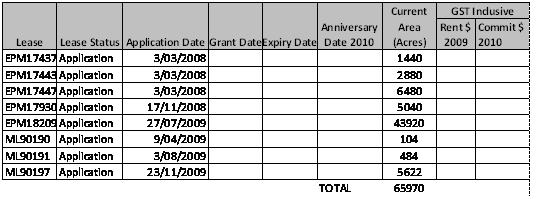
Table B. Tenements under application for Queensland Projects
7
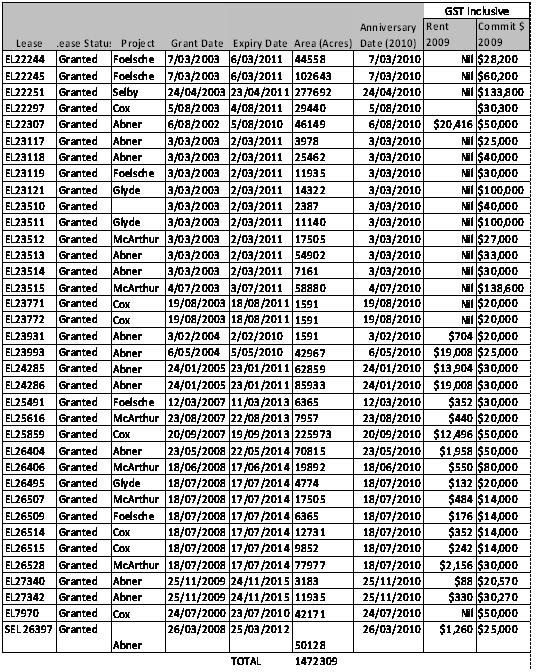
Table C: Granted Tenements for Northern Territory Projects
8
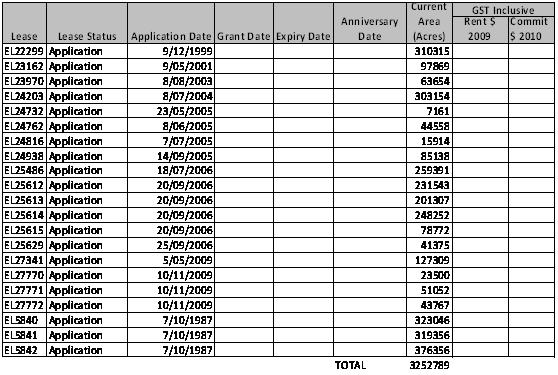
Table D: Tenements under application for Northern Territory Projects
Metallurgy
During 2009, Legend has carried out four stages of bench scale beneficiation test work culminating in a pilot plant study using samples of D-Tree, Paradise North and Paradise South mineralized material. Phosphoric acid testing was also completed on selected samples.
Bench Scale Flotation Test Work
The major aims of the bench scale test program were to develop a beneficiation flow sheet that would recover the most phosphate at the highest grade, without discarding any Ultrafine (-20µm) material. The main findings included:
|
·
|
Both D-Tree and Paradise South ores could be successfully beneficiated,
|
|
·
|
Encouraging flotation of Ultrafine phosphate in a specialized flotation cell.
|
|
·
|
Potential for >80% total P2O5 recoveries at 31-33% P2O5 grade without discarding any -20µm particles.
|
|
·
|
A process flow sheet using a split sized flotation circuit of -150+20µm in conventional flotation cells and -20µm in specialized flotation cells would be successful in recovering >80% P2O5 at about 33% P2O5 concentrate grade.
|
|
·
|
Only a single rod mill would be required, grinding to a P80 of 150µm.
|
|
·
|
A WHIMS unit would not be required to obtain the required Fe2O3 rejection from the concentrates.
|
Bench Scale Data
Stage 1
Location of Samples:
All of the samples were taken from the phosphorite horizons within the Beetle Creek Formation (D-Tree deposit). The Beetle Creek Formation occurs within the Lower Middle Cambrian stratigraphy of the Georgina Basin, Queensland, Australia. Phosphorite at D-Tree occurs predominantly as mudstone and silty mudstone phosphorite with some minor occurrences of pelletal phosphorite. In 2008, Legend completed an extensive drilling program across the D-Tree deposit. Samples chosen for bench scale test work were taken from eleven cored drillholes distributed across a broad area of the D-Tree deposit, and from different intervals of the ore zone so that the abovementioned range of ore types were processed.
9
|
Test ID
|
Original Sample
Size
(Kg)
|
Original Sample
Grade
(% P2O5)
|
Concentrate
Grade
(% P2O5)
|
Calculated
P2O5
Recovery (%)
|
|
1
|
0.16
|
23.0
|
32.6
|
91.1
|
|
2
|
0.23
|
20.1
|
34.8
|
94.9
|
|
3
|
5.0
|
16.4
|
33.8
|
52.0
|
|
4
|
5.5
|
13.6
|
32.7
|
60.5
|
|
5
|
3.96
|
18.2
|
19.1
|
89.7
|
|
6
|
5.0
|
16.3
|
26.5
|
47.6
|
|
7
|
5.5
|
14.5
|
32.4
|
45.6
|
|
8
|
1.0
|
13.85
|
31.67
|
79.3
|
|
9a
|
1.0
|
20.87
|
31.62
|
44.3
|
Table E: Test results of Stage 1 bench scale flotation test work
Stage 2
Location of Samples:
For the Stage 2 flotation test work, a range of samples of different ore character were taken from several cored drillholes positioned across different prospect areas of the D-Tree deposit. All of the samples were taken from the phosphorite horizons within the Beetle Creek Formation (D-Tree deposit). The Beetle Creek Formation occurs within the Lower Middle Cambrian stratigraphy of the Georgina Basin, Queensland, Australia.
|
Test ID
|
Original Sample
Size
(Kg)
|
Original Sample
Grade
(% P2O5)
|
Concentrate
Grade
(% P2O5)
|
Calculated
P2O5
Recovery (%)
|
|
9b
|
0.21
|
20.1
|
36.8
|
50.9
|
|
10
|
0.42
|
20.1
|
34.2
|
88.2
|
|
11
|
0.21
|
20.0
|
34.6
|
82.4
|
|
12
|
0.23
|
21.6
|
32.7
|
57.7
|
|
13
|
0.46
|
21.6
|
29.3
|
86.5
|
|
14
|
0.23
|
21.3
|
30.9
|
88.7
|
|
15
|
0.21
|
20.2
|
32.8
|
94.6
|
|
16
|
0.65
|
20.4
|
36.4
|
94.4
|
|
17
|
0.84
|
20.4
|
34.1
|
94.1
|
|
18
|
0.24
|
15.8
|
33.2
|
28.4
|
|
19
|
0.66
|
15.7
|
30.9
|
53.7
|
|
20
|
0.87
|
15.6
|
30.1
|
49.2
|
|
UQ1375
|
2.23
|
20.2
|
29.5
|
76.2
|
|
UQ1376
|
2.34
|
21.4
|
27.5
|
82.9
|
|
UQ1377
|
2.82
|
22.4
|
30.2
|
67.0
|
|
UQ1380
|
5.90
|
22.4
|
29.7
|
34.9
|
|
UQ1381
|
2.90
|
22.4
|
29.6
|
44.0
|
Table F: Test results of stage 2 bench scale flotation test work.
10
Stage 3
Location of Samples:
Samples used for the Stage 3 test work were taken from both the D-Tree and Paradise South deposits. All of the D-Tree samples were taken from cored drillholes that intersected the phosphorite horizons within the Beetle Creek Formation. Samples from the Paradise South deposit were taken from large ore stockpiles that were left on site from work conducted by Broken Hill South in the late 1960’s and early 1970’s. Broken Hill South conducted detailed metallurgical studies into the phosphate rock at Paradise South (previously known as the Lady Annie phosphate deposit) including the development of an on-site pilot plant. In order to provide phosphate rock for the pilot plant, Broken Hill South excavated nine costeans across a broad area of the Paradise South phosphate deposit. Approximately 64,000 tonne of phosphate rock was excavated from these trenches that sampled the full range of ore types at Paradise South, from all of the main prospect areas across the deposit. The costeans were never rehabilitated and large amounts of the stockpiles were never processed through the pilot plant. Several 100kg samples of Paradise South ore were taken from these stockpiles and used for the Stage 3 metallurgical test work. Before processing was carried out these 100kg samples were riffle split in half where one half was kept at the laboratory for future reference. The sample half that was used had further sub-splits taken from it for head assays and particle size distribution assessment prior to flotation testing.
|
Test ID
|
Original Sample
Size
(Kg)
|
Original Sample
Grade
(% P2O5)
|
Concentrate
Grade
(% P2O5)
|
Calculated
P2O5
Recovery (%)
|
|
21
|
1.09
|
16.2
|
35.1
|
58.0
|
|
23
|
0.99
|
11.0
|
29.6
|
34.0
|
|
24
|
0.87
|
4.7
|
24.6
|
72.4
|
|
25
|
0.97
|
16.5
|
35.1
|
73.7
|
|
26
|
1.05
|
33.2
|
36.4
|
37.2
|
|
27
|
1.10
|
9.6
|
33.4
|
41.7
|
|
28
|
0.95
|
10.1
|
31.2
|
55.0
|
|
29
|
1.02
|
11.1
|
29.0
|
39.0
|
|
30
|
0.87
|
4.7
|
26.0
|
62.9
|
|
31
|
1.03
|
33.7
|
37.0
|
38.4
|
|
32
|
0.87
|
8.5
|
34.8
|
62.1
|
|
33
|
0.97
|
9.5
|
32.3
|
61.9
|
|
34
|
0.93
|
13.1
|
29.7
|
78.8
|
|
35
|
1.10
|
5.1
|
27.4
|
74.4
|
|
36
|
0.99
|
19.6
|
34.8
|
59.9
|
|
37
|
0.83
|
33.2
|
37.1
|
59.2
|
|
38
|
0.91
|
10.5
|
34.9
|
71.8
|
|
39
|
0.88
|
10.2
|
33.2
|
61.8
|
|
UQ1408
|
4.66
|
12.8
|
17.4
|
22.1
|
|
UQ1409
|
4.88
|
20.1
|
22.8
|
54.4
|
|
UQ1410
|
4.57
|
16.5
|
20.0
|
58.9
|
|
UQ1411
|
4.32
|
14.0
|
13.8
|
25.5
|
|
UQ1412
|
3.90
|
29.6
|
30.4
|
71.4
|
Table G: Test results of stage 3 bench scale flotation testwork.
11
Stage 4
Location of Samples:
For the Stage 4 flotation test work, a range of samples of different ore character were taken from several cored drillholes positioned across different prospect areas of the D-Tree deposit. All of the samples were taken from the phosphorite horizons within the Beetle Creek Formation (DTree deposit). The Beetle Creek Formation occurs within the Lower Middle Cambrian stratigraphy of the Georgina Basin, Queensland, Australia.
|
Test ID
|
Original Sample
Size
(Kg)
|
Original Sample
Grade
(% P2O5)
|
Concentrate
Grade
(% P2O5)
|
Calculated
P2O5
Recovery (%)
|
|
1
|
0.86
|
16.7
|
33.4
|
94.7
|
|
2
|
0.88
|
16.6
|
30.3
|
97.4
|
|
3
|
1.03
|
17.1
|
34.2
|
86.5
|
|
4
|
0.93
|
16.9
|
33.8
|
76.2
|
|
5
|
1.03
|
17.0
|
35.6
|
70.8
|
|
6
|
0.98
|
17.1
|
30.9
|
97.6
|
|
7
|
1.03
|
17.1
|
29.8
|
97.1
|
|
8
|
1.02
|
16.9
|
32.2
|
96.9
|
|
9
|
0.97
|
16.7
|
25.9
|
51.4
|
|
10
|
0.95
|
16.1
|
26.0
|
93.8
|
|
11
|
0.98
|
16.7
|
31.3
|
97.5
|
|
12
|
1.02
|
16.6
|
27.3
|
96.0
|
Table H: Test results of stage 4 bench scale flotation test work.
Pilot Plant Flotation Test Work
In August 2009, Legend had sufficient information and confidence in the deposit to design and implement a pilot plant for the beneficiation process. This was carried out through October and November 2009 on larger ore samples, representative of two Paradise South samples and one sample each from Paradise North and D-Tree.
Highlights include:
|
·
|
Confirmation of simple processing circuit with no crushing of ROM ore needed.
|
|
·
|
Paradise South hourly survey concentrate grades up to 34.4% P2O5 were achieved from feed grades between 17% and 20% P2O5. The best hourly survey result of 92% P2O5 recovery at 31.6% P2O5 grade was achieved from a single flotation cell, indicating fast flotation kinetics.
|
|
·
|
A low grade Paradise South hourly survey sampled at 14.3% P2O5 and upgraded to a 31.7% P2O5 concentrate with 75% P2O5 recovery.
|
|
·
|
D-Tree hourly survey concentrate grades up to 35% P2O5 were achieved from feed grades between 16% and 18% P2O5. The best hourly survey recovery of 87% P2O5 was obtained to a concentrate grade of 30.1% P2O5.
|
|
·
|
Most results were achieved without a cleaner flotation stage. This indicates that there is still some potential to obtain higher P2O5 concentrate grades with lower impurities by including cleaning in the flotation circuit.
|
During the operation of the pilot plant it was found that the two flotation circuits that were initially set up to treat the coarse and ultrafine material separately could be simplified to one flotation circuit capable of treating the entire range of particle sizes, without any particle classification. This development together with the elimination of the crushing circuit has potential to save on capital and operating costs, water and power usage.
Pilot Plant Data
Location of Samples:
All samples for DTree, Paradise North and Paradise South were taken from historic trenches from the Beetle Creek formation in the Georgina Basin, Queensland, Australia. Four lots of 40 tonnes were sampled using hand held excavators and were processed through a ten tonne per day pilot plant processing facility in Adelaide, Australia.
12
In the 1970’s numerous large costeans were excavated at the D-Tree, Paradise South and Paradise North deposits. All of these costeans were used to provide phosphate rock for pilot plant studies in the 1970’s and were never rehabilitated. As such, Legend was able to revisit these trenches and sample them thoroughly in 2009. At the D-Tree deposit, two large costeans were sampled to provide 40 tonnes of material for the 2009 pilot plant. The large samples incorporated a range of ore characters.
Two 40 tonne samples were obtained from the stockpiles of six costeans at Paradise South in 2009. One 40 tonne Paradise South sample was taken from costeans located in the Rufous Creek prospect area and incorporated predominantly pelletal ore types of higher grade. The second 40 tonne sample was taken from costeans in the Jessops Creek prospect area and incorporated both mudstone phosphorite and pelletal phosphorite of average P2O5 grades.
At Paradise North, the stockpiles of two costeans were sampled to create a 40 tonne sample. This sample incorporated several different ore types, and one type of ore that is mostly confined to the Paradise North deposit.
|
Test ID
|
Original Sample
Size
(Kg)
|
Original Average
Sample Grade
(% P2O5)
|
Representative
Concentrate Grade
Achieved
(% P2O5)
|
Representative
Calculated
P2O5 Recovery
(%)
|
|
DTree
|
40,000
|
17.8
|
30.1
|
87.3
|
|
Paradise North
|
40,000
|
19.0
|
28.8
|
86.6
|
|
Paradise South 1
|
40,000
|
18.3
|
31.3
|
92.3
|
|
Paradise South 2
|
40,000
|
14.5
|
28.9
|
85.3
|
Table I: Test results of pilot flotation plant samples
Proposed Beneficiation Plant
The proposed Beneficiation Plant Site location is at the site of the historic Pilot Plant which was operated by BH South in the 1970s. This site was also identified by BH South as the most suitable location for their proposed Beneficiation Plant. The area was chosen due to the favourable topography and its location to existing road and power infrastructure in the region. The site was previously sterilised of phosphate mineralisation through drilling by BH South.
The process is capable of treating phosphate ores which contain up to 60 wt% Ultrafines, where Ultrafines is defined as particles smaller than 20 micron in size. The ore as mined is screened at 25mm and the oversize fraction, which is rich in silica, is discarded. The undersize fraction is fed to a rod mill and ground at 63% solids so that 55% of the material is reduced to less than 150 micron in size. During grinding soda ash is added to the mill to provide a slurry pH of between 9 and 10. The slurry is then fed to a hydrocyclone which provides further size classification of the particles so that the cyclone overflow product is at least 80% passing 150 micron and the cyclone underflow is recycled to the rod mill for re-grinding. The cyclone overflow is dewatered using a belt filter so that the solids content is increased to at least 70%. This slurry is then conditioned in a stirred tank with flotation chemicals that provide hydrophobicity to the phosphate bearing minerals, thus enabling them to be separated from silica and carbonate gangue minerals during flotation. After conditioning, the slurry is diluted to approximately 25% solids and is fed to the flotation circuit where flotation cells concentrate the phosphate. The concentrate and tailings are subsequently thickened and dewatered. The concentrate is the final product that becomes the feed to Legend’s phosphoric acid plant and assays at least 32% P2O5. The tailing is fed to the tailings dam and assays approximately 2% P P2O5.
13
Proposed Tailings Dam
A by-product of this flotation process will be a significant quantity of tailings, which will require storage during the life of the potential mine. The broad tailings management strategy will be as follows:
|
·
|
Construct a specially designed Tailings Storage Facility (TSF) to store tailings during the “start-up” period. The duration of this period is nominally 3 to 5 years, and is basically taken to be the time required to;
|
|
·
|
Develop one or more initial tailings storage cells within the proposed mining pits. The remaining life of mine tailings from the beneficiation plant will then be directed to a series of ”inpit” cells, which will be formed, filled and closed in a sequenced manner
|
The preferred site for the Start-up TSF is the valley to the south of the beneficiation plant site. A total of three conceptual options for the configuration of a TSF within this valley have been considered, these being based on “start-up” periods ranging from 2 to 7 years to investigate the optimum efficiency (in terms of costs versus storage capacity).
The general arrangement consists of the down-valley deposition of tailings using two pipe-end discharge points, to a retaining embankment (identified as the “Tailings Embankment”). A decant water system will be installed on the upstream face of the Tailings Embankment, transferring decant and catchment runoff water via a buried pipe to a Decant Pond immediately downstream. The pond will be formed by a water retaining embankment at the southern end (identified as the “Decant Embankment”). The Decant Pond will have a capacity of approximately 400 ML, to provide storage for the TSF design storage allowance.
An emergency spillway will be constructed at the western abutment of the Tailings Embankment, and as an outfall chute on the crest of the Decant Embankment. Both spillways would need to be designed to pass the critical duration, 1 in 10,000 year AEP flood event, assuming that the tailings/decant pond level is at the minimum freeboard level.
Each of the options include Discharge Bunds and Saddle Dams of varying extents, in order to provide the required tailings head of beach, and containment of tailings at the saddles on the eastern side of the valley.
Phosphoric Acid Manufacture
During 2009 Legend supplied a total of five rock samples to CTI laboratories in Belle Chasse USA for the bench scale evaluation of phosphoric acid manufacture. Apart from the one sample from Paradise South, all samples were ‘as sampled’ material (AS) with no flotation beneficiation having taken place. The Paradise South sample was remnant flotation concentrate from an old stockpile from the 1974 pilot plant situated at Lady Annie. One Paradise North sample did have simple washing and screening at 20 microns.
The conclusions of the phosphoric acid manufacture conducted in Belle Chase, U.S.A were as follows:
|
·
|
The Paradise North AS, Paradise North (washed) and Paradise South concentrate rock produced phosphoric acid equal in quality to Florida base rock.
|
|
·
|
The Paradise North AS and the Paradise South rock gave the highest phosphate recovery compared to the Base rock and the Paradise South rock.
|
|
·
|
The Paradise North (washed) rock produced phosphogypsum slurries which filtered around 30% slower than the Florida Base rock.
|
|
·
|
Paradise North AS rock produced phosphogypsum slurries which filtered significantly slower than Base rock slurries.
|
|
·
|
While the Australian rocks contained high levels of SiO2 much of this is in the form of insoluble quartz. The low levels of reactive SiO2 show the need to add reactive silica (for example clay) to handle the fluorine in the rock.
|
|
·
|
The lower CaO/P2O5 ratios in the Australian rocks suggest that around 10 – 15 % less sulphuric acid is required to digest the phosphate in these rocks compared to the Florida Base rock.
|
|
·
|
The basis for designing a continuous pilot plant run based on Wet Screened and Paradise South rock have been successfully demonstrated.
|
|
·
|
The acid produced had minor element ratio’s which would make a world quality Di Ammonium Phosphate (DAP) and therefore other phosphate fertilizer products.
|
14
Phosphoric Acid Data
Location of Samples:
The historic Lady Annie pilot plant, of which remnants still exist at the site now known as Paradise South, processed phosphate rock and produced concentrate in the early 1970’s. Several small stockpiles of the concentrate produced at this pilot plant still exist at the historic pilot plant site. These concentrate stockpiles were sampled for the phosphoric acid test work.
At D-Tree, Paradise South and Paradise North, there are areas and intervals of the deposit that are of a high grade suitable for phosphoric acid manufacture. At D-Tree, the high grade ore occurs in the upper stratigraphy of the northern part of the deposit. These intervals were sampled from several cored drillholes for this test work.
At Paradise North, a large proportion of the deposit is also of a high grade nature. Material of this character was sampled from several cored drillholes across the Paradise North site. At Paradise South, localised areas of the deposit provide high-grade material suitable for phosphoric acid testing. This material was sampled in several cored drillholes as well as historic costean faces.
|
Test ID
|
Original Sample
Size (Gram)
|
Original Sample
Grade
(% P2O5)
|
Acid Grade
(% P2O5)
|
Calculated
P2O5 Recovery
(%)
|
|
Paradise South 1970’s Con
|
80
|
34.23
|
27.65
|
91.4
|
|
DTree AS 1
|
122
|
22.02
|
28.33
|
63.7
|
|
DTree AS 2
|
122
|
28.61
|
27.96
|
71.4
|
|
PNorth Not Deslimed
|
104
|
30.36
|
29.27
|
94.7
|
|
PNorth Deslimed
|
104
|
31.86
|
26.9
|
94.6
|
|
Paradise South A
|
358
|
34.52
|
24.54
|
96.2
|
|
Paradise South B
|
326
|
33.19
|
23.11
|
96.0
|
|
Paradise North
|
462
|
31.81
|
28.16
|
93.6
|
Table J: Test results of phosphoric acid test work.
Transport
During 2009 Legend signed a Memorandum of Understanding with P&O Trans Australia (POTA) for haulage and handling services associated with Legend’s Georgina Basin Phosphate project. POTA’s services are to include:-
|
1.
|
Road cartage from D-Tree and Paradise North tenements, both located approximately 160 kilometers from the deposit to the rail head in Mount Isa;
|
|
2.
|
Rail haulage from Mount Isa to Port of Townsville, approximately 1,000 kilometers; and,
|
|
3.
|
Various storage and material handling tasks.
|
P&O Trans Australia is a business of POTA Holdings Pty Ltd which is the joint venture company of Kaplan (KIL: Kaplan Infrastructure & Logistics Fund & KEL: Kaplan Equity Limited) and DP World (Government Owned Corporation in Dubai). P&O operates a Port precinct based Full and Empty container logistics business working from a total of 16 sites located in the State capital Cities of mainland Australia, a Multi-User Intermodal Terminals business with 6 sites in capital city locations along the Eastern Seaboard of Australia, a Rail Freight business operating Shipping Services between regional, metropolitan and interstate origins and the Ports of Sydney and Melbourne and a Global Freight Forwarding company with a network of offices in Australia and around the World.
15
The Queensland Government also announced in December 2009 that it will commit AUD$102 million to upgrades to the Mt Isa to Townsville rail line over the next two years. These upgrades will be aimed at increasing efficiency and capacity for future demand. This announcement is consistent with Legends own discussions with the Queensland government and in particular the Premier of Queensland who has given the Legend Phosphate project her full support.
Legend also engaged Pipeline Systems International (PSI) to undertaken a conceptual study for assessment of a slurry pipeline to transport the beneficiated phosphate ore from the deposit site to existing rail facilities. The option would involve a dewatering facility at the rail terminal and return water pipelines to the beneficiation plant following the route of the slurry pipeline. The dewatered phosphate concentrate would be loaded into rail wagons and make their way via rail to the Port of Townsville for storage and loading to ship.
Water supply
Three water supply options are under consideration for this project.
|
1.
|
Lake Julius option
|
Legend engaged SunWater to undertake a pre-feasibility study to assess the option of directing up to 10GL of unallocated water from Lake Julius to the proposed mine and beneficiation plant. Lake Julius is located approximately 85 kilometers east southeast of the proposed mine and beneficiation plant. The findings of this study will be compared against the other options presented below but initial findings are that the water supply is available to Legend and it is technically feasible to bring this water to the proposed site.
|
2.
|
Thorntonia Borefield option
|
Legend has commenced commercial negotiations in regard to the lease of an existing borefield water permit. The borefield water will need to be pumped approximately 45 kilometers to the beneficiation plant via an above ground pipeline.
|
3.
|
Upper Battle Creek Dam
|
Legend has investigated the potential to develop new surface water storages in the catchment; Lower Gunpowder Creek, Upper Gunpowder Creek, Battle Creek and Upper Battle Creek. Upper Battle Creek is the preferred site. Conceptual studies including a yield analysis, geotechnical reconnaissance, visual assessment, conceptual design and capital expenditure estimate have been completed.
The dam is intended to supply a proposed phosphate mine for a period of 30 years. With a catchment area of 162 ha, the estimated yield of the storage is 2500 ML/a at 90% reliability, requiring a storage capacity of 10,000 ML.
The spillway excavation will provide all or most of the rock needed for the dam. Subject to drilling, the rock appears to be of high quality. A rock fill dam with a concrete slab on the upstream face is considered the most suitable, requiring much smaller concrete plant.
Legend has estimated the Probable Maximum Flow (PMF) inflow in Upper Battle Creek as 1000 m³/s. Assuming a 75 m wide spillway channel invert, the maximum flood rise would require a dam wall about 20 m high. Increasing the width to 150 m, the flood rise is less and the embankment height (and rock volume) is reduced to 16.5 m. The corresponding volume of rock is about 90,000 m³.
Power supply
Generation
Legend has commenced commercial negotiations with local power generators in regards to the supply of power for the proposed beneficiation plant with a load factor of 80% for a 24 hr-7 day a week operation.
16
Power distribution option
Legend has made a connection enquiry to Ergon Energy for distribution of 8.5MW to the Birla Mt Gordon substation via the Century Zinc 220kV 100MVA transmission line. Legend has been advised that these lines have sufficient capacity to deliver the required power to the Birla Mt Gordon substation from Mt Isa. Legend will need to construct a 2km 66kV 12.5MW transmission line from the existing 66kV line to the proposed beneficiation plant.
For a larger connected load a direct connection to the existing Century Zinc 220kV line is required. Legend has made connection applications to the owner of the Century Zinc 220kV line, Ergon Energy, for the preferred and alternative connection options.
Environment
Legend is currently engaged in environmental approvals of three separate Mine Lease Applications; D-Tree North, Paradise North and Paradise South. Both D-Tree North and Paradise North are to be licensed following agreement of separate Environmental Management Plans. Paradise South is to be licensed following the completion of an Environmental Impact Statement (EIS) which commenced in November 2009. All three Mining Leases have had ecological survey work and cultural heritage clearances completed in 2009 with no impediments to granting of the leases encountered.
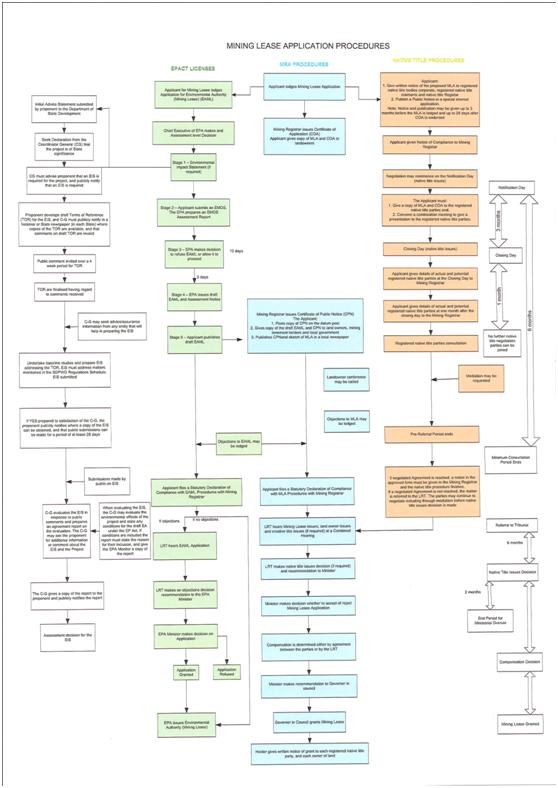
The process of obtaining Mine Lease approval in the State of Queensland, Australia, involves compliance with the Minerals Resources Act (1989), Environmental Protection Act (1994) and Native Title Act (1993). The regulations pertaining to the Minerals Resources Act (1989) and Native Title Act (1993) are administered by the Department of Employment, Economic Development and Innovation (DEEDI). The provisions of the Environmental Protection Act (1994) are administered by the Department of Environment and Resource Management (DERM).
The flow chart below describes the interrelated approval process in accordance with these Acts.
The level of environmental approval required is predicated on the size and nature of the proposed mining operation. Legend’s D-Tree North (ML90190) and Paradise North (ML90191) mine leases have been approved through submission of an Environmental Management Plan (EMP) given that these are small scale operations with minimal ore processing. Legend’s large Paradise South proposed mine operation includes a beneficiation processing plant requiring power and water infrastructure and accordingly is being approved through an Environmental Impact Statement (EIS) with supporting EMP. Legend has voluntarily applied to undertake the EIS for the Paradise South mine lease. The State government provides no indication of expected expenditure for completing an EMP only or EIS with EMP. The studies required in the EMP and EIS include air quality, surface water, groundwater, ecology and geology, as a minimum. The remoteness of sites and availability of historical data greatly influence costs. Legend estimate the total cost of EMP only of US$1 million and EIS with EMP of US$2 million.
17
18
Geology
Geological History of the Georgina Basin of Queensland.
The majority of Australia’s sedimentary phosphorite reserves lie within early Middle Cambrian successions of the Georgina Basin in northwest Queensland and northeast Northern Territory. Some eighteen named, discrete phosphorite deposits occur within the lower Middle Cambrian Beetle Creek Formation, or its stratigraphic equivalent the Border Waterhole Formation, that are basal in the stratigraphy of the Georgina Basin.
In common with many other phosphatic successions, the Georgina Basin phosphorites are associated with carbonates, cherts and organic-rich shales. Phosphorite lithologies are dominantly represented by apatitic peloids and bioclasts within a carbonate matrix or early diagenetic siliceous matrix, with thin interbeds of phosphatic mudstone, commonly referred to as collophane mudstone.
The Paradise South, Paradise North, & D-Tree phosphate deposits lie within the Beetle Creek Formation and its lateral facies equivalents (Howard, 1986). The Cambrian stratigraphy typically associated with the phosphorite deposits is comprised of a sequence of overlying laminated siltstones and shales of the Inca Formation that conformably overlie the Beetle Creek Formation and Thorntonia Limestone. The Thorntonia Limestone is a dolomitic limestone with increasing chert bands towards the top. It is the lateral facies equivalent to the Beetle Creek Formation, with which it intertongues. The Beetle Creek Formation hosts the phosphate deposits, comprised predominately of interbedded coarse to fine grained phosphorites, siltstone, claystone, chert and some discrete carbonate lenses. Locally, karst-like surfaces in the Thorntonia Limestone are filled with chalky high-grade phosphorite that appear to replace the underlying limestone. The Beetle Creek Formation and Thorntonia Limestone units conformably and gradationally overlie the Mt Hendry Formation which is a discontinuous conglomerate and sandstone (Cook & Elgueta, 1986).
The Cambrian sediments may be covered by up to 71 metres of Mesozoic claystone and sandstone in parts of the basin as well as Cainozoic alluvium and elluvium.
All of the phosphorite deposits are thought to have formed under coastal, shallow marine conditions, and consist of three recognised phosphorite ore-types: pelletal, microsphorite and replacement phosphorite (Rogers and Keevers, 1976). Coarse to medium grained skeletal-ovulitic grainstone and packstone pelletal phosphorites are thought to have formed through reworking, transport and accumulation of phosphatic grains. Microsphorite is thought to have formed from the suspension of very fine grained detrital material and/or precipitation of apatite from the water column in very shallow supratidal areas (Cook & Elgueta, 1986). The replacement phosphorite is thought to have formed through post-depositional phosphate replacement of carbonate (Rogers and Keevers, 1976).
Exploration History and Forward Work Program
The Paradise South, Paradise North, & D-Tree phosphate deposits are located approximately 130km north west of Mt Isa in the Georgina Basin. To date, significant exploration has been completed on all deposits, although much of this exploration was conducted in the late 1960’s early 1970’s. Partial revalidation drilling has been conducted by Legend since September 2008.Below is a table (Table K) that outlines the historical non-reserve mineralized material figures as published in freely available documentation1:
19
|
Historic Estimates
|
|||
|
Deposit
|
Classification
|
Estimated
million
tonnes
|
% P2O5
|
|
Paradise South
|
*Non-reserve mineralized material1
|
293
|
16.6
|
|
Paradise North
|
*Non-reserve mineralized material1
|
193
|
17.6
|
|
D-Tree
|
*Non-reserve mineralized material1
|
339
|
16.0
|
|
Lily Creek
|
*Non-reserve mineralized material1
|
191
|
14.9
|
|
Quita Creek
|
*Non-reserve mineralized material1
|
54
|
17.3
|
|
Sherrin Creek
|
*Non-reserve mineralized material1
|
175
|
16.5
|
|
Highland Plains
|
*Non-reserve mineralized material1
|
84
|
13.4
|
|
Total
|
*Non-reserve mineralized material1
|
1,329
|
16.2
|
* Such non-reserve mineralized material would not qualify as a reserve until a comprehensive evaluation based upon unit cost, grade, recoveries and other material factors concludes being both legal and economic feasibility
1 Source of Information
Historically published in Queensland Minerals Mines & Projects, 4th Edition. From:1 1990 Freeman, M.J., Shergold, J.H., Morris, D.G., & Walter, M.R. Late Proterozoic And Palaeozoic Basins of Central and Northern Australia- Regional Geology And Mineralization. 2.1996 Draper, J.J Phosphate- Queensland Mineral Commodity Report, Queensland Government Mining Journal, 97 (1131) 14-25.
Table K: Historic estimations of non-reserve mineralization for the Phosphate deposits controlled by Legend.
Past feasibility studies by BH South Ltd (Rogers J.K, 1988) occurred in 1974 on a phosphate rock beneficiation plant and slurry pipeline to the Queensland coast. Beneficiation test shafts and mining scale trenches were dug. A pilot plant built in 1973 produced 34% P205 concentrate at Paradise South from 17% P205 rock (Cook, P.J. 1989). Feasibility was concluded at that time for a proposed phosphate rock concentrate production rate of 4-5 million tonnes per year (Cook, P.J. 1989).
During 2009 drilling was conducted on the D-Tree, Paradise North and Paradise South deposits. Results are pending for Paradise South.
Metallurgical sampling was also conducted during the year. Metallurgical work completed included both bench scale plants up to pilot plant scale operations. Samples were collected from D-Tree, Paradise North and Paradise South for this work. Metallurgical testwork continues on diamond drill core and these results will be used to inform the mineralized material model for each deposit.
Current Work
A drilling program at the D-Tree deposit commenced in September 2008 with up to 3 drill rigs utilized on the drill program. Drilling was completed during 2009, particularly on the D-Tree North prospect.
During 2009, Legend purchased the Barr Creek project from Elkedra Diamonds N.L and Uramet Minerals Ltd. Barr Creek is located to the east of the current Paradise North deposit. It was decided after a review of historic phosphate drilling in this area to drill a small program of reverse circulation (“RC”) holes to target potential high grade material. During the year the diamond exploration crew also took several Heavy Mineral Analysis (“HMA”) samples from the project.
20
In July 2009, EPM17330 (Paradise North) was granted with drilling commencing soon after that. The aim of the drilling at Paradise North was to target further high grade material, using the historical drill data to target the drilling.
In September 2009, drilling commenced at Paradise South with the intention to target mineralized material suitable for beneficiation. The target was to delineate approximately 40 million tonnes of suitable mineralized material for future processing.
Table L below outlines the total amount of drilling that has been completed at each of the deposits since September 2008.
|
Deposit
|
Drill Type
|
No. of Holes
|
Metres
|
|
Barr Creek
|
RC
|
25
|
780
|
|
D-Tree
|
RC
|
655
|
19,633
|
|
D-Tree
|
Sonic
|
11
|
296.0
|
|
D-Tree
|
Diamond
|
41
|
1,132.8
|
|
Paradise North
|
RC
|
386
|
9,103
|
|
Paradise North
|
Diamond
|
31
|
759.3
|
|
Paradise South
|
RC
|
135
|
4,759
|
|
Paradise South
|
Diamond
|
18
|
658.4
|
|
Lily Creek
|
RC
|
10
|
384
|
|
Total
|
RC
|
1,211
|
34,659
|
|
Total
|
Sonic
|
11
|
296.0
|
|
Total
|
Diamond
|
90
|
2,551
|
Table L: Drill statistics completed by December 31 2009.
Paradise North
Tenement EPM17330 was granted in July 2009, with drilling commencing in early August 2009 with the aim of delineating high grade material. The drilling program was completed in November 2009, with all assays returned by December 2009. High grade material was successfully delineated as reported on the 24th September 2009. An estimate of the tonnes and grade of this high grade core mineralization has been reported March 16, 2010.
Paradise South
The Paradise South exploration licence was granted in late August 2009 and drilling commenced on this deposit in November 2009.
Drilling was completed in December 2009 with a total of 18 diamond drill holes for 658 metres and 135 RC for 4,759 metres of drilling. The combination of RC and diamond drilling results will be used to produce a mineralized material and reserve estimation on beneficiated product. The aim is to delineate an initial 40 million tonnes of phosphate rock in the first phase, with larger tonnages to be defined in subsequent drilling phases.
D-Tree
D-Tree was the first north-west Queensland phosphate deposit drilled by Legend, with drilling commencing in September 2008. There were several drill patterns designed and drilled finishing in mid 2009. In 2009 Legend became manager of the D-Tree West Tenement, located to the west and north-west of the D-Tree Tenement, which gave Legend access to extra historic mineralized material at D-Tree West.
21
In total, 655 RC holes for 19,633 metres were drilled including 41 Diamond holes for 1,132.75 metres and 11 Sonic for 296 metres throughout the deposit. The mineralized material estimation was publically released in May 2009.
Highland Plains
No field work was conducted at Highland Plains during the year, due to the distance from Mt Isa it was decided that the Highland Plains deposit was a lower priority target. During the year further open file data was reviewed. It is planned that a small drill program be completed at Highland Plains in 2010 to test the suitability of the phosphate mineralization to the beneficiation process.
Work completed for 2009 also included a review of the aero-magnetic and radiometric survey completed at Highland Plains in 2008 as flown by Fugro. Grant Archer from Archer Geophysics completed the review with the data now available to assist with drill hole planning.
Lily Creek
A field reconnaissance trip was conducted to Lily Creek later in 2009 to assess the quality of the access tracks and past drilling. It was decided that little work was required to gain access for a small drill program around the higher grade zones at the Lily Creek deposit. A local contractor was employed and the field team prepared for drilling. As drilling continued at the Paradise Project until the beginning of the wet season no drill rigs were available to complete the small program planned for Lily Creek in 2009.
Archer Geophysics also completed a review of the geophysical data for Lily and Sherrin Creek and this information will be used to target drilling with the idea of identifying the phosphatic ore close to surface. The review will also be used to identify areas where the phosphate ore is close to surface for potential rock chip sampling.
In late 2009, a small team was sent to Lily Creek and completed the rehabilitation of all the drilling that was completed in 2008. All drill holes were cut below surface and all sample bags were removed.
Quita Creek
King Eagle Resources, the current Joint Venture partner, conducted a detailed field trip and sampling campaign to Quita Creek with emphasis on base metal and uranium exploration. After reviewing the results of this campaign, Legend performed reconnaissance and field sampling with focus on phosphate mineralization. Two sampling campaigns were completed during the year, the first trip collected around 35 samples (including 2 standards) and the second approximately 110 samples. All samples were submitted to a local commercial lab in Mt Isa for analysis. The rock chip results confirmed the presence of phosphate mineralization which will allow targeting for follow up drilling campaigns later in 2010.
Barr Creek
The Barr Creek projects (EPM’s 15014 and 15015) were purchased during 2009 as they contain both historic phosphate mineralized materials and potential diamond bearing kimberlites. During 2009, a small RC program for 25 holes (780 metres) was completed. Mineralized material was intersected in the drilling and will be included in future estimates of tonnes and grade.
Drilling Techniques
Legend has contracted Downer EDI Mining to carry out the drilling on the Queensland Phosphate tenements. Drilling techniques used include reverse circulation (RC) and Diamond Coring methods. Downer EDI has supplied two UDR 650 rigs (Universal Drill Rigs). One was on a 515 base with tracks and the other rig was mounted on a Twin Steer Volvo truck. Both rigs were dual purpose with RC and Diamond coring capability.
22
Sampling Techniques
All RC sampling was conducted using a commercially available rig mounted static cone splitter. The sampling procedures used were developed by the Legend Geology team and in summary required several steps:
|
·
|
All RC samples were collected for each 1 metre of drilling.
|
|
·
|
All samples for analysis were designed to weigh between 1 and 3 kilograms. This is the standard weight required for sample preparation at commercial laboratories.
|
|
·
|
A second field duplicate was collected at the same time for every sample.
|
|
·
|
All sample reject through the cone splitter was also collected and has been stored in a temporary bag farm on site. These samples may be required for further analysis so have been tagged and stored in order.
|
|
·
|
A combined sample weight was measured using on site scales and logged into the database. Each sample was also weighed for comparison to ensure no bias from the sampling technique.
|
|
·
|
Each sample was tested in the field using the modified Shapiro test for estimated phosphate concentrations. If a sample returned a positive result in the field then it was submitted to the lab for analysis.
|
|
·
|
For each hole two field duplicates were submitted to the lab for analysis. Comparison of assay results from field duplicates is designed to test the suitability and accuracy of the sampling technique.
|
|
·
|
Samples that were not to be analysed due to geological reasons were then coded with a -999 grade for the database. This then ensures each metre of drilling is coded with either a pre-determined code or an assay grade.
|
|
·
|
A set of matrix matched reference standards were inserted into the lab submission for QAQC purposes. Standards were submitted to the lab at a rate of 1 in 25 samples. A coarse blank sample was also inserted for submission at a rate of 1 in 25 samples.
|
|
·
|
Diamond core samples were generally collected in 1.5m core runs, except where ground conditions dictated shorter run lengths. To ensure diamond core sample integrity was maintained, each run of diamond drill core recovered on the rig was transferred from the inner tube to a PVC split. The split would then sit inside the core tray and hold the core in place. This was particularly effective in maintaining the sample integrity of highly oxidised, friable core samples.
|
Drill Sample Recovery
All samples were weighed in the field using calibrated digital scales accurate to the gram. Each sample was weighed, including the original sample, the duplicate and the reject sample. The data was recorded on site and monitored by the field geologist to ensure no great fluctuations occur while drilling.
Recorded sample weights were compared to expected sample weights, as derived by calculating the volume of the cylindrical sample at 1m long and 120-132mm in diameter. The expected weight of the sample was then calculated using the average bulk density value for the sediment type.
The direct comparison of recorded sample weights against expected sample weights highlights whether any potential sample bias has occurred as a result of the drilling or sample collection technique.
All diamond drilling had core recoveries measured and calculated while at the rig. Generally all recoveries for diamond drilling were greater than 85%, but where less than 85% recovery occurred, the main issue noted by the driller’s were cavities that occur in the Beetle Creek Formation. These were identified as drilled, and logged.
Drill Sample Logging
The logging of all RC chips and Diamond core from the deposit was carried out by qualified geologists who provided daily supervision of the rigs for the duration of the program. Logging of chips and core was done in a qualitative manner directly into a field notebook computer and data was entered into the database several times a week. The level of detail obtained from the chips/core during the logging process has been deemed sufficient to support the mineral resource estimation process and metallurgical studies that have been carried out. Whilst in the field, geologists were significantly assisted with regards to assessing P2O5 content of chips/core by using the modified Shapiro test, a chemical visual colorimetric test that was developed in the 1960’s. This allowed a quantitative estimate of phosphate content to be obtained at the time of drilling and that data was subsequently used as a tool to select intervals for assay. Once assays were returned, these definitive results were combined with the geological logs in order to create a model for resource estimation.
23
All logging was conducted using pre-determined codes, as outlined in the Legend ‘Manual of Standardised Geological Procedures’. Lithology codes can only be entered into the database as set, and any non-recognised codes would be rejected when loaded into the database. Any coding errors were sent back to the geologist responsible for correction.
Laboratory sub-sampling techniques and preparation
For typical RC holes, samples were usually a 1-3kg sub-split taken from all chips recovered over any given 1m down-hole sample interval. All sample splits collected were sent to ALS Laboratories in Mt Isa and/or Brisbane or Amdel laboratories in Mt Isa. All samples were split and pulverised, with lab splits taken at the preparation stage for cross-checking of the sample prep stage. All samples were pulverised in a tungsten carbide mill. A quartz wash was processed through the mill between each sample due to the sometimes clayey nature of the phosphorite ore. The quartz wash ensures no inter-sample contamination.
Legend also included a coarse blank sample (glass quality beach sand) to be used to assess the sample preparation stage. These blanks are known to contain P2O5 levels below detection and therefore would identify any preparation contamination.
At all stages through the sampling process a duplicate system was used. The duplicates used and reported at all stages were;
|
·
|
Field duplicate – taken on the drill rig to test sampling technique.
|
|
·
|
Lab Splits – samples taken at the sample preparation stage to ensure prep techniques are suitable.
|
|
·
|
Lab repeats – a repeat assay analysis of the final pulp.
|
All of these duplicates are analysed and reported in the monthly QAQC statistics for the deposit.
Where core samples have been submitted for assay, half core samples were taken using a manual diamond blade core saw. Before cutting, diamond cores were metre marked and assessed to make sure all of the pieces of core were positioned to conform to the original orientation, i.e. all core breaks were aligned. Core samples were then crushed at the laboratory prior to being riffle split into sub-samples and prepared for analysis by the same method used for RC samples.
Quality of Assay Data
Samples were assayed by one of two analytical techniques; 1) wavelength dispersive X-ray fluorescence spectrometry and/or 2) an ICP acid digest method that conforms to the internationally accepted analytical method of the Association of Fertiliser and Phosphate Chemists (AFPC).
XRF methodology
The samples were dried at 105°C, pulverised and an aliquot taken for XRF analysis. The pulp was fused using a Lithium-Borate flux mixture with a Sodium-Nitrate oxidant. The fusion disks were analysed using wavelength dispersive X-ray fluorescence spectrometry for the following suite of elements and reported according to their total ‘oxide’ form as follows:
24
|
·
|
P2O5, Fe2O3, Al2O3, MgO, SiO2, CaO and LOI
|
ICP acid digest methodology
The samples are dried at 105°C, pulverised and an aliquot taken for acid digest in two parts nitric acid, two parts water and 1 part hydrochloric acid. The acid digest method conforms to one of the internationally accepted analytical methods of the Association of Fertilizer and Phosphate Chemists (AFPC). The specific method is ICP Method 3D-2. The acid digest is then analysed using the multi-element inductively coupled plasma atomic emission spectrometer (ICP-AES). The standard assay suiet for the ICP analytical technique is:
|
·
|
P2O5, Al2O3, Fe2O3, MgO, CaO
|
Standards
The accuracy and precision of the analytical techniques used were tested through the use of standards. The Standards used for all of Legend’s drilling programs consist of commercially manufactured, matrix matched, certified standard reference material. The standards were manufactured and supplied by Ore Research & Exploration Pty Ltd based in Bayswater in Melbourne. Each standard was analysed at ten commercial laboratories by lithium borate fusion with XRF or ICP finish.
The material used for these standards was sourced from the Paradise South deposit from several different locations to try and simulate the different ore types recognised throughout the Georgina Basin. During manufacture two pigeon pair samples of close range were produced. These standards were submitted during drilling. These standards were used as their mean grades (and their ranges) are close together, thus making it harder for a lab to know which one is being used.
These standards are pre-prepared so require no milling at the lab, therefore they are only used to test the pure analytical technique and not sample preparation. Each standard is individually wrapped and submitted unmarked; therefore the laboratory will not know which standard is being submitted.
Lab Repeats
During analysis each laboratory was required to repeat the analysis on around 1:25 samples. This is to test the analytical technique at the data capture stage.
Once assay analysis was complete all sample rejects and sample pulps were returned to Legend for storage in a secure facility in Mt Isa.
Access
Access to the Queensland project areas is by commercial airline to Mount Isa, a mining district in Queensland. Mount Isa has substantial infrastructure, accommodation and other facilities.
From Mount Isa, it is approximately 100-150 kilometers by road via the Barkly Highway, Thorntonia Road and further access tracks to each deposit. The Paradise deposits are accessed using the McNamara haul road that services the Lady Annie Copper Mine operated by Cape Lambert.
Between April to November, in the dry season, four wheel drive vehicles can access the area via dirt roads and access tracks. During the wet season access can be limited due to creek and river crossings which can be affected by flooding during periods of heavy rain. These periods are usually limited in extent as the water quickly disperses.
Government Regulations, Declarations & Conditions
The Company’s exploration operations are subject to Federal and State laws and regulations governing the method of acquisition and ownership of mining rights, exploration, development, mining, production, taxes, labour standards, occupational health, mine safety, toxic substances and other matters. Federal and State legislation also governs environmental management and native title issues. We are committed to and, to our knowledge, are in compliance with all governmental legislation and regulations.
25
Under the stipulated government regulations and guidelines Legend has submitted three mining lease applications during the past year. The three applications are;
|
·
|
MLA90190 – D-Tree North
|
|
·
|
MLA90191 – Paradise North
|
|
·
|
MLA90197 – Paradise South
|
The Mining Lease applications are at various stages through the process to grant. The D-Tree North MLA was submitted first in April 2009 and it is expected this lease would be granted in the first quarter of 2010.
Mineralization
No known mineral reserves have been reported on our land in Queensland, apart from the recorded phosphate deposits. Our proposed program will be advanced with a view to verify existing data and prove the extent of mineralization. Currently, Legend is working towards using the recent drilling results to estimate tonnes and grade for the purpose of estimating reserves. These estimates will be used to inform any future estimates of probable or proven reserves in conjunction with the appropriate modifying factors.
Legend is working towards generating a reserve base at all deposits following the mineralized material drilling which was completed in December 2009.
Government Requirements for Maintenance of Licences
To ensure that licences are kept in good standing the Company is required to pay the annual rent amount for each licence on its respective anniversary date. The amount due is dependent upon the size and age of the licence. The Company is also required to work the licences and meet the annual expenditure commitments. Annual reporting is required, specifying details of the exploration programme which has occurred and which is anticipated for the following year. Failure to comply would place the licences at risk of cancellation and therefore forfeit the right to explore on that ground.
License Conditions
The Company is required to meet certain standard conditions and obligations as specified by the Queensland Mineral Resources Act, Exploration Permits. These include conducting activities in a way which minimise environmental damage, rehabilitation, avoiding interference with registered native title sites or areas and ensuring compliance with any other relevant legislation. Programmes of Work are to be submitted at the time of application for any ground disturbance or exploration works, the conditions of which are clearly specified and adhered to. Security bonds are payable on the grant of the permits and additional conditions can be imposed by the government State Minister.
Native Title
The rights and obligations of the Company with respect to native title obligations differ depending upon the permit’s proposed impact on the land. All the exploration permit applications held by the company will need to comply with the Native Title Act (1993). The overwhelming majority on permit applications will be advertised under the expedited procedure and require advertising to determine whether there are any objections. If there are no objections, the Queensland Government can grant the permit and will impose the Native Title Protection Conditions on the permit before grant. These conditions ensure that any native title claimants are aware of the proposed exploration work and gives them an opportunity to identify any culturally sensitive areas. If there are objections, the company will need to negotiate an agreement with the native title claimants. Following lodgement of this agreement with the Queensland government the permit will be granted.
26
Environment
The rights and obligations of the Company with respect to environmental management and rehabilitation are based upon the principles of disturbance minimisation, including such things as preservation of mature trees, preventing the spread of noxious weeds, avoiding the disturbance of waterways and waste management. Rehabilitation is a condition of the Security bond and requires such things as sealing of collars, plugging of casings and replacement of topsoils.
Royalties
The royalty rate for phosphate rock is the higher of the following: (a) 80 cents for each tonne of phosphate rock; or (b) the rate, rounded down to 2 decimal places, for each tonne of phosphate rock worked out using the following formula –
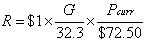
where R is the royalty rate, G is the average P2O5 content of the phosphate rock for the return period, and Pcurr is the average price for the return period, converted to Australian dollars at the average hedge settlement rate for the return period, of Moroccan phosphate rock with 32.3% P2O5 content.
The royalty is payable to the State of Queensland.
Contractual Agreements in relation to Queensland Phosphate Interests
|
(i)
|
On November 2, 2007, we entered into an agreement with Iron Duyfken Pty Ltd to acquire three (3) project areas in the Georgina Basin of Queensland, Australia. Each project hosts a known and well documented, substantial deposit of phosphate rock (Cook, P.J, 1989, Howard, P.F, 1986). These deposits were delineated by earlier work conducted by previous major companies since 1967 and have been named the Lady Annie, Lady Jane and Thorntonia phosphate deposits. The deposits were defined in times when phosphate prices were low. Phosphate prices have risen considerably since those times due to increased world demand especially from China and India. Past feasibility studies on these deposits will be reassessed with a view to commercialization of the deposits, based on current prices. Legend agreed to pay A$500,000 and issue 500,000 shares of Common Stock as consideration.
|
|
(ii)
|
Effective November 7, 2007, we entered into an agreement with Ansett Resources & Industries Pty Ltd to acquire one (1) project area in the Georgina Basin of Queensland, Australia. The project hosts a known and well documented, substantial deposit of phosphate rock (Cook, P.J, 1989, Howard, P.F, 1986). The deposit was delineated by earlier work conducted by previous major companies since 1967 and have been named the D-Tree phosphate deposit. As set out above, the deposit was defined in times when phosphate prices were low. Phosphate prices have risen considerably since those times due to increased world demand especially from China and India. Past feasibility studies on this deposit will be reassessed with a view to commercialization of the deposit, based on current prices. Legend agreed to pay A$300,000 as consideration.
|
|
(iii)
|
We entered into a farm-in and joint venture heads of agreement with King Eagle Resources Pty Limited on December 7, 2007 pursuant to which Legend can earn an 80% interest in phosphate on three tenement blocks named Quita Creek, Highland Plains and Lily and Sherrin creek by spending $3 million on phosphate exploration over five years. Legend has no rights to any other minerals on the three tenement blocks.
|
|
(iv)
|
Effective February 27, 2008, we entered into a Share Sale Agreement whereby the Company agreed to purchase all of the issued and outstanding shares of Teutonic Minerals Pty Ltd. As a result, Teutonic became a subsidiary of the Company from that date. Teutonic held an application for a mineral licence over phosphate in the Georgina Basin in the State of Queensland, Australia which has subsequently been withdrawn, allowing Legend’s application to take priority. The consideration payable to the vendors was A$300,000, and the Company granted a 1% gross revenue royalty from production from the mineral licence.
|
27
|
(v)
|
On October 27, 2008, we entered into a Heads of agreement with Mt. Isa Metals Ltd. (“MET”) for the formation of a Joint Venture (“JV”) over each party’s respective interest in tenements overlying the D-Tree phosphate deposit. Under the JV, Legend contributed tenements EPM 14753, EPMA’s 17333, 17437, 17443 and 17446, and MET contributed tenement EPM 15763 (D-Tree West). Legend managed and held an 80% interest in the JV and MET held a 20% contributing interest in the JV. The JV has access to plant and infrastructure at Legend’s 100% owned proposed Lady Annie phosphate development, which lies 9 miles to the east of D-Tree. The Heads of Agreement was replaced by a formal JV agreement dated April 18, 2009. Effective September 30, 2009, MET exited the JV. Legend, as manager of the D-Tree JV, had invoiced MET A$1.739 million for MET’s 20% interest in the D-Tree project for the period September 1, 2008 to June 30, 2009. MET decided to dilute its interest rather than pay the invoices and in accordance with the JV agreement, MET’s interest has reduced to less than 5%, thus requiring MET to exit the JV. MET retains a royalty of A$0.50 per tonne from product from the D-Tree Joint Venture tenements.
|
|
(vi)
|
On December 24, 2008, we entered into a Sale and Purchase Agreement with Elkedra Diamonds Pty Ltd and Uramet Minerals Limited to purchase a 100% interest in EPM 15014, EPM 15015 and application for EPM 17930 for a consideration of A$900,000. The purchase by Legend was subject to a number of pre-conditions including the receipt by the vendors of any necessary consents and approvals required under the Mining Act and approval for the purchase under the Foreign Acquisition and Takeovers Act 1975 (Cth). These pre-conditions were satisfied in February 2009 and the purchase by Legend settled. As part of the purchase, all parties provided standard warranties for such a transaction to each other. The tenements covered by this purchase are located immediately north of the Queensland phosphate project and are prospective for phosphate and diamonds.
|
Northern Territory and Western Australian Exploration Interests
Legend’s exploration interests in the Northern Territory and Western Australia are through its 47.83% interest in North Australian Diamonds Limited (“NADL”); NADL’s 25% (increased to 28% since December 31, 2009) interest in Top End Uranium Ltd (“TEU”); and its direct holdings in exploration interests in its own right.
The exploration interests cover the following minerals:
|
i.
|
Legend exploration interests cover diamonds and base metals;
|
|
ii.
|
NADL exploration interests cover previous diamond mining operations at the Merlin Diamond Mine and diamond exploration on Tenements in the Northern Territory and Western Australia; and
|
|
iii.
|
TEU exploration interests cover uranium exploration in the Northern Territory and Western Australia.
|
Legend intends to spin out to a new company the diamond, gold and base metal interests of Legend of which Legend shareholders will receive shares of common stock on a pro rata basis to the shares they hold in Legend. Following the spin out, Legend will be a 100% pure phosphate company.
The entire exploration interests of Legend are highly prospective for diamonds, base metals and uranium. Legend’s exploration team is currently focused on discovering further diamond deposits in the Northern Territory, Australia. Numerous diamond indicator mineral, microdiamond occurrences and other anomalies are being followed up across all projects.
28
Geological History and Kimberlite Occurrence in the McArthur River Basin
The North Australian Craton is one of two principal tectonic domains in the Northern Territory. The dominant tectonic episode for formation of the Craton, reworking the Archaean (or Palaeo-Proterozoic) basement, was the Barramundi Orogeny at 1865-1850Ma. Outcrops of these older deformed and metamorphosed rocks are now surrounded by younger basins.
The McArthur Group is the principal element of cover over the North Australian Craton, composed of mildly deformed and unmetamorphosed Meso-proterozoic (1800-570Ma) dolomitic carbonate, evaporates and sediments. The McArthur River Basin extends over 180,000 square kilometres and its sediments host a number of base metal occurrences including the McArthur Lead-Zinc-Silver shale-hosted deposit; strata-bound, disseminated Lead-Zinc deposits; the Redbank Copper deposits and Cobalt, Uranium and Iron.
The McArthur River Basin is covered by approximately 100 meters of Cambrian Bukalara sandstone and flood basalts in the south. Widespread, young Cretaceous sedimentation covered the region but much has been removed through erosion. One remnant of Cretaceous sediment is host to the Merlin field which represents the youngest volcanic event in the region.
The major structural feature in the McArthur Basin is the north to north-west trending Batten Trough or Batten Fault Zone approximately 70 kilometres wide, to which Legend’s holdings lie to the east. The Trough is bound on the west by the Emu Fault which transects Legend’s holdings in the McArthur River Project. The associated Mallapunyah and Calvert faults are approximately 50 kilometres apart and also trend north-west.
The presence of microdiamonds across the North Australian Craton defies geological boundaries, extending right across its heart. This wide distribution may be due to recycling of the microdiamonds through the younger Cretaceous by fluvial processes. However, an element of high-level fracture control is now evidenced by the Merlin deposits. Since the discovery of the Merlin field, diamond exploration approaches have shifted from Proterozoic mobile belts with little consideration of regional geology, to incorporate the range of fracture zones in the North Australian Craton. The North Australian Craton is extensively underlain by Archaean basement and deep lithospheric cratonic rocks may be tapped by younger kimberlites as they intrude into these fractures. The Merlin kimberlites are certainly younger than their Cambrian sandstone host, yet older than their Cretaceous cover.
Access
Access to the Northern Territory project areas is by commercial airline to Darwin, the capital of the Northern Territory. From Darwin, it is approximately 950 kilometres by road approximately 2 hours flying time by air. The nearest major town is Borroloola, which has limited accommodation and other facilities, including transport and freight depots. Legend is currently utilizing the Merlin Diamond Mine (operated by Northern Australian Diamonds Ltd), as a base for all exploration. Access to the Merlin Mine from Borroloola is via approximately 70 kilometres of bitumen road to the McArthur River mine turn-off, then approximately 65 kilometres of gravel road to site. Between the months of April to November, in the dry season, four wheel drive vehicles can be used on dirt roads; however, distances from Merlin to field sites range between 10 and 150 kilometres. During wet season, access to field sites can be difficult due high rainfall and fast flowing river and creek crossings.
|
Project
|
Access
|
|
Selby
|
Via the Carpentaria Highway, east from Daly Waters to Cape Crawford, Borroloola and from the south via Wollogorang.
|
|
McArthur
|
|
|
Glyde
|
|
|
Abner Range
|
|
|
Foelsche
|
|
|
Cox
|
Via the Roper Highway and station roads to Hodgson River, Nutwood Downs and Cox River. Or, via the Carpentaria Highway towards Cape Crawford.
|
29
Government Regulations, Declarations & Conditions
The Company’s exploration operations are subject to federal and state laws and regulations governing the method of acquisition and ownership of mining rights, exploration, development, mining, production, taxes, labour standards, occupational health, mine safety, toxic substances and other matters. Federal and State legislation also governs environmental management and native title issues. We are committed to and, to our knowledge, are in compliance with all governmental legislation and regulations.
Mineralization
No known mineral reserves are known on our land in the Northern Territory. Our previous and proposed programs are exploratory in nature.
Government Requirements for Maintenance of Licenses
To ensure that licences are kept in good standing the Company is required to pay the annual rent amount for each licence on its respective anniversary date. The amount due is dependent upon the size and age of the licence. The Company is also required to work the licences and meet the annual expenditure commitments. Annual reporting is required, specifying details of the exploration programme which has occurred and which is anticipated for the following year. Failure to comply would place the licences at risk of cancellation and therefore forfeit the right to explore on that ground.
License Conditions
The Company is required to meet certain standard conditions and obligations as specified by the Northern Territory of Australia Mining Act, Exploration Licence. These include conducting activities in a way which minimise environmental damage, rehabilitation, avoiding interference with registered native title sites or areas and ensuring compliance with any other relevant legislation. Mine Management Plans are to be submitted for any ground disturbance or exploration works, the conditions of which are to be clearly specified for approval and adhered to. Security bonds are payable on Mine Management plans and additional conditions can be imposed by the Government State or Territory Minister.
Native Title
The rights and obligations of the Company with respect to native title obligations differ between licences depending upon the underlying ownership of the land. Crown land, namely pastoral lease land, falls under the Native Title Act (1993) while Aboriginal freehold land falls under the Aboriginal Land Rights Act (Northern Territory). All the granted licences held by the Company are on pastoral lease land. The Company is currently in negotiations with the local native title council working towards the grant of several more applications that are situated on aboriginal freehold land. Heritage surveys are contracted where necessary to ensure the protection of local registered and unregistered aboriginal heritage sites.
Environment
The rights and obligations of the Company with respect to environmental management and rehabilitation are based upon the principles of disturbance minimisation, including such things as preservation of mature trees, preventing the spread of noxious weeds, avoiding the disturbance of waterways and waste management. Rehabilitation is a condition of the Security bond and requires such things as sealing of collars, plugging of casings and replacement of topsoils. Legend takes responsibility to ensure all high impact exploration activities are rehabilitated soon after they are completed. During 2009 Legend conducted rehabilitation on drilling activities from 2008.
30
Royalties
Certain of the tenements have a 1% gross revenue royalty payable to an external party from all mineral production derived on the tenements.
Acquisition of Northern Territory Tenements
Effective as of March 3, 2006, Legend entered into a Contract for the Sale of Exploration Tenements (“Contract”) with Astro Diamond Mines N.L. (“Astro”) an Australian company pursuant to which the Company acquired certain diamond exploration tenements in Northern Australia from Astro. The consideration payable by Legend to Astro was Australian dollars $1.5 million and Legend was also required to pay to Astro any costs incurred on the tenements after February 1, 2006. Astro provided commercial warranties which are usual for a transaction of this nature in favour of Legend. Under Australian law, Astro was required to provide an independent experts report to shareholders for this transaction. In order to prepare the independent experts report, a mineral valuation was prepared on behalf of Astro which indicated that the preferred value for the tenements that are the subject of the transaction was A$1.5 million. This formed the basis of the consideration agreed by the parties. The President and Chief Executive Officer of the Company, Mr. J. I. Gutnick was Chairman and Managing Director of Astro at the time of entering into the Contract and Dr DS Tyrwhitt, an independent Director of the Company, who is also a Director of Astro and was a Director of Astro at the time of entering into the Contract. The tenements are located in the Northern Territory of Australia and are prospective for diamonds.
Legend has entered into an agreement with Ashton Mining Limited (“Ashton”) and Rio Tinto Exploration Pty Ltd (“Ashton Agreement”) dated December 4, 2009 and a second agreement with Mwana Africa plc, Gravity Diamonds Limited and Diamond Mines Australia Pty Ltd dated April 24, 2009 (“Gravity Agreement”). Under these two agreements, Legend has acquired further diamond interests in the Northern Territory of Australia. As way of background, in April and July 2004, Ashton, NADL and certain of NADL’s 100% owned subsidiaries entered into agreements whereby NADL purchased certain diamond assets (including the Merlin Diamond Mine and diamond exploration tenements) from Ashton and Ashton retained rights over these diamond assets including royalty rights, marketing rights and earn back rights. In addition, Rio Tinto and Gravity had entered into an agreement in July 2003 whereby Gravity acquired certain diamond interests from Rio Tinto in the McArthur Basin, which is in the broad vicinity of Legend and NADL’s diamond interests in the Northern Territory, with Rio Tinto retaining certain residual rights.
Under the Ashton Agreement, Legend purchased all of the Ashton and Rio Tinto’s mining information, rights under three agreements and interests in four (4) exploration licences, six (6) applications for exploration licences, five (5) substitute exploration licences and one (1) mining lease for an amount of A$1,000,000. Rio Tinto retained the royalty payable by NADL in respect of the Merlin Diamond Mine and rights to conduct exploration, development and production activities for non-diamond minerals. Under the Gravity Agreement, Legend purchased Gravity’s interest in twelve (12) exploration licences, nine (9) applications for exploration licences and one (1) substitute exploration licence; Gravity’s rights, interests and obligations under the Red Metal Agreement and all exploration and data bases relevant to historical exploration; and Legend paid Gravity A$400,000 for these assets.
In summary, under the Ashton Agreement and Gravity Agreement, Legend has acquired all of Ashton’s, Rio Tinto’s and Gravity’s rights under previous agreement between those parties, not already held by Legend or NADL.
North Australian Diamonds Limited
On May 12, 2009, Legend announced it was making an on market takeover offer for all of the shares in North Australian Diamonds Limited, an Australian corporation (ASX: NAD) that it does not already own.
31
The offer was an unconditional on market cash offer at $A0.012 per NADL share, which expires on June 27, 2009 unless extended in the sole discretion of Legend.
On June 18, 2009, the Company increased its offer to A$0.015 per NADL share as a final offer. The offer period was also extended to July 24, 2009.
On July 23, 2009, the Company’s voting power in NADL exceeded 50% and in accordance with subsection 624(2) of the Australian Corporation Act 2001 the offer was automatically extended for an additional period of 14 days.
As of August 6, 2009 (close of offer), the Company held 55% of the issued and outstanding shares of NADL for a total cost of A$11.6 million (approx. US$9.3 million). As a result, NADL became a subsidiary of the Company post June 30, 2009. In early December 2009, NADL placed shares to a third party which had the effect of diluting the Company’s interest in NADL to 47.83%. It is management’s conclusion that the Company still has a controlling financial interest in NADL and accordingly, it should continue to consolidate NADL’s results into the Company.
Merlin Diamond Project
Highlights
|
Ø
|
Significant changes to Board with mining entrepreneur Joseph Gutnick becoming Chairman/Managing Director.
|
|
Ø
|
Legend becomes major shareholder of NADL with 47.83%.
|
|
Ø
|
$13.66M raised via a share placement in December 2009 with the majority of the shares placed to large US fund manager Attara Capital LP.
|
|
Ø
|
Flagship Merlin Project remains on track with NADL aiming to be the only Australian owned ‘pure play’ integrated diamond company.
|
|
Ø
|
Over 5,000 carats produced in 2009 trial production with 24% of production being greater than 1 carat in weight and approximately 80% being high quality, high value gems.
|
|
Ø
|
Recent drilling on the PalSac pipe has increased the total number of carats in the mineralized material.
|
|
Ø
|
New technologies to increase diamond liberation and large diamond recovery.
|
|
Ø
|
Major exploration focus at Lancelot, 40km south of Merlin, where there is strong evidence for a second diamond field.
|
|
Ø
|
Reconnaissance exploration commenced on highly prospective regions in Arnhem Land and Yambarra, totaling 8795km2.
|
The Merlin Diamond Project is located 100km south of the settlement of Borroloola in the Northern Territory of Australia on the Mining Lease MLN1154 (refer to Figure 1 and 2). The project is accessed by road and also contains a landing strip allowing light aircraft access. Mineral rights are obtained and held for the project under a mining licence with the Northern Territory Government, which is due for renewal in 2022.
The project comprises 14 diamond-bearing pipe-like bodies composed of the volcanic rock known as kimberlite. Nine of the pipes were subject to open-pit mining by Ashton Mining Limited over a 5 year period commencing in 1998. Previous mining operations produced 507,000 carats of diamonds.
Site facilities include an 18 man accommodation camp, a 2400m length gravel airstrip, a pilot process plant, workshop facilities, tailings dam and nine open pits. The pilot process plant has been through several stages of upgrade including the addition of a second trommel and the incorporation of a high pressure grinding roll crusher (HPGR). No public infrastructure is in place and power is sourced by a diesel generator. Water for the project is sourced from groundwater bores entirely within the mining licence.
32
The project is currently in a prefeasibility stage with a view to recommencing commercial scale diamond mining.’ The project does not have any known reserves.
Mineralized Materials
The combined mineralized material for all diamond pipes at Merlin is 26Mt for a grade of 23.5cpht.(See Table M).
Table M: Merlin Total Mineralized Material
|
Mineralized
Material (tonnes)
|
Grade (carats per
hundred tonne)
|
||
|
PalSac1
|
8,100,000 | 30.4 | |
|
Launfal3
|
1,600,000 | 24.7 | |
|
Excalibur3
|
464,000 | 34.1 | |
|
Gawain2
|
1,100,000 | 40.3 | |
|
Ywain2
|
80,000 | 71.3 | |
|
Gareth3
|
125,000 | 21.6 | |
|
Kaye2
|
874,000 | 13.5 | |
|
Ector3
|
1,510,000 | 8.1 | |
|
TOTAL
|
13,853,000 | 27.3 | |
|
1 Estimated using a +1DTC bottom screen cutoff (approx 0.85mm).
|
|||
| 2Estimated using a +1mm slotted bottom screen size. | |||
|
3Based on previous mining operation recovery.
|
|||
Tom Reddicliffe, a full time employee of NADL, and who is a Fellow of the AUSIMM, has sufficient experience which is relevant to the style of mineralisation and type of deposit under consideration and to the activity which he is undertaking to qualify as a Competent Person as defined in the 2004 Edition of the ‘Australian Code of Reporting of Exploration Results, Mineral Resources and Ore Reserves’. Tom Reddicliffe consents to the inclusion in the report of the matters based on his information in the form and context in which it appears.
33
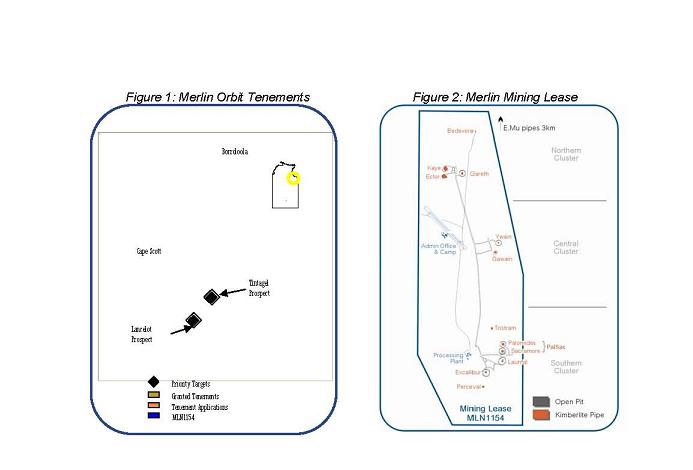
Pre-Feasibility Production Trials
During the mineralized material grade testing and production trials in 2009, a number of staged modifications to the Merlin pilot processing plant were completed. These were aimed at testing a variety of processing and recovery components with a view to establishing an efficient flowsheet design.
Pilot Plant Upgrade
The upgrade has increased the throughput capacity of the pilot plant to 70tph and will enable the efficient processing of large bulk samples during the next phase of pre-production trials. The HPGR incorporated into the process circuit has increased diamond liberation which will result in an increase in the project resource through improving the number of recovered carats per tonne. It has also had a positive impact by improving processing throughput due to increased generation of slime material. An optical sorter was successfully incorporated into the process circuit aimed at capturing the large size diamonds known to exist within the Merlin kimberlite pipes.
Mineralized Material Grade Testing
In addition to the three samples each of 200 tonne that were previously excavated from the base of Gawain pit, a further two samples also of approximately 200 tonne size were excavated from Sacramore pit. All of these samples are awaiting processing. The samples will be used to establish an accurate base of pit grade for both Gawain and Sacramore pipes and will also provide diamond size distribution information that will allow ongoing interpretation of deep core samples which is required for pre-feasibility studies. Similar samples are to be excavated from the other pits under evaluation.
Diamond Parcel
The mineralized material grade testing, pilot plant testing and pre-feasibility production trials has enabled a ‘run of mine’ diamond parcel to be built up which will be used for valuation and marketing purposes. The sorting of the 2009 concentrates is complete with 5,264 carats of diamonds recovered. A total of 698 diamonds of greater than 1carat in size, totalling 1,254 carats, have been recovered during the trial, with the largest being a white 14.73 carat diamond of near gem quality.
34
2010 Production Trials
Production trials will continue during 2010 with an initial focus on Kaye pipe which is one of the larger pipes in the field. To this end the Kaye pit is currently being dewatered, with excavation planned to commence early in 2010. In addition a significant portion of the reject oversize material currently stockpiled from previous operations will be processed. Mining and economic models are also being refined as part of the pre-feasibility study aimed at moving Merlin towards a long term sustainable mining operation.
With the building up of a significantly sized diamond parcel, NADL intends to investigate marketing opportunities including downstream value adding strategies including the branding of Merlin diamonds. NADL strongly believes that the good quality and large diamonds produced by Merlin will enable ‘branding’ and boutique marketing opportunities that will be important in redeveloping Merlin and successfully establishing NADL as an integrated long term diamond producer.
Mineralized Material Definition Drilling
A drilling program commenced in January 2010 aimed at further defining and increasing the kimberlite mineralized material in the PalSac pipe. A drill rig was mobilised to Merlin site in late December 2009 to enable an early commencement of this program. Approximately 2,000m of core drilling was drilled and increased the total mineralised material at Merlin.
Exploration Drilling
A major RC drilling program commenced at Merlin in January 2010. This is the first major exploration initiative for some years and will test at depth kimberlite bearing structures associated with the pipes Gareth/Bedevere, Ywain/Gawain and Excalibur. In addition drill testing of two areas with known indicator minerals and diamonds at surface will be completed. This program has the potential to identify both extensions to the known mineralized materials as well as new discrete kimberlite occurrences.
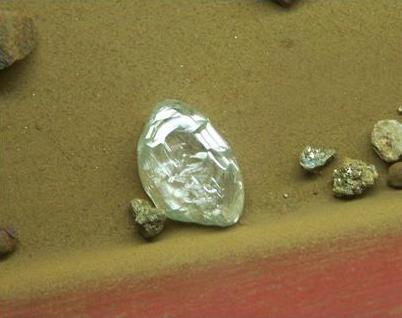
12.05ct gem quality diamond recovered 2009
35
Diamond Exploration
Merlin Orbit Tenements, Northern Territory
The Merlin Orbit tenements comprise an area of some 338,337 acres (refer to table N), and encompass numerous known unresolved occurrences of indicator minerals and diamonds.
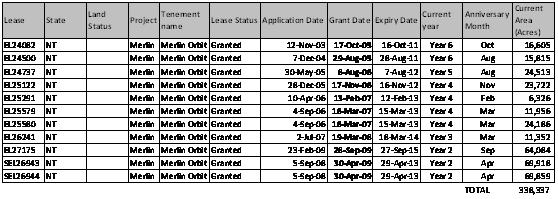
Table N: Merlin Orbit Tenements
Lancelot Prospect
The Lancelot and Lancelot Prospects prospect are situated some 40km south of Merlin and comprises an area where there are significant numbers of indicator minerals and diamonds reporting to surface samples. Drill testing of a number of geophysical, geochemical and indicator mineral anomalies in both of these areas was completed with 77 holes drilled for 2,753 metres. Follow-on trenching has led to the identification of near surface eluvial material believed to be near sourced. Samples were taken from this material to ascertain whether this material is sourcing the indicator minerals and diamonds. These samples are being processed through NADL’s heavy mineral and diamond laboratory in Perth.
Pending receipt of outstanding sample results a follow-up program of trenching, sampling and bulk testing will commence early in 2010 as soon as weather conditions permit.
Yambarra Project, Northern Territory
Rio Tinto Yambarra Farm-in –NADL Earning 100%
NADL has a farm-in agreement with Rio Tinto to earn 100% interest for diamonds in tenements in the Daly River region of the Northern Territory. These tenements have a total project area of 9,132km2.
Kimberley Projects
North Kimberley
Within NADL’s North Kimberley project area, NADL had previously identified two diamondiferous kimberlite pipes, the Ashmore and Seppelt 1 and 2 pipes. NADL holds this material under mining leases, as they continue to retain commercial potential. NADL also retains 1 exploration license within this region.
Top End Uranium Ltd
Uranium Exploration
Top End Uranium is a uranium focused exploration company which controls through farm-in arrangements with NADL, one of the largest portfolios of highly prospective exploration tenements in the Northern Territory, Australia. Its tenement holding covers an area aggregating approximately 33,400km² across three project areas, Arnhem Land Project Area, Yambarra Project Area and the McArthur South Project Area (Figure 7).
36
NADL assigned to Top End the non-diamond mineral rights to its tenements.
Figure 7: NT Project Areas
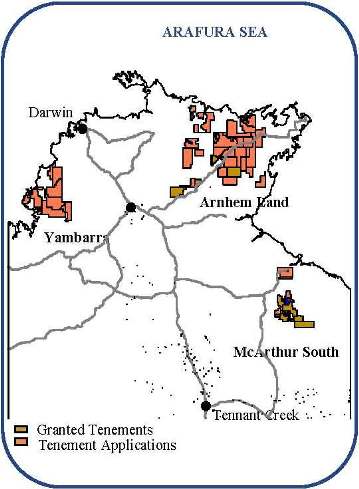
Investment in Northern Capital Resources Corp
Legend holds a 21.29% interest in Northern Capital Resources Corp (“NCRC”), an unlisted US corporation. NCRC is an emerging corporation in the North American and Australian gold and base metal markets. NCRC’s subsidiary Golden River Resources (GORV:OTCBB) announced in March 2009 that it had entered into an agreement whereby it would subscribe for up to 338.1m shares in Acadian Mining Corporation, a Canadian company listed on Toronto Stock Exchange (TSX:ADA) for an aggregate gross investment of up to C$10m. Following close of the transaction, Golden River holds approximately 68.78% of Acadian.
Acadian Mining Corporation is a Halifax, Nova Scotia, Canada based mining company focused on developing five advanced gold properties, Beaver Dam, Fifteen Mile Stream, Tangier, Forest Hill and Goldenville, which form the core holdings of the Scotia Goldfields Project. All of the five advanced properties host gold mineralized deposits described in technical reports prepared in compliance with Canadian National Instrument 43-101. Acadian is bringing a new approach to the development of Nova Scotia gold deposits by pursuing a multiple mine, central processing, managing and servicing strategy. Acadian is also focused on zinc-lead and barite properties in Atlantic Canada. Acadian operated an open pit zinc-lead mine (Scotia Mine) at Gays River, Nova Scotia from May, 2007 to early 2009 (Scotia Zinc Project) through its 100% wholly owned subsidiary ScoZinc Ltd. The Scotia Mine was put on care and maintenance in early 2009.
Acadian also holds a 29.18% interest in Royal Roads Corporation (TSX:RRO), a Canadian based exploration and development company, listed on the Toronto Venture Exchange, which is focused on gold and base metal properties in central Newfoundland, particularly, the Buchans Mining Camp. The Buchans mine was one of Canada's richest base metal mines having produced over 16 million tonnes of ore grading over 23% combined base metals with significant gold and silver credits.
NCRC also holds exploration interests in Australia.
37
Item 1A. Risk Factors.
We Lack an Operating History And Have Losses Which We Expect To Continue Into the Future.
To date we have had no material source of revenue. We have no operating history as a mineral exploration or mining company upon which an evaluation of our future success or failure can be made. Our ability to achieve and maintain profitability and positive cash flow is dependent upon:
|
-
|
exploration and development of any mineral property we identify;
|
|
-
|
our ability to locate economically viable mineral reserves in any mineral property we identify; and
|
|
-
|
our ability to generate revenues and profitably operate a mine on any mineral property we identify.
|
We Have No Mineral Reserves And We Cannot Assure You That We Will Find Such Reserves. If We Develop A Mineral Reserve, There Is No Guarantee That Production Will Be Profitable.
We cannot guarantee we will ever find any or that we will be successful in locating commercial mineral reserves on any exploration properties that we may obtain. Even if we find a commercial mineral reserve, there is no assurance that we will be able to mine them. Even if we develop a mine, there is no assurance that we will make a profit. If we do not find commercial minerals you could lose part or all of your investment.
We May Need Further Financing To Determine If There Is Commercial Minerals, Develop Any Minerals We Identify And To Maintain The Mineral Claims.
Our success may depend on our ability to raise further capital. We may require further substantial additional funds to conduct mineral exploration and development activities on all of our tenements. There is no assurance whatsoever that funds will be available from any source or, if available, that they can be obtained on terms acceptable to us to make investments. If funds are not available in the amounts required to achieve our business strategy, we would be unable to reach our objective. This could cause the loss of all or part of your investment.
World Economic Conditions Could Adversely Affect Our Results of Operations and Financial Condition
In 2008 and 2009, world economic conditions have experienced a downturn due to the sequential effects of the subprime lending crisis, general credit market crisis, the general unavailability of financing, collateral effects on the finance and banking industries, volatile energy and commodity costs, concerns about inflation, slower economic activity, decreased consumer confidence, reduced corporate profits and capital spending, adverse business conditions, increased unemployment and liquidity concerns. These adverse conditions may make it harder for the Company to raise additional funds to finance the continued development of its business and may reduce the demand for phosphate, which, at least in the short term, could reduce the value of the Company's mineral exploration properties. Continued adverse economic conditions could adversely affect our liquidity, results of operations and financial condition.
We Could Encounter Delays Due To Regulatory And Permitting Delays.
We could face delays in obtaining mining permits and environmental permits. Such delays, could jeopardize financing, if any, in which case we would have to delay or abandon work on the properties.
38
There Are Uncertainties Inherent In The Estimation Of Mineral Reserves.
Reserve estimates, including the economic recovery of ore, will require us to make assumptions about recovery costs and market prices. Reserve estimation is, by its nature, an imprecise and subjective process and the accuracy of such estimates is a function of the quality of available data and of engineering and geological interpretation, judgment and experience. The economic feasibility of properties will be based upon our estimates of the size and grade of ore reserves, metallurgical recoveries, production rates, capital and operating costs, and the future price of diamonds. If such estimates are incorrect or vary substantially it could affect our ability to develop an economical mine and would reduce the value of your investment.
If We Define An Economic Ore Reserve And Achieve Production, It Will Decline In The Future. An Ore Reserve Is A Wasting Asset.
Our future ore reserve and production, if any, will decline as a result of the exhaustion of reserves and possible closure of any mine that might be developed. Eventually, at some unknown time in the future, all of the economically extractable ore will be removed from the properties, and there will be no ore remaining unless this Company is successful in near mine site exploration to extend the life of the mining operation. This is called depletion of reserves. Ultimately, we must acquire or operate other properties in order to continue as an on going business. Our success in continuing to develop reserves, if any, will affect the value of your investment.
There Are Significant Risks Associated With Mining Activities.
The mining business is generally subject to risks and hazards, including quantity of production, quality of the ore, environmental hazards, industrial accidents, the encountering of unusual or unexpected geological formations, cave-ins, flooding, earthquakes and periodic interruptions due to inclement or hazardous weather conditions. These occurrences could result in damage to, or destruction of, our mineral properties or production facilities, personal injury or death, environmental damage, reduced production and delays in mining, asset write-downs, monetary losses and possible legal liability. We could incur significant costs that could adversely affect our results of operation. Insurance fully covering many environmental risks (including potential liability for pollution or other hazards as a result of disposal of waste products occurring from exploration and production) is not generally available to us or to other companies in the industry. What liability insurance we carry may not be adequate to cover any claim.
We May Be Subject To Significant Environmental And Other Governmental Regulations That Can Require Substantial Capital Expenditure, And Can Be Time-Consuming.
We may be required to comply with various laws and regulations pertaining to exploration, development and the discharge of materials into the environment or otherwise relating to the protection of the environment in the countries that we operate, all of which can increase the costs and time required to attain operations. We may have to obtain exploration, development and environmental permits, licenses or approvals that may be required for our operations. There can be no assurance that we will be successful in obtaining, if required, a permit to commence exploration, development and operation, or that such permit can be obtained in a timely basis. If we are unsuccessful in obtaining the required permits it may adversely affect our ability to carry on business and cause you to lose part or all of your investment.
Mining Accidents Or Other Adverse Events At Our Property Could Reduce Our Production Levels.
If and when we reach production it may fall below estimated levels as a result of mining accidents, cave-ins or flooding on the properties. In addition, production may be unexpectedly reduced if, during the course of mining, unfavourable ground conditions or seismic activity are encountered, ore grades are lower than expected, or the physical or metallurgical characteristics of the ore are less amenable to mining or processing than expected. The happening of these types of events would reduce our profitably or could cause us to cease operations which would cause you to lose part or all of your investment.
39
The acquisition of mineral properties is subject to substantial competition. If we must pursue alternative properties, companies with greater financial resources, larger staffs, more experience, and more equipment for exploration and development may be in a better position than us to compete for properties. We may have to undertake greater risks than more established companies in order to compete which could affect the value of your investment.
We May Lose Our Claims If We Do No Maintain A Minimum Level of Work On The Claims
We will be required to carry out a minimum level of work on each claim to maintain of our claims in good standing. If we cannot afford to carry out the work or pay the fees we could lose our interest in claims. The loss of some or all of our mineral claims would adversely affect the value of your investment.
Approximately 52% Of Our Common Stock Is Controlled By Certain Stockholders, Including Our Chairman And Chief Executive Officer, Who Have The Ability To Substantially Influence The Election Of Directors And Other Matters Submitted To Stockholders
Mr Joseph Gutnick, our Chairman and Chief Executive Officer, beneficially owned 74.2 million shares of our common stock, which represented 33% of our shares outstanding as of December 31, 2009. In addition, Mr Gutnick is a party to a stockholders agreement with IFFCO, which beneficially owned 19% of our common stock as of December 31, 2009. Pursuant to the stockholders agreement, Mr Gutnick and IFFCO have agreed to vote their shares together on certain matters, including the election of directors. As a result, they have and are expected to continue to have the ability to significantly influence the election of our Board of Directors and the outcome of all other issues submitted to our stockholders. The interests of these principal stockholders may not always coincide with our interests or the interests of other stockholders, and they may act in a manner that advances their best interests and not necessarily those of other stockholders. One consequence to this substantial influence or control is that it may be difficult for investors to remove management of the Company. It could also deter unsolicited takeover, including transactions in which stockholders might otherwise receive a premium for their shares over then current market prices.
We are substantially dependent upon AXIS Consultants To Carry Out Our Activities
We are substantially dependent upon AXIS for our senior management, financial and accounting, corporate legal and other corporate headquarters functions. For example, each of our officers is employed by AXIS and, as such, is required by AXIS to devote substantial amounts of time to the business and affairs of the other shareholders of AXIS.
Pursuant to a services agreement, AXIS provides us with office facilities, administrative personnel and services, management and geological staff and services. No fixed fee is set in the agreement and we are required to reimburse AXIS for any direct costs incurred by AXIS for us. In addition, we pay a proportion of AXIS indirect costs based on a measure of our utilization of the facilities and activities of AXIS plus a service fee of not more than 15% of the direct and indirect costs. This service agreement may be terminated by us or AXIS on 60 days’ notice. See “Certain Relationships and Related Party Transactions.”
We are one of ten affiliated companies. Each of the companies has some common Directors, officers and shareholders. In addition, each of the companies is substantially dependent upon AXIS for its senior management and certain mining and exploration staff. A number of arrangements and transactions have been entered into from time to time between such companies. Currently, there are no material arrangements or planned transactions between the Company and any of the other affiliated companies other than AXIS. However, it is possible we may enter into such transactions in the future which could present conflicts of interest. In addition, there may be conflicts among the Company and the other companies that AXIS provides services to with respect to access to executive and administrative personnel and other resources.
40
Historically, AXIS has allocated corporate opportunities to each of the companies engaged in the exploration and mining industry after considering the location of each of the companies’ operations and the type of commodity for which each company explores within its geographic region. At present, there are no conflicts among the ten companies with respect to the principal geographic areas in which they operate and/or the principal commodities that they are searching for other than between the Company and NADL (in which the Company owned a 47.83% interest as of December 31, 2009) with respect to the search for diamonds in Northern Australia. AXIS has advised the Company that it plans to allocate diamond exploration opportunities between the Company and NADL based upon the proximity of such opportunities to their respective existing exploration properties.
Future Sales of Common Stock Could Depress The Price Of Our Common Stock
Future sales of substantial amounts of Common Stock by certain stockholders could have a material adverse impact on the market price for the Common Stock at the time. As of the date of this annual report, there are 226,333,392 shares of Common Stock outstanding, of which 5,000,000 shares of Common Stock are restricted securities. Restricted securities will be available for sale pursuant to Rule 144 under the Securities Act. In general, under rule 144, a person (or persons whose shares are aggregated) who has satisfied a six-month holding period and who is not an affiliate of the Company may sell restricted securities without limitation as long as the Company is current in its SEC reports. A person who is an affiliate of the Company may sell within any three-month period a number of restricted securities which does not exceed the greater of one (1%) percent of the shares outstanding or the average weekly trading volume during the four calendar weeks preceding the notice of sale required by Rule 144. In addition, Rule 144 permits, under certain circumstances, the sale of restricted securities by a non-affiliate without any limitations after a one-year holding period. Any sales of shares by stockholders pursuant to Rule 144 may have a depressive effect on the price of our Common Stock.
Our Common Stock Is Traded Over the Counter, Which May Deprive Stockholders Of The Full Value Of Their Shares
Our Common Stock is quoted via the Over The Counter Bulletin Board (OTCBB). As such, our Common Stock may have fewer market makers, lower trading volumes and larger spreads between bid and asked prices than securities listed on an exchange such as the New York Stock Exchange or the NASDAQ Stock Market. These factors may result in higher price volatility and less market liquidity for the Common Stock.
A Low Market Price May Severely Limit The Potential Market For Our Common Stock
Our Common Stock is currently trading at a price substantially below $5.00 per share, subjecting trading in the stock to certain SEC rules requiring additional disclosures by broker-dealers. These rules generally apply to any equity security that has a market price of less than $5.00 per share, subject to certain exceptions (a “penny stock”). Such rules require the delivery, prior to any penny stock transaction, of a disclosure schedule explaining the penny stock market and the risks associated therewith and impose various sales practice requirements on broker-dealers who sell penny stocks to persons other than established customers and institutional or wealthy investors. For these types of transactions, the broker-dealer must make a special suitability determination for the purchaser and have received the purchaser’s written consent to the transaction prior to the sale. The broker-dealer also must disclose the commissions payable to the broker-dealer, current bid and offer quotations for the penny stock and, if the broker-dealer is the sole market maker, the broker-dealer must disclose this fact and the broker-dealer’s presumed control over the market. Such information must be provided to the customer orally or in writing before or with the written confirmation of trade sent to the customer. Monthly statements must be sent disclosing recent price information for the penny stock held in the account and information on the limited market in penny stock. The additional burdens imposed upon broker-dealers by such requirements could discourage broker-dealers from effecting transactions in our Common Stock.
41
The Market Price Of Your Shares Will Be Volatile.
The stock market price of mineral exploration companies like us has been volatile. Securities markets may experience price and volume volatility. The market price of our stock may experience wide fluctuations that could be unrelated to our financial and operating results. Such volatility or fluctuations could adversely affect your ability to sell your shares and the value you might receive for those shares.
|
Unresolved Staff Comments.
|
As of December 31, 2009, we do not have any Securities and Exchange Commission staff comments that have been unresolved for more than 180 days.
|
Properties.
|
Legend has exploration properties as discussed in “Item 1 – Description of Business”. Legend occupies certain executive and office facilities in New York, Melbourne, Victoria and certain regional areas in Australia to support field operations and AXIS also provides office facilities pursuant to the Service Agreement with AXIS. See “Item 1 – Business - Employees” and “Item 12 – Certain Relationships and Related Transactions”. Legend believes that its administrative space is adequate for its current needs.
|
Legal Proceedings.
|
In January 2010, two stockholders (“the plaintiffs”- being an individual and his private company) commenced an action in Supreme Court, New York County against the Company, Renika Pty Ltd. and Joseph Gutnick (collectively “the defendants”) on account of the alleged failure of the defendants to issue warrants to the plaintiffs in connection with the purchase of shares of common stock from the Company and from Renika Pty Ltd. in 2006 and 2007. The complaint alleges three causes of action, and seeks unspecified damages. The Company, Renika Pty Ltd. and Joseph Gutnick vehemently deny the allegation. The defendants have moved to dismiss the complaint as a matter of law. The Company, Renika Pty Ltd. and Joseph Gutnick is vigorously defending such claim.
The Company has received a claim for compensation in consideration of introducing the Company to a third party. The Company’s attorneys responded denying any agreement or understanding. The Company does not believe the claim has any merit and will defend the claim vigorously if necessary.
Other than these matters, there are no pending legal proceedings to which the Company is a party, or to which any of its property is the subject, which the Company considers material.
42
|
Market for Registrant’s Common Equity, Related Stockholder Matters and Issuer Purchases of Equity Securities.
|
Market Information
Legend's Common Stock is quoted on the NASD Over-the-Counter Bulletin Board ("OTCBB") under the ticker symbol "LGDI" and CUSIP# 52467C 10 0. The Company's Common Stock was initially cleared for trading on the OTC-BB on September 26, 2003.
The following table sets out the high and low bid information for the Common Stock as reported by the National Quotation Service Bureau for each period/quarter indicated in US$:
| High Bid (1) | Low Bid (1) | |
|
2007
|
||
|
First Quarter
|
1.80
|
0.90
|
|
Second Quarter
|
1.95
|
1.50
|
|
Third Quarter
|
1.45
|
1.25
|
|
Fourth Quarter
|
1.50
|
0.75
|
|
2008
|
||
|
First Quarter
|
2.15
|
0.09
|
|
Second Quarter
|
5.05
|
1.62
|
|
Third Quarter
|
4.42
|
0.62
|
|
Fourth Quarter
|
1.43
|
0.27
|
|
2009
|
||
|
First Quarter
|
0.76
|
0.44
|
|
Second Quarter
|
0.77
|
0.53
|
|
Third Quarter
|
1.11
|
0.59
|
|
Fourth Quarter
|
1.49
|
0.73
|
|
(1)
|
The quotations set out herein reflect inter-dealer prices without retail mark-up, mark-down or commission and may not necessarily reflect actual transactions.
|
As of March 15, 2010, there are 226,333,392 shares of Common Stock outstanding.
To date we have not paid dividends on our Common Stock and we do not expect to declare or pay any dividends on our Common Stock in the foreseeable future. Payment of any dividends will depend upon our future earnings, if any, our financial condition, and other factors deemed relevant by the Board of Directors.
Shareholders
As of January 31, 2010, there were approximately 2,034 record holders of the Company's Common Stock. Within the holders of record of the Company's Common Stock are depositories such as Cede & Co., a nominee for The Depository Trust Company (or DTC), that hold shares of stock for brokerage firms which, in turn, hold shares of stock for one or more beneficial owners. Accordingly, the Company believes there are many more beneficial owners of its Common Stock whose shares are held in "street name", not in the name of the individual shareholder.
43
Options
Effective as of December 12, 2005, the Board of Directors of Company approved the distribution to stockholders for no consideration of an aggregate of 36,135,500 non-transferable options, each of which is exercisable to purchase one share of Common Stock of the Company at an exercise price of US$0.25 ($0.111, as adjusted) per share with a latest exercise date of December 31, 2012 and otherwise on the terms and conditions set out in Appendix A to the Form 8-K dated December 12, 2005. The options were issued on a pro-rata basis to all stockholders of record on December 31, 2005 on the basis of two (2) options for every one (1) share of Common Stock owned by a stockholder on the record date. The options may not be exercised until the shares underlying the options are registered under federal and state securities laws. On June 26, 2006, the Board of Directors amended the terms and conditions of the options and included a cashless exercise clause for the options in the terms and conditions. On July 21, 2006, Renika exercised 34,778,220 options using the cashless exercise feature and were issued 71,730,079 shares of Common Stock. In December 2006, the Company issued 700,000 shares with attaching options on the basis of one option for every two shares at no exercise price. The options were exercised in December 2006. On December 27, 2006, a further option holder exercised 19,000 options using the cashless exercise feature and was issued 24,750 shares of Common Stock. 3,123,630 of these options remained outstanding as of the date of this Report.
On September 19, 2006, the Company issued 8,100,000 options (as adjusted for the Stock Split) pursuant to the 2006 Equity Incentive Plan. Of the total 8,100,000 options issued, 2,700,000 vested on September 19, 2007, 2,700,000 vested on September 19, 2008 and 2,700,000 will vest on September 19, 2009. The exercise price of the options is US$1.00 for the President and Chief Executive Officer and for all other participants, US$0.444 for 50% of the options and US$1.00 for the balance of 50% of the options. The options expire on September 19, 2016.
In November 2006, the Company issued options to purchase 112,500 shares of Common Stock with an exercise price of US$0.111 per share in connection with the settlement of a dispute.
On May 16, 2007, the Company issued 862,500 options pursuant to the 2006 Equity Incentive Plan. Of the total 862,500 options issued, 287,500 vested on May 16, 2008, 287,500 will vest on May 16, 2009 and 287,500 will vest on May 16, 2010. The exercise price of the options is US$0.444 for 50% of the options and US$1.00 for the balance of 50% of the options. The options expire on May 16, 2017.
On December 28, 2007, the Board of Directors of the Company agreed to issue/ratify the issue of 5,387,500 options under the 2006 Incentive Option Plan to officers, employees and consultants as follows:
|
(i)
|
300,000 options of which 1/3 vested on September 10, 2008, 1/3 will vest on September 10, 2009 and the balance will vest on September 10, 2010 and 50% of the options have an exercise price of US$0.444 per option and 50% have an exercise price of US$1.00 per option;
|
|
(ii)
|
300,000 options of which 1/3 vested on December 19, 2008, 1/3 will vest on December 19, 2009 and the balance will vest on December 19, 2010 and 50% of the options have an exercise price of US$0.444 per option and 50% have an exercise price of US$1.00 per option; and
|
|
(iii)
|
4,787,500 options of which 1/3 vested on December 28, 2008, 1/3 will vest on December 28, 2009 and the balance will vest on December 28, 2010 and have an exercise price of US$1.00 per option.
|
On February 7, 2008 the Board of Directors of the Company agreed to issue 5,000,000 options to officers, employees and consultants under the 2006 Incentive Option Plan of which 1/3 vested on February 7, 2009, 1/3 will vest on February 7, 2010 and the balance on February 7, 2011 and have an exercise price of US$2.00 per option.
On February 18, 2008 the Board of Directors of the Company agreed to issue 400,000 options to officers, employees and consultants under the 2006 Incentive Option Plan of which 1/3 vested on February 18, 2009, 1/3 will vest on February 18, 2010 and the balance on February 18, 2011 and have an exercise price of US$1.00 per option.
44
On May 29, 2008 the Board of Directors of the Company agreed to issue 362,500 options to officers, employees and consultants under the 2006 Incentive Option Plan of which 1/3 will vest on May 29, 2009, 1/3 will vest on May 29, 2010 and the balance on May 29, 2011 and have an exercise price of US$1.00 per option.
On July 11, 2008, the Company issued Dr. D.S. Tyrwhitt 1,000,000 options under the 2006 Incentive Option Plan with an exercise price of US$3.48, a latest exercise date of July 11, 2018, no issue price and to vest 1/3 in 12 months, 1/3 in 24 months and 1/3 in 36 months. An external consultant has calculated the fair value of the options using the Binomial valuation method using a share price of US$3.26, strike price as set out above, maturity period of 5.5 to 6.5 years depending on the vesting date, risk free interest rate of 3.960% and volatility of 60%. This equates to values ranging from US$1.81 to US$1.95 per option depending on the exercise price and vesting date. The total value of the options equates to A$1,959,558.
On July 14, 2008, the Company issued options to the Indian Farmers Fertilizer Cooperative Limited, pursuant to a Share Options Agreement, to purchase 30,000,000 shares of Common Stock on the following terms:
|
a.
|
5,000,000 options, at an exercise price of $2.50 per share and expiring 60 days from July 11, 2008;
|
|
b.
|
8,000,000 options, at an exercise price of $3.00 per share and expiring 12 months from July 11, 2008;
|
|
c.
|
8,000,000 options, at an exercise price of $3.50 per share and expiring 18 months from July 11, 2008;
|
|
d.
|
9,000,000 options, at an exercise price of $4.00 per share and expiring 24 months from July 11, 2008.
|
On August 11, 2008, the Board of Directors of the Company agreed to issue/ratify the issue of 462,500 options under the 2006 Incentive Option Plan to officers, employees and consultants as follows:
|
(i)
|
200,000 options which will vest 1/3 on July 7, 2009, 1/3 on July 7, 2010 and the balance on July 7, 2011 and have an exercise price of US$2.00 per option.
|
|
(ii)
|
150,000 options which will vest 1/3 on July 21, 2009, 1/3 on July 21, 2010 and the balance on July 21, 2011 and have an exercise price of US$2.00 per option.
|
|
(iii)
|
112,500 options which will vest 1/3 on August 8, 2009, 1/3 on August 8, 2010 and the balance on August 8, 2011 and have an exercise price of US$1.00 per option.
|
On August 11, 2008 the Company issued two non executive directors 700,000 options under the 2006 Incentive Option Plan with an exercise price of US$2.00, a latest exercise date of August 11, 2018, no issue price and to vest 1/3 in 12 months, 1/3 in 24 months and 1/3 in 36 months.
On December 4, 2008, the Board of Directors of the Company agreed to issue/ratify the issue of 3,275,000 options under the 2006 Incentive Option Plan to officers, employees and consultants as follows:
|
(i)
|
962,500 options which will vest 1/3 on December 4, 2009, 1/3 on December 4, 2010 and the balance on December 4, 2011 and have an exercise price of US$1.00 per option.
|
|
(ii)
|
1,050,000 options which will vest 1/3 on December 4, 2009, 1/3 on December 4 10, 2010 and the balance on December 4, 2011 and have an exercise price of US$1.00 per option.
|
45
|
(iii)
|
562,500 options which will vest 1/3 on December 4, 2009, 1/3 on December 4 10, 2010 and the balance on December 4, 2011 and have an exercise price of US$1.00 per option.
|
|
(iv)
|
500,000 options which will vest 1/3 on December 4, 2009, 1/3 on December 4 10, 2010 and the balance on December 4, 2011 and have an exercise price of US$1.00 per option. For additional information concerning stock options, see Note 7 to the Company’s Financial Statements.
|
On January 4, 2009, the Company issued 200,000 options under the 2006 Incentive Option Plan with an exercise price of US$1.00, a latest exercise date of January 4, 2019, no issue price and to vest 1/3 in 12 months, 1/3 in 24 months and 1/3 in 36 months.
On February 2, 2009, the Company issued 600,000 options under the 2006 Incentive Option Plan with an exercise price of US$1.00, a latest exercise date of February 2, 2019, no issue price and to vest 1/3 in 12 months, 1/3 in 24 months and 1/3 in 36 months.
On February 9, 2009, the Company issued 200,000 options under the 2006 Incentive Option Plan with an exercise price of US$1.00, a latest exercise date of February 9, 2019, no issue price and to vest 1/3 in 12 months, 1/3 in 24 months and 1/3 in 36 months.
On February 25, 2009, the Company issued 250,000 options under the 2006 Incentive Option Plan with an exercise price of US$1.00, a latest exercise date of February 25, 2019, no issue price and to vest 1/3 in 12 months, 1/3 in 24 months and 1/3 in 36 months.
On March 23, 2009, the Company issued 300,000 options under the 2006 Incentive Option Plan with an exercise price of US$1.00, a latest exercise date of March 23, 2019, no issue price and to vest 1/3 in 12 months, 1/3 in 24 months and 1/3 in 36 months.
On April 1, 2009, the Company issued 150,000 options under the 2006 Incentive Option Plan with an exercise price of US$1.00, a latest exercise date of April 1, 2019, no issue price and to vest 1/3 in 12 months, 1/3 in 24 months and 1/3 in 36 months.
On April 13, 2009, the Company issued 100,000 options under the 2006 Incentive Option Plan with an exercise price of US$1.00, a latest exercise date of April 13, 2019, no issue price and to vest 1/3 in 12 months, 1/3 in 24 months and 1/3 in 36 months.
On June 25, 2009, the Company issued 100,000 options under the 2006 Incentive Option Plan with an exercise price of US$1.00, a latest exercise date of June 25, 2019, no issue price and to vest 1/3 in 12 months, 1/3 in 24 months and 1/3 in 36 months.
Dividend Policy
The Company has not previously paid any cash dividends on Common Stock and does not anticipate or contemplate paying dividends on Common Stock in the foreseeable future. It is the present intention of management to utilize all available funds for the development of the Company's business. The only restrictions that limit the ability to pay dividends on common equity or that are likely to do so in the future, are those restrictions imposed by law. Under Delaware corporate law, no dividends or other distributions may be made which would render the Company insolvent or reduce assets to less than the sum of its liabilities plus the amount needed to satisfy any outstanding liquidation preferences.
Effective November 17, 2006, the Company’s Board of Directors declared a 1-for-2 share bonus issue in the form of a dividend that was payable in December 2006 to stockholders of record as of November 17, 2006. An aggregate of 27,599,722 shares of Common Stock were issued in connection with this dividend.
In November 2006, the Company’s Board of Directors declared a second 1-for-2 share bonus issue in the form of a dividend that was payable in January 2007 to stockholders of record as of December 31, 2006. An aggregate of 41,934,337 shares of Common Stock were issued in connection with this dividend.
46
Transfer Agent
The transfer agent and registrar for the Company's Common Stock is Continental Stock Transfer & Trust Company of 17 Battery Place, 8th Floor, New York, NY 10004.
Recent Sales of Unregistered Securities
We have issued no unregistered securities within the period covered by this report which have not been previously reported on Form 10-Q or Form 8-K.
Performance Graph
The following graph compares the cumulative 5-year total return provided shareholders on Legend's common stock relative to the cumulative total returns of the NASDAQ Composite index, and a customized peer group of seven companies that includes: Agrium Inc, CF Industries Holdings Inc, Minemakers Limited, Phoscan Chemical Corp., Potash Corp. Of Saskatchewan, Terra Industries Inc and The Mosaic Company. An investment of $100 (with reinvestment of all dividends) is assumed to have been made in our common stock, in the peer group, and the index on December 31, 2004 and its relative performance is tracked through December 31, 2009.
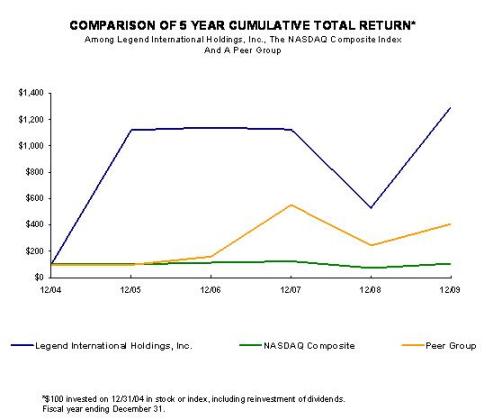
47
|
Selected Financial Data.
|
Our selected financial data presented below for each of the years in the five-year period ended December 31, 2009, and the balance sheet data at December 31, 2005, 2006, 2007, 2008 and 2009 has been derived from financial statements, which have been audited by PKF, Certified Public Accountants, a Professional Corporation, New York, NY. The selected financial data should be read in conjunction with our financial statements for each of the years in the period ended December 31, 2009 and Notes thereto, which are included elsewhere in this Annual Report.
Statement of Operations Data
| Year ended December 31 | ||||||||||||
|
2005
|
2006
|
2007
|
2008
|
2009
|
2009
Conv.
Transl
|
|||||||
|
A$000s
|
A$000s
|
A$000s
|
A$000s
|
A$000s
|
US$000s
|
|||||||
|
Revenues
|
-
|
-
|
-
|
-
|
-
|
-
|
||||||
|
Other income (loss)
|
-
|
2
|
22
|
3,726
|
3,823
|
3,414
|
||||||
|
Costs and expenses
|
(77
|
)
|
(4,537
|
)
|
(8,540
|
)
|
(23,408
|
)
|
(40,629
|
)
|
(36,286
|
)
|
|
Loss from operations
|
(77
|
)
|
(4,535
|
)
|
(8,518
|
)
|
(19,682
|
)
|
(36,806
|
)
|
(32,872
|
)
|
|
Other non-operational gains and costs
|
1
|
(40
|
)
|
(120
|
)
|
5,461
|
(2,347
|
)
|
(2,095
|
)
|
||
|
Provision for income taxes
|
-
|
-
|
-
|
-
|
-
|
-
|
||||||
|
Equity in losses of unconsolidated entities
|
-
|
-
|
-
|
-
|
(346
|
)
|
(309
|
)
|
||||
|
Net profit (loss)
|
(76
|
)
|
(4,575
|
)
|
(8,638
|
)
|
(14,221
|
)
|
(39,499
|
)
|
(35,276
|
)
|
|
Net (loss) attributable to non-controlling interests
|
-
|
-
|
-
|
-
|
1,613
|
1,440
|
||||||
|
Net (loss) attributable to Legend stockholders
|
(76
|
)
|
(4,575
|
)
|
(8,638
|
)
|
(14,221
|
)
|
(37,886
|
)
|
(33,836
|
)
|
|
A$
|
A$
|
A$
|
A$
|
A$
|
$US
|
|||||||
|
Basic net (loss) per share (1)
|
(0.00
|
)
|
(0.06
|
)
|
(0.06
|
)
|
(0.07
|
)
|
(0.17
|
)
|
(0.15
|
)
|
|
Weighted average number
of shares outstanding (000s)(1)
|
28,669
|
75,230
|
146,740
|
204,501
|
226,328
|
226,328
|
||||||
|
Balance Sheet Data
|
||||||||||||
|
A$000s
|
A$000s
|
A$000s
|
A$000s
|
A$000s
|
US$000s
|
|||||||
|
Total assets
|
-
|
1,149
|
17,994
|
130,076
|
120,433
|
107,558
|
||||||
|
Total liabilities
|
(89
|
)
|
(1,881
|
)
|
(1,035
|
)
|
(3,317
|
)
|
(5,534
|
)
|
(4,942
|
)
|
|
Total equity
|
(89
|
)
|
(732
|
)
|
16,959
|
126,759
|
114,899
|
102,616
|
||||
(1) Effective November 17, 2006, Legend issued one (1) new bonus share of Common Stock for every two (2) shares of Common Stock outstanding on the record at that date. The issue of the new bonus shares of Common Stock were on a pro-rate basis to all shareholders. As a result, the Company issued 27,599,722 shares of its Common Stock. Effective December 31, 2006, Legend issued one (1) new bonus share of Common Stock for every two (2) shares of Common Stock outstanding on the record at that date. The issue of the new bonus shares of Common Stock were on a pro-rata basis to all shareholders. As a result, the Company issued 41,934,337 shares of its Common Stock.
48
The Company has accounted for these bonus issues as a stock split and accordingly, all share and per share data has been retroactively restated.
|
Management’s Discussion and Analysis of Financial Condition and Results of Operation.
|
General
The following discussion and analysis of our financial condition and plan of operation should be read in conjunction with the Financial Statements and accompanying notes and the other financial information appearing elsewhere in this report. This report contains numerous forward-looking statements relating to our business. Such forward-looking statements are identified by the use of words such as believes, intends, expects, hopes, may, should, plan, projected, contemplates, anticipates or similar words. Actual operating schedules, results of operations, ore grades and mineral deposit estimates and other projections and estimates could differ materially from those projected in the forward-looking statements.
We are an exploration stage company. Our principal exploration target is for phosphate. We are in the initial stages of our exploration program and we have not yet identified any ore reserves. We have not generated any material revenues from operations
Foreign Currency Translation
The majority of our administrative operations are in Australia and, as a result, our accounts are reported in Australian dollars. Foreign income and expenses are translated into Australian dollars at the average exchange rate prevailing during the period. Assets and liabilities of the foreign operations are translated into Australian dollars at the period-end exchange rate. The following table shows the period-end rates of exchange of the Australian and US dollar compared with the US dollar during the periods indicated. During the year, the Company had significant US$ cash balances which when converted to Australian dollars results in a large foreign exchange loss.
Year ended
December 31
2008 A$1.00 = US$0.6907
2009 A$1.00 = US$0.8931
The exchange rate between the A$ and US$ has moved by 29.3% between December 31, 2008 and 2009. Accordingly, a direct comparison of costs between fiscal 2008 and 2009 may not necessarily be a true comparison.
Plan of Operation
We had A$72,666,088 in cash at December 31, 2009.
We commenced exploration activities on the tenements we acquired in July 2006 and since that time and up to December 31, 2009, have spent A$43,332,165 on exploration and pre-development activities. We plan to continue our exploration and pre-development program throughout 2010 and anticipate spending A$16.3 million on exploration and pre-development and A$10.4 million on administrative costs.
As set out in Item 1 “Employees” the services of our Chief Executive Officer, Chief Financial Officer, Executive General Manager, geologists, finance and clerical employees are provided by AXIS. At the current time, we have no plans to change these arrangements or employ any further persons.
49
Results of Operations
Year ended December 31, 2009 versus Year ended December 31, 2008
The Company as part of its business strategy is increasing its diamond exploration activity in the proximity of the Merlin diamond mine in the Northern Territory and is continually sourcing new ground in this region which is one of the most diamond prospective areas in Australia. As part of this strategy, the Company acquired a 14.9% interest in North Australian Diamonds Ltd (“NADL”), an Australian diamond exploration corporation, at a cost of A$2,368,000 in February 2009. NADL owns the Merlin diamond mine and surrounding tenements. On May 12, 2009, the Company made an on market takeover offer for all of the shares in NADL, an Australian corporation. The takeover offer concluded on August 6, 2009. At the close of offer, the Company held 55% of the issued and outstanding shares of NADL. As a result, the Company has since that time consolidated the results of NADL. In early December 2009, NADL placed shares to a third party which had the effect of diluting the Company’s interest in NADL to 47.83%. It is management’s conclusion that the Company still has a controlling financial interest in NADL and accordingly, it should continue to consolidate NADL’s results into the Company.
As an exploration stage company, we do not have an ongoing source of revenue. Our revenue stream is normally from ad-hoc tenement disposals and interest received on cash in bank. During the year ended December 31, 2009, we received A$3,338,315 (US$2,981,449) in interest on funds in the bank (2008: A$3,669,440), interest income from a related entity of A$81,503 (US$72,790) (2008 A$49,931) and other income of A$403,266 (US$360,157) (2008: A$6,534). Included in other income is an amount for NADL A$359,587 (US$321,147) being a refund from the government for research and development and diesel fuel; for which there are no comparable amounts for the year ended December 31, 2008.
Costs and expenses increased during the year from A$23,408,089 for the year ended December 31, 2008 to A$40,629,310 (US$36,286,036) for the year ended December 31, 2009.
The main components of costs and expenses are as follows:-
|
(i)
|
an increase in exploration expenditure written off from A$8,780,037 in 2008 to A$25,608,743 (US$22,871,169) in 2009. Our accounting policy is to expense all exploration costs (including costs associated with the acquisition of tenement interests) as incurred. During 2009, we continued our drilling programs on the phosphate project in Queensland for the entire year as well as continuing the sampling program throughout the year in the Northern Territory. The costs included drilling, assaying, camp costs, aerial surveying, geological/geophysical contractors, salaries and associated costs for contract field staff, travel, accommodation, meals and tenement holding costs. During 2008, we commenced a significant drilling program at our phosphate project in Queensland in September 2008 and a detailed sampling program in the Northern Territory. On our Queensland phosphate project, we also commenced early stage investigations into a mining operation. The costs included drilling, assaying, camp costs, aerial surveying, geological/geophysical contractors, salaries and associated costs for contract field staff, travel, accommodation, meals and tenement holding costs. During 2008, we incurred A$3,729,592 in costs for exploration drilling on our tenements in the Northern Territory. The costs included drilling, helicopter support, geological/geophysical contractors, salaries and associated costs for contract field staff, travel, accommodation, meals and tenement holding costs.
|
|
(ii)
|
an increase in interest expense from A$32,715 in 2008 to A$64,831 (US$57,901) in 2009. During 2009, we incurred interest on the motor vehicle finance leases for a full 12 months compared to 2008 when we incurred interest on the camp lease and motor vehicle finance lease for part of the year.
|
50
|
(iii)
|
an increase in aircraft maintenance costs from A$278,826 in 2008 to A$1,014,986 (US$906,484) in 2009. The Company purchased a Lear jet from AXIS in August 2008 to utilize in its field operations and has incurred operating costs for the jet since that time. In 2009, the lear jet was owned and used for a full 12 month period.
|
|
(iv)
|
an increase in legal, professional and accounting from A$707,444 for 2008 to A$880,851 (US$786,687) for 2009. During 2009, we incurred legal expenses of A$407,549 (US$363,982) for general legal work including stock transfer matters, regulatory filings, stock option plans, native title and environmental approvals, asset acquisitions, and Form S-1 Registration Statements in both the US and Australia; audit fees of A$384,747 (US$343,618) for professional services in relation to financial statements, the quarterly Form 10-Qs, Form 10-K, Form 10-K/A and Form S-1; and taxation fees of A$69,875 (US$62,405) relating to both the Company and its subsidiaries. Included within legal, accounting and professional expense for the year ended December 31, 2009 are the following amounts for NADL A$66,854 being a fee paid to tax consultants for the preparation of the research and development claim, legal fees of A$16,737, professional fees paid to attorney’s independent experts and other consultants for takeover defense costs of A$27,771 for which there is no comparative amount in 2008. During 2008, we incurred legal expenses of A$518,273 for general legal work including stock transfer matters, regulatory filings, stock option plans, native title and environmental approvals, asset acquisitions, and Form S-1 Registration Statements; audit fees of A$176,198 for professional services in relation to financial statements, the quarterly Form 10-Qs, Form 10-K, and Form S-1; and taxation fees of $11,492.
|
|
(v)
|
an increase in amortization of mineral rights from A$nil in 2008 to A$582,710 (US$520,418) in 2009. On the acquisition date of the business combination of NADL, the Company recognized mineral rights of A$18,873,000 (US$16,835,476). The underlying mineral property licences have a set term and mineral rights are being amortized over the term of the licences. The acquisition occurred during 2009 and therefore there was no comparable amounts in 2008.
|
|
(vi)
|
a increase in administrative costs from A$8,096,798 in 2008 to A$8,217,286 (US$7,338,858) in 2009. During 2009, the corporate management and service fees charged to us by AXIS was A$4,433,074 (US$3,959,178). AXIS charged us A$2,968,765 (US$2,651,404) for Directors’ fees, salaries and salary related matters incurred in behalf of the Company, which relates to our share of salaries paid to the President & Chief Executive Officer, Chief Financial Officer and Secretary, Executive General Manager, General Manager Business, Project Manager and other staff of AXIS who provide services to the Company, and A$208,578 (US$186,281) for independent directors’ fees. The Company paid insurance costs of A$536,364 (US$479,027), including the Federal Government of Australia insurance policy on cash at bank in Australia in excess of A$1,000,000, for 2009. The Company incurred A$1,062,977 (US$949,345) for travel by Directors and officers, contractors, and other AXIS staff who provide services to the Company on capital raising trips, trips to the field; A$467,204 (US$417,260) for investor relations consultants; A$62,385 (US$55,716) for work on the ASX listing; A$9,291 (US$8,296),in borrowing costs and bank fees; A$102,572 (US$91,607) for motor vehicles costs; A$51,149 (US$45,681) for public relations; A$46,111 (US$41,182) for stock transfer agent services; A$206,344 (US$184,286) for office and computing consumables;A$118,875 (US$106,167) for staff support costs; A$555,260 (US$495,903) for rent of offices in Melbourne, Mt Isa, Perth and New York and an apartment; A$39,138 (US$34,954) for subscription to industry papers and services; A$43,361 (US$38,726) for telecommunications support; A$66,715 (US$59,583) for depreciation of non-field assets and minor equipment purchases; A$60,095 (US$53,583) for Delaware franchise tax; A$86,800 (US$77,521) in donations to local community groups; general costs of A$279,036 (US$249,207). AXIS charge an administration and service fee of A$1,264,759 (US$1,129,556). During 2008, the corporate management and service fees charged to us by AXIS was A$5,413,203. AXIS charged us A$2,459,665 for Directors’ fees, salaries and salary related matters incurred in behalf of the Company, which relates to our share of salaries paid to the President & Chief Executive Officer, Chief Financial Officer and Secretary, Executive General Manager, General Manager Business, Project Manager and other staff of AXIS who provide services to the Company. The Company paid insurance premiums of A$66,586 for 2008. The Company incurred A$856,703 for travel by Directors and officers, contractors, and other AXIS staff who provide services to the Company on capital raising trips, trips to the field, A$1,269,395 for investor relations consultants and A$15,329 in borrowing costs and bank fees; A$24,068 for motor vehicles costs, A$100,976 for public relations; A$91,672 for stock transfer agent services; and A$5,893 for consumables. During 2008, the Company issued shares to certain shareholders for registration statement non-performance amounting to A$660,494; paid A$213,758 for rent of offices in Melbourne, Mt Isa and New York and an apartment; A$169,489 for subscription to industry papers and services; A$45,231 for telecommunications support; A$78,927 for depreciation of non-field assets and minor equipment purchases, A$60,487 for franchise tax, general costs of A$170,507 AXIS charge A$98,528 for asset usage of plant and equipment, an administration and service fee of A$1,661,723. The overall increase in administration costs related to the increase in activity by the Company as a consequence of providing support to a field exploration program for a full financial year as the exploration projects develop, capital raising activities, preparation of regulatory filings and registration statements.
|
51
|
(vii)
|
Stock based compensation has decreased from A$5,185,743 for 2008 to A$4,259,903 (US$3,804,519) for 2009. The Company has issued options under the 2006 Incentive Option Plan in throughout 2006, 2007 and 2008. The decrease is the result of options being fully vested in prior periods and an adjustment for forfeited options. See note 7 for further details on the options issued.
|
Accordingly, the loss from operations increased from A$19,682,184 for the year ended December 31, 2008 to A$36,806,226 (US$32,871,640) for the year ended December 31, 2009.
A decrease in foreign currency exchange gain from a gain/loss of A$5,389,750 for the year ended December 31, 2008 to a foreign currency exchange loss of A$4,661,096 (US$4,162,825) in the year ended December 31, 2009 was recorded as a result of the movement in the Australian dollar versus the US dollar. On May 12, 2009, the Company made an on-market takeover offer for all of the shares in North Australian Diamonds Limited (“NADL”). The Company held 34.61% of the issued and outstanding shares at May 31, 2009, which increased to 39.38% at June 30, 2009. During the month of June 2009 the Company accounted for its 34.61%interest in NADL as an unconsolidated entity and for the month of July 2009, at the rate of 39.38%. The on market takeover of NADL finished on August 6, 2009 and since that time, the Company has consolidated the results of NADL. In accordance with US GAAP, the Company calculated the difference between the fair value of assets acquired at August 6, 2009 and the carrying value of its investment in an unconsolidated entity (NADL) at August 6, 2009 and recorded an adjustment to fair value on stepped acquisition of A$2,200,620 (US$1,965,374), for which there was no comparable amount in 2008. A net gain of A$113,739 (US$101,580) on sale of certain trading securities was incurred in the year ended December 31, 2009, (2008: $70,874) being the difference between the cost price, sale price and market value. There were no trading securities held at December 31,2009..
The loss before income taxes and equity in losses of unconsolidated entity was A$14,221,560 for the year ended December 31, 2008 compared to A$39,152,963 (US$34,967,511) for the year ended December 31, 2009.
On May 12, 2009, the Company made an on-market takeover offer for all of the shares in North Australian Diamonds Limited (“NADL”). The Company held 34.61% of the issued and outstanding shares at May 31, 2009 and as a result, accounted for its interest in NADL as an unconsolidated entity until August 6, 2009. The takeover offer concluded on August 6, 2009. At the close of the offer, the Company held 55% of the issued and outstanding shares of NADL and as a result, commenced consolidating the results of NADL from that date. In early December 2009, NADL placed shares to a third party which had the effect of diluting the Company’s interest in NADL to 47.83%. Under Australian takeover laws, the Company was prevented from purchasing further shares in NADL for a period of 6 months from the conclusion of the takeover (August 6, 2009). Accordingly, it was not until February 6, 2010 that the Company was entitled to purchase any further shares in NADL under Australian Corporations Law. Since February 6, 2010, the Company has purchased further shares in NADL and its current interest is approximately 50%. It is the Company’s intentions to continue to acquire shares and to maintain a controlling financial interest. Furthermore, management believes it has the ability to control the operations of NADL through its share ownership as well as having three of the Directors of NADL. It is management’s conclusion that the Company has a controlling financial interest in NADL and accordingly, it should continue to consolidate NADL’s results into the Company
52
During the year ended December 31, 2009, the Company’s share of the losses of the unconsolidated entity for the two months it equity accounted its investment in NADL amounted to A$345,707 (US$308,751) (2008: $nil).
There was no provision for tax in either 2009 or 2008.
The net loss was A$14,221,560 for the year ended December 31, 2008 compared to a net loss of A$39,498,670 (US$35,276,262) for the year ended December 31, 2009.
The share of the net loss attributable to the non-controlling interests of NADL amounted to A$1,612,599 (US$1,440,212) for the year ended December 31, 2009 compared to A$nil for the year ended December 31, 2008 as the acquisition of NADL which occurred in July 2009 for the first time.
The net loss attributable to Legend stockholders amounted to A$37,886,071 (US$33,886,050) for the year ended December 31, 2009 compared to A$14,221,560 for the year ended December 31, 2008.
Year ended December 31, 2008 versus Year ended December 31, 2007
As an exploration stage company, we do not have an ongoing source of revenue. Our revenue stream is normally from ad-hoc tenement disposals and interest received on cash in bank. During the year ended December 31, 2008, we received A$3,719,371 in interest on funds in the bank (2007: A$22,183) and other income of A$6,534 (2007: A$nil). The increase in interest income is a result of the higher level of cash reserves we held during the year following the equity raisings from Atticus in December 2007, from the share placement arranged by BMO in June 2008 and following the exercise of options by IFFCO in July 2008.
Costs and expenses increased during the year from A$8,539,934 for the year ended December 31, 2007 to A$23,337,215 for the year ended December 31, 2008.
The main components of costs and expenses are as follows:-
|
(i)
|
An increase in exploration expenditure written off from A$5,132,000 in 2007 to A$8,780,037 in 2008. Our accounting policy is to expense all exploration costs (including costs associated with the acquisition of tenement interests) as incurred. During 2008, we conducted a significant drilling program at our phosphate project in Queensland and a detailed sampling program in the Northern Territory. On our Queensland phosphate project, we also commenced early stage investigations into a mining operation. The costs included drilling, assaying, camp costs, aerial surveying, geological/geophysical contractors, salaries and associated costs for contract field staff, travel, accommodation, meals and tenement holding costs. During 2008, we incurred A$3,729,592 in costs for exploration drilling on our tenements in the Northern Territory. The costs included drilling, helicopter support, geological/geophysical contractors, salaries and associated costs for contract field staff, travel, accommodation, meals and tenement holding costs. During 2007, we used drillers almost continuously on our exploration program. In December 2007, we entered into agreements to purchase exploration permits in Queensland. The purchase price of A$1,318,000 included cash of A$800,000, and shares with a value of A$518,000. The total cost has been expensed as part of exploration costs. We have spent A$84,408 since entering into the agreements on purchasing and reviewing data for the permits.
|
53
|
(ii)
|
An decrease in interest expense from A$62,196 in 2007 to A$32,715 in 2008. During 2008, we incurred interest on the camp lease and motor vehicle finance leases. During 2007, we incurred A$25,235 for interest on the camp lease; A$1,807 motor vehicle finance lease; A$14,683 charged by AXIS on outstanding amounts owing under the Service Agreement, which was repaid in June 2007; A$16,774 charged by Astro on amounts owed for exploration expenditure incurred by Astro, which was repaid in March 2007, and A$3,697 for short term funds used to maintain the Company’s activities. AXIS provides management and geological services to us pursuant to a Service Agreement dated December 2004. AXIS and Astro charged interest at a rate of 10.10% during 2007.
|
|
(iii)
|
An increase in aircraft maintenance costs from A$nil in 2007 to A$278,826 in 2008. The Company purchased a Lear jet from AXIS in August 2008 to utilize in its field operations at a price of A$1,210,000 (A$1,100,000 which was based on an external valuation plus 10% GST with GST being refundable from the Australian Government subject to compliance with tax laws) and has incurred operating costs for the jet since that time. There was no comparable cost in 2007.
|
|
(iv)
|
An increase in legal, professional and accounting from A$213,063 for 2007 to A$707,444 for 2008. During 2008, we incurred legal expenses of A$518,273 for general legal work including stock transfer matters, regulatory filings, stock option plans, native title and environmental approvals, asset acquisitions, and Form S-1 Registration Statements; audit fees of A$176,198 for professional services in relation to financial statements, the quarterly Form 10-Qs, Form 10-K, and Form S-1; and taxation fees of $11,492. All fees have increased from 2007 as a result of increased activity by the Company as a consequence of the acquisition of mining tenements, capital raising activities and preparation of the Form SB-2 Registration Statement. During 2007, we incurred legal expenses of A$91,483 for general legal work including stock transfer matters, regulatory filings, stock option plans and Form SB-2 Registration Statement; audit fees of A$62,049 for professional services in relation to financial statements, the quarterly Form 10-QSBs, Form 10-KSB, Form 10-K and Form SB-2; and A$59,531 for a stock transfer agent and regulatory filing fees.
|
|
(v)
|
A net gain of A$70,874 on revaluation of securities was incurred at December 2008 on certain trading securities purchased during 2008 being the difference between the costs price and market value at December 31, 2008. There were no trading securities held at December 31, 2007.
|
|
(vi)
|
An increase in impairment of investment from A$nil in 2007 to A$326,526 in 2008. On February 27, 2008, the Company entered into a Share Sale Agreement whereby the Company agreed to purchase all of the issued and outstanding shares of Teutonic Minerals Pty Ltd. As a result, Teutonic became a subsidiary of the Company from that date. Teutonic held an application for a mineral licence over phosphate in the Georgina Basin in the State of Queensland, Australia. The consideration payable to the vendors was A$300,000, and the Company granted the vendors a 1% gross revenue royalty from production from the mineral licence and incurred legal costs of A$26,526.The mineral licence application held by Teutonic was withdrawn on March 17, 2008 and replaced by a mineral application lodged by the Company. Teutonic had no other assets or liabilities. As at December 31, 2008 the net assets and liabilities acquired by the Company have no value. The consideration and legal costs of A$326,526 paid by the Company are included as impairment of investment in the Statement of Operations.
|
54
|
(vii)
|
An increase in administrative costs from A$2,753,365 in 2007 to A$8,096,798 in 2008. During 2008, the corporate management and service fees charged to us by AXIS was A$5,413,203 . AXIS charged us A$2,459,665 for Directors’ fees, salaries and salary related matters incurred in behalf of the Company, which relates to our share of salaries paid to the President & Chief Executive Officer, Chief Financial Officer and Secretary, Executive General Manager, General Manager Business, Project Manager and other staff of AXIS who provide services to the Company. The Company paid insurance premiums of A$66,586 (US$45,991) for 2008. The Company incurred A$856,703 for travel by Directors and officers, contractors, and other AXIS staff who provide services to the Company on capital raising trips, trips to the field, A$1,269,395 for investor relations consultants and A$15,329 n borrowing costs and bank fees; A$24,068 for motor vehicles costs, A$100,976 for public relations; A$91,672 for stock transfer agent services; and A$5,893 for consumables. During 2008, the Company issued shares to certain shareholders for registration statement non-performance amounting to A$660,494; paid A$213,758 for rent of offices in Melbourne, Mt Isa and New York and an apartment; A$169,489 for subscription to industry papers and services; A$45,231 for telecommunications support; A$78,927 for depreciation of non-field assets and minor equipment purchases, A$60,487 for franchise tax, general costs of A$170,507. AXIS charge A$98,528 for asset usage of plant and equipment, an administration and service fee of A$1,661,723. The overall increase in administration costs related to the increase in activity by the Company as a consequence of providing support to a field exploration program for a full financial year as the exploration projects develop, capital raising activities, preparation of regulatory filings and registration statements. During 2007, the corporate management and service fees charged to us by AXIS was A$410,416. AXIS charged us A$454,107 for Directors’ fees, salaries and salary related matters incurred in behalf of the Company, which relates to our share of salaries paid to the President & Chief Executive Officer, Chief Financial Officer and Secretary, General Manager Development and Resources, General Manager Business and other staff of AXIS who provide services to the Company. One independent Director charged directly to the Company the amount of A$20,000 for 2007. The Company paid insurance premiums of A$35,100 for 2007, incurred A$282,648 for travel by Directors and officers on capital raising trips, A$67,867 for travel of Directors, officers and support contractors to the field, A$534,268 for investor relations consultants and A$36,595 for tax matters, employee option valuation and exploration tenement maintenance; and A$13,443 for postage and freight charges. During 2007, the Company issued shares to certain shareholders for registration statement non-performance amounting to A$604,805; A$111,197 for New York rent; A$49,256 for subscription to industry papers and services; A$15,564 for telecommunications support; A$14,751 for website maintenance; A$15,601 for depreciation of non-field assets and minor equipment purchases, A$8,238 for franchise tax, general costs of A$10,791 and A$8,791 for printing and stationery. AXIS charge A$120,000 for asset usage of plant and equipment of which $60,000 was charged to costs in 2007 and there was no comparable amount for 2006. The overall increase in administration costs related to the increase in activity by the Company as a consequence of providing support to a field exploration program from mid February 2007 to November 2007, capital raising activities, preparation of regulatory filings and Form SB-2 Registration Statement.
|
|
(viii)
|
Stock based compensation has increased from A$375,740 for 2007 to A$5,185,743 for 2008. The Company has issued options under the 2006 Incentive Option Plan in throughout 2006, 2007 and 2008. The increase is a result of additional options issued, amortization of certain options for a full 12 month period and includes an adjustment for forfeited options. See note 7 for further details on the options issued.
|
Accordingly, the loss from operations increased from A$8,517,751 for the year ended December 31, 2007 to A$19,682,184 for the year ended December 31, 2008.
There was no provision for tax in either 2008 or 2007.
55
The net loss amounted to A$14,221,560 for the year ended December 31, 2008, compared to a net loss of A$8,638,129 for the year ended December 31, 2007.
The net loss per common equivalent share in 2008 was A$0.07 (US$0.05) compared with a net loss with a common equivalent share price of A$0.06 in the prior year.
Liquidity and Capital Resources
We funded our operations through fund raisings noted below.
As of December 31, 2009, the Company has cash of A$72,666,088 (US$64,898,082).
During fiscal 2009, net cash used in operating activities was A$30,508,919 (US$27,247,516), as compared to A$15,359,851 in 2008, reflecting the commencement of the Company’s phosphate exploration activities in the third quarter of 2008, which intensified in 2009 and the increase in the level of diamond exploration in 2009. During fiscal 2009, net cash used in investing activities was A$24,632,260 (US$21,999,072) and A$5,677,315 in 2008. The major component in 2009 was the cost of the investment in unconsolidated entities of A$13,082,295 (US$11,683,798) (2008 $nil) and the investment in the subsidiary of A$9,198,412 (US$8,215,102) (2008 $nil); additions to property, plant and equipment and motor vehicles of A$3,356,338 (US$2,997,546) (2008 A$4,640,717); and we received A$1,272,343 (US$1,136,330)(2008 $nil) from the sale of investments. In 2009, capital expenditure includes A$nil (2008 A$1,270,869) for a Lear jet, A$1,720,847 (2008 A$2,536,607) for land, buildings and associated equipment and the purchase of motor vehicles, non cash purchase of motor vehicles under capital finance agreements of A$87,149 (2008 A$705,841) and plant upgrade at Merlin of A$579,228 (2008 A$nil). During fiscal 2009, net cash provided by financing activities was A$13,190,827 (US$11,780,728) which represented the proceeds of private placements offering of shares of Common Stock of our subsidiary of A$13,542,008 (US$12,094,367) (2008 A$nil) less costs of A$20,342 (US$18,167) and we repaid A$353,944 (US$136,107) under finance leases. At December 31, 2009 and 2008,, the Company held US$930,857 and US$4,213,003 respectively in interest bearing accounts in US banking institutions. During the year, the Company had significant US$ cash balances which when converted to Australian dollars results in a large foreign exchange loss.
We plan to continue our exploration and pre-development program throughout 2010 and anticipate spending A$16.3 million on exploration and pre-development and A$10.4 million on administrative costs. However, if exploration and pre-development results are positive, we believe that we have the cash resources or will be able to raise additional equity capital in order to progress our exploration and development program at a faster rate.
On December 12, 2007, we entered into a Subscription Agreement with Atticus European Fund Ltd. and Green Way Managed Account Series Ltd. in respect of its segregated account, Green Way Portfolio D (collectively “Atticus”) pursuant to which the Company issued in a private placement transaction (the “Private Placement”) to Atticus an aggregate of 18,750,000 shares of Common Stock at a price of US$0.80 per share for an aggregate purchase price of US$15,000,000 (A$16,924,292).
In June 2008, the Company completed a private placement offering (the “BMO Offering”) of 42,000,000 share of common stock to institutional investors at a purchase price of US$2.50 per share for total proceeds of A$110,028,293 (US$105,000,000). BMO Nesbitt Burns Inc., Wellington West Capital Markets Inc. and BBY Limited acted as agents for the offering and received a commission of 5% of the offering proceeds and two year warrants to purchase 840,000 shares of common stock at an exercise price of US$2.50 per share.
Effective July 14, 2008, the Company entered into a Shares Option Agreement with the Indian Farmers Fertilizer Cooperative Limited (“IFFCO”) to finance the Company’s operations.
56
Under the Share Options Agreement, IFFCO received options to purchase 30 million shares of Common Stock of the Company on the following terms:
|
a.
|
5,000,000 options, at an exercise price of US$2.50 per share and expiring 60 days from July 11, 2008;
|
|
b.
|
8,000,000 options, at an exercise price of US$3.00 per share and expiring 12 months from July 11, 2008;
|
|
c.
|
8,000,000 options, at an exercise price of US$3.50 per share and expiring 18 months from July 11, 2008;
|
|
d.
|
9,000,000 options, at an exercise price of US$4.00 per share and expiring 24 months from July 11, 2008.
|
During the third quarter of 2008, the 5,000,000 options issued to IFFCO, at an exercise price of US$2.50 per share and expiring 60 days from July 11, 2008 were exercised on August 11, 2008 and pursuant to the Share Options Agreement, received a 1.2% discount on the exercise price. The total amount received was A$13,672,091 (US$12,350,000) and the Company issued 5,000,000 shares of common stock. The 8,000,000 options expiring 12 months after July 11, 2008 and the 8,000,000 options expiring 18 months after July 11, 2008 were not exercised and lapsed.
The total remaining proceeds to be received upon the exercise of the options amount to US$36 million, and when exercised will be utilized to fund expenditure related to the Company’s phosphate project.
The Company accounts for these options as a financing activity and accordingly, records all proceeds upon exercise of such options within stockholders’ equity.
The Share Options Agreement also gives IFFCO a pre-emptive right to acquire its pro rata share of future issuances of Common Stock by the Company, with certain exceptions.
Pursuant to the Shares Option Agreement, the parties agreed to enter into a long-term rock off-take agreement, which shall be separately negotiated but which shall be based on certain principles which were previously described in the Company’s Quarterly Report of Form 10-Q for the fiscal quarter ended June 30, 2008.
Between July 1, 2008 and December 31, 2008, 281,200 options were exercised using the cashless exercise feature and the Company issued 247,774 shares of common stock.
Between July 1, 2008 and December 31, 2008, an additional 327,600 options were exercised for US$0.111, total amount received A$38,950 (US$36,364) and the Company issued 327,600 shares of common stock.
Between January 1, 2009 and December 31, 2009, an additional 18,000 options were exercised for US$0.111, total amount received A$2,763 (US$1,998) and the Company issued 18,000 shares of common stock.
The Company is considered to be an exploration stage company, with no significant revenue, and is dependent upon the raising of capital through placement of its Common Stock, preferred stock or debentures. In the event the Company is unsuccessful in raising such capital, it may never commence active operations.
|
Contractual
Obligations
|
Total
A$000’s
|
Less than
1 year
A$000’s
|
1-3
Years
A$000’s
|
3-5
Years
A$000’s
|
More than 5 years
A$000’s
|
|
Long term debt obligations
|
-
|
-
|
-
|
-
|
-
|
|
Capital lease obligations
|
297
|
288
|
9
|
-
|
-
|
|
Operating lease obligations
|
649
|
407
|
242
|
-
|
|
|
Purchase obligations
|
4,077
|
1,718
|
|||
|
Other long term liabilities reflected on the consolidated balance sheet under GAAP
|
936
|
83
|
161
|
161
|
531
|
|
1,882
|
4,855
|
2,130
|
161
|
531
|
57
Impact of Recent Accounting Pronouncements
For a discussion of the impact of recent accounting pronouncements on the Company’s annual financial statements, see Note 2 to the Company’s Financial Statements which are included herein.
|
Quantitative and Qualitative Disclosures About Market Risk.
|
At December 31, 2009, the Company had no outstanding Loan Facilities.
The Company reports in A$ and holds cash denominated in US dollars. At December 31, 2009, this amounted to US$9,656,512 (A$10,812,353). A change in the exchange rate between the A$ and the US$ will have an effect on the amounts reported in the Company’s consolidated financial statements, and create a foreign exchange gain or loss. A movement of 1% in the A$ versus the US$ exchange rate will have a A$108,124 effect on the consolidated balance sheet and statement of operations. The balance of cash of A$61,853,735 is held in Australian dollars.
The Company holds trading securities in US listed corporations which are traded in US$. At December 31, 2009, this amounted to US$446,348 (A$499,774). A change in the exchange rate between the A$ and the US$ will have an effect on the amounts reported in the Company’s consolidated financial statements, and create a foreign exchange gain or loss. A movement of 1% in the A$ versus the US$ exchange rate will have a US$4,463 (A$4,998) effect on the consolidated balance sheet and statement of operations.
The Company holds an investment in a Fund denominated in euros. At December 31, 2009, this amounted to €1,700,000 (A$2,900,000). A change in the exchange rate between the A$ and the € will have an effect on the amounts reported in the Company’s consolidated financial statements, and create a foreign exchange gain or loss. A movement of 1% in the A$ versus the € exchange rate will have a A$29,000 effect on the consolidated balance sheet and statement of operations.
|
Financial Statements and Supplementary Data.
|
See the Financial Statements beginning on page F-1.
|
Changes in and Disagreements With Accountants on Accounting and Financial Disclosure.
|
There have been no changes in accountants or any disagreements with accountants on any matter of accounting principles or practices or financial statement disclosures during the two years ended December 31, 2009.
|
Controls and Procedures.
|
Disclosure Controls and Procedures
Our principal executive officer and our principal financial officer evaluated the effectiveness of our disclosure controls and procedures (as defined in Rule 13a-15(e) and 15d-15(e) of the Securities Exchange Act of 1934 as amended) as of the end of the period covered by this report. Based on that evaluation, such principal executive officer and principal financial officer concluded that, the Company’s disclosure control and procedures were effective as of the end of the period covered by this report at the reasonable level of assurance.
58
Internal Control over Financial Reporting
|
(a)
|
Management’s Annual Report on Internal Control over Financial Reporting
|
Management of the Company is responsible for establishing and maintaining effective internal control over financial reporting. The Company’s internal control system was designed to provide reasonable assurance regarding the preparation and fair presentation of published financial statements. All internal control systems, no matter how well designed, have inherent limitations. Therefore, even those systems determined to be effective can provide only reasonable assurance regarding the reliability of financial statement preparation and presentation.
Management assessed the Company’s internal control over financial reporting as of December 31, 2009. This assessment was based on criteria for effective internal control over financial reporting established in Internal Control - Integrated Framework issued by the Committee of Sponsoring Organizations of the Treadway Commission (the “COSO criteria”). Based on this assessment, management has concluded that the Company’s internal control over financial reporting was effective as of December 31, 2009.
PKF, Certified Public Accountants, A Professional Corporation, the Company’s independent registered public accounting firm, has issued their report on their audit of the Company’s internal control over financial reporting as of December 31, 2009, a copy of which is included herein.
|
(b)
|
Attestation Report of the Independent Registered Public Accounting Firm
|
Report of Independent Registered Public Accounting Firm
To the Board of Directors and Stockholders of
Legend International Holdings, Inc.
We have audited Legend International Holdings, Inc.’s internal control over financial reporting as of December 31, 2009, based on criteria established in Internal Control - Integrated Framework issued by the Committee of Sponsoring Organizations of the Treadway Commission (the “COSO criteria”). Legend International Holdings, Inc.’s management is responsible for maintaining effective internal control over financial reporting and for its assessment of the effectiveness of internal control over financial reporting, included in the accompanying Management’s Annual Report on Internal Control over Financial Reporting. Our responsibility is to express an opinion on the Company’s internal control over financial reporting based on our audit.
We conducted our audit in accordance with the standards of the Public Company Accounting Oversight Board (United States). Those standards require that we plan and perform the audit to obtain reasonable assurance about whether effective internal control over financial reporting was maintained in all material respects. Our audit included obtaining an understanding of internal control over financial reporting, assessing the risk that a material weakness exists, testing and evaluating the design and operating effectiveness of internal control, based upon the assessed risk, and performing such other procedures as we considered necessary in the circumstances. We believe that our audit provides a reasonable basis for our opinion.
59
A company’s internal control over financial reporting is a process designed to provide reasonable assurance regarding the reliability of financial reporting and the preparation of financial statements for external purposes in accordance with generally accepted accounting principles. A company’s internal control over financial reporting includes those policies and procedures that (1) pertain to the maintenance of records that, in reasonable detail, accurately and fairly reflect the transactions and dispositions of the assets of the company; (2) provide reasonable assurance that transactions are recorded as necessary to permit preparation of financial statements in accordance with generally accepted accounting principles, (3) receipts and expenditures of the company are being made only in accordance with authorizations of management and directors of the company; and (4) provide reasonable assurance regarding prevention or timely detection of unauthorized acquisition, use, or disposition of the company’s assets that could have a material effect on the financial statements.
Because of its inherent limitations, internal control over financial reporting may not prevent or detect misstatements. Also, projections of any evaluation of effectiveness to future periods are subject to the risk that controls may become inadequate because of changes in conditions, or that the degree of compliance with the policies or procedures may deteriorate.
In our opinion, Legend International Holdings, Inc. maintained, in all material respects, effective internal control over financial reporting as of December 31, 2009 based on the COSO criteria.
We also have audited, in accordance with the standards of the Public Company Accounting Oversight Board (United States), the consolidated balance sheet of Legend International Holdings, Inc as of December 31, 2009 and 2008, and the related consolidated statements of operations, stockholders’ equity (deficit) and cash flows for the years ended December 31, 2007, 2008 and 2009 and the cumulative amounts from inception, January 5, 2001 through December 31, 2009 and our report dated March 15, 2010 expressed an unqualified opinion thereon.
| New York, NY | PKF |
| March 15, 2010 | Certified Public Accountants A Professional Corporation |
|
(c)
|
Changes in Internal Control Over Financial Reporting
|
There have been no changes in internal control over financial reporting during the Company’s fourth fiscal quarter.
|
(d)
|
Other
|
We believe that a controls system, no matter how well designed and operated, can not provide absolute assurance that the objectives of the controls system are met, and no evaluation of controls can provide absolute assurance that all control issues and instances of fraud, if any, within a company have been detected. Therefore, a control system, no matter how well conceived and operated, can provide only reasonable, not absolute, assurance that the objectives of the control system are met. Our disclosure controls and procedures are designed to provide such reasonable assurance of achieving our desired control objectives, and our principal executive officer and principal financial officer have concluded, as of December 31, 2009, that our disclosure controls and procedures were effective in achieving that level of reasonable assurance.
|
Other Information.
|
None.
60
|
Directors, Executive Officers and Corporate Governance.
|
The following table sets out certain information concerning the Company’s executive officers and directors.
|
Name
|
Age
|
Position(s) Held
|
|
Joseph Gutnick
|
57
|
Chairman of the Board
|
|
President, Chief Executive Officer and Director.
|
||
|
David Tyrwhitt
|
71
|
Director
|
|
Dr U.S Awasthi
|
64
|
Director
|
|
Dr Allan Trench
|
46
|
Director
|
|
Henry Herzog
|
68
|
Director
|
|
Peter Lee
|
52
|
Secretary, Chief Financial Officer and Principal Accounting Officer.
|
|
Craig Michael
|
32
|
Executive General Manager
|
|
Edward Walker
|
38
|
Project Manager
|
Director Qualifications
The following paragraphs provide information as of the date of this report about each director as well as about each executive officer. The information presented includes information each director has given us about his age, all positions he holds, his principal occupation and business experience for the past five years, and the names of other publicly-held companies of which he currently serves as a director or has served as a director during the past five years. In addition to the information presented below regarding each director’s specific experience, qualifications, attributes and skills that led our Board to the conclusion that he should serve as a director, we also believe that all of our directors have demonstrated an ability to exercise sound judgment, as well as a commitment of service to Legend and our Board. Finally, we value their significant experience in the mining industry and other public and board committees.
Joseph Gutnick
Mr. Gutnick has been Chairman of the Board, President and Chief Executive Officer since November 2004 and has been Chairman of the Board, President and Chief Executive Officer of numerous public listed companies in Australia and the USA specialising in the mining sector since 1980. Mr. Gutnick is currently Chairman of the Board, President and Chief Executive Officer of Golden River Resources Corporation, Northern Capital Resources Corporation, Yahalom International Resources Corporation, ProIndia International, Inc. and Aurum, Inc., US corporations; and Executive Chairman and Managing Director of North Australian Diamonds Limited, Top End Uranium Limited and Quantum Resources Limited, all listed on Australian Securities Exchange. He has previously been a Director of Hawthorn Resources Limited, Astro Diamond Mines NL, Acadian Mining Corporation and Royal Roads Corporation in the last five years. Mr. Gutnick was previously been a Director of the World Gold Council. He is a Fellow of the Australasian Institute of Mining & Metallurgy and the Australian Institute of Management and a Member of the Australian Institute of Company Directors.
61
Mr. Gutnick’s extensive experience in leading teams in building and operating major mining operations in Australia as well as his experience in founding and serving as the chief executive officer and chairman of a number of public companies will provide our Board with valuable executive leadership and management experience.
Mr. Gutnick devotes a majority of his business time to the affairs of the Company.
David Tyrwhitt
Dr Tyrwhitt was appointed a Director in March 2005. He is a geologist, holding a Bachelor of Science and PhD degrees and has 50 years experience in mineral exploration and management development and operation of gold and diamond mines in Australia. Dr Tyrwhitt has been a Director of numerous public listed companies in Australia in the mining industry and is currently a Director of Hawthorn Resources Limited, Quantum Resources Limited, Golden River Resources Corp, a Delaware corporation (GORV.OB) and Northern Capital Resources Corp., a Delaware corporation since 2008. In the last five years, he has also been a Director of Astro Diamond Mines NL.
Dr. Tyrwhitt’s experience in working on mining projects in Australia and technical skills will provide our Board with an Australian perspective to mining operations.
U.S. Awasthi
Dr. Awasthi was appointed a Director in August 2008. Dr. Awasthi has been the Managing Director of IFFCO since February 1993, the largest producer and seller of fertilizers in India. Dr. Awasthi has worked in various pivotal positions in IFFCO & KRIBHCO and acquired all-round expertise in planning and execution of fertilizer plants and was closely associated with the construction of Hazira as well as Aonla Projects. In 1986, he joined Pyrites, Phosphates & Chemicals Limited (PPCL) as its Chairman and Managing Director. He also held additional charge as Chairman & Managing Director of Rashtriya Chemicals & Fertilizers Ltd. (RCF) from April 1991 to March 1992. Dr. Awasthi was the Chairman of the Fertilizer Association of India (FAI), New Delhi, during 1994-96. He held the position of President, International Fertilizer Industry Association (IFA), Paris during 1997-99. Dr. Awasthi has over 30 papers to his credit and has co-authored a book ‘Fertilizer Industry in India’.
Dr. Awasthi’s experience in the international fertilizer markets will provide our Board with a valuable perspective on the development and operation of fertilizer plants and marketing of fertilizer products.
Dr. Trench was appointed a Director in August 2008. Dr Allan Trench is a geologist/geophysicist and business management consultant with approximately 20 years experience within the Australian resources sector across a number of commodity groups and is currently Chairman of the Board and a Director of Acadian Mining Corporation (ADA:TSX), a Director of Navigator Resources Ltd, Pioneer Resources Limited and Venturex Resources Limited, and was a Director of Heron Resources Ltd during the past five years. Dr Trench was the Exploration Manager for WMC for the Leinster-Mt Keith region and then managed a number of exploration companies associated with Mr. Joseph Gutnick before joining McKinsey & Company as a management consultant. In his role at McKinsey, Dr Trench was an advisor to a number of large international resources companies on strategic, organization and operational issues. From 2004 to 2006 Dr Trench was employed in a contract role as corporate strategist end benchmarking manager at Woodside Energy, helping to building Woodside’s capability in strategy, benchmarking and performance improvement across its global asset portfolio. Following this, he was employed by the CRU Group and was firstly responsible for global copper research managing a team of 12 analysts and more recently as Regional Director - Australasia. Dr Trench also serves as a non executive director for two other resource companies and currently holds the title of Adjunct Professor of Mineral Economics & Mine Management at the WA School of Mines, Curtin University.
62
Dr. Trench’s experience in working on complex mining projects internationally and Australia and technical skills will provide our Board with a valuable perspective on conducting business in international jurisdictions.
Henry Herzog
Mr. Henry Herzog has more than 40 years of corporate and management experience. He has been a Director of the Company since August 2008. Mr. Herzog has served in various positions as President, Vice President or Director of a number of publicly listed companies in Australia and the United States, predominantly in the mining sector and is currently also a Director of North Australian Diamonds Limited (NAD:ASX). Mr. Herzog was responsible for the restructuring and reorganization of several publicly listed companies including Bayou International Limited, now known as Golden River Resources Corporation (GORV.OB), where he served as its President and Chief Executive Officer from 1986-1988 and as a Vice President from 1988-1989. For at least the past five years, Mr. Herzog has also been managing a number of private investment entities. He is also a member of the Board of Trustees of a non-profit college of higher education.
Peter Lee
Mr. Lee has been Chief Financial Officer since March 2005 and Secretary since November 2004. He is a Director, Chief Financial Officer and Secretary of Golden River Resources Corp, a Delaware corporation (GORV.OB), Chief Financial Officer and Secretary of Aurum, Inc. (AURM.OB), ProIndia International, Inc. (PNDI.OB), Northern Capital Resources Corp and Yahalom International Resources Corp, and Chief Financial Officer and Company Secretary of North Australian Diamonds Limited, Top End Uranium Ltd and Quantum Resources Limited, all listed on Australian Securities Exchange. Mr Lee is also President, Chief Executive Officer and Director of Acadian Mining Corporation (ADA:TSX) and Chairman of the Board and Director of Royal Roads Corp (RRO:TSX-V). Mr. Lee is a Member of the Institute of Chartered Accountants in Australia, a Fellow of Chartered Secretaries Australia Ltd., a Member of the Australian Institute of Company Directors and holds a Bachelor of Business (Accounting) from Royal Melbourne Institute of Technology. He has over 25 year's commercial experience and is currently Chief Financial Officer and Company Secretary of several listed public companies in Australia.
Mr. Lee devotes a majority of his business time to the affairs of the Company.
Craig Michael
Mr. Michael has been Executive General Manager of the Company since September 2007 and has more than nine years experience in the mining and resources industry and is a Director of Aurum, Inc. (AURM:OB) and North Australian Diamonds Limited (NAD:ASX). From February 2004 to September 2007, he was employed by Oxiana Ltd where he was based in Laos in a Supervisor/Trainer role, both as a Mine Geologist and Resource Geologist at the Sepon Copper Gold Project. He was responsible for the geological interpretation of the Khanong copper-gold deposit and the surrounding oxide and primary gold deposits. In conjunction with training the national geologic staff in all mining and resource geology functions Mr. Michael also conducted resource estimates for public reporting. Prior to his time with Oxiana, he was a Mine Geologist at Sons of Gwalia’s Carosue Dam Gold Project in Western Australia where he also conducted his honours thesis on their flagship Karari gold deposit.
Edward Walker
Mr. Walker has been Project Manager of the Company since October 2008. He has acquired extensive international experience in the mining and water sectors via a number of senior engineering and project manager roles in international organizations, including as Principal Engineer for Parsons Brinkerhoff Australia from April 2007 to October 2008 and prior to that was with Bahia Mineracao Limitada as Senior Project Manager. Mr. Walker spent over 10 years in senior engineering roles in Australia and the United Kingdom before spending two years as a senior project manager of an Iron Ore Mining project run by Brazilian company Bahia Mineração Limitada (BML). He then moved to a multi-disciplinary engineering firm Parsons Brinkerhoff as a Principal Engineer responsible for business development and delivery of client projects. Mr Walker has a Bachelor of Engineering (Civil) from Swinburne University of Technology and an Executive MBA from the Business School of São Paulo.
63
Involvement on Certain Material Legal Proceedings During the Last Ten Years
No director, officer, significant employee or consultant has been convicted in a criminal proceeding, exclusive of traffic violations. No director, officer, significant employee or consultant has been permanently or temporarily enjoined, barred, suspended or otherwise limited from involvement in any type of business, securities or banking activities. No director, officer or significant employee has been convicted of violating a federal or state securities or commodities law.
Mr. Gutnick was formerly the Chairman of the Board, Dr. Tyrwhitt was formerly an independent Director and Mr. Lee was formerly Company Secretary of Centaur Mining & Exploration Ltd., an Australian corporation, which commenced an insolvency proceeding in Australia in March 2001.
Board of Directors
Our Certificate of Incorporation provides that there must be at least one Director of the Company. Our Board of Directors currently consists of five directors.
Directors need not be stockholders of the Company or residents of the State of Delaware. Directors are elected for an annual term and generally hold office until the next Directors have been duly elected and qualified. Directors may receive compensation for their services as determined by the Board of Directors. A vacancy on the Board may be filled by the remaining Directors even though less than a quorum remains. A Director appointed to fill a vacancy remains a Director until his successor is elected by the Stockholders at the next annual meeting of Shareholder or until a special meeting is called to elect Directors.
The executive officers of the Company are appointed by the Board of Directors. There are no family relationships between any Directors or executive officers of the Company other than as disclosed.
Our Board of Directors consists of five members, of whom three would meet the independence requirement of the NASDAQ Stock Market.
The Company encourages all Directors to attend the Annual Meeting of stockholders, either in person or by telephone. Mr. Gutnick attended the 2009 Annual Meeting via video conference, and Dr Tyrwhitt and Mr. Herzog attended the 2009 Annual Meeting. Dr Awasthi was unavailable due to business commitments.
Nominating Committee
At a meeting of the Board of Directors on August 12, 2008, it was resolved that Dr. Allan Trench, Dr. David Tyrwhitt and Mr. Henry Herzog be appointed to the Nominating Committee and that Dr. David Tyrwhitt be the Chair of the Committee. The Nominating Committee has authority and responsibilities as vested in it by the Board of Directors at a Directors Meeting held on June 27, 2008
Audit and Compensation Committees
At a meeting of the Board of Directors on August 12, 2008, it was resolved that Dr. Allan Trench, Dr. David Tyrwhitt and Mr. Henry Herzog be appointed to the Audit Committee and the Compensation Committee and that Dr. Allan Trench be the Chair of both of the Committees. It is the opinion of the Board of Directors that Dr. David Tyrwhitt, Dr. Allan Trench and Mr. Henry Herzog are independent directors as defined in Rule 10A-3 of the Securities Exchange Act of 1934. In addition, the Board believes that Dr. David Tyrwhitt, Dr. Allan Trench and Mr. Henry Herzog would meet the director independence requirements of the NASDAQ Stock Market if we were listed on such Market.
64
Code of Ethics
We have adopted a Code of Conduct and Ethics and it applies to all Directors, Officers and employees. A copy of the Code of Conduct and Ethics will be posted on our website and we will provide a copy to any person without charge. If you require a copy, you will be able to download it from our website at www.lgdi.net or alternatively, contact us by facsimile or email and we will send you a copy.
Stockholder Communications with the Board
Stockholders who wish to communicate with the Board of Directors should send their communications to the Chairman of the Board at the address listed below. The Chairman of the Board is responsible for forwarding communications to the appropriate Board members.
Mr. Joseph Gutnick
Legend International Holdings, Inc.
PO Box 6315 St Kilda Road
Central Melbourne, Victoria 8008 Australia
Section 16(a) Beneficial Ownership Reporting Compliance
Pursuant to Section 16(a) of the Securities Exchange Act of 1934, our Directors, executive officers and beneficial owners of more than 10% of the outstanding Common Stock are required to file reports with the Securities and Exchange Commission concerning their ownership of and transactions in our Common Stock and are also required to provide to us copies of such reports. Based solely on such reports and related information furnished to us, we believe that in fiscal 2009 all such filing requirements were complied with in a timely manner by all Directors and executive officers and 10% stockholders.
|
Executive Compensation.
|
Compensation Discussion and Analysis
Overview
Our executive compensation program for our Chief Executive Officer and Chief Financial Officer, and our other executive officers (including up to three of our executive officers whose total compensation exceeds $100,000 per annum), whom we collectively refer to as our named executive officers, consists of (i) base salary and (ii) incentive compensation in the form of cash bonuses and (iii) equity-based incentive compensation awards under the Company’s 2006 Equity Incentive Plan. Our executive compensation program has historically included and continues to include very few perquisites. In August 2008 the Company’s Board of Directors appointed a Compensation Committee which is responsible for reviewing and approving the compensation paid by us to the named executive officers. Prior thereto, compensation decisions were determined by the full Board of Directors. The services of our named executive officers are provided to us under a Service Agreement with AXIS Consultants Pty Ltd. Cash compensation is paid to the named executive officers by AXIS and is reimbursed to AXIS by the Company.
Compensation Objectives
The Compensation Committee’s philosophy is to establish executive compensation policies linked to the creation of stockholder value. Our compensation program is designed to:
65
|
|
•
|
Adequately and fairly compensate executive officers in relation to their responsibilities, capabilities and contributions to the Company and in a manner that is commensurate with compensation paid by companies of comparable size and at a comparable stage of development within our industry;
|
|
|
•
|
Align the interests of the executive officers with those of the stockholders with respect to short-term operating goals and long-term increases in the value of our common stock; and
|
|
|
•
|
Provide a strong emphasis on equity-based compensation and equity ownership, creating a direct link between stockholder and management interests.
|
These objectives serve as the guiding principles for all the decisions the Compensation Committee makes with respect to the amount and type of compensation payable to our named executive officers.
Mix of Compensation Elements
Our executive compensation during fiscal 2009 consisted of base salary, cash bonuses, grants under our 2006 Equity Incentive Plan, benefits and perquisites. We do not have any formal or informal policy or target for allocating compensation between long-term and short term compensation, between cash and non-cash compensation or among the different forms of non-cash compensation. Similarly, compensation decisions regarding one compensation component do not directly affect decisions regarding other compensation elements. For example, an increase to the base salary of a named executive officer does not require a formulaic decrease to another element of the executive’s compensation. Instead, we have determined subjectively on a case-by-case basis the appropriate level and mix of the various compensation components.
We believe that together all of our compensation components provide a balanced mix of base compensation and compensation that is contingent upon each executive officer’s individual performance and our overall performance. A goal of the compensation program is to provide executive officers with a reasonable level of security through base salary and benefits, while rewarding them through incentive compensation to achieve business objectives and create stockholder value. We believe that each of our compensation components is critical in achieving this goal. Base salaries provide executives with a base level of monthly income and security. Annual cash bonuses motivate executives to drive our development goals. Long-term equity incentive awards link the interests of our executives with our stockholders, which motivates our executives to create stockholder value. In addition, we want to ensure that our compensation programs are appropriately designed to encourage executive officer retention, which is accomplished through all of our compensation elements.
Components of Compensation
Base Salary. The base salaries for the Company’s named executive officers for the year ended December 31, 2009 were established in fiscal 2008 and reviewed effective June 2008 by AXIS with the consultation and approval of the Company’s Board of Directors. The services of our named executive officers are provided to us under a Service Agreement with AXIS Consultants Pty Ltd. Cash compensation is paid to the named executive officers by AXIS and is reimbursed to AXIS by the Company. AXIS advised that adjustments to base salaries are generally determined based upon a number of factors, including the client companies performance (to the extent such can fairly be attributed or related to each executive’s performance), as well as the nature of each executive’s responsibilities, capabilities and contributions, and whether their salary fairly reflect job responsibilities and prevailing market conditions and rates of pay. AXIS advised that it considered each of these factors but did not assign a specific value to each factor in raising base salaries for 2008. The Company believes that the remuneration (including salaries) charged to the Company by AXIS for the Company’s named executive officers have historically been reasonable in relation to the Company’s size and performance. We do not use benchmarking as a fixed criteria to determine compensation. Rather, after subjectively setting compensation based on the above factors, we reviewed the compensation paid to officers based on our knowledge of salaries paid in the industry in Australia to obtain a general understanding of the reasonableness of base salaries and other compensation payable to our named executive officers. AXIS has advised that the level of remuneration charged to the Company for the named executive officers for the year ended December 31, 2009 increased over 2008 as a result of the significant increase in time spent by those named executive officers with the development of the phosphate project of the Company, the investments of the Company and corporate compliance matters dealt with as a result of the increase in the level of activity. The Company acknowledged the increase in activity referred to by AXIS and believes the increase in the level of remuneration appropriate given the circumstances.
66
Cash Bonuses AXIS with the acknowledgement of the Company, awarded cash bonuses to the Company’s named executive officers for the period July 2008 to December 2009 to acknowledge the significant work undertaken by the named executives of the Company in advancing the phosphate project of the Company for the benefit of shareholders. The bonuses were not based on a predetermined formula. In determining the contribution of each individual executive, the Company acknowledged the contribution of each of the executive management team in the efficient running of the Company, Messrs Gutnick and Michael in the Company’s negotiations with external parties in the advancement of the Company’s affairs and activities, Mr. Walker’s contribution in leading the development team in pre-development activities and negotiations with potential infrastructure companies; and Mr. Lee’s contribution in leading the finance, corporate and secretarial team through the increasing compliance and reporting matters in connection with the Company’s acquisition of its interest in NAD. Each of the bonuses were based on a flat amount plus an amount of 10% of salary. The Company’s independent directors, at the time, were consulted on the bonuses and determined that the bonuses were reasonable given the overall advancement of the Company’s activities.
2006 Equity Incentive Plan. Under the 2006 Equity Incentive Plan, certain management and key employees of the Company are granted time-based options to purchase common stock issued by us. Time-based options generally vest ratably over a three-year period on the anniversary of the date of the grant. Time-based options generally vest upon a change of control, subject to certain conditions, and expire ten years from the date of grant. Our Board of Directors believes that equity-based compensation awards foster and promote our long-term financial success by linking the interests of our executive management team with our stockholders. The Board also believes that increasing the personal equity stake of our executive officers in our continued success and growth can potentially materially increase stockholder value. Equity-based compensation awards also enable us to attract and retain the services of an outstanding management team, upon which the success of our operations are largely dependent.
Benefits and Perquisites
We also offer to certain executives limited perquisites as a method of compensation and provide executive officers with only those perquisites that we believe are reasonable and consistent with our overall compensation program to better enable us to attract and retain superior employees for key positions. The perquisites provided to the named executive officers include vehicle allowances and superannuation and are quantified in the Summary Compensation Table below.
In accordance with the laws of Australia, AXIS pays an amount equal to 9% of a named executives base salary into superannuation. Executives have the ability to make further contributions to a superannuation fund. Furthermore, in accordance with the laws of Australia, the named executives have the ability to direct superannuation contributions to a superannuation fund of their choosing. Superannuation funds are accumulation funds and are not defined benefit funds, therefore, AXIS nor the Company has a legal obligation to the superannuation funds other than remitting contributions, which AXIS have advised have been made to superannuation funds as required by law.
Accounting and Tax Treatment
The accounting treatment of our compensation plans is not a significant factor in how we design our executive compensation plans. Section 162(m) of the Internal Revenue Code of 1986, as amended, generally denies publicly-held corporations a federal income tax deduction for compensation exceeding $1,000,000 paid to named executive officers, excluding performance-based compensation. Through December 31, 2009, we have not paid compensation to any of our named executive officers in excess of $1,000,000, excluding performance-based compensation, thus Section 162(m) has not limited our ability to deduct executive compensation, however the Compensation Committee will continue to monitor the potential impact of this provision on our ability to deduct executive compensation.
67
Elements of Post-Termination Compensation
The Company does not currently have a severance plan or similar agreement with any named executive officers. Under the 2006 Equity Incentive Plan, upon a merger, reorganization, or sale of the Company, the Committee may (i) provide that any or all options are exercisable in full; (ii) provide for the substitution of any or all options by a successor or purchaser Company; or (iii) make any other provision for outstanding options as the Committee deems appropriate. After the termination of service of an employee, director or consultant, (other than termination for cause) he or she may exercise his or her option for the period of time stated in the option agreement. Generally, if termination is due to death or disability, the option will remain exercisable for 12 months. In all other cases, the option will generally remain exercisable for three months following the termination of service. However, in no event may an option be exercised later than the expiration of its term. Upon a change in control, all outstanding options become fully vested and exercisable.
Stock Ownership Guidelines
The Company does not have stock ownership guidelines for its named executives; however, the Committee considers the number of options previously granted to named executives in determining whether to grant additional options and in what amounts.
Compensation Committee Report
The Compensation Committee, comprised of independent directors, reviewed and discussed the above Compensation Discussion and Analysis with the Company’s management. Based on that review and discussion, the Compensation Committee recommended to the Board of Directors that the Compensation Discussion and Analysis be included in this Annual Report on From 10-K.
|
Compensation Committee:
|
|
|
Dr. Allan Trench
|
|
|
Dr. David Tyrwhitt
|
|
|
Mr. Henry Herzog
|
The following table sets forth the annual salary, bonuses and all other compensation awards and pay outs on account of our Chief Executive Officer for services rendered to us during the fiscal years ended December 31, 2007, 2008 and 2009, and for our Chief Financial Officer and Secretary, Executive General Manager and Project Manager for 2009. No other executive officer received more than US$100,000 per annum during this period.
Summary Compensation Table
|
Name
and
Principal
Position
|
Year
|
Salary
(A$)
|
Bonus
(A$)
|
Stock
Awards
(A$)
|
Option
Awards
(A$)
|
Non-Equity
Incentive Plan
Compensation
(A$)
|
Change in
Pension Value
and
Nonqualified
Deferred
Compensation
Earnings (A$)
|
All Other
Compensation
(A$)
|
Total (A$)
|
|
Joseph
Gutnick,
Chairman
of the
Board,
President
and CEO
|
2009
2008
2007
|
675,210
487,000
82,132
|
125,000
100,000
-
|
-
-
-
|
776,530
1,323,168
86,764
(i)
|
-
-
-
|
-
-
-
|
147,886
118,288
26,768
(ii)
|
1,724,626
2,028,456
195,664
|
|
Peter
Lee, CFO
&
Secretary
|
2009
2008
2007
|
309,596
214,634
115,400
|
82,500
80,000
-
|
-
-
-
|
208,412
480,499
65,501
(i)
|
-
-
-
|
-
-
-
|
98,417
58,339
38,825
(ii)(iii)
|
698,925
833,471
219,726
|
|
Craig
Michael,
Executive
General
Manager
|
2009
2008
2007
|
254,377
206,518
48,988
|
77,500
80,000
-
|
-
-
-
|
299,500
699,453
59,341
(i)
|
-
-
-
|
-
-
-
|
75,170
19,362
11,948
(ii)(iii)
|
706,547
1,005,333
120,277
|
|
Edward
Walker,
Project
Manager
|
2009
|
240,837
|
75,000
|
-
|
71,351
(i)
|
-
|
-
|
40,291
(ii)(iii)
|
427,479
|
|
(i)
|
The amounts included in the table for option awards have been calculated in accordance with FASB ASC Topic 718. They relate to the value of the options that have not been exercised by the individual and accordingly no value has been realized.
|
|
(ii)
|
Includes share of superannuation contributions made by AXIS applicable to salaries charged to the Company.
|
|
(iii)
|
Includes share of cost of motor vehicle costs made by AXIS applicable to Messrs. Lee, Michael and Walker as charged to the Company.
|
68
The services of our Chief Executive Officer, Chief Financial Officer & Secretary, Executive General Manager and Project Manager are provided to us pursuant to a Service Agreement effective December 1, 2004 (the “Service Agreement”) by and between AXIS Consultants Pty Limited and ourselves.
Outstanding Equity Awards at Fiscal Year-End
|
Option Awards
|
Stock Awards
|
|||||||||
|
Name
|
Number of
Securities
Underlying
Unexercised
Options (#)
Exercisable
|
Number of
Securities
Underlying
Unexercised
Options (#)
Unexercisable
|
Equity
Incentive
Plan
Awards:
Number of
Securities
Underlying
Unexercised
Unearned
Options (#)
|
Option
Exercise
Price ($)
|
Option
Expiration
Date
|
Number
of
Shares
or Units
of
Stock
That
Have
Not
Vested
(#)
|
Market
Value
of
Shares
or
Units
of
Stock
That
Have
Not
Vested
($)
|
Equity
Incentive
Plan
Awards:
Number
of
Unearned
Shares,
Units or
Other
Rights
That
Have Not
Been
Vested
(#)
|
Equity
Incentive
Plan
Awards:
Market or
Payout
Value of
Unearned
Shares,
Units or
Other
Rights
That
Have Not
Vested
($)
|
|
|
Joseph
Gutnick,
Chairman
of the
Board,
President
and CEO
|
3,333,334
2,250,000
|
-
-
|
1,666,666
|
US$2.00
US$1.00
|
2/07/18
9/19/16
|
-
|
-
|
-
|
-
|
|
|
Peter
Lee, CFO
and
Secretary
|
787,500
787,500
666,666
|
-
-
-
|
333,334
|
US$0.444
US$1.00
US$1.00
|
9/19/16
9/19/16
12/28/17
|
-
-
-
|
-
-
-
|
-
-
-
|
-
-
-
|
|
|
Craig
Michael,
Executive
General
Manager
|
100,000
100,000
833,333
|
-
-
-
|
50,000
50,000
416,667
|
US$0.444
US$1.00
US$1.00
|
9/10/17
9/10/17
12/28/17
|
-
-
-
|
-
-
-
|
-
-
-
|
-
-
-
|
|
|
Edward
Walker,
Project
Manager
|
166,667
|
-
|
333,333
|
US$1.00
|
04/12/18
|
-
|
-
|
-
|
-
|
|
2006 Equity Incentive Plan
The 2006 Plan provides for the granting of options. The maximum number of shares available for awards is 10% of the issued and outstanding shares of Common Stock on issue at any time. If an option expires or is cancelled without having been fully exercised or vested, the remaining shares will generally be available for grants of other awards.
69
The 2006 Plan is administered by the Board comprised solely of directors who are not employees or consultants to Legend or any of its affiliated entities.
Any employee, director, officer, consultant of or to Legend or an affiliated entity (including a company that becomes an affiliated entity after the adoption of the 2006 Plan) is eligible to participate in the 2006 Plan if the Committee, in its sole discretion, determines that such person has contributed significantly or can be expected to contribute significantly to the success of Legend or an affiliated entity. During any one year period, no participant is eligible to be granted options to purchase more than 5% shares of our issued and outstanding Common Stock or if they provide investor relations activities, or are a consultant to the Company, 2% of the issued and outstanding shares of Common Stock in any 12 month period.
Options granted under the 2006 Plan are to purchase Legend Common Stock. The term of each option will be fixed by the Board, but no option will be exercisable more than 10 years after the date of grant. The option exercise price is fixed by the Board at the time the option is granted. The exercise price must be paid in cash. Options granted to participants vest and have a term of 10 years.
No award is transferable, or assignable by the participant except upon his or her death.
The Board may amend the 2006 Plan, except that no amendment may adversely affect the rights of a participant without the participant’s consent or be made without stockholder approval if such approval is necessary to qualify for or comply with any applicable law, rule or regulation the Board deems necessary or desirable to qualify for or comply with.
Subject to earlier termination by the Board, the 2006 Plan has an indefinite term except that no ISO may be granted following the tenth anniversary of the date the 2006 Plan is approved by stockholders.
Other than the issue of these Options, there are no other current plans or arrangements to grant any options under the 2006 Plan.
Compensation Pursuant to Plans
The Company does not have any pension or profit sharing plans. The Company does not have any employees and therefore has no superannuation obligations.
Equity Compensation Plan Information
The following table sets forth, as of December 31, 2009, information regarding options under our 2006 stock option plan, our only active plan. The 2006 stock option plan has been approved by our stockholders. Outstanding options under this plan that are forfeited or cancelled will be available for future grants. All of the options are for the purchases of our Common Stock.
|
Number of Securities to be
issued upon exercise of
outstanding options,
warrants and rights
|
Weighted-average
exercise price of
outstanding options,
warrants and rights
|
Number of securities remaining
available future issuance under
equity compensation (excluding
securities reflected in Column One)
|
|
|
Equity compensation plans
approved by security
holders
|
23,687,500
|
A$1.31
|
2,395,272
|
|
Equity compensation plans
not approved by security
holders
|
-
|
-
|
-
|
70
Director Compensation
|
Name
|
Fees
Earned or
Paid in
Cash (A$)
|
Stock
Awards
($)
|
Option
Awards ($)
(i)
|
Non-Equity
Incentive Plan
Compensation
($)
|
Change in
Pension Value
and
Nonqualified
Deferred
Compensation
Earnings
|
All Other
Compensation
($)
|
Total (A$)
|
|
David Tyrwhitt
|
66,000
|
-
|
883,229
|
-
|
-
|
949,229
|
|
|
Dr US Awasthi
|
60,000
|
-
|
49,946
|
-
|
-
|
109,946
|
|
|
Manish Gupta
|
15,000
|
-
|
49,946
|
-
|
-
|
64,946
|
|
|
Dr Allan Trench
|
66,000
|
-
|
105,402
|
-
|
-
|
171,402
|
|
|
Henry Herzog
|
66,000
|
-
|
49,946
|
-
|
-
|
115,946
|
|
(i)
|
The amounts included in the table for option awards has been calculated in accordance with FASB ASC Topic 718. They relate to the value of the options that have not been exercised by the individual and accordingly no value has been realized.
|
It is our policy to reimburse Directors for reasonable travel and lodging expenses incurred in attending Board of Directors meetings. Commencing April 1, 2008, non-executive Directors are to be paid A$60,000 per annum and fees for attendance at board committee meetings have been set at A$1,500 per meeting.
|
Security Ownership of Certain Beneficial Owners and Management and Related Stockholder Matters.
|
The following table sets out, to the best of our knowledge, the numbers of shares in us beneficially owned as at December 31, 2009 by:
|
(i)
|
each of our present Executive Officers and Directors,
|
|
(ii)
|
each person (including any “group” as that term is defined in Section 13(d)(3) of the Securities Exchange Act) who beneficially owns more than 5% of our Common Stock, and
|
|
(iii)
|
all of our present Directors and officers as a group.
|
|
Title of Class
|
Name
|
Number of Shares Owned
|
Percentage of
Shares (1)
|
||
|
Shares of
Common Stock
|
Joseph and Stera Gutnick *
|
74,260,060
|
(2)(3)(4)(5)
|
32.81
|
|
|
Shares of
Common Stock
|
David Tyrwhitt *
|
333,333
|
(6)
|
-
|
|
|
Shares of
Common Stock
|
U.S. Awasthi *
|
116,667
|
(7)
|
-
|
|
|
Shares of
Common Stock
|
Allan Trench *
|
116,667
|
(8)
|
-
|
|
|
Shares of
Common Stock
|
Henry Herzog *
|
1,001,607
|
(9)(10)
|
**
|
|
|
Shares of
Common Stock
|
Peter Lee *
|
2,241,666
|
(11)
|
**
|
|
|
Shares of
Common Stock
|
Craig Michael *
|
1,033,333
|
(12)
|
**
|
|
|
Shares of
Common Stock
|
Edward Walker *
|
116,667
|
(13)
|
-
|
|
|
All officers and Directors
As a Group
|
79,220,000
|
35.00
|
|||
|
Shares of
Common Stock
|
Attara Fund Ltd.
767 Fifth Avenue –
12th Fl.
New York, NY 10153
|
30,629,300
|
(14)
|
13.53
|
|
|
Shares of
Common Stock
|
Kisan International Trading,
FZE
Emaar Business Park No.2,
Office 562,
Jebel Ali
Dubai, UAE
Post Box 261835
|
43,300,464
|
(15)
|
19.13
|
|
|
Shares of
Common Stock
|
Soros Fund Management
LLC
888 Seventh Avenue
New York, NY 10106
|
23,431,180
|
(16)
|
10.35
|
|
|
*
|
unless otherwise indicated, the address for each person is C/- Legend International Holdings, Inc., Level 8, 580 St Kilda Road, Melbourne, Victoria 3004, Australia.
|
|
**
|
less than 1%
|
71
Notes relating to Item 12:
|
(1)
|
Based on 226,333,392 shares outstanding as of December 31, 2009.
|
|
(2)
|
Includes 48,775,476 shares of Common Stock owned by Renika Pty. Ltd., of both of which Mr Joseph Gutnick, Stera M. Gutnick and members of their family are officers, Directors and principal stockholders.
|
|
(3)
|
Includes 750,000 shares issuable to Mr Joseph Gutnick upon exercise of stock options of which vested on September 19, 2007, 750,000 options which vested on September 19, 2008, 1,666,667 options which vested on February 7, 2009, 750,000 options which vested on September 19, 2009 and 1,666,667 options which vested on February 7, 2010. Mr Gutnick holds a further 1,666,666 options which vest on February 7, 2011.
|
|
(4)
|
Joseph Gutnick and Stera Gutnick are husband and wife.
|
|
(5)
|
Includes 19,901,250 shares of Common Stock owned by Chabad House of Caulfield Pty Ltd. (“Chabad House”), a private corporation that is the trustee of the Heichal Menachem Community Centre Fund, a charitable organization. Joseph Gutnick and Stera Gutnick are directors of Chabad House but disclaim any beneficial interest in the shares of Common Stock owned by Chabad House.
|
|
(6)
|
Include 333,333 options which vested on July 21, 2009. Does not include 333,333 options which vest on July 21, 2010 and 333,334 options which vest on July 21, 2011.
|
|
(7)
|
Includes 116,667 options which vested on December 4, 2009. Does not include 116,667 options which vest on December 4, 2010 and 116,666 options which vest on December 4, 2011.
|
|
(8)
|
Includes 116,667 options which vested on August 11, 2009. Does not include 116,667 options which vest on August 11, 2010 and 116,666 options which vest on August 11, 2011.
|
|
(9)
|
Includes 884,940 shares of Common Stock owned by Riccalo Pty. Ltd., of which Mr Henry Herzog and members of his family are officers, Directors and principal stockholders.
|
|
(10)
|
Includes 116,667 options which vested on December 4, 2009. Does not include 116,667 options which vest on December 4, 2010 and 116,666 options which vest on December 4, 2011.
|
|
(11)
|
Includes 525,000 shares issuable to Mr. Peter Lee upon exercise of stock options of which vested on September 19, 2007, 525,000 options which vested on September 19, 2008, 333,333 options which vested on December 28, 2008, 333,333 options which vested on December 28, 2009 and 525,000 options which vested on September 19, 2009. Does not include 333,334 options which vest on December 28, 2010.
|
72
|
(12)
|
Includes 100,000 shares issuable to Mr. Craig Michael upon exercise of stock options of which vested on September 10, 2008, 416,666 options which vested on December 28, 2008, 100,000 options which vested on September 10, 2009 and 416,667 options which vested on December 28, 2009. Mr Michael holds a further 100,000 options which vest on September 10, 2010 and 416,667 options which vest on December 28, 2010.
|
|
(13)
|
Includes 166,667 options which vested on December 4, 2009. Does not include 166,667 options which vest on December 4, 2010 and 166,666 options which vest on December 4, 2011.
|
|
(14)
|
In accordance with a Schedule 13G dated December 3, 2009, Attara Capital L.P. and Mr. David Slager may be deemed to be beneficial owners of the shares of Common Stock.
|
|
(15)
|
Includes 34,300,464 shares of common stock owned by Kisan International Trading, FZE, a subsidiary of Indian Farmers Fertilizer Cooperative Limited (“IFFCO”). Also includes share issuable upon exercise of 9,000,000 stock options which are exercisable no later than July 14, 2010 at an exercise price of US$4.00 per option.
|
|
(16)
|
Based upon a Schedule 13G/A filed with the SEC on February 16, 2010: Represents Shares held for the account of Quantum Partners LDC, a Cayman Islands exempted limited duration company (“Quantum Partners”) Quantum EMEA Fund Ltd., a Cayman Islands exempted limited liability company (“Quantum EMEA”), and RS Capital Partners Ltd., a Cayman Islands exempted limited liability company (“RE Capital”). Soros Fund Management LLC (“SFM LLC”) serves as principal investment manager to Quantum Partners, Quantum EMEA, and RS Capital. As such, SFM LLC has been granted investment discretion over portfolio investments, including the Shares, held for the account of Quantum Partners, Quantum EMEA, and RS Capital. George Soros serves as Chairman of SFM LLC, Robert Soros serves as Deputy Chairman of SFM LLC, and Jonathan Soros serves as President and Deputy Chairman of SFM LLC.
|
|
Certain Relationships and Related Transactions, and Director Independence.
|
In December 2004, the Company entered into an agreement with AXIS Consultants Pty Ltd to provide geological, management and administration services to the Company. AXIS is affiliated through common management and is incorporated in Australia. AXIS’ principal business is to provide geological, management and administration services to companies. We are one of ten affiliated companies that AXIS provides services to, namely, Legend, Quantum Resources Limited, North Australian Diamonds Ltd, Top End Uranium Ltd, Northern Capital Resources Corp, Golden River Resources Corp, Yahalom International Resources Corp, Aurum Inc, ProIndia International Inc,, Acadian Mining Corporation. Each of the companies has some common Directors, officers and shareholders. In addition, each of the companies is substantially dependent upon AXIS for its senior management and certain mining and exploration staff. A number of arrangements and transactions have been entered into from time to time between such companies. It has been the intention of the affiliated companies and respective Boards of Directors that each of such arrangements or transactions should accommodate the respective interest of the relevant affiliated companies in a manner which is fair to all parties and equitable to the shareholders of each. Currently, there are no material arrangements or planned transactions between the Company and any of the other affiliated companies other than AXIS.
AXIS is a company owned by the companies to which it provides services (including Legend which holds a 9.09% interest at a cost of A$1 and which is accounted for under the cost method) and any profits generated by AXIS are returned to its shareholders in the form of dividends.
AXIS is paid by each company for the costs incurred by it in carrying out the administration function for each such company. Pursuant to the Service Agreement, AXIS performs such functions as payroll, maintaining employee records required by law and by usual accounting procedures, providing insurance, legal, human resources, company secretarial, land management, certain exploration and mining support, financial, accounting advice and services. AXIS procures items of equipment necessary in the conduct of the business of the Company. AXIS also provides for the Company various services, including but not limited to the making available of office supplies, office facilities and any other services as may be required from time to time by the Company as and when requested by the Company.
73
We are required to reimburse AXIS for any direct costs incurred by AXIS for the Company. In addition, we are required to pay a proportion of AXIS’s overhead cost based on AXIS’s management estimate of our utilization of the facilities and activities of AXIS plus a service fee of not more than 15% of the direct and overhead costs. Amounts invoiced by AXIS are required to be paid by us. We are also not permitted to obtain from sources other than AXIS, and we are not permitted to perform or provide ourselves, the services contemplated by the Service Agreement, unless we first requests AXIS to provide the service and AXIS fails to provide the service within one month.
The Service Agreement may be terminated by AXIS or us upon 60 days prior notice. If the Service Agreement is terminated by AXIS, we would be required to independently provide, or to seek an alternative source of providing, the services currently provided by AXIS. There can be no assurance that we could independently provide or find a third party to provide these services on a cost-effective basis or that any transition from receiving services under the Service Agreement will not have a material adverse effect on us. Our inability to provide such services or to find a third party to provide such services may have a material adverse effect on our operations.
In accordance with the Service Agreement AXIS provides the Company with the services of our Chief Executive Officer, Chief Financial Officer, geologists and clerical employees, as well as office facilities, equipment, administrative and clerical services. We pay AXIS for the actual costs of such facilities plus a maximum service fee of 15%.
During 2007, AXIS charged the Company A$1,126,311 in management fees including salaries incurred in relation to AXIS staff that provided services to the Company, A$834,552 for exploration services provided to the Company, A$151,800 for asset usage, interest of A$14,683 and we repaid A$2,432,687. AXIS charged interest at a rate of 10.10% for 2007. The amount owed to AXIS at December 31, 2007 was A$6,912. During 2008, AXIS charged the Company A$5,413,203 in management and administration services including salaries incurred in relation to AXIS staff that provided services to the Company and A$2,224,638 for exploration services provided to the Company. The Company placed on deposit with AXIS funds amounting to A$699,638 to acquire two properties in Mt Isa, which is the base for the Company’s phosphate project, to be used to accommodate AXIS employees and consultants when working in Mt Isa and relocating to the field operations. The Company also purchased a lear jet owned by AXIS (at cost to AXIS) amounting to A$1,210,000 which includes 10% GST and was based on an independent valuation, to utilize in its field operations; and a residential property at a value of A$900,000 (cost to AXIS) used to accommodate AXIS employees when visiting field operations. The Company has entered into a rental agreement with AXIS for one rental property used by AXIS staff when conducting field operations for the Company. The rental agreement is for the period October 1, 2008 to September 30, 2009. The Company paid rental expense of A$6,240 for 2008. During 2008, the Company paid AXIS an aggregate of A$10,551,866 which included the cost of the Lear jet, the three properties and an advance for 2009 charges and ongoing operations. The Company charged AXIS interest of A$49,931 at the rate between 10.35% to 11.75%.The amount owed by AXIS at December 31, 2008 was A$1,552,919. During 2009, AXIS charged the Company A$4,876,381 in management fees including salaries incurred in relation to AXIS staff that provided services to the Company, A$8,273,059 for exploration services provided to the Company, interest of A$81,504, provided advance funding to AXIS of A$606,000 and we repaid A$12,805,855. AXIS charged interest at a rate between 9.25% and 10.35% for 2009. The amount due from AXIS at December 31, 2009 was A$1,878,205, and is included in receivables.
74
Mr Joseph Gutnick, the President of the Company advanced the Company the initial deposit on opening a US Dollar bank account. In March, 2007, the balance of A$831, owing of the initial advance of A$1,303 (US$1,000) less expenses incurred of A$472, was repaid.
The Company appointed Mr. Mordechai Gutnick, as the Company’s General Manager, Business in December, 2007. Mr. Gutnick is the son of Joseph Gutnick, the Company’s President and Chairman of the Board. Mr. Mordechai Gutnick receives an annual salary paid via AXIS. In addition, in December, 2007, Mr. Mordechai Gutnick was granted 2,000,000 stock options.
During the 2009 year, the Company invested in North Australian Diamonds Ltd (“NADL”) through on-market purchases on ASX and through a takeover offer. At December 31, 2009, the Company held 47.83% of the issued shares of NADL. The Company’s President and Chief Executive Officer, Executive General Manager and one of its independent Directors are Executive Chairman and Managing Director, and Directors respectively of NADL. In addition, the Company’s President is a director and officer of Yahalom International Resources Corporation (“Yahalom”). Yahalom tendered 378,275,603 NAD shares to the Company for which it received A$3,058,660, or A$0.008 per share, which represented its cost of purchase for the NAD shares and was less than the A$0.015 per share purchase price paid to the non-affiliated shareholders of NAD. All of the shares in Yahalom are held in trust by Northern Raizel Pty Ltd., as trustee of a family trust for the benefit of members of the Company’s President’s family. The Company’s President is a director and a stockholder of Northern Raizel. The Company’s President did not take part in any material decision made by either the Company or NAD relating to the Offer and/or the Takeover Bid.
During the 2009 year, the Company took a private placement of shares of common stock in Northern Capital Resources Corp (“NCRC”). At December 31, 2009, the Company held 21.29% of the shares of NCRC. The Company’s President and Chief Executive Officer and one of its independent Directors (Dr Tyrwhitt) are President and Chief Executive Officer and Director respectively of NCRC and certain companies with which the Company’s President is affiliated own approximately 67% of the outstanding shares of NCRC.
During the 2009 year, the Company and NADL entered into a camp access agreement and airfield access agreement relating to the Merlin camp and airstrip to allow the Company to utilize these facilities. Under the arrangements, the Company paid NADL $836,570 to upgrade the facilities, $132,698 for accommodation, meals and fuel and NADL paid the Company $21,022 for costs incurred in behalf of NADL. At December 31, 2009, the Company owes NADL $19,265 pursuant to these arrangements.
Transactions with Management.
We have a written policy that we will not enter into any transaction with an Officer, Director or affiliate of us or any member of their families unless the transaction is approved by a majority of our disinterested non-employee Directors and the disinterested majority determines that the terms of the transaction are no less favourable to us than the terms available from non-affiliated third parties or are otherwise deemed to be fair to us at the time authorized.
75
|
Principal Accounting Fees and Services.
|
The following table shows the audit fees incurred for fiscal 2009 and 2008.
| 2009 A$ | 2008 A$ | |||||||
|
Audit fees
|
220,199 | 260,690 | ||||||
|
Audit related fees
|
- | - | ||||||
|
Tax fees
|
35,102 | 11,492 | ||||||
|
Total
|
255,301 | 272,182 |
Audit fees were for the audit of our annual financial statements, review of financial statements included in our 10-Q quarterly reports, and services that are normally provided by independent auditors in connection with our other filings with the SEC. This category also includes advice on accounting matters that arose during, or as a result of, the audit or review of our interim financial statements. The fees related to 2008 also include services provided by our independent auditors in connection with the filing of an amendment to our originally filed 2008 Form 10-K.
Tax fees relate to the preparation of the Company’s tax returns and various tax planning and compliance related filings.
As part of its duties, our Audit Committee pre-approves audit and non-audit services performed by our independent auditors in order to assure that the provision of such services does not impair the auditors’ independence. Our Audit Committee does not delegate to management its responsibilities to pre-approve services performed by our independent auditors.
76
|
Exhibits, Financial Statement Schedules.
|
Documents filed as part of the report.
|
(1)
|
All Financial Statements
|
|
|
Page
|
||
|
Report of Independent Registered Public Accounting Firm
|
F-1
|
|
|
Consolidated Balance Sheet
|
F-2
|
|
|
Consolidated Statements of Operations
|
F-3
|
|
|
Consolidated Statements of Stockholders’ Equity (Deficit)
|
F-4
|
|
|
Consolidated Statements of Cash Flows
|
F-6
|
|
|
Notes to Consolidated Financial Statements
|
F-7 - F-25
|
|
|
(2)
|
Financial Statements Schedule
|
|
|
All other schedules have been omitted because they are not applicable or not required, or because the required information is shown in the consolidated financial statements or notes thereto.
|
||
|
(3)
|
Exhibits
|
|
|
See Index to Exhibits at page 70 for a description of the exhibits filed as a part of this report.
|
77
Pursuant to the requirements of Section 13 or 15(d) of the Securities Exchange Act of 1934, the Registrant has caused this Annual Report to be signed on its behalf by the undersigned, thereunto duly authorised.
|
LEGEND INTERNATIONAL HOLDINGS, INC.
|
|||
|
(Registrant)
|
|||
|
By:
|
/s/ Peter Lee
|
||
|
Peter J Lee
|
|||
|
Chief Financial Officer and Secretary
|
|||
Dated: December 21, 2010
78
FORM 10-K Signature Page
Pursuant to the requirements of the Securities Exchange Act of 1934, this Report has been signed below by the following persons in the capacities and on the dates indicated.
|
Signature
|
Title
|
Date
|
|
|
/s/ Joseph Gutnick
|
|||
|
1.
|
……………………………
|
Chairman of the Board,
|
|
|
Joseph Gutnick
|
President and Chief Executive
|
||
|
Officer (Principal Executive
|
|||
|
Officer) and Director
|
December 21, 2010
|
||
|
/s/ David Tyrwhitt
|
|||
|
2.
|
……………………………
|
Director
|
March 15, 2010
|
|
David Tyrwhitt
|
|||
|
/s/ Peter Lee
|
|||
|
3.
|
…………………………….
|
Chief Financial Officer and
|
|
|
Peter Lee
|
Secretary (Principal Financial
|
||
|
and Accounting Officer)
|
December 21, 2010
|
||
|
/s/ U S Awasthi
|
|||
|
4.
|
……………………………
|
Director
|
March 15, 2010
|
|
U S Awasthi
|
|||
|
/s/ Allan Trench
|
|||
|
5.
|
……………………………
|
Director
|
March 15, 2010
|
|
Allan Trench
|
|||
|
/s/ Henry Herzog
|
|||
|
6.
|
……………………………
|
Director
|
March 15, 2010
|
|
Henry Herzog
|
79
EXHIBIT INDEX
Incorporated by
Reference to:
|
Exhibit No.
|
Exhibit
|
|
1.1
|
Subscription Agreement (1)
|
|
3.1
|
Certificate of Incorporation (1)
|
|
3.2
|
Amended Certificate of Incorporation (2)
|
|
3.3
|
Bylaws (1)
|
|
3.4
|
Specimen Stock Certificate (1)
|
|
3.5
|
Amendment to Certificate of Incorporation (6)
|
|
10.1
|
2006 Incentive Option Plan (3)
|
|
10.2
|
Contract for the Sale of Mining Tenements (4)
|
|
10.3
|
Subscription Agreement dated as of December 12, 2007 (6)
|
|
10.4
|
Agreement with Iron Duketon Pty Limited dated November 2, 2007 (7)
|
|
10.5
|
Agreement with Ansett Resources & Industries Pty Ltd. dated November 7, 2007 (7)
|
|
10.6
|
Agreement with King Eagle Resources Pty Limited dated December 7, 2007 (8)
|
|
10.7
|
Form of Subscription Agreement for BMO Offering (9)
|
|
10.8
|
Agency Agreement dated as of June 3, 2008 (9)
|
|
10.9
|
Registration Rights Agreement dated as of June 3, 2008 (9)
|
|
10.10
|
Form of Broker Warrant (9)
|
|
10.11
|
Share Options agreement dated July 14, 2008 with Indian Farmers Fertilizer Cooperative Limited (IFFCO)(10)
|
| 10.12 | Service Agreement with AXIS Consultants Pty Ltd dated February 25, 2005 (11) |
|
21.1
|
Subsidiaries of the Registrant (5)
|
|
31.1
|
Certification Pursuant to 18 U.S.C. Section 1350, as Adopted Pursuant to Section 302 of the Sarbanes-Oxley Act of 2002 by Joseph Isaac Gutnick (5)
|
|
31.2
|
Certification of Pursuant to 18 U.S.C. Section 1350, as Adopted Pursuant to Section 302 of the Sarbanes-Oxley Act of 2002 by Peter James Lee (5)
|
|
32.1
|
Certification of Pursuant to 18 U.S.C. Section 1350, as Adopted Pursuant to Section 906 of the Sarbanes-Oxley Act of 2002 by Joseph Isaac Gutnick (5)
|
|
32.2
|
Certification Pursuant to 18 U.S.C. Section 1350, as Adopted Pursuant to Section 906 of the Sarbanes-Oxley Act of 2002 by Peter James Lee (5)
|
80
Footnotes:
|
(1)
|
Incorporated herein by reference to the Company’s Registration Statement on Form SB-2, filed on February 2, 2001, File No. 333-55116, and the amendments thereto.
|
|
(2)
|
Incorporated herein by reference to the Company’s current report on Form 8-K filed on March 21, 2003.
|
|
(3)
|
Incorporated herein by reference to the Appendix to the Company’s Proxy Statement filed on October 19, 2006.
|
|
(4)
|
Incorporated by reference to the Company’s current report on Form 8-K filed on March 10, 2006.
|
|
(5)
|
Filed herewith
|
|
(6)
|
Incorporated herein by reference to the Company’s Form 10-K filed on March 17, 2008
|
|
(7)
|
Incorporated herein by reference to the Company’s Current Report on Form 8-K filed on December 28, 2007.
|
|
(8)
|
Incorporated herein by reference to the Company’s Current Report on Form 8-K filed on December 28, 2007.
|
|
(9)
|
Incorporated herein by reference to Amendment 1 to the Company’s Registration Statement on Form S-1 filed on August 7, 2008 (SEC File No. 333-152691).
|
|
(10)
|
Incorporated herein by reference to the Company’s current Report on Form 8-K filed on July 16, 2008.
|
|
(11)
|
Incorporated herein by reference to the Company’s Current Report on Form 8-K filed on March 8, 2005.
|
Consolidated Financial Statements for the years ended December 31, 2008 and 2009.
Legend International Holdings, Inc.
Audited Consolidated Financial Statements for the Company for the years ended December 31, 2009 and 2008.
81
LEGEND INTERNATIONAL HOLDINGS, INC.
(An Exploration Stage Company)
Consolidated Financial Statements
December 31, 2009 and 2008
(with Report of Independent Registered Public Accounting Firm)
CONTENTS
|
Page
|
|
|
F-1
|
|
|
F-2
|
|
|
F-3
|
|
|
F-4
|
|
|
F-6
|
|
|
F-7– F-25
|
To the Board of Directors and Stockholders of
Legend International Holdings, Inc
We have audited the accompanying consolidated balance sheet of Legend International Holdings, Inc (An Exploration Stage Company) as of December 31, 2009 and 2008, and the related consolidated statements of operations, stockholders’ equity (deficit) and cash flows for the years ended December 31, 2007, 2008 and 2009 and the cumulative amounts from inception, January 5, 2001 through December 31, 2009. These financial statements are the responsibility of the Company’s management. Our responsibility is to express an opinion on these financial statements based on our audits.
We conducted our audits in accordance with standards of the Public Company Accounting Oversight Board (United States). Those standards require that we plan and perform the audit to obtain reasonable assurance about whether the financial statements are free of material misstatement. An audit includes examining, on a test basis, evidence supporting the amounts and disclosures in the financial statements. An audit also includes assessing the accounting principles used and significant estimates made by management, as well as evaluating the overall financial statement presentation. We believe that our audits provide a reasonable basis for our opinion.
In our opinion, the financial statements referred to above present fairly, in all material respects, the financial position of Legend International Holdings, Inc. at December 31, 2009 and 2008, and the results of its operations and its cash flows for the periods indicated above in conformity with accounting principles generally accepted in the United States of America.
We also have audited, in accordance with the standards of the Public Company Accounting Oversight Board (United States), the Company’s internal control over financial reporting as of December 31, 2009 based on criteria established in Internal Control-Integrated Framework issued by the Committee of Sponsoring Organizations of the Treadway Commission and our report dated March 15, 2010 expressed an unqualified opinion thereon.
|
New York, NY
|
PKF
|
|
March 15, 2010
|
Certified Public Accountants
|
|
A Professional Corporation
|
F-1
(An Exploration Stage Company)
Consolidated Balance Sheet
December 31, 2009
|
2009
A$
|
2008
A$
|
Convenience
Translation
2009
US$
|
||||||||||
|
ASSETS
|
||||||||||||
|
Current Assets:
|
||||||||||||
|
Cash
|
72,666,088 | 119,277,536 | 64,898,082 | |||||||||
|
Receivables (note 11)
|
1,148,567 | 2,843,331 | 1,025,785 | |||||||||
|
Prepayments
|
644,033 | 371,499 | 575,186 | |||||||||
|
Inventories (note 10)
|
254,544 | 92,194 | 227,333 | |||||||||
|
Trading Securities (note 10)
|
- | 780,946 | - | |||||||||
|
Total Current Assets
|
74,713,232 | 123,365,506 | 66,726,387 | |||||||||
|
Non-Current Assets:
|
||||||||||||
|
Property and Equipment, net (note 3)
|
8,473,654 | 5,320,625 | 7,567,820 | |||||||||
|
Investment in unconsolidated entities (note 6)
|
10,409,693 | - | 9,296,897 | |||||||||
|
Investments (note 10)
|
2,928,294 | - | 2,615,260 | |||||||||
|
Deposits (note 5)
|
2,659,494 | 793,712 | 2,375,194 | |||||||||
|
Receivables (note 11)
|
1,243,172 | 555,668 | 1,110,277 | |||||||||
|
Prepayments
|
622,272 | 40,194 | 555,751 | |||||||||
|
Mineral Rights (note 6)
|
18,290,290 | - | 16,335,058 | |||||||||
|
Goodwill (note 6)
|
1,092,950 | - | 976,114 | |||||||||
|
Total Non-Current Assets
|
45,719,819 | 6,710,199 | 40,832,371 | |||||||||
|
Total Assets
|
120,433,051 | 130,075,705 | 107,558,758 | |||||||||
|
LIABILITIES
|
||||||||||||
|
Current Liabilities:
|
||||||||||||
|
Accounts payable and accrued expenses
|
4,086,609 | 2,386,575 | 3,649,750 | |||||||||
|
Lease liability (note 9)
|
213,550 | 186,785 | 190,722 | |||||||||
|
Total Current Liabilities
|
4,300,159 | 2,573,360 | 3,840,472 | |||||||||
|
Non Current Liabilities:
|
||||||||||||
|
Reclamation and Remediation Provision (note 8)
|
935,558 | 206,192 | 835,547 | |||||||||
|
Lease liability (note 9)
|
297,914 | 537,008 | 266,067 | |||||||||
|
Total Non Current Liabilities
|
1,233,472 | 743,200 | 1,101,614 | |||||||||
|
Total Liabilities
|
5,533,631 | 3,316,560 | 4,942,086 | |||||||||
|
Commitments and Contingencies (Notes 9 and 13)
|
||||||||||||
|
Stockholders’ Equity
|
||||||||||||
|
Common stock: US$.001 par value, 300,000,000 shares authorised
|
||||||||||||
|
226,333,392 and 226,315,392 shares issued and outstanding
|
275,101 | 275,076 | 245,693 | |||||||||
|
Additional Paid-in-Capital
|
163,765,820 | 154,661,002 | 146,259,253 | |||||||||
|
Other Comprehensive Gain (Loss)
|
(388,529 | ) | 38,490 | (346,995 | ) | |||||||
|
Retained Deficit prior to exploration activities
|
(839,463 | ) | (839,463 | ) | (749,724 | ) | ||||||
|
Retained Deficit during exploration period
|
(65,262,031 | ) | (27,375,960 | ) | (58,285,520 | ) | ||||||
|
Legend Stockholders’ Equity
|
97,550,898 | 126,759,145 | 87,122,707 | |||||||||
|
Non-Controlling Interests (note 6)
|
17,348,522 | - | 15,493,965 | |||||||||
|
Total Equity
|
114,899,420 | 126,759,145 | 102,616,672 | |||||||||
|
Total Liabilities and Equity
|
120,433,051 | 130,075,705 | 107,558,758 | |||||||||
The accompanying notes are integral part of the consolidated financial statements.
F-2
(An Exploration Stage Company)
Consolidated Statements of Operations
|
For the years Ended
December 31
|
Convenience
Translation
|
January 5,
2001
(Inception) to
December 31,
|
||||||||||||||||||
|
2007
A$
|
2008
A$
|
2009
A$
|
2009
US$
|
2009
A$
|
||||||||||||||||
|
Revenues:
|
||||||||||||||||||||
|
Sales
|
- | - | - | - | 6,353 | |||||||||||||||
|
less cost of sales
|
- | - | - | - | (1,362 | ) | ||||||||||||||
|
Gross profit
|
- | - | - | - | 4,991 | |||||||||||||||
|
Other income
|
||||||||||||||||||||
|
Interest income – related entity
|
- | 49,931 | 81,503 | 72,790 | 131,434 | |||||||||||||||
|
Interest income – other
|
22,183 | 3,669,440 | 3,338,315 | 2,981,449 | 7,033,813 | |||||||||||||||
|
Other
|
- | 6,534 | 403,266 | 360,157 | 409,800 | |||||||||||||||
| 22,183 | 3,725,905 | 3,823,084 | 3,414,396 | 7,575,047 | ||||||||||||||||
|
Costs and expenses:
|
||||||||||||||||||||
|
Legal, professional and accounting
|
213,063 | 707,444 | 880,851 | 786,687 | 1,936,755 | |||||||||||||||
|
Exploration expenditure
|
5,132,000 | 8,780,037 | 25,608,743 | 22,871,169 | 43,332,165 | |||||||||||||||
|
Aircraft maintenance
|
- | 278,826 | 1,014,986 | 906,484 | 1,293,812 | |||||||||||||||
|
Stock based compensation
|
375,740 | 5,185,743 | 4,259,903 | 3,804,519 | 10,592,543 | |||||||||||||||
|
Interest expense
|
62,196 | 32,715 | 64,831 | 57,901 | 209,677 | |||||||||||||||
|
Impairment of investment
|
- | 326,526 | - | - | 326,526 | |||||||||||||||
|
Amortization of mineral rights
|
- | - | 582,710 | 520,418 | 582,710 | |||||||||||||||
|
Administration expenses
|
2,756,935 | 8,096,798 | 8,217,286 | 7,338,858 | 19,627,728 | |||||||||||||||
|
Total costs and expenses
|
(8,539,934 | ) | (23,408,089 | ) | (40,629,310 | ) | (36,286,036 | ) | (77,901,916 | ) | ||||||||||
|
(Loss) from operations
|
(8,517,751 | ) | (19,682,184 | ) | (36,806,226 | ) | (32,871,640 | ) | (70,321,878 | ) | ||||||||||
|
Adjustment to fair value on stepped
acquisition (note 6)
|
- | - | 2,200,620 | 1,965,374 | 2,200,620 | |||||||||||||||
|
Gain on trading securities
|
- | 70,874 | 113,739 | 101,580 | 184,613 | |||||||||||||||
|
Foreign currency exchange gain/(loss)
|
(120,378 | ) | 5,389,750 | (4,661,096 | ) | (4,162,825 | ) | 568,259 | ||||||||||||
|
(Loss) before income taxes and equity in losses of
unconsolidated entities
|
(8,638,129 | ) | (14,221,560 | ) | (39,152,963 | ) | (34,967,511 | ) | (67,368,386 | ) | ||||||||||
|
Provision for income taxes
|
- | - | - | - | - | |||||||||||||||
|
Loss before equity in losses of unconsolidated entities
|
(8,638,129 | ) | (14,221,560 | ) | (39,152,963 | ) | (34,967,511 | ) | (67,368,386 | ) | ||||||||||
|
Equity in losses of unconsolidated entities (note 6)
|
- | - | (345,707 | ) | (308,751 | ) | (345,707 | ) | ||||||||||||
|
Net (loss)
|
(8,638,129 | ) | (14,221,560 | ) | (39,498,670 | ) | (35,276,262 | ) | (67,714,093 | ) | ||||||||||
|
Net (loss) attributable to non-controlling entities (note 6)
|
- | - | 1,612,599 | 1,440,212 | 1,612,599 | |||||||||||||||
|
Net (loss) attributable to Legend stockholders
|
(8,638,129 | ) | (14,221,560 | ) | (37,886,071 | ) | (33,836,050 | ) | (66,101,494 | ) | ||||||||||
|
Basic and diluted loss per common shares
|
(0.06 | ) | (0.07 | ) | (0.17 | ) | (0.15 | ) | (0.08 | ) | ||||||||||
|
Weighted average number of common shares used in
per share calculations
|
146,739,872 | 204,500,520 | 226,327,933 | 226,327,933 | 82,484,596 | |||||||||||||||
The accompanying notes are integral part of the consolidated financial statements.
F-3
(An Exploration Stage Company)
Consolidated Statements of Stockholders' Equity (Deficit)
for the period ended December 31, 2009
|
Common Stock
|
||||||||||||||||||||||||||||||||
|
Shares
|
Par Value
A$
|
Additional
Paid-In Capital
A$
|
Retained
(Deficit) During
the Exploration
Period
A$
|
Retained
(Deficit) prior to exploration activities
A$
|
Accumulated
Other
Comprehensive
Income (Loss)
A$
|
Non-
Controlling
Interests
A$
|
Stockholders’
Equity (Deficit)
A$
|
|||||||||||||||||||||||||
|
Balance, January 5, 2001
|
- | - | - | - | - | - | - | - | ||||||||||||||||||||||||
|
Shares issued to founder for
organisation cost and
services at US$0.05
per shares
|
4,297,500 | 5,550 | 118,896 | - | - | - | - | 124,446 | ||||||||||||||||||||||||
|
Shares Issued for services
rendered at US$0.05 per
share
|
146,250 | 189 | 4,046 | - | - | - | - | 4,235 | ||||||||||||||||||||||||
|
Shares Issued for Cash
|
616,500 | 796 | 17,056 | - | - | - | - | 17,852 | ||||||||||||||||||||||||
|
Net Loss
|
- | - | - | - | (131,421 | ) | - | - | (131,421 | ) | ||||||||||||||||||||||
|
Balance, December 31, 2001
|
5,060,250 | 6,535 | 139,998 | - | (131,421 | ) | - | - | 15,112 | |||||||||||||||||||||||
|
Shares Issued for Cash
|
225,000 | 291 | 6,225 | - | - | - | - | 6,516 | ||||||||||||||||||||||||
|
Shares Issued for Officer’s
Compensation
|
11,250,000 | 14,529 | 148,359 | - | - | - | - | 162,888 | ||||||||||||||||||||||||
|
Net Loss
|
- | - | - | - | (182,635 | ) | - | - | (182,635 | ) | ||||||||||||||||||||||
|
Balance, December 31, 2002
|
16,535,250 | 21,355 | 294,582 | - | (314,056 | ) | - | - | 1,881 | |||||||||||||||||||||||
|
Shares Issued for services
rendered at US$0.022 per
share
|
5,026,500 | 6,491 | 139,065 | - | - | - | - | 145,556 | ||||||||||||||||||||||||
|
Net Loss
|
- | - | - | - | (156,965 | ) | - | - | (156,965 | ) | ||||||||||||||||||||||
|
Balance, December 31, 2003
|
21,561,750 | 27,846 | 433,647 | - | (471,021 | ) | - | - | (9,528 | ) | ||||||||||||||||||||||
|
Shares Issued for services
rendered at US$0.022 per
share
|
2,004,750 | 2,589 | 55,464 | - | - | - | - | 58,053 | ||||||||||||||||||||||||
|
Options Issued for services
|
- | - | 160,672 | - | - | - | - | 160,672 | ||||||||||||||||||||||||
|
Loan forgiveness-former
major shareholder
|
- | - | 12,144 | - | - | - | - | 12,144 | ||||||||||||||||||||||||
|
Net Loss
|
- | - | - | - | (234,611 | ) | - | - | (234,611 | ) | ||||||||||||||||||||||
|
Balance, December 31, 2004
|
23,566,500 | 30,435 | 661,927 | - | (705,632 | ) | - | - | (13,270 | ) | ||||||||||||||||||||||
|
Shares issued on cashless
exercise of options
|
17,085,938 | 22,066 | (22,066 | ) | - | - | - | - | - | |||||||||||||||||||||||
|
Net Loss
|
- | - | - | - | (75,508 | ) | - | - | (75,508 | ) | ||||||||||||||||||||||
|
Balance, December 31, 2005
|
40,652,438 | 52,501 | 639,861 | - | (781,140 | ) | - | - | (88,778 | ) | ||||||||||||||||||||||
|
Share issued on cashless
exercise of options
|
72,281,329 | 93,336 | (93,336 | ) | - | - | - | - | - | |||||||||||||||||||||||
|
Shares and options issued
under settlement agreement
|
112,500 | 144 | 35,272 | - | - | - | - | 35,416 | ||||||||||||||||||||||||
|
Shares issued for cash
|
12,756,734 | 16,524 | 3,854,843 | - | - | - | - | 3,871,367 | ||||||||||||||||||||||||
|
Cost of share issues
|
- | - | (128,376 | ) | - | - | - | - | (128,376 | ) | ||||||||||||||||||||||
|
Amortisation of Options under
stock option plan
|
- | - | 115,307 | - | - | - | - | 115,307 | ||||||||||||||||||||||||
|
Net unrealized gain on foreign
exchange translation
|
- | - | - | - | - | 38,490 | - | 38,490 | ||||||||||||||||||||||||
|
Net Loss
|
- | - | - | (4,516,271 | ) | (58,323 | ) | - | - | (4,574,594 | ) | |||||||||||||||||||||
|
Balance, December 31, 2006
|
125,803,001 | 162,505 | 4,423,571 | (4,516,271 | ) | (839,463 | ) | 38,490 | - | (731,168 | ) | |||||||||||||||||||||
F-4
LEGEND INTERNATIONAL HOLDINGS, INC.
(An Exploration Stage Company)
Consolidated Statements of Stockholders' Equity (Deficit)
for the period ended December 31, 2009
(continued)
|
Shares
|
Par Value
A$
|
Additional
Paid-In Capital
A$
|
Retained
(Deficit) During
the Exploration
Period
A$
|
Retained
(Deficit) prior to exploration activities
A$
|
Accumulated
Other
Comprehensive
Income (Loss)
A$
|
Non-
Controlling
Interests
A$
|
Stockholders’
Equity
(Deficit)
A$
|
|||||||||||||||||||||||||
|
Shares issued for cash
|
47,686,624 | 56,438 | 25,684,666 | - | - | - | - | 25,741,104 | ||||||||||||||||||||||||
|
Cost of share issues
|
- | - | (1,675,111 | ) | - | - | - | - | (1,675,111 | ) | ||||||||||||||||||||||
|
Shares issued for consulting fees
|
2,604,200 | 2,984 | 1,001,122 | - | - | - | - | 1,004,106 | ||||||||||||||||||||||||
|
Shares issued on cashless exercise
of options
|
75,000 | 85 | (85 | ) | - | - | - | - | - | |||||||||||||||||||||||
|
Shares issued as a result of delay in
lodgement of registration statement
|
200,000 | 230 | 364,575 | - | - | - | - | 364,805 | ||||||||||||||||||||||||
|
Shares issued for part-settlement of the
acquisition of rights to exploration
licences under agreement
|
500,000 | 545 | 517,455 | - | - | - | - | 518,000 | ||||||||||||||||||||||||
|
Amortization of options under stock
option plan
|
- | - | 375,740 | - | - | - | - | 375,740 | ||||||||||||||||||||||||
|
Net Loss
|
- | - | - | (8,638,129 | ) | - | - | - | (8,638,129 | ) | ||||||||||||||||||||||
|
Balance, December 31, 2007
|
176,868,825 | 222,787 | 30,691,933 | (13,154,400 | ) | (839,463 | ) | 38,490 | - | 16,959,347 | ||||||||||||||||||||||
|
Shares issued for cash
|
42,000,000 | 44,011 | 109,984,282 | - | - | - | - | 110,028,293 | ||||||||||||||||||||||||
|
Cost of share issues
|
- | (5,964,346 | ) | - | - | - | - | (5,964,346 | ) | |||||||||||||||||||||||
|
Shares issued on cashless exercise
of options
|
1,522,358 | 1,701 | (1,701 | ) | - | - | - | - | - | |||||||||||||||||||||||
|
Shares issued on exercise of options
|
5,435,600 | 5,999 | 13,717,586 | - | - | - | - | 13,723,585 | ||||||||||||||||||||||||
|
Shares issued for consulting fees
|
30,800 | 33 | 147,555 | - | - | - | - | 147,588 | ||||||||||||||||||||||||
|
Shares issued under registration
rights agreement
|
457,809 | 545 | 899,950 | - | - | - | - | 900,495 | ||||||||||||||||||||||||
|
Amortization of options under stock
option plan
|
- | - | 5,185,743 | - | - | - | - | 5,185,743 | ||||||||||||||||||||||||
|
Net Loss
|
- | - | - | (14,221,560 | ) | - | - | - | (14,221,560 | ) | ||||||||||||||||||||||
|
Balance, December 31, 2008
|
226,315,392 | 275,076 | 154,661,002 | (27,375,960 | ) | (839,463 | ) | 38,490 | - | 126,759,145 | ||||||||||||||||||||||
|
Shares issued on exercise of options
|
18,000 | 25 | 2,738 | - | - | - | - | 2,763 | ||||||||||||||||||||||||
|
Amortization of options under stock
option plan
|
- | - | 4,259,903 | - | - | - | - | 4,259,903 | ||||||||||||||||||||||||
|
Net unrealized loss on foreign
exchange translation
|
- | - | - | - | - | (427,019 | ) | - | (427,019 | ) | ||||||||||||||||||||||
|
Net Loss attributable to
Legend stockholders
|
- | - | - | (37,886,071 | ) | - | - | - | (37,886,071 | ) | ||||||||||||||||||||||
|
Fair value of non-controlling interest
|
- | - | - | - | - | - | 10,261,290 | 10,261,290 | ||||||||||||||||||||||||
|
Net change in controlling/
non-controlling interest
|
- | - | 4,842,177 | - | - | - | 8,699,831 | 13,542,008 | ||||||||||||||||||||||||
|
Net loss attributable to
non-controlling stockholders
|
- | - | - | - | - | - | (1,612,599 | ) | (1,612,599 | ) | ||||||||||||||||||||||
|
Balance, December 31, 2009
|
226,333,392 | 275,101 | 163,765,820 | (65,262,031 | ) | (839,463 | ) | (388,529 | ) | 17,348,522 | 114,899,420 | |||||||||||||||||||||
The accompanying notes are integral part of the consolidated financial statements.
F-5
(An Exploration Stage Company)
Consolidated Statement of Cash Flows
|
For the years Ended
December 31
|
Convenience
Translation
|
January 5, 2001
(Inception) to
December 31,
|
||||||||||||||||||
|
2007
A$
|
2008
A$
|
2009
A$
|
2009
A$
|
2009
A$
|
||||||||||||||||
|
CASH FLOWS FROM OPERATING ACTIVITIES:
|
||||||||||||||||||||
|
Net Loss attributable to Legend stockholders
|
(8,638,129 | ) | (14,221,560 | ) | (37,886,071 | ) | (33,836,050 | ) | (66,101,494 | ) | ||||||||||
|
Adjustments to reconcile net loss attributable to Legend stockholders
to net cash (used) by operating activities:
|
||||||||||||||||||||
|
Foreign exchange
|
120,378 | (5,389,750 | ) | 4,661,096 | 4,162,825 | (569,602 | ) | |||||||||||||
|
Gain in revaluation of trading securities
|
- | (70,874 | ) | (113,739 | ) | (101,580 | ) | (184,613 | ) | |||||||||||
|
Shares and Options issued for Stock Based Compensation
|
||||||||||||||||||||
|
- Employees
|
375,740 | 5,185,743 | 4,259,903 | 3,804,519 | 10,592,544 | |||||||||||||||
|
- Consultants
|
383,833 | 147,588 | - | - | 531,421 | |||||||||||||||
|
- Exploration agreement
|
518,000 | - | - | - | 518,000 | |||||||||||||||
|
- Registration payment arrangements
|
364,805 | 900,494 | - | - | 1,265,299 | |||||||||||||||
|
Exploration expenditure
|
- | 326,526 | - | - | 326,526 | |||||||||||||||
|
Provision for reclamation and remediation
|
90,000 | 116,192 | 91,722 | 81,917 | 297,914 | |||||||||||||||
|
Gain on sale of property, plant & equipment
|
- | - | (16,761 | ) | (14,969 | ) | (16,761 | ) | ||||||||||||
|
Depreciation and amortisation
|
19,949 | 202,943 | 847,006 | 756,461 | 1,070,919 | |||||||||||||||
|
Adjustment to fair value on stepped acquisition
|
- | - | (2,200,620 | ) | (1,965,374 | ) | (2,200,620 | ) | ||||||||||||
|
Equity accounting loss
|
- | - | 345,707 | 308,751 | 345,707 | |||||||||||||||
|
Interest receivable
|
- | (49,931 | ) | (81,503 | ) | (72,790 | ) | (131,434 | ) | |||||||||||
|
Accrued interest added to principal
|
- | - | - | - | 37,282 | |||||||||||||||
|
Net Change in:
|
||||||||||||||||||||
|
Receivables
|
(388,634 | ) | (2,891,735 | ) | 881,056 | 786,871 | (2,568,584 | ) | ||||||||||||
|
Prepayments and deposits
|
(136,281 | ) | (964,563 | ) | (2,742,677 | ) | (2,449,485 | ) | (3,948,080 | ) | ||||||||||
|
Inventories
|
- | (92,194 | ) | (162,350 | ) | (144,995 | ) | (254,544 | ) | |||||||||||
|
Accounts payable and accrued expenses
|
245,171 | 1,441,270 | 1,608,312 | 1,436,383 | 3,859,565 | |||||||||||||||
|
Net Cash (Used) In Operating Activities
|
(7,045,168 | ) | (15,359,851 | ) | (30,508,919 | ) | (27,247,516 | ) | (57,130,555 | ) | ||||||||||
|
CASH FLOWS FROM INVESTING ACTIVITIES:
|
||||||||||||||||||||
|
Proceeds from sale of trading securities
|
- | - | 1,272,343 | 1,136,330 | 1,272,343 | |||||||||||||||
|
Investment in trading securities
|
- | (710,072 | ) | (377,658 | ) | (337,286 | ) | (377,658 | ) | |||||||||||
|
Other investments
|
- | - | (13,082,295 | ) | (11,683,798 | ) | (13,792,367 | ) | ||||||||||||
|
Acquisition of subsidiary
|
- | (326,526 | ) | - | - | (326,526 | ) | |||||||||||||
|
Acquisition of subsidiary, net cash acquired
|
- | - | (9,198,412 | ) | (8,215,102 | ) | (9,198,412 | ) | ||||||||||||
|
Purchase of property, equipment and motor vehicles
|
(142,292 | ) | (4,640,717 | ) | (3,356,338 | ) | (2,997,546 | ) | (8,151,620 | ) | ||||||||||
|
Proceeds from sale of property, equipment and motor vehicles
|
- | - | 110,100 | 98,330 | 110,100 | |||||||||||||||
|
Net Cash (Used) In Investing Activities
|
(142,292 | ) | (5,677,315 | ) | (24,632,260 | ) | (21,999,072 | ) | (30,464,140 | ) | ||||||||||
|
CASH FLOWS FROM FINANCING ACTIVITIES:
|
||||||||||||||||||||
|
Advances payable - affiliates
|
(1,271,501 | ) | - | - | - | 23,847 | ||||||||||||||
|
Repayment of convertible debenture
|
- | - | - | - | (130,310 | ) | ||||||||||||||
|
Repayment of shareholder advance
|
- | - | - | - | (641 | ) | ||||||||||||||
|
Repayment under finance leases
|
- | - | (353,944 | ) | (316,107 | ) | (418,941 | ) | ||||||||||||
|
Proceeds from convertible debenture payable
|
- | - | - | - | 130,310 | |||||||||||||||
|
Shareholder advance
|
- | - | - | - | 6,621 | |||||||||||||||
|
Proceeds from issuance of stock
|
25,741,103 | 123,751,878 | 2,763 | 2,467 | 153,391,479 | |||||||||||||||
|
Proceeds from issuance of stock by controlled entity
|
- | - | 13,542,008- | 12,094,368 | 16,149,291 | |||||||||||||||
|
Cost of share issues
|
(1,033,749 | ) | (5,964,347 | ) | - | - | (7,255,062 | ) | ||||||||||||
|
Net Cash Provided by financing activities
|
23,435,853 | 117,787,531 | 13,190,827 | 11,780,728 | 159,482,898 | |||||||||||||||
|
Effect of Exchange Rate changes on Cash
|
- | 5,438,981 | (4,661,096 | ) | (4,162,825 | ) | 777,885 | |||||||||||||
|
Net Increase (Decrease) in Cash
|
16,248,393 | 102,189,346 | (46,611,448 | ) | (41,628,685 | ) | 72,666,088 | |||||||||||||
|
Cash at Beginning of Period
|
839,797 | 17,088,190 | 119,277,536 | 106,526,767 | - | |||||||||||||||
|
Cash at End of Period
|
17,088,190 | 119,277,536 | 72,666,088 | 64,898,082 | 72,666,088 | |||||||||||||||
|
Supplemental Disclosures:
|
||||||||||||||||||||
|
Cash paid for interest
|
62,196 | 32,715 | 63,600 | 56,801 | 158,111 | |||||||||||||||
|
Cash paid for income taxes
|
- | - | - | - | - | |||||||||||||||
|
Stock and options issued for services
|
641,361 | 147,588 | - | - | 1,595,523 | |||||||||||||||
|
Accrued interest and stockholder advances charged to paid in capital
|
12,744 | - | - | - | 12,744 | |||||||||||||||
|
Stock issued for exploration agreement
|
518,000 | - | - | - | 518,000 | |||||||||||||||
|
Stock issued for registration payment arrangement
|
364,805 | 900,494 | - | - | 1,265,299 | |||||||||||||||
|
Equipment obtained through a capital lease
|
24,581 | 705,841 | - | - | 730,422 | |||||||||||||||
|
Capital lease obligation for exploration costs
|
362,462 | - | - | - | 362,462 | |||||||||||||||
|
Interest in relation to capital lease for exploration costs
|
42,313 | - | - | - | 42,313 | |||||||||||||||
|
Fair value of warrants in connection with issuance of capital stock
|
- | 1,330,852 | - | - | 1,330,852 | |||||||||||||||
The accompanying notes are integral part of the consolidated financial statements.
F-6
(An Exploration Stage Company)
Notes to Consolidated Financial Statements
|
1.
|
ORGANISATION AND BUSINESS
|
Legend International Holdings, Inc, ("the Company"or “Legend”), was incorporated under the laws of the State of Delaware on January 5, 2001.
The Company has never generated any significant revenues from operations and is still considered an exploration stage company. The Company was initially formed to engage in the business of selling compatible inkjet cartridges and refill kits on the Internet for the consumer printer market. In March 2003, management of the Company decided to engage in the business of building and acquiring controlling or other interests in one or more companies engaged in the contract sales and distribution of specialty medical products, and raise additional capital for this purpose. Neither business was successful and operations of both were eventually discontinued. During fiscal 2004, management of the Company developed a plan of operations to acquire income-producing real property. The Company did not acquire any properties pursuant to such plan.
Following a change of management in November 2004, the Company developed a new plan of operations for fiscal 2006, which is to engage in mineral exploration and development activities. The Company's current business plan calls for the identification of mineral properties where it can obtain secure title to exploration, development and mining interests. The Company’s preference is to identify large minerals deposits with low operating costs. The Company is prepared to consider the exploration, development and mining of profitable base metal interests. At the beginning of 2006, the Company expanded its areas of interest to include diamond exploration activities and in July 2006, the Company completed the acquisition of certain diamond mining tenements in Northern Australia. Since that time, the Company has identified that those mining tenements in Northern Australia also have potential for uranium and base metals. In November 2007, the Company acquired mining tenements prospective for phosphate in the State of Queensland, Australia.
The Company has revised its project strategy for its phosphate project due to the current financial and economic climate. The strategy aims to deliver positive operational cash flow as soon as possible with a reduced capital outlay and the ability to pay for any required infrastructure from this cash flow.
During the economic downturn of 2008, Legend also decided that part of the Company’s strategy should be to invest into undervalued mining projects should opportunities arise. This investment would not detract from Legend’s primary goal of developing the Phosphate Project and had the aim of diversifying interests to dilute the effect of identified potential project risks. This was seen as necessary by the Company due to the obviously volatile and unpredictable nature of the commodity markets at the time. Some of these investments include taking a major stake in North Australian Diamonds Ltd (NADL) which controls the Merlin Diamond Mine and includes NADL’s 25% interest (increased to 28% since December 31, 2009) in Top End Uranium Ltd in the Northern Territory, Australia and an investment in Northern Capital Resources Corporation which controls gold and zinc assets in Nova Scotia, Canada. These are outlined in further detail below.
Legend’s initial plan was to develop the phosphate deposits with a staged approach. All of these stages, as described below, have been progressed during the year. Legend formed a strategic alliance with Wengfu in November 2009 and based on initial recommendations from the work they have conducted so far, the Company will be issuing a revised project timeline and strategy upon completion of the feasibility study in the second quarter of fiscal 2010 which is being conducted by Wengfu. The revised strategy and timeline may involve a different combination or prioritization of the various stages currently being developed.
Stage 1 aims to begin production with mining of known high grade material at Paradise North and D-Tree North deposits which require little or no beneficiation. This material is referred to as ‘direct shipping ore’ (DSO). Based on recommendations by Wengfu, final development of this stage is awaiting results from the feasibility study which is due for completion in the second quarter of fiscal 2010 whereby a revised project timeline will be issued.
Stage 2 of the project involves beneficiation of phosphate rock, through flotation, at the Paradise South deposit and secondly the D-Tree deposit to achieve production of large volumes of high grade phosphate rock concentrate. Although named Stage 2 it is being concurrently developed with Stage 1.
F-7
Stage 3 will develop value added phosphate fertiliser and phosphate speciality chemical products in the Mt Isa region. This stage may be prioritized depending on the international market price for phosphate rock and Legend’s view on the longer term Phosphate price that may be achieved. The fact that higher margins can be achieved with less material to be transported on the rail line makes this an attractive option. Construction of a phosphoric acid plant in Mt Isa will be required for this stage in conjunction with an increase in capacity of beneficiated rock product of approximately 1.4Mtpa (provided all 5mtpa from stage 2 is being consumed). After the phosphoric acid stream is online, the acid can be marketed and production of various fertiliser and specialty phosphate products can also be investigated. Depending on the composition of the acid that is produced, a variety of products may be produced, ranging from fertilisers, food grade and technical grade acids.
During the year, the Company acquired interests in entities as follows:
|
|
·
|
in late May 2009, the Company increased its interest in NADL from 14.9% to 19.9% and from that date to July 31, 2009, accounted for NADL as an unconsolidated entity;
|
|
|
·
|
in early August 2009, the Company increased its interest in NADL to 55% and from that date to November 30, 2009, consolidated the results of NADL;
|
|
|
·
|
in early December 2009, NADL issued shares, which diluted the Company’s interest to 47.83% and the Company consolidated NADL at that rate for December 2009; and
|
|
|
·
|
in late October 2009, the Company took a private placement in Northern Capital Resources Corp (“NCRC”) and held a 21.29% interest, and accounted for NCRC as an unconsolidated entity from that date.
|
Legend intends to spin out to a new company the diamond, gold and base metal interests of Legend of which Legend shareholders will receive shares of common stock on a pro rata basis to the shares they hold in Legend. Following the spin out, Legend will be a 100% pure phosphate company.
Exploration Stage Enterprise
The Company complies with ASC Topic 930 Extractive activities its characterization of the company as an exploration stage enterprise. The Company is devoting all of its present efforts in securing and establishing its exploration business through field sampling and drilling programs in the State of Queensland and the Northern Territory of Australia.
|
2.
|
RECENT ACCOUNTING PRONOUNCEMENTS
|
In June 2009, the Financial Accounting Standards Board (“FASB”) issued the FASB Accounting Standards Codification and the Hierarchy of Generally Accepted Accounting Principles, also known as FASB Accounting Standards Codification (“ASC”) 105-10, Generally Accepted Accounting Principles, (“ASC 105-10”). ASC 105-10 establishes the FASB Accounting Standards Codification (“Codification”) as the single source of authoritative US GAAP recognized by the FASB to be applied by nongovernmental entities. Rules and interpretive releases of the Securities and Exchange Commission (“SEC”) under authority of federal securities laws are also sources of authoritative US GAAP for SEC registrants. The subsequent issuances of new standards will be in the form of Accounting Standards Updates (“ASU”) that will be included in the Codification. Generally, the Codification is not expected to change US GAAP. All other accounting literature excluded from the Codification will be considered nonauthoritative. This ASC is effective for financial statements issued for interim and annual periods ending after September 15, 2009. The Company adopted this ASC for our quarter ended September 30, 2009. The adoption did not have any effect on our financial condition or results of operations. All accounting references have been updated, and therefore SFAS references have been replaced with ASC references.
In December 2007, the FASB issued amended ASC Topic 805, Business Combinations. ASC 805 establishes principles and requirements for how the acquirer of a business recognizes and measures in its financial statements the identifiable assets acquired and the liabilities assumed. The provisions of ASC 805 are effective for the Company’s fiscal year beginning January 1, 2009 which applies prospectively to all business combinations entered into on or after such date. Legend’s acquisition of NADL (see note 6) was and any other future acquisitions will be impacted by application of this statement.
F-8
In December 2007, the FASB issued accounting guidance contained within ASC 810, Consolidation (“ASC 810-10-65”), regarding noncontrolling interests. ASC 810-10-65 establishes accounting and reporting standards for the noncontrolling interest in a subsidiary and for the deconsolidation of a subsidiary. It clarifies that a noncontrolling interest in a subsidiary is an ownership interest in the consolidated entity that should be reported as equity in the consolidated financial statements. The adoption of ASC 810-10-65 revised our presentation of consolidated financial statements and further impact will continue to be dependent on our future changes in ownership in subsidiaries after the effective date.
The Company adopted the “Financial Instruments Topic”, ASC 825 on April 1, 2009. This standard requires disclosures about fair value of financial instruments in interim financial statements as well as in annual financial statements.
Effective January 1, 2009, the Company adopted the provisions of ASC Topic 820, Fair Value Measurements and Disclosures. This topic defines fair value, establishes a hierarchal disclosure framework for measuring fair value, and requires expanded disclosures about fair value measurements. The provisions of this topic apply to all financial instruments that are being measured and reported on a fair value basis. The adoption of ASC 820 has not and is not expected to have a material impact on the Company’s financial position or results of operations.
In August 2009, the FASB issued Accounting Standards Update No. (ASU) 2009-05, Fair Value Measurements and Disclosures (Topic 820) - Measuring Liabilities at Fair Value. The fair value measurement of a liability assumes transfer to a market participant on the measurement date, not a settlement of the liability with the counterparty. ASU 2009-05 describes various valuation methods that can be applied to estimating the fair value of liabilities, requires the use of observable inputs and minimizes the use of unobservable valuation inputs. ASU 2009-05 is effective for the fourth quarter of 2009. The adoption of ASU 2009-05 did not have a material impact on the Company’s financial position, results of operations or cash flows.
In May 2009, the FASB issued ASC 855, Subsequent Events, on the accounting for and disclosure of events that occur after the balance sheet date. This guidance was effective for interim and annual financial periods ending after June 15, 2009. This guidance was amended in February 2010. It requires an entity that is a SEC filer to evaluate subsequent events through the date that the financial statements are issued.
In January 2010, the FASB issued ASU 2010-02, Consolidation (Topic 810) – Accounting and Reporting for Decreases in Ownership of a Subsidiary – A Scope Clarification. ASU 2010-02 clarifies the scope of the decrease in the ownership provisions of Subtopic 810 and expands the disclosure requirements about deconsolidation of a subsidiary or de-recognition of a group of assets. ASU 2010-02 is effective beginning in the first interim of annual reporting period ending on or after December 15, 2009. The amendments in ASU 2010-02 must be applied retrospectively to the first period that an entity adopted SFAS 160. The adoption of ASU 2010-02 did not have any impact on the Company’s financial position, results of operations or cash flows.
In January 2010, the FASB issued ASU 2010-06, Fair Value Measurements and Disclosures (Topic 820) – Improving Disclosures about Fair Value Measurements. This ASU requires new disclosures and clarifies certain existing disclosure requirements about fair value measurements. ASU 2010-06 requires a reporting entity to disclose significant transfers in and out of Level 1 and Level 2 fair value measurements, to describe the reasons for the transfers and to present separately information about purchases, sales, issuances and settlements for fair value measurements using significant unobservable inputs. ASU 2010-06 is effective for interim and annual reporting periods beginning after December 15, 2010; early adoption is permitted. The Company does not expect the adoption of ASU 2010-06 will have a material impact on our financial position, results of operation or cash flows.
F-9
|
3.
|
SUMMARY OF SIGNIFICANT ACCOUNTING POLICIES
|
Mineral Property Acquisition, Exploration Costs and Amortization of Mineral Rights
Mineral property acquisition, exploration and development costs are expensed as incurred until such time as economic reserves are quantified. To date, the Company has not established any proven or probable reserves on its mineral properties. When it is determined that a mining deposit can be economically and legally extracted or produced based on established proven and probable reserves, further exploration costs and development costs incurred after such determination will be capitalized. The establishment of proven and probable reserves is based on results of final feasibility studies which indicate whether a property is economically feasible. Upon commencement of commercial production, capitalized costs will be transferred to the appropriate asset category and amortized over their estimated useful lives. Capitalized costs, net of salvage values, relating to a deposit which is abandoned or considered uneconomic for the foreseeable future, will be written off. Mineral rights are amortized over their estimated useful lives being the Company’s estimated rights to tenure.
Stock Options
For the issuances of stock options, the Company follows the fair value provisions of FASB issued guidance now codification ASC Topic 718, “Compensation-Stock Compensation”. Topic 718 requires the Company to measure the cost of employee services received in exchange for an award of equity instruments based on grant date fair value. The cost will be recognised over the period during which an employee is required to provide service in exchange for the award – usually the vesting period. In the case where there is no required service period, the fair value of the equity instruments is expensed immediately.
Comprehensive Income (Loss)
The Company follows ASC Topic 220 “Comprehensive Income” (“ASC 220”). ASC 220 requires a company to report comprehensive profit (loss) and its components in a full set of financial statements. Comprehensive income (loss) is the change in equity during a period from transactions and other events and circumstances from non-owner sources such as unrealized gains (losses) on foreign currency translation adjustments. Changes in unrealized foreigh currency translation adjustments during fiscal 2007, 2008 and 2009 amounted to A$nil, A$nil and A$427,019 respectively. Accordingly, the Company’s comprehensive (loss) for the years ended December 31, 2007, 2008 and 2009 amounted to A$8,638,129, A$14,221,560 and AS39,925,689 respectively
Inventories
Materials and Supplies
Materials and supplies are valued at the lower of average cost or net realizable value.
Loss per Common Share
Basic loss per share is computed on the basis of the weighted average number of common shares outstanding during each year. Diluted loss per share is not presented as the effect of Common Stock equivalents would be anti dilutive. The options to purchase 18,066,830 shares of common stock are not included in the loss per share computation as such amounts would be anti-dilutive.
Property and Equipment
Property and equipment is stated at cost. The Company records depreciation and amortization, when appropriate, using straight-line method over the estimated useful lives of the assets. Expenditures for maintenance and repairs are charged to expense as incurred. Additions, major renewals and replacements that increase the property's useful life are capitalized. Property sold or retired, together with the related accumulated depreciation is removed from the appropriate accounts and the resultant gain or loss is included in net income (loss).
|
At December 31, 2009
|
At December 31, 2008
|
||||||||||||||||||||||||||
|
Depreciable
Life
(in years)
|
Cost
A$
|
Accumulated
Depreciation
A$
|
Net Book
Value
A$
|
Cost
A$
|
Accumulated
Depreciation
A$
|
Net Book
Value
A$
|
|||||||||||||||||||||
|
Land
|
1,101,358 | - | 1,101,358 | 1,101,358 | - | 1,101,358 | |||||||||||||||||||||
|
Buildings
|
40 | 2,968,213 | (43,235 | ) | 2,924,978 | 1,435,249 | (3,828 | ) | 1,431,421 | ||||||||||||||||||
|
Leasehold Improvements
|
1-2 | 235,831 | (35,790 | ) | 200,041 | 178,944 | (6,385 | ) | 172,559 | ||||||||||||||||||
|
Motor Vehicles
|
5 | 1,001,863 | (234,199 | ) | 767,664 | 897,482 | (64,970 | ) | 832,512 | ||||||||||||||||||
|
Equipment
|
1-10 | 2,135,498 | (282,626 | ) | 1,852,872 | 435,340 | (50,559 | ) | 384,781 | ||||||||||||||||||
|
Lear Jet
|
5 | 1,270,869 | (352,345 | ) | 918,524 | 1,270,869 | (98,171 | ) | 1,172,698 | ||||||||||||||||||
|
Construction in Progress
|
708,217 | - | 708,217 | 225,296 | - | 225,296 | |||||||||||||||||||||
| 9,421,849 | (948,195 | ) | 8,473,654 | 5,544,538 | (223,913 | ) | 5,320,625 | ||||||||||||||||||||
F-10
The fair value of assets acquired on acquisition of a subsidiary was A$690,419. The depreciation expense for the year ended December 31, 2009 amounted to A$757,234 (US$676,286) and for the year ended December 31, 2008 amounted to A$202,943 and accumulated depreciation on assets written off and/or disposed of for the year ended December 31, 2009 was A$32,952 (US$29,429) and for the year ended December 31, 2008 was A$nil. Net book value of assets written off for the year ended December 31, 2009 amounted to A$117,411 (US$104,860).
Principles of Consolidation
The consolidated financial statements include the assets and liabilities of the Company and the entities it controlled at the end of the financial period and the results of the Company and the entities it controlled during the year. Where entities are not controlled throughout the entire financial year, the consolidated results include the results of those entities for that part of the period during which control exists. The effect of all transactions between entities in the group and the inter-entity balances are eliminated in full in preparing the consolidated financial statements.
Fair Value of Financial Instruments
FASB issued ASC Topic 825, "Financial Instruments", which requires the Company to disclose, when reasonably attainable, the fair market values of its assets and liabilities which are deemed to be financial instruments. Legend's financial instruments consist primarily of cash, accounts receivable, accounts payable and accrued expenses. The Company believes that the fair value of the Company’s financial instruments approximate their respective fair values because of the short maturities of those instruments.
Reclassifications
Certain amounts in the 2008 financial statements are reclassified to conform to the 2009 presentation with no effects on net loss.
Federal Income Tax
ASC Topic 740 prescribes how a company should recognise, measure, present and disclose in its financial statements uncertain tax positions that the Company has taken or expects to take on a tax return. Additionally for tax positions to qualify for deferred tax benefit recognition under ASC 740, the position must have at least “more than likely not” chance of being sustained upon challenge by the respective taxing authorities, and whether or not it meets that criteria is a matter of significant judgement. The Company believes that it does not have any uncertain tax positions that would require the recording of a potential tax liability,
The Company follows the asset and liability approach which requires the recognition of deferred tax liabilities and assets for the expected future tax consequences of temporary differences between the carrying amounts and the tax basis of assets and liabilities. For the period presented, there was no taxable income. There are no deferred income taxes resulting from temporary differences in reporting certain income and expense items for income tax and financial accounting purposes. The Company, at this time, is not aware of any net operating losses which are expected to be realised.
Foreign Currency Translation
The Company’s functional and reporting currency is the Australian dollar. Revenue and expenses incurred in a currency other than the reporting currency, Australian dollars are translated at the date incurred or invoiced. Assets and liabilities are re-valued at the period end exchange rate where appropriate. Gains or losses from foreign currency transactions are included in the results of operations .Foreign currency exchange gain/loss in 2009 and 2008 is primarily as a result of the translation of cash maintained in US banking institutions and amounted to a loss of A$4,661,096 (US$4,162,825) in 2009 and a gain of A$5,389,750 in 2008.
F-11
Goods and Services Tax (“GST”)
Revenues, expenses and assets generated in Australia are subject to Australian GST which requires the supplier to add a 10% GST to predominately all expenses and the cost of assets and for the Company to include a 10% GST to the selling price of a product. Revenues, expenses and assets are recognized net of the amount of GST except where the GST incurred on a purchase of goods and services is not recoverable from the taxation authority, in which case the GST is recognized as part of the cost of acquisition of the assets or as part of the expense item as applicable, and receivables and payables are stated with the amount of GST included. The net amount of GST recoverable from, or payable to, the taxation authority is included as part of receivables or payables in the balance sheet. Cash flows are included in the cash flow statement on a gross basis and the GST component of cash flows arising from investing and financing activities which is recoverable from, or payable to, the taxation authority are classified as operating cash flows. Commitments and contingencies are disclosed net of the amount of GST recoverable from, or payable to, the taxation authority
Reclamation and Remediation Obligations (Asset Retirement Obligations)
Reclamation costs are allocated to expense over the life of the exploration activity and are periodically adjusted to reflect changes in the estimated present value resulting from the passage of time and revisions to the estimates of either the timing or amount of the reclamation and remediation costs. The asset retirement obligation is based on when the spending for an existing environmental disturbance will occur. The Company reviews, on at least an annual basis, the asset retirement obligation at each exploration site.
Future remediation costs are accrued based on management’s best estimate at the end of each period of the costs expected to be incurred. Such cost estimates include, where applicable, plugging of drill holes, removal of consumables and ripping of drill pads and tracks. Changes in estimates are reflected in earnings in the period an estimate is revised.
Accounting for reclamation and remediation obligations requires management to make estimates unique to each exploration operation of the future costs the Company will incur to complete the reclamation and remediation work required to comply with existing laws and regulations. Actual costs incurred in future periods could differ from amounts estimated. Additionally, future changes to environmental laws and regulations could increase the extent of reclamation and remediation work required. Any such increases in future costs could materially impact the amounts charged to earnings for reclamation and remediation.
Concentrations of credit risk
The Company monitors its position with, and the credit quality of, the financial institution it invests with. As of the balance sheet date, and periodically throughout the year, the Company has maintained balances in various operating accounts in excess of federally insured limits.
Convenience Translation to US$
The consolidated financial statements as of and for the year ended December 31, 2009 have been translated into United States dollars using the rate of exchange of the United States dollar at December 31, 2009 (A$1.00=US$0.8931). The translation was made solely for the convenience of readers in the United States.
Use of Estimates
The preparation of financial statements in conformity with accounting principles generally accepted in the United States of America requires management to make estimates and assumptions that affect the reported amounts of assets and liabilities and disclosure on contingent assets and liabilities at the date of the financial statements, and the reported amounts of revenues and expenses during the reporting period. Actual results could differ from those estimates.
|
4.
|
CONCENTRATIONS OF RISKS
|
Cash Balances
Cash consists of all cash balances and highly liquid investments with an original maturity of three months or less. Because of the short term maturity of these investments, the carrying amounts approximate their fair value.
The Company held in interest bearing cash accounts at December 31, 2009, A$71,623,812 (US$63,967,226) in Australian banking institutions and A$1,042,256 (US$930,856) in US banking institutions.
F-12
Mineral Rights and Foreign Operations
The Company has mineral rights in Australia.
|
5.
|
DEPOSITS
|
Deposits held by the Company consist of
|
December 31
|
||||||||
|
2009
A$
|
2008
A$
|
|||||||
|
Term Deposit as security for a Banker’s Undertaking
|
2,130,988 | 642,109 | ||||||
|
Other
|
1,604 | 1,603 | ||||||
|
Cash deposits provided to Government Departments for the purpose of guaranteeing
the Company’s performance in accordance with mining law
|
526,902 | 150,000 | ||||||
| 2,659,494 | 793,712 | |||||||
|
6.
|
ACQUISITIONS/INVESTMENTS
|
The following is the summary of the Company’s acquisitions and investments.
Teutonic Minerals Pty Ltd
On February 27, 2008, the Company entered into a Share Sale Agreement whereby the Company agreed to purchase all of the issued and outstanding shares of Teutonic Minerals Pty Ltd. As a result, Teutonic became a subsidiary of the Company from that date. Teutonic held an application for a mineral licence over phosphate in the Georgina Basin in the State of Queensland, Australia. The consideration payable to the vendors was A$300,000, and the Company granted the vendors a 1% gross revenue royalty from production from the mineral licence and incurred legal costs of A$26,526. The mineral licence application held by Teutonic was withdrawn on March 17, 2008 and replaced by a mineral application lodged by the Company. Teutonic had no other assets or liabilities. As at December 31, 2008 the net assets and liabilities acquired by the Company have no value. The consideration and legal costs of A$326,526 paid by the Company are included as impairment of investment in the accompanying consolidated statement of operations for the year ended December 31, 2008.
Mt Isa Mines Ltd (D-Tree Joint Venture)
On October 27, 2008, the Company entered into a Heads of Agreement with Mt. Isa Metals Ltd. (“MET”) for the formation of an unincorporated Joint Venture (“JV”) over each party’s respective interest in tenements overlying the D-Tree phosphate deposit. Under the JV, Legend will contribute tenements EPM 14753, EPMA’s 17333, 17437, 17443 and 17446, and, MET will contribute tenement EPM 15763 (D-Tree West). Legend managed and held an 80% interest in the JV and MET held a 20% contributing interest in the JV. The JV has access to plant and infrastructure at Legend’s 100% owned proposed Lady Annie phosphate development, which lies 9 miles to the east of D-Tree. The Heads of Agreement was replaced by a formal JV agreement. Under the joint venture, the Company as manager, incurs all costs and these are treated as exploration expenditure in the Company’s records. The Company invoices the joint venture partner for 20% of the joint venture expenditure and this is recorded as a joint venture recovery against the exploration expenditure. The joint venture has no assets and as liabilities are incurred in the name of the manager, the liabilities of the joint venture are included in accounts payable and accrued expenses. During 2008, the joint venture incurred exploration costs totalling approximately A$3,200,000 of which the Company has recorded its proportionate share (80%) of such costs which amounted to approximately A$2,550,000 which are included in exploration expenditure in the accompanying consolidated statement of operations. In addition, approximately A$650,000 is due from the joint venture partner at December 31, 2008 which is included in receivables in the accompanying consolidated balance sheet. In September 2009 MET exited from the JV. Legend, as manager of the D-Tree Joint Venture, had invoiced MET $1.739 million for MET’s 20% interest in the D-Tree project for the period September 1, 2008 to June 30, 2009. MET decided to dilute rather than pay the invoices and in accordance with the JV agreement, MET’s interest reduced to less than 5%, thus requiring MET to exit the JV. The account receivable recorded for MET was expensed to exploration expenditure. MET retained a royalty of A$0.50 per tonne from product from the D-Tree JV tenements. No royalty payments are payable until D-Tree commences production.
F-13
North Australian Diamonds Ltd
The Company is increasing its diamond exploration activity in the proximity of the Merlin diamond mine in the Northern Territory and is continually sourcing new ground in this region which is one of the most diamond prospective areas in Australia. As part of this strategy, the Company acquired a 14.9% interest in North Australian Diamonds Ltd (“NADL”), an Australian diamond exploration corporation, at a cost of approximately A$2,400,000 in February 2009. NADL owns the Merlin diamond mine and surrounding tenements. The Company’s President and Chief Executive Officer is Executive Chairman of NADL. The Company believes the acquisition of NADL will assist in the opportunity to discover diamond deposits.
On May 12, 2009, the Company made an on market takeover offer for all of the shares in NADL, an Australian corporation (see note 1). The takeover offer concluded on August 6, 2009 with an additional investment of approximately A$11,600,000. At close of the offer, the Company held 55% of the issued and outstanding shares of NADL. At the end of May 2009, the Company had increased its interest in NADL from 14.9% to 19.9% and equity accounted the results of NADL for June and July 2009. The Company’s equity accounted results of NADL for this period was a loss of A$182,667 (US$163,139).
The transaction was accounted for using the acquisition method required by ASC Topic 805, Business Combinations. Accordingly, goodwill has been measured as the excess of the total consideration including the fair value of the non-controlling interest on acquisition date over the amounts assigned to the identifiable assets acquired and liabilities assumed. On the acquisition date, the fair value of the non-controlling interest was A$10,261,290. The fair value of non-controlling interest was based on an estimate of the fair value of NADL’s identifiable assets. The assignment of the total consideration including the fair value of the non-controlling interest as of acquisition is as follows:
|
A$
|
||||
|
Cash and cash equivalents
|
2,418,161 | |||
|
Receivables
|
1,125,948 | |||
|
Inventory
|
17,257 | |||
|
Property, plant & equipment (net)
|
690,419 | |||
|
Prepayments
|
113,055 | |||
|
Investment
|
857,463 | |||
|
Deposits
|
312,116 | |||
|
Mineral rights
|
18,873,000 | |||
|
Accounts payable & accruals
|
(1,312,311 | ) | ||
|
Rehabilitation provision
|
(291,902 | ) | ||
|
Total fair value excluding goodwill
|
22,802,866 | |||
|
Goodwill
|
1,092,950 | |||
|
Total fair value
|
23,895,816 | |||
|
Fair value of non-controlling interest
|
10,261,290 | |||
|
Total consideration
|
13,634,526 | |||
Fair valuation methods used for identifiable net assets acquired in that acquisition make use of independent experts’ reports prepared for NADL as part of its Target’s Statement to respond to the on market takeover offer. Included within the report is the valuation of Mineral Rights of the mineral properties of NADL of A$21,700,000 which has been determined on two bases; (i) certain mineral properties with mineralized material has been valued at A$18,873,000; and (ii) certain mineral properties with a value of A$2,827,000 have been valued on the basis of a multiple of historic exploration expenditure. Under US GAAP, exploration expenditure is expensed to the Income Statement as incurred, unless there is a reserve on the property. The Company has not included in the fair value of the identified assets that part of the valuation based on a multiple of historic exploration expenditure. Accordingly, the Company has attributed a fair value of A$18,873,000 to Mineral Rights.
The underlying mineral property licences have a set term and the Mineral Rights are being amortized over the term of the licences. The amortization charge for the year ended December 31, 2009 is A$582,710 and the net carrying value of Mineral Rights at December 31, 2009 is A$18,290,290.
F-14
Goodwill of A$1,092,950 recognises the inherent value of prospective exploration interest not recognised as such values are not capable of being capitalized to the balance sheet under US GAAP. Goodwill is not deductible for tax purposes.
Management believes that the carrying value of receivables of A$1,125,948, which is the gross contractual amount represents fair value at acquisition date and does not have any evidence that the amount will not be collectable.
On the acquisition date, goodwill of A$1,092,950 was recorded into the accounts. In accordance with ASC Topic 350, Intangibles - “Goodwill and Other”, the Company completed an impairment test and determined that the goodwill recorded at the acquisition date was not impaired at December 31, 2009.
The acquisition of NADL was achieved in stages. The acquisition date fair value of the equity interest in NADL immediately before the acquisition date was A$8,979,769 and the amount of the gain recognized as a result of remeasuring to fair value the equity interest in NADL before the business combination amounted to A$2,200,620 and has been recognized in the consolidated statement of operations as “Adjustment to fair value on stepped acquisition”.
In early December 2009, NADL issued shares in exchange for cash proceeds of A$13,562,350 (costs of issue A$20,342) to Attara Capital LLC and others (third parties) which had the effect of diluting the Company’s interest in NADL to 47.83%. Under Australian takeover laws, the Company was prevented from purchasing further shares in NADL for a period of 6 months from the conclusion of the takeover (August 6, 2009). Accordingly, it was not until February 6, 2010 that the Company was entitled to purchase any further shares in NADL under Australian Corporations Law. Since February 6, 2010, the Company has purchased further shares in NADL and its current interest is approximately 50%. It is the Company’s intention to continue to acquire shares and continue to maintain a controlling interest in NADL. Furthermore, management of the Company believes it has the ability to control the operations of NADL through its share ownership as well as having three of the four Directors of NADL and control of the management of the day to day operations. It is management’s conclusion that the Company has a controlling financial interest in NADL and accordingly, it should continue to consolidate NADL’s results into the Company.
The amount of revenue of NADL since the acquisition date included in the consolidated statement of operations for the reporting period is A$nil and the amount of loss is A$1,864,524.
The consolidated statement of operations include the operations since August 6, 2009, which is the acquisition date. The following unaudited pro-forma information presents the results of operations for the year ended December 31, 2009 and 2008, as if the acquisition of NADL had occurred on January 1, 2008.
|
2009
A$
|
2008
A$
|
|||||||
|
Revenue
|
- | - | ||||||
|
Net loss
|
(38,571,013 | ) | (15,921,885 | ) | ||||
|
Basic and diluted earnings per share
|
(0.17 | ) | (0.08 | ) | ||||
Since the balance sheet date, the Company has increased its interest in North Australian Diamonds Ltd by 2.20% at a cost of A$2,430,650.
Northern Capital Resources Corp
In the third fiscal quarter of 2009, Legend took a private placement from Northern Capital Resources Corporation (“NCRC”), a Nevada Corporation. NCRC holds a majority interest in Golden River Resources Corporation (“GRR”) and GRR holds a 68.7% interest in TSX listed Acadian Mining Corporation, which has significant gold and base metal interests in Canada. The Company has acquired 43,435,841 issued and outstanding shares in NCRC at a cost of A$10,097,818. At December 31, 2009, the Company held a 21.29% interest in NCRC. The Chairman of the Board and Chief Executive Officer of the Company, is also the Chairman of the Board and Chief Executive Officer of NCRC and certain companies with which Mr Gutnick is associated own approximately 51.05% of the outstanding common stock of NCRC. Mr JI Gutnick is one of six directors (four of the directors are independent of NCRC) of the Company and was not present at the meeting that approved the acquisition of shares in NCRC. The Company has accounted for the investment in NCRC using the equity method. At December 31, 2009, the value of the investment was A$9,648,696. For the year ended December 31, 2009, the Company recorded equity loss in NCRC of A$78,287.
F-15
Top End Uranium Ltd
The Company via NADL has a 25% interest in Top End Uranium (“TEU”) which has a carrying value of A$760,997 at December 31, 2009. NADL accounts for the investment in TEU using the equity method. For the year ended December 31, 2009, the Company recorded equity loss in TEU of A$74,754. Since the balance date NADL has increased its interest in TEU to 28%.
|
7.
|
STOCKHOLDERS EQUITY
|
Common Stock
In January 2001, 4,297,500 common shares were issued to the Company's founder for organization cost valued at A$124,446 (US$95,500), and 146,250 common shares were issued to a related party in exchange for consulting fee valued at A$4,235 (US$3,250).
In March 2002, 11,250,000 common shares were issued to the Company's founder in exchange for present and future services valued at A$162,888 (US$125,000).
In April 2002, the Company closed its offering under its registration statement filed with the United States Securities and Exchange Commission to sell up to 4,500,000 shares of its Common Stock at US$0.022 per share, which became effective on April 11, 2001. The Company sold 841,500 shares (616,500 shares in 2001 and a further 225,000 shares in 2002) of its Common Stock under the offering.
In 2003, a total of 5,026,500 common shares were issued to the Company's sole officer and director for services valued at A$145,556 (US$111,700) or A$0.029 (US$0.022) per share.
In 2004, a total of 2,004,750 common shares were issued to the Company’s former sole officer and director for services valued at A$58,053 (US$44,550) or A$0.029 (US$0.022) per share.
In December 2004, the Company issued to Renika Pty Limited (“Renika”), a company associated with Mr J I Gutnick, 20,250,000 options to be converted into 20,250,000 shares of Common Stock, at an exercise price of US$0.022 and a latest exercise date of December 2009 for services to be rendered to the Company. The Company undertook a Black Scholes valuation of these options using a A$0.029 (US$0.022) exercise price, US$0.022 market price, 5 year life, risk free interest rate of 5.155% and a volatility of 16.7%. The 20,250,000 options were valued at A$160,672 (US$123,300) or A$0.008 (US$0.006) each. The stock options were issued for services rendered, to be rendered and for agreeing to provide financial assistance to the Company (not the actual provision of financial assistance). The issue of the stock options was not contingent upon any further services or events. The stock options are not forfeitable if the services or financial assistance are not provided. Accordingly, the value of the stock options were expensed during 2004.
In September 2005, Renika exercised the 20,250,000 options using the cashless exercise feature and were issued 17,085,938 shares of Common Stock.
Effective as of December 12, 2005, the Board of Directors of Company approved the distribution to all stockholders for no consideration of an aggregate of 36,135,500 non-transferable options, each of which is exercisable to purchase one share of Common Stock of the Company at an exercise price of US$0.25 cents per share with a latest exercise date of December 31, 2012. The options were issued on a pro-rata basis to all stockholders of record on December 31, 2005 on the basis of two (2) options for every one (1) share of Common Stock owned by a stockholder on the record date. The options may not be exercised until the shares underlying the options are registered under federal and state securities laws.
At December 31, 2005 the Company had outstanding 36,135,500 options and as at December 31, 2006, the Company had outstanding 1,388,280 options, each of which is exercisable to purchase one share of Common Stock at US$0.25 per share. The options cannot be exercised, other than using the cashless exercise feature, until the Company registers the shares of Common Stock to be issued upon exercise of the options in accordance with the Securities Act of 1933, as amended and any applicable state securities laws. The only exception is in the case of a cashless exercise.
F-16
Effective July 21, 2006, Legend issued 71,730,079 shares of Common Stock to Renika Pty Ltd (“Renika”), a company associated with Mr. J I Gutnick, President of Legend, following the cashless exercise of 34,778,220 options. The shares of Common Stock issued are restricted shares.
Between September 19, 2006 and November 17, 2006, Legend issued 11,703,728 shares of Common Stock at a placement price of US$0.22 per share raising A$3,425,662. The securities were issued pursuant to a private placement and are issued in reliance upon an exemption from the registration requirements of the Securities Act of 1933, as amended (“The Act”) under Section 4(2) of the Act.
Effective November 30, 2006, Legend issued a further 112,500 shares of Common Stock and 50,000 options with an exercise price of A$0.25 per option and a latest exercise date of December 12, 2012 for no consideration to settle outstanding matters with an external party. The Company has valued these shares and options at A$35,416.
Effective December 31, 2006, Legend issued a further 1,053,000 shares of Common Stock at a placement price of US$0.33 raising A$445,705 (US$351,000). The securities were issued pursuant to a private placement and are issued in reliance upon an exemption from the registration requirements of the Securities Act of 1933, as amended (“the Act”) under Section 4 (2) of the Act.
In December 2006, 19,000 options issued with no exercise price were exercised and the Company issued 24,750 shares of Common Stock.
In December 2006, 351,000 options were exercised using the cashless exercise feature and the Company issued 526,500 shares of Common Stock.
Between January 1, 2007 and September 30, 2007, Legend issued a further 29,136,624 shares of Common Stock raising A$8,816,411 (US$7,226,906). The securities were issued pursuant to a private placement and are issued in reliance upon an exemption from the registration requirements of the Securities Act of 1933 as amended (“The Act”) under Section 4(2) of the Act.
Effective June 15, 2007, Legend issued a further 200,000 shares of Common Stock for consulting fees amounting to A$59,074 (US$50,000).
Between July 1, 2007 and September 30, 2007, Legend issued a further 2,150,200 shares of Common Stock for consulting fees amounting to A$614,469 (US$537,550).
On December 12, 2007, Legend issued a further 18,750,000 shares of Common Stock at a placement price of US$0.80 per share raising A$16,924,292 (US$15,000,000). The securities were issued pursuant to a private placement and are issued in reliance upon an exemption from the registration requirements of the Securities Act of 1933 as amended (“The Act”) under Section 4(2) of the Act.
Between October 1, 2007 and December 31, 2007, Legend issued a further 500,000 shares of Common Stock for part settlement of acquisition of exploration permits amounting to A$518,000 (US$475,000).
Between October 1, 2007 and December 31, 2007, Legend issued a further 254,000 shares for consulting fees amounting to A$330,564 (US$289,420).
Between October 1, 2007 and December 31, 2007, Legend issued a further 200,000 shares of Common Stock as a result of delays in lodging a registration statement amounting to A$364,805 (US$318,000).
Between January 1, 2008 and June 30, 2008, Legend issued a further 457,809 shares of common stock as a result of delays in lodging a registration statement amounting to A$900,495 (US$757,015).
F-17
On June 3, 2008, Legend issued 42,000,000 shares of common stock at a placement price of US$2.50 per share raising A$110,028,293 (US$105,000,000). The securities were issued pursuant to a private placement and are issued in reliance upon an exemption from the registration requirements of the Securities Act of 1933 as amended (“The Act”) under Section 4(2) of the Act. The direct costs of the offering totalled approximately A$5,920,448. As additional consideration, the Company issued to the agents 840,000 warrants to purchase common stock with an exercise price of US$2.50 per warrant. The warrants are exercisable at any time up to June 3, 2010. The fair value of the warrants was A$1,330,852 (US$919,219).
Between April 1, 2008 and June 30, 2008, 1,332,000 options were exercised using the cashless exercise feature and the Company issued 1,274,584 shares of common stock.
Between April 1, 2008 and June 30, 2008, 108,000 options were exercised for US$0.111, total amount received A$12,544 (US$11,988.00) and the Company issued 108,000 shares of common stock.
Between April 1, 2008 and June 30, 2008, Legend issued a further 30,800 shares for consulting fees amounting to A$147,588 (US$138,600).
Effective July 14, 2008, the Company entered into a Shares Option Agreement with the Indian Farmers Fertilizer Cooperative Limited (“IFFCO”) to finance the Company’s operations.
Under the Share Options Agreement, IFFCO received options to purchase 30 million shares of Common Stock of the Company on the following terms:
|
|
a.
|
5,000,000 options, at an exercise price of US$2.50 per share and expiring 60 days from July 11, 2008;
|
|
|
b.
|
8,000,000 options, at an exercise price of US$3.00 per share and expiring 12 months from July 11, 2008;
|
|
|
c.
|
8,000,000 options, at an exercise price of US$3.50 per share and expiring 18 months from July 11, 2008;
|
|
|
d.
|
9,000,000 options, at an exercise price of US$4.00 per share and expiring 24 months from July 11, 2008.
|
During the third quarter of 2008, the 5,000,000 options issued to IFFCO, at an exercise price of US$2.50 per share and expiring 60 days from July 11, 2008 were exercised on August 11, 2008 and pursuant to the Share Options Agreement, received a 1.2% discount on the exercise price. The total amount received was A$13,672,091 (US$12,350,000) and the Company issued 5,000,000 shares of common stock. IFFCO holds 15.2% of the shares of common stock of the Company.
Between July 1, 2008 and December 31, 2008, 281,200 options were exercised using the cashless exercise feature and the Company issued 247,774 shares of common stock.
Between July 1, 2008 and December 31, 2008, an additional 327,600 options were exercised for US$0.111, total amount received A$38,950 (US$36,364) and the Company issued 327,600 shares of common stock.
Between January 1, 2009 and December 31, 2009, an additional 18,000 options were exercised for US$0.111, total amount received A$2,763 (US$1,998) and the Company issued 18,000 shares of common stock.
Share Bonus Issue
Effective November 17, 2006, Legend issued one (1) new bonus share of Common Stock for every two (2) shares of Common Stock outstanding on the record at that date. The issue of the new bonus shares of Common Stock were on a pro-rate basis to all shareholders. As a result, the Company issued 27,599,722 shares of its Common Stock.
Effective December 31, 2006, Legend issued one (1) new bonus share of Common Stock for every two (2) shares of Common Stock outstanding on the record at that date. The issue of the new bonus shares of Common Stock were on a pro-rata basis to all shareholders. As a result, the Company issued 41,934,337 shares of its Common Stock.
The Company has accounted for these two bonus issues as a stock split and accordingly, all share and per share data has been retroactively restated.
F-18
Share Option Plan
The Company has a Stock Incentive Plan (“Stock Plan”) for executives and eligible employees and contractors. Under this Stock Plan, options to purchase shares of stock can be granted with exercise prices not less than the fair market value of the underlying stock at the date of grant. The Company believes that such awards better align the interests of its employees with those of its shareholders. Option awards are generally granted with an exercise price equal to or greater than the market price of the Company’s stock at the date of grant; those option awards generally vest 1/3 after 12 months, 1/3 after 24 months and the balance after 36 months with a 10-year contractual term. The expected life of the options is generally between 5 ½ to 6 ½ years. Certain option and share awards provide for accelerated vesting if there is a change in control (as defined in the Stock Plan). The maximum aggregate number of Shares which may be optioned and sold under the Stock Plan is 10% of the issued and outstanding shares (on a fully diluted basis).
The fair value of each option award is estimated on the date of grant using the Binomial option valuation model that uses the assumptions noted in the following table. The Binomial option valuation model requires the input of subjective assumptions, including the expected term of the option award and stock price volatility. Expected volatility is based on the historical volatility of our stock at the time grants are issued and other factors, including the expected life of the options of 5 ½ to 6 ½ years. The Company uses historical data to estimate option exercise and employee termination within the valuation model; separate groups of employees that have similar historical exercise behavior are considered separately for valuation purposes. The expected term of options granted is derived from the output of the option valuation model and represents the period of time that options granted are expected to be outstanding; the range given below results from certain groups of employees exhibiting different behavior. The risk-free rate for periods within the contractual life of the option is based on the U.S. Treasury yield curve in effect at the time of grant.
|
For the year ended
December 31, 2009
|
For the year ended
December 31, 2008
|
|
|
Weighted Average Volatility
|
70%
|
63%
|
|
Dividend Yield
|
-
|
-
|
|
Expected term (years)
|
5.5 – 6.5
|
5.5 – 6.5
|
|
Risk-free rate
|
2.48% - 3.54%
|
2.55% - 4.42%
|
A summary of option activity under the Plan as of December 31, 2009, and changes during the year is presented below:
|
Options
|
Shares
|
Weighted-
Average
Exercise Price
|
|
|
Balance, December 31, 2006
|
8,100,000
|
$0.83
|
|
|
Granted
|
6,250,000
|
$0.93
|
|
|
Exercised
|
-
|
-
|
|
|
Forfeited and expired
|
(1,762,500)
|
$0.72
|
|
|
Balance, December 31, 2007
|
12,587,500
|
$0.79
|
|
|
Granted
|
11,000,000
|
$1.79
|
|
|
Exercised
|
-
|
-
|
|
|
Forfeited and expired
|
(1,125,000)
|
$0.98
|
|
|
Balance, December 31, 2008
|
22,462,500
|
$1.19
|
|
|
Granted
|
1,900,000
|
$1.00
|
|
|
Exercised
|
-
|
-
|
|
|
Forfeited and expired
|
(675,000)
|
$1.00
|
|
|
Balance, December 31, 2009
|
23,687,500
|
$1.30
|
|
|
Options exercisable at December 31, 2009
|
13,350,000
|
$1.13
|
At the time of an issue of options, management assess the forfeiture rate to be used for the issue based on historical experience and management’s view on the likelihood that the individual will continue employment to the end of the vesting period. The forfeiture rates vary between 33.3% and 100%.
F-19
For the year ended December 31, 2009 stock-based compensation expense relating to stock options was A$4,259,903 (US$3,804,519). No income tax benefit was recognized in the year ended December 31, 2009 for stock-based compensation arrangements because of the valuation allowance. As at December 31, 2009, there was A$2,261,129 (US$2,019,414) of unrecognized compensation cost, before income taxes, related to unvested stock options.
For the year ended December 31, 2009, the Company issued 1,900,000 stock options. The options will vest 1/3 after 12 months, 1/3 after 24 months and the balance 1/3 after 36 months. The exercise price of the options is US$1.00 and the weighted-average grant-date fair value of options granted was US$0.297. The latest exercise date for the options is June 25, 2019.
|
Options Outstanding
|
Options Exercisable
|
||||||
|
Exercise
Prices
US$
|
Number
Outstanding
|
Weighted
Average
Remaining
Contractual
Life (In Years)
|
Weighted-
Average
Exercise
Price
|
Number
Exercisable
|
Weighted
Average
Remaining
Contractual
Life
(In Years)
|
Weighted-
Average
Exercise
Price
|
|
|
$0.444
|
2,006,250
|
6.94
|
1,843,750
|
6.88
|
|||
|
$1.000
|
14,781,250
|
7.89
|
9,206,250
|
7.43
|
|||
|
$2.000
|
5,900,000
|
8.18
|
1,966,667
|
8.18
|
|||
|
$3.480
|
1,000,000
|
8.53
|
333,333
|
8.53
|
|||
|
23,687,500
|
8.17
|
$1.30
|
13,350,000
|
7.49
|
$1.13
|
||
The aggregate intrinsic value of outstanding stock options at December 31, 2009 was A$8,501,975 and the aggregate intrinsic value of exercisable stock options was A$5,887,125.
|
8.
|
RECLAMATION AND REHABILITATION
|
|
December 31,
2009
A$
|
December 31,
2008
A$
|
|
|
Balance January 1
|
206,192
|
90,000
|
|
Increase as a result of rehabilitation requirement on exploration undertaken during year
|
730,332
|
137802
|
|
Increase as a result of acquisition of subsidiary during the year
|
291,902
|
-
|
|
Decrease as a result of rehabilitation performed during the year
|
(292,868)
|
(21,610)
|
|
Closing balance December 31
|
935,558
|
206,192
|
|
The Company’s exploration activities are subject to various federal and state laws and regulations governing the protection of the environment. These laws and regulations are continually changing and are generally becoming more restrictive. The Company conducts its operations so as to protect the environment and believes its operations are in compliance with applicable laws and regulations in all material respects. The Company has made, and expects to make in the future, expenditures to comply with such laws and regulations, but cannot predict the full amount of such future expenditures. Estimated future reclamation costs are based principally on legal and regulatory requirements.
|
||
F-20
|
9.
|
LEASE LIABILITY
|
|
A$
|
|
|
The Company entered into capital finance lease agreements for motor vehicles . The leases are non-cancellable and
require total monthly repayments of A$19,962 (2008: A$21,016) and expire at various dates from 2010 to 2012.
Future minimum payments due for the remaining term of the leases as of December 31, 2009 are as follows:
|
|
|
2010
|
249,876
|
|
2011
|
305,264
|
|
2012
|
9,476
|
|
564,616
|
|
|
Less amounts representing interest
|
53,152
|
|
511,464
|
|
|
Current liability
|
213,550
|
|
Non-current liability
|
297,914
|
|
511,464
|
|
|
At December 31, 2009, the net book value of the motor vehicles under capital leases amounts to:
|
538,117
|
|
10.
|
TRADING AND OTHER SECURITIES
|
Management determines the appropriate classification of its investments in marketable equity securities at the time of purchase and re-evaluates such determinations at each reporting date. The Company accounts for its equity security investments as trading securities in accordance with FASB issued guidance now codified as ASC Topic 820, “Fair Value Measurements and Disclosures” (“ASC 820”).
On January 1, 2008, the Company adopted ASC 820, which, among other things, defines fair value, establishes a consistent framework for measuring fair value and expands disclosure for each major asset and liability category measured at fair value on either a recurring or nonrecurring basis. The Company did not adopt the ASC 820 fair value framework for nonfinancial assets and liabilities, except for items that are recognized or disclosed at fair value in the financial statements at least annually. ASC 820 clarifies that fair value is an exit price, representing the amount that would either be received to sell an asset or be paid to transfer a liability in an orderly transaction between market participants. As such, fair value is a market-based measurement that should be determined based on assumptions that market participants would use in pricing an asset or liability. As a basis for considering such assumptions, ASC 820 establishes a three-tier fair value hierarchy, which prioritizes the inputs used in measuring fair value as follows:
|
Level 1. Observable inputs such as quoted prices in active markets for identical assets or liabilities;
|
|
Level 2. Inputs, other than the quoted prices in active markets, that are observable either directly or indirectly; and
|
|
Level 3. Unobservable inputs in which there is little or no market data, which require the reporting entity to develop its own assumptions.
|
Investment Measured at Fair Value on a Recurring Basis:
|
Fair Value
Hierarchy
|
Fair Value at
December 31,
2008
|
|
|
Level 1
|
$780,946
|
The trading securities held at December 31, 2008 were investments in companies in the phosphate industry that were listed on either a US stock exchange or the Australian Stock Exchange. For trading securities in companies listed on a US stock exchange, the cost of the investments was A$381,481, the fair market value at December 31, 2008 was A$446,348 and the unrealized gain was A$64,867. For trading securities in companies listed on the Australian Stock Exchange, the cost of the investments was A$328,591, the fair market value at December 31, 2008 was A$334,598 and the unrealized gain was A$6,007. The total unrealized gain of A$70,874 had been taken up in the consolidated statement of operations.
Legend did not hold any trading securities at December 31, 2009.
For the year ended December 31, 2009, Legend sold certain trading securities with a carrying value of A$1,158,604 for a consideration of A$1,272,343 and a net gain of A$113,739.
F-21
During December 2009, the Company invested approximately A$2,900,000 in exchange for shares in a Fund that purchases shares in companies quoted on international stock exchanges.
This investment is valued at the net asset value which is provided by the Fund’s manager.
|
11.
|
AFFILIATE TRANSACTIONS
|
In December 2004, the Company entered into an agreement with AXIS Consultants Pty Ltd to provide geological, management and administration services to the Company. AXIS is affiliated through common management. The Company is one of ten affiliated companies. Each of the companies has some common Directors, officers and shareholders. In addition, each of the companies is substantially dependent upon AXIS for its senior management and certain mining and exploration staff. A number of arrangements and transactions have been entered into from time to time between such companies. It has been the intention of the affiliated companies and respective Boards of Directors that each of such arrangements or transactions should accommodate the respective interest of the relevant affiliated companies in a manner which is fair to all parties and equitable to the shareholders of each. Currently, there are no material arrangements or planned transactions between the Company and any of the other affiliated companies other than AXIS.
AXIS is a company owned by its public companies (including Legend which holds a 9.09% interest at a cost of A$1 and which is accounted for under the cost method) and any profits generated by AXIS are returned to its shareholders in the form of dividends.
AXIS is paid by each company for the costs incurred by it in carrying out the administration function for each such company. Pursuant to the Service Agreement, AXIS performs such functions as payroll, maintaining employee records required by law and by usual accounting procedures, providing insurance, legal, human resources, company secretarial, land management, certain exploration and mining support, financial, accounting advice and services. AXIS procures items of equipment necessary in the conduct of the business of the Company. AXIS also provides for the Company various services, including but not limited to the making available of office supplies, office facilities and any other services as may be required from time to time by the Company as and when requested by the Company.
The Company is required to reimburse AXIS for any direct costs incurred by AXIS for the Company. In addition, the Company is required to pay a proportion of AXIS’s overhead cost based on AXIS’s management estimate of our utilisation of the facilities and activities of AXIS plus a service fee of not more than 15% of the direct and overhead costs. Amounts invoiced by AXIS are required to be paid by us. The Company is also not permitted to obtain from sources other than AXIS, and we are not permitted to perform or provide ourselves, the services contemplated by the Service Agreement, unless we first requests AXIS to provide the service and AXIS fails to provide the service within one month.
The Service Agreement may be terminated by AXIS or us upon 60 days prior notice. If the Service Agreement is terminated by AXIS, the Company would be required to independently provide, or to seek an alternative source of providing, the services currently provided by AXIS. There can be no assurance that the Company could independently provide or find a third party to provide these services on a cost-effective basis or that any transition from receiving services under the Service Agreement will not have a material adverse effect on us. The Company’s inability to provide such services or to find a third party to provide such services may have a material adverse effect on our operations.
In accordance with the Service Agreement AXIS provides the Company with the services of the Company’s Chief Executive Officer, Chief Financial Officer, geologists and clerical employees, as well as office facilities, equipment, administrative and clerical services. We pay AXIS for the actual costs of such facilities plus a maximum service fee of 15%.
F-22
During 2008, AXIS charged the Company A$5,413,203 in management and administration services including salaries incurred in relation to AXIS staff that provided services to the Company; A$2,224,638 for exploration services provided to the Company; and AXIS charged interest of A$7,762 for 2008. The Company placed on deposit with AXIS funds amounting to A$699,638 to acquire two properties in Mt Isa, which is the base for the Company’s phosphate project, to be used to accommodate AXIS employees and consultants when working in Mt Isa and relocating to the field operations. The Company has entered into a rental agreement with AXIS for one rental property (refer note 14). The Company also purchased a lear jet owned by AXIS (at cost to AXIS) amounting to A$1,210,000 which includes 10% GST and was based on an independent valuation, to utilize in its field operations; and a residential property at a value of A$900,000 (cost to AXIS) used to accommodate AXIS employees when visiting field operations. The Company paid A$10,551,866 which includes the cost of the lear jet, the three properties and an advance for 2009 charges and ongoing operations. The Company charged AXIS interest of A$49,931 at the rate between 10.35% to 11.75%.The amount owed by AXIS at December 31, 2008 was A$1,552,919 of which A$991,251 and A$555,668 is included in current and non-current receivables in the accompanying Balance Sheet, respectively. During 2009, AXIS charged the Company A$4,876,381 in management fees including salaries incurred in relation to AXIS staff that provided services to the Company, A$8,273,059 for exploration services provided to the Company, interest of A$81,504, provided advance funding to AXIS of A$606,000 and we repaid A$12,805,855. AXIS charged interest at a rate between 9.25% and 10.35% for 2009. The amount due by AXIS at December 31, 2009 was A$1,878,205, and is included in receivables.
During the 2009 year, the Company invested in North Australian Diamonds Ltd (“NADL”) through on-market purchases on ASX and through a takeover offer. At December 31, 2009, the Company held 47.83% of the issued shares of NADL. The Company’s President and Chief Executive Officer, Executive General Manager and one of its independent Directors are Executive Chairman and Managing Director, and Directors respectively of NADL.
During the 2009 year, the Company took a private placement of shares of common stock in Northern Capital Resources Corp (“NCRC”). At December 31, 2009, the Company held 21.29% of the shares of NCRC. The Company’s President and Chief Executive Officer and one of its independent Directors are President and Chief Executive Officer and Director respectively of NCRC.
During the 2009 year, the Company and NADL entered into a camp access agreement and airfield access agreement relating to the Merlin camp and airstrip to allow the Company to utilize these facilities. Under the arrangements, the Company paid NADL $836,570 to upgrade the facilities, $132,698 for accommodation, meals and fuel and NADL paid the Company $21,022 for costs incurred in behalf of NADL. At December 31, 2009, the Company owes NADL $19,265 pursuant to these arrangements.
|
12.
|
INCOME TAXES
|
The Company has adopted the provisions of ASC Topic 740 "Income Taxes". ASC 740 requires recognition of deferred tax liabilities and assets for the expected future tax consequences of events that have been included in the financial statements or tax returns. Under this method, deferred tax liabilities and assets are determined based on the differences between the financial statement and tax basis of assets and liabilities using enacted tax rates in effect for the year in which the differences are expected to reverse.
The Company is subject to taxation in both the USA and Australia.
At December 31, 2009 and 2008 deferred taxes consisted of the following:
|
USA
2009
A$
|
Australia
2009
A$
|
Total
2009
A$
|
|
|
Deferred tax assets
|
|||
|
Net operating loss carry-forward
|
13,063,058
|
14,517,363
|
27,580,421
|
|
Exploration expenditure
|
11,186,798
|
-
|
11,186,798
|
|
Less valuation allowance
|
(24,249,856)
|
(14,517,363)
|
(38,767,219)
|
|
Net deferred taxes
|
-
|
-
|
-
|
|
USA
2008
A$
|
Australia
2008
A$
|
Total
2008
A$
|
|
|
Deferred tax assets
|
|||
|
Net operating loss carry-forward
|
5,690,431
|
5,522,759
|
11,213,190
|
|
Exploration expenditure
|
6,464,699
|
-
|
6,464,699
|
|
Less valuation allowance
|
(12,155,130)
|
(5,522,759)
|
(17,677,889)
|
|
Net deferred taxes
|
- | - | - |
F-23
Under ASC 740-10 tax benefits are recognised only for tax positions that are more likely than not to be sustained upon examination by tax authorities. The valuation allowance offsets the net deferred tax asset for which there is no assurance of recovery. The valuation allowance will be evaluated at the end of each year, considering positive and negative evidence about whether the deferred tax asset will be realized.
At that time, the allowance will either be increased or reduced; reduction could result in the complete elimination of the allowance if positive evidence indicates that the value of the deferred tax assets is no longer impaired and the allowance is no longer required.
As a result of the ownership change that occurred in November 2004 (see note 1), Internal Revenue Code Section 382 limits the use of available operating loss carryforwards for losses incurred prior to the ownership change. In addition, the Company will need to file tax returns for 2007 to 2009 to establish the tax benefits of the net operating loss carry forwards in Australia for those years. Carry-forward net operating losses will be available to offset future taxable income. Total available net operating loss carryforwards in the United states, which are subject to limitations, amount to approximately A$37,000,000 at December 31, 2009 expire in years 2022 through 2029. Net operating loss carryforwards in Australia do not have a definite expiration date.
|
13.
|
COMMITMENTS AND CONTINGENCIES
|
The Company has entered into lease agreements for the rental of office premises and equipment which expire between 2010 and 2012. The lease agreements have a monthly payment as adjusted by the increase in the consumer price index in Australia annually, and the future commitment amounts to A$648,135 (US$578,849).
Total rent expenses incurred by the Company amounted to A$30,349 and A$30,349 in 2009 and 2008, respectively.
|
A$
|
|
|
Future minimum lease payments under the Company’s non-cancellable operating leases are as follows:.
|
|
|
2010
|
406,862
|
|
2011
|
131,604
|
|
2012
|
109,669
|
The Company entered into an agreement for drilling on its Queensland phosphate project whereby the Company guaranteed to drill a set number of metres. If those metres were not drilled, the Company was required to make a payment for the metres that had not been drilled. At December 31, 2009, the value of the commitment was A$3,028,037 (US$2,703,734).
In December 2008, the Company entered into an agreement to purchase certain mining tenements adjacent to its Queensland phosphate interests and paid a deposit of A$295,000 with the balance of the purchase price of A$605,000 being payable following the receipt of certain regulatory approvals. The regulatory approvals were received in February 2009 and the balance of the purchase price was paid at that time.
F-24
Exploration
The Company has to perform minimum exploration work and expend minimum amounts of money on its tenements. The overall expenditure requirement tends to be limited in the normal course of the Company’s tenement portfolio management through expenditure exemption approvals, and expenditure reductions through relinquishment of parts or the whole of tenements deemed non prospective. Should the company wish to preserve interests in its current tenements the amount which may be required to be expended is as follows:
|
2009
A$
|
2008
A$
|
|
|
Not later than one year
|
6,724,027
|
748,755
|
|
Later than one year but not later than five years
|
6,423,559
|
2,801,013
|
|
Later than five years but not later than twenty one years
|
1,864,163
|
317,912
|
|
15,011,749
|
3,867,680
|
Legend has entered into an agreement with Ashton Mining Limited (“Ashton”) and Rio Tinto Exploration Pty Ltd (“Ashton Agreement”) dated December 4, 2009 and a second agreement with Mwana Africa plc, Gravity Diamonds Limited and Diamond Mines Australia Pty Ltd dated April 24, 2009 (“Gravity Agreement”). Under these two agreements, Legend has acquired further diamond interests in the Northern Territory of Australia. As way of background, in April and July 2004, Ashton, NADL and certain of NADL’s 100% owned subsidiaries entered into agreements whereby NADL purchased certain diamond assets (including the Merlin Diamond Mine and diamond exploration tenements) from Ashton and Ashton retained rights over these diamond assets including royalty rights, marketing rights and earn back rights. In addition, Rio Tinto and Gravity had entered into an agreement in July 2003 whereby Gravity acquired certain diamond interests from Rio Tinto in the McArthur Basin, which is in the broad vicinity of Legend and NADL’s diamond interests in the Northern Territory, with Rio Tinto retaining certain residual rights.
Under the Ashton Agreement, Legend purchased all of the Ashton and Rio Tinto’s mining information, rights under three agreements and interests in four (4) exploration licences, six (6) applications for exploration licences, five (5) substitute exploration licences and one (1) mining lease for an amount of A$1,000,000. Rio Tinto retained the royalty payable by NAD in respect of the Merlin Diamond Mine and rights to conduct exploration, development and production activities for non-diamond minerals. Under the Gravity Agreement, Legend purchased Gravity’s interest in twelve (12) exploration licences, nine (9) applications for exploration licences and one (1) substitute exploration licence; Gravity’s rights, interests and obligations under the Red Metal Agreement and all exploration and data bases relevant to historical exploration; and Legend paid Gravity A$400,000 for these assets.
Both of the agreements contained pre-conditions that were not satisfied until after December 31, 2009.
In January 2010, two stockholders (being an individual and his private company) commenced an action in Supreme Court, New York County against the Company, Renika Pty Ltd. and Joseph Gutnik on account of the alleged failure of the defendants to issue warrants to the plaintiffs in connection with the purchase of shares of common stock from the Company and from Renika Pty Ltd. in 2006 and 2007. The complaint alleges three causes of action, and seeks unspecified damages. The Company, Renika Pty Ltd. and Joseph Gutnick vehemently deny the allegation. The defendants have moved to dismiss the complaint as a matter of law. The Company, Renika Pty Ltd. and Joseph Gutnick is vigorously defending such claim.
The Company has received a claim for compensation in consideration of introducing the Company to a third party. The Company’s attorneys responded denying any agreement or understanding. The Company does not believe the claim has any merit and will defend the claim vigorously if necessary.
|
14.
|
SUBSEQUENT EVENTS
|
The Company has evaluated events and transactions after the balance sheet date and through the date the consolidated financial statements were issued and believes that all relevant disclosures have been included herein and there are no other which require recognition or disclosure in the accompanying consolidated financial statements.
F-25
Appendix A
GLOSSARY
In this Form 10-K, we use certain capitalized and abbreviated terms, as well as technical terms, which are defined below.
|
ASSAY
|
To analyze the proportions of metals in a specimen of rock or other geological material. Results of a test of the proportions of metals in a specimen of rock or other geological material.
|
|
BACKGROUND
|
As pertains to geochemical data; the variation in natural abundance of a particular metal or other constituent within a specific geological setting.
|
|
BENEFICIATION
|
The process of sorting material by size most commonly used to remove waste materials from ores.
|
|
CaO
|
Chemical Symbol for Calcium Oxide
|
|
COLLAR
|
The start or beginning of a drill hole or the mouth of an underground working entrance.
|
|
CRATON
|
The relatively stable nucleus of a continent. Cratons are made up of a shield-like core of Precambrian Rock and a buried extension of the shield.
|
|
DISSEMINATED
|
Fine grain particles of minerals that occur within the rock
|
|
FACIES
|
A term applied to sedimentary units and the rocks that belong to them
|
|
FAULT
|
A fracture or fracture zone in rock along which there has been displacement of the two sides relative to each other and parallel to the fracture plane.
|
|
FE/Fe2O3
|
Chemical symbol for iron.
|
|
FLOTATION
|
The process of using chemicals to move fine grain particles in a solution, one process used in beneficiation
|
|
FRACTURE
|
A general term for any break in a rock, whether or not it causes displacement.
|
|
KARST
|
Topography formed by weathered limestone
|
|
METALLURGICAL TEST
|
A general term for a number of mechanical or chemical processes that are employed to test the amenability of separating metals from their ores.
|
|
METAMORPHOSED
|
Rock or mineral that has undergone mineralogical and/or structural change in response to elevated pressures, temperatures or changes in chemical conditions.
|
|
MICROSPHORITE
|
Very fine grained phosphorite (phosphate rich rock)
|
|
MINERALIZATION
|
The process or processes by which a mineral or minerals are introduced into a rock, resulting in an enriched deposit; or the result of these processes.
|
|
MINERALIZED
|
Rock that has undergone the process of mineralization.
|
|
ORE
|
The naturally occurring material from which a mineral or minerals of economic value can be extracted profitably or to satisfy social or political objectives.
|
|
P2O5
|
Chemical symbol for Phosphate
|
|
PHOSPHORITE
|
Phosphate rock, or a rock with high concentrations of phosphate.
|
|
PRECAMBRIAN
|
A period of geologic time earlier than 544 million years before present.
|
|
QUARTZ
|
A glassy silicate and common rock forming mineral (SiO2).
|
|
RADIOMETRIC SURVEY
|
Geophyisical survey looking at the emission of radiation from rocks at very low levels. Used as an exploration tool.
|
|
RC DRILLING
|
Reverse Circulation (RC). Drilling technique used which has a double tube to pass the air down between the inner tube and outer tube, with the sample returned up the inner tube.
|
|
REPLACEMENT
|
Pertaining to a type of mineral deposit that forms by partial or complete replacement of bedrock constituents by new minerals, generally by the action of hydrothermal fluids.
|
|
RESERVE
|
An estimate within specified accuracy limits of the valuable metal or mineral content of known deposit that may be produced under current economic conditions and with present technology.
|
|
RESOURCE
|
Pertaining to the quantity or bulk of mineralized material without reference to the economic viability of its extraction (see reserve).
|
|
SEDIMENT
|
Fragmental material that originates from weathering of rocks and that is transported by air, water, ice or other natural agents, and that forms in layers on the Earth's surface at ordinary temperatures in a loose, unconsolidated form; e.g. silt, sand, gravel, etc.
|
|
SELECTED SAMPLE
|
A specimen of a mineralized zone that is not intended to be representative of the deposit as a whole.
|
|
SILICA/SiO2
|
A generic term for silicon dioxide (SiO2), the most common form of which is quartz.
|
|
SPLIT
|
A portion of a rock or soil sample that is separated from the bulk of the original before the analytical process so as to provide material for re-analysis as a check of the accuracy of the original procedure should it be required.
|
|
STRATA
|
Beds or layers of rock.
|
|
STRIKE
|
The course or bearing of the outcrop of an inclined bed, vein or fault plane on a level surface; the direction of a horizontal line perpendicular to the dip.
|
|
VEIN
|
An epigenetic mineral filling of a fault or other fracture in a host rock, in tabular or sheetlike form, often as a precipitate from a hydrothermal fluid.
|
|
WEIGHTED AVERAGE
|
Value calculated from a number of samples, each of which has been “weighted” by a factor of the individual sample width.
|
|
WORKING
|
A general term for any type of excavation carried out during the course of mining or mining exploration.
|