Attached files
| file | filename |
|---|---|
| EX-21 - EXHIBIT 21 - LEGEND INTERNATIONAL HOLDINGS INC | a6643680ex21.htm |
| EX-31.2 - EXHIBIT 31.2 - LEGEND INTERNATIONAL HOLDINGS INC | a6643680ex31-2.htm |
| EX-32.1 - EXHIBIT 32.1 - LEGEND INTERNATIONAL HOLDINGS INC | a6643680ex32-1.htm |
| EX-31.1 - EXHIBIT 31.1 - LEGEND INTERNATIONAL HOLDINGS INC | a6643680ex31-1.htm |
| EX-32.2 - EXHIBIT 32.2 - LEGEND INTERNATIONAL HOLDINGS INC | a6643680ex32-2.htm |
UNITED STATES
SECURITIES AND EXCHANGE COMMISSION
Washington, D.C. 20549
———————
FORM 10-K
|
x
|
ANNUAL REPORT PURSUANT TO SECTION 13 OR 15(d) OF THE SECURITIES EXCHANGE
|
|
ACT OF 1934
|
|
|
For the fiscal year ended: December 31, 2010
|
|
|
or
|
|
|
TRANSITION REPORT PURSUANT TO SECTION 13 OR 15(d) OF THE SECURITIES EXCHANGE
|
|
|
ACT OF 1934
|
|
|
For the transition period from: _____________ to _____________
|
|
Commission File Number 000-32551
LEGEND INTERNATIONAL HOLDINGS, INC.
(Exact name of registrant as specified in its charter)
———————
|
Delaware
|
23-3067904
|
|
|
(State or Other Jurisdiction
|
(I.R.S. Employer
|
|
|
of Incorporation or Organization)
|
Identification No.)
|
Level 8, 580 St Kilda Road Melbourne, Victoria, 3004, Australia
(Address of Principal Executive Office) (Zip Code)
011 (613) 8532 2866
(Registrant’s telephone number, including area code)
N/A
(Former name or former address, if changed since last report)
———————
|
Securities registered pursuant to Section 12(b) of the Act: None
|
||
|
Securities registered pursuant to Section 12(g) of the Act:
|
||
|
Title of each class
|
||
|
Common Stock, par value $.001 per share
|
||
|
Indicate by check mark if the registrant is a well-known seasoned issuer, as defined in Rule 405 of the Securities Act.
|
||||||||
|
Yes
|
x
|
No
|
||||||
|
Indicate by check mark if the registrant is not required to file reports pursuant to Section 13 or Section 15(d) of the Act.
|
||||||||
|
Yes
|
x
|
No
|
||||||
|
Indicate by check mark whether the registrant (1) has filed all reports required to be filed by Section 13 or 15(d) of the Securities Exchange Act of 1934 during the preceding 12 months (or for such shorter period that the registrant was required to file such reports), and (2) has been subject to such filing requirements for the past 90 days.
|
||||||||
|
x
|
Yes
|
No
|
||||||
|
Indicate by check mark whether the registrant has submitted electronically and posted on its corporate website, if any, every Interactive Data file required to be submitted and posted pursuant to Rule 405 of Regulation S-T (§232.405 of this chapter) during the preceding 12 months (or for any such shorter period that the registrant was required to submit and post such file).*The registrant has not yet been phased into the interactive data requirements.
|
||||||||
|
Yes
|
No
|
|||||||
|
Indicate by check mark if disclosure of delinquent filers pursuant to Item 405 of Regulation S-K (§229.405 of this chapter) is not contained herein, and will not be contained, to the best of registrant’s knowledge, in definitive proxy or information statements incorporated by reference in Part III of this Form 10-K or any amendment to this Form 10-K.
|
||||||||
|
Indicate by check mark whether the registrant is a large accelerated filer, an accelerated filer, a non-accelerated filer, or a smaller reporting company.
|
||||||||
|
Large accelerated filer
|
Accelerated filer
|
x
|
||||||
|
Non-accelerated filer
|
Smaller reporting company
|
|||||||
|
Indicate by check mark whether the registrant is a shell company (as defined in Rule 12b-2 of the Act).
|
Yes
|
x
|
No
|
|||||
|
State the aggregate market value of the voting and non-voting common equity held by non-affiliates computed by reference to the price at which the common equity was last sold, or the average bid and asked price of such common equity, as of the last business day of the registrant’s most recently completed second fiscal quarter.
|
||||||||
|
The aggregate market value based on the average bid and asked price on the over-the-counter market of the Registrant’s common stock, (“Common Stock”) held by non-affiliates of the Company was US$134,064,506 as at June 30, 2010.
There were 226,399,674 outstanding shares of Common Stock as of March 15, 2011.
|
||||||||
|
APPLICABLE ONLY TO REGISTRANTS INVOLVED IN BANKRUPTCY
|
||||||||
|
PROCEEDINGS DURING THE PRECEDING FIVE YEARS:
|
||||||||
|
Indicate by check mark whether the registrant has filed all documents and reports required to be filed by Section 12, 13 or 15(d) of the Securities Exchange Act of 1934 subsequent to the distribution of securities under a plan confirmed by a court.
|
||||||||
|
Yes
|
No
|
|||||||
|
DOCUMENTS INCORPORATED BY REFERENCE
|
||||||||
|
Not Applicable
|
||||||||
|
INDEX
|
|||||
|
1
|
|||||
|
37
|
|||||
|
40
|
|||||
|
41
|
|||||
|
41
|
|||||
|
42
|
|||||
|
47
|
|||||
|
48
|
|||||
|
57
|
|||||
|
58
|
|||||
|
58
|
|||||
|
58
|
|||||
|
60
|
|||||
|
61
|
|||||
|
65
|
|||||
|
72
|
|||||
|
74
|
|||||
|
76
|
|||||
|
77
|
|||||
|
78
|
|||||
Information Regarding Forward Looking Statements
This report and other reports, as well as other written and oral statements made or released by us, may contain forward looking statements. Forward looking statements are statements that describe, or that are based on, our current expectations, estimates, projections and beliefs. Forward looking statements are based on assumptions made by us, and on information currently available to us. Forward-looking statements describe our expectations today of what we believe is most likely to occur or may be reasonably achievable in the future, but such statements do not predict or assure any future occurrence and may turn out to be wrong. You can identify forward-looking statements by the fact that they do not relate strictly to historical or current facts. The words "believe," "anticipate," "intend," "expect," "estimate," "project", "predict", "hope", "should", "may", and "will", other words and expressions that have similar meanings, and variations of such words and expressions, among others, usually are intended to help identify forward-looking statements.
Forward-looking statements are subject to both known and unknown risks and uncertainties and can be affected by inaccurate assumptions we might make. Risks, uncertainties and inaccurate assumptions could cause actual results to differ materially from historical results or those currently anticipated. Consequently, no forward-looking statement can be guaranteed. The potential risks and uncertainties that could affect forward looking statements include, but are not limited to:
|
|
§
|
the risks of mineral exploration stage projects,
|
|
|
§
|
political risks in foreign countries,
|
|
|
§
|
risks associated with environmental and other regulatory matters,
|
|
|
§
|
exploration risks and competitors,
|
|
|
§
|
the volatility of phosphate, diamond and other mineral prices,
|
|
|
§
|
estimates of proven and probable reserves are subject to considerable uncertainty,
|
|
|
§
|
movements in foreign exchange rates,
|
|
|
§
|
increased competition, governmental regulation,
|
|
|
§
|
performance of information systems,
|
|
|
§
|
ability of the Company to hire, train and retain qualified employees,
|
|
|
§
|
the availability of sufficient, transportation, power and water resources, and
|
|
|
§
|
our ability to enter into key exploration and supply agreements and the performance of contract counterparties.
|
In addition, other risks, uncertainties, assumptions, and factors that could affect the Company's results and prospects are described in this report, including under the heading “Risk Factors” and elsewhere and may further be described in the Company's prior and future filings with the Securities and Exchange Commission and other written and oral statements made or released by the Company.
We caution you not to place undue reliance on any forward-looking statements, which speak only as of the date of this document. The information contained in this report is current only as of its date, and we assume no obligation to update any forward-looking statements.
|
Business.
|
GENERAL
The terms “Legend,” “Company,” “we,” “our,” and “us” refer to Legend International Holdings, Inc. unless the context suggests otherwise.
Legend has been an exploration stage company since August 2006. During February 2011, the Company announced its maiden mineral reserve for its 100% owned Paradise South phosphate project in accordance with SEC Industry Guide 7. As a result of establishing mineral reserve estimates, Legend will be entering into the development stage for this project as it engages in the process of preparing the mineral deposit for extraction, while it continues with its other various exploration activities.
1
We have an additional objective to exploit our interest in certain exploration tenements which are in Queensland and the Northern Territory of Australia. Our exploration target is for base metals and diamonds and we are seeking to determine whether they are present in commercially economic quantities on our tenements to develop an operating mine.
Currency
We use the Australian dollar as our reporting currency, since we are headquartered in Australia and our administrative expenses are incurred in Australian dollars. References to dollars are to Australian dollars (A$) unless otherwise indicated as being United States dollars (US$). For the convenience of the reader, the Australian Dollar figures for the year ended December 31, 2010 have been translated into United States Dollars (“US$”) using the rate of exchange at December 31, 2010 of A$1.00=US$1.0163.
History
Legend was incorporated in the State of Delaware on January 5, 2001 under the name Sundew International, Inc. On March 13, 2003, Legend filed for an Amendment to its Certificate of Incorporation pursuant to which the name of Sundew International, Inc. was changed to "Legend International Holdings, Inc."
Following the change of management in November 2004, the Company developed a new plan of operations, which was to engage in mineral exploration activities.
Effective as of March 3, 2006, the Company entered into a Contract for the Sale of Mining Tenements (“Contract”) with Astro Diamond Mines N.L. (“Astro”) an Australian company pursuant to which the Company acquired certain diamond exploration tenements in Northern Australia from Astro.
In November 2007, Legend acquired a number of phosphate exploration interests in the State of Queensland in Australia.
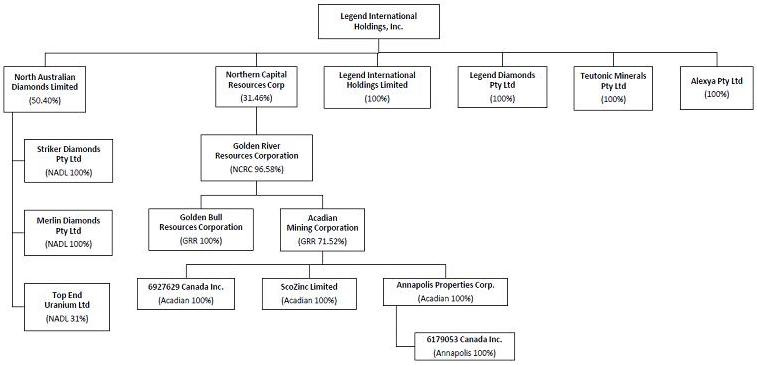
In August 2009, Legend acquired a controlling interest in North Australian Diamonds Limited (“NADL”), an Australian company with diamond interests in the Northern Territory of Australia.
During the 2009 year, the Company took a private placement of shares in Northern Capital Resources Corp. (“NCRC”). During the 2010 year, the Company took additional private placements in NCRC to increase its holding to 31.46% at December 31, 2010.
Legend has not been involved in any bankruptcy, receivership or similar proceeding. Legend has not been involved in any material reclassification, merger consolidation, or purchase or sale of a significant amount of assets not in the ordinary course of business.
SEC Reports
We file annual, quarterly, current and other reports and information with the SEC. These filings can be viewed and downloaded from the Internet at the SEC’s website at www.sec.gov. In addition, these SEC filings are available at no cost as soon as reasonably practicable after the filing thereof on our website at www.lgdi.net. These reports are also available to be read and copied at the SEC’s public reference room located at Judiciary Plaza, 100 F Street, N.E., Washington, D.C. 20549. The public may obtain information on the operation of the public reference room by calling the SEC at 1-800-SEC-0330.
DESCRIPTION OF BUSINESS
Business
Legend is primarily focused on the development of mining, beneficiation and processing of its 100% owned phosphate mineral reserves near Mount Isa in northwest Queensland, Australia. Legend has a phased implementation plan to become a leading supplier of the high analysis phosphate fertilizers DAP (Diammonium Phosphate) and MAP (Monoammonium Phosphate) and the valuable by-product Aluminum Fluoride (AlF3).
2
Legend has been an exploration stage company since August 2006. During February 2011, the Company announced its maiden mineral reserve for its 100% owned Paradise South phosphate project in accordance with SEC Industry Guide 7. As a result of establishing mineral reserve estimates, Legend will be entering into the development stage for this project as it engages in the process of preparing the mineral deposit for extraction, while it continues with its other various exploration activities.
The following chart sets forth the Company’s corporate organization as of December 31, 2010:
Legend’s flagship project is the Paradise South phosphate project in which phosphate mineral reserves have recently been estimated. The Paradise South phosphate project has also been the subject of a detailed feasibility study in 2010 which showed that the project is technically and economically feasible. The phosphate interests are managed by Legend through a dedicated development team.
Legend, in accordance with its initial strategy of exploration for various mineral commodities across northern Australia (with a focus on diamond exploration) also controls and maintains landholdings in the Northern Territory of Australia. These interests are managed by Legend through a dedicated exploration team.
Legend owns a controlling interest in North Australian Diamonds Ltd (NADL) which controls the Merlin Diamond Mine in the Northern Territory, Australia and includes NADL’s 31% interest in Top End Uranium Ltd. The Company also has an investment in Northern Capital Resources Corporation which controls gold and zinc assets in Nova Scotia, Canada. These are outlined in further detail below.
PARADISE SOUTH PHOSPHATE PROJECT
During 2010 Legend completed a feasibility study for the Paradise South project and also developed mineral reserve estimates as reported below.
Phosphate Mineral Reserves
In development of the mineral reserve estimate Legend aimed to define reserves for a minimum 30 year mine life to support the base case scenario of producing 600,000 tonnes per year of Diammonium Phosphate (DAP) and Monoammonium Phosphate (MAP) high analysis phosphate fertilizers, for 30 years as covered by Legend’s feasibility study which is further discussed below. The resulting mineral reserve estimate was above expectations with the following highlights:
3
|
|
Ø
|
Proven and probable phosphate rock reserves that will support 59 years of operation for the production of 600,000 tonnes of DAP per year or 29 years at a doubled rate of production.
|
|
|
Ø
|
‘As-mined’ proven and probable ore reserves of phosphorite of 196.2 million tonnes at 14.6% P2O5.
|
|
|
Ø
|
Proven and probable mineral reserves of recoverable, commercially useable and internationally marketable phosphate rock concentrate of 55.5 million tonnes at 33% P2O5 (72 BPL).
|
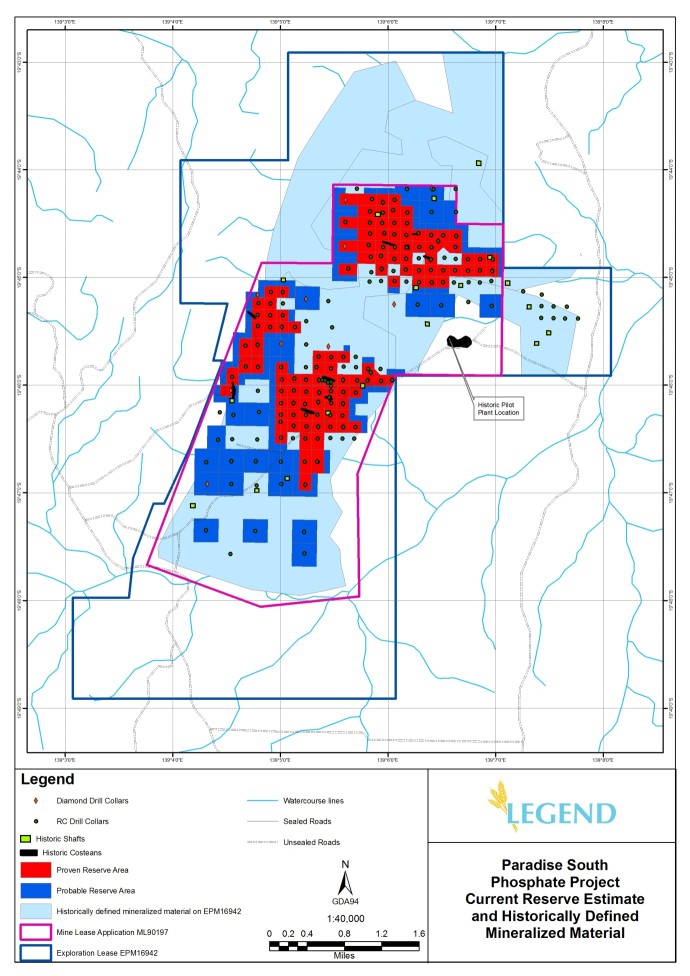
The reserve area targeted by recent drilling within the Paradise South Mining Lease Application (MLA90197 – see Figure 1) equates to only approximately 70% of the area that contains historically defined mineralized material within this lease and only approximately 50% of the area that contains historically defined mineralized material within Legend’s exploration licence EPM16942 (see Figure 2). The current reserve estimates correlate well to historical (1970’s) estimates. This supports potential further increases in reserve tonnage upon successful future drilling results within areas that have not recently been tested with modern drilling techniques but have reported phosphate intersections in historical drilling information.
Paradise South is one of seven phosphate rock deposits being explored or developed by Legend and is the first to have a current mineral reserve estimate reported. All seven deposits however have historically reported mineralized material of significant tonnage.
The reserve estimate is presented below in Table 1 as both “as-mined” ore reserves of phosphorite which will provide feed for the beneficiation plant to be located at Paradise South, and the recoverable commercially useable or marketable phosphate rock concentrate or “product” mineral reserves achievable from the ore reserves. The ore reserves and mineral reserves cannot be aggregated as the mineral reserves represent the recoverable product derived from the ore reserves after beneficiation of the phosphorite. Reserve classifications are as defined in the U.S Securities and Exchange Commission’s Industry Guide No. 7 (see Glossary of Terms).
The “as-mined” proven ore reserves of the Paradise South phosphorite deposit are currently estimated at 98.0 million tonnes of phosphorite at 15.3% P2O5. The Paradise South phosphorite deposit contains additional probable ore reserves estimated at 98.1 million tonnes of phosphorite at 13.9% P2O5. The total proven and probable ore reserves are estimated at 196.1 million tonnes of phosphorite at 14.6% P2O5. These reserves are based on a block model, typical of industry standards, developed from 180 drill holes using reverse circulation drilling technology and 32 cored diamond drill holes.
The recoverable, proven mineral reserves of the Paradise South phosphorite deposit are currently estimated at 28.9 million tonnes of phosphate rock concentrate at 33.1% P2O5 (72.4 BPL). The Paradise South phosphorite deposit contains additional probable mineral reserves estimated at 26.6 million tonnes of phosphate rock concentrates at 32.9% P2O5 (71.8 BPL). The total proven and probable mineral reserves are estimated at 55.5 million tonnes of phosphate rock concentrates at 33.0% P2O5 (72.1 BPL). These reserves are based on a block model, typical of industry standards, developed from 180 drill holes using reverse circulation drilling technology, 32 cored diamond drill holes and a beneficiation process developed specifically for Legend’s phosphorite ore types.
The production scenario of producing 600,000 tonnes per year of DAP fertilizer requires approximately 0.95 million tonnes per annum of phosphate rock concentrate at 33.0% P2O5 to feed Legend’s proposed Mt Isa Fertilizer Complex. The above proven and probable phosphate rock concentrate reserves of 55.5 million tonnes therefore provide a total project life estimated at 59 years. This mine life calculation is based on recovering 93% of the P2O5 from the rock concentrate during the acidulation process and 95% of the P2O5 during the DAP/MAP granulation process. It is also based on producing only DAP containing 46% P2O5. A doubled production scenario would provide an estimated total project mine life of 29 years. Producing both MAP and DAP at a 2:1 production ratio at 600,000 tonnes per year would reduce the total mine life to 54 years due to the higher P2O5 content of MAP (52% P2O5).
Proven reserves are based on an area of influence for each drill hole not to exceed 20 acres (8 hectares). Probable reserves are based on an area of influence for each drill hole not to exceed 40 acres (16 hectares).
It is reasonable to expect that additional fill-in drilling to reduce the drill hole area of influence will result in the reclassification of probable reserves into the proven category. Legend may endeavor to expand the Paradise South proven and probable reserves in future drilling seasons.
4
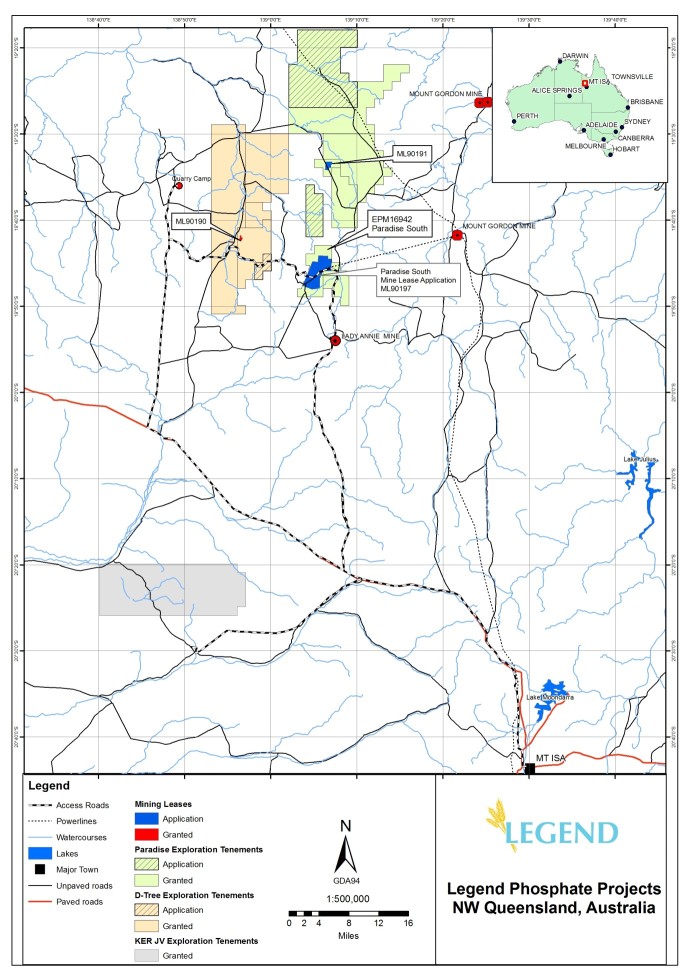
Figure 1 - Location and access to Paradise South.
5
Figure 2 – Paradise South Reserve Blocks
6
Table 1. Ore & Mineral Reserves for the Paradise South Phosphate Rock Deposit.
|
(1) (2) ORE RESERVES - "As-Mined” Phosphorite (Pre Processing)
|
||||||||||
|
Tonnes
(Millions)
|
%P2O5
|
Average BPL
|
%Fe2O3
|
%Al2O3
|
%MgO
|
%CaO
|
||||
|
Proven
|
98.0
|
15.3
|
33.4
|
6.5
|
2.6
|
0.4
|
21.3
|
|||
|
Probable
|
98.1
|
13.9
|
30.4
|
6.1
|
2.4
|
0.4
|
19.3
|
|||
|
Total
|
196.1
|
14.6
|
31.9
|
6.3
|
2.5
|
0.4
|
20.3
|
|||
|
Acres
|
Hectares
|
(3)Overburden
|
(3)Ore
|
(3)Interburden
|
||||||
|
Proven
|
1,277
|
517
|
10.1
|
10.5
|
2.3
|
|||||
|
Probable
|
1,315
|
532
|
13.4
|
10.2
|
3.2
|
|||||
|
Total
|
2,592
|
1,049
|
11.8
|
10.4
|
2.8
|
|||||
|
(4) (2) MINERAL RESERVES - Recoverable Phosphate Rock Concentrate (Post Processing)
|
||||||||||
|
Tonnes
(Millions)
|
%P2O5
|
Average BPL
|
%Fe2O3
|
%Al2O3
|
%MgO
|
%CaO
|
||||
|
Proven
|
28.9
|
33.1
|
72.4
|
(5)3.0
|
0.8
|
0.2
|
47.0
|
|||
|
Probable
|
26.6
|
32.9
|
71.9
|
(5)2.9
|
0.8
|
0.2
|
46.6
|
|||
|
Total
|
55.5
|
33.0
|
72.1
|
(5)2.9
|
0.8
|
0.2
|
46.8
|
|||
|
|
(1)
|
Ore reserves are defined here as the phosphorite ore material for the beneficiation plant. It is “as-mined” material and is before screening and processing in the proposed flotation beneficiation plant to be located at Paradise South. All ore reserves are in areas that are fully accessible for mining; free of surface or subsurface encumbrance, legal setbacks, environmental reserves and other legal restrictions that preclude permittable access for mining; believed by us to be permittable within a reasonable timeframe; and meet specified minimum physical, economic and chemical criteria related to current mining and production practices of the industry.
|
|
|
(2)
|
Proven and Probable Reserves have been estimated by Henry J. Lamb (a member of the American Institute of Professional Geologists and Licensed Professional Geologist Registered in the states of Florida and North Carolina), who has more than 30 years experience in the exploration, development, valuation and operation of phosphorite deposits throughout the world including the United States, Peru, Egypt, Iraq, Uganda, Australia, Jordan, and Kazakhstan. Mr. Lamb is an independent consultant contracted to Legend. During this project, Mr. Lamb had opportunities to observe portions of the drilling and sampling activity, reviewed analytical and metallurgical laboratory procedures, reviewed the geologic database, converted the phosphorite ore information to phosphate rock concentrate (product); reviewed the operating cost model, and independently estimated the proven and probable reserves based on phosphate industry accepted procedures and standards. In preparing this proven and probable phosphate rock concentrate reserve estimate, Mr. Lamb relied upon his independent examination of geologic, metallurgical, and cost estimate data provided by Legend. Throughout the exploration and development program, Mr. Lamb has been an independent Technical Advisor to the Legend staff and project management regarding the exploration and development of the Paradise South Phosphorite Deposit.
|
|
|
(3)
|
Overburden, ore and interburden are reported here as average thicknesses in vertical metres.
|
|
|
(4)
|
Mineral reserves are defined here as the recoverable rock concentrate post screening and processing of the ore through the proposed flotation beneficiation plant to be located at Paradise South. This material is therefore a subset of the ore reserves and cannot be aggregated with the ore reserves. These reserves are in areas that are fully accessible for mining; free of surface or subsurface encumbrance, legal setbacks, environmental reserves and other legal restrictions that preclude permittable access for mining; believed by us to be permittable within a reasonable timeframe; and meet specified minimum physical, economic and chemical criteria related to current mining and production practices of the industry.
|
7
|
|
(5)
|
Please see comments below in the section on Metallurgy titled “Investigative studies on the Fe2O3 content” which details testwork that shows less than 50% of the iron contained in the rock concentrate leaches into the phosphoric acid due to the iron species being less amenable to acidulation than other known iron species.
|
Commodity Pricing
Legend currently intends to use its Paradise South phosphate rock concentrate mineral reserves in its own Mt Isa Fertilizer Complex proposed for construction at the development site in Mt Isa, Queensland, Australia, to produce the high analysis phosphate fertilizers MAP and DAP. Profit will be attributable to the Fertilizer Complex rather than the phosphate rock mine. Legend has therefore optimized the Paradise South reserve estimates with the aim of achieving average mining and processing costs across the life of mine to be consistent with similar new phosphate developments around the world, and within an acceptable range of costs estimated in Legend’s 2010 feasibility study to achieve similar profit margins as estimated in the study.
The feasibility study assumed a long term average DAP selling price equivalent to US$445 per tonne sold FOB Tampa (US$531 FOB Townsville) which reported cash margins of US$210 per tonne of DAP produced. The DAP price FOB Tampa used is within 2% of CRU Group’s(1) long term 10 year average forecast from 2010 to 2019. It is worth noting that current spot prices for DAP are over US$620(2) per tonne FOB Tampa (approx. $706 FOB Townsville) as of 3 March 2011. The 3 year historical average (2008-2010) for DAP FOB Tampa is US$597 per tonne (3) (approx.US$683 FOB Townsville). All Australian dollar costs were converted to USD at a rate of 1.00 AUD = 0.85 USD.
|
|
(1)
|
CRU Group are commodity research analysts who currently publish fertilizer prices in the weekly, industry recognized, publication FERTILIZER WEEK.
|
|
|
(2)
|
Sourced from recognized fertilizer industry weekly price publications.
|
|
|
(3)
|
Data provided by CRU Group.
|
Location and Access
The Paradise South Phosphate deposit is located approximately 130 kilometers to the North West of Mt Isa in north-western Queensland. Access from Mt Isa is via the main Barkly Highway, which connects Mt Isa to Tennant Creek in the Northern Territory, for 67km, then via the McNamara Highway, which is a well maintained haul road used by the Lady Annie Copper Mine, for about 50km, then via farm access roads for a further 10 kilometers (see Figure 1). The farm access roads have been maintained by Legend sub-contractors for the duration of drilling and exploration activities.
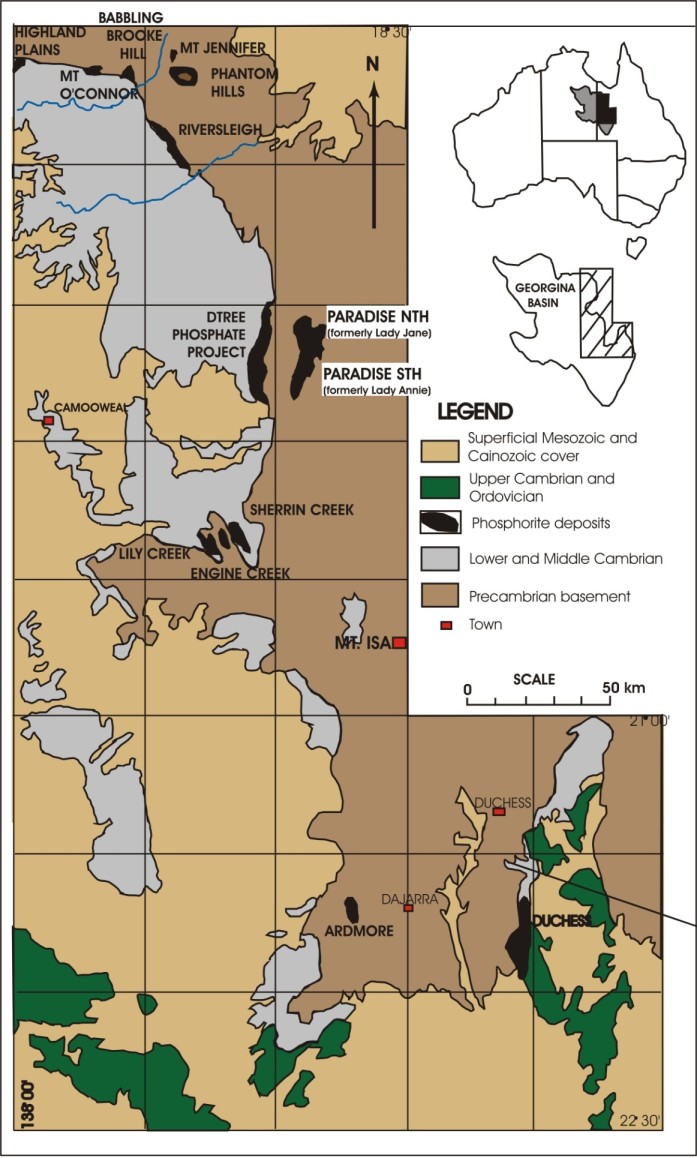
Paradise South is part of the EPM16942 lease, which is one of 12 exploration tenements covering 7 phosphate deposits granted to Legend or its joint venture partner King Eagle Resources Ltd, located in Queensland, Australia.
Mining Tenure
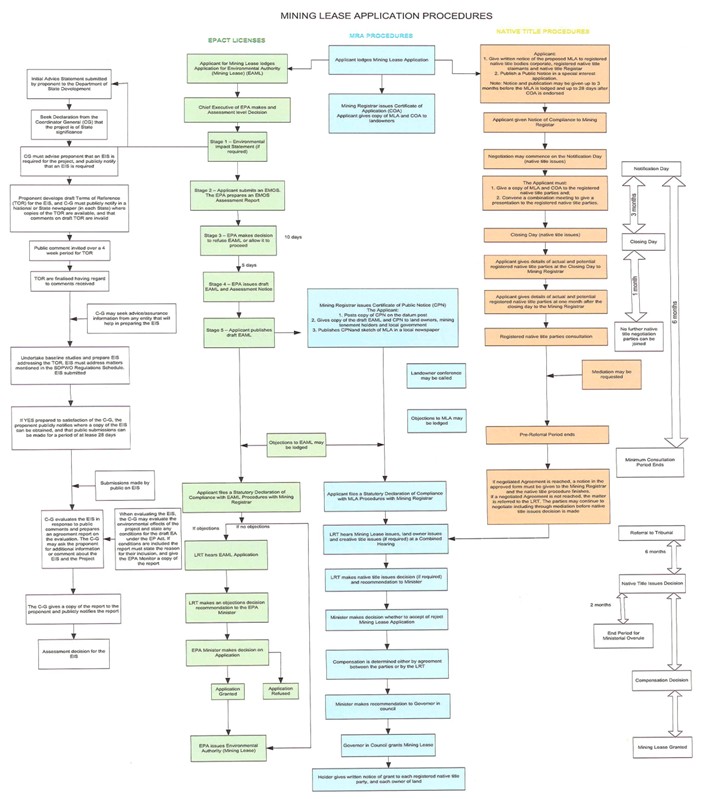
Legend currently has a Mining Lease Application (MLA) being processed by the Queensland Government for MLA 90197, Paradise South (See Figure 1) and a granted exploration permit EPM16942 which encompasses the entire mineral reserve as reported above. The MLA process involves approval through the Environmental Protection (EP) Act, Native Title Act (NTA) and Mineral Resources Act (MRA). The flow chart below (Figure 3) describes the interrelated approval process in accordance with these Acts.
Due to the scale of the proposed Paradise South production, Legend has voluntarily submitted an application to undertake an Environmental Impact Statement (EIS) under the EP Act for the Paradise South mine lease (MLA 90197), beneficiation plant and associated infrastructure. Legend agreed to the Terms of Reference (TOR) for the EIS with the Queensland Government’s Department of Environment & Resource Management (DERM) on June 30, 2010, and these were advertised in a public notice on July 3, 2010. Post wet-season environmental surveys were undertaken in 2010 and all data required for the environmental studies of the EIS is now available. Legend was granted a ‘Right to Negotiate’ under the NTA for the Paradise South mine lease as advertised in a public notice on May 5, 2010. Legend continues to negotiate access and compensation agreements as required by the NTA and MRA for the Paradise South mine lease with the local indigenous group, pastoralists and mining companies – some of which are parties who have already provided consent in respect of the Paradise North mine lease application (MLA90191).
Legend has reasonable expectations that MLA90197 for Paradise South will be granted within approximately 12 months although exact timeframes will not be known until closer to the time of grant. This is well within the current projected timelines for the project development which is currently forecasting mining production to begin in 2017 at this location. Legend has already successfully been granted a Mining Lease (ML90190) over a portion of the D-Tree deposit which demonstrates Legends ability to work within the Queensland Government’s procedures to successfully secure mining tenure. Legend has also submitted a Mining Lease Application for Paradise North (MLA90191) which is anticipated to be granted within the next few months and is the proposed location of initial mining for the project beginning in 2013. Reserves for Paradise North are currently being estimated and will be reported later this year.
8
Figure 3 – Mining Lease Application Procedures
Project History
The Paradise South Mineral Reserve estimate forms part of the historical phosphate deposit known as Lady Annie which was discovered in 1967 by Broken Hill South Ltd (BH South). BH South reported historical tonnages of mineralized material in 1972 using 54,499 meters of rotary percussion drilling, 33 shafts and 10 deep trenches which provided feed to a pilot plant which was constructed on site and operated for 1 year in 1973 processing 64,000 tonnes of material. The phosphate rock concentrate produced from the pilot plant achieved grades between 32% P2O5 and 36% P2O5 and was used to produce DAP and MAP in full scale plant testing by international fertilizer manufacturers (Rogers, J.K. and Keevers, R.E., 1976).
9
Feasibility studies were carried out by BH South with a view to the development of the Lady Annie deposit and included investigation of mining and beneficiation, transportation, port location, power and water supply and townships. Results of these studies were positive however subsequent market events caused development to be postponed.
In 1980 Western Mining Corporation (WMC) and Conzinc Rio Tinto of Australia (CRA) made a successful bid for BH South and in 1990 acquired all the remaining shares in Queensland Phosphates Ltd which was the company holding the phosphate assets in Queensland.
In 2005 WMC was taken over by BHP Billiton Ltd who then sold its Queensland Phosphate assets to Incitec Pivot Ltd in 2006. Legend successfully applied for and was granted the exploration permit in 2007.
Legend commenced drilling at Paradise South in 2009, operated a pilot beneficiation plant in late 2009 and completed a feasibility study in 2010 which has culminated in this initial reserve estimate to support the project defined in the 2010 feasibility study.
Geology
Regional Geology
The majority of Australia’s sedimentary phosphorite (phosphate rock ore) reserves lie within early Middle Cambrian successions of the Georgina Basin in northwest Queensland and northeast Northern Territory (see Figure 4). Some eighteen named, discrete phosphorite deposits occur within the lower Middle Cambrian Beetle Creek Formation, or its stratigraphic equivalent the Border Waterhole Formation, that are basal in the stratigraphy of the Georgina Basin.
The Georgina Basin is a broad intracratonic basin covering some 325,000 km2 of western Queensland and east-central Northern Territory (Shergold and Druce, 1980). The basin is bound by Proterozoic basement of the Mount Isa Block and South Nicholson Basin to the east and north; and by the Tennant Creek Block and the Arunta Complex to the west and south.
Sediments within the Georgina Basin consist mainly of Cambrian to Middle Ordovician marine sedimentary rocks. The Cambrian and Early Ordovician sediments are dominated by marine carbonate rocks with minor sandstone and siltstone, while the Middle Ordovician rocks are comprised primarily of siltstone and sandstone. Silurian to Devonian freshwater sandstone and Permian boulder beds overlie the early Palaeozoic Georgina Basin succession and are thought to represent younger successions laid down in later basins. Throughout the basin, sediments have been deformed by minor to moderate folding and faulting, with moderate to strong folding, faulting and overthrusting along the southern margin.
10
Figure 4 - Location of major phosphorite deposits of the Georgina Basin, northwest Queensland (after Rogers and Keevers, 1976).
11
Local Geology
Due to considerable exploration efforts in the 1960’s and 70’s the local geology of the Paradise South area has been well-described in several publications, namely Rogers and Keevers (1976), Thomson and Russell (1971) and Thomson and Rogers (1974). The results of the current drilling program concur with the findings of the historic drilling results and geological interpretation. The geology description herein is derived from both historic and recent observation and results.
The Paradise South phosphorite deposit, discovered in the late 1960’s and formerly known as the Lady Annie phosphorite deposit, is located in an outlier of the Georgina Basin, separated from the D-Tree deposit to the west by outcropping Precambrian sediments (Figure 4). It is confined to an area of low relief, approximately 25 km long and 5 km wide, trending north-south between ridges and hills of Precambrian shales, quartzites, siltstones and dolomite. The sedimentary phosphate rock was deposited in an embayment of the inland sea that covered the Georgina Basin during the early Middle Cambrian.
Stratigraphy of the embayment hosting the Paradise South phosphorite is comprised of sediments of Cambrian and Mesozoic age, with some thin overlying Tertiary and Recent deposits. The phosphatic unit that comprises the reserves defined herein is the Beetle Creek Formation. The most prominent units of the Paradise South project area are as follows:
|
|
●
|
Tertiary laterite and silcrete up to 5m thick.
|
|
|
●
|
Mesozoic quartz sandstones, micaceous mudstone and coarse conglomerate beds. These sediments are mostly confined to the western boundary of the Paradise South project area, adjacent to the Western Fault and can be up to 40m thick.
|
|
|
●
|
The Inca Formation of Middle Cambrian age consists of well-laminated fissile shale with some interbeds of siltstone and minor chert. This unit has a recorded maximum thickness of 24m in the project area.
|
|
|
●
|
The Beetle Creek Formation of Lower Middle Cambrian age consists of beds of phosphorite, siltstone, shale and chert. Phosphorite lithologies include friable pelletal phosphorite and soft clayey phosphatic mudstone. This unit attains a maximum thickness of 46.5m in the Paradise South project area.
|
|
|
●
|
The Thorntonia Limestone underlies the Beetle Creek Formation on the eastern margin of the Paradise South project area. In contrast to the Beetle Creek Formation this unit is characterized by dolomitic limestone containing abundant chert nodules. The thickness of this unit is highly variable and reaches a maximum of 16m.
|
|
|
●
|
The Mt Hendry Formation forms the basal unit of the Cambrian stratigraphy and is typically a 2m thick conglomerate with lesser sandstone.
|
Drilling, Sampling and Metallurgical Testing
Legend has completed 180 reverse circulation (RC) drill holes within the MLA area of the Paradise South Phosphorite Deposit and an additional 32 core diamond drill holes have been completed with 23 of those diamond drill holes being twins to the reverse circulation drill holes.
The cored diamond drill holes were 83mm in diameter and intersected the full thickness of the phosphate rock horizon. Diamond core samples were generally collected in 1.5m core runs, except where ground conditions dictated shorter run lengths. To ensure diamond core sample integrity was maintained, each run of diamond drill core was transferred from the inner tube to a PVC split placed inside the core tray to hold the core in place. This was particularly effective in maintaining the sample integrity of highly oxidised, friable core samples.
12
The RC drill holes were 120mm in diameter and extended to variable depths each of which was sufficient to intersect the anticipated and full thickness of the phosphate rock bearing horizon. RC sampling was conducted using a commercially available rig-mounted static cone splitter. The sampling procedures were developed by the Legend Geology team and required several steps:
|
|
●
|
The RC samples were composites, collected for each 1 metre interval.
|
|
|
●
|
A cone splitter was used to collect a 1 to 3 kilogram subsample for ore interval assaying. A second field duplicate was collected at the same time for future reference.
|
|
|
●
|
All sample reject through the cone splitter was collected, labelled and stored in a temporary storage area at Paradise South and are available for future testing.
|
|
|
●
|
A combined sample weight was measured using on site scales and logged into the database.
|
|
|
●
|
Each sample was tested in the field using the modified Shapiro test for estimating phosphate content. A sample returning a positive field test result was submitted to the analytical laboratory for final analysis.
|
|
|
●
|
For each hole two field duplicates were submitted for analytical testing.
|
|
|
●
|
A set of matrix matched reference standards were inserted into the lab submission for QA/QC purposes. Standards were submitted to the lab at a rate of 1 in 25 samples. A coarse blank sample was also inserted for submission at a rate of 1 in 25 samples.
|
Drill Sample Recovery
All drill samples were weighed in the field using calibrated digital scales accurate to the gram. Each sample was weighed, including the original sample, the duplicate and the reject sample. The data was recorded on site and monitored by the field geologist to ensure no unacceptable fluctuations in sample recovery occurred while drilling.
Recorded sample weights were compared to expected sample weights, as derived by calculating the volume of the cylindrical sample. The expected weight of the sample was then calculated using the average bulk density value for the sediment type. The direct comparison of recorded sample weights against expected sample weights highlights whether any potential sample bias has occurred as a result of the drilling or sample collection technique.
All diamond drilling had core recoveries measured and calculated while at the rig. Generally all recoveries for diamond drilling were greater than 85%, but where less than 85% recovery occurred, the main issue noted by the driller’s were cavities that occur in the Beetle Creek Formation. These were identified as drilled, and logged.
Drill Sample Logging
The logging of all RC chips and Diamond core from the deposit was carried out by qualified geologists who provided daily supervision of the rigs for the duration of the program. Logging of chips and core was done in a qualitative manner directly into a field notebook computer and data was entered into the database several times a week. The level of detail obtained from the chips/core during the logging process has been deemed sufficient to support the mineral reserve estimation process and metallurgical studies that have been carried out. Whilst in the field, geologists were significantly assisted with regards to assessing P2O5 content of chips/core by using the modified Shapiro test, a chemical visual colorimetric test that was developed in the 1960’s. This allowed a quantitative estimate of phosphate content to be obtained at the time of drilling and that data was subsequently used as a tool to select intervals for assay. Once assays were returned, these definitive results were combined with the geological logs in order to create a model for reserve estimation.
13
All logging was conducted using pre-determined codes, as outlined in the Legend ‘Manual of Standardised Geological Procedures’. Lithology codes can only be entered into the database as set, and any non-recognised codes would be rejected when loaded into the database. Any coding errors were sent back to the geologist responsible for correction.
Laboratory sub-sampling techniques and preparation
For typical RC holes, samples were usually a 1-3kg sub-split taken from all chips recovered over any given 1m down-hole sample interval. All sample splits collected were sent to ALS Laboratories in Mt Isa and/or Brisbane or Amdel laboratories in Mt Isa. All samples were split and pulverised, with lab splits taken at the preparation stage for cross-checking of the sample prep stage. All samples were pulverised in a tungsten carbide mill. A quartz wash was processed through the mill between each sample due to the sometimes clayey nature of the phosphorite ore. The quartz wash ensures no inter-sample contamination.
Legend also included a coarse blank sample (glass quality beach sand) to be used to assess the sample preparation stage. These blanks are known to contain P2O5 levels below detection and therefore would identify any preparation contamination.
At all stages through the sampling process a duplicate system was used. The duplicates used and reported at all stages were:
|
|
●
|
Field duplicate – taken on the drill rig to test sampling technique.
|
|
|
●
|
Lab Splits – samples taken at the sample preparation stage to ensure prep techniques are suitable.
|
|
|
●
|
Lab repeats – a repeat assay analysis of the final pulp.
|
All of these duplicates are analysed and reported internally as monthly QA/QC statistics for the deposit.
Where core samples have been submitted for assay, half core samples were taken using a manual diamond blade core saw. Before cutting, diamond cores were metre marked and assessed to make sure all of the pieces of core were positioned to conform to the original orientation, i.e. all core breaks were aligned. Core samples were then crushed at the laboratory prior to being riffle split into sub-samples and prepared for analysis by the same method used for RC samples.
Quality of Assay Data
Samples were assayed by one of two analytical techniques; 1) wavelength dispersive X-ray fluorescence spectrometry and/or 2) an ICP acid digest method that conforms to the internationally accepted analytical method of the Association of Fertiliser and Phosphate Chemists (AFPC).
XRF methodology
The samples were dried at 105°C, pulverised and an aliquot taken for XRF analysis. The pulp was fused using a Lithium-Borate flux mixture with a Sodium-Nitrate oxidant. The fusion disks were analysed using wavelength dispersive X-ray fluorescence spectrometry for the following suite of elements and reported according to their total ‘oxide’ form as follows:
|
|
●
|
P2O5, Fe2O3, Al2O3, MgO, SiO2, CaO and LOI
|
ICP acid digest methodology
The samples are dried at 105°C, pulverised and an aliquot taken for acid digest in two parts nitric acid, two parts water and 1 part hydrochloric acid. The acid digest method conforms to one of the internationally accepted analytical methods of the Association of Fertilizer and Phosphate Chemists (AFPC). The specific method is ICP Method 3D-2. The acid digest is then analysed using the multi-element inductively coupled plasma atomic emission spectrometer (ICP-AES). The standard assay suite for the ICP analytical technique is:
|
|
●
|
P2O5, Al2O3, Fe2O3, MgO, CaO
|
14
The accuracy and precision of the analytical techniques used were tested through the use of standards. The standards used for all of Legend’s drilling programs consist of commercially manufactured, matrix matched, certified standard reference material. The standards were manufactured and supplied by Ore Research & Exploration Pty Ltd based in Bayswater in Melbourne. Each standard was analysed at ten commercial laboratories by lithium borate fusion with XRF or ICP finish.
The material used for these standards was sourced from the Paradise South deposit from several different locations to simulate the different ore types recognised throughout the Georgina Basin. During manufacture two pigeon pair samples of close range were produced. These standards were submitted during drilling. These standards were used as their mean grades (and their ranges) are close together, thus making it harder for a lab to identify which one is being used.
These standards are pre-prepared so require no milling at the lab, therefore they are only used to test the pure analytical technique and not sample preparation. Each standard is individually wrapped and submitted unmarked; therefore the laboratory will not know which standard is being submitted.
Lab Repeats
During analysis each laboratory was required to repeat the analysis on approximately 1 in 25 samples. This is to test the analytical technique at the data capture stage. Once assay analysis was complete all sample rejects and sample pulps were returned to Legend for storage in a secure facility in Mt Isa.
Metallurgy
Beneficiation Process Testing
For the metallurgical test work conducted on the Paradise South phosphorite in 2010, 39 samples were composited from the phosphorite horizon/s from 22 diamond holes and 4 RC holes. Legend processed 32 out of the 39 composited Paradise South drill core and reverse circulation samples through their beneficiation flow sheet to model the relationships between ore and concentrate analyses for P2O5 (See Table 2 below) and the main impurity species Fe2O3, Al2O3, MgO and CaO. Each selected metallurgical diamond and RC drill core was individually dry tumbled and screened at 25mm to remove silica in the +25mm fraction. The -25mm fractions were wet milled to a minimum P80 150 microns and then filtered to at least 75% solids. This slurry was then systematically conditioned with flotation reagents including a collector and an iron depressant at 75% solids before being diluted to approximately 20% solids with water and transferred to the pilot scale flotation cell. Rougher, scavenger and cleaner flotation was completed on each sample, followed by filtering, drying, and weighing of the products. Each product was assayed for P2O5, Fe2O3, Al2O3 and CaO by ICP and MgO and SiO2 by XRF.
The results of this work allowed Legend to calculate the mineral reserve tonnes in terms of phosphate rock concentrate product. These samples provided a full range of phosphorite samples and variations of the primary chemical components (P2O5, Fe2O3, Al2O3, MgO and CaO) in the ore and the resulting primary chemical components after the initial crushing and sizing, in the flotation feed, and in the phosphate rock concentrate. From these metallurgical tests it was possible to develop high-quality, strongly correlated regression formulas to convert the ore assays to reliable estimates of the concentrate chemistry and the amount of recoverable product.
15
Table 2 – Reserve Beneficiation Sample Tests – Original Ore Sample and After Beneficiation Concentrate Grades
|
Sample
|
Drill Hole
|
Original Sample Mass (kg)
|
Original
Sample Grade
(% P2O5)
|
Original
Sample Grade
(% Fe2O3)
|
Original
Sample Grade
(% Al2O3)
|
Original
Sample Grade
(% CaO)
|
Original
Sample Grade
(% MgO)
|
Conc
Sample
Mass (kg)
|
Conc
Sample
Grade
(% P2O5)
|
Conc
Sample
Grade
(% Fe2O3)
|
Conc
Sample
Grade
(% Al2O3)
|
Con
Sample
Grade
(% CaO)
|
Concentrate Sample
Grade (% MgO)
|
|
JC1
|
PSRC0156
|
53.37
|
7.79
|
3.65
|
2.99
|
22.84
|
8.14
|
7.66
|
19.4
|
1.57
|
0.54
|
39.8
|
8.97
|
|
JC2
|
PSRC0157
|
59.44
|
16.75
|
8.47
|
5.65
|
24.22
|
0.76
|
12.41
|
34.4
|
2.48
|
0.86
|
50.1
|
0.54
|
|
JC3
|
PSRC0148
|
57.73
|
19.74
|
6.99
|
5.45
|
27.94
|
0.95
|
12.39
|
36.4
|
2.19
|
0.86
|
50.2
|
0.46
|
|
JC4
|
PSDD0001
|
76.38
|
20.89
|
7.27
|
5.72
|
30.10
|
0.46
|
17.55
|
33.3
|
2.27
|
1.34
|
48.1
|
0.26
|
|
JC5a
|
PSDD0002
|
28.96
|
22.91
|
5.01
|
3.57
|
32.04
|
0.22
|
11.11
|
36.7
|
2.13
|
0.66
|
50.7
|
0.08
|
|
JC5b
|
PSDD0002
|
41.34
|
12.11
|
20.89
|
3.86
|
16.56
|
0.28
|
10.12
|
9.08
|
46.5
|
1.27
|
11.5
|
0.28
|
|
JC6a
|
PSDD0003
|
43.99
|
16.01
|
4.83
|
2.93
|
23.06
|
0.91
|
8.08
|
33.4
|
1.61
|
0.7
|
49
|
1.62
|
|
JC6b
|
PSDD0003
|
31.25
|
4.77
|
0.96
|
1.43
|
29.75
|
14.97
|
13.93
|
4.98
|
0.62
|
0.27
|
33.5
|
17.3
|
|
JC7
|
PSDD0007
|
76.23
|
16.83
|
5.45
|
6.28
|
24.04
|
1.03
|
18.73
|
33
|
3.33
|
1.14
|
47.5
|
1.18
|
|
JC8
|
PSDD0008
|
38.13
|
14.77
|
4.97
|
6.66
|
21.34
|
0.71
|
7.03
|
34.9
|
1.96
|
0.82
|
49.5
|
1.17
|
|
JC9a
|
PSD0009
|
28.15
|
21.68
|
4.49
|
3.01
|
30.42
|
0.34
|
5.28
|
34.8
|
1.93
|
0.69
|
49.6
|
0.28
|
|
JC9b
|
PSD0009
|
31.84
|
8.92
|
6.60
|
8.72
|
12.70
|
0.61
|
9.66
|
27.5
|
7.3
|
1.49
|
39.5
|
0.34
|
|
JC10
|
PSD0010
|
46.7
|
6.92
|
7.32
|
20.26
|
1.23
|
41.24
|
3.34
|
30.4
|
1.98
|
1.01
|
47.8
|
1.17
|
|
JC11a
|
PSD0014
|
46.93
|
7.61
|
2.13
|
5.35
|
9.94
|
0.23
|
5.28
|
29.3
|
4.16
|
1.89
|
40.6
|
0.28
|
|
JC11b
|
PSD0014
|
23.94
|
10.42
|
15.07
|
5.83
|
14.22
|
0.33
|
5.82
|
29.3
|
9.6
|
2.04
|
40.7
|
0.21
|
|
JC12
|
PSD0015
|
23.69
|
14.62
|
7.52
|
3.67
|
20.85
|
0.53
|
11.79
|
30.1
|
3.69
|
1.43
|
43.8
|
0.44
|
|
JC13
|
PSD0016
|
30.63
|
9.77
|
2.99
|
6.94
|
13.89
|
0.55
|
3.61
|
34.3
|
2.05
|
0.94
|
49.4
|
0.59
|
|
JC14
|
PSDD0017
|
30.8
|
9.13
|
7.56
|
4.08
|
14.05
|
1.22
|
3.04
|
30.4
|
2.38
|
0.91
|
45.4
|
1.06
|
|
JC15
|
PSDD0021
|
19.65
|
15
|
7.52
|
3.97
|
20.42
|
0.26
|
3.66
|
27.9
|
8.17
|
2.08
|
38.1
|
0.24
|
|
JC16a
|
PSRC0141
|
62.76
|
17.15
|
16.76
|
3.30
|
23.82
|
0.25
|
9.84
|
34.1
|
5.87
|
1.11
|
46.8
|
0.15
|
|
JC16b
|
PSRC0141
|
54.5
|
17.06
|
16.79
|
3.27
|
23.69
|
0.25
|
28.21
|
33.2
|
6.99
|
1.34
|
45.9
|
0.18
|
|
JC17
|
PSRC0141
|
34.7
|
5.66
|
0.87
|
4.61
|
7.53
|
0.16
|
2.55
|
34.7
|
1.17
|
2.23
|
46.6
|
0.19
|
|
JC18
|
PSRC0151
|
67.9
|
16.26
|
5.44
|
6.31
|
24.33
|
1.69
|
12.81
|
31.6
|
3.62
|
0.9
|
46.7
|
2.24
|
|
JC19
|
PSRC0151
|
42.1
|
12.21
|
12.25
|
5.47
|
18.36
|
1.71
|
3.7
|
32.9
|
4.11
|
1.02
|
46.2
|
1.5
|
|
JC20
|
PSDD0025
|
59.14
|
18.01
|
13.53
|
3.22
|
25.04
|
0.38
|
16.9
|
32.4
|
8.07
|
0.75
|
46.1
|
0.22
|
|
JC21
|
PSDD0022
|
59.11
|
27.06
|
3.36
|
2.70
|
38.04
|
0.26
|
15.59
|
36
|
2.06
|
0.7
|
51
|
0.15
|
|
JC22a
|
PSDD0024
|
69.8
|
30.69
|
3.03
|
1.51
|
41.96
|
0.08
|
15.15
|
37.2
|
2.22
|
0.77
|
50.8
|
0.06
|
|
JC22b
|
PSDD0024
|
37.79
|
10.27
|
5.88
|
4.32
|
14.43
|
0.39
|
3.89
|
33
|
3.99
|
0.98
|
45.3
|
0.15
|
|
JC23a
|
PSDD0042
|
35.17
|
15.76
|
2.57
|
5.00
|
21.77
|
0.37
|
8.39
|
33.9
|
1.79
|
1.08
|
47.1
|
0.23
|
|
JC23b
|
PSDD0042
|
33.8
|
14.34
|
6.72
|
4.01
|
20.16
|
0.43
|
7.98
|
33.2
|
4.02
|
0.67
|
45.6
|
0.2
|
|
JC24a
|
PSDD0144
|
41.4
|
14.18
|
10.85
|
5.06
|
20.96
|
1.32
|
8.34
|
31.3
|
3.95
|
0.77
|
46.4
|
1.52
|
|
JC24b
|
PSDD0144
|
56.1
|
8.85
|
6.84
|
4.98
|
14.00
|
1.85
|
3.88
|
28.6
|
2.79
|
0.89
|
43.6
|
2.64
|
Investigative Studies of the Fe2O3 Content
Many phosphorite deposits in the Georgina Basin have a higher than normal Fe2O3 content when compared to the typical world phosphorite deposits. This results in a higher than normal MER (Minor Element Ratio) defined as the metallic contents of Fe2O3 + Al2O3 + MgO divided by the P2O5. In the case of the Paradise South Deposit, the MER ratio for the phosphate rock concentrates is 0.12 compared to the more common ratio of 0.10.
16
Legend commissioned definitive chemical and mineralogical studies to define the behavior of the Fe2O3 in the Paradise South phosphate rock concentrates. Phosphoric acid testing at an independent laboratory (Crescent Technologies in New Orleans, Louisiana) and at the company laboratories of IFFCO (Indian Farmers Fertilizer Cooperative (India) and Wengfu (China) confirmed that approximately 50% of the iron content was not reporting to the phosphoric acid; therefore, the phosphoric acid MER was acceptable for manufacturing ammoniated granular phosphate-base fertilizers (DAP). Further testing of several phosphate rock concentrate samples with varying Fe2O3 contents were acidulated with the phosphate rock concentrate, the acidulation residue, and the phosphoric acid being assayed and the residue mineralogy being defined by QEM-SCAN (Quantitative Evaluation of Minerals by SCANning electron microscopy). The electron microscopy work clearly indicated than much of the residual solids from the phosphoric acid test was goethite, an iron mineral, which resisted acidulation. Further, the goethite particles contained apatite inclusions and voids that appeared to be similar to the apatite inclusions but indicated that some of the apatite inclusions had been acidulated.
Table 3 below shows some results from these tests and indicates only 29.2%, 11.6% and 21% of the Fe2O3 in these phosphate rock concentrate leaches into the resulting phosphoric acid. Mineralogical examination concluded that the Fe2O3 in Paradise South phosphorite is present as the refractory mineral goethite and does not leach as readily as other Fe2O3 minerals. These three samples were selected for testing due to their higher than typical Fe2O3 contents. Approximately 82 grams were used for the iron leach tests which were split from a 0.5kg sample of concentrate derived from individual composited drill core samples.
Additional tests with samples representing higher Fe2O3 contents are being planned. The results of those tests may result in an increase in the Paradise South reserve tonnage estimate as higher levels of Fe2O3 could potentially be processed.
Table 3- Iron solubilities in phosphoric acid.
|
Sample
|
Rock
Concentrate Units Fe2O3 |
Phosphoric
Acid Units Fe2O3 |
Fe2O3
Extraction % to acid |
|
JC14
|
2.12
|
0.62
|
29.2
|
|
JC19
|
3.20
|
0.37
|
11.6
|
|
JC20
|
6.92
|
1.45
|
21.0
|
Bulk Density Testing
Bulk density and associated tonnage calculations have been determined from a series of diamond holes distributed across the Paradise South phosphorite deposit. A bulk density sampling program was carried out on diamond core samples from 17 locations with a total of 281 samples. In each drill core, samples were taken from each identified lithology, which in most cases involved taking samples at intervals ranging from 0.5 - 2m. Whole drill core samples, typically of minimum 100mm length and up to 350mm in length, were submitted to the laboratory for bulk density analysis using a standard Archimedes method. Dried core samples were coated in paraffin wax and then weighed in air and again in a liquid of known density, i.e. water, and the bulk density calculated from the difference in weights. The dry bulk densities were determined from samples from the mineralized horizon and for host rock and waste rock lithologies.
A review of the bulk density data relative to lithology and assay grades showed that a range of bulk density values were recorded in the ore zone. The bulk density of the ore zone is generally 1.9, and the range in bulk density values may be attributed to the different lithologies that comprise the ore zone. For example, mudstone phosphorite, also known as microsphorite, tends to show lower bulk density than peloidal and replacement phosphorite.
17
Differences in clay content and varying states of oxidation and porosity of the ore zone throughout the deposit, may also contribute to the range in bulk density.
The overburden bulk density is generally quite similar to the phosphate zone, likely reflecting an indistinct boundary and contrast between phosphate and waste lithologies.
Table 4 below gives a statistical summary of the bulk density data from within the ore and waste zones.
For the reserve estimate, a conservative bulk density of 1.8 tonnes per cubic meter was used to convert measured phosphorite volumes to phosphorite tonnes.
Table 4: Statistical summary of bulk density data taken from Paradise South core samples and coded according to the resource model domain for ore composite intervals and waste.
|
Ore
|
Waste
|
|
|
Mean
|
1.89
|
2.04
|
|
Standard Error
|
0.02
|
0.05
|
|
Standard Deviation
|
0.24
|
0.29
|
|
Sample Variance
|
0.06
|
0.09
|
|
Confidence Level (95.0%)
|
0.04
|
0.09
|
Note that bulk density data are given in units of tonnes per cubic metre.
2010 PARADISE FEASIBILITY STUDY
A feasibility study on the Paradise South project was completed in July 2010. The study was based on a project that involves development of a beneficiation plant at Paradise South to upgrade the phosphorite ore into a phosphate rock concentrate suitable for phosphate-based fertilizer manufacture. The phosphate rock concentrate will be transported to Mount Isa for treatment in a purpose built DAP/MAP fertilizer manufacturing facility. The DAP, MAP and AlF3 will be transported from Mount Isa to the Port of Townsville via rail for local and international markets. A feasibility study conducted in 2010 outlined that the project was technically and economically viable for the base case scenario as described below:
|
|
Ø
|
Transport approximately 1 million tonnes of upgraded ore by road from Paradise South to the proposed Mt Isa Fertilizer Complex.
|
|
|
Ø
|
Direct acidulation in Legend’s proposed phosphoric acid plant of upgraded ore to produce approximately 300ktpa phosphoric acid using approximately 800ktpa of sulfuric acid (200ktpa sourced from local smelters and 600ktpa produced in Legend’s sulfuric acid plant, using imported sulfur).
|
|
|
Ø
|
Import of approximately 100ktpa of liquid ammonia (NH3) to combine with phosphoric acid in the ammonium phosphate plant to enable granulation of MAP and DAP in a ratio dependent on market conditions but currently assumed at 400ktpa MAP and 200ktpa DAP.
|
|
|
Ø
|
Production of 15ktpa of aluminum fluoride (AlF3) through Wengfu’s proprietary technology for their self-developed dry process. This marketable chemical product is used in the aluminum industry which currently has a strong demand both locally in Australia and in overseas markets.
|
|
|
Ø
|
Water for the phosphoric acid plant will be sourced from the Lake Julius water allocation. Water will be transferred from Lake Julius to Lake Moondarra via the existing transfer pipeline. An existing pumping station and new pipeline from Lake Moondarra will service the phosphoric acid plant.
|
|
|
Ø
|
Power for phosphoric acid plant will come from the Ergon Energy eastern transmission line near Mica Creek Power Station.
|
|
|
Ø
|
Transport 600ktpa of MAP/DAP and 15ktpa aluminium fluoride in containers on flat bed rail wagons from Mt Isa to the Port of Townsville using 2 train sets for sale on the local and international markets.
|
18
Transport
During 2010, Legend, its rail operator P&O Trans Australia and Queensland Rail commenced negotiations for a rail access agreement for the transport of approximately 700,000 ton per year of phosphate products from Mount Isa to Townsville and the transport of sulfur and ammonia between Townsville and Mount Isa.
Queensland Rail confirmed that subject to the successful execution of an access agreement including agreement of a rail operating plan, the required capacity in the form of train paths is currently available for the proposed operations.
The Mount Isa Line Master Plan released in late 2009 clearly identifies infrastructure solutions available should additional incremental capacity be required. A commitment has been by the Queensland Government to support the first tranche of capacity enhancements. The Queensland Government announced in December 2009 that it will commit AUD$102 million to upgrades to the Mt Isa to Townsville rail line over the next two years. These upgrades will be aimed at increasing efficiency and capacity for future demand. This announcement is consistent with Legends own discussions with the Queensland government and in particular the Premier of Queensland who has given the Legend Phosphate project her full support. Completion of these works will increase current system capacity by approx. 1.5 million tonnes per annum.
Legend also engaged Pipeline Systems International (PSI) to undertaken a conceptual study for assessment of a slurry pipeline to transport the beneficiated phosphate ore from the deposit site to existing rail facilities. The option would involve a dewatering facility at the rail terminal and return water pipelines to the beneficiation plant following the route of the slurry pipeline. The dewatered phosphate concentrate would be loaded into rail wagons and make their way via rail to the Port of Townsville for storage and loading to ship.
Water supply
Beneficiation Plant
Three water supply options are under consideration for the beneficiation plant:
|
|
1.
|
Lake Julius option
|
Legend engaged SunWater to undertake a pre-feasibility study to assess the option of directing up to 10GL of unallocated water from Lake Julius to the proposed mine and beneficiation plant. Lake Julius is located approximately 85 kilometers east southeast of the proposed mine and beneficiation plant. The findings of this study will be compared against the other options presented below but initial findings are that the water supply is available to Legend and it is technically feasible to bring this water to the proposed site.
|
|
2.
|
Thorntonia Borefield option
|
Legend has commenced commercial negotiations in regard to the lease of an existing borefield water permit. The borefield water will need to be pumped approximately 45 kilometers to the beneficiation plant via an above ground pipeline.
|
|
3.
|
Upper Battle Creek Dam
|
Legend has investigated the potential to develop new surface water storages in the catchment; Lower Gunpowder Creek, Upper Gunpowder Creek, Battle Creek and Upper Battle Creek. Upper Battle Creek is the preferred site. Conceptual studies including a yield analysis, geotechnical reconnaissance, visual assessment, conceptual design and capital expenditure estimate have been completed.
19
The dam is intended to supply a proposed phosphate mine for a period of 30 years. With a catchment area of 162 ha, the estimated yield of the storage is 2500 ML/a at 90% reliability, requiring a storage capacity of 10,000 ML.
The spillway excavation will provide all or most of the rock needed for the dam. Subject to drilling, the rock appears to be of high quality. A rock fill dam with a concrete slab on the upstream face is considered the most suitable, requiring much smaller concrete plant.
Legend have estimated the Probable Maximum Flow (PMF) inflow in Upper Battle Creek as 1000 m³/s. Assuming a 75 m wide spillway channel invert, the maximum flood rise would require a dam wall about 20 m high. Increasing the width to 150 m, the flood rise is less and the embankment height (and rock volume) is reduced to 16.5 m. The corresponding volume of rock is about 90,000 m³.
Fertiliser Complex
The water for Mount Isa and its mining industries is sourced from Lake Moondarra on the Leichhardt River. The water supply of Lake Moondarra is sustained in dry years by water pumped from Lake Julius further downstream on the Leichhardt River. The full supply capacities of Lake Moondarra and Lake Julius are 107,000ML and 107,500ML respectively. Water supply licenses from Lake Moondarra are fully allocated. There is 10,800ML per year of unallocated water available from Lake Julius. A 1200ktpa DAP/MAP Fertiliser Complex (doubled production scenario) requires 2,800 ML per year of makeup water.
Water demand for the Mt Isa Plant will be met by unallocated water from Lake Julius. Mount Isa Water Board (MIWB) can provide water for the Fertiliser Complex plant from Lake Julius via the Lake Moondarra transfer system. Supply will be taken at a flange immediately downstream from the Mount Isa Transfer Reservoir and this will be fed to the battery limit of the Fertiliser Complex via a 600mm diameter pipeline.
Power supply
Beneficiation Plant
Generation
Legend has commenced commercial negotiations with local power generators in regards to the supply of power for the proposed beneficiation plant with a load factor of 80% for a 24 hr-7 day a week operation.
Power distribution option
Legend has made a connection enquiry to Ergon Energy for a connected load to the existing Century Zinc 220kV 100 MVA line. This transmission line passes within 40km of the proposed beneficiation plant.
Fertiliser Complex
There are three options for power generation:
|
|
1.
|
Mica Creek is a 325MW natural gas fired power plant, located one kilometre to the north of the proposed Fertiliser Complex site. Legend has received an offer to connect from CS Energy to meet the power requirements for the Fertilizer Complex
|
|
|
2.
|
Legend is one of five Foundation Mining Customers of the CopperString project. The CopperString project is a proposal to construct a transmission line from Woodstock (south of Townsville) to Dajarra Road near Cloncurry in North West Queensland. The proposed transmission line will provide Legend with access to the National Electricity Grid, significantly improving the supply and reliability of electricity to the region.
|
|
|
3.
|
Legend also continues to negotiate with APA regarding its proposed gas-fired power station near the Fertilizer Complex.
|
20
Depending on the generation option a 220kV or 132kV powerline form Mica Creek Substation (or APA substation) will be used to distribute power to an on-site substation. The plants within the Fertilizer Complex operate on a 11kV system.
One waste heat recovery power station is proposed for this project, in which a 25MW and 11.5kV steam turbine generator is provided. During normal operation, the generating unit of the power station can provide approximately 25MW power with a further 36.3MW power required from the external network. In the event that the generator fails the entire power demand of 61.3MW will be sourced from the external grid.
Environment
Mt Isa Fertilizer Complex
Legend has submited a Development Application through Mount Isa City Council to be assessed under the Sustainability Planning Act (2009) with the Department of Environment & Resource Management and Department of Transport & Main Roads as concurrency authorities.
Legend has completed the following studies in relation to the fertilizer complex which have been submitted to the Mount Isa City Council:
|
|
●
|
Road Impact Assessment
|
|
|
●
|
Workforce Management Plan
|
|
|
●
|
Landscape Response
|
|
|
●
|
Quantitative Risk Assessment
|
|
|
●
|
Traffic Management & Carparking
|
|
|
●
|
Environmental Assessment Report
|
|
|
●
|
Air Quality Impact Assessment
|
|
|
●
|
Noise Assessment
|
|
|
●
|
Flood Impact Assessment
|
|
|
●
|
Aquatic Ecology & Water Quality Baseline Condition Assessment
|
|
|
●
|
Stormwater Management Plan
|
|
|
●
|
Geotechnical & Geology Assessment
|
|
|
●
|
Erosion & Sediment Control Management Plan
|
|
|
●
|
Hydrogeological Assessment
|
|
|
●
|
Gypsum Disposal Management Plan
|
|
|
●
|
Waste Management Plan
|
|
|
●
|
Dangerous Goods & Hazardous Material Assessment
|
|
|
●
|
Decommissioning & Rehabilitation Strategy
|
The Mount Isa City Council is currently assessing the reports.
21
The level of environmental approval required is predicated on the size and nature of the proposed mining operation. Legend’s Paradise North (ML90191) mine lease has been approved through submission of an Environmental Management Plan (EMP) given that these are small scale operations with minimal ore processing. Legend’s larger Paradise South proposed mine operation includes a beneficiation processing plant requiring power and water infrastructure and accordingly is being approved through an Environmental Impact Statement (EIS) with supporting EMP. Legend has voluntarily applied to undertake the EIS for the Paradise South mine lease. The State government provides no indication of expected expenditure for completing an EMP only or EIS with EMP. The studies required in the EMP and EIS include air quality, surface water, groundwater, ecology and geology, as a minimum. The remoteness of sites and availability of historical data greatly influence costs. Legend estimate the total cost of EMP only of US$1 million and EIS with EMP of approximately US$2 million.
Project Expansion Study
An expanded study is currently underway to examine the feasibility of doubling production to produce 1.2 million tonnes of DAP/MAP and 30,000 tonnes of AlF3 per year. The above reported mineral reserve estimate warrants an expanded production scenario with no further drilling required at this stage.
LEGEND’S LANDHOLDINGS AND EXPLORATION PROJECTS
The Legend landholdings, both granted and under application, prospective for phosphate, diamonds and base metals cover 502,949.9 acres in Queensland, Australia and over 3,936,528 million acres in the Northern Territory, Australia (refer to tables A,B,C and D). Areas under application are not considered as currently under Legend’s control. Granted landholdings consist of 428,792.4 acres in Queensland and 1,162,382 acres in the Northern Territory (refer to tables A and C). In Queensland, Legend’s holdings contain both historically defined phosphate mineralized material and current mineral reserves located in the Mt. Isa district, along the margin of the Georgina Basin which is host to major base metal and phosphate deposits.
Legend’s exploration tenements are divided into the following project areas (See Figure A below):
|
|
●
|
Phosphate Projects:
|
|
|
§
|
Paradise Phosphate Project, Queensland
|
|
|
§
|
D-Tree Phosphate Project, Queensland
|
|
|
§
|
King Eagle Phosphate Project, Queensland
|
|
|
●
|
Diamond and Phosphate Projects:
|
|
|
§
|
Barr Creek Project, Queensland
|
|
|
●
|
Diamond Projects:
|
|
|
§
|
Glyde River, Northern Territory.
|
|
|
§
|
Foelsche, Northern Territory
|
|
|
§
|
Abner Range, Northern Territory.
|
|
|
§
|
Cox, Northern Territory.
|
|
|
§
|
Gravity Project, Northern Territory
|
|
|
●
|
Diamonds and Base Metals
|
|
|
§
|
McArthur River, Northern Territory
|
The exploration tenements of North Australian Diamonds are discussed separately below.
22
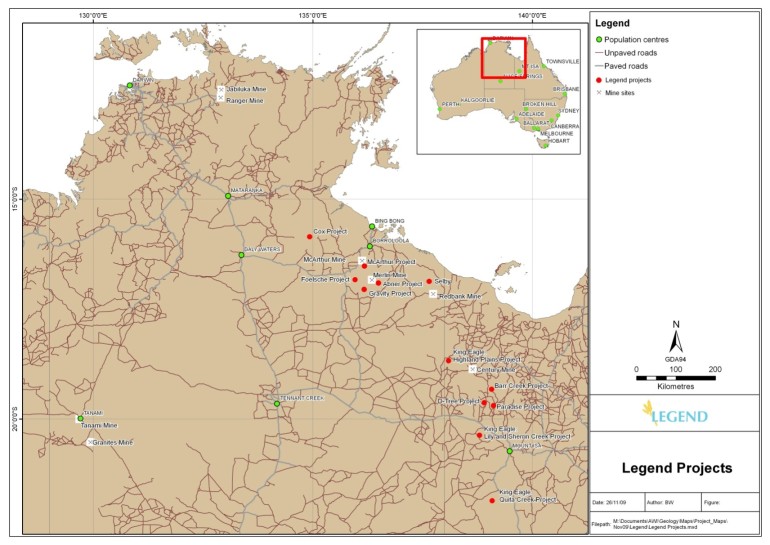
Figure A: Projects in Northern Territory and Queensland, Australia
23
Queensland and Northern Territory Projects
Tenement Status, Details & Commitments (Projected) Queensland and Northern Territory, Australia
|
GST Inclusive
|
|||||||||||||||||
|
Lease
|
Lease
Status |
Project
|
Grant Date
|
Expiry
Date |
Acres
|
Anniversary
Date 2011 |
Rent 2010
|
Commitment
2011 |
|||||||||
|
EPM14753
|
Granted
|
D-Tree
|
21-Apr-08
|
20-Apr-13
|
16702.14
|
21-Apr-11
|
$100,000
|
$2,590
|
|||||||||
|
EPM14905
|
Granted
|
King Eagle*
|
12-Dec-06
|
11-Dec-11
|
73171.28
|
12-Dec-11
|
$140,000
|
NA-expires
|
|||||||||
|
EPM14906
|
Granted
|
King Eagle*
|
24-Aug-07
|
23-Aug-12
|
58855.16
|
24-Aug-11
|
$120,000
|
$9,127
|
|||||||||
|
EPM14912
|
Granted
|
King Eagle*
|
30-Jan-07
|
29-Jan-12
|
79534
|
30-Jan-11
|
$120,000
|
$12,335
|
|||||||||
|
EPM15014
|
Granted
|
Barr Creek
|
21-Aug-06
|
20-Aug-11
|
33404.28
|
21-Aug-11
|
$20,000
|
NA-expires
|
|||||||||
|
EPM15015
|
Granted
|
Barr Creek
|
21-Aug-06
|
20-Aug-11
|
29427.58
|
21-Aug-11
|
$20,000
|
NA-expires
|
|||||||||
|
EPM15763
|
Granted
|
D-Tree
|
26-Jun-08
|
25-Jun-13
|
62831.86
|
26-Jun-11
|
$50,000
|
$9,745
|
|||||||||
|
EPM16942
|
Granted
|
Paradise
|
28-Aug-09
|
27-Aug-14
|
14316.12
|
28-Aug-11
|
$75,000
|
$2,220
|
|||||||||
|
EPM17330
|
Granted
|
Paradise
|
23-Jul-09
|
22-Jul-14
|
3181.36
|
23-Jul-11
|
$180,000
|
$493
|
|||||||||
|
EPM17333
|
Granted
|
D-Tree
|
29-Sep-09
|
28-Sep-14
|
30222.92
|
29-Sep-11
|
$50,000
|
$4,687
|
|||||||||
|
EPM17441
|
Granted
|
Paradise
|
6-Oct-09
|
5-Oct-14
|
14316.12
|
6-Oct-11
|
$120,000
|
$2,220
|
|||||||||
|
EPM17446
|
Granted
|
D-Tree
|
29-Sep-09
|
28-Sep-13
|
5567.38
|
29-Sep-11
|
$50,000
|
$863
|
|||||||||
|
EPM17447
|
Granted
|
Paradise
|
23-Feb-10
|
22-Feb-14
|
7158.06
|
23-Feb-11
|
$80,000
|
$1,110
|
|||||||||
|
ML90190
|
Granted
|
D-Tree
|
12-Aug-10
|
31-Aug-15
|
104.1513
|
12-Aug-11
|
NA-ML
|
$2,009
|
|||||||||
|
Total
|
428,792.4
|
||||||||||||||||
Table A. Granted Tenements for Queensland Projects
* earning 80% interest
|
GST Inclusive
|
||||||||||||||||
|
Lease
|
Lease
Status |
Application
Date |
Grant
Date |
Expiry
Date |
Anniversary
Date |
Acres
|
Rent 2010
|
Commitment
2011 |
||||||||
|
EPM17087
|
Application
|
3-Dec-07
|
8748.74
|
|||||||||||||
|
EPM17437
|
Application
|
3-Mar-08
|
1590.68
|
|||||||||||||
|
EPM17443
|
Application
|
3-Mar-08
|
3181.36
|
|||||||||||||
|
EPM17930
|
Application
|
5567.38
|
||||||||||||||
|
EPM18209
|
Application
|
48515.74
|
||||||||||||||
|
ML90191
|
Application
|
3-Aug-09
|
483.7717
|
|||||||||||||
|
ML90197
|
Application
|
23-Nov-09
|
5619.591
|
|||||||||||||
|
ML90210
|
Application
|
3-Dec-10
|
450.2748
|
|||||||||||||
Table B: Tenements under application for Queensland Projects
|
GST Inclusive
|
||||||||||||||||||
|
Lease
|
Lease
Status |
Project
|
Grant
Date |
Expiry
Date |
Acres
|
Anniversary
Month |
Rent 2010
|
Commitment
2011 |
||||||||||
|
EL22244
|
Granted
|
Foelsche
|
7-Mar-03
|
6-Mar-11
|
44539.04
|
7-Mar-11
|
NA-expires*
|
$40,000
|
||||||||||
|
EL22245
|
Granted
|
Foelsche
|
7-Mar-03
|
6-Mar-11
|
102598.9
|
7-Mar-11
|
NA-expires*
|
$50,000
|
||||||||||
|
EL22297
|
Granted
|
Cox
|
5-Aug-03
|
4-Aug-11
|
29427.58
|
5-Aug-11
|
NA- expires
|
$20,210
|
||||||||||
|
EL23117
|
Granted
|
Abner
|
3-Mar-03
|
2-Mar-11
|
3976.7
|
3-Mar-11
|
NA-renewed
|
$49,700
|
||||||||||
|
EL23118
|
Granted
|
Abner
|
3-Mar-03
|
2-Mar-11
|
25450.88
|
3-Mar-11
|
NA-renewed
|
$47,750
|
||||||||||
|
EL23119
|
Granted
|
Foelsche
|
3-Mar-03
|
2-Mar-11
|
11930.1
|
3-Mar-11
|
NA-expires*
|
$30,000
|
||||||||||
|
EL23121
|
Granted
|
Glyde
|
3-Mar-03
|
2-Mar-11
|
14316.12
|
3-Mar-11
|
NA-renewed
|
$50,000
|
||||||||||
|
EL23510
|
Granted
|
Foelsche
|
3-Mar-03
|
2-Mar-11
|
50733.8
|
3-Mar-11
|
NA-expires*
|
$50,000
|
||||||||||
|
EL23511
|
Granted
|
Glyde
|
3-Mar-03
|
2-Mar-11
|
11134.76
|
3-Mar-11
|
NA-renewed
|
$50,000
|
||||||||||
|
EL23512
|
Granted
|
McArthur
|
3-Mar-03
|
2-Mar-11
|
17497.48
|
3-Mar-11
|
NA- renewed
|
$30,000
|
||||||||||
|
EL23513
|
Granted
|
Abner
|
3-Mar-03
|
2-Mar-11
|
54878.46
|
3-Mar-11
|
NA-expires*
|
$30,000
|
||||||||||
|
EL23514
|
Granted
|
Abner
|
3-Mar-03
|
2-Mar-11
|
7158.06
|
3-Mar-11
|
NA-expires*
|
$30,000
|
||||||||||
|
EL23771
|
Granted
|
Cox
|
19-Aug-03
|
18-Aug-11
|
1590.68
|
19-Aug-11
|
NA- expires
|
$7,500
|
||||||||||
|
EL23772
|
Granted
|
Cox
|
19-Aug-03
|
18-Aug-11
|
1590.68
|
19-Aug-11
|
NA- expires
|
$8,500
|
||||||||||
|
EL23931
|
Granted
|
Abner
|
3-Feb-04
|
2-Feb-12
|
795.34
|
3-Feb-11
|
NA-renewed
|
$16,050
|
||||||||||
|
EL23993
|
Granted
|
Abner
|
6-May-04
|
5-May-12
|
42948.36
|
6-May-11
|
NA-renewed
|
$69,250
|
||||||||||
|
EL24285
|
Granted
|
Abner
|
24-Jan-05
|
23-Jan-11
|
62831.86
|
24-Jan-11
|
NA-expires*
|
Nil
|
||||||||||
|
EL24286
|
Granted
|
Abner
|
24-Jan-05
|
23-Jan-11
|
85896.72
|
24-Jan-11
|
NA-expires*
|
Nil
|
||||||||||
|
EL25491
|
Granted
|
Foelsche
|
12-Mar-07
|
11-Mar-13
|
6362.72
|
12-Mar-11
|
$60,000
|
$704
|
||||||||||
|
EL25616
|
Granted
|
McArthur
|
23-Aug-07
|
22-Aug-13
|
7953.4
|
23-Aug-11
|
$20,000
|
$880
|
||||||||||
|
EL25859
|
Granted
|
Cox
|
20-Sep-07
|
19-Sep-13
|
225876.6
|
20-Sep-11
|
$50,000
|
$24,992
|
||||||||||
|
EL26404
|
Granted
|
Abner
|
23-May-08
|
22-May-14
|
50901.76
|
23-May-11
|
$35,000
|
$2,816
|
||||||||||
|
EL26495
|
Granted
|
Foelsche
|
18-Jul-08
|
17-Jul-14
|
4772.04
|
18-Jul-11
|
$20,000
|
$264
|
||||||||||
|
EL26507
|
Granted
|
McArthur
|
18-Jul-08
|
17-Jul-14
|
17497.48
|
18-Jul-11
|
$15,000
|
$968
|
||||||||||
|
EL26509
|
Granted
|
Foelsche
|
18-Jul-08
|
17-Jul-14
|
6362.72
|
18-Jul-11
|
$10,000
|
$352
|
||||||||||
|
EL26514
|
Granted
|
Cox
|
18-Jul-08
|
17-Jul-14
|
12725.44
|
18-Jul-11
|
$10,000
|
$704
|
||||||||||
|
EL26515
|
Granted
|
Cox
|
18-Jul-08
|
17-Jul-14
|
8748.74
|
18-Jul-11
|
$10,000
|
$484
|
||||||||||
|
EL26528
|
Granted
|
McArthur
|
18-Jul-08
|
17-Jul-14
|
77943.32
|
18-Jul-11
|
$15,000
|
$4,312
|
||||||||||
|
EL27340
|
Granted
|
Abner
|
25-Nov-09
|
24-Nov-15
|
3181.36
|
25-Nov-11
|
$10,000
|
$88
|
||||||||||
|
EL27342
|
Granted
|
Abner
|
25-Nov-09
|
24-Nov-15
|
11930.1
|
25-Nov-11
|
$15,000
|
$330
|
||||||||||
|
EL27770
|
Granted
|
Kiana
|
19-Aug-10
|
18-Aug-16
|
23489.7
|
19-Aug-11
|
$11,000
|
$319
|
||||||||||
|
EL27771
|
Granted
|
Kiana
|
19-Aug-10
|
18-Aug-16
|
51030.2
|
19-Aug-11
|
$17,000
|
$693
|
||||||||||
|
EL27772
|
Granted
|
Kiana
|
19-Aug-10
|
18-Aug-16
|
43748.64
|
19-Aug-11
|
$21,000
|
$594
|
||||||||||
|
SEL26397
|
Granted
|
Abner
|
26-Mar-08
|
25-Mar-12
|
40562.34
|
26-Mar-11
|
$225,000
|
$11,088
|
||||||||||
24
Table C: Granted Tenements for Northern Territory Projects
Note NA-expires* these titles are subject to applications for a Substitute Exploration Licence which retain the area of the individual Exploration Licence for another two (2) years
|
GST Inclusive
|
|||||||||||||||
|
Lease
|
Lease
Status |
Application
Date |
Grant
Date |
Expiry
Date |
Anniversary
Date |
Acres
|
Rent 2010
|
Commitment
2011 |
|||||||
|
EL22299
|
Application
|
9-Dec-99
|
310182.6
|
||||||||||||
|
EL23162
|
Application
|
9-May-01
|
97826.82
|
||||||||||||
|
EL23970
|
Application
|
8-Aug-03
|
63627.2
|
||||||||||||
|
EL24203
|
Application
|
15-Mar-04
|
287117.74
|
||||||||||||
|
EL24732
|
Application
|
23-May-05
|
7158.06
|
||||||||||||
|
EL24762
|
Application
|
8-Jun-05
|
44539.04
|
||||||||||||
|
EL24816
|
Application
|
7-Jul-05
|
15906.8
|
||||||||||||
|
EL24938
|
Application
|
14-Sep-05
|
85101.38
|
||||||||||||
|
EL25486
|
Application
|
18-Jul-06
|
259280.84
|
||||||||||||
|
EL25614
|
Application
|
20-Sep-06
|
248146.08
|
||||||||||||
|
EL25615
|
Application
|
20-Sep-06
|
78738.66
|
||||||||||||
|
EL25629
|
Application
|
25-Sep-06
|
41357.68
|
||||||||||||
|
EL27341
|
Application
|
5-May-09
|
127254.4
|
||||||||||||
|
EL27911
|
Application
|
21-Jan-10
|
795.34
|
||||||||||||
|
EL28254
|
Application
|
30-Aug-10
|
42153.02
|
||||||||||||
|
EL5840
|
Application
|
7-Oct-87
|
322908.04
|
||||||||||||
|
EL5841
|
Application
|
7-Oct-87
|
318931.34
|
||||||||||||
|
EL5842
|
Application
|
7-Oct-87
|
376195.82
|
||||||||||||
|
SEL28206
|
Application
|
5-Aug-10
|
46925.06
|
||||||||||||
Table D: Tenements under application for Northern Territory Projects
Government Regulations, Declarations & Conditions
The Company’s exploration operations are subject to Federal and State laws and regulations governing the method of acquisition and ownership of mining rights, exploration, development, mining, production, taxes, labour standards, occupational health, mine safety, toxic substances and other matters. Federal and State legislation also governs environmental management and native title issues. We are committed to and, to our knowledge, are in compliance with all governmental legislation and regulations.
Government Requirements for Maintenance of Licences
To ensure that licences are kept in good standing the Company is required to pay the annual rent amount for each licence on its respective anniversary date. The amount due is dependent upon the size of the licence. The Company is also required to work the licences and meet the annual expenditure commitments. Annual reporting is required, specifying details of the exploration programme which has occurred and which is anticipated for the following year. Failure to comply would place the licences at risk of cancellation and therefore forfeit the right to explore on that ground.
License Conditions
The Company is required to meet certain standard conditions and obligations as specified by the Queensland Mineral Resources Act, Exploration Permits. These include conducting activities in a way which minimise environmental damage, rehabilitation, avoiding interference with registered native title sites or areas and ensuring compliance with any other relevant legislation. Programmes of Work are to be submitted at the time of application for any ground disturbance or exploration works, the conditions of which are clearly specified and adhered to. Security bonds are payable on the grant of the permits and additional conditions can be imposed by the government State Minister.
25
Native Title
The rights and obligations of the Company with respect to native title obligations differ depending upon the permit’s proposed impact on the land. All the exploration permit applications held by the company will need to comply with the Native Title Act. The overwhelming majority on permit applications will be advertised under the expedited procedure and require advertising to determine whether there are any objections. If there are no objections, the Queensland Government can grant the permit and will impose the Native Title Protection Conditions on the permit before grant. These conditions ensure that any native title claimants are aware of the proposed exploration work and gives them an opportunity to identify any culturally sensitive areas. If there are objections, the company will need to negotiate an agreement with the native title claimants. Following lodgement of this agreement with the Queensland government the permit will be granted.
Environment
The rights and obligations of the Company with respect to environmental management and rehabilitation are based upon the principles of disturbance minimisation, including such things as preservation of mature trees, preventing the spread of noxious weeds, avoiding the disturbance of waterways and waste management. Rehabilitation is a condition of the Security bond and requires such things as sealing of collars, plugging of casings and replacement of topsoils.
Royalties
The royalty rate for phosphate rock is the higher of the following: (a) 80 cents for each tonne of phosphate rock; or (b) the rate, rounded down to 2 decimal places, for each tonne of phosphate rock worked out using the following formula –

where R is the royalty rate, G is the average P2O5 content of the phosphate rock for the return period, and Pcurr is the average price for the return period, converted to Australian dollars at the average hedge settlement rate for the return period, of Moroccan phosphate rock with 32.3% P2O5 content.
The royalty is payable to the State of Queensland.
Contractual Agreements in relation to Queensland Phosphate Interests
|
|
(i)
|
On November 2, 2007, we entered into an agreement with Iron Duyfken Pty Ltd to acquire three (3) project areas in the Georgina Basin of Queensland, Australia. Each project hosts a known and well documented, substantial deposit of phosphate rock (Cook, P.J, 1989, Howard, P.F, 1986). These deposits were delineated by earlier work conducted by previous major companies since 1967 and have been named the Lady Annie, Lady Jane and Thorntonia phosphate deposits. The deposits were defined in times when phosphate prices were low. Phosphate prices have risen considerably since those times due to increased world demand especially from China and India. Past feasibility studies on these deposits will be reassessed with a view to commercialization of the deposits, based on current prices. Legend agreed to pay A$500,000 and issue 500,000 shares of Common Stock as consideration.
|
|
|
(ii)
|
Effective November 7, 2007, we entered into an agreement with Ansett Resources & Industries Pty Ltd to acquire one (1) project area in the Georgina Basin of Queensland, Australia. The project hosts a known and well documented, substantial deposit of phosphate rock (Cook, P.J, 1989, Howard, P.F, 1986). The deposit was delineated by earlier work conducted by previous major companies since 1967 and have been named the D-Tree phosphate deposit. As set out above, the deposit was defined in times when phosphate prices were low. Phosphate prices have risen considerably since those times due to increased world demand especially from China and India. Past feasibility studies on this deposit will be reassessed with a view to commercialization of the deposit, based on current prices. Legend agreed to pay A$300,000 as consideration.
|
26
|
|
(iii)
|
We entered into a farm-in and joint venture heads of agreement with King Eagle Resources Pty Limited on December 7, 2007 pursuant to which Legend can earn an 80% interest in phosphate on three tenement blocks named Quita Creek, Highland Plains and Lily and Sherrin creek by spending $3 million on phosphate exploration over five years. Legend has no rights to any other minerals on the three tenement blocks.
|
|
(iv)
|
Effective February 27, 2008, we entered into a Share Sale Agreement whereby the Company agreed to purchase all of the issued and outstanding shares of Teutonic Minerals Pty Ltd. As a result, Teutonic became a subsidiary of the Company from that date. Teutonic held an application for a mineral licence over phosphate in the Georgina Basin in the State of Queensland, Australia which has subsequently been withdrawn, allowing Legend’s application to take priority. The consideration payable to the vendors was A$300,000, and the Company granted a 1% gross revenue royalty from production from the mineral licence.
|
|
|
(v)
|
On October 27, 2008, we entered into a Heads of agreement with Mt. Isa Metals Ltd. (“MET”) for the formation of a Joint Venture (“JV”) over each party’s respective interest in tenements overlying the D-Tree phosphate deposit. Under the JV, Legend contributed tenements EPM 14753, EPMA’s 17333, 17437, 17443 and 17446, and MET contributed tenement EPM 15763 (D-Tree West). Legend managed and held an 80% interest in the JV and MET held a 20% contributing interest in the JV. The JV has access to plant and infrastructure at Legend’s 100% owned proposed Lady Annie phosphate development, which lies 9 miles to the east of D-Tree. The Heads of Agreement was replaced by a formal JV agreement dated April 18, 2009. Effective September 30, 2009, MET exited the JV. Legend, as manager of the D-Tree JV, had invoiced MET A$1.739 million for MET’s 20% interest in the D-Tree project for the period September 1, 2008 to June 30, 2009. MET decided to dilute its interest rather than pay the invoices and in accordance with the JV agreement, MET’s interest has reduced to less than 5%, thus requiring MET to exit the JV. MET retains a royalty of A$0.50 per tonne from product from the D-Tree Joint Venture tenements.
|
|
(vi)
|
On December 24, 2008, we entered into a Sale and Purchase Agreement with Elkedra Diamonds Pty Ltd and Uramet Minerals Limited to purchase a 100% interest in EPM 15014, EPM 15015 and application for EPM 17930 for a consideration of A$900,000. The purchase by Legend was subject to a number of pre-conditions including the receipt by the vendors of any necessary consents and approvals required under the Mining Act and approval for the purchase under the Foreign Acquisition and Takeovers Act 1975 (Cth). These pre-conditions were satisfied in February 2009 and the purchase by Legend settled. As part of the purchase, all parties provided standard warranties for such a transaction to each other. The tenements covered by this purchase are located immediately north of the Queensland phosphate project and are prospective for phosphate and diamonds.
|
Northern Territory and Western Australian Exploration Interests
Legend’s exploration interests in the Northern Territory and Western Australia are through its 50.40% interest in North Australian Diamonds Limited (“NADL”); NADL’s 25% (increased to 31.06% since December 31, 2009) interest in Top End Uranium Ltd (“TEU”); and its direct holdings in exploration interests in its own right.
27
The exploration interests cover the following minerals:
|
|
(i)
|
Legend exploration interests cover diamonds and base metals;
|
|
|
(ii)
|
NADL exploration interests cover previous diamond mining operations at the Merlin Diamond Mine and diamond exploration on Tenements in the Northern Territory and Western Australia; and
|
|
|
(iii)
|
TEU exploration interests cover uranium exploration in the Northern Territory and Western Australia.
|
The entire exploration interests of Legend are highly prospective for diamonds and uranium. Legend’s exploration team is currently focused on discovering further diamond deposits in the Northern Territory, Australia. Numerous diamond indicator mineral, microdiamond occurrences and other anomalies are being followed up across all projects.
Geological History and Kimberlite Occurrence in the McArthur River Basin
The North Australian Craton is one of two principal tectonic domains in the Northern Territory. The dominant tectonic episode for formation of the Craton, reworking the Archaean (or Palaeo-Proterozoic) basement, was the Barramundi Orogeny at 1865-1850Ma. Outcrops of these older deformed and metamorphosed rocks are now surrounded by younger basins.
The McArthur Group is the principal element of cover over the North Australian Craton, composed of mildly deformed and unmetamorphosed Meso-proterozoic (1800-570Ma) dolomitic carbonate, evaporates and sediments. The McArthur River Basin extends over 180,000 square kilometres and its sediments host a number of base metal occurrences including the McArthur Lead-Zinc-Silver shale-hosted deposit; strata-bound, disseminated Lead-Zinc deposits; the Redbank Copper deposits and Cobalt, Uranium and Iron.
The McArthur River Basin is covered by approximately 100 meters of Cambrian Bukalara sandstone and flood basalts in the south. Widespread, young Cretaceous sedimentation covered the region but much has been removed through erosion. One remnant of Cretaceous sediment is host to the Merlin field which represents the youngest volcanic event in the region.
The major structural feature in the McArthur Basin is the north to north-west trending Batten Trough or Batten Fault Zone approximately 70 kilometres wide, to which Legend’s holdings lie to the east. The Trough is bound on the west by the Emu Fault which transects Legend’s holdings in the McArthur River Project. The associated Mallapunyah and Calvert faults are approximately 50 kilometres apart and also trend north-west.
The presence of microdiamonds across the North Australian Craton defies geological boundaries, extending right across its heart. This wide distribution may be due to recycling of the microdiamonds through the younger Cretaceous by fluvial processes. However, an element of high-level fracture control is now evidenced by the Merlin deposits. Since the discovery of the Merlin field, diamond exploration approaches have shifted from Proterozoic mobile belts with little consideration of regional geology, to incorporate the range of fracture zones in the North Australian Craton. The North Australian Craton is extensively underlain by Archaean basement and deep lithospheric cratonic rocks may be tapped by younger kimberlites as they intrude into these fractures. The Merlin kimberlites are certainly younger than their Cambrian sandstone host, yet older than their Cretaceous cover.
Access
Access to the Northern Territory project areas is by commercial airline to Darwin, the capital of the Northern Territory. From Darwin, it is approximately 950 kilometres by road approximately 2 hours flying time by air. The nearest major town is Borroloola, which has limited accommodation and other facilities, including transport and freight depots. Legend is currently utilizing the Merlin Diamond Mine (operated by Northern Australian Diamonds Ltd), as a base for all exploration. Access to the Merlin Mine from Borroloola is via approximately 70 kilometres of bitumen road to the McArthur River mine turn-off, then approximately 65 kilometres of gravel road to site. Between the months of April to November, in the dry season, four wheel drive vehicles can be used on dirt roads; however, distances from Merlin to field sites range between 10 and 150 kilometres. During wet season, access to field sites can be difficult due high rainfall and fast flowing river and creek crossings.
28
|
Project
|
Access
|
|
McArthur
|
Via the Carpentaria Highway, east from Daly Waters to Cape Crawford, Borroloola and from the south via Wollogorang.
|
|
Glyde
|
|
|
Abner Range
|
|
|
Foelsche
|
|
|
Cox
|
Via the Roper Highway and station roads to Hodgson River, Nutwood Downs and Cox River. Or, via the Carpentaria Highway towards Cape Crawford.
|
Government Regulations, Declarations & Conditions
The Company’s exploration operations are subject to federal and state laws and regulations governing the method of acquisition and ownership of mining rights, exploration, development, mining, production, taxes, labour standards, occupational health, mine safety, toxic substances and other matters. Federal and State legislation also governs environmental management and native title issues. We are committed to and, to our knowledge, are in compliance with all governmental legislation and regulations.
Mineralization
No known mineral reserves are known on our land in the Northern Territory. Our previous and proposed programs are exploratory in nature.
Government Requirements for Maintenance of Licenses
To ensure that licences are kept in good standing the Company is required to pay the annual rent amount for each licence on its respective anniversary date. The amount due is dependent upon the size and age of the licence. The Company is also required to work the licences and meet the annual expenditure commitments. Annual reporting is required, specifying details of the exploration programme which has occurred and which is anticipated for the following year. Failure to comply would place the licences at risk of cancellation and therefore forfeit the right to explore on that ground.
License Conditions
The Company is required to meet certain standard conditions and obligations as specified by the Northern Territory of Australia Mining Act, Exploration Licence. These include conducting activities in a way which minimise environmental damage, rehabilitation, avoiding interference with registered native title sites or areas and ensuring compliance with any other relevant legislation. Mine Management Plans are to be submitted for any ground disturbance or exploration works, the conditions of which are to be clearly specified for approval and adhered to. Security bonds are payable on Mine Management plans and additional conditions can be imposed by the Government State or Territory Minister.
Native Title
The rights and obligations of the Company with respect to native title obligations differ between licences depending upon the underlying ownership of the land. Crown land, namely pastoral lease land, falls under the Native Title Act while Aboriginal freehold land falls under the Aboriginal Land Rights Act (Northern Territory). All the granted licences held by the Company are on pastoral lease land. The Company is currently in negotiations with the local native title council working towards the grant of several more applications that are situated on aboriginal freehold land. Heritage surveys are contracted where necessary to ensure the protection of local registered and unregistered aboriginal heritage sites.
29
Environment
The rights and obligations of the Company with respect to environmental management and rehabilitation are based upon the principles of disturbance minimisation, including such things as preservation of mature trees, preventing the spread of noxious weeds, avoiding the disturbance of waterways and waste management. Rehabilitation is a condition of the Security bond and requires such things as sealing of collars, plugging of casings and replacement of topsoils. Legend takes responsibility to ensure all high impact exploration activities are rehabilitated soon after they are completed. During 2009 Legend conducted rehabilitation on drilling activities from 2008.
Royalties
Certain of the tenements have a 1% gross revenue royalty payable to an external party from all mineral production derived on the tenements.
Acquisition of Northern Territory Tenements
Effective as of March 3, 2006, Legend entered into a Contract for the Sale of Exploration Tenements (“Contract”) with Astro Diamond Mines N.L. (“Astro”) an Australian company pursuant to which the Company acquired certain diamond exploration tenements in Northern Australia from Astro. The consideration payable by Legend to Astro was Australian dollars $1.5 million and Legend was also required to pay to Astro any costs incurred on the tenements after February 1, 2006. Astro provided commercial warranties which are usual for a transaction of this nature in favour of Legend. Under Australian law, Astro was required to provide an independent experts report to shareholders for this transaction. In order to prepare the independent experts report, a mineral valuation was prepared on behalf of Astro which indicated that the preferred value for the tenements that are the subject of the transaction was A$1.5 million. This formed the basis of the consideration agreed by the parties. The President and Chief Executive Officer of the Company, Mr. J. I. Gutnick was Chairman and Managing Director of Astro at the time of entering into the Contract and Dr DS Tyrwhitt, an independent Director of the Company, who is also a Director of Astro and was a Director of Astro at the time of entering into the Contract. The tenements are located in the Northern Territory of Australia and are prospective for diamonds.
Legend has entered into an agreement with Ashton Mining Limited (“Ashton”) and Rio Tinto Exploration Pty Ltd (“Ashton Agreement”) dated December 4, 2009 and a second agreement with Mwana Africa plc, Gravity Diamonds Limited and Diamond Mines Australia Pty Ltd dated April 24, 2009 (“Gravity Agreement”). Under these two agreements, Legend has acquired further diamond interests in the Northern Territory of Australia. As way of background, in April and July 2004, Ashton, NADL and certain of NADL’s 100% owned subsidiaries entered into agreements whereby NADL purchased certain diamond assets (including the Merlin Diamond Mine and diamond exploration tenements) from Ashton and Ashton retained rights over these diamond assets including royalty rights, marketing rights and earn back rights. In addition, Rio Tinto and Gravity had entered into an agreement in July 2003 whereby Gravity acquired certain diamond interests from Rio Tinto in the McArthur Basin, which is in the broad vicinity of Legend and NADL’s diamond interests in the Northern Territory, with Rio Tinto retaining certain residual rights.
Under the Ashton Agreement, Legend purchased all of the Ashton and Rio Tinto’s mining information, rights under three agreements and interests in four (4) exploration licences, six (6) applications for exploration licences, five (5) substitute exploration licences and one (1) mining lease for an amount of A$1,000,000. Rio Tinto retained the royalty payable by NADL in respect of the Merlin Diamond Mine and rights to conduct exploration, development and production activities for non-diamond minerals. Under the Gravity Agreement, Legend purchased Gravity’s interest in twelve (12) exploration licences, nine (9) applications for exploration licences and one (1) substitute exploration licence; Gravity’s rights, interests and obligations under the Red Metal Agreement and all exploration and data bases relevant to historical exploration; and Legend paid Gravity A$400,000 for these assets.
30
In summary, under the Ashton Agreement and Gravity Agreement, Legend has acquired all of Ashton’s, Rio Tinto’s and Gravity’s rights under previous agreement between those parties, not already held by Legend or NADL.
North Australian Diamonds Limited
On May 12, 2009, Legend announced it was making an on market takeover offer for all of the shares in North Australian Diamonds Limited, an Australian corporation (ASX: NAD) that it does not already own.
The offer was an unconditional on market cash offer at $A0.012 per NADL share, which expires on June 27, 2009 unless extended in the sole discretion of Legend.
On June 18, 2009, the Company increased its offer to A$0.015 per NADL share as a final offer. The offer period was also extended to July 24, 2009.
On July 23, 2009, the Company’s voting power in NADL exceeded 50% and in accordance with subsection 624(2) of the Australian Corporation Act 2001 the offer was automatically extended for an additional period of 14 days.
As of August 6, 2009 (close of offer), the Company held 55% of the issued and outstanding shares of NADL for a total cost of A$11.6 million (approx. US$9.3 million). As a result, NADL became a subsidiary of the Company post June 30, 2009. In early December 2009, NADL placed shares to a third party which had the effect of diluting the Company’s interest in NADL to 47.83%. During 2010, Legend has subsequently increased its stake to 50.40%.
Merlin Diamond Project
Highlights
|
|
●
|
Legend International Holdings remains a major shareholder of NADL with 50.40%.
|
|
|
●
|
Flagship Merlin Project remains on track with NADL aiming to be the only Australian owned ‘pure play’ integrated diamond company
|
|
|
●
|
NADL has successfully completed pre-feasibility production trials and has commenced a Pre-feasibility study to validate the scale and commercial viability of a mining project.
|
|
|
●
|
A total of10,600 carats was produced in the 2009/2010 trial production with 24% of production being greater than 1 carat in weight and approximately 80% being high quality, high value gems
|
|
|
●
|
New technologies to increase diamond liberation and large diamond recovery were successfully tested.
|
|
|
●
|
Recent drilling on the PalSac, Launfal and Bedevere pipes has increased the total number of carats in the mineralized material.
|
|
|
●
|
Major exploration focus at Lancelot, 40km south of Merlin, where there is strong evidence for a second diamond field.
|
|
|
●
|
Reconnaissance exploration continuing on highly prospective regions in Arnhem Land and Yambarra.
|
The Merlin Diamond Project is located 100km south of the settlement of Borroloola in the Northern Territory of Australia on the Mining Lease MLN1154 (refer to Figure 1 and 2). The project is accessed by road and also contains a landing strip allowing light aircraft access. Mineral rights are obtained and held for the project under a mining licence with the Northern Territory Government, which is due for renewal in 2022.
31
The project comprises 14 diamond-bearing pipe-like bodies composed of the volcanic rock known as kimberlite. Nine of the pipes were subject to open-pit mining by Ashton Mining Limited over a 5 year period commencing in 1998. These previous mining operations produced 507,000 carats of diamonds.
Site facilities include a 30 man accommodation camp, a 2400m length gravel airstrip, a pilot process plant, workshop facilities, tailings dam and nine open pits. The pilot process plant has been through several stages of upgrade including the addition of a second trommel and the incorporation of a high pressure grinding roll crusher (HPGR). No public infrastructure is in place and power is sourced by a diesel generator. Water for the project is sourced from groundwater bores entirely within the mining licence.
The project is currently in a prefeasibility stage with a view to recommencing commercial scale diamond mining.’ The project does not have any known reserves.
Mineralized Materials
The combined mineralized material for all diamond pipes at Merlin is 14.2Mt for a grade of 27cpht. (See Table M).
Table M: Merlin Total Mineralized Material
|
Mineralized
Material (tonnes) |
Grade (carats per
hundred tonne) |
|
|
PalSac1
|
8,100,000
|
30.4
|
|
Launfal3
|
1,600,000
|
24.7
|
|
Excalibur3
|
464,000
|
34.1
|
|
Gawain2
|
1,100,000
|
40.3
|
|
Ywain2
|
80,000
|
71.3
|
|
Gareth3
|
125,000
|
21.6
|
|
Kaye2
|
874,000
|
13.5
|
|
Ector3
|
1,510,000
|
8.1
|
|
Bedevere
|
366,000
|
21.0
|
|
TOTAL
|
14,219,000
|
27.1
|
|
1Estimated using a +1DTC bottom screen cutoff (approx 0.85mm).
2Estimated using a +1mm slotted bottom screen size.
3Based on previous mining operation recovery.
|
||
Tom Reddicliffe, a full time employee of NADL, and who is a Fellow of the AUSIMM, has sufficient experience which is relevant to the style of mineralisation and type of deposit under consideration and to the activity which he is undertaking to qualify as a Competent Person as defined in the 2004 Edition of the ‘Australian Code of Reporting of Exploration Results, Mineral Resources and Ore Reserves’. Tom Reddicliffe consents to the inclusion in the report of the matters based on his information in the form and context in which it appears.
32
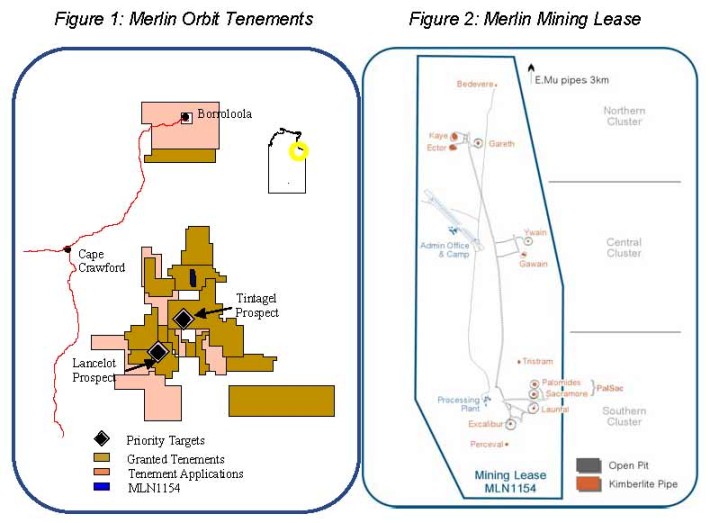
Pre-Feasibility Production Trials
North Australian Diamonds Limited (“North Australian” or “the Company”), successful completed pre-feasibility production trials at its 100% owned Merlin diamond project in the Northern Territory in 2010. The trials which commenced in July, 2009 resulted in the recovery of 10,600cts of diamonds.
The primary objectives of the trials, to build a parcel of diamonds for valuation and marketing purposes, to test new liberation and recovery technologies in the process circuit and to confirm grades were achieved.
|
|
1)
|
Diamond Parcel
|
The trials resulted in the recovery of 10,600 carats with the largest diamond being a 24.12 carat gem quality stone. The +1ct diamonds represent 2,590 carats or 24% of the total production. The diamond parcel is being used to test current market diamond pricing and value adding strategies. The company believes that the good quality and large diamonds produced by Merlin will enable ‘branding’ and boutique marketing opportunities that will be important in redeveloping Merlin and successfully establishing NADL as an integrated long term diamond producer. Preliminary indications are that the parcel will achieve in excess of the US$215 per carat reported in 2008.
|
|
2)
|
Pre-Feasibility Study
|
Project studies based on the results obtained from the production trials has identified a potential commercial mining project. Further studies aimed at confirming the scale and commercial viability of the mining project are being undertaken by Australian Mining Consultants (AMC). This study is expected to be completed early in the forthcoming quarter. The successful outcome of this study will enable the company to embark on a detailed Feasibility Study.
33

Mineralized Material Definition Drilling
A drilling program was completed during 2010 aimed at further defining and increasing the kimberlite mineralized material in the PalSac, Launfal and Bedevere pipes. A total 3320m of core drilling was drilled which increased the total mineralised material at Merlin to 14,219,000 tonnes.
12.05ct gem quality diamond recovered 2009
34
Diamond Exploration
Merlin Orbit Tenements, Northern Territory
The Merlin Orbit tenements comprise an area of some 634,681 acres (refer to table N), and encompass numerous known unresolved occurrences of indicator minerals and diamonds.

Table N: Merlin Orbit Tenements
Lancelot Prospect
The Lancelot Prospect is situated some 40km south of Merlin and comprises an area where there are significant numbers of indicator minerals and diamonds reporting to surface samples. Trench mapping and heavy mineral sampling has led to the identification of indicator mineral bearing eluvial material believed to be derived from the eroding rocks in the southern part of the licence area. The samples have not been processed for diamonds. Further sampling of this eluvial material towards its interpreted source area has been initiated aimed at identifying the source rock. Preliminary results of samples taken to the south of Lancelot have reported indicator minerals and may support the premise that the primary kimberlite source is to the south. Processing of the reconnaissance samples taken in this southern area is continuing.
Yambarra Project, Northern Territory
Rio Tinto Yambarra Farm-in –NADL Earning 100%
NADL has a farm-in agreement with Rio Tinto to earn 100% interest for diamonds in tenements in the Daly River region of the Northern Territory. These tenements have a total project area of 2,230,133 acres.
Kimberley Projects
North Kimberley
Within NADL’s North Kimberley project area, NADL has previously identified six diamondiferous kimberlite pipes, these being contained within the Ashmore, Seppelt 1 and Seppelt 2 discrete pipe clusters. NADL holds these pipes under mining leases, as they continue to retain commercial potential.
35
Top End Uranium Ltd
Uranium Exploration
Top End Uranium is a uranium focused exploration company which controls through farm-in arrangements with NADL, one of the largest portfolios of highly prospective exploration tenements in the Northern Territory, Australia. Its tenement holding covers an area aggregating approximately 8,221,430 acres across three project areas, Arnhem Land Project Area, Yambarra Project Area and the McArthur South Project Area (Figure 7). NADL assigned to Top End the non-diamond mineral rights to its tenements.
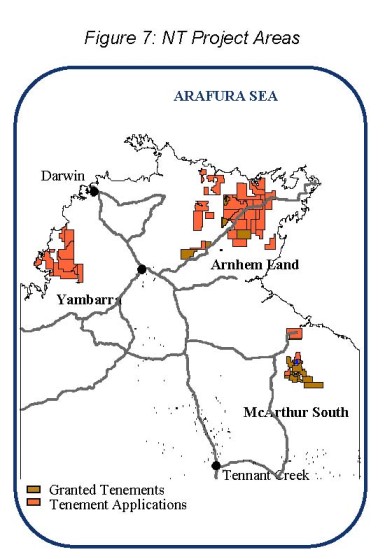
Investment in Northern Capital Resources Corp
Legend holds a 31.46% interest in Northern Capital Resources Corp (“NCRC”), an unlisted US corporation. NCRC is an emerging corporation in the North American and Australian gold and base metal markets. NCRC’s subsidiary Golden River Resources (GORV:OTCBB) announced in March 2009 that it had entered into an agreement whereby it would subscribe for shares in Acadian Mining Corporation (“Acadian”), a Canadian company listed on Toronto Stock Exchange (TSX:ADA) for an aggregate gross investment of up to C$10m. Golden River currently holds approximately 71.5% of Acadian.
Acadian is a Halifax, Nova Scotia, Canada based mining company focused on developing five advanced gold properties, Beaver Dam, Fifteen Mile Stream, Tangier, Forest Hill and Goldenville, which form the core holdings of the Scotia Goldfields Project. All of the five advanced properties host gold mineralized deposits described in technical reports prepared in compliance with Canadian National Instrument 43-101. Acadian is bringing a new approach to the development of Nova Scotia gold deposits by pursuing a multiple mine, central processing, managing and servicing strategy. Acadian operated an open pit zinc-lead mine (Scotia Mine) at Gays River, Nova Scotia from May, 2007 to early 2009 (Scotia Zinc Project) through its 100% wholly owned subsidiary ScoZinc Ltd. The Scotia Mine was put on care and maintenance in early 2009. In February 2011, Acadian announced that it had signed a letter of intent to sell ScoZinc for net proceeds of approximately CDN$6.5 million.
NCRC also holds exploration interests in Australia.
36
We Lack an Operating History And Have Losses Which We Expect To Continue Into the Future.
To date we have had no material source of revenue. We have no operating history as a mineral exploration or mining company upon which an evaluation of our future success or failure can be made. Our ability to achieve and maintain profitability and positive cash flow is dependent upon:
|
|
-
|
exploration and development of any mineral property we identify; and
|
|
|
-
|
our ability to generate revenues and profitably operate a mine on any mineral property we identify.
|
We May Need Further Financing To Determine If There Is Commercial Minerals, Develop Any Minerals We Identify And To Maintain The Mineral Claims.
Our success may depend on our ability to raise further capital. We may require further substantial additional funds to conduct mineral exploration and development activities on all of our tenements. There is no assurance whatsoever that funds will be available from any source or, if available, that they can be obtained on terms acceptable to us to make investments. If funds are not available in the amounts required to achieve our business strategy, we would be unable to reach our objective. This could cause the loss of all or part of your investment.
There are Risks Related to the Construction, Development and Operation of Our Proposed Phosphate Mining and Beneficiation Facilities
The planning, construction and operation of phosphate mining and beneficiation facilities is a complex undertaking that involves various elements including engineering, design, procurement of equipment, transportation, water resources, construction and obtaining financing and permits required related thereto.
We will need to obtain substantial equity and/or debt financing from third parties to fund the construction and development of our proposed phosphate mining and beneficiation facilities. We do not have any definitive agreements or understandings at this time to obtain this financing and there can be no assurance that we will be successful in doing so.
If we are not successful obtaining the necessary permits and approvals or raising the necessary funds, in a timely manner, or at all, in order to plan, construct or operate the mining and benefaction facilities, this would have material adverse affect on our business and financial condition.
World Economic Conditions Could Adversely Affect Our Results of Operations and Financial Condition
The effects of the recent global financial crisis are difficult to accurately predict. As a result of this crisis, conditions in the credit markets have become uncertain and risk adverse. These adverse conditions may make it harder for the Company to raise additional funds to finance the continued development of its business and may reduce the demand for phosphate, which, at least in the short term, could reduce the value of the Company's mineral exploration properties. Continued adverse economic conditions could adversely affect our liquidity, results of operations and financial condition.
We Could Encounter Delays Due To Regulatory And Permitting Delays.
We could face delays in obtaining mining permits and environmental permits. Such delays, could jeopardize financing, if any, in which case we would have to delay or abandon work on the properties.
37
There Are Uncertainties Inherent In The Estimation Of Mineral Reserves.
Reserve estimates, including the economic recovery of ore, will require us to make assumptions about recovery costs and market prices. Reserve estimation is, by its nature, an imprecise and subjective process and the accuracy of such estimates is a function of the quality of available data and of engineering and geological interpretation, judgment and experience. The economic feasibility of properties will be based upon our estimates of the size and grade of ore reserves, metallurgical recoveries, production rates, capital and operating costs, and the future price of diamonds. If such estimates are incorrect or vary substantially it could affect our ability to develop an economical mine and would reduce the value of your investment. Further, it may take many years from the initial phase of drilling before production is possible and, during that time, the economic feasibility of exploiting a discovery may change.
If We Define An Economic Ore Reserve And Achieve Production, It Will Decline In The Future. An Ore Reserve Is A Wasting Asset.
Our future ore reserve and production, if any, will decline as a result of the exhaustion of reserves and possible closure of any mine that might be developed. Eventually, at some unknown time in the future, all of the economically extractable ore will be removed from the properties, and there will be no ore remaining unless this Company is successful in near mine site exploration to extend the life of the mining operation. This is called depletion of reserves. Ultimately, we must acquire or operate other properties in order to continue as an on going business. Our success in continuing to develop reserves, if any, will affect the value of your investment.
There Are Significant Risks Associated With Mining Activities.
The mining business is generally subject to risks and hazards, including quantity of production, quality of the ore, environmental hazards, industrial accidents, the encountering of unusual or unexpected geological formations, cave-ins, flooding, earthquakes and periodic interruptions due to inclement or hazardous weather conditions. These occurrences could result in damage to, or destruction of, our mineral properties or production facilities, personal injury or death, environmental damage, reduced production and delays in mining, asset write-downs, monetary losses and possible legal liability. We could incur significant costs that could adversely affect our results of operation. Insurance fully covering many environmental risks (including potential liability for pollution or other hazards as a result of disposal of waste products occurring from exploration and production) is not generally available to us or to other companies in the industry. What liability insurance we carry may not be adequate to cover any claim.
We May Be Subject To Significant Environmental And Other Governmental Regulations That Can Require Substantial Capital Expenditure, And Can Be Time-Consuming.
We may be required to comply with various laws and regulations pertaining to exploration, development and the discharge of materials into the environment or otherwise relating to the protection of the environment in the countries that we operate, all of which can increase the costs and time required to attain operations. We may have to obtain exploration, development and environmental permits, licenses or approvals that may be required for our operations. There can be no assurance that we will be successful in obtaining, if required, a permit to commence exploration, development and operation, or that such permit can be obtained in a timely basis. If we are unsuccessful in obtaining the required permits it may adversely affect our ability to carry on business and cause you to lose part or all of your investment.
Mining Accidents Or Other Adverse Events At Our Property Could Reduce Our Production Levels.
If and when we reach production it may fall below estimated levels as a result of mining accidents, cave-ins or flooding on the properties. In addition, production may be unexpectedly reduced if, during the course of mining, unfavourable ground conditions or seismic activity are encountered, ore grades are lower than expected, or the physical or metallurgical characteristics of the ore are less amenable to mining or processing than expected. The happening of these types of events would reduce our profitably or could cause us to cease operations which would cause you to lose part or all of your investment.
38
The acquisition of mineral properties is subject to substantial competition. If we must pursue alternative properties, companies with greater financial resources, larger staffs, more experience, and more equipment for exploration and development may be in a better position than us to compete for properties. We may have to undertake greater risks than more established companies in order to compete which could affect the value of your investment.
We May Lose Our Claims If We Do No Maintain A Minimum Level of Work On The Claims
We will be required to carry out a minimum level of work on each claim to maintain of our claims in good standing. If we cannot afford to carry out the work or pay the fees we could lose our interest in claims. The loss of some or all of our mineral claims would adversely affect the value of your investment.
Approximately 49% Of Our Common Stock Is Controlled By Certain Stockholders, Including Our Chairman And Chief Executive Officer, Who Have The Ability To Substantially Influence The Election Of Directors And Other Matters Submitted To Stockholders
Mr Joseph Gutnick, our Chairman and Chief Executive Officer, beneficially owned 75.9 million shares of our common stock, which represented 34% of our shares outstanding as of December 31, 2010. In addition, Mr Gutnick is a party to a stockholders agreement with IFFCO, which beneficially owned 15% of our common stock as of December 31, 2010. Pursuant to the stockholders agreement, Mr Gutnick and IFFCO have agreed to vote their shares together on certain matters, including the election of directors. As a result, they have and are expected to continue to have the ability to significantly influence the election of our Board of Directors and the outcome of all other issues submitted to our stockholders. The interests of these principal stockholders may not always coincide with our interests or the interests of other stockholders, and they may act in a manner that advances their best interests and not necessarily those of other stockholders. One consequence to this substantial influence or control is that it may be difficult for investors to remove management of the Company. It could also deter unsolicited takeover, including transactions in which stockholders might otherwise receive a premium for their shares over then current market prices.
We are substantially dependent upon AXIS Consultants To Carry Out Our Activities
We are substantially dependent upon AXIS for our senior management, financial and accounting, corporate legal and other corporate headquarters functions. For example, each of our officers is employed by AXIS and, as such, is required by AXIS to devote substantial amounts of time to the business and affairs of the other shareholders of AXIS.
Pursuant to a services agreement, AXIS provides us with office facilities, administrative personnel and services, management and geological staff and services. No fixed fee is set in the agreement and we are required to reimburse AXIS for any direct costs incurred by AXIS for us. In addition, we pay a proportion of AXIS indirect costs based on a measure of our utilization of the facilities and activities of AXIS plus a service fee of not more than 15% of the direct and indirect costs. This service agreement may be terminated by us or AXIS on 60 days’ notice. See “Certain Relationships and Related Party Transactions.”
We are one of ten affiliated companies. Each of the companies has some common Directors, officers and shareholders. In addition, each of the companies is substantially dependent upon AXIS for its senior management and certain mining and exploration staff. A number of arrangements and transactions have been entered into from time to time between such companies. Currently, there are no material arrangements or planned transactions between the Company and any of the other affiliated companies other than AXIS. However, it is possible we may enter into such transactions in the future which could present conflicts of interest. In addition, there may be conflicts among the Company and the other companies that AXIS provides services to with respect to access to executive and administrative personnel and other resources.
39
Historically, AXIS has allocated corporate opportunities to each of the companies engaged in the exploration and mining industry after considering the location of each of the companies’ operations and the type of commodity for which each company explores within its geographic region. At present, there are no conflicts among the ten companies with respect to the principal geographic areas in which they operate and/or the principal commodities that they are searching for other than between the Company and NADL (in which the Company owned a 50.40% interest as of December 31, 2010) with respect to the search for diamonds in Northern Australia. AXIS has advised the Company that it plans to allocate diamond exploration opportunities between the Company and NADL based upon the proximity of such opportunities to their respective existing exploration properties.
Our Common Stock Is Traded Over the Counter, Which May Deprive Stockholders Of The Full Value Of Their Shares
Our Common Stock is quoted via the Over The Counter Bulletin Board (OTCBB). As such, our Common Stock may have fewer market makers, lower trading volumes and larger spreads between bid and asked prices than securities listed on an exchange such as the New York Stock Exchange or the NASDAQ Stock Market. These factors may result in higher price volatility and less market liquidity for the Common Stock.
A Low Market Price May Severely Limit The Potential Market For Our Common Stock
Our Common Stock is currently trading at a price substantially below $5.00 per share, subjecting trading in the stock to certain SEC rules requiring additional disclosures by broker-dealers. These rules generally apply to any equity security that has a market price of less than $5.00 per share, subject to certain exceptions (a “penny stock”). Such rules require the delivery, prior to any penny stock transaction, of a disclosure schedule explaining the penny stock market and the risks associated therewith and impose various sales practice requirements on broker-dealers who sell penny stocks to persons other than established customers and institutional or wealthy investors. For these types of transactions, the broker-dealer must make a special suitability determination for the purchaser and have received the purchaser’s written consent to the transaction prior to the sale. The broker-dealer also must disclose the commissions payable to the broker-dealer, current bid and offer quotations for the penny stock and, if the broker-dealer is the sole market maker, the broker-dealer must disclose this fact and the broker-dealer’s presumed control over the market. Such information must be provided to the customer orally or in writing before or with the written confirmation of trade sent to the customer. Monthly statements must be sent disclosing recent price information for the penny stock held in the account and information on the limited market in penny stock. The additional burdens imposed upon broker-dealers by such requirements could discourage broker-dealers from effecting transactions in our Common Stock.
The Market Price Of Your Shares Will Be Volatile.
The stock market price of mineral exploration companies like us has been volatile. Securities markets may experience price and volume volatility. The market price of our stock may experience wide fluctuations that could be unrelated to our financial and operating results. Such volatility or fluctuations could adversely affect your ability to sell your shares and the value you might receive for those shares.
|
Unresolved Staff Comments.
|
As of December 31, 2010, we do not have any Securities and Exchange Commission staff comments that have been unresolved for more than 180 days.
40
|
Properties.
|
Legend has exploration properties as discussed in “Item 1 – Description of Business”. Legend occupies certain executive and office facilities in New York, Melbourne, Victoria and certain regional areas in Australia to support field operations and AXIS also provides office facilities pursuant to the Service Agreement with AXIS. See “Item 1 – Business - Employees” and “Item 12 – Certain Relationships and Related Transactions”. Legend believes that its administrative space is adequate for its current needs.
|
Legal Proceedings.
|
There are no pending legal proceedings to which the Company is a party, or to which any of its property is the subject, which the Company considers material.
41
|
Market for Registrant’s Common Equity, Related Stockholder Matters and Issuer Purchases of Equity Securities.
|
Market Information
Legend's Common Stock is quoted on the NASD Over-the-Counter Bulletin Board ("OTCBB") under the ticker symbol "LGDI" and CUSIP# 52467C 10 0. The Company's Common Stock was initially cleared for trading on the OTC-BB on September 26, 2003.
The following table sets out the high and low bid information for the Common Stock as reported by the National Quotation Service Bureau for each period/quarter indicated in US$:
|
Calendar Period
|
High Bid (1)
|
Low Bid (1)
|
|
2009
|
||
|
First Quarter
|
0.76
|
0.44
|
|
Second Quarter
|
0.77
|
0.53
|
|
Third Quarter
|
1.11
|
0.59
|
|
Fourth Quarter
|
1.49
|
0.73
|
|
2010
|
||
|
First Quarter
|
1.60
|
1.02
|
|
Second Quarter
|
1.26
|
0.80
|
|
Third Quarter
|
1.03
|
0.60
|
|
Fourth Quarter
|
1.11
|
0.68
|
|
(1)
|
The quotations set out herein reflect inter-dealer prices without retail mark-up, mark-down or commission and may not necessarily reflect actual transactions.
|
As of March 15, 2011, there are 226,399,674 shares of Common Stock outstanding.
To date we have not paid dividends on our Common Stock and we do not expect to declare or pay any dividends on our Common Stock in the foreseeable future. Payment of any dividends will depend upon our future earnings, if any, our financial condition, and other factors deemed relevant by the Board of Directors.
Shareholders
As of January 31, 2011, there were approximately 2,074 record holders of the Company's Common Stock. Within the holders of record of the Company's Common Stock are depositories such as Cede & Co., a nominee for The Depository Trust Company (or DTC), that hold shares of stock for brokerage firms which, in turn, hold shares of stock for one or more beneficial owners. Accordingly, the Company believes there are many more beneficial owners of its Common Stock whose shares are held in "street name", not in the name of the individual shareholder.
Options
Effective as of December 12, 2005, the Board of Directors of Company approved the distribution to stockholders for no consideration of an aggregate of 36,135,500 non-transferable options, each of which is exercisable to purchase one share of Common Stock of the Company at an exercise price of US$0.25 (US$0.111, as adjusted) per share with a latest exercise date of December 31, 2012 and otherwise on the terms and conditions set out in Appendix A to the Form 8-K dated December 12, 2005. The options were issued on a pro-rata basis to all stockholders of record on December 31, 2005 on the basis of two (2) options for every one (1) share of Common Stock owned by a stockholder on the record date. The options may not be exercised until the shares underlying the options are registered under federal and state securities laws. On June 26, 2006, the Board of Directors amended the terms and conditions of the options and included a cashless exercise clause for the options in the terms and conditions. On July 21, 2006, Renika exercised 34,778,220 options using the cashless exercise feature and were issued 71,730,079 shares of Common Stock. In December 2006, the Company issued 700,000 shares with attaching options on the basis of one option for every two shares at no exercise price. The options were exercised in December 2006. On December 27, 2006, a further option holder exercised 19,000 options using the cashless exercise feature and were issued 24,750 shares of Common Stock. 3,123,630 of these options remained outstanding as of the date of this Report.
42
On September 19, 2006, the Company issued 8,100,000 options (as adjusted for the Stock Split) pursuant to the 2006 Equity Incentive Plan. Of the total 8,100,000 options issued, 2,700,000 vested on September 19, 2007, 2,700,000 vested on September 19, 2008 and 2,700,000 will vest on September 19, 2009. The exercise price of the options is US$1.00 for the President and Chief Executive Officer and for all other participants, US$0.444 for 50% of the options and US$1.00 for the balance of 50% of the options. The options expire on September 19, 2016.
In November 2006, the Company issued options to purchase 112,500 shares of Common Stock with an exercise price of US$0.111 per share in connection with the settlement of a dispute.
On May 16, 2007, the Company issued 862,500 options pursuant to the 2006 Equity Incentive Plan. Of the total 862,500 options issued, 287,500 vested on May 16, 2008, 287,500 will vest on May 16, 2009 and 287,500 will vest on May 16, 2010. The exercise price of the options is US$0.444 for 50% of the options and US$1.00 for the balance of 50% of the options. The options expire on May 16, 2017.
On December 28, 2007, the Board of Directors of the Company agreed to issue/ratify the issue of 5,387,500 options under the 2006 Incentive Option Plan to officers, employees and consultants as follows:
|
(i)
|
300,000 options of which 1/3 vested on September 10, 2008, 1/3 will vest on September 10, 2009 and the balance will vest on September 10, 2010 and 50% of the options have an exercise price of US$0.444 per option and 50% have an exercise price of US$1.00 per option;
|
|
(ii)
|
300,000 options of which 1/3 vested on December 19, 2008, 1/3 will vest on December 19, 2009 and the balance will vest on December 19, 2010 and 50% of the options have an exercise price of US$0.444 per option and 50% have an exercise price of US$1.00 per option; and
|
|
(iii)
|
4,787,500 options of which 1/3 vested on December 28, 2008, 1/3 will vest on December 28, 2009 and the balance will vest on December 28, 2010 and have an exercise price of US$1.00 per option.
|
On February 7, 2008 the Board of Directors of the Company agreed to issue 5,000,000 options to officers, employees and consultants under the 2006 Incentive Option Plan of which 1/3 vested on February 7, 2009, 1/3 will vest on February 7, 2010 and the balance on February 7, 2011 and have an exercise price of US$2.00 per option.
On February 18, 2008 the Board of Directors of the Company agreed to issue 400,000 options to officers, employees and consultants under the 2006 Incentive Option Plan of which 1/3 vested on February 18, 2009, 1/3 will vest on February 18, 2010 and the balance on February 18, 2011 and have an exercise price of US$1.00 per option.
On May 29, 2008 the Board of Directors of the Company agreed to issue 362,500 options to officers, employees and consultants under the 2006 Incentive Option Plan of which 1/3 will vest on May 29, 2009, 1/3 will vest on May 29, 2010 and the balance on May 29, 2011 and have an exercise price of US$1.00 per option.
On July 11, 2008, the Company issued Dr. D.S. Tyrwhitt 1,000,000 options under the 2006 Incentive Option Plan with an exercise price of US$3.48, a latest exercise date of July 11, 2018, no issue price and to vest 1/3 in 12 months, 1/3 in 24 months and 1/3 in 36 months.
43
An external consultant has calculated the fair value of the options using the Binomial valuation method using a share price of US$3.26, strike price as set out above, maturity period of 5.5 to 6.5 years depending on the vesting date, risk free interest rate of 3.960% and volatility of 60%. This equates to values ranging from US$1.81 to US$1.95 per option depending on the exercise price and vesting date. The total value of the options equates to A$1,959,558.
On July 14, 2008, the Company issued options to the Indian Farmers Fertilizer Cooperative Limited, pursuant to a Share Options Agreement, to purchase 30,000,000 shares of Common Stock on the following terms:
|
a.
|
5,000,000 options, at an exercise price of $2.50 per share and expiring 60 days from July 11, 2008;
|
|
b.
|
8,000,000 options, at an exercise price of $3.00 per share and expiring 12 months from July 11, 2008;
|
|
c.
|
8,000,000 options, at an exercise price of $3.50 per share and expiring 18 months from July 11, 2008;
|
|
d.
|
9,000,000 options, at an exercise price of $4.00 per share and expiring 24 months from July 11, 2008.
|
On August 11, 2008, the Board of Directors of the Company agreed to issue/ratify the issue of 462,500 options under the 2006 Incentive Option Plan to officers, employees and consultants as follows:
|
(i)
|
200,000 options which will vest 1/3 on July 7, 2009, 1/3 on July 7, 2010 and the balance on July 7, 2011 and have an exercise price of US$2.00 per option.
|
|
(ii)
|
150,000 options which will vest 1/3 on July 21, 2009, 1/3 on July 21, 2010 and the balance on July 21, 2011 and have an exercise price of US$2.00 per option.
|
|
(iii)
|
112,500 options which will vest 1/3 on August 8, 2009, 1/3 on August 8, 2010 and the balance on August 8, 2011 and have an exercise price of US$1.00 per option.
|
On August 11, 2008 the Company issued two non executive directors 700,000 options under the 2006 Incentive Option Plan with an exercise price of US$2.00, a latest exercise date of August 11, 2018, no issue price and to vest 1/3 in 12 months, 1/3 in 24 months and 1/3 in 36 months.
On December 4, 2008, the Board of Directors of the Company agreed to issue/ratify the issue of 3,275,000 options under the 2006 Incentive Option Plan to officers, employees and consultants as follows:
|
(i)
|
962,500 options which will vest 1/3 on December 4, 2009, 1/3 on December 4, 2010 and the balance on December 4, 2011 and have an exercise price of US$1.00 per option.
|
|
(ii)
|
1,050,000 options which will vest 1/3 on December 4, 2009, 1/3 on December 4 10, 2010 and the balance on December 4, 2011 and have an exercise price of US$1.00 per option.
|
|
(iii)
|
562,500 options which will vest 1/3 on December 4, 2009, 1/3 on December 4 10, 2010 and the balance on December 4, 2011 and have an exercise price of US$1.00 per option.
|
|
(iv)
|
500,000 options which will vest 1/3 on December 4, 2009, 1/3 on December 4 10, 2010 and the balance on December 4, 2011 and have an exercise price of US$1.00 per option. For additional information concerning stock options, see Note 7 to the Company’s Financial Statements.
|
On January 4, 2009, the Company issued 200,000 options under the 2006 Incentive Option Plan with an exercise price of US$1.00, a latest exercise date of January 4, 2019, no issue price and to vest 1/3 in 12 months, 1/3 in 24 months and 1/3 in 36 months.
44
On February 2, 2009, the Company issued 600,000 options under the 2006 Incentive Option Plan with an exercise price of US$1.00, a latest exercise date of February 2, 2019, no issue price and to vest 1/3 in 12 months, 1/3 in 24 months and 1/3 in 36 months.
On February 9, 2009, the Company issued 200,000 options under the 2006 Incentive Option Plan with an exercise price of US$1.00, a latest exercise date of February 9, 2019, no issue price and to vest 1/3 in 12 months, 1/3 in 24 months and 1/3 in 36 months.
On February 25, 2009, the Company issued 250,000 options under the 2006 Incentive Option Plan with an exercise price of US$1.00, a latest exercise date of February 25, 2019, no issue price and to vest 1/3 in 12 months, 1/3 in 24 months and 1/3 in 36 months.
On March 23, 2009, the Company issued 300,000 options under the 2006 Incentive Option Plan with an exercise price of US$1.00, a latest exercise date of March 23, 2019, no issue price and to vest 1/3 in 12 months, 1/3 in 24 months and 1/3 in 36 months.
On April 1, 2009, the Company issued 150,000 options under the 2006 Incentive Option Plan with an exercise price of US$1.00, a latest exercise date of April 1, 2019, no issue price and to vest 1/3 in 12 months, 1/3 in 24 months and 1/3 in 36 months.
On April 13, 2009, the Company issued 100,000 options under the 2006 Incentive Option Plan with an exercise price of US$1.00, a latest exercise date of April 13, 2019, no issue price and to vest 1/3 in 12 months, 1/3 in 24 months and 1/3 in 36 months.
On June 25, 2009, the Company issued 100,000 options under the 2006 Incentive Option Plan with an exercise price of US$1.00, a latest exercise date of June 25, 2019, no issue price and to vest 1/3 in 12 months, 1/3 in 24 months and 1/3 in 36 months.
On September 1, 2010, the Company issued 1,000,000 options with an exercise price of US$1.00 and expiring on September 1, 2014, for consulting fees amounting to A$247,163 (US$220,000).
On December 13, 2010, the Company issued 500,000 stock options under the 2006 Incentive Option Plan with an exercise price of US$1.00, a latest exercise date of November 20, 2020, and to vest 1/3 on December 13, 2010, 1/3 on November 20, 2011 and the balance 1/3 on November 20, 2012. The weighted-average grant-date fair value of options granted was US$0.46.
Dividend Policy
The Company has not previously paid any cash dividends on Common Stock and does not anticipate or contemplate paying dividends on Common Stock in the foreseeable future. It is the present intention of management to utilize all available funds for the development of the Company's business. The only restrictions that limit the ability to pay dividends on common equity or that are likely to do so in the future, are those restrictions imposed by law. Under Delaware corporate law, no dividends or other distributions may be made which would render the Company insolvent or reduce assets to less than the sum of its liabilities plus the amount needed to satisfy any outstanding liquidation preferences.
Effective November 17, 2006, the Company’s Board of Directors declared a 1-for-2 share bonus issue in the form of a dividend that was payable in December 2006 to stockholders of record as of November 17, 2006. An aggregate of 27,599,722 shares of Common Stock were issued in connection with this dividend.
In November 2006, the Company’s Board of Directors declared a second 1-for-2 share bonus issue in the form of a dividend that was payable in January 2007 to stockholders of record as of December 31, 2006. An aggregate of 41,934,337 shares of Common Stock were issued in connection with this dividend.
45
Transfer Agent
The transfer agent and registrar for the Company's Common Stock is Continental Stock Transfer & Trust Company of 17 Battery Place, 8th Floor, New York, NY 10004.
Recent Sales of Unregistered Securities
We have issued no unregistered securities within the period covered by this report which have not been previously reported on Form 10-Q or Form 8-K.
Performance Graph
The following graph compares the cumulative 5-year total return attained by shareholders on Legend International Holdings, Inc.'s common stock relative to the cumulative total returns of the NASDAQ Composite index, and a customized peer group of six companies that includes: Agrium Inc, CF Industries Holdings Inc, Minemakers Limited, Phoscan Chemical Corp., Potash Corp. Of Saskatchewan and The Mosaic Company. The graph tracks the performance of a $100 investment in our common stock, in the peer group, and the index (with the reinvestment of all dividends) from December 31, 2005 to December 31, 2010.
| 12/05 | 12/06 | 12/07 | 12/08 | 12/09 | 12/10 | |||||||||||||||||||
|
Legend International Holdings, Inc.
|
100.00 | 101.79 | 100.45 | 47.41 | 115.71 | 81.96 | ||||||||||||||||||
|
NASDAQ Composite
|
100.00 | 111.16 | 124.64 | 73.80 | 107.07 | 125.99 | ||||||||||||||||||
|
Peer Group
|
100.00 | 163.09 | 557.58 | 248.47 | 408.92 | 568.16 |
The stock price performance included in this graph is not necessarily indicative of future stock price performance.
46
|
Selected Financial Data.
|
Our selected financial data presented below for each of the years in the five-year period ended December 31, 2010, and the balance sheet data at December 31, 2006, 2007, 2008, 2009 and 2010 has been derived from financial statements, which have been audited by PKF LLP (formerly PKF, Certified Public Accountants, a Professional Corporation), New York, NY. The selected financial data should be read in conjunction with our financial statements for each of the years in the period ended December 31, 2010 and Notes thereto, which are included elsewhere in this Annual Report.
Statement of Operations Data
| Year ended December 31 |
||||||||||||||||||||||||
|
2006
|
2007
|
2008
|
2009
|
2010
|
2010
Conv.
Transl
|
|||||||||||||||||||
| A$000s | A$000s | A$000s | A$000s | A000s |
US$000s
|
|||||||||||||||||||
|
Revenues
|
- | - | - | - | - | - | ||||||||||||||||||
|
Other income (loss)
|
2 | 22 | 3,726 | 3,823 | 2,938 | 2,986 | ||||||||||||||||||
|
Costs and expenses
|
(4,537 | ) | (8,540 | ) | (23,408 | ) | (40,629 | ) | (40,777 | ) | (41,442 | ) | ||||||||||||
|
Loss from operations
|
(4,535 | ) | (8,518 | ) | (19,682 | ) | (36,806 | ) | (37,839 | ) | (38,456 | ) | ||||||||||||
|
Other non-operational gains and costs
|
(40 | ) | (120 | ) | 5,461 | (2,347 | ) | (852 | ) | (867 | ) | |||||||||||||
|
Provision for income taxes
|
- | - | - | - | - | - | ||||||||||||||||||
|
Equity in losses of unconsolidated entities
|
- | - | - | (346 | ) | (1,441 | ) | (1,464 | ) | |||||||||||||||
|
Net profit (loss)
|
(4,575 | ) | (8,638 | ) | (14,221 | ) | (39,499 | ) | (40,132 | ) | (40,787 | ) | ||||||||||||
|
Net (loss) attributable to non-controlling interests
|
- | - | - | 1,613 | 3,803 | 3,865 | ||||||||||||||||||
|
Net (loss) attributable to Legend stockholders
|
(4,575 | ) | (8,638 | ) | (14,221 | ) | (37,886 | ) | (36,329 | ) | (36,922 | ) | ||||||||||||
| A$ | A$ | A$ | A$ | A$ |
$US
|
|||||||||||||||||||
|
Basic net (loss) per share (1)
|
(0.06 | ) | (0.06 | ) | (0.07 | ) | (0.17 | ) | (0.16 | ) | (0.16 | ) | ||||||||||||
|
Weighted average number
of shares outstanding (000s)(1)
|
75,230 | 146,740 | 204,501 | 226,328 | 226,380 | 226,380 | ||||||||||||||||||
|
Balance Sheet Data
|
||||||||||||||||||||||||
| A$000s | A$000s | A$000s | A$000s | A$000s |
US$000s
|
|||||||||||||||||||
|
Total assets
|
1,149 | 17,994 | 130,076 | 120,433 | 80,241 | 81,549 | ||||||||||||||||||
|
Total liabilities
|
(1,881 | ) | (1,035 | ) | (3,317 | ) | (5,534 | ) | (6,604 | ) | (6,712 | ) | ||||||||||||
|
Total equity
|
(732 | ) | 16,959 | 126,759 | 114,899 | 73,637 | 74,837 | |||||||||||||||||
| (1) Effective November 17, 2006, Legend issued one (1) new bonus share of Common Stock for every two (2) shares of Common Stock outstanding on the record at that date. The issue of the new bonus shares of Common Stock were on a pro-rate basis to all shareholders. As a result, the Company issued 27,599,722 shares of its Common Stock. Effective December 31, 2006, Legend issued one (1) new bonus share of Common Stock for every two (2) shares of Common Stock outstanding on the record at that date. The issue of the new bonus shares of Common Stock were on a pro-rata basis to all shareholders. As a result, the Company issued 41,934,337 shares of its Common Stock. | |
47
Effective December 31, 2006, Legend issued one (1) new bonus share of Common Stock for every two (2) shares of Common Stock outstanding on the record at that date. The issue of the new bonus shares of Common Stock were on a pro-rata basis to all shareholders. As a result, the Company issued 41,934,337 shares of its Common Stock.
The Company has accounted for these bonus issues as a stock split and accordingly, all share and per share data has been retroactively restated.
|
Management’s Discussion and Analysis of Financial Condition and Results of Operation.
|
General
The following discussion and analysis of our financial condition and plan of operation should be read in conjunction with the Financial Statements and accompanying notes and the other financial information appearing elsewhere in this report. This report contains numerous forward-looking statements relating to our business. Such forward-looking statements are identified by the use of words such as believes, intends, expects, hopes, may, should, plan, projected, contemplates, anticipates or similar words. Actual operating schedules, results of operations, ore grades and mineral deposit estimates and other projections and estimates could differ materially from those projected in the forward-looking statements.
Legend has been an exploration stage company since August 2006. During February 2011, the Company announced its maiden mineral reserve for its 100% owned Paradise South phosphate project in accordance with SEC Industry Guide 7. As a result of establishing mineral reserve estimates, Legend will be entering into the development stage for this project as it engages in the process of preparing the mineral deposit for extraction, while it continues with its other various exploration activities.
Legend also has exploration interests in the Northern Territory and Western Australia through its 50.40% interest in North Australian Diamonds Limited (“NADL”) and has direct holdings in exploration interests in its own right. NADL’s exploration interests cover previous diamond mining operations at the Merlin Diamond Mine and Legend’s exploration interests are highly prospective for diamonds and uranium.
Foreign Currency Translation
The majority of our administrative operations are in Australia and, as a result, our accounts are reported in Australian dollars. Foreign income and expenses are translated into Australian dollars at the average exchange rate prevailing during the period. Assets and liabilities of the foreign operations are translated into Australian dollars at the period-end exchange rate. The following table shows the period-end rates of exchange of the Australian and US dollar compared with the US dollar during the periods indicated. During the year, the Company had significant US$ cash balances which when converted to Australian dollars results in a large foreign exchange loss.
|
|
Year ended
|
|||
|
|
December 31
|
|||
|
2009
|
A$1.00
|
=
|
US$0.8931
|
|
|
2010
|
A$1.00
|
=
|
US$1.0163
|
|
The exchange rate between the A$ and US$ has moved by 13.8% between December 31, 2009 and 2010. Accordingly, a direct comparison of costs between fiscal 2009 and 2010 may not necessarily be a true comparison.
Plan of Operation
We had A$25,165,910 in cash at December 31, 2010.
48
We commenced exploration activities on the tenements we acquired in July 2006 and since that time and up to December 31, 2010, have spent A$69,037,290 on exploration and pre-development activities. We plan to continue our exploration and pre-development program throughout 2011 and anticipate spending A$7.4 million on exploration and pre-development and A$10.7 million on administrative costs. Our planned exploration and development expenditures throughout 2011 are expected to be significantly less than in prior years as the field exploration including drilling and assaying on Paradise South is complete given the announcement of the reserve estimate in February 2011.
As set out in Item 1 “Employees” the services of our Chief Executive Officer, Chief Financial Officer, Executive General Manager, geologists, finance and clerical employees are provided by AXIS. At the current time, we have no plans to change these arrangements or employ any further persons.
Results of Operations
Year ended December 31, 2010 versus Year ended December 31, 2009
As a result of the acquisition of NADL, commencing September quarter 2009, there is a lack of comparability between the Company’s results for the year ended December 31, 2010.
As an exploration company, we have not had an ongoing source of revenue. Our revenue stream is normally from ad-hoc tenement disposals, interest received on cash in bank and Australian Taxation Office refunds. During the year ended December 31, 2010, we received A$2,081,829 (US$2,115,763) in interest on funds in the bank (2009: A$3,338,315), interest income from a related entity of A$174,011 (US$176,847) (2009 A$81,503) and other income of A$682,048 (US$693,165) (2009: A$403,266). Included in other income is an amount for NADL A$681,108 (US$692,210) being a refund from the government for research and development and diesel fuel (2009: A$359,587).
Costs and expenses increased during the year from A$40,629,310 for the year ended December 31, 2009 to A$40,777,372 (US$41,442,043) for the year ended December 31, 2010.
The main components of costs and expenses are as follows:-
|
(i)
|
an increase in exploration expenditure written off from A$25,608,743 in 2009 to A$25,705,125 (US$26,124,119) in 2010. Our accounting policy is to expense all exploration costs (including costs associated with the acquisition of tenement interests) as incurred. The exploration costs include drilling, geological, geophysical and mineral analysis contractors, salaries for contract field staff, travel costs, accommodation and tenement costs. In the current year in relation to our diamond activities, drilling and trial testing continued from January 2010 at Merlin and surrounding areas and included within exploration expenditure is A$7,935,740 (2009: A$7,181,714). On our phosphate activities, we continued to advance the current feasibility test work but this only included limited drilling and work continued on investigations into a mining operation. During 2009, we continued our drilling programs on the phosphate project in Queensland took place for the entire year as well as continuing the sampling program throughout the year in the Northern Territory. The costs included drilling, assaying, camp costs, aerial surveying, geological/geophysical contractors, salaries and associated costs for contract field staff, travel, accommodation, meals and tenement holding costs.
|
|
(ii)
|
a decrease in interest expense from A$64,831 in 2009 to A$61,326 (US$62,325) in 2010. During 2010 and 2009, we incurred interest on the motor vehicle finance leases.
|
|
(iii)
|
a decrease in aircraft maintenance costs from A$1,014,986 in 2009 to A$587,163 (US$596,734) in 2010. The Company purchased an aircraft in August 2008 to utilize in its field operations and has incurred operating costs for the aircraft since that time. In 2009, the aircraft underwent a scheduled maintenance program and there is no such requirement for a maintenance program in 2010.
|
49
|
(iv)
|
an increase in legal, professional and accounting from A$880,851 for 2009 to A$898,437 (US$913,082) for 2010. During 2010, we incurred legal expenses of A$334,393 (US$339,844) for general legal work including tenement acquisition and sale and A$196,308 (US$199,508) paid to independent experts and other consultants for business development; audit fees of A$281,385 (US$285,972) for professional services in relation to financial statements, the quarterly Form 10-Qs, Form 10-K and Form 10-K/A and quarterly, half year and annual reporting in Australia for NADL; and taxation fees of A$86,351 (US$87,758) relating to both the Company and its subsidiaries. During 2009, we incurred legal expenses of A$407,549 for general legal work including stock transfer matters, regulatory filings, stock option plans, native title and environmental approvals, asset acquisitions, and Form S-1 Registration Statements in both the US and Australia; audit fees of A$384,747 for professional services in relation to financial statements, the quarterly Form 10-Qs, Form 10-K, Form 10-K/A and Form S-1 and quarterly, half year and annual reporting in Australia for NADL; and taxation fees of A$69,875 relating to both the Company and its subsidiaries. Included within legal, accounting and professional expense for the year ended December 31, 2009 are the following amounts for NADL A$66,854 being a fee paid to tax consultants for the preparation of the research and development claim, legal fees of A$16,737, professional fees paid to attorney’s independent experts and other consultants for takeover defense costs of A$27,771.
|
|
(v)
|
an increase in amortization of mineral rights from A$582,710 in 2009 to A$1,398,502 (US$1,421,297) in 2010. On the acquisition date of the business combination of NADL, the Company recognized mineral rights of A$18,873,000. The underlying mineral property licences have a set term and mineral rights are being amortized over the term of the licences. The acquisition occurred during 2009.
|
|
(vi)
|
an increase in administrative costs from A$8,217,286 in 2009 to A$10,398,897 (US$10,568,399) in 2010. During 2010, the corporate management and service fees charged to us by AXIS was A$1,360,504 (US$1,382,680). AXIS charged us A$3,832,026 (US$3,894,488) for Directors’ fees, salaries and salary related matters incurred in behalf of the Company, which relates to our share of salaries paid to the President & Chief Executive Officer, Chief Financial Officer and Secretary, Executive General Manager, General Manager Business, Project Manager and other staff of AXIS who provide services to the Company, and A$258,000 (US$262,205) for independent directors’ fees. The Company paid insurance costs of A$287,953 (US$292,645), for 2010. The Company incurred A$1,193,904 (US$1,213,365) for travel by Directors and officers, contractors, and other AXIS staff who provide services to the Company on capital raising trips, trips to the field; A$1,170,405 (US$1,189,483) for investor relations consultants; A$42,145 (US$42,832) in borrowing costs and bank fees; A$25,406 (US$25,820) for motor vehicles costs; A$409,457 (US$416,131) for public relations; A$106,149 (US$107,879) for stock transfer agent services; A$112,803 (US$114,642) for office and computing consumables; A$161,452 (US$164,083) for staff support costs; A$723,774 (US$735,571) for rent of offices in Melbourne, Mt Isa, Perth and New York and an apartment in Melbourne; A$153,503 (US$156,005) for subscription to industry papers and services; A$74,953 (US$76,178) for telecommunications support; A$205,738 (US$209,091) for depreciation of non-field assets and minor equipment purchases; A$25,012 (US$25,419) for Delaware franchise tax; A$133,036 (US$135,205) in donations to local community groups; general costs of A$122,677 (US$124,676). During 2009, the corporate management and service fees charged to us by AXIS was A$4,433,074. AXIS charged us A$2,968,765 for Directors’ fees, salaries and salary related matters incurred in behalf of the Company, which relates to our share of salaries paid to the President & Chief Executive Officer, Chief Financial Officer and Secretary, Executive General Manager, General Manager Business, Project Manager and other staff of AXIS who provide services to the Company, and A$208,578 for independent directors’ fees. The Company paid insurance costs of A$536,364, including the Federal Government of Australia insurance policy on cash at bank in Australia in excess of A$1,000,000, for 2009. The Company incurred A$1,062,977 for travel by Directors and officers, contractors, and other AXIS staff who provide services to the Company on capital raising trips, trips to the field; A$467,204 for investor relations consultants; A$62,385 for work on the ASX listing; A$9,291 in borrowing costs and bank fees; A$102,572 for motor vehicles costs; A$51,149 for public relations; A$46,111 for stock transfer agent services; A$206,344 for office and computing consumables;A$118,875 for staff support costs; A$555,260 for rent of offices in Melbourne, Mt Isa, Perth and New York and an apartment; A$39,138 for subscription to industry papers and services; A$43,361 for telecommunications support; A$66,715 for depreciation of non-field assets and minor equipment purchases; A$60,095 for Delaware franchise tax; A$86,800 in donations to local community groups; general costs of A$279,036. AXIS charge an administration and service fee of A$1,264,759.
|
50
|
(vii)
|
Stock based compensation has decreased from A$4,259,903 for 2009 to A$1,727,922 (US$1,756,087) for 2010. The Company has issued options under the 2006 Incentive Option Plan in throughout 2006, 2007, 2008, 2009 and 2010. The decrease is the result of options being fully vested in prior periods and an adjustment for forfeited options. See note 7 for further details on the options issued.
|
Accordingly, the loss from operations increased from A$36,806,226 for the year ended December 31, 2009 to A$37,839,484 (US$38,456,268) for the year ended December 31, 2010. During 2010, the Company has written off obsolete assets, and wrote down the carrying value of the Lear jet, of A$244,924 (US$248,916). There were no comparable amounts in 2009.
A decrease in foreign currency exchange gain from a loss of A$4,661,096 for the year ended December 31, 2009 to a foreign currency exchange loss of A$674,496 (US$685,490) in the year ended December 31, 2010 was recorded as a result of the movement in the Australian dollar versus the US dollar. The on market takeover of NADL finished on August 6, 2009 and since that time, the Company has consolidated the results of NADL. In accordance with US GAAP, the Company calculated the difference between the fair value of assets acquire at August 6, 2009 and the carrying value of its investment in an unconsolidated entity (NADL) at August 6, 2009. For 2009, the Company recorded an adjustment to fair value on stepped acquisition of A$2,200,620. There was no comparable adjustment for 2010. A net gain of A$66,891 (US$67,981) on sale of certain trading securities was incurred in the year ended December 31, 2010 (2009: A$113,739), being the difference between the cost price, sale price and market value.
The loss before income taxes and equity in losses of unconsolidated entity was A$39,152,963 for the year ended December 31, 2009 compared to A$38,692,013 (US$38,322,693) for the year ended December 31, 2010.
During the year ended December 31, 2010, the Company’s share of the losses of the unconsolidated entities amounted to A$1,440,407 (US$1,463,885) (2009: A$345,707). At balance date, the Company holds a 31.46% interest in NCRC and the Company through its investment in NADL holds a 31.06% interest in Top End Uranium Ltd. The Company accounts for both of these investments using the equity method of accounting. The Company held 21.29% and NADL held 25% in Top End Uranium at December 31, 2009.
The net loss was A$39,498,670 for the year ended December 31, 2009 compared to a net loss of A$40,132,420 (US$40,786,578) for the year ended December 31, 2010.
The share of the net loss attributable to the non-controlling interests of NADL amounted to A$3,803,366 (US$3,865,361) for the year ended December 31, 2010 compared to A$1,612,599 for the year ended December 31, 2009.
On May 12, 2009, the Company made an on-market takeover offer for all of the shares in North Australian Diamonds Limited (“NADL”). The Company held 34.61% of the issued and outstanding shares at May 31, 2009 and as a result, accounted for its interest in NADL as an unconsolidated entity until August 6, 2009. The takeover offer concluded on August 6, 2009. At the close of the offer, the Company held 55% of the issued and outstanding shares of NADL and as a result, commenced consolidating the results of NADL from that date. In early December 2009, NADL placed shares to a third party which had the effect of diluting the Company’s interest in NADL to 47.83%. Under Australian takeover laws, the Company was prevented from purchasing further shares in NADL for a period of 6 months from the conclusion of the takeover (August 6, 2009). Accordingly, it was not until February 6, 2010 that the Company was entitled to purchase any further shares in NADL under Australian Corporations Law. Since February 6, 2010, the Company has purchased further shares in NADL and its current interest is 50.40%. It is the Company’s intentions to continue to acquire shares and to maintain a controlling financial interest. Furthermore, management believes it has the ability to control the operations of NADL through its share ownership as well as having six of the Directors of NADL. During 2010, the Company purchased a further 87,168,065 shares in NADL at a cost of A$4,032,694 and a decrease in non-controlling interest of A$308,013.
51
The net loss attributable to Legend stockholders amounted to A$36,329,054 (US$36,921,217) for the year ended December 31, 2010 compared to A$37,886,071 for the year ended December 31, 2009.
Year ended December 31, 2009 versus Year ended December 31, 2008
As an exploration stage company, we do not have an ongoing source of revenue. Our revenue stream is normally from ad-hoc tenement disposals and interest received on cash in bank. During the year ended December 31, 2009, we received A$3,338,315 in interest on funds in the bank (2008: A$3,669,440), interest income from a related entity of A$81,503 (2008 A$49,931) and other income of A$403,266 (2008: A$6,534). Included in other income is an amount for NADL A$359,587 being a refund from the government for research and development and diesel fuel; for which there are no comparable amounts for the year ended December 31, 2008.
Costs and expenses increased during the year from A$23,408,089 for the year ended December 31, 2008 to A$40,629,310 for the year ended December 31, 2009.
The main components of costs and expenses are as follows:
|
(i)
|
an increase in exploration expenditure written off from A$8,780,037 in 2008 to A$25,608,743 in 2009. Our accounting policy is to expense all exploration costs (including costs associated with the acquisition of tenement interests) as incurred. During 2009, we continued our drilling programs on the phosphate project in Queensland for the entire year as well as continuing the sampling program throughout the year in the Northern Territory. The costs included drilling, assaying, camp costs, aerial surveying, geological/geophysical contractors, salaries and associated costs for contract field staff, travel, accommodation, meals and tenement holding costs. During 2008, we commenced a significant drilling program at our phosphate project in Queensland in September 2008 and a detailed sampling program in the Northern Territory. On our Queensland phosphate project, we also commenced early stage investigations into a mining operation. The costs included drilling, assaying, camp costs, aerial surveying, geological/geophysical contractors, salaries and associated costs for contract field staff, travel, accommodation, meals and tenement holding costs. During 2008, we incurred A$3,729,592 in costs for exploration drilling on our tenements in the Northern Territory. The costs included drilling, helicopter support, geological/geophysical contractors, salaries and associated costs for contract field staff, travel, accommodation, meals and tenement holding costs.
|
|
(ii)
|
an increase in interest expense from A$32,715 in 2008 to A$64,831 in 2009. During 2009, we incurred interest on the motor vehicle finance leases for a full 12 months compared to 2008 when we incurred interest on the camp lease and motor vehicle finance lease for part of the year.
|
|
(iii)
|
an increase in aircraft maintenance costs from A$278,826 in 2008 to A$1,014,986 in 2009. The Company purchased a Lear jet from AXIS in August 2008 to utilize in its field operations and has incurred operating costs for the jet since that time. In 2009, the lear jet was owned and used for a full 12 month period.
|
52
|
(iv)
|
an increase in legal, professional and accounting from A$707,444 for 2008 to A$880,851 for 2009. During 2009, we incurred legal expenses of A$407,549 for general legal work including stock transfer matters, regulatory filings, stock option plans, native title and environmental approvals, asset acquisitions, and Form S-1 Registration Statements in both the US and Australia; audit fees of A$384,747 for professional services in relation to financial statements, the quarterly Form 10-Qs, Form 10-K, Form 10-K/A and Form S-1; and taxation fees of A$69,875 relating to both the Company and its subsidiaries. Included within legal, accounting and professional expense for the year ended December 31, 2009 are the following amounts for NADL A$66,854 being a fee paid to tax consultants for the preparation of the research and development claim, legal fees of A$16,737, professional fees paid to attorney’s independent experts and other consultants for takeover defence costs of A$27,771 for which there is no comparative amount in 2008. During 2008, we incurred legal expenses of A$518,273 for general legal work including stock transfer matters, regulatory filings, stock option plans, native title and environmental approvals, asset acquisitions, and Form S-1 Registration Statements; audit fees of A$176,198 for professional services in relation to financial statements, the quarterly Form 10-Qs, Form 10-K, and Form S-1; and taxation fees of $11,492.
|
|
(v)
|
an increase in amortization of mineral rights from A$nil in 2008 to A$582,710 in 2009. On the acquisition date of the business combination of NADL, the Company recognized mineral rights of A$18,873,000. The underlying mineral property licences have a set term and mineral rights are being amortized over the term of the licences. The acquisition occurred during 2009 and therefore there was no comparable amounts in 2008.
|
|
(vi)
|
a increase in administrative costs from A$8,096,798 in 2008 to A$8,217,286 in 2009. During 2009, the corporate management and service fees charged to us by AXIS was A$4,433,074. AXIS charged us A$2,968,765 for Directors’ fees, salaries and salary related matters incurred in behalf of the Company, which relates to our share of salaries paid to the President & Chief Executive Officer, Chief Financial Officer and Secretary, Executive General Manager, General Manager Business, Project Manager and other staff of AXIS who provide services to the Company, and A$208,578 for independent directors’ fees. The Company paid insurance costs of A$536,364, including the Federal Government of Australia insurance policy on cash at bank in Australia in excess of A$1,000,000, for 2009. The Company incurred A$1,062,977 for travel by Directors and officers, contractors, and other AXIS staff who provide services to the Company on capital raising trips, trips to the field; A$467,204 for investor relations consultants; A$62,385 for work on the ASX listing; A$9,291 in borrowing costs and bank fees; A$102,572 for motor vehicles costs; A$51,149 for public relations; A$46,111 for stock transfer agent services; A$206,344 for office and computing consumables; A$118,875 for staff support costs; A$555,260 for rent of offices in Melbourne, Mt Isa, Perth and New York and an apartment; A$39,138 for subscription to industry papers and services; A$43,361 for telecommunications support; A$66,715 for depreciation of non-field assets and minor equipment purchases; A$60,095 for Delaware franchise tax; A$86,800 in donations to local community groups; general costs of A$279,036. AXIS charge an administration and service fee of A$1,264,759. During 2008, the corporate management and service fees charged to us by AXIS was A$5,413,203. AXIS charged us A$2,459,665 for Directors’ fees, salaries and salary related matters incurred in behalf of the Company, which relates to our share of salaries paid to the President & Chief Executive Officer, Chief Financial Officer and Secretary, Executive General Manager, General Manager Business, Project Manager and other staff of AXIS who provide services to the Company. The Company paid insurance premiums of A$66,586 for 2008. The Company incurred A$856,703 for travel by Directors and officers, contractors, and other AXIS staff who provide services to the Company on capital raising trips, trips to the field, A$1,269,395 for investor relations consultants and A$15,329 in borrowing costs and bank fees; A$24,068 for motor vehicles costs, A$100,976 for public relations; A$91,672 for stock transfer agent services; and A$5,893 for consumables. During 2008, the Company issued shares to certain shareholders for registration statement non-performance amounting to A$660,494; paid A$213,758 for rent of offices in Melbourne, Mt Isa and New York and an apartment; A$169,489 for subscription to industry papers and services; A$45,231 for telecommunications support; A$78,927 for depreciation of non-field assets and minor equipment purchases, A$60,487 for franchise tax, general costs of A$170,507 AXIS charge A$98,528 for asset usage of plant and equipment, an administration and service fee of A$1,661,723. The overall increase in administration costs related to the increase in activity by the Company as a consequence of providing support to a field exploration program for a full financial year as the exploration projects develop, capital raising activities, preparation of regulatory filings and registration statements.
|
53
|
(vii)
|
Stock based compensation has decreased from A$5,185,743 for 2008 to A$4,259,903 for 2009. The Company has issued options under the 2006 Incentive Option Plan in throughout 2006, 2007 and 2008. The decrease is the result of options being fully vested in prior periods and an adjustment for forfeited options. See note 7 for further details on the options issued.
|
Accordingly, the loss from operations increased from A$19,682,184 for the year ended December 31, 2008 to A$36,806,226 for the year ended December 31, 2009.
A decrease in foreign currency exchange gain/loss from a gain of A$5,389,750 for the year ended December 31, 2008 to a foreign currency exchange loss of A$4,661,096 in the year ended December 31, 2009 was recorded as a result of the movement in the Australian dollar versus the US dollar. On May 12, 2009, the Company made an on-market takeover offer for all of the shares in North Australian Diamonds Limited (“NADL”). The Company held 34.61% of the issued and outstanding shares at May 31, 2009, which increased to 39.38% at June 30, 2009. During the month of June 2009 the Company accounted for its 34.61%interest in NADL as an unconsolidated entity and for the month of July 2009, at the rate of 39.38%. The on market takeover of NADL finished on August 6, 2009 and since that time, the Company has consolidated the results of NADL. In accordance with US GAAP, the Company calculated the difference between the fair value of assets acquired at August 6, 2009 and the carrying value of its investment in an unconsolidated entity (NADL) at August 6, 2009 and recorded an adjustment to fair value on stepped acquisition of A$2,200,620, for which there was no comparable amount in 2008. A net gain of A$113,739 on sale of certain trading securities was incurred in the year ended December 31, 2009, (2008: A$70,874) being the difference between the cost price, sale price and market value. There were no trading securities held at December 31,2009.
The loss before income taxes and equity in losses of unconsolidated entities was A$14,221,560 for the year ended December 31, 2008 compared to A$39,152,963 for the year ended December 31, 2009.
On May 12, 2009, the Company made an on-market takeover offer for all of the shares in North Australian Diamonds Limited (“NADL”). The Company held 34.61% of the issued and outstanding shares at May 31, 2009 and as a result, accounted for its interest in NADL as an unconsolidated entity until August 6, 2009. The takeover offer concluded on August 6, 2009. At the close of the offer, the Company held 55% of the issued and outstanding shares of NADL and as a result, commenced consolidating the results of NADL from that date. In early December 2009, NADL placed shares to a third party which had the effect of diluting the Company’s interest in NADL to 47.83%. Under Australian takeover laws, the Company was prevented from purchasing further shares in NADL for a period of 6 months from the conclusion of the takeover (August 6, 2009). Accordingly, it was not until February 6, 2010 that the Company was entitled to purchase any further shares in NADL under Australian Corporations Law. Since February 6, 2010, the Company has purchased further shares in NADL and its current interest is approximately 50%. It is the Company’s intentions to continue to acquire shares and to maintain a controlling financial interest. Furthermore, management believes it had the ability to control the operations of NADL through its share ownership as well as having three of the Directors of NADL. It is management’s conclusion that the Company has a controlling financial interest in NADL and accordingly, it should continue to consolidate NADL’s results into the Company.
54
During the year ended December 31, 2009, the Company’s share of the losses of the unconsolidated entities for the two months it equity accounted its investment in NADL amounted to A$345,707 (2008: $nil).
There was no provision for tax in either 2009 or 2008.
The net loss was A$14,221,560 for the year ended December 31, 2008 compared to a net loss of A$39,498,670 for the year ended December 31, 2009.
The share of the net loss attributable to the non-controlling interests of NADL amounted to A$1,612,599 for the year ended December 31, 2009 compared to A$nil for the year ended December 31, 2008 as the acquisition of NADL which occurred in July 2009 for the first time.
The net loss attributable to Legend stockholders amounted to A$37,886,071 for the year ended December 31, 2009 compared to A$14,221,560 for the year ended December 31, 2008.
Liquidity and Capital Resources
We funded our operations through fund raisings noted below.
As of December 31, 2010, the Company has cash of A$25,165,910 (US$25,576,114).
During fiscal 2010, net cash used in operating activities was A$33,512,141 (US$34,058,388), as compared to A$30,508,919 in 2009. During fiscal 2010, net cash used in investing activities was A$16,850,020 (US$17,124,675) and A$24,632,260 in 2009. The major components in 2010 was an additional investment in consolidated entities of A$4,032,694 (US$4,098,427) (2009: A$9,198,412), investment in unconsolidated entities A$6,194,022 (US$6,294,985) (2009: A$13,082,295); additions to property, plant and equipment of A$6,426,532 (US$6,531,284) (2009: A$3,356,338); proceeds from sale of trading securities A$nil (US$nil) (2009: A$1,272,343) and investment in marketable securities of A$196,772 (US$199,979) (2009: A$377,658). In 2010, capital expenditure included A$2,938,792 (US$2,986,694) for purchase of assets provided under a finance agreement, A$2,727,301 (US$2,771,756) for land, buildings and associated equipment and plant upgrade of the Merlin processing plant of A$760,439 (US$772,834). During fiscal 2010, net cash provided by financing activities was A$2,064,022 (US$2,097,666) which represented the proceeds of private placements offering of shares of Common Stock of our subsidiary of A$2,097,283 (US$2,649,782) (2009: A$13,542,008) less costs of A$142,407 (US$144,728), proceeds from capital lease agreements of A$2,938,792 (US$2,986,694), advance to affiliates A$2,936,845 (US$2,984,715) and we repaid A$402,801 (US$409,367) (2009: A$353,944) under finance leases. At December 31, 2010 and 2009, the Company held US$913,849 and US$930,857 respectively in interest bearing accounts in US banking institutions and US$3,195,100 and US$8,725,656 respectively held in US currency in Australian banking institutions. During the year, the Company had significant US$ cash balances which when converted to Australian dollars results in a foreign exchange loss.
We plan to continue our exploration and development program throughout 2011 and anticipate spending A$7.4 million on exploration and development and A$10.7 million on administrative costs. In February 2011, the Company announced its maiden mineral reserve for its 100% owned Paradise South phosphate project in accordance with SEC Industry Guide 7. As the Company has completed most of its drilling and assaying programs to establish the reserve, costs in 2011 will be substantially reduced.
On December 12, 2007, we entered into a Subscription Agreement with Atticus European Fund Ltd. and Green Way Managed Account Series Ltd. in respect of its segregated account, Green Way Portfolio D (collectively “Atticus”) pursuant to which the Company issued in a private placement transaction (the “Private Placement”) to Atticus an aggregate of 18,750,000 shares of Common Stock at a price of US$0.80 per share for an aggregate purchase price of US$15,000,000 (A$16,924,292).
55
In June 2008, the Company completed a private placement offering (the “BMO Offering”) of 42,000,000 share of common stock to institutional investors at a purchase price of US$2.50 per share for total proceeds of A$110,028,293 (US$105,000,000). BMO Nesbitt Burns Inc., Wellington West Capital Markets Inc. and BBY Limited acted as agents for the offering and received a commission of 5% of the offering proceeds and two year warrants to purchase 840,000 shares of common stock at an exercise price of US$2.50 per share.
Effective July 14, 2008, the Company entered into a Shares Option Agreement with the Indian Farmers Fertilizer Cooperative Limited (“IFFCO”) to finance the Company’s operations.
Under the Share Options Agreement, IFFCO received options to purchase 30 million shares of Common Stock of the Company on the following terms:
|
|
a.
|
5,000,000 options, at an exercise price of US$2.50 per share and expiring 60 days from July 11, 2008;
|
|
|
b.
|
8,000,000 options, at an exercise price of US$3.00 per share and expiring 12 months from July 11, 2008;
|
|
|
c.
|
8,000,000 options, at an exercise price of US$3.50 per share and expiring 18 months from July 11, 2008;
|
|
|
d.
|
9,000,000 options, at an exercise price of US$4.00 per share and expiring 24 months from July 11, 2008.
|
During the third quarter of 2008, the 5,000,000 options issued to IFFCO, at an exercise price of US$2.50 per share and expiring 60 days from July 11, 2008 were exercised on August 11, 2008 and pursuant to the Share Options Agreement, received a 1.2% discount on the exercise price. The total amount received was A$13,672,091 (US$12,350,000) and the Company issued 5,000,000 shares of common stock. The 8,000,000 options expiring 12 months after July 11, 2008, the 8,000,000 options expiring 18 months after July 11, 2008 and the 9,000,000 options expiring 24 months after July 11, 2008 were not exercised and lapsed.
The Company accounts for these options as a financing activity and accordingly, records all proceeds upon exercise of such options within stockholders’ equity.
The Share Options Agreement also gives IFFCO a pre-emptive right to acquire its pro rata share of future issuances of Common Stock by the Company, with certain exceptions.
Pursuant to the Shares Option Agreement, the parties agreed to enter into a long-term rock off-take agreement, which shall be separately negotiated but which shall be based on certain principles which were previously described in the Company’s Quarterly Report of Form 10-Q for the fiscal quarter ended June 30, 2008.
Between July 1, 2008 and December 31, 2008, 281,200 options were exercised using the cashless exercise feature and the Company issued 247,774 shares of common stock.
Between July 1, 2008 and December 31, 2008, an additional 327,600 options were exercised for US$0.111, total amount received A$38,950 (US$36,364) and the Company issued 327,600 shares of common stock.
Between January 1, 2009 and December 31, 2009, an additional 18,000 options were exercised for US$0.111, total amount received A$2,763 (US$1,998) and the Company issued 18,000 shares of common stock.
Between July 1, 2010 and December 31, 2010, 333,334 options were exercised pursuant to the 2006 Equity Incentive Plan using the cashless exercise feature and the Company issued 66,282 shares of common stock.
56
The Company has historically funded its activities from funds provided by capital raising through the issuance of its shares and from advances from affiliated entities. The Company has in place a planning and budgeting process to help determine the funds required to support the Company's operating requirements and its exploration and pre-development plans. Based on this process and the amount of the Company's cash and other current assets as of December 31,2010, management believes that the Company has sufficient operating liquidity to sustain its activities through 2011. However, as the Company has not yet generated income producing activities, it will continue to seek opportunities to raise additional funds from capital raising efforts through the issuance of its shares, funding from affiliated entities as may be available and other financing arrangements until which time as the Company can commence revenue producing activities.
As future exploration and development activities will require additional financing, the Company is pursuing varying strategies to accomplish this including obtaining third parties to take an ownership interest in or to provide financing for the anticipated development activities related to the phosphate project, as well as capital raising through share issuances.
|
Contractual
Obligations
|
Total
A$000’s
|
Less
than 1 year
A$000’s
|
1-3
Years
A$000’s
|
3-5
Years
A$000’s
|
More
than 5 years A$000’s
|
|||||||||||||||
|
Long term debt obligations
|
2,835 | 224 | 495 | 2,116 | - | |||||||||||||||
|
Capital lease obligations
|
709 | 455 | 254 | - | - | |||||||||||||||
|
Operating lease obligations
|
547 | 277 | 270 | - | - | |||||||||||||||
|
Purchase obligations
|
- | - | - | - | - | |||||||||||||||
|
Other long term liabilities reflected on the consolidated balance sheet under GAAP
|
926 | 76 | 126 | 126 | 598 | |||||||||||||||
| 5,017 | 1,032 | 1,145 | 2,242 | 598 | ||||||||||||||||
Impact of Recent Accounting Pronouncements
For a discussion of the impact of recent accounting pronouncements on the Company’s annual financial statements, see Note 2 to the Company’s Financial Statements which are included herein.
|
Quantitative and Qualitative Disclosures About Market Risk.
|
At December 31, 2010, the Company had long-term debt of A$2,835,482 (US$2,881,700). As the Loan Facility is US dollars, a change in the exchange rate between the A$ and the US$ will have an effect on the amounts reported in the Company’s consolidated financial statements, and create a foreign exchange gain or loss. A movement of 1% in the A$ versus the US$ exchange rate will have an A$28,355 effect on the consolidated balance sheet and income statement..
The Company reports in A$ and holds cash denominated in US dollars. At December 31, 2010, this amounted to US$4,109,792 (A$4,043,877). A change in the exchange rate between the A$ and the US$ will have an effect on the amounts reported in the Company’s consolidated financial statements, and create a foreign exchange gain or loss. A movement of 1% in the A$ versus the US$ exchange rate will have an A$40,039 effect on the consolidated balance sheet and income statement. The balance of cash of A$21,122,033 is held in Australian dollars.
The Company holds trading securities in Australian and US listed corporations. The trading securities in Australian corporations amounted to A$150,000 at December 31, 2010 and are affected by the volatility of the Australian stock market.. The US listed corporations are traded in US$ and at December 31, 2010, this amounted to US$115,595 (A$113,741). The trading securities are affected by the movement of the A$ against the US$ and volatility of the US stock market. A change in the exchange rate between the A$ and the US$ will have an effect on the amounts reported in the Company’s consolidated financial statements, and create a foreign exchange gain or loss. A movement of 1% in the A$ versus the US$ exchange rate will have an A$1,126 effect on the consolidated balance sheet and income statement.
57
The Company holds an investment in a Fund denominated in euros. At December 31, 2010, this amounted to €1,700,000 (A$2,784,477). A change in the exchange rate between the A$ and the € will have an effect on the redemption amount and reported gain or loss on sale of the investment. The investment is carried at cost and the effect of € exchange rate at December 31, 2010 on the income statement if the investment was redeemed is A$(379,339).
|
Financial Statements and Supplementary Data.
|
See the Financial Statements beginning on page F-1.
|
Changes in and Disagreements With Accountants on Accounting and Financial Disclosure.
|
There have been no changes in accountants or any disagreements with accountants on any matter of accounting principles or practices or financial statement disclosures during the three years ended December 31, 2010.
|
Controls and Procedures.
|
Disclosure Controls and Procedures
Our principal executive officer and our principal financial officer evaluated the effectiveness of our disclosure controls and procedures (as defined in Rule 13a-15(e) and 15d-15(e) of the Securities Exchange Act of 1934 as amended) as of the end of the period covered by this report. Based on that evaluation, such principal executive officer and principal financial officer concluded that, the Company’s disclosure control and procedures were effective as of the end of the period covered by this report at the reasonable level of assurance.
Internal Control over Financial Reporting
|
|
(a)
|
Management’s Annual Report on Internal Control over Financial Reporting
|
Management of the Company is responsible for establishing and maintaining effective internal control over financial reporting. The Company’s internal control system was designed to provide reasonable assurance regarding the preparation and fair presentation of published financial statements. All internal control systems, no matter how well designed, have inherent limitations. Therefore, even those systems determined to be effective can provide only reasonable assurance regarding the reliability of financial statement preparation and presentation.
Management assessed the Company’s internal control over financial reporting as of December 31, 2010. This assessment was based on criteria for effective internal control over financial reporting established in Internal Control - Integrated Framework issued by the Committee of Sponsoring Organizations of the Treadway Commission (the “COSO criteria”). Based on this assessment, management has concluded that the Company’s internal control over financial reporting was effective as of December 31, 2010.
PKF LLP (formerly PKF, Certified Public Accountants, A Professional Corporation), the Company’s independent registered public accounting firm, has issued their report on their audit of the Company’s internal control over financial reporting as of December 31, 2010, a copy of which is included herein.
|
|
(b)
|
Attestation Report of the Independent Registered Public Accounting Firm
|
58
Report of Independent Registered Public Accounting Firm
To the Board of Directors and Stockholders of Legend International Holdings, Inc.
We have audited Legend International Holdings, Inc.’s (an Exploration Stage Company) internal control over financial reporting as of December 31, 2010, based on criteria established in Internal Control - Integrated Framework issued by the Committee of Sponsoring Organizations of the Treadway Commission (the “COSO criteria”). Legend International Holdings, Inc.’s management is responsible for maintaining effective internal control over financial reporting and for its assessment of the effectiveness of internal control over financial reporting, included in the accompanying Management’s Annual Report on Internal Control over Financial Reporting. Our responsibility is to express an opinion on the Company’s internal control over financial reporting based on our audit.
We conducted our audit in accordance with the standards of the Public Company Accounting Oversight Board (United States). Those standards require that we plan and perform the audit to obtain reasonable assurance about whether effective internal control over financial reporting was maintained in all material respects. Our audit included obtaining an understanding of internal control over financial reporting, assessing the risk that a material weakness exists, testing and evaluating the design and operating effectiveness of internal control, based upon the assessed risk, and performing such other procedures as we considered necessary in the circumstances. We believe that our audit provides a reasonable basis for our opinion.
A company’s internal control over financial reporting is a process designed to provide reasonable assurance regarding the reliability of financial reporting and the preparation of financial statements for external purposes in accordance with generally accepted accounting principles. A company’s internal control over financial reporting includes those policies and procedures that (1) pertain to the maintenance of records that, in reasonable detail, accurately and fairly reflect the transactions and dispositions of the assets of the company; (2) provide reasonable assurance that transactions are recorded as necessary to permit preparation of financial statements in accordance with generally accepted accounting principles, (3) receipts and expenditures of the company are being made only in accordance with authorizations of management and directors of the company; and (4) provide reasonable assurance regarding prevention or timely detection of unauthorized acquisition, use, or disposition of the company’s assets that could have a material effect on the financial statements.
Because of its inherent limitations, internal control over financial reporting may not prevent or detect misstatements. Also, projections of any evaluation of effectiveness to future periods are subject to the risk that controls may become inadequate because of changes in conditions, or that the degree of compliance with the policies or procedures may deteriorate.
In our opinion, Legend International Holdings, Inc. (an Exploration Stage Company) maintained, in all material respects, effective internal control over financial reporting as of December 31, 2010 based on the COSO criteria.
We also have audited, in accordance with the standards of the Public Company Accounting Oversight Board (United States), the consolidated balance sheet of Legend International Holdings, Inc (an Exploration Stage Company) as of December 31, 2010 and 2009, and the related consolidated statements of operations, stockholders’ equity (deficit) and cash flows for the years ended December 31, 2008, 2009 and 2010 and the cumulative amounts from inception, January 5, 2001 through December 31, 2010 and our report dated March 14, 2011 expressed an unqualified opinion thereon.
New York, NY /s/ PKF LLP
March 14, 2011
|
|
(c)
|
Changes in Internal Control Over Financial Reporting
|
There have been no changes in internal control over financial reporting during the Company’s fourth fiscal quarter.
(d) Other
59
We believe that a controls system, no matter how well designed and operated, can not provide absolute assurance that the objectives of the controls system are met, and no evaluation of controls can provide absolute assurance that all control issues and instances of fraud, if any, within a company have been detected. Therefore, a control system, no matter how well conceived and operated, can provide only reasonable, not absolute, assurance that the objectives of the control system are met. Our disclosure controls and procedures are designed to provide such reasonable assurance of achieving our desired control objectives, and our principal executive officer and principal financial officer have concluded, as of December 31, 2010, that our disclosure controls and procedures were effective in achieving that level of reasonable assurance.
|
Other Information.
|
None.
60
|
Directors, Executive Officers and Corporate Governance.
|
The following table sets out certain information concerning the Company’s executive officers and directors.
|
Name
|
Age
|
Position(s) Held
|
|
Joseph Gutnick
|
58
|
Chairman of the Board
President, Chief Executive Officer and Director.
|
|
David Tyrwhitt
|
72
|
Director
|
|
Dr U.S Awasthi
|
65
|
Director
|
|
Manish Gupta
|
44
|
Director
|
|
Dr Allan Trench
|
47
|
Director
|
|
Henry Herzog
|
69
|
Director
|
|
Peter Lee
|
53
|
Secretary, Chief Financial Officer and Principal
Accounting Officer.
|
|
|
||
|
Craig Michael
|
33
|
Executive General Manager
|
|
Edward Walker
|
39
|
Project Manager
|
Director Qualifications
The following paragraphs provide information as of the date of this report about each director as well as about each executive officer. The information presented includes information each director has given us about his age, all positions he holds, his principal occupation and business experience for the past five years, and the names of other publicly-held companies of which he currently serves as a director or has served as a director during the past five years. In addition to the information presented below regarding each director’s specific experience, qualifications, attributes and skills that led our Board to the conclusion that he should serve as a director, we also believe that all of our directors have demonstrated an ability to exercise sound judgment, as well as a commitment of service to Legend and our Board. Finally, we value their significant experience in the mining industry and other public and board committees.
Joseph Gutnick
Mr Gutnick has been Chairman of the Board, President and Chief Executive Officer since November 2004 and has been Chairman of the Board, President and Chief Executive Officer of numerous public listed companies in Australia and the USA specialising in the mining sector since 1980. Mr Gutnick is currently Chairman of the Board, President and Chief Executive Officer of Golden River Resources Corporation, Northern Capital Resources Corporation, Great Central Resources Corporation, Electrum International, Inc. and Aurum, Inc., US corporations; and Executive Chairman and Managing Director of North Australian Diamonds Limited, Top End Uranium Limited and Quantum Resources Limited, all listed on Australian Securities Exchange. He has previously been a Director of Hawthorn Resources Limited, Astro Diamond Mines NL, Acadian Mining Corporation and Royal Roads Corporation in the last five years. Mr Gutnick was previously been a Director of the World Gold Council. He is a Fellow of the Australasian Institute of Mining & Metallurgy and the Australian Institute of Management and a Member of the Australian Institute of Company Directors.
Mr Gutnick’s extensive experience in leading teams in building and operating major mining operations in Australia as well as his experience in founding and serving as the chief executive officer and chairman of a number of public companies will provide our Board with valuable executive leadership and management experience.
61
Mr Gutnick devotes a majority of his business time to the affairs of the Company.
David Tyrwhitt
Dr Tyrwhitt was appointed a Director in March 2005. He is a geologist, holding a Bachelor of Science and PhD degrees and has 50 years experience in mineral exploration and management development and operation of gold and diamond mines in Australia. Dr Tyrwhitt has been a Director of numerous public listed companies in Australia in the mining industry and is currently a Director of Hawthorn Resources Limited, Bassari Resources Ltd, Quantum Resources Limited, Golden River Resources Corp, a Delaware corporation (GORV.OB) and Northern Capital Resources Corp., a Delaware corporation since 2008. In the last five years, he has also been a Director of Astro Diamond Mines NL.
Dr Tyrwhitt’s experience in working on mining projects in Australia and technical skills will provide our Board with an Australian perspective to mining operations.
U.S. Awasthi
Dr Awasthi was appointed a Director in August 2008. Dr. Awasthi has been the Managing Director of IFFCO since February 1993, the largest producer and seller of fertilizers in India. Dr. Awasthi has worked in various pivotal positions in IFFCO & KRIBHCO and acquired all-round expertise in planning and execution of fertilizer plants and was closely associated with the construction of Hazira as well as Aonla Projects. In 1986, he joined Pyrites, Phosphates & Chemicals Limited (PPCL) as its Chairman and Managing Director. He also held additional charge as Chairman & Managing Director of Rashtriya Chemicals & Fertilizers Ltd. (RCF) from April 1991 to March 1992. Dr Awasthi was the Chairman of the Fertilizer Association of India (FAI), New Delhi, during 1994-96. He held the position of President, International Fertilizer Industry Association (IFA), Paris during 1997-99. Dr Awasthi has over 30 papers to his credit and has co-authored a book ‘Fertilizer Industry in India’.
Dr Awasthi’s experience in the international fertilizer markets will provide our Board with a valuable perspective on the development and operation of fertilizer plants and marketing of fertilizer products.
Manish Gupta
Mr Gupta was originally appointed a Director in August 2008, before resigning in November 2009 due to other commitments. Mr Gupta was re-appointed as a Director in December 2010. Mr Manish Gupta graduated from the Indian Institute of Technology (IIT), Delhi, India in 1988 with a Bachelor of Technology specialising in Civil Engineering and continued his studies at the Institute of Management (IIM), Calcutta, India where he gained a Post Graduate Diploma in Management in 1990 specialising in Development, Marketing, and then at the University of Pune, Pune, India where he gained a Bachelor of Laws (LLB) in 1996 excelling in Taxation and Commercial Laws. Mr Gupta has held several positions in the Indian Government including with the Indian Taxation Office and as Deputy Secretary to the Government of India, Ministry of Chemicals and Fertilisers, and as an Additional Commissioner of Income Tax and Officer on Special Duty to the Revenue Secretary, Government of India. In May 2004, he joined IFFCO and currently heads the strategic management team of IFFCO, responsible for formulating the future vision of the society and associated strategic decision making including setting up new ventures and partnerships, acquisition of existing ventures and diversification in new areas.
Mr. Gupta’s experience in the international fertilizer markets and his engineering background will provide our Board with a valuable perspective in the development of the Company’s phosphate project.
Allan Trench
Dr Trench was appointed a Director in August 2008. Dr Allan Trench is a geologist/geophysicist and business management consultant with approximately 20 years experience within the Australian resources sector across a number of commodity groups and is currently Chairman of the Board and a Director of Acadian Mining Corporation (ADA:TSX), a Director of Navigator Resources Ltd, Pioneer Resources Limited and Venturex Resources Limited, and was a Director of Heron Resources Ltd during the past five years. Dr Trench was the Exploration Manager for WMC for the Leinster-Mt Keith region and then managed a number of exploration companies associated with Mr Joseph Gutnick before joining McKinsey & Company as a management consultant. In his role at McKinsey, Dr Trench was an advisor to a number of large international resources companies on strategic, organization and operational issues. From 2004 to 2006 Dr Trench was employed in a contract role as corporate strategist end benchmarking manager at Woodside Energy, helping to building Woodside’s capability in strategy, benchmarking and performance improvement across its global asset portfolio. Following this, he was employed by the CRU Group and was firstly responsible for global copper research managing a team of 12 analysts and more recently as Regional Director - Australasia. Dr Trench also serves as a non executive director for two other resource companies and currently holds the title of Adjunct Professor of Mineral Economics & Mine Management at the WA School of Mines, Curtin University.
62
Dr Trench’s experience in working on complex mining projects internationally and Australia and technical skills will provide our Board with a valuable perspective on conducting business in international jurisdictions.
Henry Herzog
Mr Henry Herzog has more than 40 years of corporate and management experience. He has been a Director of the Company since August 2008. Mr Herzog has served in various positions as President, Vice President or Director of a number of publicly listed companies in Australia and the United States, predominantly in the mining sector and is currently also a Director of North Australian Diamonds Limited (NAD:ASX). Mr Herzog was responsible for the restructuring and reorganization of several publicly listed companies including Bayou International Limited, now known as Golden River Resources Corporation (GORV.OB), where he served as its President and Chief Executive Officer from 1986 to 1999 and as a Vice President from 1988-1989. For at least the past five years, Mr Herzog has also been managing a number of private investment entities. He is also a member of the Board of Trustees of a non-profit college of higher education.
Mr Herzog’s experience in corporate and management of international companies will provide our Board with a valuable perspective on conducting business in international jurisdictions.
Peter Lee
Mr Lee has been Chief Financial Officer since March 2005 and Secretary since November 2004. He is a Director, Chief Financial Officer and Secretary of Golden River Resources Corp, a Delaware corporation (GORV.OB), Chief Financial Officer and Secretary of Aurum, Inc. (AURM.OB), Electrum International, Inc. (PNDI.OB), Northern Capital Resources Corp and Great Central Resources Corp, and Chief Financial Officer and Company Secretary of North Australian Diamonds Limited, Top End Uranium Ltd and Quantum Resources Limited, all listed on Australian Securities Exchange. Mr Lee is also President, Chief Executive Officer and Director of Acadian Mining Corporation (ADA:TSX) and Chairman of the Board and Director of Royal Roads Corp (RRO:TSX-V). Mr Lee is a Member of the Institute of Chartered Accountants in Australia, a Fellow of Chartered Secretaries Australia Ltd., a Member of the Australian Institute of Company Directors and holds a Bachelor of Business (Accounting) from Royal Melbourne Institute of Technology. He has over 30 years commercial experience and is currently Chief Financial Officer and Company Secretary of several listed public companies in Australia.
Mr Lee devotes a majority of his business time to the affairs of the Company.
63
Craig Michael
Mr Michael has been Executive General Manager of the Company since September 2007 and has more than nine years experience in the mining and resources industry and is a Director of Aurum, Inc. (AURM:OB), Electrum International, Inc. (PNDI:OB), Quantum Resources Limited (QUR:ASX) and North Australian Diamonds Limited (NAD:ASX). From February 2004 to September 2007, he was employed by Oxiana Ltd where he was based in Laos in a Supervisor/Trainer role, both as a Mine Geologist and Resource Geologist at the Sepon Copper Gold Project. He was responsible for the geological interpretation of the Khanong copper-gold deposit and the surrounding oxide and primary gold deposits. In conjunction with training the national geologic staff in all mining and resource geology functions Mr Michael also conducted resource estimates for public reporting. Prior to his time with Oxiana, he was a Mine Geologist at Sons of Gwalia’s Carosue Dam Gold Project in Western Australia where he also conducted his honours thesis on their flagship Karari gold deposit.
Edward Walker
Mr Walker has been Project Manager of the Company since October 2008. He has acquired extensive international experience in the mining and water sectors via a number of senior engineering and project manager roles in international organizations, including as Principal Engineer for Parsons Brinkerhoff Australia from April 2007 to October 2008 and prior to that was with Bahia Mineracao Limitada as Senior Project Manager. Mr Walker spent over 10 years in senior engineering roles in Australia and the United Kingdom before spending two years as a senior project manager of an Iron Ore Mining project run by Brazilian company Bahia Mineração Limitada (BML). He then moved to a multi-disciplinary engineering firm Parsons Brinkerhoff as a Principal Engineer responsible for business development and delivery of client projects. Mr Walker has a Bachelor of Engineering (Civil) from Swinburne University of Technology and an Executive MBA from the Business School of São Paulo.
Involvement on Certain Material Legal Proceedings During the Last Ten Years
No director, officer, significant employee or consultant has been convicted in a criminal proceeding, exclusive of traffic violations. No director, officer, significant employee or consultant has been permanently or temporarily enjoined, barred, suspended or otherwise limited from involvement in any type of business, securities or banking activities. No director, officer or significant employee has been convicted of violating a federal or state securities or commodities law.
Mr. Gutnick was formerly the Chairman of the Board, Dr. Tyrwhitt was formerly an independent Director and Mr. Lee was formerly Company Secretary of Centaur Mining & Exploration Ltd., an Australian corporation, which commenced an insolvency proceeding in Australia in March 2001.
Board of Directors
Our Certificate of Incorporation provides that there must be at least one Director of the Company. Our Board of Directors currently consists of five directors.
Directors need not be stockholders of the Company or residents of the State of Delaware. Directors are elected for an annual term and generally hold office until the next Directors have been duly elected and qualified. Directors may receive compensation for their services as determined by the Board of Directors. A vacancy on the Board may be filled by the remaining Directors even though less than a quorum remains. A Director appointed to fill a vacancy remains a Director until his successor is elected by the Stockholders at the next annual meeting of Shareholder or until a special meeting is called to elect Directors.
The executive officers of the Company are appointed by the Board of Directors. There are no family relationships between any Directors or executive officers of the Company other than as disclosed.
Our Board of Directors consists of six members, of whom three would meet the independence requirement of the NASDAQ Stock Market.
The Company encourages all Directors to attend the Annual Meeting of stockholders, either in person or by telephone. Mr. Gutnick, Mr. Herzog and Dr Trench attended the 2010 Annual Meeting. Dr Awasthi and Dr Tyrwhitt were unavailable due to business commitments.
64
Nominating Committee
At a meeting of the Board of Directors on August 12, 2008, it was resolved that Dr. Allan Trench, Dr. David Tyrwhitt and Mr. Henry Herzog be appointed to the Nominating Committee and that Dr. David Tyrwhitt be the Chair of the Committee. The Nominating Committee has authority and responsibilities as vested in it by the Board of Directors at a Directors Meeting held on June 27, 2008
Audit and Compensation Committees
At a meeting of the Board of Directors on August 12, 2008, it was resolved that Dr. Allan Trench, Dr. David Tyrwhitt and Mr. Henry Herzog be appointed to the Audit Committee and the Compensation Committee and that Dr. Allan Trench be the Chair of both of the Committees. It is the opinion of the Board of Directors that Dr. David Tyrwhitt, Dr. Allan Trench and Mr. Henry Herzog are independent directors as defined in Rule 10A-3 of the Securities Exchange Act of 1934. In addition, the Board believes that Dr. David Tyrwhitt, Dr. Allan Trench and Mr. Henry Herzog would meet the director independence requirements of the NASDAQ Stock Market if we were listed on such Market. The Board has designated Dr Trench as an “audit committee financial expert” under the rules and regulations of the SEC for purposes of Section 407 of the Sarbanes-Oxley Act of 2002 after determining that he meets the requirements for such designation.
We have adopted a Code of Conduct and Ethics and it applies to all Directors, Officers and employees. A copy of the Code of Conduct and Ethics will be posted on our website and we will provide a copy to any person without charge. If you require a copy, you will be able to download it from our website at www.lgdi.net or alternatively, contact us by facsimile or email and we will send you a copy.
Stockholder Communications with the Board
Stockholders who wish to communicate with the Board of Directors should send their communications to the Chairman of the Board at the address listed below. The Chairman of the Board is responsible for forwarding communications to the appropriate Board members.
Mr. Joseph Gutnick
Legend International Holdings, Inc.
PO Box 6315 St Kilda Road
Central Melbourne, Victoria 8008 Australia
Section 16(a) Beneficial Ownership Reporting Compliance
Pursuant to Section 16(a) of the Securities Exchange Act of 1934, our Directors, executive officers and beneficial owners of more than 10% of the outstanding Common Stock are required to file reports with the Securities and Exchange Commission concerning their ownership of and transactions in our Common Stock and are also required to provide to us copies of such reports. Based solely on such reports and related information furnished to us, we believe that in fiscal 2010 all such filing requirements were complied with in a timely manner by all Directors and executive officers and 10% stockholders.
|
Executive Compensation.
|
Compensation Discussion and Analysis
Overview
Our executive compensation program for our Chief Executive Officer and Chief Financial Officer, and our other executive officers (including up to three of our executive officers whose total compensation exceeds $100,000 per annum), whom we collectively refer to as our named executive officers, consists of (i) base salary and (ii) incentive compensation in the form of cash bonuses and (iii) equity-based incentive compensation awards under the Company’s 2006 Equity Incentive Plan. Our executive compensation program has historically included and continues to include very few perquisites. In August 2008 the Company’s Board of Directors appointed a Compensation Committee which is responsible for reviewing and approving the compensation paid by us to the named executive officers. Prior thereto, compensation decisions were determined by the full Board of Directors. The services of our named executive officers are provided to us under a Service Agreement with AXIS Consultants Pty Ltd. Cash compensation is paid to the named executive officers by AXIS and is reimbursed to AXIS by the Company.
65
Compensation Objectives
The Compensation Committee’s philosophy is to establish executive compensation policies linked to the creation of stockholder value. Our compensation program is designed to:
|
|
●
|
Adequately and fairly compensate executive officers in relation to their responsibilities, capabilities and contributions to the Company and in a manner that is commensurate with compensation paid by companies of comparable size and at a comparable stage of development within our industry;
|
|
|
●
|
Align the interests of the executive officers with those of the stockholders with respect to short-term operating goals and long-term increases in the value of our common stock; and
|
|
|
●
|
Provide a strong emphasis on equity-based compensation and equity ownership, creating a direct link between stockholder and management interests.
|
These objectives serve as the guiding principles for all the decisions the Compensation Committee makes with respect to the amount and type of compensation payable to our named executive officers.
Mix of Compensation Elements
Our executive compensation during fiscal 2010 consisted of base salary, benefits and perquisites. We do not have any formal or informal policy or target for allocating compensation between long-term and short term compensation, between cash and non-cash compensation or among the different forms of non-cash compensation. Similarly, compensation decisions regarding one compensation component do not directly affect decisions regarding other compensation elements. For example, an increase to the base salary of a named executive officer does not require a formulaic decrease to another element of the executive’s compensation. Instead, we have determined subjectively on a case-by-case basis the appropriate level and mix of the various compensation components.
We believe that together all of our compensation components provide a balanced mix of base compensation and compensation that is contingent upon each executive officer’s individual performance and our overall performance. A goal of the compensation program is to provide executive officers with a reasonable level of security through base salary and benefits, while rewarding them through incentive compensation to achieve business objectives and create stockholder value. We believe that each of our compensation components is critical in achieving this goal. Base salaries provide executives with a base level of monthly income and security. long-term equity incentive awards link the interests of our executives with our stockholders, which motivates our executives to create stockholder value. In addition, we want to ensure that our compensation programs are appropriately designed to encourage executive officer retention, which is accomplished through all of our compensation elements. We also consider whether the Company’s executive compensation programs encourage excessive risk taking or raise the Company’s risk profile, which we do not believe to be the case.
66
Components of Compensation
Base Salary. The base salaries for the Company’s named executive officers for the year ended December 31, 2010 were reviewed effective December 2009 by AXIS with the consultation and approval of the Company’s Board of Directors. The services of our named executive officers are provided to us under a Service Agreement with AXIS Consultants Pty Ltd. Cash compensation is paid to the named executive officers by AXIS and is reimbursed to AXIS by the Company. AXIS advised that adjustments to base salaries are generally determined based upon a number of factors, including the client companies performance (to the extent such can fairly be attributed or related to each executive’s performance), as well as the nature of each executive’s responsibilities, capabilities and contributions, and whether their salary fairly reflect job responsibilities and prevailing market conditions and rates of pay. AXIS advised that it considered each of these factors but did not assign a specific value to each factor in setting base salaries for 2010. The Company believes that the remuneration (including salaries) charged to the Company by AXIS for the Company’s named executive officers have historically been reasonable in relation to the Company’s size and performance. We do not use benchmarking as a fixed criteria to determine compensation. Rather, after subjectively setting compensation based on the above factors, we reviewed the compensation paid to officers based on our knowledge of salaries paid in the industry in Australia to obtain a general understanding of the reasonableness of base salaries and other compensation payable to our named executive officers. AXIS has advised that the level of remuneration charged to the Company for the named executive officers for the year ended December 31, 2010 was comparable to 2009 as a result of the continuing significant amount of time spent by those named executive officers with the development of the phosphate project of the Company, the investments of the Company and corporate compliance matters dealt with as a result of the increase in the level of activity. The Company acknowledged the increase in activity referred to by AXIS and believes the increase in the level of remuneration appropriate given the circumstances.
Cash Bonuses AXIS with the acknowledgement of the Company, did not pay cash bonuses in 2010 given the status of the Company’s phosphate project. In 2009, AXIS with the acknowledgement of the Company awarded cash bonuses to the Company’s named executive officers for the period July 2008 to December 2009 to acknowledge the significant work undertaken by the named executives of the Company in advancing the phosphate project of the Company for the benefit of shareholders. The bonuses were not based on a predetermined formula. In determining the contribution of each individual executive, the Company acknowledged the contribution of each of the executive management team in the efficient running of the Company, Mr. Gutnick and Michael in the Company’s negotiations with external parties in the advancement of the Company’s affairs and activities, Mr. Walker’s contribution in leading the development team in pre-development activities and negotiations with potential infrastructure companies; and Mr. Lee’s contribution in leading the finance, corporate and secretarial team through the increasing compliance and reporting matters in connection with the Company’s acquisition of its interest in NADL. Each of the bonuses were based on a flat amount plus an amount of 10% of salary. The Company’s independent directors, at the time, were consulted on the bonuses and determined that the bonuses were reasonable given the overall advancement of the Company’s activities.
2006 Equity Incentive Plan. Under the 2006 Equity Incentive Plan, certain management and key employees of the Company are granted time-based options to purchase common stock issued by us. Time-based options generally vest ratably over a three-year period on the anniversary of the date of the grant. Time-based options generally vest upon a change of control, subject to certain conditions, and expire ten years from the date of grant. Our Board of Directors believes that equity-based compensation awards foster and promote our long-term financial success by linking the interests of our executive management team with our stockholders. The Board also believes that increasing the personal equity stake of our executive officers in our continued success and growth can potentially materially increase stockholder value. Equity-based compensation awards also enable us to attract and retain the services of an outstanding management team, upon which the success of our operations are largely dependent.
67
Benefits and Perquisites
We also offer to certain executives limited perquisites as a method of compensation and provide executive officers with only those perquisites that we believe are reasonable and consistent with our overall compensation program to better enable us to attract and retain superior employees for key positions. The perquisites provided to the named executive officers include vehicle allowances and superannuation and are quantified in the Summary Compensation Table below.
In accordance with the laws of Australia, AXIS pays an amount equal to 9% of a named executives base salary into superannuation. Executives have the ability to make further contributions to a superannuation fund. Furthermore, in accordance with the laws of Australia, the named executives have the ability to direct superannuation contributions to a superannuation fund of their choosing. Superannuation funds are accumulation funds and are not defined benefit funds, therefore, AXIS nor the Company has a legal obligation to the superannuation funds other than remitting contributions, which AXIS have advised have been made to superannuation funds as required by law.
Accounting and Tax Treatment
The accounting treatment of our compensation plans is not a significant factor in how we design our executive compensation plans. Section 162(m) of the Internal Revenue Code of 1986, as amended, generally denies publicly-held corporations a federal income tax deduction for compensation exceeding $1,000,000 paid to named executive officers, excluding performance-based compensation. Through December 31, 2010, we have not paid compensation to any of our named executive officers in excess of $1,000,000, excluding performance-based compensation, thus Section 162(m) has not limited our ability to deduct executive compensation, however the Compensation Committee will continue to monitor the potential impact of this provision on our ability to deduct executive compensation.
Elements of Post-Termination Compensation
The Company does not currently have a severance plan or similar agreement with any named executive officers. Under the 2006 Equity Incentive Plan, upon a merger, reorganization, or sale of the Company, the Committee may (i) provide that any or all options are exercisable in full; (ii) provide for the substitution of any or all options by a successor or purchaser Company; or (iii) make any other provision for outstanding options as the Committee deems appropriate. After the termination of service of an employee, director or consultant, (other than termination for cause) he or she may exercise his or her option for the period of time stated in the option agreement. Generally, if termination is due to death or disability, the option will remain exercisable for 12 months. In all other cases, the option will generally remain exercisable for three months following the termination of service. However, in no event may an option be exercised later than the expiration of its term. Upon a change in control, all outstanding options become fully vested and exercisable.
Stock Ownership Guidelines
The Company does not have stock ownership guidelines for its named executives; however, the Committee considers the number of options previously granted to named executives in determining whether to grant additional options and in what amounts.
Compensation Committee Report
The Compensation Committee, comprised of independent directors, reviewed and discussed the above Compensation Discussion and Analysis with the Company’s management. Based on that review and discussion, the Compensation Committee recommended to the Board of Directors that the Compensation Discussion and Analysis be included in this Annual Report on Form 10-K.
Compensation Committee:
Dr. Allan Trench
Dr. David Tyrwhitt
Mr. Henry Herzog
68
The following table sets forth the annual salary, bonuses and all other compensation awards and pay outs on account of our Chief Executive Officer, Chief Financial Officer and Secretary and Executive General Manager for services rendered to us during the fiscal years ended December 31, 2008, 2009 and 2010, and for our and Project Manager for 2009 and 2010. No other executive officer received more than US$100,000 per annum during this period.
Summary Compensation Table
|
Name
and Principal Position |
Year
|
Salary
(A$) |
Bonus (A$)
|
Stock
Awards (A$) |
Option
Awards (A$) |
Non-Equity
Incentive Plan Compensation (A$) |
Change in
Pension Value and Nonqualified Deferred Compensation Earnings (A$) |
All Other
Compensation (A$) |
Total (A$)
|
|||||||||
|
Joseph
Gutnick, Chairman of the Board, President and CEO |
2010
2009
2008
|
718,031
675,210
487,000
|
-
125,000
100,000
|
-
-
-
|
[781,801]
[776,530]
1,323,168 (i)
|
-
-
-
|
-
-
-
|
158,557
147,886
118,288
(ii)
|
876,588
948,096
2,028,456
|
|||||||||
|
Peter
Lee, CFO & Secretary |
2010
2009
2008
|
309,389
309,596
214,634
|
-
82,500
80,000
|
-
-
-
|
[67,544]
[208,412]
480,499 (i)
|
-
-
-
|
-
-
-
|
85,248
98,417
58,339
(ii)(iii)
|
394,637
490,513
833,471
|
|||||||||
|
Craig
Michael, Executive General Manager |
2010
2009
2008
|
323,750
254,377
206,518
|
-
77,500
80,000
|
-
-
-
|
[97,268]
[299,500]
699,453 (i)
|
-
-
-
|
-
-
-
|
112,710
75,170
19,362
(ii)(iii)
|
436,460
407,047
1,005,333
|
|||||||||
|
Edward
Walker, Project Manager |
2010
2009
|
275,000
240,837
|
-
75,000
|
-
-
|
[33,853]
71,351
(i)
|
-
-
|
-
-
|
27,990
40,291
(ii)(iii)
|
302,990
427,479
|
|
(i)
|
The amounts included in the table for option awards have been calculated in accordance with FASB ASC Topic 718. They relate to the value of the options that have not been exercised by the individual and accordingly no value has been realized. See Note 7 to the Company’s Consolidated Financial Statements.
|
|
(ii)
|
Includes share of superannuation contributions made by AXIS applicable to salaries charged to the Company.
|
|
(iii)
|
Includes share of cost of motor vehicle costs made by AXIS applicable to Messrs. Lee, Michael and Walker and accommodation for Mr Michael as charged to the Company.
|
The services of our Chief Executive Officer, Chief Financial Officer & Secretary, Executive General Manager and Project Manager are provided to us pursuant to a Service Agreement effective December 1, 2004 (the “Service Agreement”) by and between AXIS Consultants Pty Limited and ourselves.
Grants Of Plan-Based Awards In Fiscal 2010
There were no options granted to executive officers during fiscal 2010.
69
Outstanding Equity Awards at Fiscal Year-End
|
Option Awards
|
Stock Awards
|
|||||||||||||||||
|
Name
|
Number of
Securities Underlying Unexercised Options (#) Exercisable |
Number of
Securities Underlying Unexercised Options (#) Unexercisable |
Equity
Incentive Plan Awards: Number of Securities Underlying Unexercised Unearned Options (#) |
Option
Exercise Price ($) |
Option
Expiration Date |
Number
of Shares or Units of Stock That Have Not Vested (#) |
Market
Value of Shares or Units of Stock That Have Not Vested ($) |
Equity
Incentive Plan Awards: Number of Unearned Shares, Units or Other Rights That Have Not Been Vested (#) |
Equity
Incentive Plan Awards: Market or Payout Value of Unearned Shares, Units or Other Rights That Have Not Vested ($) |
|||||||||
|
Joseph
Gutnick, Chairman of the Board, President and CEO |
5,000,000
2,250,000
|
-
-
|
-
|
US$2.00
US$1.00
|
2/07/18
9/19/16
|
-
|
-
|
-
|
-
|
|||||||||
|
Peter
Lee, CFO and Secretary |
787,500
787,500
1,000,000
|
-
-
-
|
-
|
US$0.444
US$1.00
US$1.00
|
9/19/16
9/19/16
12/28/17
|
-
-
-
|
-
-
-
|
-
-
-
|
-
-
-
|
|||||||||
|
Craig
Michael, Executive General Manager |
150,000
150,000
1,250,000
|
-
-
-
|
-
-
-
|
US$0.444
US$1.00
US$1.00
|
9/10/17
9/10/17
12/28/17
|
-
-
-
|
-
-
-
|
-
-
-
|
-
-
-
|
|||||||||
|
Edward
Walker, Project Manager |
333,334
|
-
|
-
|
US$1.00
|
04/12/18
|
-
|
-
|
-
|
-
|
|||||||||
2006 Equity Incentive Plan
The 2006 Plan provides for the granting of options. The maximum number of shares available for awards is 10% of the issued and outstanding shares of Common Stock on issue at any time. If an option expires or is cancelled without having been fully exercised or vested, the remaining shares will generally be available for grants of other awards.
The 2006 Plan is administered by the Board comprised solely of directors who are not employees or consultants to Legend or any of its affiliated entities.
Any employee, director, officer, consultant of or to Legend or an affiliated entity (including a company that becomes an affiliated entity after the adoption of the 2006 Plan) is eligible to participate in the 2006 Plan if the Committee, in its sole discretion, determines that such person has contributed significantly or can be expected to contribute significantly to the success of Legend or an affiliated entity. During any one year period, no participant is eligible to be granted options to purchase more than 5% shares of our issued and outstanding Common Stock or if they provide investor relations activities, or are a consultant to the Company, 2% of the issued and outstanding shares of Common Stock in any 12 month period.
Options granted under the 2006 Plan are to purchase Legend Common Stock. The term of each option will be fixed by the Board, but no option will be exercisable more than 10 years after the date of grant. The option exercise price is fixed by the Board at the time the option is granted. The exercise price must be paid in cash. Options granted to participants vest and have a term of 10 years.
No award is transferable, or assignable by the participant except upon his or her death.
70
The Board may amend the 2006 Plan, except that no amendment may adversely affect the rights of a participant without the participant’s consent or be made without stockholder approval if such approval is necessary to qualify for or comply with any applicable law, rule or regulation the Board deems necessary or desirable to qualify for or comply with.
Subject to earlier termination by the Board, the 2006 Plan has an indefinite term except that no ISO may be granted following the tenth anniversary of the date the 2006 Plan is approved by stockholders.
Other than the issue of these Options, there are no other current plans or arrangements to grant any options under the 2006 Plan.
Compensation Pursuant to Plans
The Company does not have any pension or profit sharing plans. The Company does not have any employees and therefore has no superannuation obligations.
Equity Compensation Plan Information
The following table sets forth, as of December 31, 2010, information regarding options under our 2006 stock option plan, our only active plan. The 2006 stock option plan has been approved by our stockholders. Outstanding options under this plan that are forfeited or cancelled will be available for future grants. All of the options are for the purchases of our Common Stock.
|
Number of Securities to be
issued upon exercise of outstanding options, warrants and rights |
Weighted-average
exercise price of outstanding options, warrants and rights |
Number of securities remaining
available future issuance under equity compensation (excluding securities reflected in Column One) |
|
|
Equity compensation plans
approved by security holders |
22,875,000
|
A$1.32
|
2,148,950
|
|
Equity compensation plans
not approved by security holders |
-
|
-
|
-
|
Director Compensation [Were options granted in 2010? If not, they should not be in this table.]
|
Name
|
Fees
Earned or Paid in Cash (A$) |
Stock
Awards ($) |
Option
Awards ($) (i) |
Non-Equity
Incentive Plan Compensation ($) |
Change in
Pension Value and Nonqualified Deferred Compensation Earnings |
All Other
Compensation ($) |
Total (A$)
|
|||||||
|
David Tyrwhitt
|
66,000
|
-
|
-
|
-
|
-
|
66,000
|
||||||||
|
Dr US Awasthi
|
60,000
|
-
|
-
|
-
|
-
|
60,000
|
||||||||
|
Manish Gupta
|
-
|
-
|
-
|
-
|
-
|
-
|
||||||||
|
Dr Allan Trench
|
66,000
|
-
|
-
|
-
|
-
|
66,000
|
||||||||
|
Henry Herzog
|
66,000
|
-
|
-
|
-
|
-
|
66,000
|
|
(i)
|
The amounts included in the table for option awards has been calculated in accordance with FASB ASC Topic 718. They relate to the value of the options that have not been exercised by the individual and accordingly no value has been realized.
|
It is our policy to reimburse Directors for reasonable travel and lodging expenses incurred in attending Board of Directors meetings. Commencing April 1, 2008, non-executive Directors are to be paid A$60,000 per annum and fees for attendance at board committee meetings have been set at A$1,500 per meeting.
71
|
Security Ownership of Certain Beneficial Owners and Management and Related Stockholder Matters.
|
The following table sets out, to the best of our knowledge, the numbers of shares in us beneficially owned as at December 31, 2010 by:
|
(i)
|
each of our present Executive Officers and Directors,
|
|
(ii)
|
each person (including any “group” as that term is defined in Section 13(d)(3) of the Securities Exchange Act) who beneficially owns more than 5% of our Common Stock, and
|
|
(iii)
|
all of our present Directors and officers as a group.
|
|
Title of Class
|
Name
|
Number of Shares Owned
|
Percentage of Shares (1)
|
||
|
Shares of
Common Stock |
Joseph and Stera Gutnick *
|
75,926,726
|
(2)(3)(4)(5)
|
33.54
|
|
|
Shares of
Common Stock |
David Tyrwhitt *
|
666,666
|
(6)
|
**
|
|
|
Shares of Common Stock
|
U.S. Awasthi *
|
233,334
|
(7)
|
**
|
|
|
Shares of Common Stock
|
Manish Gupta
|
233,334
|
(8)
|
**
|
|
|
Shares of Common Stock
|
Allan Trench *
|
233,334
|
(9)
|
**
|
|
|
Shares of Common Stock
|
Henry Herzog *
|
1,118,274
|
(10)(11)
|
**
|
|
|
Shares of Common Stock
|
Peter Lee *
|
2,575,000
|
(12)
|
1.14
|
|
|
Shares of Common Stock
|
Craig Michael *
|
1,550,000
|
(13)
|
**
|
|
|
Shares of Common Stock
|
Edward Walker *
|
333,334
|
(14)
|
**
|
|
|
All officers and Directors
As a Group
|
82,870,002
|
36.60
|
|||
|
Shares of Common Stock
|
Attara Fund Ltd.
767 Fifth Avenue –
12th Fl.
New York, NY 10153
|
30,820,900
|
(15)
|
13.61
|
|
|
Shares of Common Stock
|
Kisan International Trading, FZE
Emaar Business Park No.2,
Office 562,
Jebel Ali
Dubai, UAE
Post Box 261835
|
34,300,464
|
(16)
|
15.1
|
|
|
Shares of Common Stock
|
Soros Fund Management LLC
888 Seventh Avenue
New York, NY 10106
|
23,431,180
|
(17)
|
10.35
|
|
|
*
|
unless otherwise indicated, the address for each person is C/- Legend International Holdings, Inc., Level 8,
580 St Kilda Road, Melbourne, Victoria 3004, Australia. |
|
**
|
less than 1%
|
Notes relating to Item 12:
|
(1)
|
Based on 226,399,674 shares outstanding as of December 31, 2010.
|
72
|
(2)
|
Includes 48,775,476 shares of Common Stock owned by Renika Pty. Ltd., of both of which Mr Joseph Gutnick, Stera M. Gutnick and members of their family are officers, Directors and principal stockholders.
|
|
(3)
|
Includes shares issuable to Mr Joseph Gutnick upon exercise of 750,000 stock options of which vested on September 19, 2007, 750,000 options which vested on September 19, 2008, 1,666,667 options which vested on February 7, 2009, 750,000 options which vested on September 19, 2009, 1,666,667 options which vested on February 7, 2010 and 1,666,666 options which vested on February 7, 2011.
|
|
(4)
|
Joseph Gutnick and Stera Gutnick are husband and wife.
|
|
(5)
|
Includes 19,901,250 shares of Common Stock owned by Chabad House of Caulfield Pty Ltd. (“Chabad House”), a private corporation that is the trustee of the Heichal Menachem Community Centre Fund, a charitable organization. Joseph Gutnick and Stera Gutnick are directors of Chabad House but disclaim any beneficial interest in the shares of Common Stock owned by Chabad House.
|
|
(6)
|
Include shares issuable to Mr. Tyrwhitt upon exercise of stock options which vested on July 21, 2009 and 333,333 options which vested on July 21, 2010. Does not include shares issuable upon exercise of 333,334 options which vest on July 21, 2011.
|
|
(7)
|
Includes shares issuable to Dr. Awasthi upon exercise of 116,667 stock options which vested on December 4, 2009 and 116,667 options which vested on December 4, 2010. Does not include shares issuable upon exercise of 116,666 options which vest on December 4, 2011.
|
|
(8)
|
Includes shares issuable to Mr. Gupta upon exercise of 116,667 stock options which vested on December 4, 2009 and 116,667 options which vested on December 4, 2010. Does not include shares issuable upon exercise of 116,666 options which vest on December 4, 2011.
|
|
(9)
|
Includes shares issuable to Dr. Trench upon exercise of stock 116,667 options which vested on August 11, 2009 and 116,667 options which vested on August 11, 2010. Does not include shares issuable upon exercise of 116,666 options which vest on August 11, 2011.
|
|
(10)
|
Includes 884,940 shares of Common Stock owned by Riccalo Pty. Ltd., of which Mr Henry Herzog and members of his family are officers, Directors and principal stockholders.
|
|
(11)
|
Includes shares issuable to Mr. Herzog upon exercise of 116,667 stock options which vested on December 4, 2009 and 116,667 options which vested on December 4, 2010. Does not include shares issuable upon exercise of 116,666 options which vest on December 4, 2011.
|
|
(12)
|
Includes shares issuable to Mr. Peter Lee upon exercise of 525,000 stock options of which vested on September 19, 2007, 525,000 options which vested on September 19, 2008, 333,333 options which vested on December 28, 2008, 333,333 options which vested on December 28, 2009, 525,000 options which vested on September 19, 2009 and 333,334 options which vested on December 28, 2010.
|
|
(13)
|
Includes shares issuable to Mr. Craig Michael upon exercise of 100,000 stock options of which vested on September 10, 2008, 416,666 options which vested on December 28, 2008, 100,000 options which vested on September 10, 2009, 416,667 options which vested on December 28, 2009, 100,000 options which vested on September 10, 2010 and 416,667 options which vested on December 28, 2010.
|
|
(14)
|
Includes shares issuable to Mr. Walker upon exercise of 166,667 stock options which vested on December 4, 2009 and166,667 options which vested on December 4, 2010. Does not include 166,666 shares issuable upon exercise of options which vest on December 4, 2011.
|
73
|
(15)
|
In accordance with a Schedule 13G dated December 3, 2009, Attara Capital L.P. and Mr. David Slager may be deemed to be beneficial owners of the shares of Common Stock.
|
|
(16)
|
Includes 34,300,464 shares of common stock owned by Kisan International Trading, FZE, a subsidiary of Indian Farmers Fertilizer Cooperative Limited (“IFFCO”).
|
|
(17)
|
Based upon a Schedule 13G/A filed with the SEC on February 16, 2010: Represents Shares held for the account of Quantum Partners LDC, a Cayman Islands exempted limited duration company (“Quantum Partners”) Quantum EMEA Fund Ltd., a Cayman Islands exempted limited liability company (“Quantum EMEA”), and RS Capital Partners Ltd., a Cayman Islands exempted limited liability company (“RE Capital”). Soros Fund Management LLC (“SFM LLC”) serves as principal investment manager to Quantum Partners, Quantum EMEA, and RS Capital. As such, SFM LLC has been granted investment discretion over portfolio investments, including the Shares, held for the account of Quantum Partners, Quantum EMEA, and RS Capital. George Soros serves as Chairman of SFM LLC, Robert Soros serves as Deputy Chairman of SFM LLC, and Jonathan Soros serves as President and Deputy Chairman of SFM LLC.
|
|
Certain Relationships and Related Transactions, and Director Independence.
|
In December 2004, the Company entered into an agreement with AXIS Consultants Pty Ltd to provide geological, management and administration services to the Company. AXIS is affiliated through common management and is incorporated in Australia. AXIS’ principal business is to provide geological, management and administration services to companies. We are one of ten affiliated companies that AXIS provides services to, namely, Legend, Quantum Resources Limited, North Australian Diamonds Ltd, Top End Uranium Ltd, Northern Capital Resources Corp, Golden River Resources Corp, Great Central Resources Corp. (formerly Yahalom International Resources Corp), Aurum Inc, Electrum International Inc., Acadian Mining Corporation. Each of the companies has some common Directors, officers and shareholders. In addition, each of the companies is substantially dependent upon AXIS for its senior management and certain mining and exploration staff. A number of arrangements and transactions have been entered into from time to time between such companies. It has been the intention of the affiliated companies and respective Boards of Directors that each of such arrangements or transactions should accommodate the respective interest of the relevant affiliated companies in a manner which is fair to all parties and equitable to the shareholders of each. Currently, there are no material arrangements or planned transactions between the Company and any of the other affiliated companies other than AXIS.
Legend holds a 9.09% interest in AXIS at a cost of A$1 and which is accounted for under the cost method and any profits generated by AXIS are returned to its shareholders in the form of dividends.
AXIS is paid by each company it manages for the costs incurred by it in carrying out the administration function for each such company. Pursuant to the Service Agreement, AXIS performs such functions as payroll, maintaining employee records required by law and by usual accounting procedures, providing insurance, legal, human resources, company secretarial, land management, certain exploration and mining support, financial, accounting advice and services. AXIS procures items of equipment necessary in the conduct of the business of the Company. AXIS also provides for the Company various services, including but not limited to the making available of office supplies, office facilities and any other services as may be required from time to time by the Company as and when requested by the Company.
74
We are required to reimburse AXIS for any direct costs incurred by AXIS for the Company. In addition, we are required to pay a proportion of AXIS’s overhead cost based on AXIS’s management estimate of our utilization of the facilities and activities of AXIS plus a service fee of not more than 15% of the direct and overhead costs. Amounts invoiced by AXIS are required to be paid by us. We are also not permitted to obtain from sources other than AXIS, and we are not permitted to perform or provide ourselves, the services contemplated by the Service Agreement, unless we first requests AXIS to provide the service and AXIS fails to provide the service within one month.
The Service Agreement may be terminated by AXIS or us upon 60 days prior notice. If the Service Agreement is terminated by AXIS, we would be required to independently provide, or to seek an alternative source of providing, the services currently provided by AXIS. There can be no assurance that we could independently provide or find a third party to provide these services on a cost-effective basis or that any transition from receiving services under the Service Agreement will not have a material adverse effect on us. Our inability to provide such services or to find a third party to provide such services may have a material adverse effect on our operations.
In accordance with the Service Agreement AXIS provides the Company with the services of our Chief Executive Officer, Chief Financial Officer, geologists and clerical employees, as well as office facilities, equipment, administrative and clerical services. We pay AXIS for the actual costs of such facilities plus a maximum service fee of 15%.
During 2010, AXIS charged the Company A$7,003,453 in management fees including salaries incurred in relation to AXIS staff that provided services to the Company, A$7,598,615 for exploration services provided to the Company, interest of A$174,011, and provided advances of A$17,318,036. AXIS charged interest at a rate between 10.05% and 11.19% for 2009. The amount due from AXIS at December 31, 2009 was A$2,818,609, and is included in non-current assets – advances to affiliates.
The Company appointed Mr Mordechai Gutnick, as the Company’s General Manager, Business in December, 2007. Mr Gutnick is the son of Joseph Gutnick, the Company’s President and Chairman of the Board. Mr Mordechai Gutnick receives an annual salary paid via AXIS. In addition, in December, 2007, Mr Mordechai Gutnick was granted 2,000,000 stock options.
During the 2010 year, the Company increased it investment in North Australian Diamonds Ltd (“NADL”) through on-market purchases on the Australian Securities Exchange. At December 31, 2010, the Company held 50.40% of the issued shares of NADL. The Company’s President and Chief Executive Officer, Executive General Manager and one of its independent Directors are Executive Chairman and Managing Director, and Directors respectively of NADL. In addition, the Company’s President is a director and officer of Great Central Resources Corporation (“GCRC”). During Legend’s takeover bid for NADL in 2009, GCRC tendered 378,275,603 NADL shares to the Company for which it received A$3,058,660, or A$0.008 per share, which represented its cost of purchase for the NADL shares and was less than the A$0.015 per share purchase price paid to the non-affiliated shareholders of NADL. All of the shares in GCRC are held in trust by Northern Raizel Pty Ltd., as trustee of a family trust for the benefit of members of the Company’s President’s family. The Company’s President is a director and a stockholder of Northern Raizel. The Company’s President did not take part in any material decision made by either the Company or NADL relating to the Offer and/or the Takeover Bid.
During the 2009 year, the Company and NADL entered into a camp access agreement and airfield access agreement relating to the Merlin camp and airstrip to allow the Company to utilize these facilities. During the 2010 year, under the camp access agreement, the Company paid NADL A$322,184 for accommodation, meals and fuel and the Company paid NADL A$205,205 for costs incurred on behalf of Legend. NADL paid the Company A$505,648 for costs incurred on behalf of NADL. At December 31, 2010, the Company owes NADL A$24,896 under the agreement.
75
During the 2010 year, the Company took additional private placements of shares of common stock in Northern Capital Resources Corp (“NCRC”). At December 31, 2010, the Company held 31.46% of the shares of NCRC. The Company’s President and Chief Executive Officer and one of its independent Directors (Dr Tyrwhitt) are President and Chief Executive Officer and Director respectively of NCRC and certain companies with which the Company’s President is affiliated own approximately 39.85% of the outstanding shares of NCRC. The amount due from NCRC at December 31, 2010 was A$220,877 and is included under non-current assets – advances to affiliates.
Transactions with Management.
We have a written policy that we will not enter into any transaction with an Officer, Director or affiliate of us or any member of their families unless the transaction is approved by a majority of our disinterested non-employee Directors and the disinterested majority determines that the terms of the transaction are no less favourable to us than the terms available from non-affiliated third parties or are otherwise deemed to be fair to us at the time authorized.
|
Principal Accounting Fees and Services.
|
The following table shows the fees incurred for fiscal 2010 and 2009.
| 2010 A$ |
2009 A$ |
|||||||
|
Audit fees
|
212,325 | 220,199 | ||||||
|
Tax fees
|
33,054 | 35,102 | ||||||
|
Total
|
245,379 | 255,301 |
Audit fees were for the audit of our annual financial statements, review of financial statements included in our 10-Q quarterly reports, and services that are normally provided by independent auditors in connection with our other filings with the SEC. This category also includes advice on accounting matters that arose during, or as a result of, the audit or review of our interim financial statements.
Tax fees relate to the preparation of the Company’s tax returns and various tax planning and compliance related filings.
As part of its duties, our Audit Committee pre-approves audit and non-audit services performed by our independent auditors in order to assure that the provision of such services does not impair the auditors’ independence. Our Audit Committee does not delegate to management its responsibilities to pre-approve services performed by our independent auditors.
76
|
Exhibits, Financial Statement Schedules.
|
Documents filed as part of the report.
|
(1)
|
All Financial Statements
|
|
|
Page
|
||
|
Report of Independent Registered Public Accounting Firm
|
F-1
|
|
|
Consolidated Balance Sheet
|
F-2
|
|
|
Consolidated Statements of Operations
|
F-3
|
|
|
Consolidated Statements of Stockholders’ Equity (Deficit)
|
F-4
|
|
|
Consolidated Statements of Cash Flows
|
F-7
|
|
|
Notes to Consolidated Financial Statements
|
F-8 - F-24
|
|
|
(2)
|
Financial Statements Schedule
|
|
|
All other schedules have been omitted because they are not applicable or not required, or because the required information is shown in the consolidated financial statements or notes thereto.
|
||
|
(3)
|
Exhibits
|
|
See Index to Exhibits at page 70 for a description of the exhibits filed as a part of this report.
77
Pursuant to the requirements of Section 13 or 15(d) of the Securities Exchange Act of 1934, the Registrant has caused this Annual Report to be signed on its behalf by the undersigned, thereunto duly authorised.
|
LEGEND INTERNATIONAL HOLDINGS, INC.
|
|||
|
(Registrant)
|
|||
|
/s/ Peter Lee
|
|||
|
By:
|
|||
|
Peter J Lee
|
|||
|
Chief Financial Officer and Secretary
|
|||
|
Dated: March 15, 2011
|
|||
78
FORM 10-K Signature Page
Pursuant to the requirements of the Securities Exchange Act of 1934, this Report has been signed below by the following persons in the capacities and on the dates indicated.
|
Signature
|
Title
|
Date
|
||
|
/s/ Joseph Gutnick
|
||||
|
1.
|
Chairman of the Board,
|
|||
|
Joseph Gutnick
|
President and Chief Executive
|
|||
|
Officer (Principal Executive
|
||||
|
Officer) and Director
|
March 15, 2011
|
|||
|
/s/ David Tyrwhitt
|
||||
|
2.
|
Director
|
March 15, 2011
|
||
|
David Tyrwhitt
|
||||
|
/s/ Peter Lee
|
||||
|
3.
|
Chief Financial Officer and
|
|||
|
Peter Lee
|
Secretary (Principal Financial
|
|||
|
and Accounting Officer)
|
March 15, 2011
|
|||
|
/s/ U S Awasthi
|
||||
|
4.
|
Director
|
March 15, 2011
|
||
|
U S Awasthi
|
||||
|
/s/ Manish Gupta
|
||||
|
5.
|
Director
|
March 15, 2011
|
||
|
Manish Gupta
|
||||
|
/s/ Allan Trench
|
||||
|
6.
|
Director
|
March 15, 2011
|
||
|
Allan Trench
|
||||
|
/s/ Henry Herzog
|
||||
|
7.
|
Director
|
March 15, 2011
|
||
|
Henry Herzog
|
||||
79
EXHIBIT INDEX
Incorporated by
Reference to:
|
Exhibit No.
|
Exhibit
|
|
1.1
|
Subscription Agreement (1)
|
|
3.1
|
Certificate of Incorporation (1)
|
|
3.2
|
Amended Certificate of Incorporation (2)
|
|
3.3
|
Bylaws (1)
|
|
3.4
|
Specimen Stock Certificate (1)
|
|
3.5
|
Amendment to Certificate of Incorporation (6)
|
|
10.1
|
2006 Incentive Option Plan (3)
|
|
10.2
|
Contract for the Sale of Mining Tenements (4)
|
|
10.3
|
Subscription Agreement dated as of December 12, 2007 (6)
|
|
10.4
|
Agreement with Iron Duyfken Pty Limited dated November 2, 2007 (7)
|
|
10.5
|
Agreement with Ansett Resources & Industries Pty Ltd. dated November 7, 2007 (7)
|
|
10.6
|
Agreement with King Eagle Resources Pty Limited dated December 7, 2007 (8)
|
|
10.7
|
Form of Subscription Agreement for BMO Offering (9)
|
|
10.8
|
Agency Agreement dated as of June 3, 2008 (9)
|
|
10.9
|
Registration Rights Agreement dated as of June 3, 2008 (9)
|
|
10.10
|
Form of Broker Warrant (9)
|
|
10.11
|
Share Options agreement dated July 14, 2008 with Indian Farmers Fertilizer Cooperative Limited (IFFCO)(10)
|
|
10.12
|
Service Agreement with AXIS Consultants Pty Ltd dated February 25, 2005 (11)
|
|
21.1
|
Subsidiaries of the Registrant (5)
|
|
31.1
|
Certification Pursuant to 18 U.S.C. Section 1350, as Adopted Pursuant to Section 302 of the Sarbanes-Oxley Act of 2002 by Joseph Isaac Gutnick (5)
|
|
31.2
|
Certification of Pursuant to 18 U.S.C. Section 1350, as Adopted Pursuant to Section 302 of the Sarbanes-Oxley Act of 2002 by Peter James Lee (5)
|
|
32.1
|
Certification of Pursuant to 18 U.S.C. Section 1350, as Adopted Pursuant to Section 906 of the Sarbanes-Oxley Act of 2002 by Joseph Isaac Gutnick (5)
|
|
32.2
|
Certification Pursuant to 18 U.S.C. Section 1350, as Adopted Pursuant to Section 906 of the Sarbanes-Oxley Act of 2002 by Peter James Lee (5)
|
Footnotes:
|
(1)
|
Incorporated herein by reference to the Company’s Registration Statement on Form SB-2, filed on February 2, 2001, File No. 333-55116, and the amendments thereto.
|
|
(2)
|
Incorporated herein by reference to the Company’s current report on Form 8-K filed on March 21, 2003.
|
|
(3)
|
Incorporated herein by reference to the Appendix to the Company’s Proxy Statement filed on October 19, 2006.
|
80
|
(4)
|
Incorporated by reference to the Company’s current report on Form 8-K filed on March 10, 2006.
|
|
(5)
|
Filed herewith
|
|
(6)
|
Incorporated herein by reference to the Company’s Form 10-K filed on March 17, 2008
|
|
(7)
|
Incorporated herein by reference to the Company’s Current Report on Form 8-K filed on December 28, 2007.
|
|
(8)
|
Incorporated herein by reference to the Company’s Current Report on Form 8-K filed on December 28, 2007.
|
|
(9)
|
Incorporated herein by reference to the Company’s Post Effective Amendment No 1 Registration Statement on Form S-1 filed on July 18, 2008 (SEC File No. 333-145082).
|
|
(10)
|
Incorporated herein by reference to the Company’s current Report on Form 8-K filed on July 16, 2008.
|
|
(11)
|
Incorporated herein by reference to the Company’s Current Report on Form 8-K filed on March 8, 2005.
|
Consolidated Financial Statements for the years ended December 31, 2010 and 2009.
Legend International Holdings, Inc.
Audited Consolidated Financial Statements for the Company for the years ended December 31, 2010 and 2009.
81
LEGEND INTERNATIONAL HOLDINGS, INC.
(An Exploration Stage Company)
Consolidated Financial Statements
December 31, 2010 and 2009
(with Report of Independent Registered Public Accounting Firm)
CONTENTS
|
Page
|
|
|
Report of Independent Registered Public Accounting Firm
|
F-1
|
|
Consolidated Balance Sheet
|
F-2
|
|
Consolidated Statements of Operations
|
F-3
|
|
Consolidated Statements of Stockholders’ Equity (Deficit)
|
F-4
|
|
Consolidated Statements of Cash Flows
|
F-7
|
|
Notes to Consolidated Financial Statements
|
F-8– F-24
|
Report of Independent Registered Public Accounting Firm
To the Board of Directors and Stockholders of
Legend International Holdings, Inc
We have audited the accompanying consolidated balance sheet of Legend International Holdings, Inc (An Exploration Stage Company) as of December 31, 2010 and 2009, and the related consolidated statements of operations, stockholders’ equity (deficit) and cash flows for the years ended December 31, 2008, 2009 and 2010 and the cumulative amounts from inception, January 5, 2001 through December 31, 2010. These financial statements are the responsibility of the Company’s management. Our responsibility is to express an opinion on these financial statements based on our audits.
We conducted our audits in accordance with standards of the Public Company Accounting Oversight Board (United States). Those standards require that we plan and perform the audit to obtain reasonable assurance about whether the financial statements are free of material misstatement. An audit includes examining, on a test basis, evidence supporting the amounts and disclosures in the financial statements. An audit also includes assessing the accounting principles used and significant estimates made by management, as well as evaluating the overall financial statement presentation. We believe that our audits provide a reasonable basis for our opinion.
In our opinion, the financial statements referred to above present fairly, in all material respects, the financial position of Legend International Holdings, Inc. (an Exploration Stage Company) at December 31, 2010 and 2009, and the results of its operations and its cash flows for the periods indicated above in conformity with accounting principles generally accepted in the United States of America.
We also have audited, in accordance with the standards of the Public Company Accounting Oversight Board (United States), the Company’s internal control over financial reporting as of December 31, 2010 based on criteria established in Internal Control-Integrated Framework issued by the Committee of Sponsoring Organizations of the Treadway Commission and our report dated March 14, 2011 expressed an unqualified opinion thereon.
New York, NY /s/ PKF LLP
March 14, 2011
F-1
LEGEND INTERNATIONAL HOLDINGS, INC.
(An Exploration Stage Company)
Consolidated Balance Sheet
December 31, 2010
| 2010A$ | 2009A$ |
Convenience
Translation
2010
US$
|
||||||||||
|
ASSETS
|
||||||||||||
|
Current Assets:
|
||||||||||||
|
Cash
|
25,165,910 | 72,666,088 | 25,576,114 | |||||||||
|
Receivables
|
1,164,854 | 1,148,567 | 1,183,841 | |||||||||
|
Prepayments
|
913,035 | 644,033 | 927,917 | |||||||||
|
Inventories
|
109,978 | 254,544 | 111,771 | |||||||||
|
Other investments (note 10)
|
2,784,477 | - | 2,829,865 | |||||||||
|
Marketable securities (note 10)
|
263,741 | - | 268,040 | |||||||||
|
Total Current Assets
|
30,401,995 | 74,713,232 | 30,897,548 | |||||||||
|
Non-Current Assets:
|
||||||||||||
|
Property and equipment, net (note 3)
|
13,832,017 | 8,473,654 | 14,057,479 | |||||||||
|
Investment in unconsolidated entities (note 6)
|
13,569,731 | 10,409,693 | 13,790,918 | |||||||||
|
Other investments
|
200,000 | 2,928,294 | 203,260 | |||||||||
|
Deposits (note 5)
|
1,176,468 | 2,659,494 | 1,195,644 | |||||||||
|
Advances to affiliates (note 11)
|
3,039,486 | 1,243,172 | 3,089,030 | |||||||||
|
Prepayments
|
36,850 | 622,272 | 37,450 | |||||||||
|
Mineral Rights (note 13)
|
16,891,787 | 18,290,290 | 17,167,123 | |||||||||
|
Goodwill (note 12)
|
1,092,950 | 1,092,950 | 1,110,765 | |||||||||
|
Total Non-Current Assets
|
49,839,289 | 45,719,819 | 50,651,669 | |||||||||
|
Total Assets
|
80,241,284 | 120,433,051 | 81,549,217 | |||||||||
|
LIABILITIES
|
||||||||||||
|
Current Liabilities:
|
||||||||||||
|
Accounts payable and accrued expenses
|
2,133,651 | 4,086,609 | 2,168,430 | |||||||||
|
Current portion of long-term debt (note 14)
|
224,078 | - | 227,730 | |||||||||
|
Lease liability (note 9)
|
455,012 | 213,550 | 462,429 | |||||||||
|
Total Current Liabilities
|
2,812,741 | 4,300,159 | 2,858,589 | |||||||||
|
Non Current Liabilities:
|
||||||||||||
|
Reclamation and remediation provision (note 8)
|
926,127 | 935,558 | 941,223 | |||||||||
|
Long-term debt (note 14)
|
2,611,404 | - | 2,653,970 | |||||||||
|
Lease liability (note 9)
|
254,138 | 297,914 | 258,280 | |||||||||
|
Total Non Current Liabilities
|
3,791,669 | 1,233,472 | 3,853,473 | |||||||||
|
Total Liabilities
|
6,604,410 | 5,533,631 | 6,712,062 | |||||||||
|
Commitments and Contingencies (Note 16)
|
||||||||||||
|
Stockholders’ Equity
|
||||||||||||
|
Common stock: US$.001 par value, 300,000,000 shares authorised
|
||||||||||||
|
226,399,674 and 226,333,392 shares issued and outstanding
|
275,178 | 275,101 | 279,663 | |||||||||
|
Additional paid-in-capital
|
163,808,290 | 163,765,820 | 166,478,365 | |||||||||
|
Accumulated other comprehensive loss
|
(1,925,922 | ) | (388,529 | ) | (1,957,314 | ) | ||||||
|
Retained deficit prior to exploration activities
|
(839,463 | ) | (839,463 | ) | (853,146 | ) | ||||||
|
Retained deficit during exploration period
|
(101,591,085 | ) | (65,262,031 | ) | (103,247,020 | ) | ||||||
|
Legend Stockholders’ Equity
|
59,726,998 | 97,550,898 | 60,700,548 | |||||||||
|
Non-controlling interests
|
13,909,876 | 17,348,522 | 14,136,607 | |||||||||
|
Total Equity
|
73,636,874 | 114,899,420 | 74,837,155 | |||||||||
|
Total Liabilities and Equity
|
80,241,284 | 120,433,051 | 81,549,217 | |||||||||
The accompanying notes are integral part of the consolidated financial statements.
F-2
LEGEND INTERNATIONAL HOLDINGS, INC.
(An Exploration Stage Company)
Consolidated Statements of Operations
|
For the years Ended
December 31, 2010
|
Convenience
Translation
|
January 5, 2001
(Inception) to December 31, |
||||||||||||||||||
| 2008 A$ |
2009 A$ |
2010 A$ |
2010
US$
|
2010 A$ |
||||||||||||||||
|
Revenues:
|
||||||||||||||||||||
|
Sales
|
- | - | - | - | 6,353 | |||||||||||||||
|
less cost of sales
|
- | - | - | - | (1,362 | ) | ||||||||||||||
|
Gross profit
|
- | - | - | - | 4,991 | |||||||||||||||
|
Other income
|
||||||||||||||||||||
|
Interest income – related entity
|
49,931 | 81,503 | 174,011 | 176,847 | 305,445 | |||||||||||||||
|
Interest income – other
|
3,669,440 | 3,338,315 | 2,081,829 | 2,115,763 | 9,115,642 | |||||||||||||||
|
Other
|
6,534 | 403,266 | 682,048 | 693,165 | 1,091,848 | |||||||||||||||
|
Total Other income
|
3,725,905 | 3,823,084 | 2,937,888 | 2,985,775 | 10,512,935 | |||||||||||||||
|
Costs and expenses:
|
||||||||||||||||||||
|
Legal, professional and accounting
|
707,444 | 880,851 | 898,437 | 913,082 | 2,835,192 | |||||||||||||||
|
Exploration expenditure
|
8,780,037 | 25,608,743 | 25,705,125 | 26,124,119 | 69,037,290 | |||||||||||||||
|
Aircraft maintenance
|
278,826 | 1,014,986 | 587,163 | 596,734 | 1,880,975 | |||||||||||||||
|
Stock based compensation
|
5,185,743 | 4,259,903 | 1,727,922 | 1,756,087 | 12,320,465 | |||||||||||||||
|
Interest expense
|
32,715 | 64,831 | 61,326 | 62,325 | 271,003 | |||||||||||||||
|
Impairment of investment
|
326,526 | - | - | - | 326,526 | |||||||||||||||
|
Amortization of mineral rights
|
- | 582,710 | 1,398,502 | 1,421,297 | 1,981,212 | |||||||||||||||
|
Administration expenses
|
8,096,798 | 8,217,286 | 10,398,897 | 10,568,399 | 30,026,625 | |||||||||||||||
|
Total costs and expenses
|
(23,408,089 | ) | (40,629,310 | ) | (40,777,372 | ) | (41,442,043 | ) | (118,679,288 | ) | ||||||||||
|
(Loss) from operations
|
(19,682,184 | ) | (36,806,226 | ) | (37,839,484 | ) | (38,456,268 | ) | (108,161,362 | ) | ||||||||||
|
Adjustment to fair value on stepped acquisition
|
- | 2,200,620 | - | - | 2,200,620 | |||||||||||||||
|
Writeoff/writedown of assets
|
- | - | (244,924 | ) | (248,916 | ) | (244,924 | ) | ||||||||||||
|
Unrealised gain on marketable securities
|
70,874 | 113,739 | 66,891 | 67,981 | 251,504 | |||||||||||||||
|
Foreign currency exchange gain/(loss)
|
5,389,750 | (4,661,096 | ) | (674,496 | ) | (685,490 | ) | (106,237 | ) | |||||||||||
|
(Loss) before income taxes and equity in losses of unconsolidated entities
|
(14,221,560 | ) | (39,152,963 | ) | (38,692,013 | ) | (39,322,693 | ) | (106,060,399 | ) | ||||||||||
|
Provision for income taxes
|
- | - | - | - | - | |||||||||||||||
|
(Loss) before equity in losses of unconsolidated entities
|
(14,221,560 | ) | (39,152,963 | ) | (38,692,013 | ) | (39,322,693 | ) | (106,060,399 | ) | ||||||||||
|
Equity in losses of unconsolidated entities (note 6)
|
- | (345,707 | ) | (1,440,407 | ) | (1,463,885 | ) | (1,786,114 | ) | |||||||||||
|
Net (loss)
|
(14,221,560 | ) | (39,498,670 | ) | (40,132,420 | ) | (40,786,578 | ) | (107,846,513 | ) | ||||||||||
|
Net (loss) attributable to non-controlling interests
|
- | 1,612,599 | 3,803,366 | 3,865,361 | 5,415,965 | |||||||||||||||
|
Net (loss) attributable to Legend stockholders
|
(14,221,560 | ) | (37,886,071 | ) | (36,329,054 | ) | (36,921,217 | ) | (102,430,548 | ) | ||||||||||
|
Basic and diluted loss per common shares
|
(0.07 | ) | (0.17 | ) | (0.16 | ) | (0.16 | ) | (1.06 | ) | ||||||||||
|
Weighted average number of common shares used in per share calculations
|
204,500,520 | 226,327,933 | 226,379,880 | 226,379,880 | 96,881,995 | |||||||||||||||
The accompanying notes are integral part of the consolidated financial statements.
F-3
LEGEND INTERNATIONAL HOLDINGS, INC.
(An Exploration Stage Company)
Consolidated Statements of Stockholders' Equity (Deficit)
for the period ended December 31, 2010
|
Common Stock
|
||||||||||||||||||||||||||||||||
|
Shares
|
Par Value
A$
|
Additional
Paid-In
Capital A$
|
Retained
(Deficit) During the Exploration Period A$
|
Retained
(Deficit) Prior to Exploration Activities A$
|
Accumulated
Other Comprehensive Income (Loss) A$
|
Non-
Controlling Interests A$
|
Stockholders’
Equity (Deficit) A$
|
|||||||||||||||||||||||||
|
Balance, January 5, 2001
|
- | - | - | - | - | - | - | - | ||||||||||||||||||||||||
|
Shares issued to founder for organisation cost and services at US$0.05 per shares
|
4,297,500 | 5,550 | 118,896 | - | - | - | - | 124,446 | ||||||||||||||||||||||||
|
Shares issued for services rendered at US$0.05 per share
|
146,250 | 189 | 4,046 | - | - | - | - | 4,235 | ||||||||||||||||||||||||
|
Shares issued for cash
|
616,500 | 796 | 17,056 | - | - | - | - | 17,852 | ||||||||||||||||||||||||
|
Net Loss
|
- | - | - | - | (131,421 | ) | - | - | (131,421 | ) | ||||||||||||||||||||||
|
Balance, December 31, 2001
|
5,060,250 | 6,535 | 139,998 | - | (131,421 | ) | - | - | 15,112 | |||||||||||||||||||||||
|
Shares issued for cash
|
225,000 | 291 | 6,225 | - | - | - | - | 6,516 | ||||||||||||||||||||||||
|
Shares issued for officer’s compensation
|
11,250,000 | 14,529 | 148,359 | - | - | - | - | 162,888 | ||||||||||||||||||||||||
|
Net Loss
|
- | - | - | - | (182,635 | ) | - | - | (182,635 | ) | ||||||||||||||||||||||
|
Balance, December 31, 2002
|
16,535,250 | 21,355 | 294,582 | - | (314,056 | ) | - | - | 1,881 | |||||||||||||||||||||||
|
Shares issued for services rendered at US$0.022 per share
|
5,026,500 | 6,491 | 139,065 | - | - | - | - | 145,556 | ||||||||||||||||||||||||
|
Net Loss
|
- | - | - | - | (156,965 | ) | - | - | (156,965 | ) | ||||||||||||||||||||||
|
Balance, December 31, 2003
|
21,561,750 | 27,846 | 433,647 | - | (471,021 | ) | - | - | (9,528 | ) | ||||||||||||||||||||||
|
Shares issued for services rendered at US$0.022 per share
|
2,004,750 | 2,589 | 55,464 | - | - | - | - | 58,053 | ||||||||||||||||||||||||
|
Options issued for services
|
- | - | 160,672 | - | - | - | - | 160,672 | ||||||||||||||||||||||||
|
Loan forgiveness-former major shareholder
|
- | - | 12,144 | - | - | - | - | 12,144 | ||||||||||||||||||||||||
|
Net Loss
|
- | - | - | - | (234,611 | ) | - | - | (234,611 | ) | ||||||||||||||||||||||
|
Balance, December 31, 2004
|
23,566,500 | 30,435 | 661,927 | - | (705,632 | ) | - | - | (13,270 | ) | ||||||||||||||||||||||
|
Shares issued on cashless exercise of options
|
17,085,938 | 22,066 | (22,066 | ) | - | - | - | - | - | |||||||||||||||||||||||
|
Net Loss
|
- | - | - | - | (75,508 | ) | - | - | (75,508 | ) | ||||||||||||||||||||||
|
Balance, December 31, 2005
|
40,652,438 | 52,501 | 639,861 | - | (781,140 | ) | - | - | (88,778 | ) | ||||||||||||||||||||||
|
Share issued on cashless exercise of options
|
72,281,329 | 93,336 | (93,336 | ) | - | - | - | - | - | |||||||||||||||||||||||
|
Shares and options issued under settlement agreement
|
112,500 | 144 | 35,272 | - | - | - | - | 35,416 | ||||||||||||||||||||||||
|
Shares issued for cash
|
12,756,734 | 16,524 | 3,854,843 | - | - | - | - | 3,871,367 | ||||||||||||||||||||||||
|
Cost of share issues
|
- | - | (128,376 | ) | - | - | - | - | (128,376 | ) | ||||||||||||||||||||||
|
Amortisation of options under stock option plan
|
- | - | 115,307 | - | - | - | - | 115,307 | ||||||||||||||||||||||||
|
Net unrealized gain on foreign exchange translation
|
- | - | - | - | - | 38,490 | - | 38,490 | ||||||||||||||||||||||||
|
Net Loss
|
- | - | - | (4,516,271 | ) | (58,323 | ) | - | - | (4,574,594 | ) | |||||||||||||||||||||
|
Balance, December 31, 2006
|
125,803,001 | 162,505 | 4,423,571 | (4,516,271 | ) | (839,463 | ) | 38,490 | - | (731,168 | ) | |||||||||||||||||||||
F-4
LEGEND INTERNATIONAL HOLDINGS, INC.
(An Exploration Stage Company)
Consolidated Statements of Stockholders' Equity (Deficit)
for the period ended December 31, 2010
(continued)
|
Common Stock
|
||||||||||||||||||||||||||||||||
|
Shares
|
Par Value
A$
|
Additional
Paid-In Capital A$
|
Retained
(Deficit) During the Exploration Period A$
|
Retained
(Deficit) Prior to Exploration Activities A$
|
Accumulated
Other Comprehensive Income (Loss) A$
|
Non-
Controlling Interests A$
|
Stockholders’
Equity (Deficit) A$
|
|||||||||||||||||||||||||
|
Shares issued for cash
|
47,686,624 | 56,438 | 25,684,666 | - | - | - | - | 25,741,104 | ||||||||||||||||||||||||
|
Cost of share issues
|
- | - | (1,675,111 | ) | - | - | - | - | (1,675,111 | ) | ||||||||||||||||||||||
|
Shares issued for consulting fees
|
2,604,200 | 2,984 | 1,001,122 | - | - | - | - | 1,004,106 | ||||||||||||||||||||||||
|
Shares issued on cashless exercise of options
|
75,000 | 85 | (85 | ) | - | - | - | - | - | |||||||||||||||||||||||
|
Shares issued as a result of delay in lodgement of registration statement
|
200,000 | 230 | 364,575 | - | - | - | - | 364,805 | ||||||||||||||||||||||||
|
Shares issued for part-settlement of the acquisition of rights to exploration licences under agreement
|
500,000 | 545 | 517,455 | - | - | - | - | 518,000 | ||||||||||||||||||||||||
|
Amortization of options under stock option plan
|
- | - | 375,740 | - | - | - | - | 375,740 | ||||||||||||||||||||||||
|
Net Loss
|
- | - | - | (8,638,129 | ) | - | - | - | (8,638,129 | ) | ||||||||||||||||||||||
|
Balance, December 31, 2007
|
176,868,825 | 222,787 | 30,691,933 | (13,154,400 | ) | (839,463 | ) | 38,490 | - | 16,959,347 | ||||||||||||||||||||||
|
Shares issued for cash
|
42,000,000 | 44,011 | 109,984,282 | - | - | - | - | 110,028,293 | ||||||||||||||||||||||||
|
Cost of share issues
|
- | (5,964,346 | ) | - | - | - | - | (5,964,346 | ) | |||||||||||||||||||||||
|
Shares issued on cashless exercise of options
|
1,522,358 | 1,701 | (1,701 | ) | - | - | - | - | - | |||||||||||||||||||||||
|
Shares issued on exercise of options
|
5,435,600 | 5,999 | 13,717,586 | - | - | - | - | 13,723,585 | ||||||||||||||||||||||||
|
Shares issued for consulting fees
|
30,800 | 33 | 147,555 | - | - | - | - | 147,588 | ||||||||||||||||||||||||
|
Shares issued under registration rights agreement
|
457,809 | 545 | 899,950 | - | - | - | - | 900,495 | ||||||||||||||||||||||||
|
Amortization of options under stock option plan
|
- | - | 5,185,743 | - | - | - | - | 5,185,743 | ||||||||||||||||||||||||
|
Net Loss
|
- | - | - | (14,221,560 | ) | - | - | - | (14,221,560 | ) | ||||||||||||||||||||||
|
Balance, December 31, 2008
|
226,315,392 | 275,076 | 154,661,002 | (27,375,960 | ) | (839,463 | ) | 38,490 | - | 126,759,145 | ||||||||||||||||||||||
|
Shares issued on exercise of options
|
18,000 | 25 | 2,738 | - | - | - | - | 2,763 | ||||||||||||||||||||||||
|
Amortization of options under stock option plan
|
- | - | 4,259,903 | - | - | - | - | 4,259,903 | ||||||||||||||||||||||||
|
Net unrealized loss on foreign exchange translation
|
- | - | - | - | - | (427,019 | ) | - | (427,019 | ) | ||||||||||||||||||||||
|
Net Loss attributable to Legend stockholders
|
- | - | - | (37,886,071 | ) | - | - | - | (37,886,071 | ) | ||||||||||||||||||||||
|
Fair value of non-controlling interest
|
- | - | - | - | - | - | 10,261,290 | 10,261,290 | ||||||||||||||||||||||||
|
Net change in controlling/non-controlling interest
|
- | - | 4,842,177 | - | - | - | 8,699,831 | 13,542,008 | ||||||||||||||||||||||||
|
Net loss attributable to non-controlling stockholders
|
- | - | - | - | - | - | (1,612,599 | ) | (1,612,599 | ) | ||||||||||||||||||||||
|
Balance, December 31, 2009
|
226,333,392 | 275,101 | 163,765,820 | (65,262,031 | ) | (839,463 | ) | (388,529 | ) | 17,348,522 | 114,899,420 | |||||||||||||||||||||
F-5
LEGEND INTERNATIONAL HOLDINGS, INC.
(An Exploration Stage Company)
Consolidated Statements of Stockholders' Equity (Deficit)
for the period ended December 31, 2010
(continued)
|
Common Stock
|
||||||||||||||||||||||||||||||||
|
Shares
|
Par Value
A$
|
Additional
Paid-In
Capital A$
|
Retained
(Deficit) During the Exploration Period A$
|
Retained
(Deficit) Prior to Exploration Activities A$
|
Accumulated
Other Comprehensive Income (Loss) A$
|
Non-
Controlling Interests A$
|
Stockholders’
Equity (Deficit) A$
|
|||||||||||||||||||||||||
|
Shares issued on cashless exercise of options
|
66,282 | 77 | (77 | ) | - | - | - | - | - | |||||||||||||||||||||||
|
Amortization of options under stock option plan
|
- | - | 1,727,922 | - | - | - | - | 1,727,922 | ||||||||||||||||||||||||
|
Options issued for consulting fees
|
- | - | 247,163 | - | - | - | - | 247,163 | ||||||||||||||||||||||||
|
Net unrealized loss on foreign exchange translation
|
- | - | - | - | - | (1,537,393 | ) | - | (1,537,393 | ) | ||||||||||||||||||||||
|
Net loss attributable to Legend stockholders
|
- | - | - | (36,329,054 | ) | - | - | - | (36,329,054 | ) | ||||||||||||||||||||||
|
Adjustment due to purchase of additional shares in subsidiary
|
- | - | (2,705,136 | ) | - | - | - | (1,327,558 | ) | (4,032,694 | ) | |||||||||||||||||||||
|
Adjustment due to issue of shares by subsidiary
|
- | - | 772,598 | - | - | - | 1,692,278 | 2,464,876 | ||||||||||||||||||||||||
|
Net loss attributable to non-controlling stockholders
|
- | - | - | - | - | - | (3,803,366 | ) | (3,803,366 | ) | ||||||||||||||||||||||
|
Balance, December 31, 2010
|
226,399,674 | 275,178 | 163,808,290 | (101,591,085 | ) | (839,463 | ) | (1,925,922 | ) | 13,909,876 | 73,636,874 | |||||||||||||||||||||
The accompanying notes are integral part of the consolidated financial statements.
F-6
LEGEND INTERNATIONAL HOLDINGS, INC.
(An Exploration Stage Company)
Consolidated Statement of Cash Flows
|
For the years Ended
December 31
|
Convenience
Translation |
January 5, 2001
(Inception) to December 31, |
||||||||||||||||||
| $2008A | $2009A | $2010A |
2010
US$
|
$2010A | ||||||||||||||||
|
CASH FLOWS FROM OPERATING ACTIVITIES:
|
||||||||||||||||||||
|
Net (Loss)
|
(14,221,560 | ) | (39,498,670 | ) | (40,132,420 | ) | (40,786,578 | ) | (107,846,513 | ) | ||||||||||
|
Adjustments to reconcile net loss to net cash(used) operating activities:
|
||||||||||||||||||||
|
Foreign currency exchange loss
|
(5,389,750 | ) | 4,661,096 | 674,496 | 685,490 | 104,894 | ||||||||||||||
|
Unrealised gain on marketable securities
|
(70,874 | ) | (29,602 | ) | (66,891 | ) | (67,981 | ) | (251,504 | ) | ||||||||||
|
Gain on sale of marketable securities
|
- | (84,137 | ) | - | - | |||||||||||||||
|
Shares and Options issued for Stock Based Compensation
|
||||||||||||||||||||
|
- Employees
|
5,185,743 | 4,259,903 | 1,727,922 | 1,756,087 | 12,320,466 | |||||||||||||||
|
- Consultants
|
147,588 | - | 247,163 | 251,192 | 778,584 | |||||||||||||||
|
- Exploration agreement
|
- | - | - | - | 518,000 | |||||||||||||||
|
- Registration payment arrangements
|
900,494 | - | - | - | 1,265,299 | |||||||||||||||
|
Provision for reclamation and remediation
|
116,192 | 91,722 | 628,213 | 638,453 | 926,127 | |||||||||||||||
|
Gain on sale of property and equipment
|
- | (16,761 | ) | - | - | (16,761 | ) | |||||||||||||
|
Writedown/writeoff of assets
|
- | - | 244,924 | 248,916 | 244,924 | |||||||||||||||
|
Depreciation and amortisation
|
529,469 | 847,006 | 2,945,887 | 2,993,905 | 4,343,332 | |||||||||||||||
|
Adjustment to fair value on stepped acquisition
|
- | (2,200,620 | ) | - | - | (2,200,620 | ) | |||||||||||||
|
Equity accounting loss
|
- | 345,707 | 1,440,407 | 1,463,886 | 1,786,114 | |||||||||||||||
|
Interest receivable
|
(49,931 | ) | (81,503 | ) | (138,841 | ) | (141,104 | ) | (270,275 | ) | ||||||||||
|
Accrued interest added to principal
|
- | - | - | - | 37,282 | |||||||||||||||
|
Net Change in:
|
||||||||||||||||||||
|
Receivables
|
(2,891,735 | ) | 881,056 | 1,124,863 | 1,143,198 | 168,878 | ||||||||||||||
|
Prepayments and deposits
|
(964,563 | ) | (1,130,078 | ) | (99,588 | ) | (101,211 | ) | (4,047,668 | ) | ||||||||||
|
Inventories
|
(92,194 | ) | (162,350 | ) | 144,567 | 146,923 | (109,977 | ) | ||||||||||||
|
Accounts payable and accrued expenses
|
1,441,270 | 1,608,312 | (2,252,843 | ) | (2,289,564 | ) | 1,606,722 | |||||||||||||
|
Net Cash (Used) In Operating Activities
|
(15,359,851 | ) | (30,508,919 | ) | (33,512,141 | ) | (34,058,388 | ) | (90,642,696 | ) | ||||||||||
|
CASH FLOWS FROM INVESTING ACTIVITIES:
|
||||||||||||||||||||
|
Proceeds from sale of trading securities
|
- | 1,272,343 | - | - | 1,272,343 | |||||||||||||||
|
Investment in trading securities
|
(710,072 | ) | (377,658 | ) | (196,772 | ) | (199,979 | ) | (574,430 | ) | ||||||||||
|
Investment in equity accounted investments
|
- | (13,082,295 | ) | (6,194,022 | ) | (6,294,985 | ) | (19,986,389 | ) | |||||||||||
|
Acquisition of subsidiary
|
(326,526 | ) | - | - | - | (326,526 | ) | |||||||||||||
|
Investment in consolidated entity
|
- | (9,198,412 | ) | (4,032,694 | ) | (4,098,427 | ) | (13,231,106 | ) | |||||||||||
|
Purchase of property and equipment
|
(4,640,717 | ) | (3,356,338 | ) | (6,426,532 | ) | (6,531,284 | ) | (14,578,152 | ) | ||||||||||
|
Proceeds from sale of property and equipment
|
- | 110,100 | - | - | 110,100 | |||||||||||||||
|
Net Cash (Used) In Investing Activities
|
(5,677,315 | ) | (24,632,260 | ) | (16,850,020 | ) | (17,124,675 | ) | (47,314,160 | ) | ||||||||||
|
CASH FLOWS FROM FINANCING ACTIVITIES:
|
||||||||||||||||||||
|
Advances payable - affiliates
|
- | - | (2,936,845 | ) | (2,984,715 | ) | (2,912,998 | ) | ||||||||||||
|
Repayment of convertible debenture
|
- | - | - | - | (130,310 | ) | ||||||||||||||
|
Repayment of shareholder advance
|
- | - | - | - | (641 | ) | ||||||||||||||
|
Repayment under finance leases
|
- | (353,944 | ) | (402,801 | ) | (409,367 | ) | (756,745 | ) | |||||||||||
|
Proceeds from convertible debenture payable
|
- | - | - | - | 130,310 | |||||||||||||||
|
Proceeds from capital/finance loans
|
- | - | 2,938,792 | 2,986,694 | 2,938,792 | |||||||||||||||
|
Shareholder advance
|
- | - | - | - | 6,621 | |||||||||||||||
|
Proceeds from issuance of stock
|
123,751,878 | 2,763 | - | - | 153,391,479 | |||||||||||||||
|
Proceeds from issuance of stock by controlled entity
|
- | 13,542,008 | 2,607,283 | 2,649,782 | 16,149,291 | |||||||||||||||
|
Cost of share issues
|
(5,964,347 | ) | - | (142,407 | ) | (144,728 | ) | (7,268,879 | ) | |||||||||||
|
Net Cash Provided by Financing Activities
|
117,787,531 | 13,190,827 | 2,064,022 | 2,097,666 | 161,546,920 | |||||||||||||||
|
Effect of exchange rate changes on cash
|
5,438,981 | (4,661,096 | ) | 797,961 | 810,968 | 1,575,846 | ||||||||||||||
|
Net increase (decrease) in cash
|
102,189,346 | (46,611,448 | ) | (47,500,178 | ) | (48,274,429 | ) | 25,165,910 | ||||||||||||
|
Cash at beginning of period
|
17,088,190 | 119,277,536 | 72,666,088 | 73,850,595 | - | |||||||||||||||
|
Cash at end of period
|
119,277,536 | 72,666,088 | 25,165,910 | 25,576,114 | 25,165,910 | |||||||||||||||
|
Supplemental Disclosures:
|
||||||||||||||||||||
|
Cash paid for interest
|
32,715 | 63,600 | 47,852 | 47,086 | 205,963 | |||||||||||||||
|
Cash paid for income taxes
|
- | - | - | - | - | |||||||||||||||
|
Stock and options issued for services
|
147,588 | - | 247,163 | 243,199 | 1,842,686 | |||||||||||||||
|
Accrued interest and stockholder advances charged to paid in capital
|
- | - | - | - | 12,744 | |||||||||||||||
|
Stock issued for exploration agreement
|
- | - | - | - | 518,000 | |||||||||||||||
|
Stock issued for registration payment arrangement
|
900,494 | - | - | - | 1,265,299 | |||||||||||||||
|
Equipment obtained through a capital lease
|
705,841 | - | 472,357 | 464,781 | 1,202,779 | |||||||||||||||
|
Capital lease obligation for exploration costs
|
- | - | - | - | 4,188,792 | |||||||||||||||
|
Interest in relation to capital lease for exploration costs
|
- | - | 42,313 | |||||||||||||||||
|
Fair value of warrants in connection with issuance of capital stock
|
1,330,852 | - | - | - | 1,330,852 | |||||||||||||||
The accompanying notes are integral part of the consolidated financial statements.
F-7
LEGEND INTERNATIONAL HOLDINGS, INC.
(An Exploration Stage Company)
Notes to Consolidated Financial Statements
1. ORGANISATION AND BUSINESS
Legend International Holdings, Inc, ("the Company"or “Legend”), was incorporated under the laws of the State of Delaware on January 5, 2001.
Following a change of management in November 2004, the Company developed a new plan of operations for fiscal 2006, which is to engage in mineral exploration and development activities. The Company's business plan calls for the identification of mineral properties where it can obtain secure title to exploration, development and mining interests. The Company’s preference is to identify large minerals deposits with low operating costs. The Company is prepared to consider the exploration, development and mining of profitable base metal interests. At the beginning of 2006, the Company expanded its areas of interest to include diamond exploration activities and in July 2006, the Company completed the acquisition of certain diamond mining tenements in Northern Australia. Since that time, the Company has identified that those mining tenements in Northern Australia also have potential for uranium and base metals. In November 2007, the Company acquired mining tenements prospective for phosphate in the State of Queensland, Australia.
During the economic downturn of 2008, Legend also decided that part of the Company’s strategy should be to invest into undervalued mining projects should opportunities arise. This investment would not detract from Legend’s primary goal of developing the Phosphate Project and had the aim of diversifying interests to dilute the effect of identified potential project risks. This was seen as necessary by the Company due to the obviously volatile and unpredictable nature of the commodity markets at the time. Some of these investments include taking a major stake in North Australian Diamonds Ltd (NADL) which controls the Merlin Diamond Mine and includes NADL’s current 31% interest in Top End Uranium Ltd and an investment in Northern Capital Resources Corporation which controls gold and zinc assets in Nova Scotia, Canada. These are outlined in further detail below.
Legend has been an exploration stage company since August 2006. During February 2011, the Company announced its maiden mineral reserve for its 100% owned Paradise South phosphate project in accordance with SEC Industry Guide 7. As a result of establishing mineral reserve estimates, Legend will be entering into the development stage for this project as it engages in the process of preparing the mineral deposit for extraction, while it continues with its other various exploration activities.
Legend is focused on the development of mining, beneficiation and processing of its 100% owned phosphate mineral reserves near Mount Isa in northwest Queensland whilst continuing its exploration activities. Legend has a phased implementation plan to become one of the world's leading suppliers of phosphate fertilizer.
The phased implementation plan involves independent development of a Beneficiation Project and a Fertilizer Complex Project. The development of these projects is dependent on the phosphate fertilizer market and Legend’s access to project finance.
A brief description of each project is described below:
Beneficiation Project involves development of a beneficiation plant at Paradise South to upgrade low concentration rock phosphate for direct sale (or use) in fertilizer manufacture. The rock phosphate concentrate will be transported to Mount Isa via slurry pipeline before being dewater and transported to Port of Townsville by rail for market. The Paradise South and D-Tree deposits are Legend’s largest deposits with relatively low concentrations and best suitable for this project.
Fertilizer Complex Project involves development of a fertilizer manufacturing facility in Mount Isa. The fertilizer will be transported from Mount Isa to the Port of Townsville via rail for market. High grade rock phosphate from the Paradise North deposit and beneficiated rock phosphate concentrate from Paradise South and D-Tree deposits best suitable for this project. Paradise North rock will be transported to the Mount Isa Fertilizer Complex by road train whereas the beneficiation plant rock phosphate concentrate will arrive via slurry pipeline.
F-8
The Company acquired interests in entities as follows:
|
●
|
in early December 2009, NADL issued shares, which diluted the Company’s interest to 47.83% and the Company consolidated NADL at that rate for December 2009. During 2010, the Company acquired additional shares in NADL increasing its holding to 50.40%; and
|
|
●
|
during 2010, the Company took additional private placements in Northern Capital Resources Corp (“NCRC”), increasing its holding to a 31.46% interest, and continued to account for NCRC as an unconsolidated entity.
|
The Company has historically funded its activities from funds provided by capital raising through the issuance of its shares and from advances from affiliated entities. The Company has in place a planning and budgeting process to help determine the funds required to support the Company's operating requirements and its exploration and pre-development plans. Based on this process and the amount of the Company's cash and other current assets as of December 31,2010, management believes that the Company has sufficient operating liquidity to sustain its activities through 201 1. However, as the Company has not yet generated income producing activities, it will continue to seek opportunities to raise additional funds from capital raising efforts through the issuance of its shares, funding from affiliated entities as may be available and other financing arrangements until which time as the Company can commence revenue producing activities.
As future exploration and development activities will require additional financing, the Company is pursuing varying strategies to accomplish this including obtaining third parties to take an ownership interest in or to provide financing for the anticipated development activities related to the phosphate project, as well as capital raising through share issuances.
|
2.
|
RECENT ACCOUNTING PRONOUNCEMENTS
|
In May 2009, the Financial Accounting Standards Board (FASB) issued guidance on the accounting for and disclosure of events that occur after the balance sheet date. This guidance was effective for interim and annual financial periods ending after June 15, 2009. In February 2010, the FASB issued Accounting Standards Update (ASU) 2010-09, Subsequent Events: Amendments to Certain Recognition and Disclosure Requirements. This ASU retracts the requirement to disclose the date through which subsequent events have been evaluated and whether that date is the date the financial statements were issued or were available to be issued. ASU 2010-09 requires an entity that is a SEC filer to evaluate subsequent events through the date that the financial statements are issued. ASU 2010-09 is effective for interim and annual financial periods ending after February 24, 2010. The adoption of this guidance did not have an impact on our consolidated financial statements.
In January 2010, the FASB issued ASU 2010-06, Fair Value Measurements and Disclosures (Topic 820) – Improving Disclosures about Fair Value Measurements. This ASU requires new disclosures and clarifies certain existing disclosure requirements about fair value measurements. ASU 2010-06 requires a reporting entity to disclose significant transfers in and out of Level 1 and Level 2 fair value measurements, to describe the reasons for the transfers and to present separately information about purchases, sales, issuances and settlements for fair value measurements using significant unobservable inputs. ASU 2010-06 is effective for interim and annual reporting periods beginning after December 15, 2009, except for the disclosures about purchases, sales, issuances and settlements in the roll forward of activity in Level 3 fair value measurements, which is effective for interim and annual reporting periods beginning after December 15, 2010; early adoption is permitted. The adoption of ASU 2010-06 did not have a material impact on our financial position, results of operations or cash flows.
In April 2010, the FASB issued ASU 2010-13, Share Based Payment Awards Denominated in Certain Currencies. The ASU guidance issued to amend ASC 718, Compensation – Stock Compensation to clarify that an employee share-based payment award that has an exercise price denominated in the currency of the market in which a substantial portion of the entity’s equity shares trades should not be considered to contain a condition that is not a market, performance, or service condition. Therefore, an entity should not classify such an award as a liability if it otherwise qualifies as equity. This amended guidance is effective for fiscal years, and interim periods within those fiscal years, beginning on or after December 15 2010, with early adoption permitted. The adoption of ASU 2010-13 did not have a material impact on our financial position, results of operations or cash flows.
F-9
|
3.
|
SUMMARY OF SIGNIFICANT ACCOUNTING POLICIES
|
Mineral Property Acquisition, Exploration Costs and Amortization of Mineral Rights
Mineral property acquisition, exploration and development costs are expensed as incurred until such time as economic reserves are quantified. To date, the Company has not established any proven or probable reserves on its mineral properties. When it is determined that a mining deposit can be economically and legally extracted or produced based on established proven and probable reserves, further exploration costs and development costs incurred after such determination will be capitalized. The establishment of proven and probable reserves is based on results of final feasibility studies which indicate whether a property is economically feasible. Upon commencement of commercial production, capitalized costs will be transferred to the appropriate asset category and amortized over their estimated useful lives. Capitalized costs, net of salvage values, relating to a deposit which is abandoned or considered uneconomic for the foreseeable future, will be written off. Mineral rights are amortized over their estimated useful lives being the Company’s estimated rights to tenure.
Stock Options
For the issuances of stock options, the Company follows the fair value provisions of FASB issued guidance now codification ASC Topic 718, “Compensation-Stock Compensation”. Topic 718 requires the Company to measure the cost of employee services received in exchange for an award of equity instruments based on grant date fair value. The cost will be recognised over the period during which an employee is required to provide service in exchange for the award – usually the vesting period. In the case where there is no required service period, the fair value of the equity instruments is expensed immediately.
Comprehensive Income (Loss)
The Company follows ASC Topic 220 “Comprehensive Income” (“ASC 220”). ASC 220 requires a company to report comprehensive profit (loss) and its components in a full set of financial statements. Comprehensive income profit/(loss) is the change in equity during a period from transactions and other events and circumstances from non-owner sources such as unrealized gains (losses) on foreign currency translation adjustments. Changes in unrealized foreign currency translation adjustments during fiscal 2008, 2009 and 2010 amounted to A$nil, A$427,019 and A$1,537,576 respectively. Accordingly, the Company’s comprehensive (loss) for the years ended December 31, 2008, 2009 and 2010 amounted to A$(14,221,560), A$(39,925,689) and A$(41,669,813) respectively
Inventories
Materials and Supplies
Materials and supplies are valued at the lower of average cost or net realizable value.
Net Profit/Loss per Share
The Company follows the FASB ASC Topic 260 “Earnings per Share” provisions which require the reporting of both basic and diluted profit/(loss) per share. Basic profit/(loss) per share is computed by dividing net profit/(loss) available to common stockholders by the weighted average number of common shares outstanding for the period. Diluted net profit/(loss) per share reflect the potential dilution that could occur if securities or other contracts to issue common stock were exercised or converted into common stock. Anti-dilutive effects on net profit/(loss) per share are excluded.
Property and Equipment
Property and equipment is stated at cost. The Company records depreciation and amortization, when appropriate, using straight-line method over the estimated useful lives of the assets. Expenditures for maintenance and repairs are charged to expense as incurred. Additions, major renewals and replacements that increase the property's useful life are capitalized. Property sold or retired, together with the related accumulated depreciation is removed from the appropriate accounts and the resultant gain or loss is included in net income (loss).
F-10
|
At December 31, 2010
|
At December 31, 2009
|
|||||||||||||||||||||||||||
|
Depreciable
Life (in years)
|
Cost
A$
|
Accumulated
Depreciation A$
|
Net Book
Value A$
|
Cost
A$
|
Accumulated
Depreciation A$
|
Net Book
Value A$
|
||||||||||||||||||||||
|
Land
|
1,101,358 | - | 1,101,358 | 1,101,358 | - | 1,101,358 | ||||||||||||||||||||||
|
Buildings
|
40 | 2,978,403 | (118,876 | ) | 2,859,527 | 2,968,213 | (43,235 | ) | 2,924,978 | |||||||||||||||||||
|
Leasehold Improvements
|
1-2 | 324,591 | (80,925 | ) | 243,666 | 235,831 | (35,790 | ) | 200,041 | |||||||||||||||||||
|
Motor Vehicles
|
5 | 1,476,056 | (491,717 | ) | 984,339 | 1,001,863 | (234,199 | ) | 767,664 | |||||||||||||||||||
|
Equipment
|
1-10 | 3,229,250 | (689,682 | ) | 2,539,568 | 2,135,498 | (282,626 | ) | 1,852,872 | |||||||||||||||||||
|
Aircraft
|
5 | 4,671,142 | (606,518 | ) | 4,064,624 | 1,270,869 | (352,345 | ) | 918,524 | |||||||||||||||||||
|
Construction in Progress
|
2,038,935 | - | 2,038,935 | 708,217 | - | 708,217 | ||||||||||||||||||||||
| 15,819,735 | (1,987,718 | ) | 13,832,017 | 9,421,849 | (948,195 | ) | 8,473,654 | |||||||||||||||||||||
The depreciation expense for the year ended December 31, 2010 amounted to A$1,262,469 (US$1,283,047) and for the year ended December 31, 2009 amounted to A$757,234 and accumulated depreciation on assets written off and/or disposed of for the year ended December 31, 2010 was A$222,945 (US$226,597) and for the year ended December 31, 2009 was A$32,952. Net book value of assets written off for the year ended December 31, 2010 amounted to A$82,592 (US$83,938).
Principles of Consolidation
The consolidated financial statements include the assets and liabilities of the Company and the entities it controlled at the end of the financial period and the results of the Company and the entities it controlled during the year. Where entities are not controlled throughout the entire financial year, the consolidated results include the results of those entities for that part of the period during which control exists. The effect of all transactions between entities in the group and the inter-entity balances are eliminated in full in preparing the consolidated financial statements.
Noncontrolling Interests
In December 2007, the ASC guidance for noncontrolling interests was updated to establish accounting and reporting standards pertaining to: (i) ownership interests in subsidiaries held by parties other than the parent (“noncontrolling interests”), (ii) the amount of net income attributable to the parent and to the noncontrolling interests, (iii) changes in a parent’s ownership interest, and (iv) the valuation of any retained noncontrolling equity investment when a subsidiary is deconsolidated. If a subsidiary is deconsolidated, any retained noncontrolling equity investment in the former subsidiary is measured at fair value and a gain or loss is recognized in net income based on such fair value. For presentation and disclosure purposes, the guidance requires noncontrolling interests to be classified as a separate component of equity. Noncontrolling interests reflect third parties ownership interest in entities that are consolidated as less than 100% owned.
Fair Value of Financial Instruments
FASB issued ASC Topic 825 “Financial Instruments” which requires the Company to disclose, when reasonably attainable, the fair market values of its assets and liabilities which are deemed to be financial instruments. The Company’s financial instruments include cash, receivables, marketable securities, other investments, advances due from affiliates (included in receivables, see note 11), accounts payable and accrued expenses. The carrying amounts of cash, receivables, accounts payable and accrued expenses approximate their respective fair values due to the short term maturities of these instruments. The fair value of advances due from affiliates are not practicable to estimate as no similar market exists for these instruments and as it does not have a specified date of repayment. The carrying amounts of marketable securities comprised of shares are measured at fair value based on unadjusted quoted market prices that are available in active markets as of the reporting date.
The Company’s other financial instruments consists of long-term debt, including current portion. The fair value of the Company’s fixed rate debt based on market prices as of December 31, 2010 was A$2,835,482 (US$2,881,700), based on current interest rates available to us for debt instruments with similar terms, degrees of risk and remaining maturities. The carrying values of these obligations, for each period presented, approximate fair value.
Cash Equivalents
Legend considers all highly liquid investments with an original maturity of three months or less at the time of purchase to be cash equivalents. For the periods presented there were no cash equivalents.
F-11
Federal Income Tax
ASC Topic 740 prescribes how a company should recognise, measure, present and disclose in its financial statements uncertain tax positions that the Company has taken or expects to take on a tax return. Additionally for tax positions to qualify for deferred tax benefit recognition under ASC 740, the position must have at least “more than likely not” chance of being sustained upon challenge by the respective taxing authorities, and whether or not it meets that criteria is a matter of significant judgement. The Company believes that it does not have any uncertain tax positions that would require disclosure or recognition in the financial statements.
The Company follows the asset and liability approach which requires the recognition of deferred tax liabilities and assets for the expected future tax consequences of temporary differences between the carrying amounts and the tax basis of assets and liabilities. For the period presented, there was no taxable income. There are no deferred income taxes resulting from temporary differences in reporting certain income and expense items for income tax and financial accounting purposes. The Company, at this time, is not aware of any net operating losses which are expected to be realised, therefore a valuation allowance was established.
Foreign Currency Translation
The Company’s functional and reporting currency is the Australian dollar. Revenue and expenses incurred in a currency other than the reporting currency, Australian dollars are translated at the date incurred or invoiced. Assets and liabilities are re-valued at the period end exchange rate where appropriate. Gains or losses from foreign currency transactions are included in the results of operations .Foreign currency exchange gain/loss in 2010 and 2009 is primarily as a result of the translation of cash maintained in US banking institutions to A$ and amounted to a loss of A$674,496 (US$685,490) in 2010 and a loss of A$4,661,096 in 2009.
Goods and Services Tax (“GST”)
Revenues, expenses and assets generated in Australia are subject to Australian GST which requires the supplier to add a 10% GST to predominately all expenses and the cost of assets and for the Company to include a 10% GST to the selling price of a product. Revenues, expenses and assets are recognized net of the amount of GST except where the GST incurred on a purchase of goods and services is not recoverable from the taxation authority, in which case the GST is recognized as part of the cost of acquisition of the assets or as part of the expense item as applicable, and receivables and payables are stated with the amount of GST included. The net amount of GST recoverable from, or payable to, the taxation authority is included as part of receivables or payables in the balance sheet. Cash flows are included in the cash flow statement on a gross basis and the GST component of cash flows arising from investing and financing activities which is recoverable from, or payable to, the taxation authority are classified as operating cash flows. Commitments and contingencies are disclosed net of the amount of GST recoverable from, or payable to, the taxation authority
Reclamation and Remediation Obligations (Asset Retirement Obligations)
Reclamation costs are allocated to expense over the life of the exploration activity and are periodically adjusted to reflect changes in the estimated present value resulting from the passage of time and revisions to the estimates of either the timing or amount of the reclamation and remediation costs. The asset retirement obligation is based on when the spending for an existing environmental disturbance will occur. The Company reviews, on at least an annual basis, the asset retirement obligation at each exploration site.
Future remediation costs are accrued based on management’s best estimate at the end of each period of the costs expected to be incurred. Such cost estimates include, where applicable, plugging of drill holes, removal of consumables and ripping of drill pads and tracks. Changes in estimates are reflected in earnings in the period an estimate is revised.
Accounting for reclamation and remediation obligations requires management to make estimates unique to each exploration operation of the future costs the Company will incur to complete the reclamation and remediation work required to comply with existing laws and regulations. Actual costs incurred in future periods could differ from amounts estimated. Additionally, future changes to environmental laws and regulations could increase the extent of reclamation and remediation work required. Any such increases in future costs could materially impact the amounts charged to earnings for reclamation and remediation.
F-12
Lease Liability
Leases meeting certain criteria are accounted for as a capital lease. Imputed interest is charged against income. The capitalised value of the assets is depreciated over the estimated useful lives. The Company has entered into leasing agreements of four year terms for motor vehicles. Obligations under capital lease are reduced by the rental payments net of imputed interest. All other leases are treated as operating leases.
Impairment of Long-Lived Assets
The Company accounts for its long-lived assets in accordance with ASC Topic 360, “Impairment or Disposal of Long-Lived Assets”. ASC Topic 360 requires that long-lived assets be reviewed for impairment whenever events or changes in circumstances indicate that the carrying value of its assets, including property, plant and equipment and mineral rights, by estimating the future net cash flows expected to result from the asset, including eventual disposition. If the future net cash flows are less than the carrying value of the asset, the impairment loss is recorded equal to the difference between the asset’s carrying value and fair value or disposable value.
Convenience Translation to US$
The consolidated financial statements as of and for the year ended December 31, 2010 have been translated into United States dollars using the rate of exchange of the United States dollar at December 31, 2010 (A$1.00=US$1.0163). The translation was made solely for the convenience of readers in the United States.
Use of Estimates
The preparation of financial statements in conformity with accounting principles generally accepted in the United States of America requires management to make estimates and assumptions that affect the reported amounts of assets and liabilities and disclosure on contingent assets and liabilities at the date of the financial statements, and the reported amounts of revenues and expenses during the reporting period. Actual results could differ from those estimates.
Comparative Figures
Where necessary, comparative figures have been reclassified to be consistent with current year presentation with no effect on operations.
|
4.
|
CONCENTRATIONS OF RISKS
|
Cash Balances
Cash consists of all cash balances and highly liquid investments with an original maturity of three months or less. Because of the short term maturity of these investments, the carrying amounts approximate their fair value.
The Company monitors its position with, and the credit quality of, the financial institution it invests with. As of the balance sheet date, and periodically throughout the year, the Company has maintained balances in various operating accounts in excess of federally insured limits.
The Company held in interest bearing cash accounts at December 31, 2010, A$24,266,718 (US$23,877,575) including A$3,143,855 (US$3,195,100) held in US dollars in Australian banking institutions and A$899,192 (US$884,770) in US banking institutions.
Mineral Rights and Foreign Operations
The Company has mineral rights in Australia.
F-13
|
5.
|
DEPOSITS
|
Deposits held by the Company consist of
|
December 31
|
||||||||
| $2010A | $2009A | |||||||
|
Term Deposit as security for a Banker’s Undertaking
|
257,750 | 2,130,988 | ||||||
|
Other
|
229,754 | 1,604 | ||||||
|
Cash deposits provided to Government Departments for the purpose of guaranteeing the Company’s performance in accordance with mining law
|
688,964 | 526,902 | ||||||
| 1,176,468 | 2,659,494 | |||||||
|
6.
|
INVESTMENTS/SUBSIDIARIES
|
The following is the summary of the Company’s acquisitions and investments.
Consolidated Entities
North Australian Diamonds Limited
The Company is increasing its diamond exploration activity in the proximity of the Merlin diamond mine in the Northern Territory and is continually sourcing new ground in this region which is one of the most diamond prospective areas in Australia. As part of this strategy, the Company acquired a 14.9% interest in North Australian Diamonds Limited (“NADL”), an Australian diamond exploration corporation, at a cost of approximately A$2,400,000 in February 2009. NADL owns the Merlin diamond mine and surrounding tenements. The Company’s President and Chief Executive Officer is Executive Chairman of NADL and the Company has three of the four directors of NADL. The Company believes the acquisition of NADL will assist in the opportunity to discover diamond deposits.
On May 12, 2009, the Company made an on market takeover offer for all of the shares in NADL, an Australian corporation (see note 1). The takeover offer concluded on August 6, 2009 with an additional investment of approximately A$11,600,000. During fiscal 2009, the Company continued to acquire shares and maintain a controlling interest in NADL.
At December 31, 2009, the Company’s holding in NADL was 47.83%. During the 2010 year, the Company purchased an additional 87,168,065 shares, increasing its holding in NADL to 50.40% at December 31, 2010. The cost to the Company was $4,032,694. As such, the Company recorded adjustments to the Company’s additional paid-in capital and non-controlling interest accounts related to these transactions which are reflected in the accompanying Statements of Stockholders’ Equity during the fiscal 2010.
The amount of other income of NADL for the year ended December 31, 2010 included in the Consolidated Statement of Operations is A$1,208,144 and the amount of loss is A$7,540,445, including exploration expenditure expensed of A$7,935,740.
Teutonic Minerals Pty Ltd
On February 27, 2008, the Company entered into a Share Sale Agreement whereby the Company agreed to purchase all of the issued and outstanding shares of Teutonic Minerals Pty Ltd. As a result, Teutonic became a subsidiary of the Company from that date. Teutonic held an application for a mineral licence over phosphate in the Georgina Basin in the State of Queensland, Australia. The consideration payable to the vendors was A$300,000, and the Company granted the vendors a 1% gross revenue royalty from production from the mineral licence and incurred legal costs of A$26,526. The mineral licence application held by Teutonic was withdrawn on March 17, 2008 and replaced by a mineral application lodged by the Company. Teutonic had no other assets or liabilities. As at December 31, 2008 the net assets and liabilities acquired by the Company had no value. At December 31, 2010 and 2009 and for the three years ended December 31, 2010, the financial position and results of operations of Teutonic were not material.
F-14
Alexya Pty Ltd
On October 22, 2010, the Company incorporated a wholly owned Australian subsidiary, Alexya Pty Ltd (“Alexya”) to hold a certain asset and liability which has been consolidated in the accompanying financial statements.
The Company also has the following wholly owned inactive subsidiaries:
|
●
|
Legend International Holdings Limited
|
|
●
|
Legend Diamonds Pty Ltd.
|
Equity Investments
Northern Capital Resources Corp
In 2009, Legend took a private placement from Northern Capital Resources Corporation (“NCRC”), a Nevada Corporation. NCRC holds a majority interest in Golden River Resources Corporation (“GRR”) listed on the OTCBB and GRR holds a 71.52% interest in TSX listed Acadian Mining Corporation, which has significant gold and base metal interests in Canada. At December 31, 2009, the Company held 43,435,841 issued and outstanding shares in NCRC at a cost of A$10,097,818. During the 2010 year, the Company closed private placements in NCRC, acquiring 18,240,010 shares of common stock at a cost of A$3,886,132 and purchased an additional 8,500,000 shares in NCRC from unrelated parties at a cost of $1,790,528. At December 31, 2010, the Company held a 31.46% interest in NCRC. The Company has accounted for the investment in NCRC using the equity method. At December 31, 2010 and 2009, the carrying value of the investment was A$12,499,661 and A$9,648,696 respectively. For the year ended December 31, 2010 and 2009, the Company recorded an equity loss in NCRC of A$1,232,118 and A$78,287 respectively. The Chairman of the Board and Chief Executive Officer of the Company, is also the Chairman of the Board and Chief Executive Officer of NCRC and certain companies with which Mr Gutnick is associated own approximately 39.84% of the outstanding common stock of NCRC. Mr JI Gutnick is one of six directors (four of the directors are independent of NCRC) of the Company.
At December 31, 2010, the investment in the unconsolidated subsidiary is accounted for under the equity method as the Company has significant influence over NCRC.
The following table presents summary unaudited financial information for NCRC. Such summary financial information has been provided herein based upon the individual significance of this unconsolidated equity investment to the consolidated financial information of the Company:
|
December 2009
A$
|
December 2010
A$
|
|||||||
|
Current assets
|
988,354 | 918,991 | ||||||
|
Non- current assets
|
55,811,214 | 49,854,896 | ||||||
|
Total assets
|
56,799,568 | 50,773,887 | ||||||
|
Current liabilities
|
5,991,806 | 4,599,192 | ||||||
|
Non-current liabilities
|
5,362,559 | 6,264,878 | ||||||
|
Total liabilities
|
11,354,365 | 10,864,070 | ||||||
|
Total shareholders’ equity
|
45,445,203 | 39,909,817 | ||||||
|
Net profit/(loss)
|
14,796,200 | (4,677,824 | ) | |||||
The difference between the carrying value of this equity investment and the Company’s share of underlying equity in the net assets of the investee at December 31, 2010 and 2009 amounts to approximately A$56,000.
Accordingly, the Company does not believe that there was an impairment of the investment in NCRC at December 31, 2010 and 2009.
F-15
Top End Uranium Ltd
The Company, through its investment in NADL, increased its interest from 25.24% at December 31, 2009 to 31.06% interest in Top End Uranium Ltd (“TEU”) which has a carrying value of A$1,070,070 and A$760,997 at December 31, 2010 and 2009 respectively. NADL purchased 3,842,779 ordinary shares at a cost of A$517,362 during the year ended December 31, 2010. NADL accounts for the investment in TEU using the equity method, For the year ended December 31, 2010 and 2009, the Company recorded equity loss in TEU of A$208,289 and A$74,754 respectively.
At December 31, 2010, the investment in the unconsolidated subsidiary is accounted for under the equity method as the Company via its subsidiary NADL has significant influence over TEU.
The following table presents summary unaudited financial information for TEU. Such summary financial information has been provided herein based upon the individual significance of this unconsolidated equity investment to the consolidated financial information of the Company:
|
|
December 2009
A$
|
December 2010
A$
|
||||||
|
Current assets
|
5,422,226 | 4,727,929 | ||||||
|
Non-current assets
|
15,228 | 11,822 | ||||||
|
Total assets
|
5,437,454 | 4,739,751 | ||||||
|
Current liabilities
|
94,945 | 128,441 | ||||||
|
Total liabilities
|
94,945 | 128,441 | ||||||
|
Total shareholders’ equity
|
5,342,509 | 4,611,310 | ||||||
|
Net (loss)
|
(772,817 | ) | (731,199 | ) | ||||
The difference between the carrying value of this equity investment and the Company’s share of underlying equity in the net assets of the investee at December 31, 2010 amounts to approximately A$362,000.
|
7.
|
STOCKHOLDERS EQUITY
|
Common Stock
Between January 1, 2001 and December 31, 2007, the Company issued 65,582,358 shares of Common Stock raising A$29,761,285 (US$22,949,401). The Company also issued 21,031,700 shares of Common Stock in lieu of services for a value of A$1,374,839 (US$1,161,470). The Company issued a further 89,442,267 shares of Common Stock upon the cashless exercise of options. The Company issued a further 500,000 shares of Common Stock for part settlement of acquisition of exploration permits amounting to A$518,000 (US$475,000). The Company issued a further 200,000 shares of Common Stock as a result of delays in lodging a registration statement amounting to A$364,805 (US$318,000). The Company issued a further 112,500 shares of Common Stock valued at A$35,416 to settle outstanding matters with an external party.
Between January 1, 2008 and December 31, 2008, the Company issued 42,000,000 shares of Common Stock raising A$110,028,293 (US$105,000,000). The Company also issued 30,800 shares of Common Stock in lieu of services for a value of A$147,588 (US$138,600). The Company issued a further 1,522,358 shares of Common Stock upon the cashless exercise of options and 435,600 shares of Common Stock upon the exercise of options raising A$51,494 (US$48,352). The Company issued a further 457,809 shares of Common Stock as a result of delays in lodging a registration statement amounting to A$900,495 (US$757,015).
Effective July 14, 2008, the Company entered into a Shares Option Agreement with the Indian Farmers Fertilizer Cooperative Limited (“IFFCO”) to finance the Company’s operations.
Under the Share Options Agreement, IFFCO received options to purchase 30 million shares of Common Stock of the Company on the following terms:
|
a.
|
5,000,000 options, at an exercise price of US$2.50 per share and expiring 60 days from July 11, 2008;
|
|
b.
|
8,000,000 options, at an exercise price of US$3.00 per share and expiring 12 months from July 11, 2008;
|
|
c.
|
8,000,000 options, at an exercise price of US$3.50 per share and expiring 18 months from July 11, 2008;
|
|
d.
|
9,000,000 options, at an exercise price of US$4.00 per share and expiring 24 months from July 11, 2008.
|
F-16
During the third quarter of 2008, the 5,000,000 options issued to IFFCO, at an exercise price of US$2.50 per share and expiring 60 days from July 11, 2008 were exercised on August 11, 2008 and pursuant to the Share Options Agreement, received a 1.2% discount on the exercise price. The total amount received was A$13,672,091 (US$12,350,000) and the Company issued 5,000,000 shares of common stock. The 8,000,000 options expiring 12 months after July 11, 2008, the 8,000,000 options expiring 18 months after July 11, 2008 and the 9,000,000 options expiring 24 months after July 11, 2008 were not exercised and were forfeited. IFFCO holds 15.2% of the shares of common stock of the Company.
Between January 1, 2009 and December 31, 2009, an additional 18,000 options were exercised for US$0.111, total amount received A$2,763 (US$1,998) and the Company issued 18,000 shares of common stock.
Between January 1, 2010 and December 31, 2010, an additional 333,334 options were exercised using the cashless exercise feature and the Company issued 66,282 shares of common stock.
Between January 1, 2010 and December 31, 2010, Legend issued 1,000,000 options with an exercise price of US$1.00 and expiring on September 1, 2014 for consulting fees amounting to A$247,163 (US$220,000).
Share Option Plan
The Company has a Stock Incentive Plan (“Stock Plan”) for executives and eligible employees and contractors. Under this Stock Plan, options to purchase shares of stock can be granted with exercise prices not less than the fair market value of the underlying stock at the date of grant. The Company believes that such awards better align the interests of its employees with those of its shareholders. Option awards are generally granted with an exercise price equal to or greater than the market price of the Company’s stock at the date of grant; those option awards generally vest 1/3 after 12 months, 1/3 after 24 months and the balance after 36 months with a 10-year contractual term. The expected life of the options is generally between 5 ½ to 6 ½ years. Certain option and share awards provide for accelerated vesting if there is a change in control (as defined in the Stock Plan). The maximum aggregate number of Shares which may be optioned and sold under the Stock Plan is 10% of the issued and outstanding shares (on a fully diluted basis).
The fair value of each option award is estimated on the date of grant using the Binomial option valuation model that uses the assumptions noted in the following table. The Binomial option valuation model requires the input of subjective assumptions, including the expected term of the option award and stock price volatility. Expected volatility is based on the historical volatility of our stock at the time grants are issued and other factors, including the expected life of the options of 5 ½ to 6 ½ years. The Company uses historical data to estimate option exercise and employee termination within the valuation model; separate groups of employees that have similar historical exercise behavior are considered separately for valuation purposes. The expected term of options granted is derived from the output of the option valuation model and represents the period of time that options granted are expected to be outstanding; the range given below results from certain groups of employees exhibiting different behavior. The risk-free rate for periods within the contractual life of the option is based on the U.S. Treasury yield curve in effect at the time of grant.
|
For the year ended
December 31, 2010 |
For the year ended
December 31, 2009 |
|||||||
|
Weighted Average Volatility
|
70 | % | 70 | % | ||||
|
Dividend Yield
|
- | - | ||||||
|
Expected term (years)
|
5.5 – 6.5 | 5.5 – 6.5 | ||||||
|
Risk-free rate
|
1.91 | % | 2.48% - 3.54 | % | ||||
F-17
A summary of option activity under the Plan as of December 31, 2010, and changes during the year is presented below:
|
Options
|
Shares
|
Weighted-Average
Exercise Price
|
||||||
|
Balance, December 31, 2006
|
8,100,000 | $0.83 | ||||||
|
Granted
|
6,250,000 | $0.93 | ||||||
|
Exercised
|
- | - | ||||||
|
Forfeited and expired
|
(1,762,500 | ) | $0.72 | |||||
|
Balance, December 31, 2007
|
12,587,500 | $0.79 | ||||||
|
Granted
|
11,000,000 | $1.79 | ||||||
|
Exercised
|
- | - | ||||||
|
Forfeited and expired
|
(1,125,000 | ) | $0.98 | |||||
|
Balance, December 31, 2008
|
22,462,500 | $1.19 | ||||||
|
Granted
|
1,900,000 | $1.00 | ||||||
|
Exercised
|
- | - | ||||||
|
Forfeited and expired
|
(675,000 | ) | $1.00 | |||||
|
Balance, December 31, 2009
|
23,687,500 | $1.30 | ||||||
|
Granted
|
500,000 | $1.00 | ||||||
|
Exercised
|
(333,334 | ) | $0.83 | |||||
|
Forfeited and expired
|
(979,166 | ) | $0.97 | |||||
|
Balance, December 31, 2010
|
22,875,000 | $1.32 | ||||||
|
Options exercisable at December 31, 2010
|
18,437,500 | $1.25 | ||||||
At the time of an issue of options, management assess the forfeiture rate to be used for the issue based on historical experience and management’s view on the likelihood that the individual will continue employment to the end of the vesting period. The forfeiture rates vary between 33.3% and 100%.
For the year ended December 31, 2010, stock-based compensation expense relating to stock options was A$1,727,922 (US$1,539,091). No income tax benefit was recognized in the year ended December 31, 2010 for stock-based compensation arrangements because of the valuation allowance. As at December 31, 2010, there was A$575,847 (US$480,238) of unrecognized compensation cost, before income taxes, related to unvested stock options.
On December 13, 2010, the Company issued 500,000 stock options under the 2006 Incentive Option Plan with an exercise price of US$1.00, a latest exercise date of November 20, 2020, and to vest 1/3 on December 13, 2010, 1/3 on November 20, 2011 and the balance 1/3 on November 20, 2012. The weighted-average grant-date fair value of options granted was US$0.46.
The number of shares issued under the cashless exercise is determined by a fraction at the date of exercise, the numerator of which is the difference between the current market price per share of the Common Stock and the per share option price, and the denominator the current market price per share of Common Stock.
|
Options Outstanding
|
Options Exercisable
|
||||||
|
Exercise
Prices US$
|
Number
Outstanding |
Weighted
Average Remaining Contractual Life (In Years)
|
Weighted-
Average Exercise
Price |
Number
Exercisable |
Weighted
Average Remaining Contractual Life (In Years)
|
Weighted-
Average Exercise
Price |
|
|
$0.444
|
1,856,250
|
5.86
|
1,856,250
|
5.86
|
|||
|
$1.000
|
14,118,750
|
6.93
|
11,981,250
|
6.70
|
|||
|
$2.000
|
5,900,000
|
7.18
|
3,933,333
|
8.18
|
|||
|
$3.480
|
1,000,000
|
7.53
|
666,667
|
7.53
|
|||
|
22,875,000
|
6.93
|
$1.32
|
18,437,500
|
6.75
|
$1.25
|
||
The aggregate intrinsic value of outstanding stock options at December 31, 2010 was A$1,351,575 and the aggregate intrinsic value of exercisable stock options was A$1,308,825.
F-18
North Australian Diamonds Limited
Options
The number of options outstanding over unissued ordinary shares at December 31, 2010 is 80,000,000. The unlisted options are exercisable by payment of 0.8 cents each on or before February 10, 2012. Option holders are not entitled to participate in any share issue of the Company or any other body corporate and have no voting rights at shareholder meetings.
F-19
Directors, Officers and other Permitted Persons Option Plan
On July 23, 2004, the shareholders of NADL approved the establishment of the North Australian Diamonds Limited Directors, Officers and other Permitted Persons Option Plan.
All eligible directors, officers and employees, and consultants of the Company who have been continuously employed by the Company are eligible to participate in the Plan. The Plan allows the Company to issue free options to eligible persons. The options can be granted free of charge and are exercisable at a fixed price calculated in accordance with the Plan. Options granted under the Plan carry no voting rights.
No options in respect of this plan are in issue.
|
8.
|
RECLAMATION AND REHABILITATION
|
|
December 31, 2010
A$
|
December 31, 2009
A$
|
|
|
Balance January 1
|
935,558
|
206,192
|
|
Increase as a result of rehabilitation requirement on exploration undertaken during year
|
67,492
|
730,332
|
|
Increase as a result of acquisition of subsidiary during the year
|
-
|
291,902
|
|
Decrease as a result of rehabilitation performed during the year
|
(76,923)
|
(292,868)
|
|
Closing balance December 31
|
926,127
|
935,558
|
The Company’s exploration activities are subject to various federal and state laws and regulations governing the protection of the environment. These laws and regulations are continually changing and are generally becoming more restrictive. The Company conducts its operations so as to protect the environment and believes its operations are in compliance with applicable laws and regulations in all material respects. The Company has made, and expects to make in the future, expenditures to comply with such laws and regulations, but cannot predict the full amount of such future expenditures. Estimated future reclamation costs are based principally on legal and regulatory requirements.
|
9.
|
LEASE LIABILITY
|
|
A$
|
|
|
The Company entered into capital finance lease agreements for motor vehicles. The leases are non-cancellable and require total monthly repayments of A$41,958 (2009: A$19,962) and expire at various dates from 2011 to 2013. Future minimum payments due for the remaining term of the leases as of December 31, 2010 are as follows:
|
|
|
2011
|
503,493
|
|
2012
|
207,705
|
|
2013
|
63,566
|
|
774,764
|
|
|
Less amounts representing interest
|
65,614
|
|
709,150
|
|
|
Current liability
|
455,012
|
|
Non-current liability
|
254,138
|
|
709,150
|
|
|
At December 31, 2010, the net book value of the motor vehicles under capital leases amounts to:
|
814,327
|
|
10.
|
MARKETABLE SECURITIES/OTHER INVESTMENTS
|
Management determines the appropriate classification of its investments in marketable securities at the time of purchase and re-evaluates such determinations at each reporting date. The Company accounts for its marketable securities in accordance with FASB issued guidance now codified as ASC Topic 320, “Investments – Debt and Equity Securities” (“ASC 320”).
F-20
On January 1, 2008, the Company adopted ASC 820, “Fair Value Measurements and Disclosures” (“ASC 820”), which, among other things, defines fair value, establishes a consistent framework for measuring fair value and expands disclosure for each major asset and liability category measured at fair value on either a recurring or nonrecurring basis. The Company did not adopt the ASC 820 fair value framework for nonfinancial assets and liabilities, except for items that are recognized or disclosed at fair value in the financial statements at least annually. ASC 820 clarifies that fair value is an exit price, representing the amount that would either be received to sell an asset or be paid to transfer a liability in an orderly transaction between market participants. As such, fair value is a market-based measurement that should be determined based on assumptions that market participants would use in pricing an asset or liability. As a basis for considering such assumptions, ASC 820 establishes a three-tier fair value hierarchy, which prioritizes the inputs used in measuring fair value as follows:
Level 1. Observable inputs such as quoted prices in active markets for identical assets or liabilities;
Level 2. Inputs, other than the quoted prices in active markets, that are observable either directly or indirectly; and
Level 3. Unobservable inputs in which there is little or no market data, which require the reporting entity to develop its own assumptions.
Investment Measured at Fair Value on a Recurring Basis:
|
Fair Value
Hierarchy
|
Fair Value at
December 31, 2010 |
Fair Value at
December 31, 2009 |
|
|
Current Asset
Marketable Securities - Trading Securities
|
Level 1
|
$263,741
|
-
|
The marketable securities held at December 31, 2010 are investments in companies in the phosphate industry that were listed on a US stock exchange and the Australian Stock Exchange. The cost of the investments was A$196,772, the market value at December 31, 2010 was A$263,741 and the net unrealized gain was A$66,891. Unrealised gains and losses are included in earnings in the period they arise.
Other Investments
During December 2009, the Company invested A$2,784,477 in exchange for shares in a Fund that purchases shares in companies quoted on international stock exchanges. The fair value of the equity security is not readily determinable from published information. The Company accounts for these investments at cost and reviews the carrying amount for impairment at each balance sheet date. The Company has assessed the current net asset value of the investment from information provided by the Fund Manager and determined that no impairment is necessary at December 31, 2010 and 2009.
Under the rules of the fund, the redemption of any part of the investment requires notice to be given to the Fund’s manager at least three months prior to redemption. The Company provided such notice to the Fund’s manager on November 30, 2010. The Fund manager has advised that as at the exit date, the value after exchange revaluation was A$2,968,404, excluding exit costs.
|
11.
|
AFFILIATE TRANSACTIONS
|
Legend advances to and receives advances from various affiliates. All advances between consolidated affiliates are eliminated on consolidation.
In December 2004, the Company entered into an agreement with AXIS Consultants Pty Ltd to provide geological, management and administration services to the Company. AXIS is affiliated through common management. The Company is one of ten affiliated companies. Each of the companies has some common Directors, officers and shareholders. In addition, each of the companies is substantially dependent upon AXIS for its senior management and certain mining and exploration staff. A number of arrangements and transactions have been entered into from time to time between such companies. It has been the intention of the affiliated companies and respective Boards of Directors that each of such arrangements or transactions should accommodate the respective interest of the relevant affiliated companies in a manner which is fair to all parties and equitable to the shareholders of each. Currently, there are no material arrangements or planned transactions between the Company and any of the other affiliated companies other than AXIS.
F-21
Legend holds a 9.09% interest in AXIS at a cost of A$1 and which is accounted for under the cost method.
During 2009, AXIS charged the Company A$4,876,381 in management fees including salaries incurred in relation to AXIS staff that provided services to the Company, A$8,273,059 for exploration services provided to the Company, interest of A$81,504, provided advance funding to AXIS of A$606,000 and we repaid A$12,805,855. AXIS charged interest at a rate between 9.25% and 10.35% for 2009. The amount owed by AXIS at December 31, 2009 was A$1,878,205, and is included in non-current assets - receivables.
During 2010, AXIS charged the Company A$7,003,453 for management and administration services and A$7,598,615 for exploration services. The Company paid A$17,318,036 for 2010 charges and funding advances. AXIS made repayments of A$14,602,068 during 2010. The amount owed by AXIS at December 31, 2010 under non-current assets – advances to affiliates was A$2,818,609. For 2010, the Company charged AXIS interest of A$174,011 at a rate between 10.05% and 11.19%
During the 2009 year, the Company invested in North Australian Diamonds Ltd (“NADL”) through on-market purchases on ASX and through a takeover offer. At December 31, 2010, the Company held 50.4% of the issued shares of NADL (2009: 47.83%). The Company’s President and Chief Executive Officer, Executive General Manager and one of its independent Directors are Executive Chairman and Managing Director, and Directors respectively of NADL.
During the 2009 year, the Company and NADL entered into a camp access agreement and airfield access agreement relating to the Merlin camp and airstrip to allow the Company to utilize these facilities. During the 2010 year, under the camp access agreement, the Company paid NADL A$322,184 for accommodation, meals and fuel and the Company paid NADL A$205,205 costs incurred on behalf of Legend. NADL paid the Company A$505,648 for costs incurred on behalf of NADL. At December 31, 2010, the Company owes NADL A$24,896 under the agreement.
During the 2009 and 2010 years, the Company took a private placement of shares of common stock in Northern Capital Resources Corp (“NCRC”). At December 31, 2010, the Company held 31.46% of the shares of NCRC (2009: 21.29%). The Company’s President and Chief Executive Officer and one of its independent Directors are President and Chief Executive Officer and Director respectively of NCRC. The amount owed by NCRC at December 31, 2010 included under non-current assets – advances to affiliates was A$220,877.
|
12.
|
GOODWILL
|
Goodwill of A$1,092,950 recognises the inherent value of prospective exploration interest not recognised as such values are not capable of being capitalized to the balance sheet under US GAAP. Goodwill is not deductible for tax purposes. In accordance with Topic 350, Intangibles - “Goodwill and Other”, the Company completed an impairment test and determined that the goodwill recorded at the acquisition date was not impaired
|
13.
|
MINERAL RIGHTS
|
An independent experts’ report prepared for NADL as part of its Target’s Statement to respond to the on market takeover offer by the Company during 2009 included a valuation of Mineral Rights of the mineral properties of NADL with mineralized material which were valued at A$18,873,000. Under US GAAP, exploration expenditure is expensed to the Income Statement as incurred, unless there is a reserve on the property.
The underlying mineral property licenses have a set term and the Mineral Rights are being amortized over the term of the licenses. The amortization charge for 2010 is A$1,398,502 (2009: A$233,084) and the net carrying value of Mineral Rights at December 31, 2010 is A$16,891,787.
|
14.
|
LONG-TERM DEBT
|
During November 2010, the Company entered into a loan facility agreement, which provides for a US$3.2 million credit facility and has a term of five years. Interest on borrowings under the agreement will be fixed at 6.70% per annum.
F-22
Borrowings under this agreement amounted to A$2.83 million (US$2.88 million) at December 31, 2010 owed to the financier by our wholly owned subsidiary are secured by certain equipment purchased by the Company. This debt matures in 2015 with the aggregate amount of payment obligations after December 31, 2010 as follows:
|
Year
|
A$000s
|
US$000s
|
|
2011
|
224
|
228
|
|
2012
|
239
|
243
|
|
2013
|
256
|
260
|
|
2014
|
274
|
278
|
|
2015
|
1,842
|
1,872
|
|
Total
|
$2,835
|
$2,881
|
In January 2011, the Company drew down an additional A$295,188 (US$300,000) from its long-term debt facility to finance the further work required on the aforementioned equipment.
|
15.
|
INCOME TAXES
|
The Company has adopted the provisions of ASC Topic 740 "Income Taxes". ASC 740 requires recognition of deferred tax liabilities and assets for the expected future tax consequences of events that have been included in the financial statements or tax returns. Under this method, deferred tax liabilities and assets are determined based on the differences between the financial statement and tax basis of assets and liabilities using enacted tax rates in effect for the year in which the differences are expected to reverse.
ASC Topic 740 prescribes how a company should recognise, measure, present and disclose in its financial statements uncertain tax positions that the Company has taken or expects to take on a tax return. Additionally for tax positions to qualify for deferred tax benefit recognition under ASC 740, the position must have at least a “more likely than not” chance of being sustained upon challenge by the respective taxing authorities, and whether or not it meets that criteria is a matter of significant judgement. The Company believes that it does not have any uncertain tax positions that would require the recording or disclosure of a potential tax liability.
The Company follows the asset and liability approach which requires the recognition of deferred tax liabilities and assets for the expected future tax consequences of temporary differences between the carrying amounts and the tax basis of assets and liabilities. For the period presented, there was no taxable income. There are no deferred income taxes resulting from temporary differences in reporting certain income and expense items for income tax and financial accounting purposes. The Company, at this time, is not aware of any net operating losses which are expected to be realised.
The Company is subject to taxation in both the USA and Australia.
At December 31, 2010 and 2009, deferred taxes consisted of the following:
|
USA
2010
A$
|
Australia
2010
A$
|
Total
2010
A$
|
||||||||||
|
Deferred tax assets
|
||||||||||||
|
Net operating loss carry-forward
|
10,361,505 | 20,046,943 | 30,408,448 | |||||||||
|
Exploration expenditure
|
18,134,167 | - | 18,134,167 | |||||||||
|
Less valuation allowance
|
(28,495,672 | ) | (20,046,943 | ) | (48,542,615 | ) | ||||||
|
Net deferred taxes
|
- | - | - | |||||||||
F-23
|
USA
2009
A$
|
Australia
2009
A$
|
Total
2009
A$
|
||||||||||
|
Deferred tax assets
|
||||||||||||
|
Net operating loss carry-forward
|
7,082,673 | 12,426,769 | 19,509,442 | |||||||||
|
Exploration expenditure
|
11,914,882 | - | 11,914,882 | |||||||||
|
Less valuation allowance
|
(18,997,555 | ) | (12,426,769 | ) | (31,424,324 | ) | ||||||
|
Net deferred taxes
|
- | - | - | |||||||||
Under ASC 740, tax benefits are recognised only for tax positions that are more likely than not to be sustained upon examination by tax authorities, based on the technical merits of the position. The valuation allowance offsets the net deferred tax asset for which there is no assurance of recovery. The valuation allowance will be evaluated at the end of each year, considering positive and negative evidence about whether the deferred tax asset will be realized. The Company’s tax years for all years since December 31, 2007 remain open to most taxing authorities.
At that time, the allowance will either be increased or reduced; reduction could result in the complete elimination of the allowance if positive evidence indicates that the value of the deferred tax assets is no longer impaired and the allowance is no longer required.
As a result of the ownership change that occurred in November 2004 (see note 1), Internal Revenue Code Section 382 limits the use of available operating loss carryforwards for losses incurred prior to the ownership change. Carry-forward net operating losses will be available to offset future taxable income. Total available net operating loss carryforwards in the United states, which are subject to limitations, amount to approximately A$29,600,000 at December 31, 2010 expire in years 2023 through 2030. Net operating loss carryforwards in Australia do not have a definite expiration date and amounted to approximately A$66,800,000.
|
16.
|
COMMITMENTS AND CONTINGENCIES
|
The Company is a party to claims that arose in the normal course of business. Management of the Company believes that the ultimate outcome of these claims will not have a material effect on the consolidated financial statements.
The Company has entered into lease agreements for the rental of office premises and equipment which expire between 2011 and 2013. The lease agreements have a monthly payment as adjusted by the increase in the consumer price index in Australia annually, and the future commitment amounts to A$546,987 (US$555,897).
|
A$
|
|
|
Future minimum lease payments under the Company’s non-cancellable operating leases are as follows:
|
|
|
2011
|
276,899
|
|
2012
|
231,790
|
|
2013
|
38,292
|
F-24
Exploration
The Company has to perform minimum exploration work and expend minimum amounts of money on its tenements. The overall expenditure requirement tends to be limited in the normal course of the Company’s tenement portfolio management through expenditure exemption approvals, and expenditure reductions through relinquishment of parts or the whole of tenements deemed non prospective. Should the company wish to preserve interests in its current tenements the amount which may be required to be expended is as follows:
| $2010A | $2009A | |||||||
|
Not later than one year
|
1,882,928 | 6,724,027 | ||||||
|
Later than one year but not later than five years
|
4,273,869 | 6,423,559 | ||||||
|
Later than five years but not later than twenty one years
|
1,601,903 | 1,864,163 | ||||||
| 7,758,700 | 15,011,749 |
|
17.
|
SUBSEQUENT EVENTS
|
The Company has evaluated events and transactions after the balance sheet date and, through the date the consolidated financial statements were issued, believes that all relevant disclosures have been included herein and there are no other which require recognition or disclosure in the accompanying consolidated financial statements.
F-25
Appendix A
GLOSSARY
In this Form 10-K, we use certain capitalized and abbreviated terms, as well as technical terms, which are defined below.
|
ALUMINUM FLUORIDE
|
AlF3 an inorganic compound produced by reacting Aluminium Hydroxide Al(OH)3 with Fluorosilicic Acid H2SiF6. It is an important additive for the production of aluminium by electrolysis.
|
|
APATITE
|
aA pale green to purple mineral, found in sedimentary rocks, igneous rocks and metamorphosed limestones. It is used in the manufacture of phosphorus, phosphates, and fertilizers. Composition: calcium fluorophosphate or calcium chlorophosphate. General formula: Ca5(PO4,CO3)3(F,OH,Cl). Crystal structure: hexagonal
|
|
ASSAY
|
To analyze the proportions of metals in a specimen of rock or other geological material. Results of a test of the proportions of metals in a specimen of rock or other geological material.
|
|
ASSAYING
|
Qualitative or quantitative analysis of a metal or ore to determine its chemical components.
|
|
BACKGROUND
|
As pertains to geochemical data; the variation in natural abundance of a particular metal or other constituent within a specific geological setting.
|
|
BENEFICIATION
|
Any process that, from an ore feedstock, liberates valuable minerals, in this case phosphates, from most other waste materials.
|
|
BPL
|
the traditional measure known as the Bone Phosphate of Lime, by weight percentage, of calcium phosphate contained in phosphate rock which converts to % P2O5 by dividing by 2.185.
|
|
BULK DENSITY
|
is aA property of powders, granules and other "divided" solids, especially used in reference to mineral components. It is defined as the mass of many particles of the material divided by the total volume they occupy. The total volume includes particle volume, inter-particle void volume and internal pore volume.
|
|
CAMBRIAN
|
The Cambrian is the first geological period of the Paleozoic Era, lasting from 542 ± 0.3 million years ago to 488.3 ± 1.7 million years ago.
|
|
CaO
|
Chemical Symbol for Calcium Oxide
|
|
COLLAR
|
The start or beginning of a drill hole or the mouth of an underground working entrance.
|
|
CONE SPLITTER
|
Sample splitting device attached to the bottom of the cyclone on a RC (reverse circulation) drill rig. Cuttings are gravity fed over a stainless steel cone and multiple outlets capture the divided sample. This splitting method is considered “best practice” within the industry as it eliminates a grainsize bias between samples.
|
|
CONFIDENCE LEVEL
|
statistical likelihood (probability) that a random variable lies within the confidence interval of an estimate.
|
|
CRATON
|
The relatively stable nucleus of a continent. Cratons are made up of a shield-like core of Precambrian Rock and a buried extension of the shield.
|
A-1
|
DAP/MAP
|
Diammonium Phosphate (DAP) and Monoammonium Phosphate (MAP) are phosphate salts produced by reacting phosphoric acid with ammonia. They are both used as fertiliser.
|
|
DEVONIAN
|
The fourth geological period of the Paleozoic Era, spanning 408 to 360 million years ago.
|
|
DIAMOND DRILL
|
A method of extracting core samples from the earth. A series of rods/ tubes with a diamond encrusted drill bit on the end are rotated under pressure to cut a drill hole into the earth. The internal core sample is then recovered for testing and study.
|
|
DIRECT ACIDULATION
|
reaction of phosphate rock or beneficiated phosphate concentrates with sulfuric acid to produce phosphoric acid feedstocks.
|
|
DISSEMINATED
|
Fine grain particles of minerals that occur within the rock
|
|
FACIES
|
A term applied to sedimentary units and the rocks that belong to them
|
|
FAULT
|
A fracture or fracture zone in rock along which there has been displacement of the two sides relative to each other and parallel to the fracture plane.
|
|
FE/Fe2O3
|
Chemical symbol for iron.
|
|
FE2O3
|
Iron Oxide
|
|
FLOTATION
|
The process of using chemicals to move fine grain particles in a solution, one process used in beneficiation
|
|
FOB
|
acronym meaning “free on board” used in conjunction with a port of reference. It is a shipping term outlining which party pays for transportation costs to port, as well as loading costs.
|
|
FRACTURE
|
A general term for any break in a rock, whether or not it causes displacement.
|
|
GOETHITE
|
FeO(OH) is an iron hydroxide mineral often formed through the weathering of other iron compounds. As a result, it is usually unreactive to acid attack.
|
|
ICP ACID DIGEST
|
Is a technique used for assaying phosphate rock. Commercial laboratories digest the sample in acid and then analyse it using a multi-element inductively coupled plasma atomic emission spectrometer (ICP-AES).
|
|
INTRACRATONIC BASIN
|
A depression in the Earths surface caused by subsidence, notable for its lack of significant surrounding highland areas and is usually subsequently filled with sediments..
|
|
KARST
|
Topography formed by weathered limestone
|
|
LATERITE
|
Weathered material composed principally of the oxides of iron, aluminum, titanium, and manganese; laterite ranges from soft, earthy, porous soil to hard, dense rock.
|
|
LITHOLOGY
|
A set of characteristics particular to a rock formation.
|
|
MEAN
|
The average value of a set of numbers.
|
|
MESOZOIC
|
The era of geologic time from about 245 to 65 million years ago.
|
|
METALLURGICAL TEST
|
A general term for a number of mechanical or chemical processes that are employed to test the amenability of separating metals from their ores.
|
A-2
|
METAMORPHOSED
|
Rock or mineral that has undergone mineralogical and/or structural change in response to elevated pressures, temperatures or changes in chemical conditions.
|
|
MICACEOUS
|
Mica’s are a group of platy silicate minerals. A rock described as micaceous is either consisting of or pertaining to mica, or has characteristics resembling a mica, either in lustre or in having the property of being easily split into thin sheets.
|
|
MICRONS
|
a unit of measurement equal to the micrometer, or one-millionth of a meter (1x10⁻⁶m).
|
|
MICROSPHORITE
|
Very fine grained phosphorite (phosphate rich rock)
|
|
MINERALIZATION
|
The process or processes by which a mineral or minerals are introduced into a rock, resulting in an enriched deposit; or the result of these processes.
|
|
MINERALIZED
|
Rock that has undergone the process of mineralization.
|
|
ORDOVICIAN
|
The second period of the Paleozoic Era, from about 505 to 438 million years ago.
|
|
ORE
|
See RESERVE.
|
|
OUTLIER
|
an outcrop of rocks that is entirely surrounded by older rocks.
|
|
OVERTHRUSTING
|
a reverse fault in which the rocks on the upper surface of a fault plane have moved over the rocks on the lower surface.
|
|
P2O5
|
Chemical symbol for phosphorus pentoxide
|
|
P80
|
a measurement of grinding ability, where 80% of the ground ore will pass through mesh of a pre-determined screen. In this case, a P80 of 150 microns is required.
|
|
PALAEOZOIC
|
The era of geologic time from about 540 to 245 million years ago.
|
|
PELLETAL PHOSPHORITE
|
These particulate rocks vary from pale grey-white to yellowish-brown, are highly porous, with a sandy texture and are friable. Pelletal phosphorites are almost completely comprised of collophane (carbonate fluorapatite) occurring as phosphatic fossil fragments and ovulitic peloids. Grainsize is typically around 0.2 - 1.0 mm with a loose cement of collophane mud.
|
|
PERMIAN
|
The seventh and last period of the Paleozoic Era, from about 286 to 245 million years ago.
|
|
PHOSPHORITE
|
A sedimentary rock that contains at least 20 per cent of phosphate minerals.
|
|
PRECAMBRIAN
|
A period of geologic time earlier than 544 million years before present.
|
|
PROBABLE RESERVES
|
Probable (Indicated) Reserves refers to reserves for which quantity and grade and/or quality are computed from information similar to that used for proven (measured) reserves, but the sites for inspection, sampling, and measurement are farther apart or are otherwise less adequately spaced. The degree of assurance, although lower than that for proven reserves, is high enough to assume continuity between points of observation.
|
|
PROTEROZOIC
|
The later of the two divisions of the Precambrian Eon, from about 2.5 billion to 540 million years ago.
|
A-3
|
PROVEN RESERVES
|
Proven (Measured) Reserves refers to reserves for which (a) quantity is computed from dimensions revealed in outcrops, trenches, workings, drillholes; grade and/or quality are computed from the results of detailed sampling and (b) the sites of inspection, sampling and measurement are spaced so closely and geologic character is so well defined that size, shape, depth and mineral content of reserves are well-established.
|
|
QA/QC
|
Quality Assurance and Quality Control – refers to the procedures and measures put in place and taken during the drilling and assaying process of the deposit that ensure only repeatable and high quality data is obtained.
|
|
QUARTZ
|
A glassy silicate and common rock forming mineral (SiO2).
|
|
RADIOMETRIC SURVEY
|
Geophyisical survey looking at the emission of radiation from rocks at very low levels. Used as an exploration tool.
|
|
RC DRILLING
|
Reverse Circulation (RC). Drilling technique used which has a double tube to pass the air down between the inner tube and outer tube, with the sample returned up the inner tube.
|
|
REPLACEMENT
|
Pertaining to a type of mineral deposit that forms by partial or complete replacement of bedrock constituents by new minerals, generally by the action of hydrothermal fluids.
|
|
REPLACEMENT PHOSPHORITE
|
BH South geologists recognised a more indurated, porcellanous form of phosphorite which they termed ‘replacement’ phosphorite. Petrographic studies suggested this material originated from the replacement of limestone or dolomite in the sub-stratum by phosphate (Rogers and Keevers, 1976). Replacement phosphorite is white to tan in colour and consists of structureless collophane containing minor silt, chert and clay. Replacement phosphorite is typically of high-grade.
|
|
RESERVE
|
That part of a mineral deposit which could be economically and legally extracted or produced at the time of the reserve determination.
|
|
RESOURCE
|
Pertaining to the quantity or bulk of mineralized material without reference to the economic viability of its extraction (see reserve).
|
|
REVERSE CIRCULATION
|
The method of drilling that was used to obtain the majority of data that has been used in this resource estimation process. Pressurised air is forced down the outside of a string of drill rods that contain an inner-tube. The air drives a hammer and drill bit that breaks and pulverises the rock, once broken down the reverse air pressure forces the resulting material back up the inner-tube to be sampled at the top of the hole.
|
|
SAMPLE VARIANCE
|
A measurement of how spread out a set of numbers/results are from each other.
|
|
SEDIMENT
|
Fragmental material that originates from weathering of rocks and that is transported by air, water, ice or other natural agents, and that forms in layers on the Earth's surface at ordinary temperatures in a loose, unconsolidated form; e.g. silt, sand, gravel, etc.
|
|
SELECTED SAMPLE
|
A specimen of a mineralized zone that is not intended to be representative of the deposit as a whole.
|
|
SHAPIRO TEST
|
A chemical visual colorimetric test developed in the 1960’s that was used in the field by LIH geologists to allow a quantitive estimate of phosphate content of material at the time of sampling.
|
A-4
|
SILCRETE
|
A hard surface deposit composed of sand and gravel cemented by chert and quartz, it is formed by chemical weathering and water evaporation in semi-arid environments.
|
|
SILICA/SiO2
|
A generic term for silicon dioxide (SiO2), the most common form of which is quartz.
|
|
SILURIAN
|
The third period of the Paleozoic Era, from about 438 to 408 million years ago.
|
|
SPLIT
|
A portion of a rock or soil sample that is separated from the bulk of the original before the analytical process so as to provide material for re-analysis as a check of the accuracy of the original procedure should it be required.
|
|
STANDARD DEVIATION
|
A statistic used as a measure of the dispersion or variation in a distribution, equal to the square root of the arithmetic mean of the squares of the deviations from the arithmetic mean.
|
|
STANDARD ERROR
|
The standard deviations of the sample in a frequency distribution, obtained by dividing the standard deviation by the total number of cases in the frequency distribution.
|
|
STRATA
|
Beds or layers of rock.
|
|
STRATIGRAPHY
|
that aspect of the geology of an area that pertains to the character of its stratified rock.
|
|
STRIKE
|
The course or bearing of the outcrop of an inclined bed, vein or fault plane on a level surface; the direction of a horizontal line perpendicular to the dip.
|
|
TENEMENT
|
An area of land leased by a mining company from the government upon which they carry out exploration activities.
|
|
TERMS OF REFERENCE
|
Terms of reference describe the purpose and structure of a project, committee, meeting, negotiation, or any similar collection of people who have agreed to work together to accomplish a shared goal. The terms of reference of a project are often referred to as the project charter.
|
|
TERTIARY
|
The first period of the Cenozoic Era, from about 65 to 2 million years ago.
|
|
VEIN
|
An epigenetic mineral filling of a fault or other fracture in a host rock, in tabular or sheetlike form, often as a precipitate from a hydrothermal fluid.
|
|
WEIGHTED AVERAGE
|
Value calculated from a number of samples, each of which has been “weighted” by a factor of the individual sample width.
|
|
WORKING
|
A general term for any type of excavation carried out during the course of mining or mining exploration.
|
|
XRF
|
X-Ray Fluorescence Spectroscopy is a means of identifying elements in a compound by bombarding that compound with x-rays and measuring the unique elemental signature produced.
|
A-5
Appendix B
REFERENCES
Association of Fertilizer and Phosphate Chemists. 2010. AFPC Analytical Methods Manual, 10th Edition.
Rogers, J.K. and Keevers, R.E. 1976. Lady Annie-Lady Jane Phosphate Deposits, Georgina Basin, Queensland. In: Economic Geology of Australia and Papua New Guinea, Vol. 4. Industrial Minerals and Rocks (Ed C.L. Knight), pp. 251-265. Australasia Institute of Mining and Metallurgy, Monograph 8.
Shergold, J.H. and Druce, E.C. 1980. Upper Proterozoic and Lower Palaeozoic rocks of the Georgina Basin. In: The Geology and Geophysics of North-Eastern Australia (Eds R.A. Henderson and P.J. Stephenson), pp. 149 - 174. Geological Society of Australia, Queensland Division, Brisbane.
Thomson, L.D. and Rogers, J.K. 1974. The Discovery and Development of Queensland Phosphates by BH South Limited. Paper presented to the Regional Meeting of the Australasian Institute of Mining and Metallurgy (North-west Queensland Branch) on August 27th, 1974, Mt Isa, 26 pp.
Thomson, L.D. and Russell, R.T. 1971. Discovery, Exploration, and Investigations of Phosphate Deposits in Queensland. Proceedings of the Australian Institute of Mining and Metallurgy, 240: 1-14.
Freeman, M.J., Shergold, J.H., Morris, D.G. and Walter, M.R. 1990. Late Proterozoic and Palaeozoic basins of Central and Northern Australia - regional geology and mineralisation. In: Geology of the Mineral Deposits of Australia and Papua New Guinea (Ed F.E. Hughes), pp. 1125-1133. The Australasian Institute of Mining and Metallurgy, Melbourne.
Howard, P.F. 1972. Exploration for phosphorite in Australia - a case history. Economic Geology, 67: 1180 - 1192.
Rogers, J.K. 1986. Report on area relinquished – April 1985, Authority to prospect 903M, Northwest Queensland, Queensland Phosphate Ltd, CR15132. 64p.
Rogers, J.K. and Keevers, R.E. 1976. Lady Annie-Lady Jane Phosphate Deposits, Georgina Basin, Queensland. In: Economic Geology of Australia and Papua New Guinea, Vol. 4. Industrial Minerals and Rocks (Ed C.L. Knight), pp. 251-265. Australasia Institute of Mining and Metallurgy, Monograph 8.
Shergold, J.H. and Druce, E.C. 1980. Upper Proterozoic and Lower Palaeozoic rocks of the Georgina Basin. In: The Geology and Geophysics of North-Eastern Australia (Eds R.A. Henderson and P.J. Stephenson), pp. 149 - 174. Geological Society of Australia, Queensland Division, Brisbane.
Thomson, L.D. and Russell, R.T. 1971. Discovery, Exploration, and Investigations of Phosphate Deposits in Queensland. Proceedings of the Australian Institute of Mining and Metallurgy, 240: 1-14.
B-1