Attached files
| file | filename |
|---|---|
| 8-K - CURRENT REPORT ON FORM 8-K - DELTA AIR LINES, INC. | delta_8k-121510.htm |
Exhibit 99.1

Delta: State of the Airline
Richard Anderson
Chief Executive Officer

Delta: Building a Better Airline
Ed Bastian
President

2
Delta: Building A Better Airline
Higher revenues plus solid cost performance
drive $2.6 billion year-over-year improvement in
profitability for 2010
drive $2.6 billion year-over-year improvement in
profitability for 2010
Aggressively reducing debt using ~$2 billion
annual free cash flow
annual free cash flow
Addressing gaps in customer product,
technology, facilities and fleet is key to
generating superior revenues and returns
technology, facilities and fleet is key to
generating superior revenues and returns
Note: All results exclude special items
A successful 2010 with
room to improve in 2011
room to improve in 2011
Derisking the business
through balance sheet
improvements
through balance sheet
improvements
While making long-term
investments in the
business
investments in the
business

3
Meeting Our Commitments Led To Successful 2010
|
• Improve financial performance
|
|
Increased pre-tax income $2.6 billion and
operating margin 8 points |
|
• Complete merger integration and deliver
$1.3 billion in synergies |
|
Technology integration complete, single
operating certificate achieved and $1.5 billion in synergies realized |
|
• Reallocate our fleet across the
integrated network |
|
Matched supply with demand, improved
margins and reduced fleet by 90 aircraft |
|
• Enhance the quality of our product
|
|
Initiated $1 billion product investment,
revamped delta.com, and broke ground on new JFK terminal |
|
• Maintain best-in-class cost structure
|
|
Kept consolidated ex-fuel unit costs flat to
2009 and consistent with 2007 levels |
|
• Use free cash flow to aggressively
reduce debt |
|
Reduced adjusted net debt from $17 billion to
$15 billion |
|
• Target 10% return on invested capital
|
|
Will earn 10% ROIC in 2010
|
What We Said
What We Did
ü
ü
ü
ü
ü
ü
ü

4
December Quarter In Line With Expectations
|
|
|
December Quarter 2010
|
|
|
|
Operating margin
|
6 - 7%
|
|
|
|
|
Fuel price
|
$2.45
|
|
|
|
|
Total unrestricted liquidity
|
$5.3 billion
|
|
|
|
|
|
|
|
|
|
|
|
|
December Quarter 2010 vs.
December Quarter 2009 |
|
|
|
Consolidated non-fuel unit cost
|
Down 3 - 4%
|
|
|
|
|
|
|
|
|
|
|
System capacity
|
Up 7%
|
|
|
|
|
|
Domestic
|
Up 5%
|
|
|
|
|
International
|
Up 11%
|
|
|
Note: Unit costs exclude profit sharing expense

5
Achieved 2010 Return on Invested Capital Target
|
|
|
2009
|
|
2010
|
|
Operating Income
|
|
$0.1 billion
|
|
$2.7 billion
|
|
Market value of equity (assuming
$14/share) |
|
$11.8 billion
|
|
$11.8 billion
|
|
Adjusted net debt
|
|
$16.8 billion
|
|
$15.8 billion
|
|
Total invested capital
|
|
$28.6 billion
|
|
$27.6 billion
|
|
Return on invested capital
|
|
0.3%
|
|
9.8%
|
Note: All results exclude special items

6
Strengthen Balance
Sheet
Sheet
Top-Line Profitable
Growth
Growth
2011: Building A Better Airline
Focus ~$2 billion annual free cash flow toward net
debt reduction
debt reduction
Invest For The Future
Higher revenues and improved productivity from
targeted investments in airport facilities,
technology and on-board products
targeted investments in airport facilities,
technology and on-board products
Improved economic environment, increased
corporate business and capacity discipline to
drive solid top-line growth
corporate business and capacity discipline to
drive solid top-line growth

7
Economic
Growth
Growth
Passenger
Revenue
Revenue
Ancillary
Businesses
Businesses
• Macro environment
continues to improve
continues to improve
• Global Insights projects
worldwide GDP of 3%
worldwide GDP of 3%
– U.S. growth of 2 - 3%
– Stronger growth
expected in Asia-
Pacific
expected in Asia-
Pacific
• Delta’s planned system
capacity increase of 1 - 3%
in line with GDP forecasts
capacity increase of 1 - 3%
in line with GDP forecasts
• Solid passenger revenue
growth driven by unit
revenue increases
combined with higher
capacity
growth driven by unit
revenue increases
combined with higher
capacity
• PRASM expected to meet
2008 levels, despite
pressure from eliminating
smaller, high-RASM aircraft
2008 levels, despite
pressure from eliminating
smaller, high-RASM aircraft
• Expecting non-passenger
revenue to grow 5 - 10%
year over year
revenue to grow 5 - 10%
year over year
• More than $2 billion from
unbundled fees and
services
unbundled fees and
services
• Double digit revenue
improvements from
Commercial Aviation
Services businesses
improvements from
Commercial Aviation
Services businesses
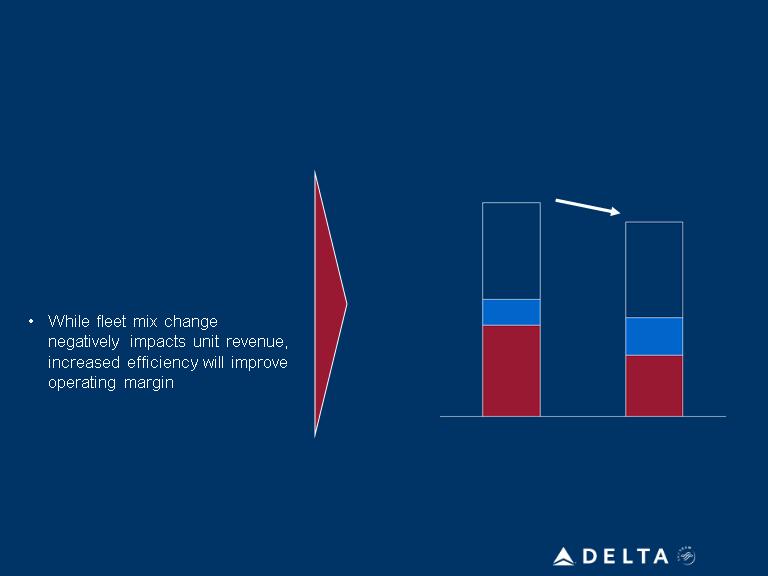
Revenue Environment Continues to Improve
Economic momentum, company actions combine for profitable top line growth

8
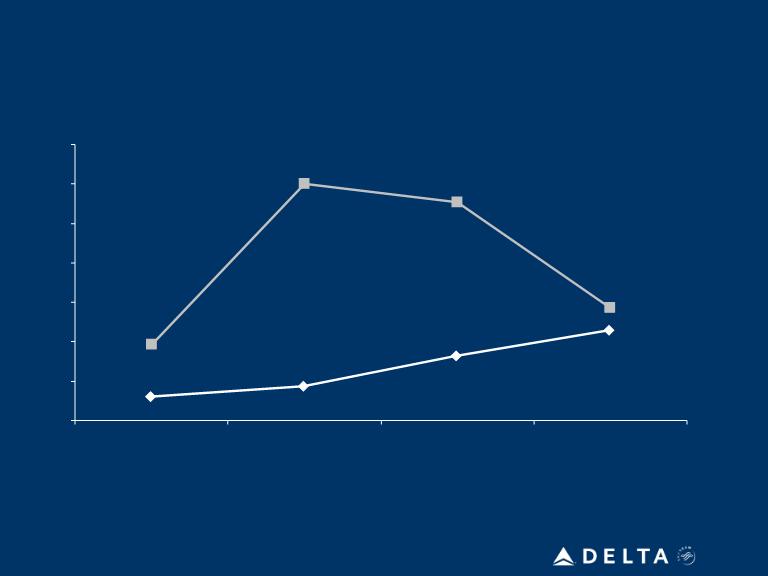
Passenger Revenue Momentum Continues
Passenger Unit Revenue Change
2010 vs. 2007
(9%)
(5%)
(2%)
(5%)
(9%)
flat
+1%
(4%)
Revenue
vs. 2007
vs. 2007
Capacity
vs. 2007
vs. 2007
0%
5%
10%
15%
20%
25%
1Q10
2Q10
3Q10
4Q10
2010 vs. 2009

9
Domestic Revenue Momentum
0%
2%
4%
6%
8%
10%
12%
14%
16%
18%
20%
1Q10
2Q10
3Q10
4Q10
2010 vs. 2007
(13%)
(10%)
(8%)
(10%)
(13%)
(7%)
(6%)
(9%)
Revenue
vs. 2007
vs. 2007
Capacity
vs. 2007
vs. 2007
Domestic Passenger Unit Revenue Change
2010 vs. 2009
10
0%
5%
10%
15%
20%
25%
30%
35%
1Q10
2Q10
3Q10
4Q10
International Revenue Momentum
2010 vs. 2007
(1%)
+4%
+7%
+3%
+2%
+16%
+16%
+7%
Revenue
vs. 2007
vs. 2007
Capacity
vs. 2007
vs. 2007
International Passenger Unit Revenue Change
2010 vs. 2009
11
Pacific
Transatlantic
Latin
Domestic
Capacity
GDP
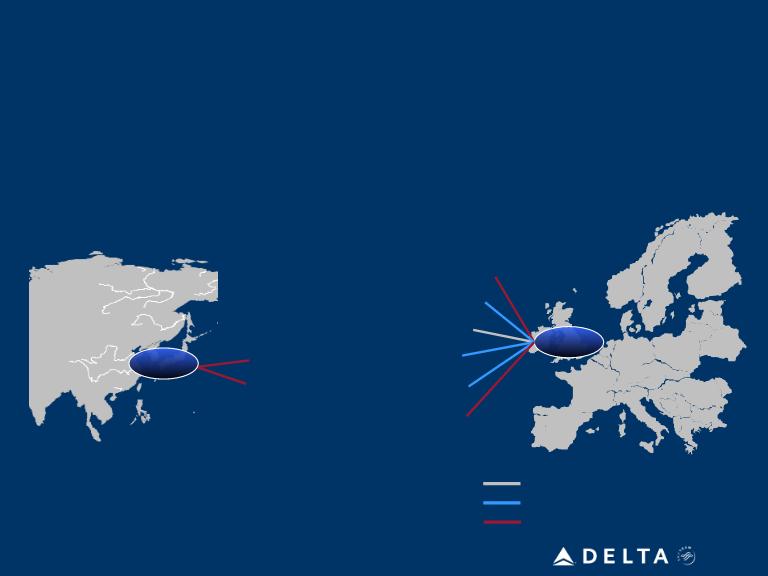
Responsible Deployment of Capacity in 2011
Additions to key restricted business markets drive international growth
Majority of international
growth from additions to
Heathrow, Haneda, Beijing
and Shanghai
growth from additions to
Heathrow, Haneda, Beijing
and Shanghai
Restricted Market Capacity
Projected system capacity growth of 1 - 3%

12
Aggressively pursuing
corporate contracts
corporate contracts
Corporate travel
momentum
momentum
Strong Traction With Corporate Revenue
Improved customer
service and support
service and support
• Broad sector strength has brought corporate
revenues back to 2007 levels
revenues back to 2007 levels
• Notable improvements in Autos and Banking
Broad sector strength, improved competitive position driving revenue growth
• Captured 2 pt. share increase vs. pre-merger levels
• Achieved targeted merger synergies
• $300 million in new contracts post-merger
• All contracts incorporate AF/KL joint venture
• Contracts in place with all Fortune 100 companies
• Ranked #1 in 3 of 5 categories in Morgan Stanley
Annual Global Travel Survey
Annual Global Travel Survey
• Most improved airline in Business Travel News survey
• Voted Best Airline for Travel Agent Support by
Recommend Magazine
Recommend Magazine

13
Ancillary Businesses
expected to generate 5-10%
revenue growth for 2011
expected to generate 5-10%
revenue growth for 2011
Ancillary Businesses Showing Strong Performance
Commercial
Aviation Services
Aviation Services
$1.5 billion
Cargo
$900 million
SkyMiles
$1.6 billion
Unbundled
Ticketing
Ticketing
$2.1 billion
Diversified revenue base reduces economic volatility

14
Factors Point To Solid Earnings Growth for 2011
Solid earnings
improvement for 2011
improvement for 2011
• Profitable top line growth
• System capacity growth of 1 -
3%
3%
• Manageable non-fuel unit cost
increases of 1 - 2%
increases of 1 - 2%
• Fuel volatility creates
headwind - however, solid
hedge book in place
headwind - however, solid
hedge book in place
• Non-operating expense
savings from debt reduction
savings from debt reduction
15
Operating Cash Flow
Capital Expenditures
$3 - $4 billion
Total Three-Year Projection
2010 - 2012
$9 - $10 billion
Adjusted Net Debt ($B)
Free Cash Flow
~$6 - 7 billion
Strong operating cash flow covers investments in product, facilities and fleet
Committed to Aggressive Debt Reduction
16
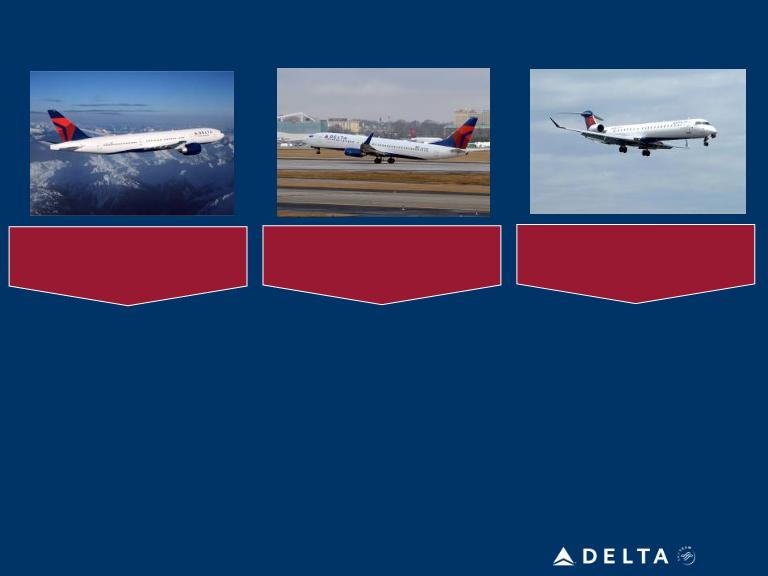
International
Domestic
Mainline
Mainline
Regional Aircraft
• 175 aircraft
• Average age: 11 years
• Investment to create high
quality product (flat bed
seats, in-seat video)
quality product (flat bed
seats, in-seat video)
• No imminent fleet renewal
needs
needs
• 542 aircraft
• Average age: 15 years
• Investment in seating
capacity and winglets to drive
increased efficiency
capacity and winglets to drive
increased efficiency
• Using secondary market to
backfill capacity from
retirements, but will assess
our options beyond 2012
backfill capacity from
retirements, but will assess
our options beyond 2012
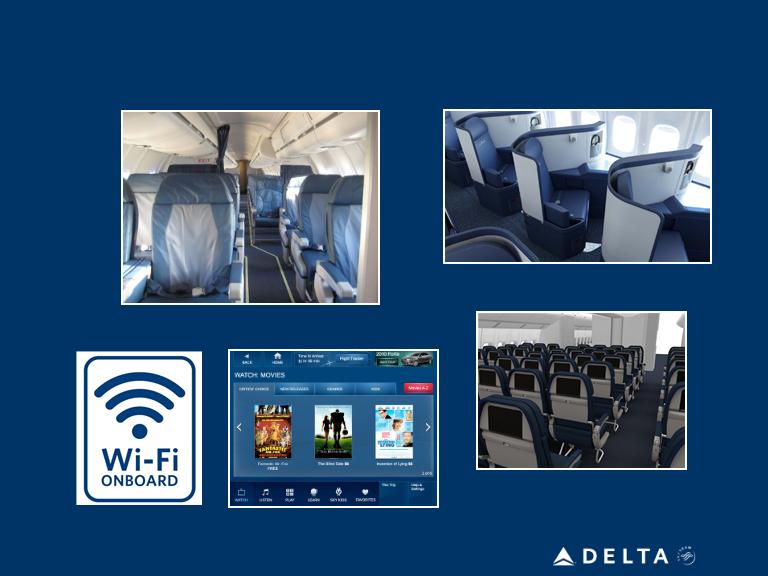
• 626 aircraft
• Average age: 7 years
• Investment in product to
create a consistent
experience (first class, wi-fi)
create a consistent
experience (first class, wi-fi)
• Continuing to reduce
turboprops and 50-seat jets
turboprops and 50-seat jets
Addressing Our Fleet Needs

17
Encouraged with progress, but more work remains to achieve this goal
10 - 12% operating margin
$5 billion EBITDAR
Minimize capital reinvestment
requirements
requirements
Use cash to delever the balance
sheet
sheet
Generate sustainable 10%+ return on invested capital
Path To Improving Shareholder Returns

Delta: Transforming Our Network
Glen Hauenstein
Executive Vice President - Network and Revenue
Management
Management

19
What We Fly
• Transform domestic fleet and enhance ability
to compete in key, high-demand markets
to compete in key, high-demand markets
• Focus on maximum return
Where We Fly
• Win in New York
• International growth in restricted access
markets
markets
• Utilize alliances to maximize global reach
• Monetize First Class product
• Capitalize on point-of-sale opportunities with
Joint Venture partners
Joint Venture partners
• Position for increased ancillary revenues
How We Sell
Delta: Transforming Our Network
20
Transforming the Domestic Fleet
• Post-merger fleet optimization
allows Delta to maintain footprint
with 9% fewer aircraft
allows Delta to maintain footprint
with 9% fewer aircraft
• Backfilling retired planes with
MD-90s, with 17 deliveries
scheduled for 2011
MD-90s, with 17 deliveries
scheduled for 2011
• Evolving fleet enhances Delta’s
ability to compete in key high-
demand markets due to
preferred product, larger gauge
and best-in-class cost structure
ability to compete in key high-
demand markets due to
preferred product, larger gauge
and best-in-class cost structure
Domestic Fleet
Single Class
Regionals
1,262
1,148
December
2009
December
2011
Serving the domestic network more efficiently while providing a superior product
Avg. Seats
% of Aircraft
With First Class
With First Class
92 95
57% 69%
Two Class
Regionals
Mainline
9%
reduction

21
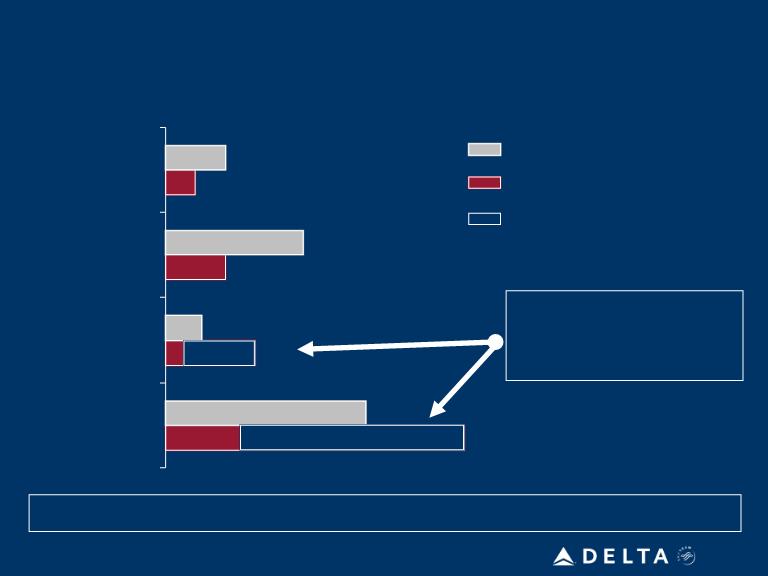
|
|
Change
|
|
Total Rev
|
5%
|
|
Total Cost
|
(14%)
|
|
Profit
|
$0.5M
|
|
Margin
|
21 pts
|
|
Unit Cost
|
(15%)
|
|
ASMs
|
1%
|
|
Passengers
|
1%
|
|
Load Factor
|
(0.6 pts)
|
Market Example: Atlanta to Daytona Beach
August 2009
Flights per Day: 7
Average Gauge: 66
August 2010
Flights per Day: 5
Average Gauge: 96
Schedule Change
Results
Atlanta to Daytona Beach reduced to 4 daily flights in September 2010 with an average
gauge of 138 seats, further improving market performance
gauge of 138 seats, further improving market performance
Refleeting to a Higher Gauge Improves Market
Profitability
Profitability
22
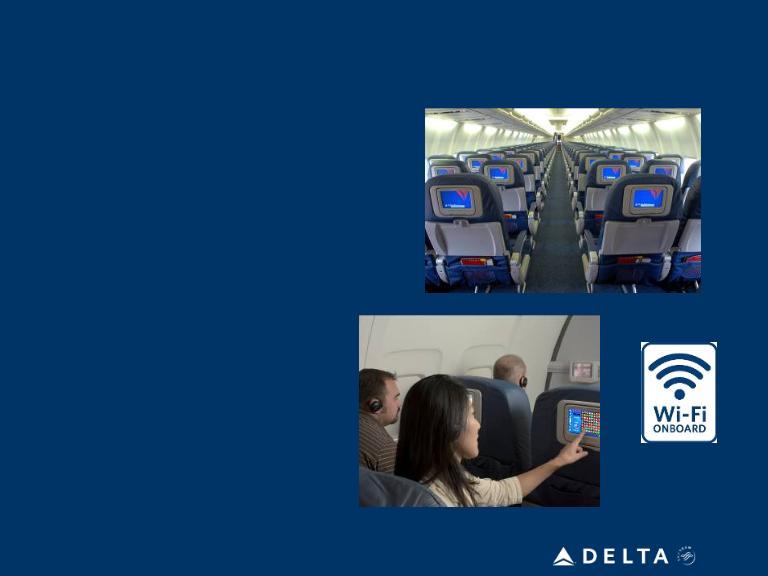
Improving Fleet Economics and Customer
Experience
Experience
• Expanding first class seating on
more than 60% of the mainline
domestic fleet
more than 60% of the mainline
domestic fleet
• No reduction to economy seat pitch
• Removal of unused galleys enables
additional seating, Improving
domestic fleet profitability
additional seating, Improving
domestic fleet profitability
• Increased first class seating
compliments other domestic
customer experience
improvements, including:
– Refurbished aircraft interiors
– Wi-Fi
– Seat-back entertainment
23
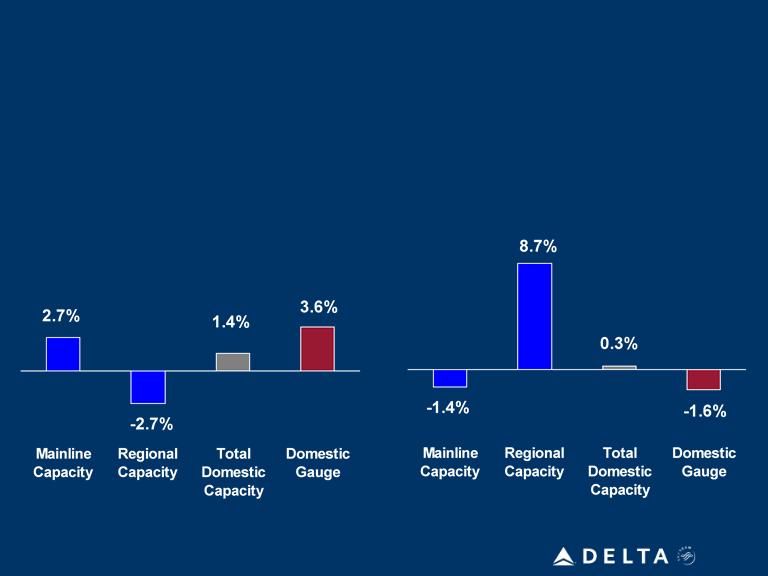
Delta Domestic Growth,
1st Half 2011 vs. 1st Half 2009
ATA Carrier Domestic Growth,
1st Half 2011 vs. 1st Half 2009
1st Half 2011 vs. 1st Half 2009
Increasing gauge on domestic flying
Delta’s Fleet Mix Change is Unique to the Industry

24
Become New
York Airline of
Choice
York Airline of
Choice
Implement JFK
Facility Solution
Facility Solution
Enhance Domestic
Network
Network
• Focus on high-value business
travelers with enhanced
SkyPriority services
travelers with enhanced
SkyPriority services
• Work closely with JV
operations team to improve on
-time performance, baggage
claims and passenger
misconnects
operations team to improve on
-time performance, baggage
claims and passenger
misconnects
• Establish Delta / Air France /
KLM / Alitalia Joint Venture as
the premiere alliance in JFK
KLM / Alitalia Joint Venture as
the premiere alliance in JFK
• $1.2B expansion and
enhancement to Terminal 4
with inter-terminal connections
to Terminal 3
enhancement to Terminal 4
with inter-terminal connections
to Terminal 3
• Relocation of Terminal 3
operations to Terminal 4 in
May 2013
operations to Terminal 4 in
May 2013
• Increase number of flights with
two-class product in LGA and
on JFK feeder flights
two-class product in LGA and
on JFK feeder flights
• Work towards LGA slot
transfer solution
transfer solution
Grow share in world’s premiere market
Win in New York
25
LHR
Atlanta
Detroit
New York
Minneapolis
Boston
Miami
Existing Service
Enhanced Service
New Service
London-Heathrow and Tokyo-Haneda are unique opportunities to expand in the
world’s richest business markets
world’s richest business markets
Tokyo-Haneda
London-Heathrow
Los Angeles
Detroit
HND
International Growth Centered on Highly Restricted
Markets
Markets
26
|
|
Delta
|
Delta with Partners
|
|
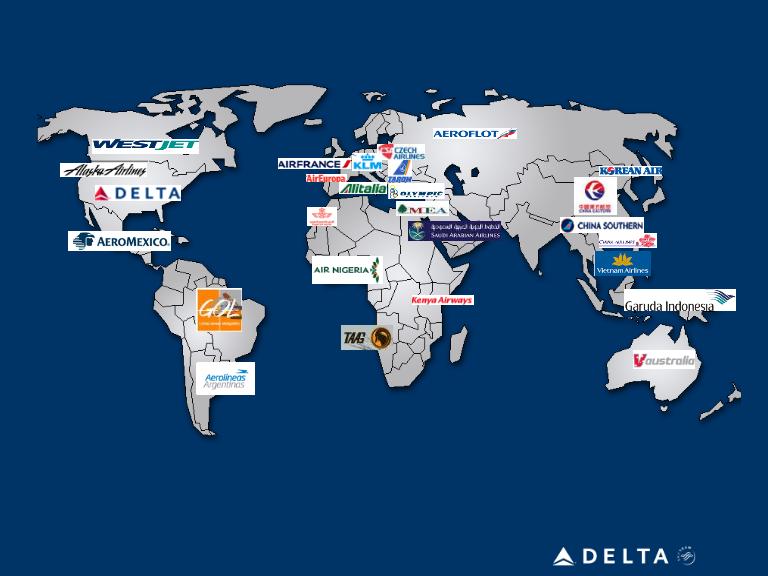
Destinations
|
363
|
1,071
|
|
Countries Served
|
67
|
181
|
|
Daily Flights
|
6,103
|
16,212
|
Global Alliances Maximize Global Reach

27
Capitalize on point-of-sale
opportunities with JV partners
opportunities with JV partners
• Leverage established relationship to expand
North Atlantic customer base
North Atlantic customer base
• Improve Italy share through Alitalia’s entry into
the JV
the JV
Monetize First Class Product
• Increase percentage of first class up-sells
– Currently in the test phase, with positive
results
results
– Full implementation scheduled for 2Q11
• Enhance delta.com shopping experience to
better capture up-sell opportunities
better capture up-sell opportunities
• Restructure fare products to better align value
of product attributes and fare paid
of product attributes and fare paid
• New e-commerce platform increases potential
for merchandising and other revenue benefits
for merchandising and other revenue benefits
Position for increased ancillary
revenues
revenues
Improving Revenue Production through Innovation

28
What We Fly
Focus on improving
margin
margin
• Domestic focus on
largest markets,
including New York
largest markets,
including New York
• International growth in
richest business
markets with limited
access
richest business
markets with limited
access
• Transform domestic
fleet, increasing gauge
and reducing unit cost
fleet, increasing gauge
and reducing unit cost
• Increase flights with
two-class product to
meet needs of
business travelers
two-class product to
meet needs of
business travelers
• Increase percentage of
first class seats sold
first class seats sold
• Capitalize on point-of-
sale opportunities with
JV partners
sale opportunities with
JV partners
• Position for increased
ancillary revenues
ancillary revenues
Where We Fly
How We Sell
Delta: Transforming Our Network

Delta: Enhancing the Customer Experience
Tim Mapes
Senior Vice President - Marketing

30
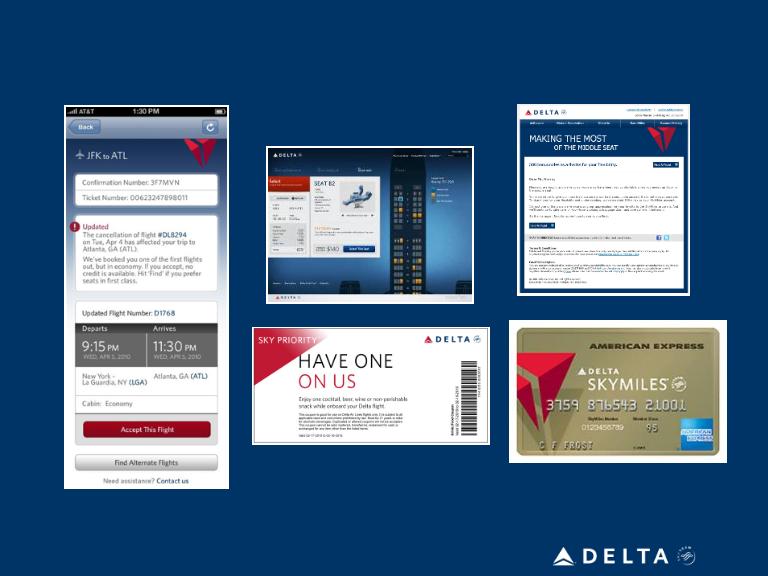
Enhancing the Customer Experience
Safe, clean, on-time, with your bags -
and a smile
and a smile
Products, services designed
for the HVC
for the HVC
People, technology centered
on customer needs
on customer needs
Greater speed, customer recognition,
productivity-enabling tools, and unconditional
protection if things go wrong
productivity-enabling tools, and unconditional
protection if things go wrong
Basics done well, consistently
Professionally-trained staff and intuitive,
industry-leading technology
industry-leading technology
31
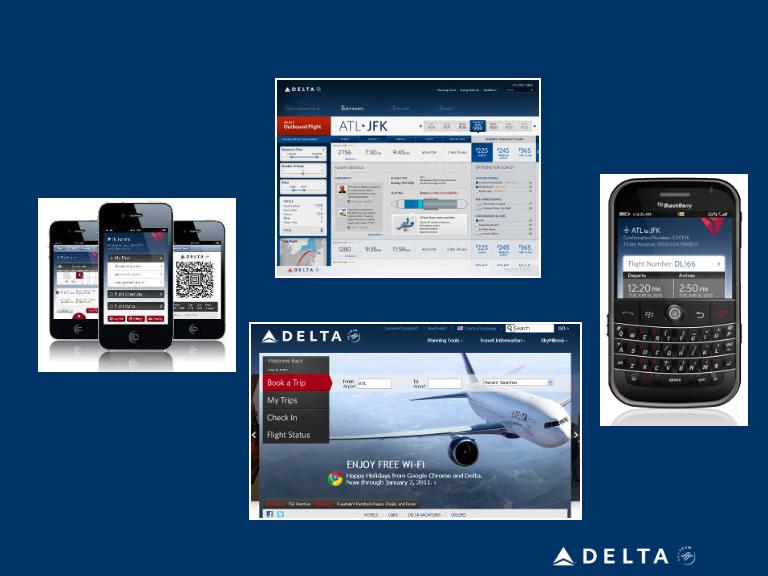
Enhancing the Customer Experience
At Booking
iPhone app
delta.com
Blackberry app
Merchandising
32
Enhancing the Customer Experience
On the Ground
33
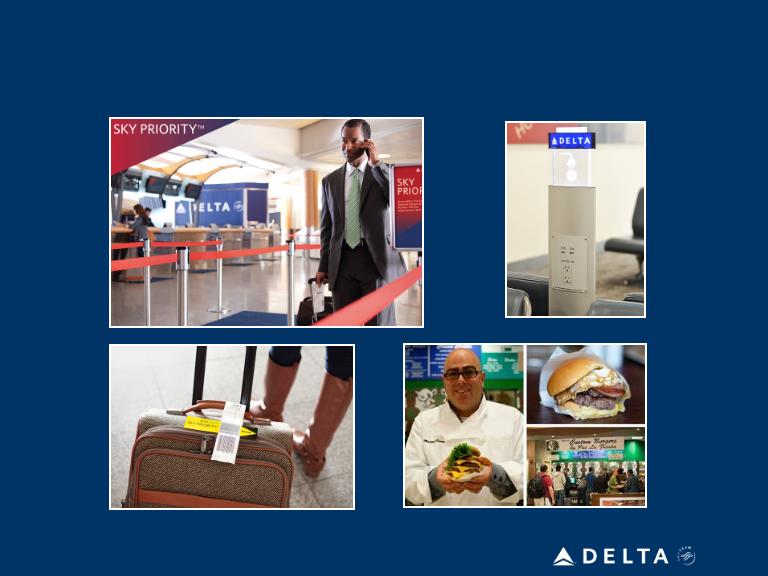
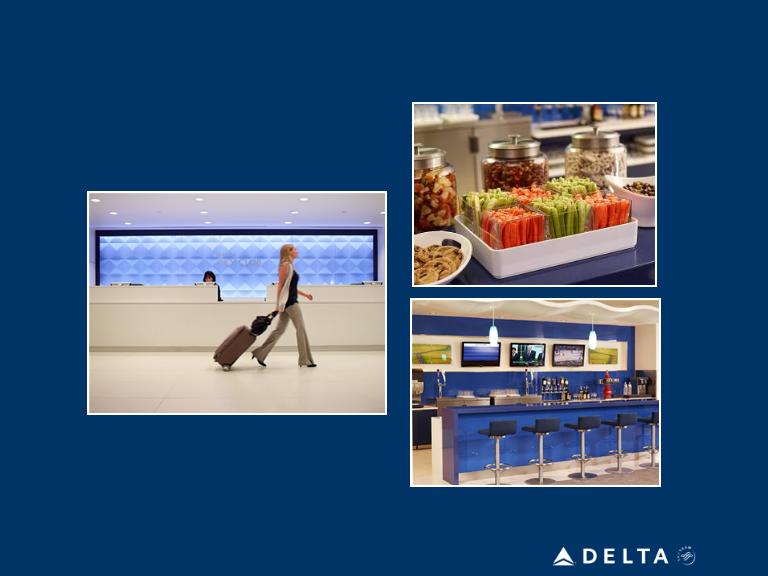
Enhancing the Customer Experience
On the Ground
Sky Club lounges
34
Enhancing the Customer Experience
In Flight
Flat bed seats
First Class on RJ’s
Seat-back AVOD
35
Enhancing the Customer Experience
Customer Service & CRM
1st Bag Free

36
In Summary
• In order to achieve superior rates of revenue
growth, a superior ratio of “promoters” to
“detractors” (net promoters) is required
growth, a superior ratio of “promoters” to
“detractors” (net promoters) is required
• Delta has been making targeted investments
in the elements of the customer experience
high-value customers (HVC) value most
in the elements of the customer experience
high-value customers (HVC) value most
• Every 1% of share gain from the HVC market
segment = $130 million
segment = $130 million

Delta: Unlocking Innovation with Technology
Theresa Wise
Senior Vice President - Chief Information Officer

38
Information Technology Integration Successfully
Complete
Complete
• Balanced speed with differentiation
• Expedited results and minimized risks with simple, disaggregated
solutions
solutions
• Completed without disruption to Delta and its Customers
• Integration was a significant focus through mid-2010
– 1,130 man-years in IT alone
– Delivery momentum will carry over to next generation solutions

39
Network &
Revenue
Management
Sales &
Customer
Retention
Delivering a
Premium Travel
Experience
Operational
Excellence
Ongoing Information Technology Investments
• Investments target returns related to revenue, cost efficiency,
operational excellence and customer experience
operational excellence and customer experience
• Development pace has accelerated June-December 2010 as focus
shifted from integration to strategic business needs
shifted from integration to strategic business needs
• $190M of IT investments are planned for 2011 focused on key
strategic initiatives and returns of over $500M annually as projects
complete
strategic initiatives and returns of over $500M annually as projects
complete
• Strategic areas of focus:

40
• Further optimization of pricing and inventory management
• Tools that support further segmenting the market with flexible product
and service offerings
and service offerings
• Integrated technology to support world-class joint ventures and alliances
• Simplified, next-generation reservations and ticketing
• Intuitive sales and customer relationship management
• Next-generation airport agent tools that simplify processes and improve
service
service
• Immediate, intelligent and intuitive self-service options that empower
customers throughout each journey
customers throughout each journey
• World-class service recovery during irregular operations
• Next generation operations control and flight planning
• Real-time event data, infused with customer impact, for better, more
proactive operational decisions
proactive operational decisions
• Modular, nimble crew scheduling and communication
Network &
Revenue
Management
Sales &
Customer
Retention
Delivering a
Premium Travel
Experience
Operational
Excellence
Information Technology: Strategic Focus Areas

Delta: Improving Operational Performance
Steve Gorman
Chief Operating Officer
42
Service Recovery
• Proactive compensation at First Point of Contact
• Irregular ops service centers
• Over 1,400 handheld units
• Automated standby rebooking
• Mishandled bag notification
Reducing
Misconnections
Misconnections
• Decision matrix for gate hold control
• Focus on international to domestic and regional
to mainline
to mainline
Customer Service
Training
Training
• Trained over 20,000 flight attendants, 3,000
pursers and 11,000 airport agents
pursers and 11,000 airport agents
• Basic principles of customer service and problem
-solving
-solving
Cabin Condition &
Cleaning
Cleaning
• Reduced service intervals
• Outside auditors
Differentiating Overall Customer Experience
43
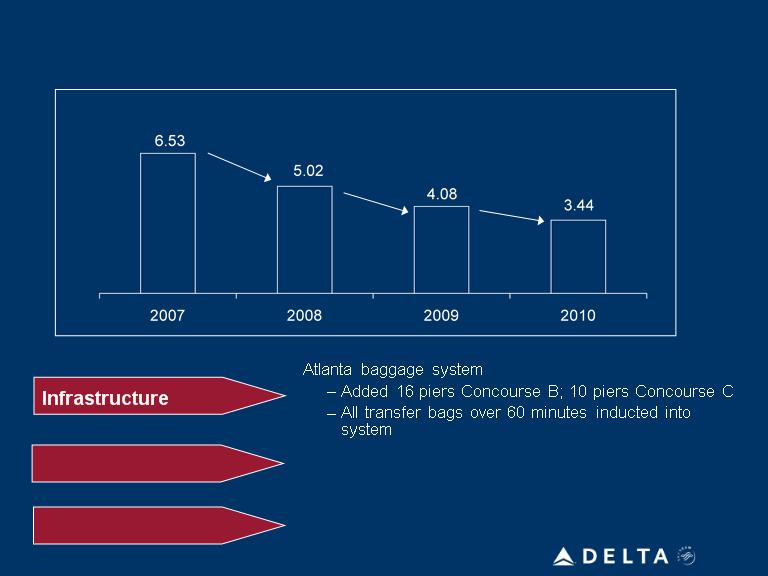
Technology
Process
– Scanner usage
– Real-time staffing and dispatching
– Dedicated transfer drivers at hubs
– Revised bag loading protocol
DOT Mishandled Baggage Rate
-23%
-19%
-16%
Baggage Claims Steadily Decreasing

Delta: Reinforcing the Financial Foundation
Hank Halter
Chief Financial Officer

45
• Maintaining best-in-class unit cost
structure
structure
• Utilize business leverage to mitigate
cost increases
cost increases
• Targeted investments in customer service
and operational improvements
and operational improvements
• Limited capital investment for aircraft and
aircraft modifications
aircraft modifications
• Targeting significant operating cash
flow which will enable strategic capital
investments
flow which will enable strategic capital
investments
• Strong free cash flow will fund further
delevering of the balance sheet
delevering of the balance sheet
Continued Cost
Leadership
Leadership
Disciplined Capital
Spending
Spending
Prudent Balance
Sheet Management
Sheet Management
Generate sustainable returns on invested capital
Delta: Reinforcing the Financial Foundation
46
Note: All figures exclude special items and profit sharing
Delta has 9% cost advantage compared to network peers
• Consolidated non-fuel unit costs
flat to 2009 resulting in 9% Delta
advantage versus industry
flat to 2009 resulting in 9% Delta
advantage versus industry
– Fleet retirements
– Technology functionality
– Divisional productivity
– Operational efficiency
2009
2010
2010
Network Average
excluding Delta
Network Average
excluding Delta
9% Advantage
Delta
Delta Maintains Cost Advantage to Network Peers
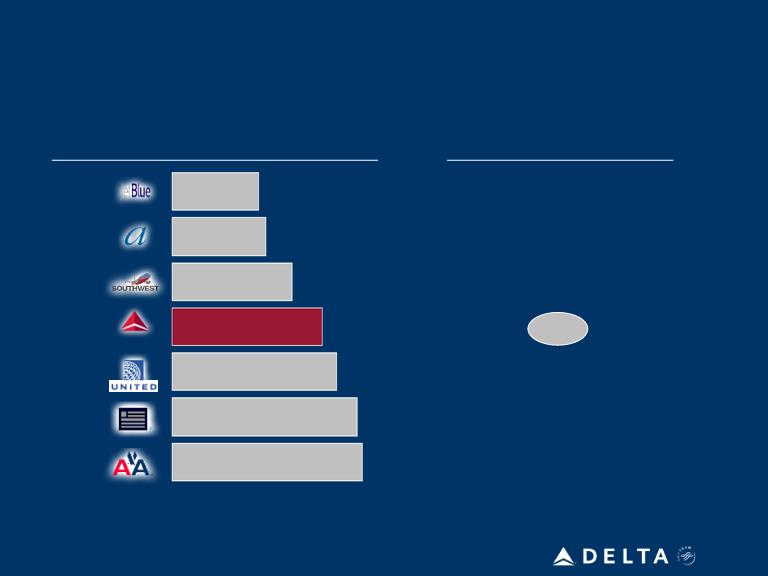
47
Critical that Delta maintains its cost advantage to network peers
Best-In-Class Cost Structure is Key Strength
Consolidated September YTD 2010
Non-Fuel Unit Cost (¢)
Non-Fuel Unit Cost (¢)
% Change vs.
September YTD 2009
September YTD 2009
6.42
6.62
7.34
8.18
8.58
9.15
9.30
7%
4%
5%
3%
1%
3%
0%
Note: All figures exclude special items and profit sharing
48
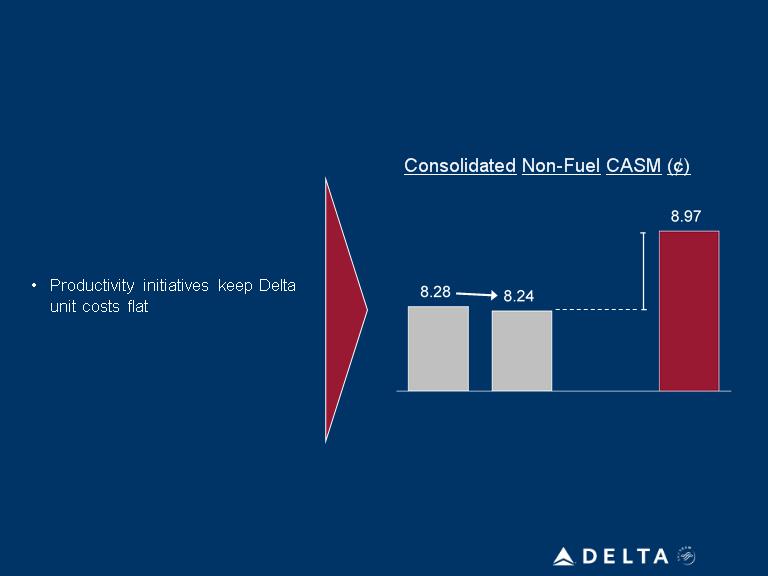
Delta Consolidated Non-Fuel CASM (¢)
2009
8.24
8.28
2010
2011
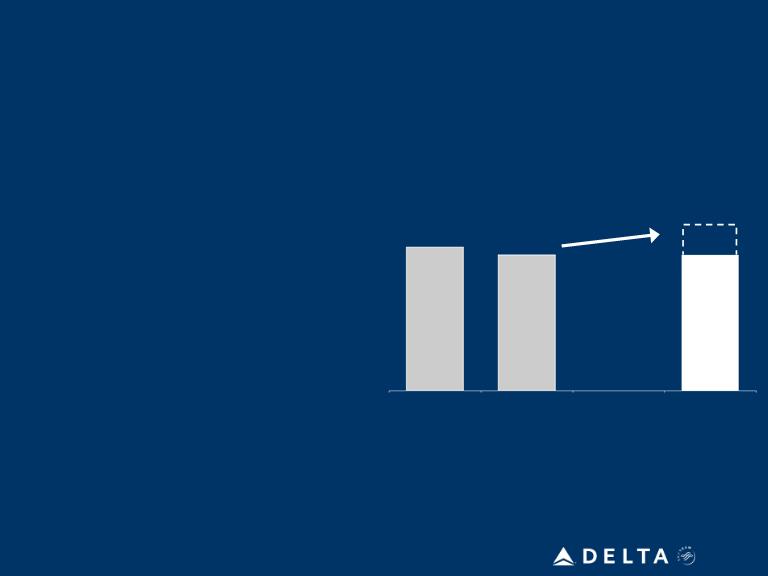
Expected cost pressures:
• Selling and revenue-related
• Customer and product investment
• Maintenance volume timing
Key productivity initiatives:
• Limit variable and fixed cost increases
as capacity growth resumes to
generate business leverage
as capacity growth resumes to
generate business leverage
• Invest in productivity-enhancing
technology
technology
• Grow operational efficiencies
• Fleet efficiencies through retirements
Targeted investments in product, employees and maintenance
Note: All figures exclude special items and profit sharing
+ 1-2%
Manageable Cost Increases Expected for 2011
49
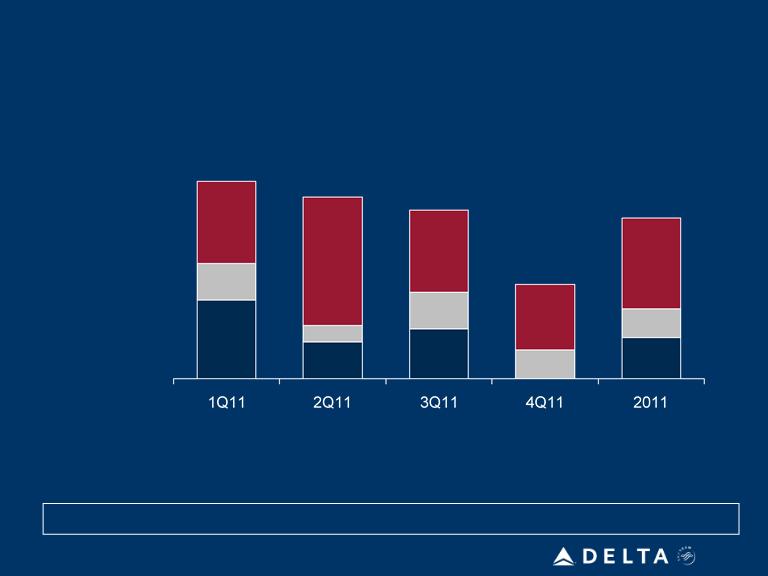
% of Fuel Consumption Hedged
Note: Hedging portfolio data as of December 3, 2010. Portfolio value is prior to premium expense.
Average Crude Call
49%
39%
23%
41%
44%
Collars
Swaps
Call options
$85
$83
$85
$86
$86
Downside Participation
83%
72%
87%
79%
93%
At current forward curve, Delta’s 2011 portfolio valued at $365 million
Projected Fuel Price
$2.47
$2.43
$2.46
$2.48
$2.51
Managing fuel price risk and volatility
Fuel Hedging Remains Important Strategy
50
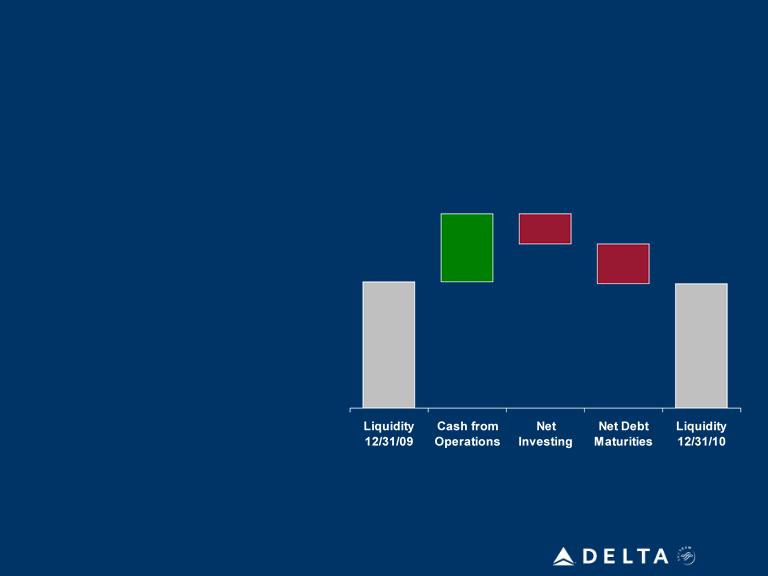
Balance Sheet Repair and Strengthening Underway
2010 accomplishments:
• Projected to generate operating
cash flow of $2.9 billion
cash flow of $2.9 billion
• $1.3 billion capital investments
– 17 aircraft deliveries
– Technology enhancements
– Onboard product
improvements
improvements
– Facility and infrastructure
renewal
renewal
• Paid down $1.7 billion debt
– $750 million delevering
initiatives in the September
quarter
initiatives in the September
quarter
Note: Liquidity includes cash, short term investments and undrawn credit facilities
Unrestricted Liquidity
December 2010 vs. December 2009 ($B)
December 2010 vs. December 2009 ($B)
$5.4
$2.9
($1.3)
($1.7)
$5.3
51
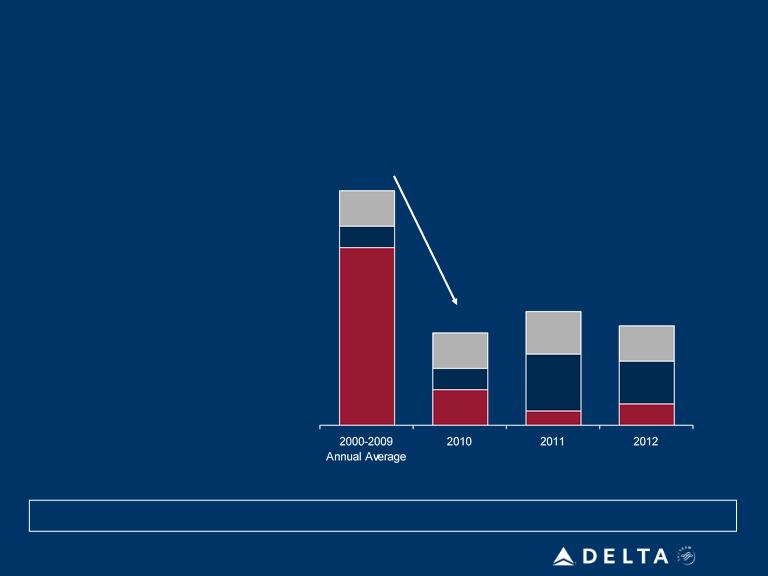
Disciplined Capital Spending Plan
Limited aircraft capex requirements enable targeted investments in customer and
operational efficiency/productivity and maximize free cash flow
operational efficiency/productivity and maximize free cash flow
• No near-term new aircraft
deliveries
deliveries
• Strategic acquisitions of cost
effective used MD-90 aircraft
effective used MD-90 aircraft
• Focused investments in customer
products and productivity-
enhancing tools
products and productivity-
enhancing tools
• Facility and infrastructure
investments
investments
Capital Spending ($B)
Dramatic reduction in capital spending versus prior decade
$3.3
$1.4
$1.5
$1.3
Ground/
technology
technology
Modifications
Aircraft
52
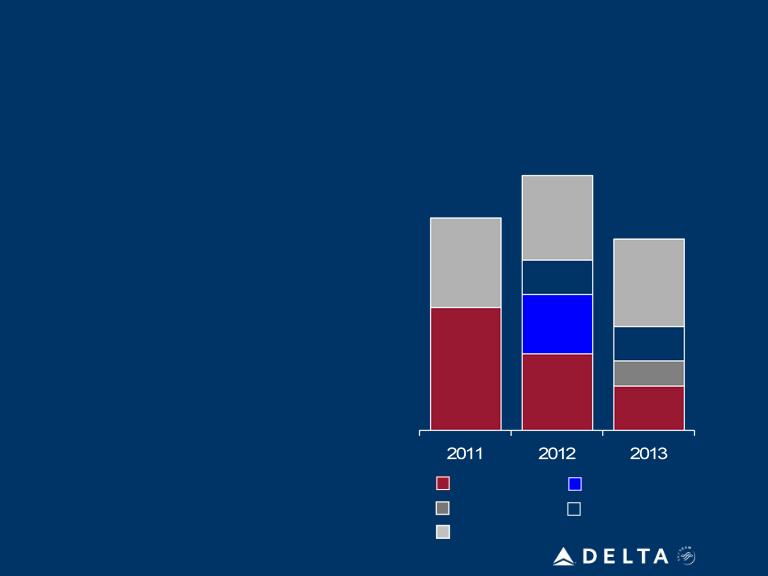
Scheduled Debt Maturities ($B)
• Scheduled debt maturities, combined
with delevering initiatives, will
strengthen Delta’s balance sheet and
reduce non-operating burden
with delevering initiatives, will
strengthen Delta’s balance sheet and
reduce non-operating burden
• Free cash flow is expected to fund
Delta’s scheduled debt maturities
Delta’s scheduled debt maturities
• Delevering initiatives
– Repurchasing debt
– Open market transactions and
private purchases
private purchases
– Opportunistic refinancing using
lower effective current interest
rates
lower effective current interest
rates
Balance Sheet Strengthening and Delevering
Underway
Underway
$1.9
$2.1
$2.5
EETC
Pacific routes
Other debt / capital leases
Exit facility
Amex
53
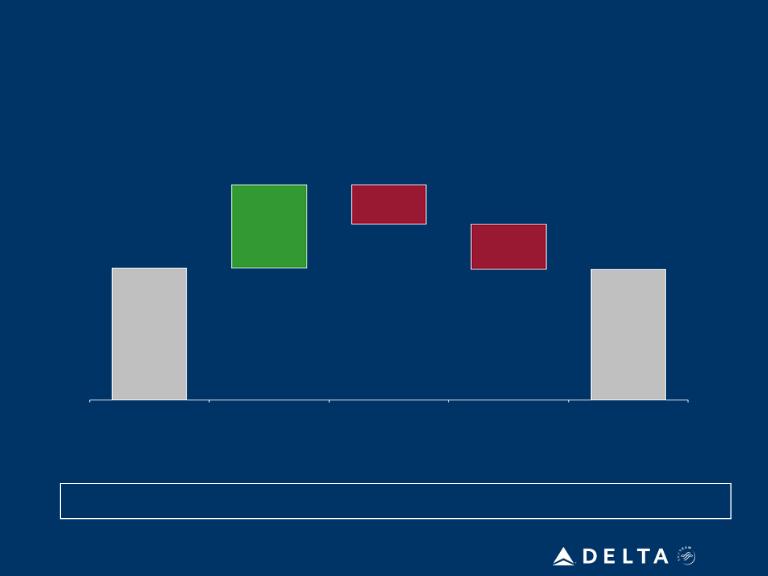
Delta Continues Prudent Balance Sheet Management
Note: Liquidity includes cash, short term investments and undrawn revolving credit facilities
Unrestricted Liquidity December 2011 vs. December 2010 ($B)
Liquidity
12/31/10
Liquidity
12/31/11
Net Debt
Maturities
$5.3
$5.3
($1.8)
Net Investing
($1.5)
$3.3
Cash From
Operations
Operating cash flow enables strategic capital investment and delevering
Targeting positive free cash flow of $1.8B in 2011
54
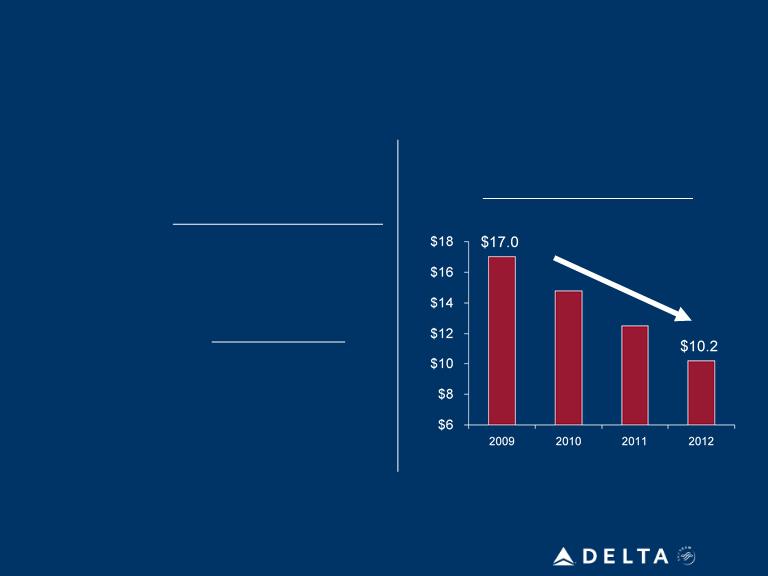
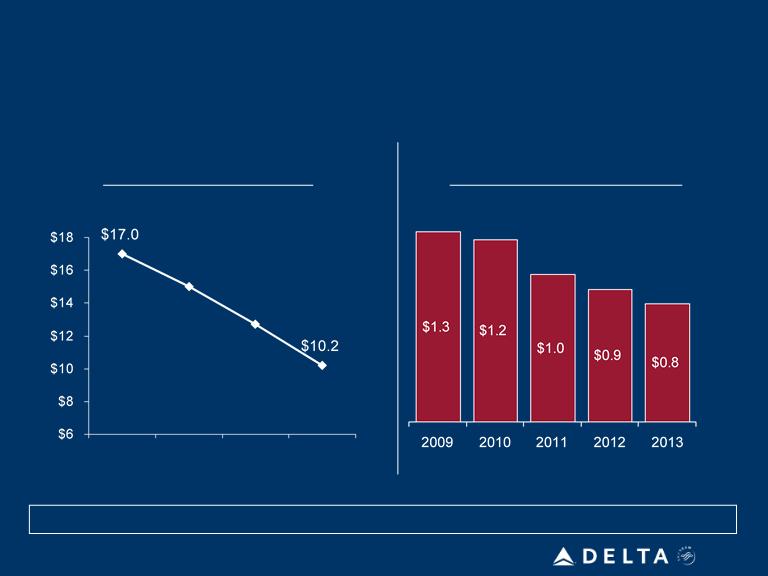
Adjusted Net Debt ($B)
12/31/09
12/31/12
Lower non-operating burden reduces earnings volatility and enhances cash flow
Net Interest Expense ($B)
12/31/10
$15.0
$15.0
Debt reductions and delevering actions drive $500 million in earnings improvement
Debt Reduction Drives Significant Earnings
Improvement
Improvement

55
Targeting Sustainable Returns on Invested Capital
Building a Better
Airline
Airline
Transforming Our
Network
Network
Enhancing the
Customer Experience
Customer Experience
Unlocking Productivity
with Technology
with Technology
Creating a Great
Place to Work
Place to Work
Reinforcing the
Financial Foundation
Financial Foundation
Improving Operational
Performance
Performance
|
Non-GAAP Financial Measures
|
||||||||||
|
We sometimes use information that is derived from our Condensed Consolidated Financial Statements, but that is not presented in accordance with accounting principles generally accepted in the U.S. (“GAAP”). Certain of this information is considered “non-GAAP financial measures” under the U.S. Securities and Exchange Commission rules. The non-GAAP financial measures should be considered in addition to results prepared in accordance with GAAP, but should not be considered a substitute for or superior to GAAP results.
|
||||||||||
|
Delta is unable to reconcile certain forward-looking projections to GAAP, including (1) projected free cash flow, (2) earnings before interest, taxes, depreciation, amortization and aircraft rent (EBITDAR) and (3) consolidated non-fuel cost per available seat mile (CASM), as the nature or amount of special items cannot be estimated at this time.
|
||||||||||
|
Delta excludes special items because management believes the exclusion of these items is helpful to investors to evaluate the company’s recurring operational performance.
|
||||||||||
|
Delta presents net investing activities because management believes this metric is helpful to investors to evaluate the company’s investing activities.
|
||||||||||
|
Delta presents net debt maturities because management believes this metric is helpful to investors to evaluate the company’s debt-related activities.
|
||||||||||
|
Delta uses adjusted total debt, including aircraft rent, in addition to long-term adjusted debt and capital leases, to present estimated financial obligations. Delta reduces adjusted total debt by cash, cash equivalents and short-term investments, resulting in adjusted net debt, to present the amount of additional assets needed to satisfy the debt.
|
||||||||||
|
Delta presents return on invested capital (ROIC) as management believes it is helpful to investors in assessing the company's ability to generate returns using its invested capital. ROIC represents operating income excluding special items divided by the sum of average market value of equity and average adjusted net debt.
|
||||||||||
|
Delta presents consolidated CASM excluding aircraft fuel and related taxes because management believes the volatility in fuel prices impacts the comparability of year-over-year financial performance.
|
||||||||||
|
Consolidated CASM excludes ancillary businesses not associated with the generation of a seat mile. These businesses include aircraft maintenance and staffing services Delta provides to third parties, Delta’s vacation wholesale operations and its dedicated freighter operations, which we discontinued on December 31, 2009.
|
||||||||||
|
Delta excludes profit sharing expense from consolidated CASM because management believes the exclusion of this item provides a more meaningful comparison of the company’s results to the airline industry and prior year results.
|
||||||||||
|
Delta presents free cash flow because management believes this metric is helpful to investors to evaluate the company’s ability to generate cash.
|
||||||||||
|
Delta presents EBITDAR as management believes it is helpful to investors in utilizing EBITDAR as a proxy for operating cash flow on a period over period basis.
|
||||||||||
56
|
Pre-Tax Income
|
||||||||
|
Full Year 2010
|
Full Year
|
|||||||
|
(in millions)
|
Projection
|
2009
|
||||||
|
Pre-tax income (loss)
|
$ | 0.7 | $ | (1.6 | ) | |||
|
Items excluded:
|
||||||||
|
Loss on extinguishment of debt
|
0.4 | 0.1 | ||||||
|
Restructuring and merger-related items
|
0.4 | 0.4 | ||||||
|
Pre-tax income (loss) excluding special items
|
$ | 1.5 | $ | (1.1 | ) | |||
57
|
Operating Income & Margin
|
||||||||
|
Full Year 2010
|
Full Year
|
|||||||
|
(in billions)
|
Projection
|
2009
|
||||||
|
Operating income (loss)
|
$ | 2.3 | $ | (0.3 | ) | |||
|
Item excluded:
|
||||||||
|
Restructuring and merger-related items
|
0.4 | 0.4 | ||||||
|
Operating income excluding special items
|
$ | 2.7 | $ | 0.1 | ||||
|
Total operating revenue
|
$ | 31.8 | $ | 28.1 | ||||
|
Operating margin excluding special items
|
8.5% | 0.3% | ||||||
58
|
Non-Fuel CASM
|
||||||||||||||||
|
Full Year 2010
|
Full Year
|
Nine Months Ended September 30,
|
||||||||||||||
|
Projection
|
2009
|
2010
|
2009
|
|||||||||||||
|
CASM
|
12.66 | ¢ | 12.32 | ¢ | 12.55 | ¢ | 12.17 | ¢ | ||||||||
|
Items excluded:
|
||||||||||||||||
|
Ancillary businesses
|
(0.27 | ) | (0.31 | ) | (0.27 | ) | (0.32 | ) | ||||||||
|
Profit sharing
|
(0.14 | ) | - | (0.16 | ) | - | ||||||||||
|
Restructuring and merger-related items
|
(0.19 | ) | (0.18 | ) | (0.19 | ) | (0.16 | ) | ||||||||
|
Aircraft fuel and related taxes
|
(3.82 | ) | (3.55 | ) | (3.75 | ) | (3.53 | ) | ||||||||
|
CASM excluding certain items
|
8.24 | ¢ | 8.28 | ¢ | 8.18 | ¢ | 8.16 | ¢ | ||||||||
59
|
Net Investing Activities
|
||||
|
Full Year 2010
|
||||
|
(in billions)
|
Projection
|
|||
|
Net cash used in investing activities (GAAP)
|
$ | 1.9 | ||
|
Items excluded:
|
||||
|
Purchase of short-term investments, net
|
(0.6 | ) | ||
|
Net investing activities
|
$ | 1.3 | ||
60
|
Net Debt Maturities
|
||||
|
Full Year 2010
|
||||
|
(in billions)
|
Projection
|
|||
|
Net cash used in financing activities (GAAP)
|
$ | 2.6 | ||
|
Items excluded:
|
||||
|
Pay down of revolving credit facility
|
(0.9 | ) | ||
|
Net debt maturities
|
$ | 1.7 | ||
61
|
Adjusted Net Debt
|
||||||||||||||||||||||||||||||||
|
December 31, 2010
|
||||||||||||||||||||||||||||||||
|
(in billions)
|
Projection
|
September 30, 2010
|
June 30, 2010
|
March 31, 2010
|
||||||||||||||||||||||||||||
|
Debt and capital lease obligations
|
$ | 15.1 | $ | 15.4 | $ | 15.8 | $ | 16.9 | ||||||||||||||||||||||||
|
Plus: unamortized discount, net from purchase accounting and fresh start reporting
|
0.7 | 0.7 | 1.0 | 1.1 | ||||||||||||||||||||||||||||
|
Adjusted debt and capital lease obligations
|
$ | 15.8 | $ | 16.1 | $ | 16.8 | $ | 18.0 | ||||||||||||||||||||||||
|
Plus: 7x last twelve months' aircraft rent
|
2.8 | 3.0 | 3.2 | 3.3 | ||||||||||||||||||||||||||||
|
Adjusted total debt
|
18.6 | 19.1 | 20.0 | 21.3 | ||||||||||||||||||||||||||||
|
Less: cash, cash equivalents and short-term investments
|
(3.6 | ) | (3.9 | ) | (4.4 | ) | (4.9 | ) | ||||||||||||||||||||||||
|
Adjusted net debt
|
$ | 15.0 | $ | 15.2 | $ | 15.6 | $ | 16.4 | ||||||||||||||||||||||||
|
(in billions)
|
December 31, 2009
|
September 30, 2009
|
June 30, 2009
|
March 31, 2009
|
December 31, 2008
|
|||||||||||||||||||||||||||||||||||
|
Debt and capital lease obligations
|
$ | 17.2 | $ | 17.7 | $ | 16.6 | $ | 16.6 | $ | 16.6 | ||||||||||||||||||||||||||||||
|
Plus: unamortized discount, net from purchase accounting and fresh start reporting
|
1.1 | 1.2 | 1.3 | 1.4 | 1.5 | |||||||||||||||||||||||||||||||||||
|
Adjusted debt and capital lease obligations
|
$ | 18.3 | $ | 18.9 | $ | 17.9 | $ | 18.0 | $ | 18.1 | ||||||||||||||||||||||||||||||
|
Plus: 7x last twelve months' aircraft rent
|
3.4 | 3.4 | 3.4 | 3.5 | 3.4 | |||||||||||||||||||||||||||||||||||
|
Adjusted total debt
|
21.7 | 22.3 | 21.3 | 21.5 | 21.5 | |||||||||||||||||||||||||||||||||||
|
Less: cash, cash equivalents and short-term investments
|
(4.7 | ) | (5.5 | ) | (4.9 | ) | (4.5 | ) | (4.5 | ) | ||||||||||||||||||||||||||||||
|
Adjusted net debt
|
$ | 17.0 | $ | 16.8 | $ | 16.4 | $ | 17.0 | $ | 17.0 | ||||||||||||||||||||||||||||||
62