Attached files
| file | filename |
|---|---|
| EX-21 - SUBSIDIARIES - ARDEN GROUP INC | ex21.htm |
| EX-23.1 - CONSENT - ARDEN GROUP INC | ex23-1.htm |
| EX-32.1 - CERTIFICATION - ARDEN GROUP INC | ex32-1.htm |
| EX-32.2 - CERTIFICATION - ARDEN GROUP INC | ex32-2.htm |
| EX-31.1 - CERTIFICATION - ARDEN GROUP INC | ex31-1.htm |
| EX-31.2 - CERTIFICATION - ARDEN GROUP INC | ex31-2.htm |
| EX-10.10 - SAR AGREEMENT - ARDEN GROUP INC | ex10-10.htm |
UNITED STATES SECURITIES AND EXCHANGE COMMISSION
Washington, D. C. 20549
FORM 10-K
(Mark One)
|
x
|
ANNUAL REPORT PURSUANT TO SECTION 13 OR 15(d) OF THE SECURITIES EXCHANGE ACT OF 1934
|
|
|
For the fiscal year ended January 1, 2011
|
OR
|
o
|
TRANSITION REPORT PURSUANT TO SECTION 13 OR 15(d) OF THE SECURITIES EXCHANGE ACT OF 1934
|
|
|
For the transition period from __________ to ___________
|
Commission file number 0-9904
ARDEN GROUP, INC.
(Exact name of registrant as specified in its charter)
|
Delaware
|
95-3163136
|
|
|
(State or other jurisdiction of
|
(I.R.S. Employer Identification No.)
|
|
|
incorporation or organization)
|
||
|
2020 South Central Avenue, Compton, California
|
90220
|
|
|
(Address of principal executive offices)
|
(Zip Code)
|
Registrant’s telephone number, including area code (310) 638-2842
Securities registered pursuant to Section 12(b) of the Act:
| (Title of each class) |
Name of each exchange on which registered
|
|
| Class A Common Stock | NASDAQ Stock Market LLC |
Securities registered pursuant to Section 12(g) of the Act:
None
(Title of each class)
Indicate by check mark if the registrant is a well-known seasoned issuer, as defined in Rule 405 of the Securities Act. Yes o No x
Indicate by check mark if the registrant is not required to file reports pursuant to Section 13 or Section 15(d) of the Act. Yes o No x
Indicate by check mark whether the registrant (1) has filed all reports required to be filed by Section 13 or 15(d) of the Securities Exchange Act of 1934 during the preceding 12 months (or for such shorter period that the registrant was required to file such reports), and (2) has been subject to such filing requirements for the past 90 days. Yes x No o
Indicate by check mark whether the registrant has submitted electronically and posted on its corporate Web site, if any, every Interactive Data File required to be submitted and posted pursuant to Rule 405 of Regulation S-T (§232.405 of this chapter) during the preceding 12 months (or for such shorter period that the registrant was required to submit and post such files). Yes ¨ No ¨
Indicate by a check mark if disclosure of delinquent filers pursuant to Item 405 of Regulation S-K is not contained herein, and will not be contained, to the best of registrant’s knowledge, in definitive proxy or information statements incorporated by reference in Part III of this Form 10-K or any amendment to this Form 10-K. o
Indicate by check mark whether the registrant is a large accelerated filer, an accelerated filer, a non-accelerated filer, or a smaller reporting company. See the definitions of “large accelerated filer,” “accelerated filer” and “smaller reporting company” in Rule 12b-2 of the Exchange Act.
| Large accelerated filer | o | Accelerated filer | x |
| Non-accelerated filer | o | Smaller reporting company | o |
Indicate by check mark whether the registrant is a shell company (as defined in Rule 12b-2 of the Act). Yes o No x
The aggregate market value of the voting and non-voting common equity held by non-affiliates of the registrant based on the price at which the Class A Common Stock last sold on July 2, 2010, the last business day of the registrant’s most recently completed second fiscal quarter, was $108,825,105.
DOCUMENTS INCORPORATED BY REFERENCE
The information required by Part III of this report is incorporated by reference from the Registrant’s definitive Proxy Statement to be filed no later than May 2, 2011.
TABLE OF CONTENTS
|
Page
|
PART I
|
|
|
1
|
Item 1.
|
Business
|
|
4
|
Item 1A.
|
Risk Factors
|
|
9
|
Item 1B.
|
Unresolved Staff Comments
|
|
9
|
Item 2.
|
Properties
|
|
9
|
Item 3.
|
Legal Proceedings
|
|
9
|
Item 4.
|
(Removed and Reserved)
|
|
PART II
|
||
|
10
|
Item 5.
|
Market for the Registrant’s Common Equity, Related Stockholder Matters and Issuer Purchases of Equity Securities
|
|
12
|
Item 6.
|
Selected Financial Data
|
|
13
|
Item 7.
|
Management’s Discussion and Analysis of Financial Condition and Results of Operations
|
|
23
|
Item 7A.
|
Quantitative and Qualitative Disclosures about Market Risks
|
|
24
|
Item 8.
|
Financial Statements and Supplementary Data
|
|
24
|
Item 9.
|
Changes in and Disagreements with Accountants on Accounting and Financial Disclosure
|
|
24
|
Item 9A.
|
Controls and Procedures
|
|
24
|
Item 9B.
|
Other Information
|
|
PART III
|
||
|
25
|
Item 10.
|
Directors, Executive Officers and Corporate Governance
|
|
25
|
Item 11.
|
Executive Compensation
|
|
25
|
Item 12.
|
Security Ownership of Certain Beneficial Owners and Management and Related Stockholder Matters
|
|
25
|
Item 13.
|
Certain Relationships, Related Transactions and Director Independence
|
|
25
|
Item 14.
|
Principal Accountant Fees and Services
|
|
PART IV
|
||
|
26
|
Item 15.
|
Exhibits and Financial Statement Schedules
|
|
27
|
SIGNATURES
|
PART I
|
Item 1.
|
Business |
General
The Registrant, Arden Group, Inc. (Company or Arden), is a holding company which conducts operations through its wholly-owned subsidiary, Arden-Mayfair, Inc. (Arden-Mayfair) and Arden-Mayfair’s wholly-owned subsidiary, Gelson’s Markets (Gelson’s) which operates supermarkets in Southern California. The Company also owns certain real estate properties through a subsidiary, Mayfair Realty, Inc. (Mayfair Realty) which is wholly-owned by the Company and Arden-Mayfair. The Company is a Delaware Corporation organized in 1988.
Arden is headquartered at 2020 South Central Avenue, Compton, California 90220 and its telephone number is (310) 638-2842.
Market Operations
As of January 1, 2011, Gelson’s operated eighteen full-service supermarkets in Southern California, which carry both perishable and dry grocery products. Gelson’s offers a broad selection of local and national brands as well as a limited number of private label items. Gelson’s targets the consumer who values superior customer service, merchandise, presentation and selection. Gelson’s also operates a distribution center in the City of Commerce, California.
Store Formats and Business Strategy
Gelson’s business strategy is to offer a comfortable upscale shopping experience which is superior to its competitors in terms of customer service and merchandise quality, selection and presentation. The goal of this strategy is to continue to develop and maintain Gelson’s loyal base of customers and appeal to potential new customers. Central elements of this strategy are as follows:
Merchandise The merchandise offerings in the markets are tailored in response to Gelson’s customer profile. Gelson’s stores, which range in size from approximately 18,000 to 40,000 square feet, typically carry a wide range of items, including traditional grocery categories such as dry groceries, produce, meat, seafood, bakery, dairy, wine and liquor, floral, sushi, vitamins and health and beauty aids. Gelson’s perishables are typically premium products, which are rigorously maintained and culled as appropriate to assure quality and freshness. Gelson’s merchandising includes specialty items such as imported foods, unusual delicatessen items and organic and natural food products.
Service Gelson’s emphasizes customer service by offering a variety of service departments including meat, seafood, delicatessen, floral, sushi, cheese and bakery departments. All sushi and most bakery departments are operated by third parties. Some Gelson’s stores include additional service departments such as fresh pizza, coffee bars, hot bars, gelato bars and carving carts offering cooked meats. Additionally, selected stores offer banking and pharmacy services through third parties. Stores are staffed so that, even at peak times, customer checkout time is minimized. In addition to checkers, there are personnel assigned to bagging and assisting customers. All employees are encouraged to know customers by name and assist them whenever possible. All stores offer a Company charge card to qualified customers in addition to the option of paying for their purchases with cash, checks, credit or debit cards. Stores are typically open 14 to 17 hours per day, with hours of operation determined by local code, lease provisions or as appropriate for the business characteristics of each community.
1
Presentation All stores are maintained in accordance with extremely high standards. Personnel continually fill and face shelves with product. Produce and other perishables are trimmed and culled to maintain quality and appearance.
Pricing The pricing strategy at the stores is to be competitive primarily within their market niches, ranging from the more traditional to the more exotic, specialty or high-end retailers.
Expansion and Store Development Management regularly evaluates the feasibility of opening new stores in and outside its existing trade areas and remodeling existing stores in order to maximize the existing stores’ appeal to consumers and their profit potential. In 2010, capital expenditures totaled $2,597,000.
Advertising and Promotion Gelson’s advertises on a limited basis in newspapers and through its own newsletter. In the past, advertising has focused primarily on the promotion of events rather than prices; for example, Gelson’s emphasizes special holiday selections, new products, specialty items, services and recipes. With the downturn in the economy, the Company has redirected more of its advertising to focus on competitive pricing and discount coupons as consumers have become more and more price conscious. In addition, Gelson’s maintains a website at www.gelsons.com which allows customers to learn more about Gelson’s and to read about food related topics that may be of interest to them. The website also provides an opportunity for customers to request a newsletter, offer feedback and to place catering and holiday meal orders online. The Company reevaluates its strategy regularly in an effort to identify the most effective means of attracting and retaining customers.
Competition
The retail grocery business is highly competitive. Competition in the supermarket business is based upon price, merchandise variety and quality, service and location. The number of stores, market share and brand awareness are also important competitive factors. Gelson’s is in direct competition with numerous local outlets of regional and national supermarket chains (most of which have greater resources and a larger market share than Gelson’s), independent grocery stores, convenience stores, specialty and gourmet markets and food and grocery departments in mass merchandise and club stores. The stores of the national and regional chains are generally larger than Gelson’s stores which, in some cases, enables them to offer more products, and their greater resources allow them to conduct more comprehensive advertising campaigns. Competition also exists from other types of retailers with respect to particular products. Gelson’s competes primarily by offering a combination of high-quality products and superior customer service. The Company also believes that Gelson’s prime store locations and long-standing reputation add to its competitive strength.
Certain competitors of the Company offer home delivery, in-store banks and pharmacies in addition to their existing retail store operations. The Company has, in the past, evaluated opportunities for home delivery, but has elected not to do so at this time. A few of the Company’s stores offer in-store banks and pharmacies; most of the Company’s stores are not large enough for such additional facilities.
2
Seasonality
Gelson’s business is somewhat seasonal with sales tending to increase during the last quarter of the year due to the holiday season.
Support and Other Services
Each store has an on-site stockroom, the size of which varies for each store. In addition, Gelson’s operates a 127,000 square foot warehouse in the City of Commerce, California. The central warehouse distributes fresh produce, liquor, wine, floral and certain grocery items to the stores. The stores also receive meat, delicatessen, paper goods, health and beauty aids, hardware and supply items from the warehouse on a limited basis.
The bulk of all merchandise purchasing takes place at Gelson’s headquarters in Encino, California. Approximately 51% of the purchases for 2010 were distributed through the central warehouse; the remainder was delivered directly to the stores from manufacturers, distributors or wholesalers. The central purchasing and distribution operations are conducted based on electronic in-store ordering systems. Stores can place and receive orders up to six days per week. Perishables are ordered more frequently than other goods.
The largest supplier for the stores is Unified Grocers, Inc. (Unified), a grocery wholesale cooperative, which has been a supplier to the Company for approximately 36 years and which accounted for approximately 15% of Gelson’s purchases in fiscal 2010. No other supplier accounts for more than 4% of Gelson’s purchases. The Company believes that there would be a negative short-term impact if the Company were to lose Unified as a supplier for Gelson’s, but that such impact could possibly be mitigated by a combination of events, which could include purchasing certain items for direct store delivery and purchasing some products through other wholesalers. However, such a loss could have a short-term adverse effect on the performance of Gelson’s.
Employees
Gelson’s had approximately 1,222 full-time and 860 part-time store, warehouse and office employees as of January 1, 2011. Most Gelson’s employees are covered by union collective bargaining agreements that establish rates of pay, benefits, work rules and procedures for the orderly settlement of disputes. In general, these agreements have been negotiated on a local industry-wide basis.
In addition to employees at Gelson’s, Arden-Mayfair had approximately 59 employees at its executive and headquarters offices as of January 1, 2011, some of whom are covered by a collective bargaining agreement.
Governmental Regulation
Gelson’s is subject to regulation by a variety of governmental agencies, including the U.S. Food and Drug Administration, the California Department of Alcoholic Beverage Control, and state and local health departments. The Company believes that Gelson’s store operations comply in all material respects with federal, state and local health, environmental and other laws and regulations. Although the Company cannot predict the effect of future laws or regulations on its operations, expenditures for continued compliance with current laws are not expected to have a material adverse impact on Gelson’s competitive position or the Company’s consolidated financial position, results of operations or cash flows.
3
Available Information
The Company maintains a website at www.ardengroupinc.com. Access to the Company’s Securities and Exchange Commission (SEC) filings, including annual reports on Form 10-K, quarterly reports on Form 10-Q, current reports on Form 8-K, Section 16 filings and all amendments to those reports, are available through our website free of charge, as soon as reasonably practicable after these reports are filed electronically with the SEC. In addition, the Company will provide free of charge upon written request to Assistant Secretary, Arden Group, Inc., P.O. Box 512256, Los Angeles, California 90051-0256 paper copies of the reports listed above.
|
Item 1A.
|
Risk Factors |
The Private Securities Litigation Reform Act of 1995 provides a safe harbor for forward-looking statements made by or on behalf of the Company. Certain statements contained in this Item 1A, Item 7 - Management’s Discussion and Analysis of Financial Condition and Results of Operations, other parts of this report and other Company filings are forward-looking statements. These statements discuss, among other things, future sales, operating results, cash flows and financial condition. Forward-looking statements reflect the Company’s current plans and expectations regarding important risk factors and are based on information currently known to the Company.
The Company cautions readers that any forward-looking statements contained in this report or made by the management of the Company involve risks and uncertainties, and are subject to change based on various important factors. Such statements may be identified by such words as “anticipate,” “expect,” “may,” “believe,” “could,” “estimate,” “project,” and similar words or phrases. The Company does not undertake any obligation to update forward-looking statements. The factors listed below, among others, could affect the Company’s financial results and could cause the Company’s financial performance to differ materially from the expectations expressed in any forward-looking statement made by or on behalf of the Company:
Changes in Economic, Political or Social Conditions
Our profitability may be impacted by both national and local economic conditions, particularly in Southern California. Changes in economic conditions such as recessionary cycles, increased levels of unemployment, higher consumer debt levels, inflation, higher interest rates and tax rates and increased energy costs may result in reduced consumer spending or influence our customers to shift their spending to our lower-priced competitors. The depressed state of the economy, including its impact on the unemployment rate, the financial markets and the real estate markets, as well as the effects of budget uncertainties in California, have and will continue to influence consumer spending patterns in the future. In addition, current market conditions have continued to limit the amount that the Company can charge for its products and the Company has continued to emphasize price specials and discount coupons in its advertising. If the Company’s sales volume continues to decrease or if the Company is unable to pass increased costs on to its customers, profit margins may be negatively affected. In addition, our business may be subject to interruption from acts of terrorism, national emergencies or natural disasters.
4
Competition in the Grocery Business
The retail grocery business is intensely competitive with respect to price, food quality and selection, service and location. The Company is in direct competition with numerous local outlets of regional and national supermarket chains, independent grocery stores, convenience stores, specialty and gourmet markets and food and grocery departments in mass merchandise and club stores. There are a number of well established competitors with substantially greater financial, marketing and other resources than ours, many of which are also nonunion. The Company frequently faces the opening of a new or remodeled competitor’s store in its trade area. Consequently, the Company also must continually maintain its existing stores in order to retain their appeal. An inability to successfully compete with other grocery retailers in our trade areas could prevent us from increasing or sustaining our revenues and profitability.
Food and Drug Safety Concerns
There is increasing governmental scrutiny and public awareness regarding food and drug safety. The Company could be adversely affected if consumers lose confidence in the safety and quality of the Company’s food and drug products. Any events that give rise to actual or potential food contamination, drug contamination or food-borne illness could result in product liability claims and a loss of consumer confidence. In addition, adverse publicity about these types of concerns whether valid or not, may discourage consumers from buying the Company’s products or cause production and delivery disruptions, which could have an adverse effect on the Company’s sales and results of operations.
New Labor Contracts and Labor Stoppages
The majority of our employees belong to unions with which we have labor agreements which establish rates of pay, benefits, work rules and procedures for the orderly settlement of disputes. In order to continue to attract and retain quality personnel, we may accept terms that increase our operating costs, which in turn, may negatively impact our profitability. If contract negotiations are not successful, the union could recommend that our employees vote to strike our stores, distribution center and offices.
In July 2007, the United Food & Commercial Workers International Union (UFCW) completed negotiation of a new contract with the three major grocery retailers in our trade area - Vons, Ralphs and Albertsons grocery chains (Majors). The wage increases agreed to by these three competitors were somewhat less than the Company agreed to for certain job classifications and experience levels during our UFCW negotiations in February 2007 and March 2009. This could affect our ability to compete with grocery retailers whose labor costs are less than our own. Our contract with the UFCW expired March 6, 2011, the same date as the Majors’ contract. The Majors are currently in negotiations with the UFCW to renew their collective bargaining agreements. The Company has signed an extension agreement with the UFCW pending the outcome of the UFCW’s negotiations with the Majors which obligates Gelson’s to any changes agreed to by the Majors in hourly wage rates and contributions to the benefit plans.
5
Cost of Providing Employee Benefits
The Company provides health insurance for the majority of its nonunion employees, for which the employees pay a portion. Health care costs have increased significantly in recent years. If this trend continues, it could have a negative impact on the Company’s profitability. The status of the recent health care reform makes it more difficult than ever to predict the impact on health care costs in the near future.
The Company also contributes to several multi-employer union health care plans in accordance with the Company’s various collective bargaining agreements. The majority of the Company’s union employees are members of the UFCW. The Company’s UFCW health and welfare contribution rate was scheduled to increase effective with hours worked during March 2009; however, the Company was notified by the Southern California United Food & Commercial Workers Unions and the Food Employers Joint Trust Funds (Trust), in the first quarter of 2009, that the increase had been suspended. In March 2010, the Company was notified that the UFCW health and welfare contribution rate would increase effective March 2010 to the maximum allowable rate under the collective bargaining agreement resulting in a significant increase in the Company’s health and welfare expense. The agreement also allowed for an additional increase in the health and welfare contribution rate effective February 2011 which has gone into effect. As discussed above, the Company’s contract with the UFCW expired March 6, 2011. The UFCW is currently negotiating with the Majors. All employers who participate in a multi-employer plan are required to contribute at the same hourly rate based on straight-time hours worked in order to fund the plan, and accordingly, the Company will be subject to the same contribution rate as negotiated by the Majors. The Company has been notified that the UFCW health and welfare plan is currently underfunded. Many factors influence the funded status of the plans including changes in the cost of health care, the plans’ return on investment, changes to benefits offered under the plans, government regulations and the level of employee utilization.
The Company also participates in various multi-employer union pension plans. Adverse financial market developments have significantly impacted the funded status of pension plans on a worldwide basis. The Company’s contributions under the UFCW pension plan were fixed under the terms of the agreement which expired on March 6, 2011. The economic downturn has had a significant impact on the funded status of the health care and pension plans to which the Company contributes. The Company anticipates that both health care and pension benefits will be important topics during negotiations with the UFCW. If the Company and other participating employers are unable to negotiate an acceptable agreement with the union concerning employee benefits, a labor dispute could result or the negotiations could result in a new agreement requiring higher contribution rates. In addition, if any of the participating employers in the plan withdraws from the plan due to insolvency and is not able to contribute an amount sufficient to cover the underfunded liabilities associated with its participants, the Company may be required to make additional contributions. Each of these scenarios could negatively impact the Company’s financial condition and results of operations.
Retention of Key Personnel
Our success is dependent on our key employees. We must continue to attract, retain and motivate a sufficient number of qualified management and operating personnel including the replacement of senior management upon retirement. Individuals of this caliber could be in short supply and this shortage may limit our ability to hire and retain qualified personnel, and thus, may hinder our ability to operate effectively.
6
Changes in Laws or Regulations or Failure to Comply
We are subject to various federal, state and local laws, regulations and licensing requirements which regulate health and sanitation standards, food labeling and handling, the sale of alcoholic beverages, employment practices, working conditions, citizenship requirements and public accommodations. Changes to such laws or regulations may adversely affect our profitability by increasing our costs or affecting the sale of certain items. In addition, we must comply with state and local fire, zoning, land use and environmental regulations. Failure to comply with these regulations could adversely affect the costs and the operation of our existing stores or could delay or prevent the opening of a new store.
Changes in Accounting Standards, Policies and Practices
The issuance of new pronouncements or changes to existing accounting policies and practices could have a significant impact on our reported results or change the way we account for various transactions. New policies and changes to existing rules may adversely affect our reported financial results.
Availability and Retention of Retail Space
We currently lease the majority of our store locations. Typically, our supermarket leases have initial twenty year lease terms and may include options for up to an additional twenty years. The average term remaining on our supermarket leases, including renewal options, is approximately seventeen years. Our revenues and profitability could be negatively impacted if we are unable to renew any of these leases at reasonable rates.
Our continued growth depends to a significant degree on our ability to open or acquire new stores in existing and new trade areas and to operate these stores successfully. Our expansion strategy is dependent on finding suitable locations, and we face intense competition from other retailers for such sites. We may not be able to find suitable locations that meet our demographic and operational requirements at a reasonable cost. The most recent opening of a Gelson’s store occurred in September 2001 when the Company opened its location in Pasadena, California.
The Ability of our Vendors to Supply Products and Services in a Timely Manner
Our business is dependent on our ability to purchase products from a large wholesaler and numerous smaller vendors in a timely manner and at competitive prices. The largest supplier for our stores is Unified, a grocery wholesale cooperative, which has provided product for our stores for approximately 36 years. We currently procure approximately 15% of our product from Unified. Any disruption in the business of Unified or any of our other principal suppliers could negatively impact our sales and profitability. Even where we have access to alternative sources of supply, the failure of a major supplier to fulfill our orders could temporarily disrupt store level merchandise selection.
7
Ability to Control Insurance Coverage Costs and Claims Experience
We use a combination of insurance and self-insurance plans to provide for coverage associated with losses related to workers’ compensation, general and auto liability, property damage, directors and officers liability, fiduciary, employment practices liability, business interruption, crime, earthquake and health care. If insurance costs increase, it could have a negative impact on our profitability if we are not able to offset the effect of such increases with plan modifications, cost control measures, sales increases or by improving our operating efficiency.
We are self-insured for general and auto liability and, in some prior years, for workers’ compensation as well. We have stop-loss insurance coverage to limit our exposure on a per claim basis and are insured for covered costs in excess of per claim limits. The Company devotes substantial time and effort to maintaining a safe environment in our stores, warehouse and offices. However, the cost of both insured and self-insured plans is highly dependent upon legal and legislative trends, the inflation rate of premiums and our ability to manage claims.
The Outcome of Current and Future Legal Proceedings
From time to time we are the subject of complaints or litigation from customers alleging injury, food quality or operational concerns. We may be adversely affected by publicity resulting from such allegations, regardless of whether such allegations are valid or whether we are liable. We are also subject to complaints or allegations from former or current employees, claims concerning hazardous substances on our current or previously owned or leased properties, class action suits concerning warning labels and other claims. A lawsuit or claim could result in a decision against us that could have an adverse effect on our business if not covered by insurance. Additionally, the cost of defending ourselves against lawsuits and claims, regardless of merit, could have a negative impact on our profitability.
Impact of Local Projects in the Vicinity of our Supermarkets
From time to time, local events or projects take place in the vicinity of our stores that may have a negative impact on our sales and profitability.
Stock Price Volatility
The market price of our Class A Common Stock (Class A) could be subject to significant fluctuation in response to various market factors and events including general economic and market conditions, variations in our earnings results, publicity regarding the Company or its competitors and the grocery business in general. The stock market in recent years has experienced extreme price and volume fluctuations that have sometimes been unrelated or disproportionate to the operating performance of companies. Furthermore, there is not a significant volume of trading in our Class A which subjects our stock price to a higher level of volatility and may adversely impact the liquidity of the stock. In March 2007, the Company merged its Stock Bonus Plan into its 401(k) Retirement Savings Plan (401(k) Plan) in order to satisfy the new congressionally mandated diversification requirements. Stock previously held for the benefit of participants in the Company’s Stock Bonus Plan was transferred to individual participant accounts in the Company’s 401(k) Plan. As of January 1, 2011, participants in the Company’s 401(k) Plan held 66,352 shares of Class A in the 401(k) Plan. These participants can elect to sell their shares which may have a negative effect on the price of Class A. Fluctuations in our Class A price also impact compensation expense as it relates to our outstanding stock appreciation rights (SARs). See Item 7 - Management’s Discussion and Analysis of Financial Condition and Results of Operations for further information.
8
|
Item 1B.
|
Unresolved Staff Comments |
None.
|
Item 2.
|
Properties |
The Company’s wholly-owned subsidiary, Mayfair Realty, currently owns two freestanding Gelson’s supermarket properties and a shopping center in which a Gelson’s Market is located. The shopping center owned by Mayfair Realty, located in Calabasas, California, consists of approximately 58,000 leasable square feet, approximately 18,000 square feet of which is leased to multiple tenants and approximately 40,000 square feet of which is leased to Gelson’s. The remaining fifteen supermarkets and the warehouse and distribution facilities which service the markets are leased from third parties. Gelson’s corporate offices in Encino, California and the Company’s executive office in Beverly Hills, California are also leased. Typically, supermarkets have initial twenty year lease terms and may include options for up to an additional twenty years. These leases often require the payment of percentage rent on sales in excess of certain levels in addition to minimum rent. The average term remaining on Gelson’s supermarket leases, including renewal options, is approximately seventeen years. The eighteen markets range in size from approximately 18,000 to 40,000 square feet. Gelson’s warehouse and distribution facilities in the City of Commerce, California are leased and contain approximately 127,000 square feet. The term of the lease, including renewal options, expires in June 2026. Mayfair Realty also owns a 30,000 square foot office building in Compton, California which serves as the Company’s headquarters. The Company also owns (through Mayfair Realty) or leases several parcels adjacent to or near its stores which are used for additional parking.
|
Item 3.
|
Legal Proceedings |
The Company and certain of its subsidiaries are involved in a number of pending legal and/or administrative proceedings. Such proceedings are not expected individually or in the aggregate to have a material adverse impact upon either the Company’s consolidated financial position, results of operations or cash flows. See the discussion of Commitments and Contingent Liabilities in Note 16 of Notes to Consolidated Financial Statements.
|
Item 4.
|
(Removed and Reserved) |
9
PART II
|
Item 5.
|
Market for the Registrant’s Common Equity, Related Stockholder Matters and Issuer Purchases of Equity Securities |
|
(a)
|
The Company’s Class A is traded in the NASDAQ Global Market under the symbol ARDNA. During the past two years, the range of high and low sales prices for each quarterly period was, according to NASDAQ, the following:
|
|
2010
|
2009
|
|||||||||||||||
|
High
|
Low
|
High
|
Low
|
|||||||||||||
|
1st Quarter
|
$ | 111.99 | $ | 90.55 | $ | 128.14 | $ | 76.56 | ||||||||
|
2nd Quarter
|
113.65 | 86.25 | 131.50 | 103.55 | ||||||||||||
|
3rd Quarter
|
98.39 | 82.02 | 134.14 | 112.57 | ||||||||||||
|
4th Quarter
|
94.93 | 77.15 | 122.52 | 89.98 | ||||||||||||
|
(b)
|
As of January 1, 2011, there were 765 holders of record of the Company’s Class A, with aggregate holdings of 3,161,098 shares of Class A. This does not include 1,357,200 shares of the Company’s Class A owned by AMG Holdings, Inc., a wholly-owned second-tier subsidiary of the Company.
|
|
(c)
|
The Company declared regular quarterly dividends of 25 cents per share of Class A during fiscal 2010 and 2009. The Company currently anticipates payment of comparable Class A quarterly dividends in future quarters.
|
10
Stock Performance Chart
The following graph compares the cumulative stockholder return on the Company’s Class A with the cumulative total return of the S&P 500 Index and the S&P Food Retail Index for the five-year period ending December 31, 2010. The graph assumes that $100 was invested on December 31, 2005, in the Class A and in each of the above-mentioned indices with all dividends reinvested. The information presented in the graph was obtained by the Company from outside sources it considers to be reliable but has not been independently verified by the Company.
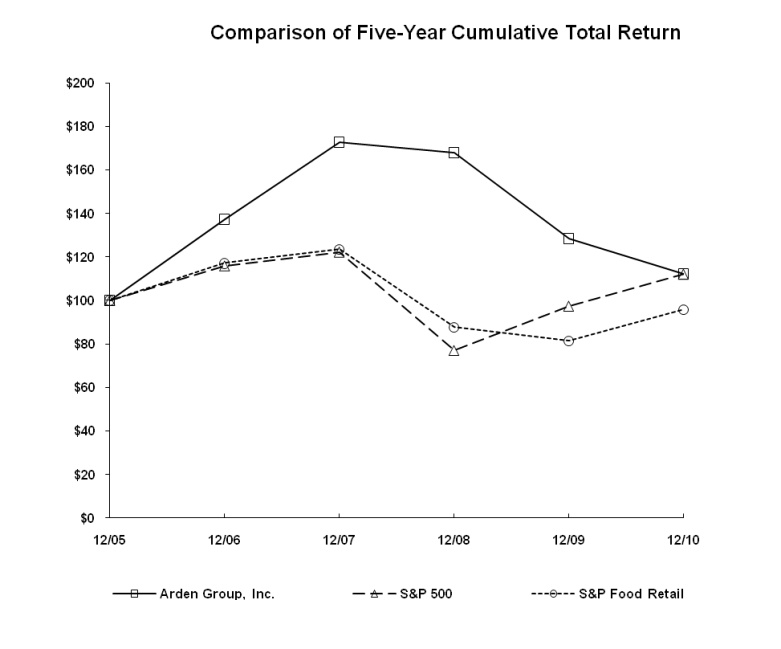
| 12/05 | 12/06 | 12/07 | 12/08 | 12/09 | 12/10 | |||||||||||||||||||
|
Arden Group, Inc.
|
100.00 | 137.34 | 172.85 | 167.92 | 128.58 | 112.18 | ||||||||||||||||||
|
S&P 500
|
100.00 | 115.80 | 122.16 | 76.96 | 97.33 | 111.99 | ||||||||||||||||||
|
S&P Food Retail
|
100.00 | 117.15 | 123.51 | 87.53 | 81.37 | 95.72 |
11
|
Item 6.
|
Selected Financial Data |
ARDEN GROUP, INC. AND CONSOLIDATED SUBSIDIARIES
(In Thousands, Except Share and Per Share Data)
All years are 52 weeks except 2008 which is 53 weeks.
|
(1)
|
Same store sales increases or decreases are calculated by comparing year-over-year sales for stores that were open in both years. If a store was not open for the entire year in both years being compared, then the store is not included in the same store analysis. No stores were opened or closed during any of the periods presented. Fiscal 2008 was a 53-week year. No adjustment was made to remove the additional week for comparison purposes. Store sales used to calculate sales increases or decreases, above, do not include revenue from leases, subleases, licensing arrangements and finance charges and, therefore, may not agree to total year-over-year sales increases or decreases as disclosed in Item 7 - Management’s Discussion and Analysis of Financial Condition and Results of Operations.
|
12
|
Item 7.
|
Management’s Discussion and Analysis of Financial Condition and Results of Operations
|
The Private Securities Litigation Reform Act of 1995 provides a safe harbor for forward-looking statements made by or on behalf of the Company. Certain statements contained in Management’s Discussion and Analysis of Financial Condition and Results of Operations, other parts of this report and other Company filings are forward-looking statements. These statements discuss, among other things, future sales, operating results and financial condition. Forward-looking statements reflect the Company’s current plans and expectations regarding important risk factors and are based on information currently available to us. The Company cautions readers that any forward-looking statements contained in this report or made by the management of the Company involve risks and uncertainties, and are subject to change based on various important factors. Such statements may be identified by such words as “anticipate,” “expect,” “may,” “believe,” “could,” “estimate,” “project,” and similar words or phrases. The Company does not undertake any obligation to update forward-looking statements.
Overview
Arden is a holding company which conducts operations through its first and second tier wholly-owned subsidiaries, Arden-Mayfair and Gelson’s, respectively, as well as owning and managing its real estate through Mayfair Realty which is owned by the Company and Arden-Mayfair. Gelson’s operates eighteen full-service supermarkets in Southern California. Gelson’s caters to those customers who expect superior quality, service and merchandise selection. In addition to the customary supermarket offerings, Gelson’s offers specialty items such as imported foods, unusual delicatessen items, prepared foods and organic and natural food products. Gelson’s stores include the typical service departments such as meat, seafood, service deli, floral, sushi, cheese and bakery. In addition, some stores offer further services including fresh pizza, coffee bars, self-service hot and cold food cases, gelato bars and carving carts offering cooked poultry and meats.
The Company’s management focuses on a number of performance indicators in evaluating financial condition and results of operations. Same store sales, gross profit and labor costs are some of the key factors that management considers. Both sales and gross profit are significantly influenced by competition in our trade area. Gelson’s faces competition from regional and national supermarket chains (most of which have greater resources and a larger market share than Gelson’s), stores specializing in natural and organic foods, specialty and gourmet markets and grocery departments in mass merchandise and club stores. The weak economic conditions have led to even greater competition in the grocery industry. As discretionary income has declined, some consumers have reduced their spending and are making more price conscious decisions which has caused us to compete for fewer customer dollars and has forced us to lower some of our retail prices and offer more promotional discounts as our competitors have also reduced their prices in an attempt to maintain or increase their own market share. Principally, for these reasons, the Company has experienced year-over-year sales decreases since 2008.
13
Labor and other related payroll costs are the second largest expense (after product cost) incurred by Gelson’s, and thus is a financial measure which is monitored by management. As of the fiscal 2010 year-end, Gelson’s had approximately 1,222 full-time and 860 part-time store, warehouse and office employees. The majority of Gelson’s employees are members of the UFCW. The Company’s current contract with the UFCW expired March 6, 2011. The agreement that the Majors currently have with the UFCW provides for hourly wage rates based on job classification and experience levels that, in some cases, are less than those agreed to by Gelson’s. The Majors are currently in negotiations with the UFCW to renew their collective bargaining agreements which also expired on March 6, 2011. The Company has signed an extension agreement with the UFCW pending the outcome of the UFCW’s negotiations with the Majors which obligates Gelson’s to any changes agreed to by the Majors in hourly wage rates and contributions to the benefit plans. In addition, certain of the Company’s warehouse and office employees are members of the International Brotherhood of Teamsters (Teamsters Union). The Company’s contract with the Teamsters Union was renewed in 2010 for a five-year period expiring September 20, 2015 on terms similar to those reached by the major retailers and wholesaler in our trade area.
The Company contributes to a multi-employer health care trust and a pension plan trust on behalf of its employees who are members of the UFCW. All employers who participate in a multi-employer plan are required to contribute at the same hourly rate based on straight-time hours worked in order to fund the plan. The Company’s health and welfare contribution rate was scheduled to increase effective with hours worked during March 2009 and after; however, the Company was notified by the Trust, in the first quarter of 2009, that the increase had been suspended. In March 2010, the Company was notified that the UFCW health and welfare contribution rate would increase effective March 2010 to the maximum allowable rate under the collective bargaining agreement; and as a result, average weekly health and welfare expense has been running approximately $74,000 higher than prior to that increase. The expired agreement allowed for an additional increase in the health and welfare contribution rate effective February 2011 which has resulted in an additional increase of $11,000 per week. The increase in health and welfare costs, as well as the labor cost issue discussed above, has negatively impacted the Company’s profitability and will continue to unless the Company is able to offset the increased expense through a combination of sales growth, increased gross margin, reduced labor hours and cost savings in other areas. Current economic and competitive conditions make it difficult for the Company to achieve significant sales growth and increased profit margins.
The Company also participates in various multi-employer union pension plans. Adverse financial market developments have significantly impacted the funded status of pension plans on a worldwide basis. Currently, the Company’s contributions under the UFCW pension plan are fixed under the terms of the current agreement which ended on March 6, 2011. The economic downturn and increases in health care costs have had a significant impact on the funded status of the health care and pension plans to which the Company contributes. Many factors influence the funded status of the plans including changes in the cost of health care, the return on investments of funds held by the plans, changes to benefits offered under the plans, government regulations and the level of employee utilization. The Company anticipates that both health care and pension benefits will be important topics during the UFCW negotiations. If, in the future, the Company and other participating employers are unable to negotiate an acceptable agreement with the union concerning employee benefits, a labor dispute could result or the negotiations could result in a new agreement requiring higher contribution rates. In addition, if any of the participating employers in the plan withdraws from the plan due to insolvency and is not able to contribute an amount sufficient to cover the underfunded liabilities associated with its participants, the Company may be required to make additional contributions. Each of these scenarios could negatively impact the Company’s financial condition and results of operations.
14
Another component of labor related expense is the cost of workers’ compensation. For some years prior to July 1, 2006, the Company is primarily self-insured through the use of a high deductible policy which provides the Company with stop-loss coverage to limit its exposure on a per claim basis and provides coverage for qualifying costs in excess of per claim limits. Since July 1, 2006, the Company has purchased fully insured guaranteed cost workers’ compensation insurance to replace the high deductible program. The guaranteed cost program eliminates the Company’s risk against claims occurring after June 30, 2006 and has resulted in lower workers’ compensation expense compared to the high deductible program. The Company continues to maintain an accrual for workers’ compensation claims incurred prior to July 2006 under the high deductible program. That accrual is based on both undeveloped reported claims and an estimate of claims incurred but not reported. While the Company devotes substantial time and commitment to maintaining a safe work environment, the ultimate cost of workers’ compensation is highly dependent upon legal and legislative trends, the inflation rate of health care costs and the Company’s ability to manage claims.
In the past, the Company’s quarterly results have reflected significant fluctuations in operating income as a result of adjustments recorded to reflect the change in the fair value of SARs that have been granted to non-employee directors and certain employees. Each SAR entitles the holder to receive cash upon exercise equal to the excess of the fair market value of a share of the Company’s Class A, as determined in accordance with the SARs agreement, on the date of exercise over the fair market value of such share on the date granted. Fluctuations in the market price of the Company’s Class A from the end of the previous fiscal year impact the recognition or reversal of SARs compensation expense in the year being reported upon. Since the Company cannot predict future fluctuations in the market price of its stock, it also cannot forecast future SARs compensation expense adjustments and the extent to which operating income will be impacted.
Results of Operations
2010 Compared to 2009
Sales from the Company’s eighteen supermarkets (all of which are located in Southern California), including revenue from licensing arrangements, subleases, leases and finance charges, were $417,065,000 in 2010. This represents a decrease of 3.3% from 2009, when sales were $431,170,000. Sales were negatively impacted by economic conditions, competition in our trade area and increased promotional discounts.
The Company’s gross profit as a percent of sales was 38.3% in 2010 compared to 38.6% in 2009. In calculating gross profit, the Company deducts product costs, net of discounts and allowances, and inbound freight charges, as well as warehouse, transportation, purchasing, advertising and occupancy costs. Gross profit as a percent of sales for the Company may not be comparable to those of other companies in the grocery industry since there may be differences in recording certain costs as cost of sales or as selling, general and administrative (SG&A) expense.
15
SG&A expense as a percent of sales was 31.0% in 2010 compared to 30.2% in 2009. The increase in SG&A expense as a percent of sales is predominately due to the increase in the health and welfare contribution rate as discussed above. Contributions to the health and welfare trust were somewhat offset by a reduction in labor hours worked as a result of decreased sales. Also, as sales decrease, SG&A expense as a percent of sales increases to some degree as certain of the Company’s costs are fixed and do not decrease proportionately with a decline in revenues. SG&A expense as a percent of sales is also higher due to an increase in UFCW hourly wage rates effective March 2010 in accordance with the collective bargaining agreement. The increase in SG&A expense as a percent of sales was partially offset by a gain of $570,000 from the early termination of a lease by the landlord of a property that was being leased by AMG Holdings, Inc., a wholly-owned subsidiary of Arden-Mayfair.
The Company contributes to several multi-employer union pension and health care plans. Pension and health care payments are determined based on straight-time hours worked and the contribution rate as stipulated in the Company’s various collective bargaining agreements. The Company recognized union pension expense of $4,558,000 in 2010 compared to $4,730,000 in 2009. Union health care expense was $11,934,000 in 2010 compared to $8,815,000 in 2009. Health care costs increased due to an increase in the contribution rate partially offset by a reduction in the number of hours eligible for contributions.
Authoritative guidance requires the Company to measure and recognize compensation expense based on the fair value of SARs. The fair value must be remeasured each reporting period until the award is settled and compensation expense must be recognized or reversed each reporting period to reflect changes in fair value and vesting. During 2010, the Company reversed $394,000 of SARs compensation expense recognized in prior periods due to the exchange of shares as discussed below and a decrease in the fair value of SARs during the year partially offset by additional vesting. During 2009, the Company reversed $273,000 of SARs compensation expense. Compensation expense is included under SG&A expense on the Consolidated Statements of Operations and Comprehensive Income. As of January 1, 2011, assuming no change in the SARs fair value, there was approximately $1,749,000 of total unrecognized compensation cost related to outstanding SARs which is expected to be recognized over a weighted average period of 4.9 years. The total intrinsic value of SARs exercised during 2010 and 2009 was $0 and $34,000, respectively. Intrinsic value represents the amount by which the fair value of SARs exceeds the grant price.
In January 2010, holders of the Company’s SARs with a grant date on or before December 6, 2007 were offered the opportunity to exchange their then outstanding SARs units for an equal number of new SARs units with a lower grant price of $110 and a new vesting period. Existing grant prices for these units ranged from $121.03 to $146.44. Ordinarily, the grant price is determined based upon the fair market value of a share of the Company’s Class A on the date of grant. On January 4, 2010, when the exchange offer was made to these SARs holders, the Class A closing price was $95.98 per share. For those holders who accepted the Company’s exchange offer, the new SARs were granted effective January 15, 2010 and expire January 15, 2017. The Class A closing price on the January 15, 2010 grant date was $108.71. SAR holders who opted to exchange their SARs also agreed to restart their vesting period. The new SARs vest 25% each year beginning at the end of the third year and expire seven years from the date of grant. Of the 110,625 SARs units outstanding at fiscal 2009 year end, 99,000 SARs units were exchanged. Just prior to the exchange on January 15, 2010, the Company had accrued approximately $817,000 for the exchanged SARs. After the exchange, the accrual of $817,000 was reversed.
16
During 2010, the Company procured approximately 15% of its product through Unified, a grocery wholesale cooperative. As a member-patron, the Company is required to provide Unified with certain minimum deposits in order to purchase product from the cooperative. As of January 1, 2011, the Company had approximately $1,628,000 on deposit with Unified, in addition to approximately $694,000 related to ownership of equity shares in Unified. There is no established public trading market for Unified’s shares and the Company accounts for its investment under the cost method. In 2010 and 2009, the Company recorded approximately $1,000 and $56,000, respectively, in patronage dividend income received in the form of cash and Unified equity shares as a reduction of cost of sales.
Interest and dividend income, net of interest expense, was $254,000 in 2010 compared to $253,000 for 2009. Individually, both interest income and interest expense increased over the prior year as the Company invested in more debentures at a premium. The amortization of this premium is recorded under interest expense.
2009 Compared to 2008
Sales from the Company’s eighteen supermarkets, including revenue from licensing arrangements, subleases, leases and finance charges, were $431,170,000 in 2009. This represents a decrease of 10.0% from 2008, when sales were $479,117,000. 2009 sales declined partially as a result of fewer weeks in 2009 (a 52-week fiscal year) compared to 2008 (a 53-week fiscal year). Sales were also negatively impacted by economic conditions and increased competition in our trade area.
The Company’s gross profit as a percent of sales was 38.6% in 2009 compared to 38.5% in 2008. In calculating gross profit, the Company deducts product costs, net of discounts and allowances, and inbound freight charges, as well as warehouse, transportation, purchasing, advertising and occupancy costs. Gross profit as a percent of sales for the Company may not be comparable to those of other companies in the grocery industry since there may be differences in recording certain costs as cost of sales or as SG&A expense.
SG&A expense as a percent of sales was 30.2% in 2009 compared to 30.1% in 2008. The increase in SG&A expense as a percent of sales is primarily due to an increase in the UFCW hourly wage rates effective early March 2008 and 2009 in accordance with the collective bargaining agreement. To a lesser extent, SG&A expense was also impacted by hourly wage rate increases under collective bargaining agreements with unions other than the UFCW and an increase in utility costs. Also, as sales decrease, SG&A expense as a percent of sales increases to some degree as certain of the Company’s costs are fixed and do not decrease proportionately with a decline in revenues. The increase in SG&A expense as a percent of sales was partially offset by a decrease in SARs compensation expense. During 2009, the Company reversed $273,000 of SARs compensation expense recognized in prior periods due to a decrease in the fair value of SARs during the year partially offset by additional vesting. The Company recognized $1,823,000 of SARs compensation expense during 2008.
The Company contributes to several multi-employer union pension and health care plans. Pension and health care payments are determined based on straight-time hours worked and the contribution rate as stipulated in the Company’s various collective bargaining agreements. The Company recognized union pension expense of $4,730,000 in 2009 compared to $5,065,000 in 2008. Union health care expense was $8,815,000 in 2009 compared to $9,258,000 in 2008. Costs decreased due to a reduction in the number of hours eligible for contributions.
17
During 2009, the Company procured approximately 16% of its product through Unified, a grocery wholesale cooperative. As a member-patron, the Company is required to provide Unified with certain minimum deposits in order to purchase product from the cooperative. As of January 2, 2010, the Company had approximately $1,628,000 on deposit with Unified, in addition to approximately $694,000 related to ownership of equity shares in Unified. There is no established public trading market for Unified’s shares. In 2009 and 2008, the Company recorded approximately $56,000 and $251,000, respectively, in patronage dividend income received in the form of cash and Unified equity shares as a reduction of cost of sales.
Interest and dividend income was $756,000 in 2009 compared to $2,460,000 for 2008. The decrease is partially due to significantly lower interest rates as a result of the general economic financial crisis. In addition, the Company’s cash available for investment was significantly lower during 2009 compared to 2008 due to a special cash dividend paid on December 8, 2008 totaling approximately $79,027,000.
Liquidity and Capital Resources
The Company’s current cash position, including investments and net cash provided by operating activities, are the primary sources of funds available to meet the Company’s capital expenditure and liquidity requirements. The Company’s cash position, including investments, at January 1, 2011 was $54,690,000, an increase of $16,309,000 over the end of the prior year. Cash not required for the immediate needs of the Company is temporarily invested in U.S. Treasuries, certificates of deposit, money market funds, commercial paper, mutual funds and corporate and government securities. During the fourth quarter of 2010, the Company shifted most of its investments to short-term, highly liquid treasuries. The Company is continually investigating opportunities for the use of these funds including new locations and the expansion and remodel of existing stores.
At year end, the Company also had two revolving lines of credit totaling $23,000,000 available for standby letters of credit, funding operations and expansion. There were no outstanding borrowings against either of the revolving lines as of January 1, 2011. In January 2011, the Company voluntarily terminated its existing lines of credit and established a new letter of credit facility totaling $10,000,000 with a different bank. The Company is currently in discussions for additional borrowing facilities with the new bank. The Company currently maintains four standby letters of credit aggregating $8,319,000 pursuant to the Company’s lease requirements and general and auto liability and workers’ compensation self-insurance programs. In connection with the cancellation of one of the previous lines of credit, these letters of credit were cancelled and reestablished with the new bank for the same dollar amounts. Under the new facility, these letters of credit are secured by a compensating balance arrangement which the Company expects to eliminate with the new facility that is currently being discussed.
The Company’s working capital was $51,062,000 as of January 1, 2011 compared to $33,925,000 as of January 2, 2010. The Company believes that its current working capital, as well as future cash flow, is sufficient to meet its ongoing needs during fiscal 2011. Net cash provided by operating activities during fiscal 2010 totaled $23,088,000. Cash flows from operating activities resulted primarily from net income plus non-cash expenses and changes in working capital.
18
Net cash provided by investing activities was $19,484,000 in 2010. Investing activities included the sale of investments of $51,926,000 partially offset by the purchase of investments of $29,861,000 and capital expenditures of $2,597,000. Net cash used in financing activities consisted solely of dividends paid during 2010 totaling $3,161,000.
The Company’s current ratio was 2.65 as of January 1, 2011 compared to 2.04 as of January 2, 2010. The Company’s total liabilities to equity ratio decreased to .51 as of January 1, 2011 from .65 as of January 2, 2010.
The following table sets forth the Company’s contractual cash obligations and commercial commitments as of January 1, 2011:
|
Contractual Cash Obligations (In Thousands)
|
||||||||||||||||||||
| Total |
Less Than
1 Year
|
1-3 Years
|
4-5 Years
|
After
5 Years
|
||||||||||||||||
|
7% Subordinated Income Debentures
|
||||||||||||||||||||
|
Due September 2014 Including Interest
|
$ | 1,572 | $ | 86 | $ | 172 | $ | 1,314 | $ | 0 | ||||||||||
|
Operating Leases
|
116,160 | 10,858 | 21,115 | 18,903 | 65,284 | |||||||||||||||
|
Total Contractual Cash Obligations (1)
|
$ | 117,732 | $ | 10,944 | $ | 21,287 | $ | 20,217 | $ | 65,284 | ||||||||||
| Other Commercial Commitments (In Thousands) | ||||||||||||||||||||
|
Total
|
Less Than
1 Year |
1-3 Years
|
4-5 Years
|
After
5 Years
|
||||||||||||||||
|
Standby Letters of Credit (2)
|
$ | 8,319 | $ | 8,319 | $ | 0 | $ | 0 | $ | 0 | ||||||||||
|
(1)
|
Other Contractual Cash Obligations |
The Company had the following other contractual cash obligations at January 1, 2011. The Company is unable to include these liabilities in the tabular disclosure of contractual cash obligations as the exact timing and amount of payments is unknown.
Self-Insurance Reserves
The Company is primarily self-insured for losses related to general and auto liability claims and for all open years prior to July 1, 2006 for workers’ compensation. The Company maintains stop-loss insurance coverage to limit its loss exposure on a per claim basis. Effective July 1, 2006, the Company purchased a fully insured guaranteed cost workers’ compensation insurance policy for losses occurring after June 30, 2006. This policy replaced the high deductible program for workers’ compensation. Liabilities associated with the risks that are retained by the Company under the high deductible programs are estimated, in part, by considering historical claims experience and regression analysis. Accruals are based on undeveloped reported claims and an estimate of claims incurred but not reported. While the ultimate amount of claims incurred is dependent on future developments, in management’s opinion recorded reserves are adequate to cover the future payment of claims. The Company’s liability reserve for unpaid and incurred but not reported claims at January 1, 2011 was approximately $3,572,000.
19
Employment Agreement
Bernard Briskin, Chairman of the Board of Directors, President and Chief Executive Officer of the Company has an employment agreement with the Company that provides for annual retirement compensation for the remainder of his lifetime equal to 25% of his average base salary and bonus earned in the last three fiscal years prior to his retirement. The Company had accrued $1,513,000 under the terms of the employment agreement as of January 1, 2011.
Property, Plant and Equipment Purchases
As of January 1, 2011, management had authorized expenditures on incomplete projects for the purchase of property, plant and equipment which totaled approximately $441,000. The Company has an ongoing program to remodel existing supermarkets and to add new stores. During 2010, total capital expenditures were $2,597,000.
|
(2)
|
Standby Letters of Credit
|
All of the Company’s letters of credit renew automatically each year unless the issuer notifies the Company otherwise. The amount of each outstanding letter of credit pursuant to the Company’s workers’ compensation and general and auto liability insurance programs will be adjusted annually based upon the outstanding claim reserves as of the renewal date. Each letter of credit obligation related to insurance will cease when all claims for the particular policy year are closed or the Company negotiates a release.
In March 2007, the Company announced a stock repurchase program, authorized by the Board of Directors, to purchase from time to time up to 200,000 shares of its Class A in the open market or in private transactions. This was in addition to 22,904 shares remaining under prior repurchase authorizations. The timing, volume and price of purchases are at the discretion of the management of the Company. No stock was repurchased under this program in 2010, 2009 or 2008.
During 2010, 2009 and 2008, the Company paid regular quarterly dividends of 25 cents per share of Class A for a total of approximately $3,161,000 in each year. In addition, the Company paid a special cash dividend of twenty-five dollars ($25) per share on its outstanding Class A totaling approximately $79,027,000 on December 8, 2008 to stockholders of record at the close of business on November 20, 2008.
Critical Accounting Policies
The preparation of financial statements in conformity with accounting principles generally accepted in the United States (GAAP) requires management to make estimates and assumptions about future events that may affect the reported amounts of assets, liabilities, revenues and expenses, as well as the disclosure of contingent assets and liabilities. Management has established accounting policies that they believe are appropriate in order to reflect the accurate reporting of the Company’s operating results, financial position and cash flows. The Company applies these accounting policies in a consistent manner. Management bases their estimates on historical experience, current and expected economic conditions and various other factors that management believes to be reasonable under the circumstances. These estimates and assumptions form the basis for making judgments about the carrying values of assets and liabilities that are not readily apparent from other sources. The Company reevaluates these significant factors and makes adjustments where facts and circumstances dictate. Future events and their effects cannot be determined with absolute certainty, and therefore actual results may differ from estimates.
20
Management believes that the following accounting policies are the most critical in the preparation of the Company’s financial statements because they involve the most difficult, subjective or complex judgments about the effect of matters that are inherently uncertain.
Inventories and Cost of Sales
Supermarket nonperishable inventories are recorded using the retail method and are stated at the lower of cost or market, with cost determined using the last-in, first-out (LIFO) method. Perishable inventories are valued at the lower of cost on a first-in, first-out (FIFO) basis or market. Under the retail inventory method, cost of sales is determined by applying a cost-to-retail ratio to sales for the period to determine cost of sales. Cost of sales is then deducted from beginning inventory plus purchases to arrive at ending inventory. The Company performs physical inventories of nonperishable items at all of its locations three times per year, at which time, ending inventory and cost of sales are adjusted to reflect actual inventory on hand and cost of sales. Physical inventories of perishable products are conducted at the end of each fiscal month.
Approximately 88.9% and 88.6% of the Company’s inventories were valued using the LIFO method as of January 1, 2011 and January 2, 2010, respectively. The LIFO method assumes that the cost of the most recently purchased items are the first to be sold, and thus, are used to measure cost of sales, leaving the earlier costs residing in the ending inventory valuation. The Company uses the Link-Chain, Dollar-Value method for purposes of calculating its LIFO charge or credit each year for nonperishable inventories. This method requires management to compute a cumulative price index which represents the change in inventory cost since the base year (i.e., the beginning of the year in which LIFO was first elected) compared to the current cost of inventory. The cumulative index is then applied to the current cost of inventory to determine the value of inventory at base year costs. This computation is performed separately for each of the Company’s individual LIFO pools (i.e., groupings of similar items such as basic grocery, housewares, alcoholic beverages, etc.) The LIFO method requires management to make assumptions and to apply judgment regarding inventory mix and factors related to the computation of price indices which could impact the ending inventory valuation as well as cost of sales. If the FIFO method had been used for nonperishable inventories instead of the LIFO method, total inventory as of January 1, 2011 and January 2, 2010 would have been higher by approximately $6,447,000 and $6,433,000, respectively.
The Company evaluates inventory shortages throughout the year based on actual physical counts at its stores and warehouse. Allowances for inventory shortages are recorded based on the results of these counts to provide for estimated shortages from the last physical count to the financial statement date. Although the Company has sufficient historical data to record reasonable estimates of inventory shortages, actual results could differ. As of January 1, 2011, a difference between actual and estimated shortages of, for example, 25 basis points would have an annual impact of approximately $587,000 on cost of sales.
21
Impairment of Long-Lived Assets
The Company monitors the carrying value of long-lived assets for potential impairment whenever events or changes in circumstances indicate the carrying value of an asset may not be recoverable. Impairment is recognized when estimated future cash flows (undiscounted and before interest charges) are less than carrying value. The factor that most significantly affects the impairment calculation is management’s estimate of future cash flows which is inherently uncertain and relies on various assumptions regarding current and future economic and market conditions and the availability of capital. The Company’s cash flow projection looks several years into the future and includes assumptions such as the rate of inflation/deflation, the strength of the economy, competition in our trade area, the ability to secure subtenants and the Company’s ability to negotiate early termination agreements. If impairment analysis assumptions change, then an adjustment to the carrying value of the Company’s long-lived assets could occur. To the extent that an asset is impaired, the excess of the carrying amount of the asset over its estimated fair value is charged against earnings. No asset impairment charges or adjustments were recognized during fiscal 2010, 2009 or 2008.
Workers’ Compensation and General and Auto Liability Insurance
The Company is primarily self-insured (i) for losses for all years related to general and auto liability claims and (ii) for some years prior to July 1, 2006 for workers’ compensation. Where primarily self-insured, the Company purchases stop-loss insurance coverage to limit its loss exposure on a per claim basis. Related accruals are based on undeveloped reported claims and an estimate of claims incurred but not reported. The amount of reserves for reported claims are determined by a third party administrator claims representative who considers the individual facts of each claim including severity in arriving at an estimate of the Company’s total exposure. In addition, the Company analyzes its historical paid and incurred loss trends in order to further develop an estimate of its ultimate cost of reported claims and claims incurred but not reported. Such estimates and historical trends are not an absolute indication of future results, and the Company reevaluates these reserves quarterly based on the most current information available. The ultimate cost of claims are impacted by numerous variables including the frequency and severity of claims, legal and legislative trends, changes in benefit levels, the rate of inflation and claim settlement patterns.
Since July 1, 2006, the Company has purchased fully insured guaranteed cost workers’ compensation insurance thereby limiting its exposure for workers’ compensation to the cost of the related insurance premium. The Company’s self-insured workers’ compensation accrual for claims incurred prior to July 2006 decreased from $3,484,000 at the beginning of fiscal 2010 to $2,211,000 at the end of the year as a result of payments of $1,241,000, which amount was partially offset by reserve adjustments of $32,000. The Company expects the workers’ compensation reserve to continue to decline as it continues to pay down and close outstanding workers’ compensation claims which occurred prior to July 1, 2006. The Company’s reserves for general and auto liability claims increased by approximately $268,000 during fiscal 2010. The net increase reflects a net accrual, including reserve adjustments, of $823,000 partially offset by payments of $555,000.
Vendor Allowances
The Company receives a variety of allowances from its vendors whose products are sold in Gelson’s stores. Typically, the vendors are paying the Company to promote their products. The promotion may be a temporary price reduction, a feature in a print advertisement or newsletter, placement of the vendor’s product in a preferred location in a store or introduction of a new product. The promotions range from approximately two weeks to six months and are recognized as a reduction of cost of sales as they are earned.
22
Vendor funds that have been earned as a result of completing the required performance under the terms of the underlying agreements but for which the product has not yet been sold are recognized as reductions of inventory. The amount and timing of recognition of vendor allowances as a reduction of cost of sales, as well as the amount of vendor funds remaining in ending inventory, requires management judgment and estimates. Management estimates current year purchase volume based on projected and historical data. In turn, the estimated purchase volume is used to determine the amount of vendor allowances to recognize each period. The Company does not expect that there will be a significant change in the annual level of vendor support; however, a one percent change in total vendor funds earned would likewise impact gross profit by approximately .04% as a percent of sales.
Stock Appreciation Rights
Outstanding SARs are revalued at the end of each quarter using the Black-Scholes option-pricing model which incorporates various highly subjective assumptions, including expected term, expected volatility, expected dividend yield and a risk-free interest rate. The fair value of SARs, as determined using the Black-Scholes option-pricing model, does not necessarily reflect the amount that will be paid out in accordance with the SARs agreement on the date of exercise. In addition, changes in the market price of the Company’s Class A can and have significantly impacted the recognition or reversal of SARs expense.
Recent Accounting Standards
In January 2010, the Financial Accounting Standards Board (FASB) issued authoritative guidance that requires entities to make new disclosures about recurring or nonrecurring fair value measurements of assets and liabilities, including 1) the amounts of significant transfers of assets and liabilities between Level 1 and Level 2 fair value measurements and the reasons for the transfers, 2) the reasons for any transfers in or out of Level 3, and 3) information on purchases, sales, issuances and settlements on a gross basis in the reconciliation of recurring Level 3 fair value measurements. The FASB also clarified existing fair value measurement disclosure guidance about the level of disaggregation of assets and liabilities, and information about the valuation techniques and inputs used in estimating Level 2 and Level 3 fair value measurements. Except for certain detailed Level 3 disclosures, which are effective for fiscal years beginning after December 15, 2010 and interim periods within those years, the new guidance became effective for the Company’s first quarter of 2010. The Company did not have transfers of assets or liabilities in or out of Level 1 fair value measurements and does not have assets or liabilities requiring Level 3 fair value measurements. The adoption of this guidance did not have an impact on the Company’s consolidated financial statements.
|
Item 7A.
|
Quantitative and Qualitative Disclosures about Market Risks |
The Company currently has no outstanding bank debt or fixture financing. If the Company should borrow in the future, the Company could then be exposed to market risk related to interest fluctuations.
A change in market prices exposes the Company to market risk related to its investments. As of January 1, 2011, all investments were classified as available-for-sale securities and totaled $2,099,000. A hypothetical 10% drop in the market value of these investments would result in a $209,900 unrealized loss and a corresponding decrease in the fair value of these instruments. This hypothetical drop would not affect cash flow and would not have an impact on earnings until the Company sold the investments.
23
|
Item 8.
|
Financial Statements and Supplementary Data
|
See Index to Consolidated Financial Statements.
|
Item 9.
|
Changes in and Disagreements with Accountants on Accounting and Financial Disclosure
|
None.
|
Item 9A.
|
Controls and Procedures
|
Evaluation of Disclosure Controls and Procedures
An evaluation was carried out by the Company’s Chief Executive Officer and the Chief Financial Officer of the effectiveness of the Company’s disclosure controls and procedures (as defined in Rules 13a-15(e) and 15d-15(e) under the Securities Exchange Act of 1934) as of January 1, 2011. Based upon that evaluation, the Chief Executive Officer and the Chief Financial Officer concluded that these disclosure controls and procedures were effective.
Changes in Internal Control over Financial Reporting
Management, with the participation of the Chief Executive Officer and the Chief Financial Officer of the Company, has evaluated any changes in the Company’s internal control over financial reporting that occurred during the most recent fiscal quarter. Based on that evaluation, management, the Chief Executive Officer and the Chief Financial Officer of the Company have concluded that there has been no change in the Company’s internal control over financial reporting during the Company’s fiscal quarter ended January 1, 2011 that has materially affected, or is reasonably likely to materially affect, the Company’s internal control over financial reporting.
|
Item 9B.
|
Other Information
|
None.
24
PART III
|
Item 10.
|
Directors, Executive Officers and Corporate Governance
|
The information required by this Item 10 is incorporated by reference from the Company’s definitive proxy statement for the 2011 Annual Meeting of Stockholders to be filed no later than 120 days after the end of the Company’s 2010 fiscal year with the SEC pursuant to Regulation 14A under the Securities Exchange Act of 1934, as amended (2011 Proxy Statement).
|
Item 11.
|
Executive Compensation
|
The information required by this Item 11 is incorporated by reference from the 2011 Proxy Statement.
|
Item 12.
|
Security Ownership of Certain Beneficial Owners and Management and Related Stockholder Matters
|
The information required by this Item 12 is incorporated by reference from the 2011 Proxy Statement.
|
Item 13.
|
Certain Relationships, Related Transactions and Director Independence
|
The information required by this Item 13 is incorporated by reference from the 2011 Proxy Statement.
|
Item 14.
|
Principal Accountant Fees and Services
|
The information required by this Item 14 is incorporated by reference from the 2011 Proxy Statement.
25
PART IV
|
Item 15.
|
Exhibits and Financial Statement Schedules
|
|
|
(a)
|
Exhibits and Financial Statements and Schedules
(1) Financial Statements
See Index to Consolidated Financial Statements
(2) Financial Statement Schedules - None
(3) Exhibits
See Index to Exhibits
|
|
|
(b)
|
Exhibits
See Index to Exhibits
|
|
|
(c)
|
Other Financial Schedules - None
|
26
SIGNATURES
Pursuant to the requirements of Section 13 or 15(d) of the Securities Exchange Act of 1934, the registrant has duly caused this report to be signed on its behalf by the undersigned, thereunto duly authorized.
ARDEN GROUP, INC.
| Date | ||
| By | /s/BERNARD BRISKIN | 3/10/11 |
|
Bernard Briskin, Chairman of the Board,
President and Chief Executive Officer
|
Pursuant to the requirements of the Securities Exchange Act of 1934, this report has been signed below by the following persons on behalf of the registrant and in the capacities and on the date indicated.
| Date | ||
| /s/BERNARD BRISKIN | 3/10/11 | |
|
Bernard Briskin, Director, Chairman of the Board, President
and Chief Executive Officer
(Principal Executive Officer)
|
||
| /s/LAURA J. NEUMANN | 3/10/11 | |
|
Laura J. Neumann, Chief Financial Officer
(Principal Financial and Principal Accounting Officer)
|
||
| /s/M. MARK ALBERT | 3/10/11 | |
|
M. Mark Albert, Director
|
||
| /s/JOHN G. DANHAKL | 3/10/11 | |
|
John G. Danhakl, Director
|
||
| /s/ROBERT A. DAVIDOW | 3/10/11 | |
|
Robert A. Davidow, Director
|
||
| /s/KENNETH A. GOLDMAN | 3/10/11 | |
|
Kenneth A. Goldman, Director
|
||
|
/s/STEVEN ROMICK
|
3/10/11 | |
|
Steven Romick, Director
|
27
ARDEN GROUP, INC. AND CONSOLIDATED SUBSIDIARIES
_______________________________________________________
INDEX TO CONSOLIDATED FINANCIAL STATEMENTS
_______________
|
|
Page
|
|
|
Management’s Report on Internal Control over Financial Reporting
|
29
|
|
|
Report of Independent Registered Public Accounting Firm
|
30
|
|
|
Financial Statements:
|
||
|
32
|
||
|
Consolidated Statements of Operations and Comprehensive Income for fiscal years 2010, 2009 and 2008
|
33
|
|
|
Consolidated Statements of Stockholders’ Equity for fiscal years 2010, 2009 and 2008
|
34
|
|
|
Consolidated Statements of Cash Flows for fiscal years 2010, 2009 and 2008
|
35
|
|
|
Notes to Consolidated Financial Statements
|
37
|
|
The financial statements include the Company’s subsidiaries (Arden-Mayfair, Inc. and Mayfair Realty, Inc.) and the subsidiaries of Arden-Mayfair, Inc.
Schedules are omitted because of the absence of the conditions under which they are required.
28
Management’s Report on Internal Control over Financial Reporting
The management of the Company is responsible for establishing and maintaining adequate internal control over financial reporting. The Company’s internal control over financial reporting is a process designed to provide reasonable assurance regarding the reliability of financial reporting and the preparation of financial statements for external purposes in accordance with accounting principles generally accepted in the United States. Because of its inherent limitations, internal control over financial reporting may not prevent or detect misstatements. Also, projections of any evaluation of effectiveness to future periods are subject to the risk that controls may become inadequate because of changes in conditions or that the degree of compliance with the policies or procedures may deteriorate.
The Company’s management assessed the effectiveness of the Company’s internal control over financial reporting as of January 1, 2011. In making the assessment, it used the criteria set forth by the Committee of Sponsoring Organizations of the Treadway Commission in Internal Control-Integrated Framework. Based on that assessment, management concluded that, as of January 1, 2011, the Company’s internal control over financial reporting is effective based on those criteria.
The effectiveness of the Company’s internal control over financial reporting as of January 1, 2011 has been audited by Moss Adams LLP, an independent registered public accounting firm, as stated in their report which appears on page 30.
29
Board of Directors and Stockholders of Arden Group, Inc. and Consolidated Subsidiaries
We have audited the accompanying consolidated balance sheets of Arden Group, Inc. and Consolidated Subsidiaries (the Company) as of January 1, 2011 and January 2, 2010, and the related consolidated statements of operations and comprehensive income, stockholders’ equity and cash flows for each of the years in the three-year period ended January 1, 2011. We also have audited the Company’s internal control over financial reporting as of January 1, 2011, based on criteria set forth by the Committee of Sponsoring Organizations of the Treadway Commission (COSO) in Internal Control - Integrated Framework. The Company’s management is responsible for these financial statements, for maintaining effective internal control over financial reporting, and for its assessment of the effectiveness of internal control over financial reporting included in the accompanying Management’s Report on Internal Control over Financial Reporting. Our responsibility is to express an opinion on these financial statements and an opinion on the Company’s internal control over financial reporting based on our audits.
We conducted our audits in accordance with the standards of the Public Company Accounting Oversight Board (United States). Those standards require that we plan and perform the audits to obtain reasonable assurance about whether the financial statements are free of material misstatement and whether effective internal control over financial reporting was maintained in all material respects. Our audits of the financial statements included examining, on a test basis, evidence supporting the amounts and disclosures in the financial statements, assessing the accounting principles used and significant estimates made by management, and evaluating the overall financial statement presentation. Our audit of internal control over financial reporting included obtaining an understanding of internal control over financial reporting, assessing the risk that a material weakness exists, and testing and evaluating the design and operating effectiveness of internal control based on the assessed risk. Our audits also include performing such other procedures as we considered necessary in the circumstances. We believe that our audits provide a reasonable basis for our opinions.
A company’s internal control over financial reporting is a process designed to provide reasonable assurance regarding the reliability of financial reporting and the preparation of financial statements for external purposes in accordance with generally accepted accounting principles. A company’s internal control over financial reporting includes those policies and procedures that (1) pertain to the maintenance of records that, in reasonable detail, accurately and fairly reflect the transactions and dispositions of the assets of the company; (2) provide reasonable assurance that transactions are recorded as necessary to permit preparation of financial statements in accordance with generally accepted accounting principles, and that receipts and expenditures of the company are being made only in accordance with authorizations of management and directors of the company; and (3) provide reasonable assurance regarding prevention or timely detection of unauthorized acquisition, use, or disposition of the company’s assets that could have a material effect on the financial statements.
30
Because of its inherent limitations, internal control over financial reporting may not prevent or detect misstatements. Also, projections of any evaluation of effectiveness to future periods are subject to the risk that controls may become inadequate because of changes in conditions or that the degree of compliance with the policies or procedures may deteriorate.
In our opinion, the consolidated financial statements referred to above present fairly, in all material respects, the consolidated financial position of Arden Group, Inc. and Consolidated Subsidiaries, as of January 1, 2011 and January 2, 2010, and the consolidated results of its operations and its cash flows for each of the three years in the period ended January 1, 2011, in conformity with accounting principles generally accepted in the United States of America. Also in our opinion, Arden Group, Inc. and Consolidated Subsidiaries, maintained, in all material respects, effective internal control over financial reporting as of January 1, 2011, based on criteria set forth by the COSO in Internal Control - Integrated Framework.
/s/Moss Adams LLP
Los Angeles, California
March 10, 2011
31
ARDEN GROUP, INC. AND CONSOLIDATED SUBSIDIARIES
_______________________________________________________
CONSOLIDATED BALANCE SHEETS
(In Thousands, Except Share and Per Share Data)
|
|
|||||||||
| Assets | January 1, 2011 | January 2, 2010 | |||||||
|
Current assets:
|
|||||||||
|
Cash and cash equivalents
|
$ | 52,591 | $ | 13,180 | |||||
|
Investments
|
2,099 | 25,201 | |||||||
|
Accounts receivable, net of allowance for doubtful accounts
|
|||||||||
|
of $201 and $300 as of January 1, 2011 and
|
|||||||||
|
January 2, 2010, respectively
|
4,580 | 5,423 | |||||||
|
Inventories, net
|
18,176 | 16,874 | |||||||
|
Deferred income taxes
|
1,797 | 2,870 | |||||||
|
Other current assets
|
2,838 | 2,933 | |||||||
|
Total current assets
|
82,081 | 66,481 | |||||||
|
Property, plant and equipment, net
|
38,247 | 40,981 | |||||||
|
Deferred income taxes
|
4,293 | 4,345 | |||||||
|
Other assets
|
3,263 | 3,290 | |||||||
|
Total assets
|
$ | 127,884 | $ | 115,097 | |||||
|
Liabilities and Stockholders’ Equity
|
|||||||||
|
Current liabilities:
|
|||||||||
|
Accounts payable, trade
|
$ | 12,790 | $ | 12,366 | |||||
|
Federal and state income taxes payable
|
626 | 863 | |||||||
|
Other current liabilities
|
17,603 | 19,327 | |||||||
|
Total current liabilities
|
31,019 | 32,556 | |||||||
|
Long-term debt
|
1,228 | 1,228 | |||||||
|
Deferred rent
|
6,336 | 6,397 | |||||||
|
Other liabilities
|
4,774 | 5,306 | |||||||
|
Total liabilities
|
43,357 | 45,487 | |||||||
|
Commitments and contingent liabilities (Notes 14 and 16)
|
|||||||||
|
Stockholders’ equity:
|
|||||||||
|
Common Stock, Class A, $.25 par value; authorized 10,000,000 shares;
|
|||||||||
|
3,161,098 shares issued and outstanding as of
|
|||||||||
|
January 1, 2011 and January 2, 2010, excluding
|
|||||||||
|
1,357,200 treasury shares
|
1,129 | 1,129 | |||||||
|
Capital surplus
|
5,378 | 5,378 | |||||||
|
Unrealized loss on investments, net of tax
|
(11 | ) | (4 | ) | |||||
|
Retained earnings
|
81,784 | 66,860 | |||||||
| 88,280 | 73,363 | ||||||||
|
Treasury stock, 1,357,200 shares at cost
|
(3,753 | ) | (3,753 | ) | |||||
|
Total stockholders’ equity
|
84,527 | 69,610 | |||||||
|
Total liabilities and stockholders’ equity
|
$ | 127,884 | $ | 115,097 | |||||
|
The accompanying notes are an integral part of these consolidated financial statements.
|
|||||||||
32
ARDEN GROUP, INC. AND CONSOLIDATED SUBSIDIARIES
_______________________________________________________
CONSOLIDATED STATEMENTS OF OPERATIONS
AND COMPREHENSIVE INCOME
(In Thousands, Except Share and Per Share Data)
| Fifty-Two | Fifty-Two | Fifty-Three | |||||||||||
| Weeks Ended | Weeks Ended | Weeks Ended | |||||||||||
| January 1, 2011 | January 2, 2010 | January 3, 2009 | |||||||||||
|
Sales
|
$ | 417,065 | $ | 431,170 | $ | 479,117 | |||||||
|
Cost of sales
|
257,506 | 264,931 | 294,617 | ||||||||||
|
Gross profit
|
159,559 | 166,239 | 184,500 | ||||||||||
|
Selling, general and administrative expense
|
129,416 | 130,203 | 144,181 | ||||||||||
|
Operating income
|
30,143 | 36,036 | 40,319 | ||||||||||
|
Interest and dividend income
|
1,298 | 756 | 2,460 | ||||||||||
|
Other income (expense), net
|
(66 | ) | 0 | (907 | ) | ||||||||
|
Interest expense
|
(1,044 | ) | (503 | ) | (365 | ) | |||||||
|
Income before income taxes
|
30,331 | 36,289 | 41,507 | ||||||||||
|
Income tax provision
|
12,246 | 14,665 | 16,840 | ||||||||||
|
Net income
|
$ | 18,085 | $ | 21,624 | $ | 24,667 | |||||||
|
Other comprehensive gain (loss), net of tax:
|
|||||||||||||
|
Unrealized gain (loss) from available-for-sale securities:
|
|||||||||||||
|
Net unrealized holding loss arising during the period
|
(45 | ) | (13 | ) | (428 | ) | |||||||
|
Reclassification adjustment for realized loss included
|
|||||||||||||
|
in net income
|
38 | 0 | 616 | ||||||||||
|
Net unrealized gain (loss), net of income tax expense (benefit)
|
|||||||||||||
|
of ($4) for 2010, ($9) for 2009 and $129 for 2008
|
(7 | ) | (13 | ) | 188 | ||||||||
|
Comprehensive income
|
$ | 18,078 | $ | 21,611 | $ | 24,855 | |||||||
|
Net income per common share:
|
|||||||||||||
|
Basic and diluted
|
$ | 5.72 | $ | 6.84 | $ | 7.80 | |||||||
|
Weighted average common shares outstanding:
|
|||||||||||||
|
Basic and diluted
|
3,161,098 | 3,161,098 | 3,161,098 | ||||||||||
|
The accompanying notes are an integral part of these consolidated financial statements.
|
|||||||||||||
33
ARDEN GROUP, INC. AND CONSOLIDATED SUBSIDIARIES
_________________________________________________________
CONSOLIDATED STATEMENTS OF STOCKHOLDERS’ EQUITY
| Unrealized | ||||||||||||||||||||||||||||||||
|
Common Stock
|
Gain (Loss)
|
Total
|
||||||||||||||||||||||||||||||
|
Class A
|
Capital
|
on
|
Retained
|
Treasury Stock
|
Stockholders’
|
|||||||||||||||||||||||||||
|
(In Thousands, Except Share Data)
|
Shares
|
Amount
|
Surplus
|
Investments
|
Earnings
|
Shares
|
Amount
|
Equity
|
||||||||||||||||||||||||
|
Balance, December 29, 2007
|
4,518,298 | $ | 1,129 | $ | 5,378 | $ | (179 | ) | $ | 105,918 | 1,357,200 | $ | (3,753 | ) | $ | 108,493 | ||||||||||||||||
|
Net unrealized gain
|
0 | 0 | 0 | 188 | 0 | 0 | 0 | 188 | ||||||||||||||||||||||||
|
Dividends declared
|
0 | 0 | 0 | 0 | (82,188 | ) | 0 | 0 | (82,188 | ) | ||||||||||||||||||||||
|
Net income
|
0 | 0 | 0 | 0 | 24,667 | 0 | 0 | 24,667 | ||||||||||||||||||||||||
|
Balance, January 3, 2009
|
4,518,298 | 1,129 | 5,378 | 9 | 48,397 | 1,357,200 | (3,753 | ) | 51,160 | |||||||||||||||||||||||
|
Net unrealized loss
|
0 | 0 | 0 | (13 | ) | 0 | 0 | 0 | (13 | ) | ||||||||||||||||||||||
|
Dividends declared
|
0 | 0 | 0 | 0 | (3,161 | ) | 0 | 0 | (3,161 | ) | ||||||||||||||||||||||
|
Net income
|
0 | 0 | 0 | 0 | 21,624 | 0 | 0 | 21,624 | ||||||||||||||||||||||||
|
Balance, January 2, 2010
|
4,518,298 | 1,129 | 5,378 | (4 | ) | 66,860 | 1,357,200 | (3,753 | ) | 69,610 | ||||||||||||||||||||||
|
Net unrealized loss
|
0 | 0 | 0 | (7 | ) | 0 | 0 | 0 | (7 | ) | ||||||||||||||||||||||
|
Dividends declared
|
0 | 0 | 0 | 0 | (3,161 | ) | 0 | 0 | (3,161 | ) | ||||||||||||||||||||||
|
Net income
|
0 | 0 | 0 | 0 | 18,085 | 0 | 0 | 18,085 | ||||||||||||||||||||||||
|
Balance, January 1, 2011
|
4,518,298 | $ | 1,129 | $ | 5,378 | $ | (11 | ) | $ | 81,784 | 1,357,200 | $ | (3,753 | ) | $ | 84,527 | ||||||||||||||||
The accompanying notes are an integral part of these consolidated financial statements.
34
ARDEN GROUP, INC. AND CONSOLIDATED SUBSIDIARIES
_______________________________________________________
CONSOLIDATED STATEMENTS OF CASH FLOWS
(In Thousands)
| Fifty-Two | Fifty-Two | Fifty-Three | |||||||||||
| Weeks Ended |
Weeks Ended
|
Weeks Ended | |||||||||||
|
January 1, 2011
|
January 2, 2010 | January 3, 2009 | |||||||||||
|
Cash flows from operating activities:
|
|||||||||||||
|
Cash received from customers
|
$ | 417,580 | $ | 431,108 | $ | 479,578 | |||||||
|
Cash paid to suppliers and employees
|
(384,624 | ) | (391,957 | ) | (437,970 | ) | |||||||
|
Interest and dividends received
|
1,580 | 565 | 2,513 | ||||||||||
|
Interest paid
|
(94 | ) | (87 | ) | (109 | ) | |||||||
|
Income taxes paid
|
(11,354 | ) | (13,895 | ) | (15,545 | ) | |||||||
|
Net cash provided by operating activities
|
23,088 | 25,734 | 28,467 | ||||||||||
|
Cash flows from investing activities:
|
|||||||||||||
|
Capital expenditures
|
(2,597 | ) | (2,890 | ) | (5,159 | ) | |||||||
|
Purchases of investments
|
(29,861 | ) | (30,164 | ) | (25,130 | ) | |||||||
|
Sales of investments
|
51,926 | 13,127 | 35,556 | ||||||||||
|
Proceeds from the sale of property, plant and
|
|||||||||||||
|
equipment
|
16 | 48 | 21 | ||||||||||
|
Net cash provided by (used in) investing activities
|
19,484 | (19,879 | ) | 5,288 | |||||||||
|
Cash flows from financing activities:
|
|||||||||||||
|
Cash dividends paid
|
(3,161 | ) | (3,161 | ) | (82,188 | ) | |||||||
|
Net cash used in financing activities
|
(3,161 | ) | (3,161 | ) | (82,188 | ) | |||||||
|
Net increase (decrease) in cash and cash equivalents
|
39,411 | 2,694 | (48,433 | ) | |||||||||
|
Cash and cash equivalents at beginning of year
|
13,180 | 10,486 | 58,919 | ||||||||||
|
Cash and cash equivalents at end of year
|
$ | 52,591 | $ | 13,180 | $ | 10,486 | |||||||
The accompanying notes are an integral part of these consolidated financial statements.
35
CONSOLIDATED STATEMENTS OF CASH FLOWS, Continued
| Fifty-Two | Fifty-Two | Fifty-Three | |||||||||||
| Weeks Ended | Weeks Ended | Weeks Ended | |||||||||||
| January 1, 2011 | January 2, 2010 | January 3, 2009 | |||||||||||
|
Reconciliation of Net Income to Net Cash Provided
|
|||||||||||||
|
by Operating Activities:
|
|||||||||||||
|
Net income
|
$ | 18,085 | $ | 21,624 | $ | 24,667 | |||||||
|
Adjustments to reconcile net income to net cash
|
|||||||||||||
|
provided by operating activities:
|
|||||||||||||
|
Depreciation and amortization
|
5,307 | 5,599 | 6,110 | ||||||||||
|
Provision for losses on accounts receivable
|
44 | 94 | 169 | ||||||||||
|
Deferred income taxes
|
1,129 | 108 | 1,923 | ||||||||||
|
Net loss from the disposal of property,
|
|||||||||||||
|
plant and equipment
|
8 | 54 | 89 | ||||||||||
|
Realized loss on investments, net
|
66 | 0 | 907 | ||||||||||
|
Amortization of premium on investments
|
960 | 472 | 259 | ||||||||||
|
Stock appreciation rights compensation expense (income)
|
(394 | ) | (273 | ) | 1,823 | ||||||||
|
Changes in assets and liabilities net of effects from
|
|||||||||||||
|
noncash investing and financing activities:
|
|||||||||||||
|
(Increase) decrease in assets:
|
|||||||||||||
|
Accounts and notes receivable
|
799 | (246 | ) | 527 | |||||||||
|
Inventories
|
(1,302 | ) | 972 | 3,712 | |||||||||
|
Other current assets
|
95 | 204 | (281 | ) | |||||||||
|
Other assets
|
27 | 16 | (69 | ) | |||||||||
|
Increase (decrease) in liabilities:
|
|||||||||||||
|
Accounts payable, trade and other current
|
|||||||||||||
|
liabilities
|
(1,090 | ) | (2,402 | ) | (9,148 | ) | |||||||
|
Federal and state income taxes payable
|
(237 | ) | 668 | (608 | ) | ||||||||
|
Deferred rent
|
(61 | ) | 99 | 154 | |||||||||
|
Other liabilities
|
(348 | ) | (1,255 | ) | (1,767 | ) | |||||||
|
Net cash provided by operating activities
|
$ | 23,088 | $ | 25,734 | $ | 28,467 | |||||||
The accompanying notes are an integral part of these consolidated financial statements.
36
ARDEN GROUP, INC. AND CONSOLIDATED SUBSIDIARIES
_______________________________________________________
NOTES TO CONSOLIDATED FINANCIAL STATEMENTS
1. Summary of Significant Accounting Policies
Basis of Presentation and Business Description
The consolidated financial statements of Arden Group, Inc. (Company or Arden) include the accounts of the Company and its direct and indirect subsidiaries. Arden is a holding company which conducts operations through its wholly-owned subsidiary, Arden-Mayfair, Inc. (Arden-Mayfair) and Arden-Mayfair’s wholly-owned subsidiary, Gelson’s Markets (Gelson’s) which operates eighteen supermarkets in Southern California. The Company and Arden-Mayfair also own certain real estate properties through a wholly-owned subsidiary, Mayfair Realty, Inc. All intercompany accounts and transactions are eliminated in consolidation.
Fiscal Year
The Company operates on a fiscal year ending on the Saturday closest to December 31. Fiscal years for the consolidated financial statements included herein ended on January 1, 2011 (fiscal 2010 - 52 weeks), January 2, 2010 (fiscal 2009 - 52 weeks) and January 3, 2009 (fiscal 2008 - 53 weeks).
The following is a summary of significant accounting policies followed in the preparation of these consolidated financial statements.
Cash and Cash Equivalents
The Consolidated Statements of Cash Flows classify changes in cash and cash equivalents (short-term, highly liquid investments readily convertible into cash) according to operating, investing or financing activities. The Company places its temporary cash investments with what it believes to be high credit, quality financial institutions.
Investments
The Company invests in marketable securities including mutual funds, U.S. treasury notes and debt securities. Marketable securities are stated at market value as determined by the most recently traded price of each security at the balance sheet date. The Company reviews its investment portfolio on a quarterly basis to determine if market declines below book value may be other-than-temporary. Any decline that is determined to be other-than-temporary is recorded as a loss on the Consolidated Statements of Operations and Comprehensive Income in accordance with authoritative guidance.
Management determines the appropriate classification of its investments in marketable securities at the time of purchase and reevaluates such determination at each balance sheet date. Debt securities that the Company does not intend to hold to maturity and equity securities are classified as available-for-sale. As of January 1, 2011, all marketable securities were classified as available-for-sale. Investments are carried at fair value, with the unrealized gains and losses, net of tax, reported as a separate component of stockholders’ equity. The cost of investments sold is determined based on the Specific Identification method.
37
Accounts Receivable
The Company monitors vendor receivables and extensions of credit on an ongoing basis and has not experienced significant losses related to its receivables. At January 1, 2011, the Company believes that it did not have significant credit risk concentrations. No customer or vendor represented greater than 3% of total accounts receivable.
Inventories
Supermarket nonperishable inventories are recorded using the retail method and are stated at the lower of cost or market, with cost determined using the last-in, first-out (LIFO) method. Perishable inventories are valued at the lower of cost on a first-in, first-out (FIFO) basis or market.
Inventory reserves are maintained for dry goods at historical run rates that are adjusted annually and trued up at each physical count (three times per year) to ensure adequacy of the reserve. Inventories of perishable items are taken at the end of every month and balances are adjusted accordingly with the offset recorded in cost of sales.
Property, Plant and Equipment
Property, plant and equipment is recorded at cost. Depreciation is provided on the straight-line method over the estimated useful lives of individual assets or classes of assets as follows:
| Buildings and improvements | 5 to | 20 years |
| Store fixtures and office equipment | 3 to | 8 years |
| Transportation equipment | 3 to | 5 years |
| Machinery and equipment | 3 to | 8 years |
Leasehold interests and improvements to leased properties are amortized over their estimated useful lives or lease period, whichever is shorter.
Leased property meeting certain capital lease criteria is capitalized and the present value of the related lease payments is recorded as a liability. Amortization of capitalized leased assets is computed on the straight-line method over the shorter of the estimated useful life or the initial lease term. There were no capitalized leases at January 1, 2011 and January 2, 2010.
Normal repairs and maintenance are expensed as incurred. Expenditures which materially increase values, change capacities or extend useful lives are capitalized. Replacements are capitalized and the property, plant and equipment accounts are relieved of the items being replaced. The related costs and accumulated depreciation of disposed assets are eliminated and any gain or loss on disposition is included in selling, general and administrative (SG&A) expense on the Consolidated Statements of Operations and Comprehensive Income.
38
Impairment of Long-Lived Assets
The Company monitors the carrying value of long-lived assets for potential impairment whenever events or changes in circumstances indicate the carrying value of an asset may not be recoverable. Impairment is recognized when estimated future cash flows (undiscounted and before interest charges) are less than carrying value. The estimation of expected future net cash flows is inherently uncertain and relies on assumptions regarding current and future economic and market conditions and the availability of capital. If impairment analysis assumptions change, then an adjustment to the carrying value of the Company’s long-lived assets could occur. To the extent that an asset is impaired, the excess of the carrying amount of the asset over its estimated fair value is charged against earnings. No impairments were recorded in 2010, 2009 or 2008.
Workers’ Compensation and General and Auto Liability Costs
The Company is primarily self-insured through the use of a high deductible policy for losses related to workers’ compensation for claims incurred prior to July 1, 2006, as well as all general and auto liability claims. The Company maintains stop-loss coverage to limit its loss exposure on a per claim basis and is insured for covered costs in excess of per claim limits. Since July 1, 2006, the Company has purchased fully insured guaranteed cost workers’ compensation insurance to replace the high deductible program. The Company continues to maintain an accrual for workers’ compensation claims incurred prior to July 2006 under the high deductible program which is based on undeveloped reported claims and an estimate of claims incurred but not reported. The Company’s workers’ compensation and general and auto liability reserves for unpaid and incurred but not reported claims at January 1, 2011 and January 2, 2010 were approximately $3,572,000 and $4,577,000, respectively. While the ultimate amount of claims incurred are dependent on future developments, the recorded reserves reflect management’s best estimate of claims to be incurred.
Revenue Recognition
The Company recognizes revenue at the time of sale. Discounts given to customers are recorded at the point of sale as a reduction of revenues. The Company maintains a bad debt allowance for receivables from vendors and Gelson’s charge card users. Valuation reserves are adjusted periodically based on historical recovery rates. The Company records income from licensing arrangements, subleases, leases and finance charges as they are earned. Income from all licensing arrangements, rental income and finance charges represents approximately 1% of sales for all periods presented and, therefore, is not disclosed separately on the Consolidated Statements of Operations and Comprehensive Income.
Gelson’s sells gift cards (and previously gift certificates) to its customers in its retail stores. The gift cards and certificates do not have an expiration date and Gelson’s does not charge an administrative fee on unused gift cards. The Company records unredeemed gift cards and certificates under Accounts Payable, Trade on its Consolidated Balance Sheets. In the past, the Company has recognized revenue from gift cards and certificates only when they were redeemed by its customers. Beginning in the first quarter of 2009, the Company began recording revenue when the likelihood of the gift cards and certificates being redeemed is remote and there is no legal obligation to remit the unredeemed gift cards and certificates to relevant jurisdictions (gift card breakage). Based on an analysis of historical redemption patterns, the Company determined the appropriate gift card breakage rate is three years. During 2010 and 2009, the Company recorded $43,000 and $490,000 of revenue related to gift card breakage, respectively. Of the amount recorded in 2009, $432,000 was related to prior years and was recorded in the first quarter. Gift card breakage is included in Sales on the Consolidated Statements of Operations and Comprehensive Income.
39
Cost of Sales
Cost of sales includes product costs, net of discounts and allowances, and inbound freight charges, as well as warehouse, transportation, purchasing, advertising and occupancy costs. Warehouse and transportation costs include receiving costs, internal transfer costs, labor, building rent, utilities, depreciation, repairs and maintenance and fuel for the Company’s distribution center and distribution system. Purchasing costs include both labor and administrative expense associated with the purchase of the Company’s products. Advertising costs, net of vendor reimbursements, are expensed as incurred and include the cost of the Gelson’s newsletter, newspaper ads and other print advertising. Occupancy costs consist of rent, common area charges (where applicable), depreciation and utilities related to Gelson’s operations. The following table summarizes warehouse, transportation, purchasing, net advertising and occupancy costs for 2010, 2009 and 2008.
|
(In Thousands)
|
2010
|
2009
|
2008
|
|||||||||
|
Warehouse and transportation
|
$ | 7,092 | $ | 7,014 | $ | 7,046 | ||||||
|
Purchasing
|
2,728 | 2,814 | 3,008 | |||||||||
|
Advertising
|
1,876 | 1,335 | 1,049 | |||||||||
|
Occupancy
|
22,232 | 22,930 | 23,624 | |||||||||
| $ | 33,928 | $ | 34,093 | $ | 34,727 | |||||||
Fair Value Measurements
Fair value is defined as the amount that would be received upon sale of an asset or paid to transfer a liability in the principal or most advantageous market for the asset or liability in an orderly transaction between market participants on the measurement date. The authoritative guidance establishes a fair value hierarchy which prioritizes the types of inputs to valuation techniques that companies may use to measure fair value. The fair value hierarchy gives the highest priority to quoted prices in active markets for identical assets or liabilities (Level 1). The next highest priority is given to inputs other than quoted prices included in Level 1 that are observable for the asset or liability, either directly or indirectly (Level 2). The lowest priority is given to unobservable inputs in which there is little or no market data available and which require the reporting entity to develop its own assumptions (Level 3). The fair value of the Company’s financial assets and liabilities measured on a recurring basis includes investments which appear under Assets on the Consolidated Balance Sheets. See Note 2 for a disaggregation of the Company’s investments including the input level used to determine fair value for each type of investment.
The carrying values of cash and cash equivalents, accounts receivable, accounts payable and accrued liabilities approximate fair value because of the short-term maturity of these instruments. The fair value of the Company’s long-term debt closely approximates its carrying value. The Company estimates the fair value of long-term debt based upon the net present value of the future cash flows using those interest rates that are currently available to the Company for the issuance of debt with similar terms and remaining maturities.
40
Vendor Allowances
The Company receives a variety of allowances from its vendors whose products are sold in Gelson’s stores. Typically, the vendors are paying the Company to promote their products. The promotion may be a temporary price reduction, a feature in a print advertisement or newsletter, placement of the vendor’s product in a preferred location in a store or introduction of a new product. The promotions range from approximately two weeks to six months and are recognized as a reduction of cost of sales as they are earned.
Occasionally, the Company receives rebate allowances in the form of upfront lump-sum payments from vendors. Under the terms of these long-term agreements (which typically extend for several months or years), the Company earns the rebates as it purchases product from the vendor. The upfront payments are recorded as a liability when they are received and are recorded as a reduction of inventory cost as the product is purchased. In the event the Company does not purchase the minimum amount of product specified in the agreement, the upfront payments must be returned on a pro rata basis to the vendor. If the contract does not specify that the rebate is earned as product is purchased, then the upfront payments are recorded as a liability when received and recognized as a reduction of cost of sales on a pro rata basis as the product is sold.
Stock Appreciation Rights
The Company has outstanding stock appreciation rights (SARs) that have been granted to non-employee directors and certain employees. Each SAR entitles the holder to receive cash upon exercise equal to the excess of the fair market value of a share of the Company’s Class A Common Stock (Class A), as determined in accordance with the SARs agreement, on the date of exercise over the fair market value of such share on the date granted. SARs granted prior to December 2007 vest 25% each year beginning at the end of the first year and expire five years from the date of grant. SARs granted in December 2007 or later vest 25% each year beginning at the end of the third year and expire seven years from the date of grant.
The fair value of each SAR is estimated at the end of each reporting period using the Black-Scholes option-pricing model. The Black-Scholes option-pricing model incorporates various highly subjective assumptions, including expected term, expected volatility, expected dividend yield and a risk-free interest rate. The Company has reviewed its historical pattern of SARs exercises and has determined that meaningful differences in SARs exercise activity exist between employees and non-employee directors. Consequently, the Company has categorized SARs into two groups for valuation purposes, as well as separate groups based on grant date. Expected volatility was determined based on historical volatility using weekly data. The risk-free interest rate is based on U.S. Treasury zero-coupon issues with a remaining term equal to the expected SARs life assumed at the date of grant less the time that has elapsed since the grant date. The expected term was calculated based on historical experience. Authoritative guidance also requires that a forfeiture assumption be applied to awards that are classified as liabilities such as SARs. However, cash-settled SARs are remeasured at fair value at the end of each reporting period and, therefore, the impact of actual forfeitures will be reflected at each remeasurement date.
The assumptions used in the Black-Scholes option-pricing model as of January 1, 2011:
| Dividend yield | 1.128% - | 1.188% | |
| Expected volatility | 38.803% - | 42.187% | |
| Risk-free interest rate | .807% - | 2.135% | |
| Expected average term | 3.52 - | 5.45 years |
See Note 10 for further information related to SARs.
41
Rental Expense and Income
Rental payments on operating leases are recorded over the lease term as they become payable or receivable except for rental payments on leases with scheduled rent increases which are recognized on a straight-line basis over the term of the lease.
Income Taxes
Deferred tax assets and liabilities are determined based on the difference between the financial statement and tax bases of assets and liabilities, using enacted tax rates in effect for the year in which the differences are expected to reverse. The realization of deferred tax assets is contingent upon the Company’s ability to generate future taxable income. See Note 13 for further information.
Common Stock and Net Income Per Share
Basic net income per common share is computed by dividing net income by the weighted average number of common shares outstanding during the period. Diluted net income per common share is determined by dividing net income by the weighted average number of common and potential common shares outstanding during the period. There were no potential common shares outstanding during the periods presented and, therefore, basic and diluted net income per common share are the same.
Use of Estimates
The preparation of financial statements in conformity with accounting principles generally accepted in the United States (GAAP) requires management to make estimates and assumptions for the reporting period and as of the financial statement date. These estimates and assumptions affect the reported amounts of assets and liabilities, the disclosure of contingent liabilities and the reported amounts of revenues and expenses. Actual results could differ from these estimates.
Impact of Recently Issued Accounting Standards
In January 2010, the Financial Accounting Standards Board (FASB) issued authoritative guidance that requires entities to make new disclosures about recurring or nonrecurring fair value measurements of assets and liabilities, including 1) the amounts of significant transfers of assets and liabilities between Level 1 and Level 2 fair value measurements and the reasons for the transfers, 2) the reasons for any transfers in or out of Level 3, and 3) information on purchases, sales, issuances and settlements on a gross basis in the reconciliation of recurring Level 3 fair value measurements. The FASB also clarified existing fair value measurement disclosure guidance about the level of disaggregation of assets and liabilities, and information about the valuation techniques and inputs used in estimating Level 2 and Level 3 fair value measurements. Except for certain detailed Level 3 disclosures, which are effective for fiscal years beginning after December 15, 2010 and interim periods within those years, the new guidance became effective for the Company’s first quarter of 2010. The Company did not have transfers of assets or liabilities in or out of Level 1 fair value measurements and does not have assets or liabilities requiring Level 3 fair value measurements. The adoption of this guidance did not have an impact on the Company’s consolidated financial statements.
42
|
2.
|
Investments
|
Marketable securities are shown on the accompanying Consolidated Balance Sheets at their fair value.
| (In Thousands) | Cost |
Unrealized
Gain (Loss)
|
Fair Value | |||||||||
|
As of January 1, 2011:
|
||||||||||||
|
Debt Securities:
|
||||||||||||
|
Corporate
|
$ | 2,013 | $ | (15 | ) | $ | 1,998 | |||||
|
Mutual Funds
|
103 | (2 | ) | 101 | ||||||||
|
Total
|
$ | 2,116 | $ | (17 | ) | $ | 2,099 | |||||
|
As of January 2, 2010:
|
||||||||||||
|
Debt Securities:
|
||||||||||||
|
Government sponsored
|
$ | 5,010 | $ | 1 | $ | 5,011 | ||||||
|
State government
|
3,895 | (3 | ) | 3,892 | ||||||||
|
Corporate
|
12,288 | (9 | ) | 12,279 | ||||||||
|
Mutual Funds
|
4,016 | 3 | 4,019 | |||||||||
|
Total
|
$ | 25,209 | $ | (8 | ) | $ | 25,201 | |||||
All of the investments listed in the table above were valued using Level 1 inputs as discussed in Note 1. Realized net losses from the sale of investments were $66,000, $0 and $907,000 in 2010, 2009 and 2008, respectively. Realized net gain or loss from the sale of investments is included in other income (expense), net on the Consolidated Statements of Operations and Comprehensive Income.
|
3.
|
Accounts Receivable, Net
|
|
January 1,
|
January 2,
|
|||||||
| (In Thousands) |
2011
|
2010
|
||||||
|
Accounts receivable, trade
|
$ | 2,369 | $ | 2,559 | ||||
|
Other accounts receivable
|
2,412 | 3,164 | ||||||
| 4,781 | 5,723 | |||||||
| Less: Allowance for doubtful accounts | (201 | ) | (300 | ) | ||||
| $ | 4,580 | $ | 5,423 | |||||
43
The provision for doubtful accounts in 2010, 2009 and 2008 was approximately $44,000, $94,000 and $169,000, respectively.
|
4.
|
Inventories
|
Inventories valued by the LIFO method totaled $15,874,000 at January 1, 2011 and $14,214,000 at January 2, 2010. Inventory balances would have been $6,446,000 and $6,433,000 higher at the end of 2010 and 2009, respectively, if they had been stated at the lower of FIFO cost or market.
|
5.
|
Significant Supplier
|
During 2010, the Company procured approximately 15% of its product through Unified Grocers, Inc. (Unified), a grocery wholesale cooperative. As a member-patron, the Company is required to provide Unified with certain minimum deposits in order to purchase product from the cooperative. As of January 1, 2011, the Company had approximately $1,628,000 on deposit with Unified in addition to approximately $694,000 related to ownership of equity shares in Unified. There is no established public trading market for Unified’s shares. The deposit and equity ownership are recorded under other assets on the Consolidated Balance Sheets.
Unified pays dividends annually in December of each year. Dividends are paid in arrears and are based on a percentage of the Company’s qualifying purchases from Unified, which percentage is typically established by Unified at or after the end of each year. The Company accrues patronage dividend income as a reduction of cost of sales ratably throughout the year based on a review of prior dividend history, projected purchase volume and an estimate of Unified’s current year patronage earnings. The accrual is adjusted each year, as needed, based on the actual amount received from Unified in December.
44
|
6.
|
Property, Plant and Equipment
|
|
January 1,
|
January 2,
|
|||||||
|
(In Thousands)
|
2011
|
2010
|
||||||
|
Land
|
$ | 8,633 | $ | 8,633 | ||||
|
Buildings and improvements
|
9,836 | 9,836 | ||||||
|
Store fixtures and office equipment
|
47,838 | 47,193 | ||||||
|
Transportation equipment
|
3,977 | 4,060 | ||||||
|
Machinery and equipment
|
2,033 | 1,982 | ||||||
|
Leasehold improvements
|
50,812 | 50,376 | ||||||
|
Leasehold interests
|
4,538 | 4,538 | ||||||
|
Assets under construction
|
1,074 | 332 | ||||||
| 128,741 | 126,950 | |||||||
|
Accumulated depreciation and amortization
|
(90,494 | ) | (85,969 | ) | ||||
| $ | 38,247 | $ | 40,981 | |||||
Depreciation and amortization expense was $5,307,000, $5,599,000 and $6,110,000 in 2010, 2009 and 2008, respectively.
|
7.
|
Other Current Liabilities
|
|
January 1,
|
January 2,
|
|||||||
|
(In Thousands)
|
2011
|
2010
|
||||||
|
Employee compensated absences
|
$ | 5,144 | $ | 5,280 | ||||
|
Taxes (excluding income taxes)
|
2,886 | 3,008 | ||||||
|
Employee benefits
|
2,146 | 1,838 | ||||||
|
Payroll
|
1,867 | 2,326 | ||||||
|
Workers’ compensation
|
782 | 1,707 | ||||||
|
Other
|
4,778 | 5,168 | ||||||
| $ | 17,603 | $ | 19,327 | |||||
|
8.
|
Long-Term Debt
|
|
Current
|
Non-Current
|
|||||||||||||||
|
January 1,
|
January 2,
|
January 1,
|
January 2,
|
|||||||||||||
|
(In Thousands)
|
2011
|
2010
|
2011
|
2010
|
||||||||||||
|
7% Subordinated Income
|
||||||||||||||||
|
Debentures due
|
||||||||||||||||
|
September 1, 2014
|
$ | 0 | $ | 0 | $ | 1,228 | $ | 1,228 | ||||||||
The Company had revolving lines of credit in the amount of $20,000,000 and $3,000,000 which were scheduled to expire in August 2012 and November 2011, respectively. In January 2011, the Company voluntarily terminated its existing lines of credit and established a new letter of credit facility totaling $10,000,000 with a different bank. The Company is currently in discussions for additional borrowing facilities with the new bank. At the end of 2010 and 2009, there were no amounts borrowed against either of the old revolving lines of credit. The Company currently maintains four standby letters of credit aggregating $8,319,000 in connection with lease and self-insurance requirements. In connection with the cancellation of one of the previous lines of credit, these letters of credit were cancelled and reestablished with the new bank for the same dollar amounts. Under the new facility, these letters of credit are secured by a compensating balance arrangement which the Company expects to eliminate with the new facility that is currently being discussed.
Debentures: The indenture relating to the 7% Subordinated Income Debentures (7% Debentures), due September 1, 2014, provides for interest payable semi-annually on March 1 and September 1 to the extent that current annual net income is sufficient therefor, or at the discretion of the Company, out of available retained earnings. All interest due and payable as of January 1, 2011 was paid. The 7% Debentures are recorded at face value which approximates its fair value.
45
|
9.
|
Capital Stock
|
The Company is authorized to issue 10,000,000 shares of Class A, par value $.25 per share. At January 1, 2011 and January 2, 2010, the number of shares issued were 4,518,298, including 1,357,200 treasury shares. The Company has a stock repurchase program, authorized by the Board of Directors, to purchase from time to time up to 222,904 shares of its Class A in the open market or in private transactions. The timing, volume and price of purchases are at the discretion of the management of the Company. No stock was repurchased under this program in 2010, 2009 or 2008.
During 2010, 2009 and 2008, the Company paid regular quarterly dividends of 25 cents per share of Class A for a total of approximately $3,161,000 in each year. In addition, on December 8, 2008, the Company paid a special cash dividend of twenty-five dollars ($25) per share on its outstanding Class A totaling approximately $79,027,000 to stockholders of record at the close of business on November 20, 2008. On January 20, 2011, the Company paid a regular quarterly cash dividend of 25 cents per share of Class A, aggregating approximately $790,000, to stockholders of record on December 31, 2010.
|
10.
|
Stock Appreciation Rights
|
The Company has granted SARs covering shares of the Company’s Class A to non-employee directors and certain employees of the Company and its subsidiaries. Each SAR entitles the holder to receive upon exercise thereof the excess of the fair market value of a share of Class A, as determined in accordance with the SARs agreement, on the date of exercise over the fair market value of such share on the date granted. SARs granted prior to December 2007 vest 25% each year beginning at the end of the first year and expire five years from the date of grant. SARs granted in December 2007 or later vest 25% each year beginning at the end of the third year and expire seven years from the date of grant. SARs transactions during the past three years are summarized below.
46
|
SARs
|
||||||||||||||||
|
Officers and
|
Non-Employee
|
|||||||||||||||
|
Employees
|
Directors
|
|||||||||||||||
|
Weighted
|
Weighted
|
|||||||||||||||
|
SARs
|
Average Price
|
SARs
|
Average Price
|
|||||||||||||
|
Outstanding as of 12/29/07
|
89,225 | $ | 128.75 | 57,500 | $ | 122.69 | ||||||||||
|
Exercised
|
17,100 | $ | 58.40 | 15,000 | $ | 68.09 | ||||||||||
|
Outstanding as of 1/3/09
|
72,125 | $ | 145.42 | 42,500 | $ | 141.96 | ||||||||||
|
Granted
|
3,500 | $ | 94.98 | 0 | $ | 0.00 | ||||||||||
|
Exercised
|
500 | $ | 57.00 | 0 | $ | 0.00 | ||||||||||
|
Forfeited
|
7,000 | $ | 146.44 | 0 | $ | 0.00 | ||||||||||
|
Outstanding as of 1/2/10
|
68,125 | $ | 143.38 | 42,500 | $ | 141.96 | ||||||||||
|
Granted
|
67,500 | $ | 107.38 | 42,500 | $ | 110.00 | ||||||||||
|
Exchanged
|
56,500 | $ | 146.44 | 42,500 | $ | 141.96 | ||||||||||
|
Forfeited
|
1,000 | $ | 110.00 | 0 | $ | 0.00 | ||||||||||
|
Outstanding as of 1/1/11
|
78,125 | $ | 110.48 | 42,500 | $ | 110.00 | ||||||||||
|
Exercisable as of 1/1/11
|
2,500 | 0 | ||||||||||||||
The following table summarizes information about the Company’s SARs outstanding at January 1, 2011:
|
SARs Outstanding
|
SARs Exercisable
|
||||||||||||||||||
| Weighted | |||||||||||||||||||
|
|
Average
|
Weighted
|
Weighted
|
||||||||||||||||
|
Remaining
|
Average
|
Average
|
|||||||||||||||||
|
|
Number
|
Contractual
|
Exercise
|
Number
|
Exercise
|
||||||||||||||
| Exercise Price |
Outstanding
|
Life
|
Price
|
Exercisable
|
Price
|
||||||||||||||
| SARs - Officers & Employees | |||||||||||||||||||
| $ |
121.03
|
1,125 |
1.2 years
|
$ | 121.03 | 750 | $ | 121.03 | |||||||||||
| $ |
146.44
|
7,000 |
3.9 years
|
$ | 146.44 | 1,750 | $ | 146.44 | |||||||||||
| $ |
94.98
|
3,500 |
5.9 years
|
$ | 94.98 | 0 | |||||||||||||
| $ |
110.00
|
56,500 |
6.0 years
|
$ | 110.00 | 0 | |||||||||||||
| $ |
95.22
|
7,500 |
6.6 years
|
$ | 95.22 | 0 | |||||||||||||
| $ |
83.50
|
2,500 |
6.7 years
|
$ | 83.50 | 0 | |||||||||||||
| 78,125 |
5.9 years
|
$ | 110.48 | 2,500 | $ | 138.82 | |||||||||||||
|
SARs - Non-Employee Directors
|
|||||||||||||||||||
| $ | 110.00 | 42,500 | 6.0 years | $ | 110.00 | 0 | |||||||||||||
47
SARs compensation expense is included in SG&A expense on the Consolidated Statements of Operations and Comprehensive Income. Authoritative guidance requires the Company to remeasure the fair value of SARs each reporting period until the award is settled. Compensation expense must be recognized or reversed each reporting period for changes in fair value and vesting. During 2010, the Company reversed $394,000 of SARs compensation expense recognized in prior periods due to the exchange of shares as discussed below and a decrease in the fair value of SARs during the year partially offset by additional vesting. The Company reversed $273,000 and recognized $1,823,000 of SARs compensation expense in 2009 and 2008, respectively.
In January 2010, all of the twenty-three holders of the Company’s SARs with a grant date on or before December 6, 2007 were offered the opportunity to exchange their then outstanding SARs units for an equal number of new SARs units with a lower grant price of $110 and a new vesting period. Existing grant prices for these units ranged from $121.03 to $146.44. Ordinarily, the grant price is determined based upon the fair market value of a share of the Company’s Class A on the date of grant. On January 4, 2010, when the exchange offer was made to these SARs holders, the Class A closing price was $95.98 per share. For those holders who accepted the Company’s exchange offer, the new SARs were granted effective January 15, 2010 and expire January 15, 2017. The Class A closing price on the January 15, 2010 grant date was $108.71. SAR holders who opted to exchange their SARs also agreed to restart their vesting period. The new SARs vest 25% each year beginning at the end of the third year and expire seven years from the date of grant. Of the 110,625 SARs units outstanding at fiscal 2009 year end, 99,000 SARs units were exchanged. Just prior to the exchange on January 15, 2010, the Company had accrued approximately $817,000 for the exchanged SARs. After the exchange, the accrual of $817,000 was reversed.
As of January 1, 2011, assuming no change in the SARs fair value, there was approximately $1,749,000 of total unrecognized compensation cost related to outstanding SARs which is expected to be recognized over a weighted average period of 4.9 years. The total intrinsic value of SARs exercised during 2010, 2009 and 2008 was approximately $0, $34,000 and $3,443,000, respectively. Intrinsic value represents the amount by which the fair value of SARs exceeds the grant price.
11. Retirement Plans
The Company contributes to multi-employer union pension plans, administered by various trustees, which may be deemed to be defined benefit plans. Contributions to these plans are based upon negotiated labor contracts. Information relating to accumulated benefits and fund assets as they may be allocable to the participants at January 1, 2011, is not available to the Company. The Company records pension expense for these plans as contributions are earned. The Company’s total union pension expense for all plans for 2010, 2009 and 2008 amounted to $4,558,000, $4,730,000 and $5,065,000, respectively.
The Arden Group, Inc. 401(k) Retirement Savings Plan (401(k) Plan) covers all non-union employees of the Company and its subsidiaries who have attained the age of eighteen and have completed the applicable service requirement, as well as retirees and employees who have terminated but remain participants in the 401(k) Plan. On the first of the month following the completion of one month of service, the 401(k) Plan provides that, with certain limitations, a qualifying employee may elect to contribute up to 100% of such employee’s annual compensation to the 401(k) Plan up to a maximum of $16,500 in 2010 on a tax-deferred basis. In addition, employees over the age of 50 may elect to make catch up contributions up to a maximum of $5,500 in 2010. The Company made discretionary contributions to the 401(k) Plan of $302,000, $295,000 and $716,000 for 2010, 2009 and 2008, respectively.
48
Bernard Briskin, Chairman of the Board of Directors, President and Chief Executive Officer of the Company has an employment agreement with the Company dating back to 1988. The employment agreement with Mr. Briskin provides for annual post-employment compensation equal to 25% of his average base salary and bonus earned in the last three fiscal years prior to the cessation of his employment with the Company. The officer is entitled to monthly payments during his lifetime beginning with the termination of his employment for any reason other than his breach of the employment agreement or termination for cause. The Company has accrued its obligation under the terms of the employment agreement. The Company decreased the accrual during 2010, 2009 and 2008 and recognized income of approximately $360,000, $249,000 and $45,000, respectively. The decrease in the accrual is primarily due to a change in estimate based on the refining of the assumptions and underlying data, including the estimated payout term. In addition, the accrual is impacted by the voluntary reductions that Mr. Briskin took in salary and bonus during 2009 and 2010 as discussed in Note 16. This accrual is recorded under other liabilities on the Consolidated Balance Sheets and totaled approximately $1,513,000 as of January 1, 2011.
|
12.
|
Multi-Employer Union Health Care Plans
|
The Company contributes to multi-employer union health care plans, administered by various trustees, in accordance with the provisions of various labor contracts. Contributions to these plans are generally based on the number of straight-time hours worked. The Company’s expense for these plans totaled $11,934,000, $8,815,000 and $9,258,000 for 2010, 2009 and 2008, respectively. The majority of Gelson’s employees are members of the United Food & Commercial Workers International Union (UFCW). The Company contributes to a multi-employer health and welfare trust fund on behalf of its employees who are members of the UFCW. The Company’s health and welfare contribution rate was scheduled to increase effective with hours worked during March 2009 and after; however, the Company was notified by the Southern California United Food & Commercial Workers Unions and the Food Employers Joint Trust Funds (Trust), in the first quarter of 2009, that the increase had been suspended. In March 2010, the Company was notified that the UFCW health and welfare contribution rate would increase effective March 2010 to the maximum allowable rate under the current collective bargaining agreement; and as a result, average weekly health and welfare expense has been running approximately $74,000 higher than it would have if not for the recent increase. The increase in health care costs was partially offset by a reduction in the number of hours eligible for contributions. Except as discussed above, there were no employer withdrawals, shortfall contributions, maintenance of benefit clauses or other material changes that affected the comparability of employer and multi-employer contributions from year to year.
49
|
13.
|
Income Taxes
|
The composition of the federal and state income tax provision (benefit) is as follows:
|
(In Thousands)
|
2010
|
2009
|
2008
|
|||||||||
|
Current:
|
||||||||||||
|
Federal
|
$ | 8,683 | $ | 11,369 | $ | 11,550 | ||||||
|
State
|
2,437 | 3,198 | 3,239 | |||||||||
|
Total current tax provision
|
11,120 | 14,567 | 14,789 | |||||||||
|
Deferred:
|
||||||||||||
|
Federal
|
907 | 115 | 1,652 | |||||||||
|
State
|
219 | (17 | ) | 399 | ||||||||
|
Total deferred tax provision
|
1,126 | 98 | 2,051 | |||||||||
|
Total income tax provision
|
$ | 12,246 | $ | 14,665 | $ | 16,840 | ||||||
The Company’s deferred tax assets (liabilities) were attributable to the following:
|
January 1,
|
January 2,
|
||||||||
|
(In Thousands)
|
2011
|
2010
|
|||||||
|
Deferred tax assets:
|
|||||||||
|
Deferred rent
|
$ | 2,582 | $ | 2,607 | |||||
|
Property, plant and equipment
|
1,670 | 1,415 | |||||||
|
Self-insured reserves
|
1,331 | 1,679 | |||||||
|
Accrued expenses
|
1,322 | 1,819 | |||||||
|
Accrued vacation
|
1,097 | 1,103 | |||||||
|
State income taxes
|
853 | 1,120 | |||||||
|
Other
|
511 | 805 | |||||||
|
Deferred tax assets
|
9,366 | 10,548 | |||||||
|
Deferred tax liabilities:
|
|||||||||
|
Deferred gain on debenture exchange
|
(2,050 | ) | (2,211 | ) | |||||
|
Other
|
(1,226 | ) | (1,122 | ) | |||||
|
Deferred tax liabilities
|
(3,276 | ) | (3,333 | ) | |||||
|
Deferred income taxes, net
|
$ | 6,090 | $ | 7,215 | |||||
Reconciliation of the statutory federal rate and effective rate is as follows:
|
(In Thousands, Except
|
2010
|
2009
|
2008
|
|||||||||||||||||||||
|
Percentage Amounts)
|
Amount
|
Rate |
Amount
|
Rate |
Amount
|
Rate | ||||||||||||||||||
|
Federal tax at statutory rate
|
$ | 10,616 | 35.0 | % | $ | 12,701 | 35.0 | % | $ | 14,527 | 35.0 | % | ||||||||||||
|
State income taxes, net of
|
||||||||||||||||||||||||
|
federal tax benefit
|
1,743 | 5.8 | % | 2,085 | 5.7 | % | 2,385 | 5.8 | % | |||||||||||||||
|
Other
|
(113 | ) | (.4 | %) | (121 | ) | (.3 | %) | (72 | ) | (.2 | %) | ||||||||||||
|
|
$ | 12,246 | 40.4 | % | $ | 14,665 | 40.4 | % | $ | 16,840 | 40.6 | % | ||||||||||||
50
The Company accounts for uncertainty in income taxes in accordance with the authoritative guidance issued by the FASB. This guidance prescribes a recognition threshold and measurement attribute for the financial statement recognition and measurement of a tax position taken or expected to be taken in a tax return, and provides guidance on derecognition, classification, interest and penalties, accounting in interim periods, disclosure and transition. As of January 1, 2011 and January 2, 2010, the Company had approximately $0 and $1,000, respectively, of unrecognized tax benefits, which would have little impact on our effective tax rate if recognized. The Company does not believe that the unrecognized tax benefit will change significantly within the 2011 fiscal year.
The Company recognizes interest and penalties related to uncertain tax positions in interest expense and SG&A expense, respectively, in the Consolidated Statements of Operations and Comprehensive Income. A reversal of interest recognized in prior periods of $11,000, $58,000 and $2,000 was recorded in 2010, 2009 and 2008, respectively. No penalties were recognized during 2010, 2009 or 2008. As of January 1, 2011 and January 2, 2010, the Company had approximately $13,000 and $24,000 accrued for interest, respectively, and no accrual for penalties at the end of either period. The interest accrual is net of the applicable federal and state tax savings which would result if the interest were paid out.
The Company files income tax returns in the U.S. federal jurisdiction and the California state jurisdiction. The Company is no longer subject to federal and state tax examinations for years before 2007 and 2006, respectively.
|
14.
|
Leases
|
The principal kinds of property leased by the Company and its subsidiaries are supermarket land and buildings. The most significant obligations assumed under the lease terms, other than rental payments, are the upkeep of the facilities, utilities, insurance and property taxes. Most supermarket leases contain contingent percentage rental provisions based on sales volume and have renewal options. In 2010 and 2009, the Company’s contingent percentage rent was lower than in the prior year due to a combination of reduced sales volume and increased base rent. The Company’s decision to exercise renewal options is primarily dependent on the level of business conducted at the location and the profitability thereof.
All leases and subleases with an initial term greater than one year are accounted for as either capital leases, operating leases or subleases, as appropriate, in accordance with authoritative guidance.
Assets Under Capital Leases: Assets under capital leases are capitalized using interest rates appropriate at the inception of each lease. There were no capital leases outstanding as of January 1, 2011 or January 2, 2010.
Operating Leases and Subleases: The Company is obligated under operating leases, primarily for land and buildings, which expire at various dates through 2027. Future minimum lease payments for all noncancelable operating leases having a remaining term in excess of one year at January 1, 2011 are as follows:
51
|
|
Deduct
|
Net
|
||||||||||
|
|
Sublease
|
Rental
|
||||||||||
|
(In Thousands)
|
Commitments
|
Rentals
|
Commitments
|
|||||||||
|
2011
|
$ | 10,858 | $ | 281 | $ | 10,577 | ||||||
|
2012
|
10,882 | 274 | 10,608 | |||||||||
|
2013
|
10,233 | 78 | 10,155 | |||||||||
|
2014
|
9,605 | 23 | 9,582 | |||||||||
|
2015
|
9,298 | 0 | 9,298 | |||||||||
|
Thereafter
|
65,284 | 0 | 65,284 | |||||||||
| $ | 116,160 | $ | 656 | $ | 115,504 | |||||||
Rent expense under operating leases was as follows:
|
(In Thousands)
|
2010
|
2009
|
2008
|
|||||||||
|
Minimum rent
|
$ | 11,574 | $ | 11,590 | $ | 11,324 | ||||||
|
Contingent percentage rent
|
845 | 1,030 | 1,356 | |||||||||
| 12,419 | 12,620 | 12,680 | ||||||||||
|
Sublease rentals
|
(1,886 | ) | (2,027 | ) | (2,110 | ) | ||||||
|
|
$ | 10,533 | $ | 10,593 | $ | 10,570 | ||||||
|
15.
|
Related Party Transactions |
A director of the Company is a partner in a law firm which performs legal services for the Company.
|
16.
|
Commitments and Contingent Liabilities |
The Company has an employment agreement with Mr. Briskin which currently expires on January 1, 2013. In addition to a base salary, the agreement provides for a bonus based on pre-tax earnings. No maximum compensation limit exists. Total salary and bonus expensed in 2010, 2009 and 2008 was approximately $1,199,000, $1,709,000 and $2,154,000, respectively. The unpaid bonus at year end is recorded under other current liabilities on the Consolidated Balance Sheets. Mr. Briskin is contractually entitled to a salary increase each year effective on January 1. In each of 2009 and 2011, Mr. Briskin offered to forego any salary increase. He was not eligible for a salary increase in 2010 as there was not an increase in the applicable consumer price index as specified in his employment agreement. In addition, for fiscal 2010, Mr. Briskin voluntarily reduced his bonus down to 50% of the bonus to which he was contractually entitled. For fiscal 2009, Mr. Briskin had also voluntarily reduced the bonus to which he was contractually entitled to equal 70% of his fiscal 2008 bonus. Mr. Briskin is also entitled to monthly payments during his lifetime beginning with the termination of his employment for any reason other than his breach of the employment agreement or termination for cause. The Company has accrued its obligation under the terms of the employment agreement as discussed in Note 11.
52
The Company is primarily self-insured for losses related to general and auto liability claims and, for certain years prior to July 1, 2006, for workers’ compensation as well. The Company purchased a fully insured guaranteed cost workers’ compensation insurance policy for losses occurring after June 30, 2006. This policy replaced the high deductible program for workers’ compensation and is currently effective through June 30, 2011. For workers’ compensation claims prior to July 1, 2006, the Company maintains stop-loss coverage to limit its loss exposure on a per claim basis. Liabilities associated with the risks that are retained by the Company are estimated, in part, by considering historical claims experience and regression analysis. Accruals are based on undeveloped reported claims and an estimate of claims incurred but not reported. While the ultimate amount of claims incurred are dependent on future developments, the reserve represents the Company’s best estimate of future payments related to claims. The Company’s workers’ compensation and general and auto liability reserves for unpaid claims and incurred but not reported claims at January 1, 2011 and January 2, 2010 were approximately $3,572,000 and $4,577,000, respectively, and are recorded under other current liabilities and other liabilities on the Consolidated Balance Sheets.
As of January 1, 2011, management had authorized expenditures on incomplete projects for the construction and purchase of property, plant and equipment which totaled approximately $441,000.
The Company and its subsidiaries are subject to a myriad of environmental laws, regulations and lease covenants with its landlords regarding, among other things, air, water and land use, products for sale, and the use, storage and disposal of hazardous materials. The Company believes it substantially complies, and has in the past substantially complied, with federal, state and local environmental laws and regulations and private covenants. The Company cannot, at this time, estimate the expense it ultimately may incur in connection with any current or future violations; however, it believes any such claims will not have a material adverse impact on either the Company’s consolidated financial position, results of operations or cash flows.
The Company or its subsidiaries are defendants in a number of cases currently in litigation, being vigorously defended, in which the complainants seek monetary damages. As of the date hereof, no estimate of potential liability, if any, is possible. Based upon current information, management, after consultation with legal counsel defending the Company’s interests in the cases, believes the ultimate disposition thereof will have no material effect upon either the Company’s consolidated financial position, results of operations or cash flows.
53
|
17.
|
Selected Quarterly Financial Data (Unaudited)
|
|
(In Thousands, Except Per Share Data)
|
|||||||||||||||||
|
|
|
Basic and Diluted
|
|||||||||||||||
| Gross |
Net
|
Net Income
|
|||||||||||||||
|
Quarter
|
Sales
|
Profit
|
Income
|
Per Share (1)
|
|||||||||||||
|
2009
|
|||||||||||||||||
|
First
|
$ | 108,847 | $ | 42,847 | $ | 5,833 | $ | 1.85 | |||||||||
|
Second
|
107,851 | 41,361 | 4,671 | 1.48 | |||||||||||||
|
Third
|
103,754 | 39,605 | 4,668 | 1.48 | |||||||||||||
|
Fourth
|
110,718 | 42,426 | 6,452 | 2.03 | |||||||||||||
|
2010
|
|||||||||||||||||
|
First
|
$ | 104,777 | $ | 40,293 | $ | 5,074 | $ | 1.61 | |||||||||
|
Second
|
101,960 | 38,928 | 4,006 | 1.27 | |||||||||||||
|
Third
|
100,308 | 38,172 | 3,454 | 1.09 | |||||||||||||
|
Fourth
|
110,020 | 42,166 | 5,551 | 1.75 | |||||||||||||
|
(1)
|
Earnings per share is calculated using the weighted average outstanding shares for the quarter.
|
|
18.
|
Subsequent Events |
On January 20, 2011, the Company paid a regular quarterly cash dividend of 25 cents per share on its Class A totaling approximately $790,000 to stockholders of record on December 31, 2010.
In January 2011, the Company voluntarily terminated its existing lines of credit and established a new letter of credit facility totaling $10,000,000 with a different bank. The Company is currently in discussions with the new bank for additional borrowing facilities. In connection with the cancellation of one of the previous lines of credit, the Company’s outstanding letters of credit were cancelled and reestablished with the new bank for the same dollar amounts. Under the new facility, these letters of credit are secured by a compensating balance arrangement which the Company expects to eliminate with the new facility that is currently being discussed.
In February 2011, the Company sold an undeveloped parcel of land in Rubidoux, California for $2,178,000 resulting in a gain of approximately $2,129,000.
The Company’s collective bargaining agreement with the UFCW expired on March 6, 2011. The UFCW’s contract with the three major grocery retailers in our trade area – Vons, Ralphs and Albertsons grocery chains (Majors) – also expired on the same date. The Majors are currently in negotiations with the UFCW to renew their collective bargaining agreements. The Company has signed an extension agreement with the UFCW pending the outcome of the UFCW’s negotiations with the Majors which obligates Gelson’s to any changes agreed to by the Majors in hourly wage rates and contributions to the benefit plans. In addition, the expired agreement allowed for an additional increase in the health and welfare contribution rate effective February 2011 which has resulted in an increase in the Company’s costs by approximately $11,000 per week.
54
ARDEN GROUP, INC. AND CONSOLIDATED SUBSIDIARIES
_______________________________________________________
INDEX TO EXHIBITS
Exhibit
|
3.1.1
|
Restated Certificate of Incorporation of Arden Group, Inc. dated November 7, 1988, filed as Exhibit 3.1 to the Annual Report on Form 10-K of Arden Group, Inc. for the fiscal year ended December 31, 1988 and incorporated herein by reference.
|
|
3.1.2
|
Certificate of Amendment of Restated Certificate of Incorporation of Arden Group, Inc. dated June 17, 1998, filed as Exhibit 3.1.2 to the Annual Report on Form 10-K of Arden Group, Inc. for the fiscal year ended January 2, 1999 and incorporated herein by reference.
|
|
3.2.1
|
Amended and Restated By-Laws of Arden Group, Inc. as amended as of November 6, 2001, filed as Exhibit 3.2.2 to the Annual Report on Form 10-K of Arden Group, Inc. for the fiscal year ended December 29, 2001 and incorporated herein by reference.
|
|
4.1
|
Indenture dated as of September 1, 1964, between Arden Farms Co. and Security First National Bank, as Trustee, pertaining to 6% Subordinated Income Debentures, due September 1, 2014, filed as Exhibit 4.2 to Registration Statement on Form S-1 of Arden Group, Inc. and Arden-Mayfair, Inc., Registration No. 2-58687, and incorporated herein by reference.
|
|
4.1.1
|
First Supplemental Indenture dated as of November 7, 1978, to Indenture which is Exhibit 4.1, filed as Exhibit 7 to the Annual Report on Form 10-K of Arden Group, Inc. for the fiscal year ended December 30, 1978 and incorporated herein by reference.
|
|
4.1.2
|
Second Supplemental Indenture dated as of November 7, 1978, to Indenture which is Exhibit 4.1, filed as Exhibit 8 to the Annual Report on Form 10-K of Arden Group, Inc. for the fiscal year ended December 30, 1978 and incorporated herein by reference.
|
|
4.1.3
|
Third Supplemental Indenture dated April 24, 1981, to Indenture which is Exhibit 4.1, filed as Exhibit 4.2.3 to the Quarterly Report on Form 10-Q of Arden Group, Inc. for the quarter ended April 4, 1981 and incorporated herein by reference.
|
|
10.1*
|
Employment Agreement dated May 13, 1988, by and among Arden Group, Inc., Arden-Mayfair, Inc., Telautograph Corporation and Gelson’s Markets and Bernard Briskin, filed as Exhibit 10 to the Quarterly Report on Form 10-Q of Arden Group, Inc. for the quarter ended July 2, 1988 and incorporated herein by reference.
|
55
Exhibit
|
10.2*
|
Amendment to Employment Agreement dated April 27, 1994, by and between Arden Group, Inc., Arden-Mayfair, Inc., AMG Holdings, Inc. and Gelson’s Markets and Bernard Briskin, filed as Exhibit 10.7 to the Quarterly Report on Form 10-Q of Arden Group, Inc. for the quarter ended April 2, 1994 and incorporated herein by reference.
|
|
10.3*
|
Second Amendment to Employment Agreement as of January 1, 1997, by and between Arden Group, Inc., Arden-Mayfair, Inc., AMG Holdings, Inc. and Gelson’s Markets and Bernard Briskin, filed as Exhibit 10.9 to the Annual Report on Form 10-K of Arden Group, Inc. for the fiscal year ended January 3, 1998 and incorporated herein by reference.
|
|
10.4*
|
Third Amendment to Employment Agreement as of December 31, 2008, by and between Arden Group, Inc., Arden-Mayfair, Inc., AMG Holdings, Inc. and Gelson’s Markets and Bernard Briskin, filed as Exhibit 10.4 to the Annual Report on Form 10-K of Arden Group, Inc. for the fiscal year ended January 3, 2009 and incorporated herein by reference.
|
|
10.5
|
Form of Indemnification Agreement between the Registrant and the Directors and certain officers, filed as Exhibit 10.13 to the Annual Report on Form 10-K of Arden Group, Inc. for the fiscal year ended December 29, 1990 and incorporated herein by reference.
|
|
10.6*
|
Arden Group, Inc., Non-Officer and Non-Director Stock Option Plan filed as Exhibit 10.15 to the Annual Report on Form 10-K of Arden Group, Inc. for the fiscal year ended December 28, 2002 and incorporated herein by reference.
|
|
10.7*
|
Form of Stock Option Plan Agreement filed as Exhibit 10.15.1 to the Annual Report on Form 10-K of Arden Group, Inc. for the fiscal year ended December 28, 2002 and incorporated herein by reference.
|
|
10.8*
|
Form of Non-Employee Director Phantom Stock Unit Agreement with each of M. Mark Albert, John G. Danhakl, Robert A. Davidow, Kenneth A. Goldman and Steven Romick dated January 15, 2010, filed as Exhibit 10.1 to the Quarterly Report on Form 10-Q of Arden Group, Inc. for the quarter ended April 3, 2010 and incorporated herein by reference.
|
|
10.9*
|
Employee Phantom Stock Unit Agreement with Laura J. Neumann dated January 15, 2010, filed as Exhibit 10.2 to the Quarterly Report on Form 10-Q of Arden Group, Inc. for the quarter ended April 3, 2010 and incorporated herein by reference.
|
|
10.10*
|
Employee Phantom Stock Unit Agreement with Laura J. Neumann dated August 10, 2010.
|
|
21.
|
Subsidiaries of Registrant.
|
|
23.1
|
Consent of Independent Registered Public Accounting Firm.
|
56
Exhibit
|
31.1
|
Certification of Chief Executive Officer pursuant to Section 302 of the Sarbanes-Oxley Act of 2002.
|
|
31.2
|
Certification of Chief Financial Officer pursuant to Section 302 of the Sarbanes-Oxley Act of 2002.
|
|
32.1
|
Certification of Chief Executive Officer pursuant to Section 906 of the Sarbanes-Oxley Act of 2002.
|
|
32.2
|
Certification of Chief Financial Officer pursuant to Section 906 of the Sarbanes-Oxley Act of 2002.
|
|
*
|
Indicates management contracts or compensatory plans or arrangements required to be filed as an exhibit to this report.
|
57
Arden Group, Inc.
March 10, 2011
United States Securities & Exchange Commission
450 Fifth Street N.W.
Washington, DC 20549
|
Reference:
|
Form 10-K
File Number 0-9904
|
Ladies and Gentlemen:
Enclosed is the Arden Group, Inc. Form 10-K for the year ended January 1, 2011. The financial statements in the enclosed report do not reflect a change from the preceding year in any accounting principles or practices, or in the method of applying any such principles or practices.
Very truly yours,
ARDEN GROUP, INC.
/s/LAURA J. NEUMANN
Laura J. Neumann
Chief Financial Officer
LJN/clp
Enclosure
2020 South Central Avenue, Compton, California 90220
Telephone: (310) 638-2842 Facsimile: (310) 631-0950