Attached files
| file | filename |
|---|---|
| 8-K - CTWS FORM 8-K - CONNECTICUT WATER SERVICE INC / CT | form_8-k.htm |

Connecticut Water Service, Inc
New York Society of Security Analysts
December 1, 2010

Forward Looking Statements
Except for the historical statements and
discussions, some statements contained in this
report constitute “forward looking statements”
within the meaning of Section 27A of the Securities
Act of 1933 and Section 21E of the Securities
Exchange Act of 1934. These forward looking
statements are based on current expectations and
rely on a number of assumptions concerning future
events, and are subject to a number of
uncertainties and other factors, many of which are
outside our control, that could cause actual results
to differ materially from such statements.
• NASDAQ: CTWS
• Subsidiaries:
– Connecticut Water Company (Regulated)
– New England Water Utility Services, Inc.
(Unregulated)
(Unregulated)
• Market Capitalization: $215 Million
• Current Dividend and Yield:
$0.93, 3.8%
• S&P Rating: A Stable
Connecticut Water Service, Inc.

• Organized in 1956
• 55 Towns
• Serving 300,000 people
• 200 Employees
Connecticut Water Company

Service Area Profile
• 4 Regions in Connecticut
– Non-contiguous
– Unregulated penetration
– Consolidation opportunities
• 500 community systems
• 100 municipal/public authority
• 75% serve less than 500 people
• 6 month regulatory lag
• Active commissioners
• WICA
• Regulatory strategy - engage & educate
Connecticut DPUC

Water Touches Everything
We Care About…
We Care About…

Water Touches Everything
We Care About…
We Care About…
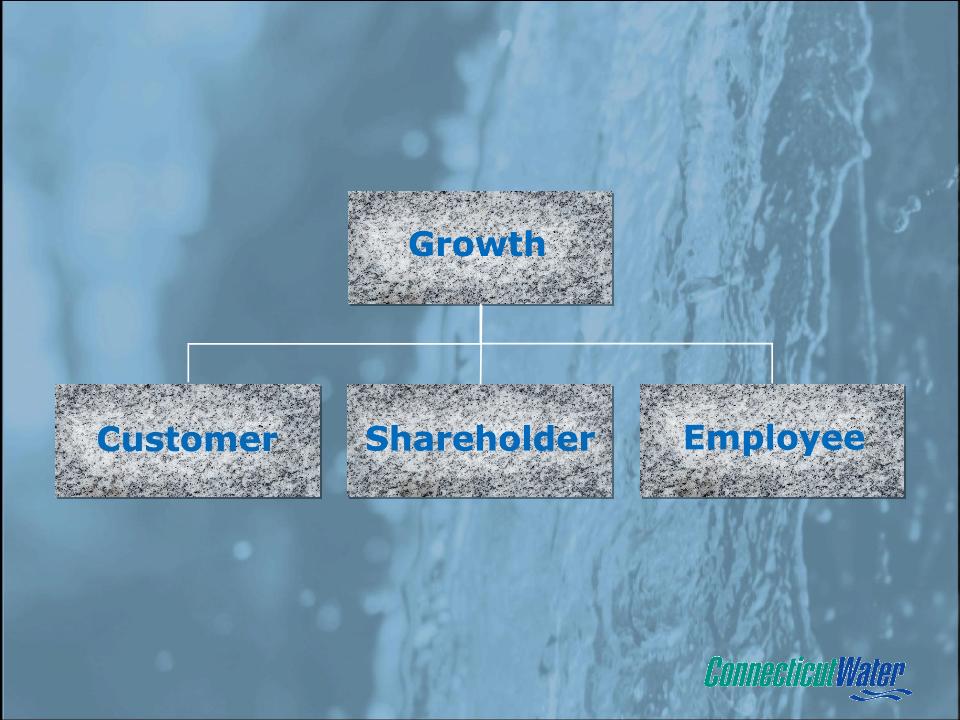
Our Strategy…
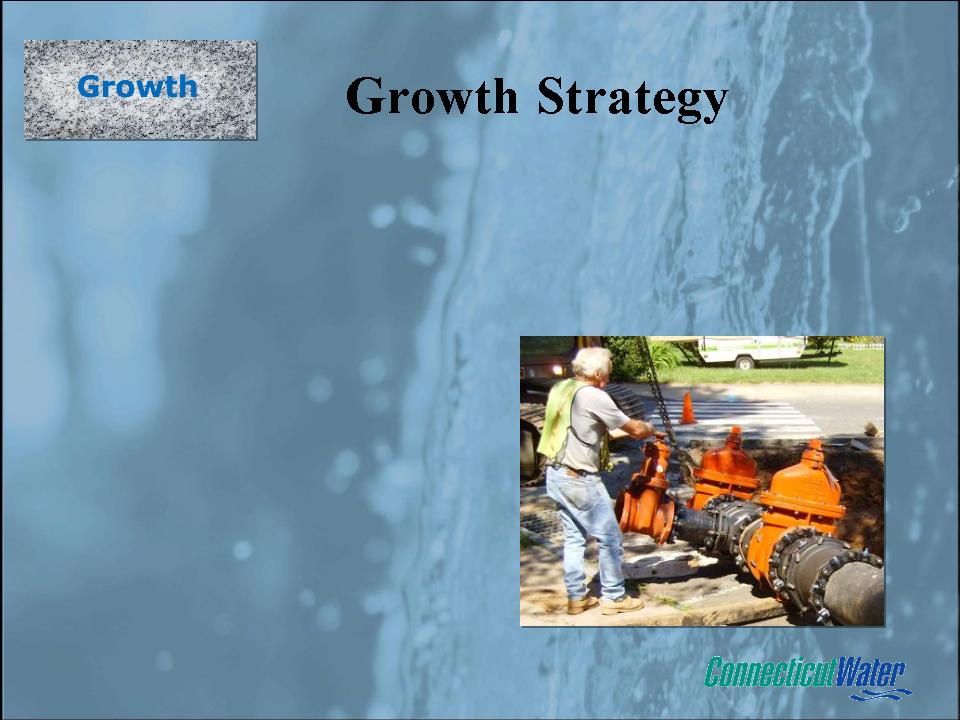
• Infrastructure Investment
• Acquisitions
• Utility Services
Infrastructure
Philosophy:
– Invest capital in
infrastructure
infrastructure
– Minimize investment vs.
recovery time
recovery time
– Seek to leverage with
growth
growth
– Manage operating costs
efficiently
efficiently
Infrastructure
• Traditional Rate Cases
– $10.9 million (22%) 2006
• 2006 marked 1st case in 15
years
years
• 2006 case allowed for
re-opener
$15 million capital
improvement in 2007
improvement in 2007
– $8 million (13%) 2010
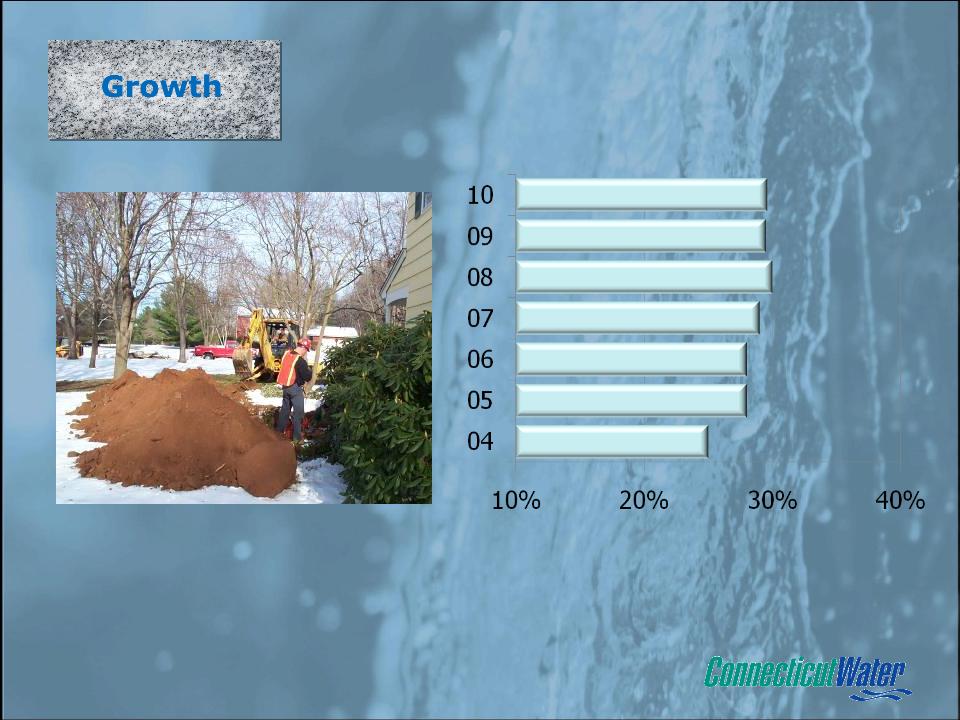
WICA
(Water Infrastructure Conservation Adjustment)
(Water Infrastructure Conservation Adjustment)
• DSIC - type infrastructure
recovery mechanism
– 5% annual cap
– 7.5% maximum adjustment
• $13 - 15 million per year in
pipeline replacement
• Pending surcharge anticipated 1.6% (1/11)
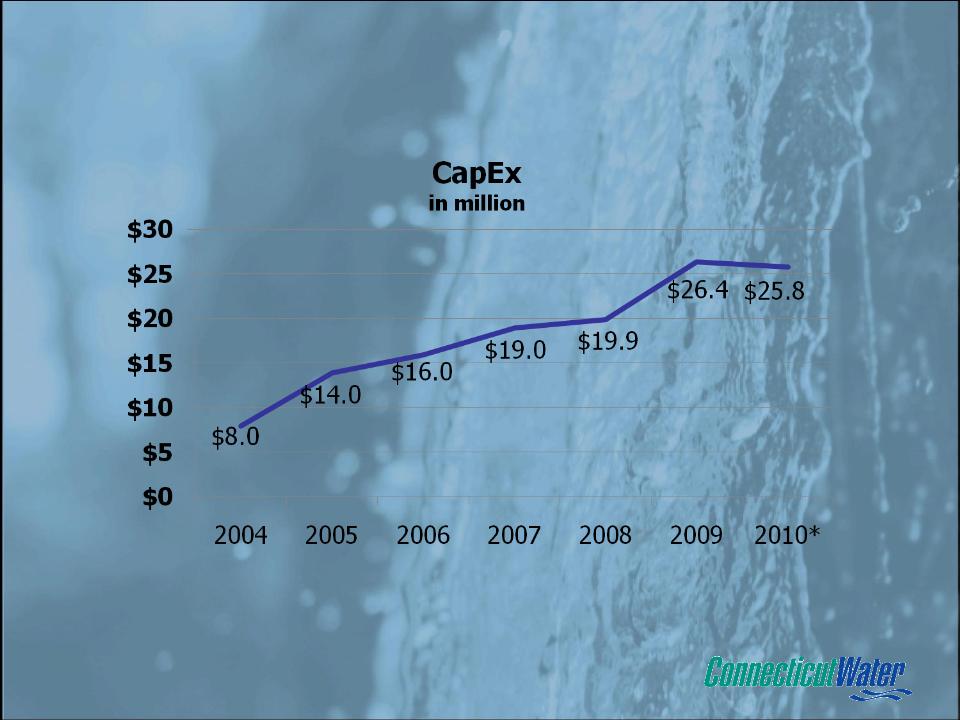
Capital Expenditures
* 2010 Estimated
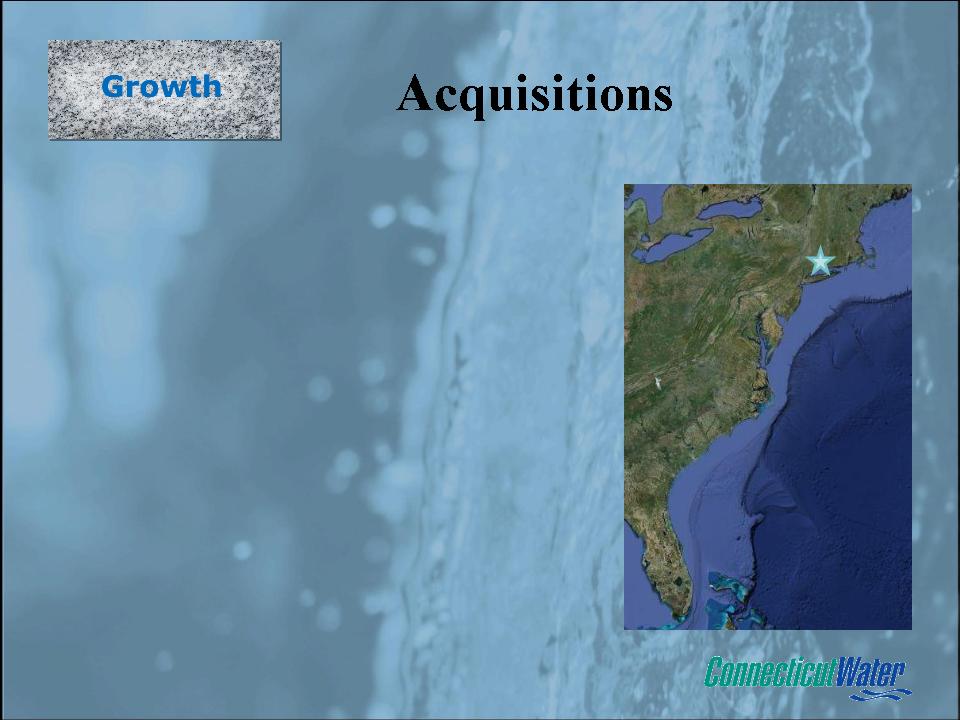
• Acquire Water &
Waste Water Systems
• Connecticut
• Atlantic Coast States
• Fair Regulation
• 60 Acquisitions in 20 years
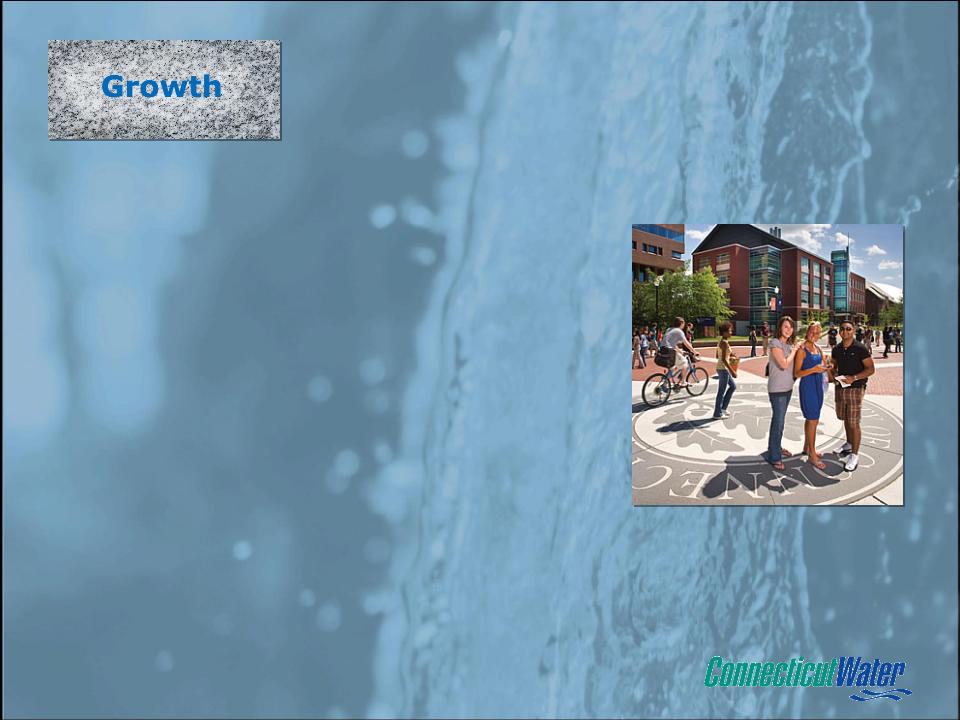
Utility Services
• 80 client contracts
– O&M
– Leak Detection
– Compliance Reporting
• University of Connecticut
Linebacker®
Service Line Protection
Service Line Protection
Renewal Rate
>90%
Percent of residential
customers enrolled
customers enrolled
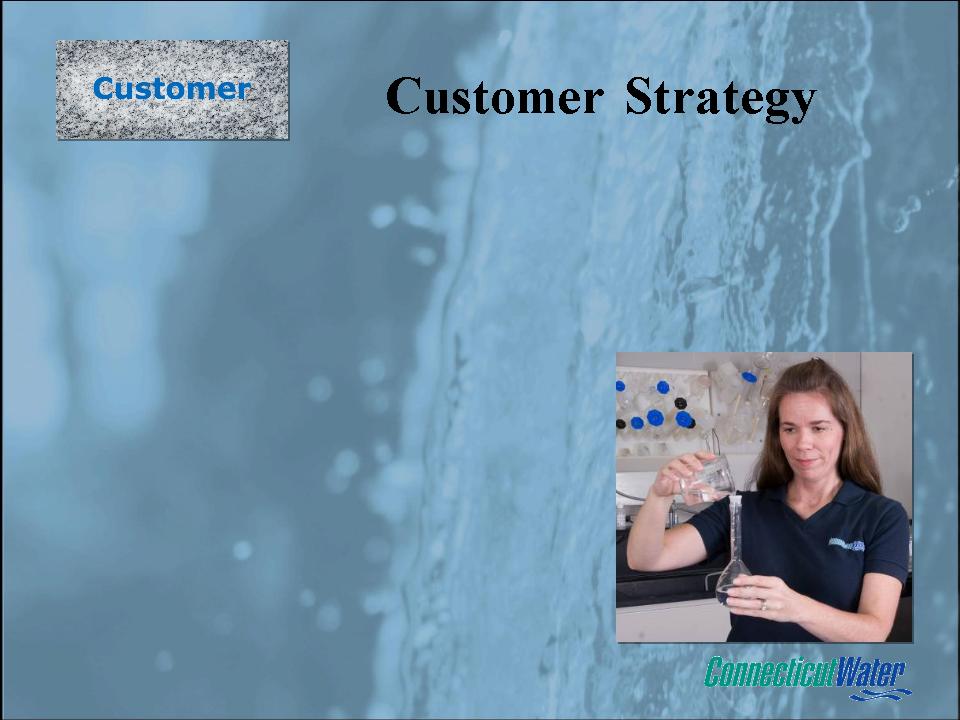
• High Quality Water
• Responsive and Courteous Service
• Efficient & Effectively
Delivered
• Environmental Stewardship
• Customer Satisfaction!
• Investment in Technology
• H2O Assistance Program
• Temporary Rate Reduction
• World Class Customer Service -
>85% satisfaction 4 years in a row
Customer Service

• Leadership is a privilege
• Trust based
• Team & service oriented
• Professionals
• “Satisfied Employees
Satisfy Customers”
• Employee Satisfaction
– Executive Compensation Metric
Employee Strategy
Shareholder Strategy
• Strong Dividend Yield
• High Earnings Quality
• Strong Balance Sheet
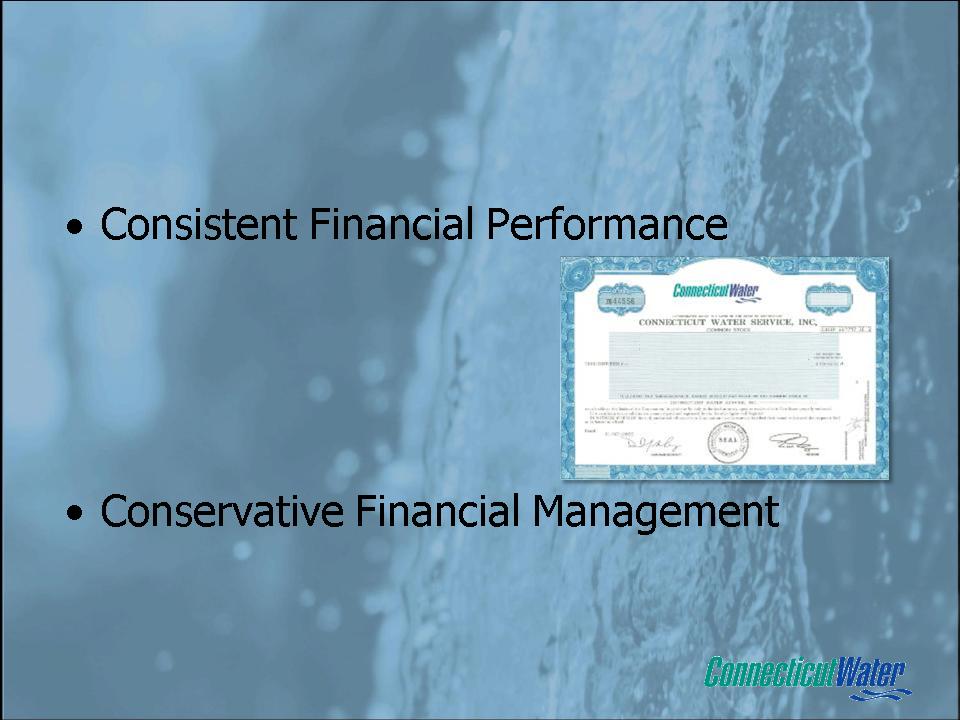
Performance
• High Earnings Quality
– 90% of Revenues, 95% of
Earnings from regulated business
• Strong Balance Sheet
– LTD 5.5% Embedded Cost
– Balanced Debt-Equity ratio
– Access to Capital Doubled
– S & P Rating “A”
Performance
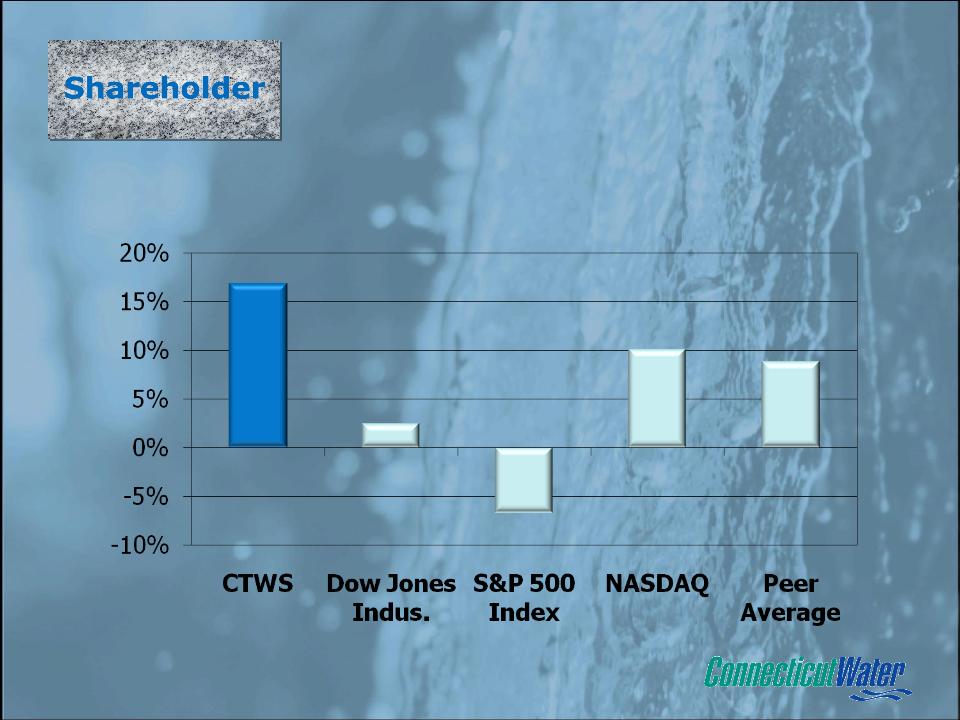
5 Year Financial Performance
Total Return
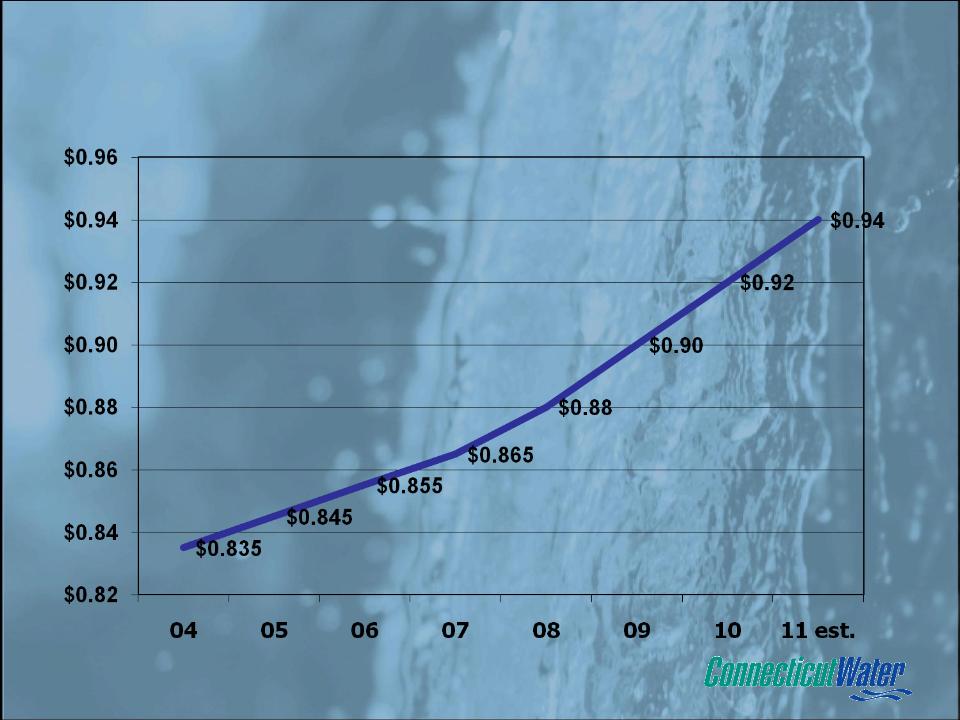
Dividend Growth
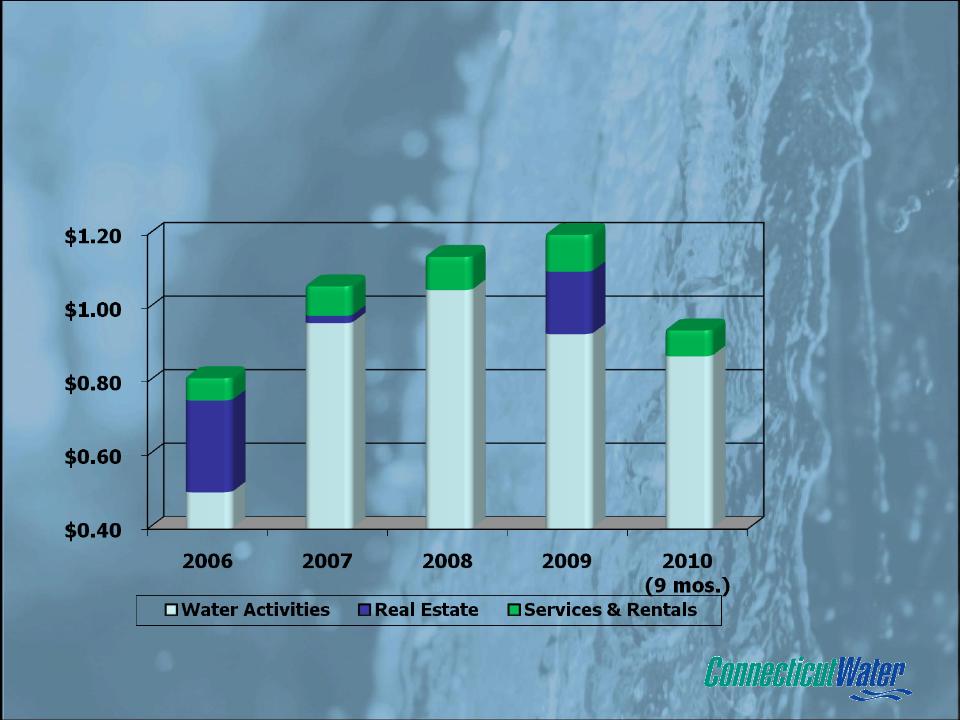
Segment Earnings
2006 - 2010
2006 - 2010
EPS
$0.81
$1.06
$1.12
$1.20
$0.94
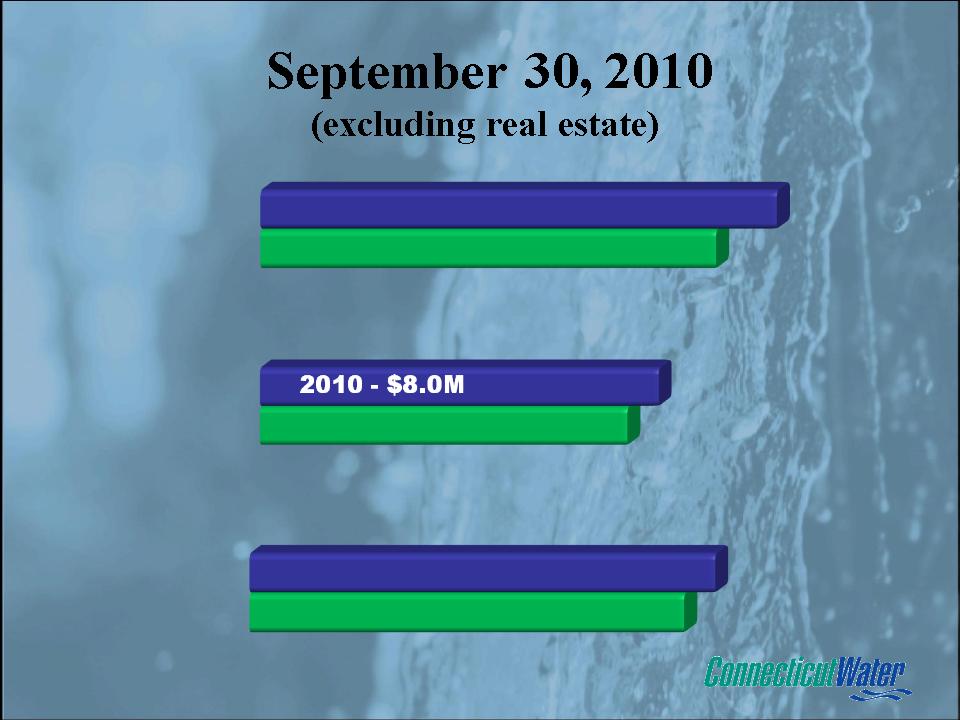
2010 - $50.7M
2009 - $45.2M
2009 - $7.8M
2010 - $0.94
2009 - $0.92
Revenue
Net Income
EPS

Thank -You
Questions?
Questions?