Attached files
| file | filename |
|---|---|
| EX-32.2 - CFO SOX CERTIFICATION - CONNECTICUT WATER SERVICE INC / CT | cfo_sox.htm |
| EX-32.1 - CEO SOX CERTIFICATION - CONNECTICUT WATER SERVICE INC / CT | ceo_sox.htm |
| EX-23.1 - PWC CONSENT - CONNECTICUT WATER SERVICE INC / CT | pwc_consent.htm |
| EX-21 - CTWS SUBSIDIARIES - CONNECTICUT WATER SERVICE INC / CT | subsidiaries.htm |
| EX-4.43 - LOAN AGREEMENT - CONNECTICUT WATER SERVICE INC / CT | loanagreement.htm |
| EX-31.1 - CEO CERTIFICATION - CONNECTICUT WATER SERVICE INC / CT | ceo_certification.htm |
| EX-31.2 - CFO CERTIFICATION - CONNECTICUT WATER SERVICE INC / CT | cfo_certification.htm |
| EX-4.42 - BOND PURCHASE AGREEMENT - CONNECTICUT WATER SERVICE INC / CT | bondpurchaseagreement.htm |
| EX-4.44 - INDENTURE OF TRUST - CONNECTICUT WATER SERVICE INC / CT | indentureoftrust.htm |
UNITED
STATES
SECURITIES
AND EXCHANGE COMMISSION
Washington,
D. C. 20549
Form
10-K
|
x
|
Annual
Report pursuant to section 13 or 15(d) of the Securities Exchange Act of
1934 for the fiscal year ended December 31, 2009
or
|
|
o
|
Transition
report pursuant to section 13 or 15(d) of the Securities Exchange Act of
1934 for the transition period from
|
to
|
Commission
File Number 0-8084
Connecticut
Water Service, Inc.
(Exact
name of registrant as specified in its charter)
|
Connecticut
(State
or other jurisdiction of
incorporation
or organization)
|
06-0739839
(I.R.S.
Employer Identification No.)
|
|
93
West Main Street, Clinton, CT
(Address
of principal executive office)
|
06413
(Zip
Code)
|
Registrant's
telephone number, including area code (860) 669-8636
Registrant’s
website: www.ctwater.com
Securities
registered pursuant to Section 12 (b) of the Act:
|
Title
of each Class
Common
Stock, without par value
|
Name
of each exchange on which registered
The
Nasdaq Stock Market, Inc.
|
Securities
registered pursuant to Section 12 (g) of the Act:
None
Indicate
by check mark if the registrant is a well-known seasoned issuer, as defined in
Rule 405 of the Securities Act. Yes o No x
Indicate
by check mark if the registrant is not required to file reports pursuant to
Section 13 or Section 15(d) of the Exchange Act. Yes o No x
Indicate
by check mark whether the registrant (1) has filed all reports required to be
filed by Section 13 or 15 (d) of the Securities Exchange Act of 1934 during the
preceding twelve (12) months (or for such shorter period that the registrant was
required to file such reports) and (2) has been subject to such filing
requirements for the past 90 days. Yes x Noo
Indicate
by check mark whether the registrant has submitted electronically and posted on
its corporate Web site, if any, every Interactive Data File required to be
submitted and posted pursuant to Rule 405 of Regulation S-T during the preceding
12 months (or for such shorter period that the registrant was required to submit
and post such files). Yes o No o
Indicate
by check mark if disclosure of delinquent filers pursuant to Item 405 of
Regulation S-K, (Section 229.405 of this chapter) is not contained herein, and
will not be contained, to the best of registrant's knowledge, in definitive
proxy or information statements incorporated by reference in Part III of this
Form 10-K or any amendment to this Form 10-K. o
Indicate
by check mark whether the registrant is a large accelerated filer, an
accelerated filer, or a non-accelerated filer, or a smaller reporting
company. See the definitions of “accelerated filer and large
accelerated filer,” “accelerated filer” and “smaller reporting company” in Rule
12b-2 of the Exchange Act. (Check one):
|
Large
Accelerated Filer o
|
Accelerated
Filer x
|
|
Non-Accelerated
Filer o
|
Smaller
Reporting Company o
|
(Do not
check if smaller reporting company)
Indicate
by check mark whether the registrant is a shell company (as defined by Rule
12b-2 of the Exchange Act). Yes o No x
As of
June 30, 2009, the aggregate market value of the registrant's voting Common
Stock held by non-affiliates of the registrant was $183,461,959 based on the
closing sale price on such date as reported on the NASDAQ.
Number of
shares of Common Stock, no par value, outstanding as of March 1, 2010 was
8,605,403, excluding 104,522 common stock equivalent shares.
DOCUMENTS
INCORPORATED BY REFERENCE
|
Document
|
Part
of Form 10-K Into Which Document is Incorporated
|
|
|
Definitive
Proxy Statement, dated March 31, 2010, for Annual Meeting of Shareholders
to be held on May 14, 2010.
|
Part
III
|
|
INDEX
TO ANNUAL REPORT ON FORM 10-K Year Ended December 31, 2009
|
||||
|
Page Number
|
||||
| 4 | ||||
|
Part
I
|
||||
|
5
|
||||
|
9
|
||||
|
12
|
||||
|
12
|
||||
|
13
|
||||
|
13
|
||||
|
Part
II
|
||||
|
13
|
||||
|
15
|
||||
|
16
|
||||
|
24
|
||||
|
25
|
||||
|
25
|
||||
|
25
|
||||
|
25
|
||||
|
Part
III
|
||||
|
25
|
||||
|
25
|
||||
|
25
|
||||
|
25
|
||||
|
25
|
||||
|
Part
IV
|
||||
|
26
|
||||
|
27
|
Certain
statements in this Annual Report on Form 10-K (“10-K”), or incorporated by
reference into this 10-K, are forward-looking statements within the meaning of
Section 27A of the Securities Act of 1933 and Section 21E of the Securities
Exchange Act of 1934 (“Exchange Act”) that are made based upon, among other
things, our current assumptions, expectations and beliefs concerning future
developments and their potential effect on us. These forward-looking
statements involve risks, uncertainties and other factors, many of which are
outside our control, which may cause our actual results, performance or
achievements to be materially different from any future results, performance or
achievements expressed or implied by these forward-looking
statements. In some cases you can identify forward-looking statements
where statements are preceded by, followed by or include the words “believes,”
“expects,” “anticipates,” “plans,” “future,” “potential,” “probably,”
“predictions,” “continue” or the negative of such terms or similar
expressions. Forward-looking statements included in this 10-K, or
incorporated by reference into this 10-K, include, but are not limited to,
statements regarding:
|
·
|
projected
capital expenditures and related funding
requirements;
|
|
·
|
the
availability and cost of capital;
|
|
·
|
developments,
trends and consolidation in the water and wastewater utility
industries;
|
|
·
|
dividend
payment projections;
|
|
·
|
our
ability to successfully acquire and integrate regulated water and
wastewater systems, as well as unregulated businesses, that are
complementary to our operations and the growth of our
business;
|
|
·
|
the
capacity of our water supplies, water facilities and wastewater
facilities;
|
|
·
|
the
impact of limited geographic diversity on our exposure to unusual
weather;
|
|
·
|
the
impact of conservation awareness of customers and more efficient plumbing
fixtures and appliances on water usage per
customer;
|
|
·
|
our
capability to pursue timely rate increase
requests;
|
|
·
|
our
authority to carry on our business without unduly burdensome
restrictions;
|
|
·
|
our
ability to maintain our operating costs at the lowest possible level,
while providing good quality water
service;
|
|
·
|
our
ability to obtain fair market value for condemned
assets;
|
|
·
|
the
impact of fines and penalties;
|
|
·
|
changes
in laws, governmental regulations and policies, including environmental,
health and water quality and public utility regulations and
policies;
|
|
·
|
the
decisions of governmental and regulatory bodies, including decisions to
raise or lower rates;
|
|
·
|
our
ability to successfully extend and expand our service contract work within
our Service and Rentals Segment;
|
|
·
|
the
development of new services and technologies by us or our
competitors;
|
|
·
|
the
availability of qualified
personnel;
|
|
·
|
the
condition of our assets;
|
|
·
|
the
impact of legal proceedings;
|
|
·
|
general
economic conditions;
|
|
·
|
the
profitability of our Real Estate Segment, which is subject to the amount
of land we have available for sale and/or donation, the demand for any
available land, the continuation of the current state tax benefits
relating to the donation of land for open space purposes and regulatory
approval for land dispositions; and
|
|
·
|
acquisition-related
costs and synergies.
|
Because
forward-looking statements involve risks and uncertainties, there are important
factors that could cause actual results to differ materially from those
expressed or implied by these forward-looking statements, including but not
limited to:
|
·
|
changes
in general economic, business, credit and financial market
conditions;
|
|
·
|
changes
in government regulations and policies, including environmental and public
utility regulations and policies;
|
|
·
|
changes
in environmental conditions, including those that result in water use
restrictions;
|
|
·
|
abnormal
weather conditions;
|
|
·
|
increases
in energy and fuel costs;
|
|
·
|
unfavorable
changes to the federal and/or state tax
codes;
|
|
·
|
significant
changes in, or unanticipated, capital
requirements;
|
|
·
|
significant
changes in our credit rating or the market price of our common
stock;
|
|
·
|
our
ability to integrate businesses, technologies or services which we may
acquire;
|
|
·
|
our
ability to manage the expansion of our
business;
|
|
·
|
the
extent to which we are able to develop and market new and improved
services;
|
|
·
|
the
continued demand by telecommunication companies for antenna site leases on
our property;
|
|
·
|
the
effect of the loss of major
customers;
|
|
·
|
our
ability to retain the services of key personnel and to hire qualified
personnel as we expand;
|
|
·
|
labor
disputes;
|
|
·
|
increasing
difficulties in obtaining insurance and increased cost of
insurance;
|
|
·
|
cost
overruns relating to improvements or the expansion of our
operations;
|
|
·
|
increases
in the costs of goods and services;
|
|
·
|
civil
disturbance or terroristic threats or acts;
and
|
|
·
|
changes
in accounting pronouncements.
|
Given
these uncertainties, you should not place undue reliance on these
forward-looking statements. You should read this 10-K and the
documents that we incorporate by reference into this 10-K completely and with
the understanding that our actual future results, performance and achievements
may be materially different from what we expect. These
forward-looking statements represent our assumptions, expectations and beliefs
only as of the date of this 10-K. Except for our ongoing obligations
to disclose certain information under the federal securities laws, we are not
obligated, and assume no obligation, to update these forward-looking statements,
even though our situation may change in the future. For further
information or other factors which could affect our financial results and such
forward-looking statements, see Part I, Item 1A“Risk Factors.” We
qualify all of our forward-looking statements by these cautionary
statements.
4
PART
I
The
Company
The
Registrant, Connecticut Water Service, Inc. (referred to as “the Company”, “we”,
or “our”) was incorporated in 1974, with The Connecticut Water Company
(Connecticut Water) as its largest subsidiary which was organized in 1956.
Connecticut Water Service, Inc. is a non-operating holding company, whose income
is derived from the earnings of its four wholly-owned subsidiary
companies. In 2009, approximately 77% of the Company’s net income was
attributable to water activities carried out within its regulated water company,
Connecticut Water. As of December 31, 2009, Connecticut Water
supplied water to 88,534 customers, representing a population of over 300,000,
in 54 towns throughout Connecticut. As a regulated water company,
Connecticut Water is subject to state regulation regarding financial issues,
rates, and operating issues, and to various other state and federal regulatory
agencies concerning water quality and environmental standards.
In
addition to its regulated utility, the Company owns three unregulated companies,
two of which were active and one of which was inactive as of December 31,
2009. In 2009, these unregulated companies, together with real estate
transactions within Connecticut Water, contributed the remaining 23% of the
Company’s earnings from continuing operations through real estate transactions
as well as services and rentals. The two active companies are Chester
Realty, Inc., a real estate company in Connecticut; and New England Water
Utility Services, Inc. (NEWUS), which provides contract water and sewer
operations and other water related services.
The
inactive company is The Barnstable Holding Company (Barnstable Holding), a
holding company which previously owned BARLACO Inc. (BARLACO) and Barnstable
Water Company (Barnstable Water). BARLACO, a real estate company in
Massachusetts whose entire inventory of land was sold in 2006, and Barnstable
Water, a company that was a public service company until its assets were sold to
the Town of Barnstable, Massachusetts in 2005, were each merged with and into
Barnstable Holding during 2007.
Our
mission is to provide high quality water service to our customers at a fair
return to our shareholders while maintaining a work environment that attracts,
retains and motivates our employees to achieve a high level of
performance.
Our
corporate headquarters are located at 93 West Main Street, Clinton, Connecticut
06413. Our telephone number is (860) 669-8636, and our internet
address is www.ctwater.com.
The
Company’s annual report on Form 10-K, quarterly reports on Form 10-Q, current
reports on Form 8-K, proxy statements and all amendments to these documents will
be made available free of charge through the “INVESTOR INFORMATION” menu of the
Company’s internet website (http://www.ctwater.com) as soon as practicable after
such material is electronically filed with, or furnished to, the Securities and
Exchange Commission (SEC). The following documents are also available through
the “CORPORATE GOVERNANCE” section of our website:
|
·
|
Employee
Code of Conduct
|
|
·
|
Audit
Committee Charter
|
|
·
|
Board
of Directors Code of Conduct
|
|
·
|
Compensation
Committee Charter
|
|
·
|
Corporate
Governance Committee Charter
|
|
·
|
Corporate
Responsibility Committee Charter
|
|
·
|
Amended
and Restated Bylaws of Connecticut Water Service,
Inc.
|
|
·
|
2009
Annual Meeting Materials (2008 Annual Report and 2009 Proxy
Statement)
|
Copies of
each of the Company’s SEC filings (without exhibits) and corporate governance
documents mentioned above will also be mailed to investors, upon request, by
contacting the Company’s Corporate Secretary at Connecticut Water, 93 West Main
Street, Clinton, CT 06413.
Our
Regulated Business
Our
business is subject to seasonal fluctuations and weather
variations. The demand for water is generally greater during the
warmer months than the cooler months due to customers’ incremental water
consumption related to cooling systems and various outdoor uses such as private
and public swimming pools and lawn sprinklers. Demand will vary with
rainfall and temperature levels from year to year and season to season,
particularly during the warmer months.
In
general, the profitability of the water utility industry is largely dependent on
the timeliness and adequacy of rates allowed by utility regulatory commissions.
In addition, profitability is affected by numerous factors over which we have
little or no control, such as costs to comply with security, environmental, and
water quality regulations. Inflation and other factors also impact costs for
construction, materials and personnel related expenses.
Costs to
comply with environmental and water quality regulations are
substantial. Since the 1974 enactment of the Safe Drinking Water Act,
we have spent approximately $59.0 million in constructing facilities and
conducting aquifer mapping necessary to comply with the requirements of the Safe
Drinking Water Act, and other federal and state regulations, of which $8.1
million was expended in the last five years. The Company expects to
spend approximately $1.7 million in 2010 on Safe Water Drinking Act projects,
primarily to bring newly acquired systems up to the Company’s
standards. The Company believes that we are presently in compliance
with current regulations, but the regulations are subject to change at any
time. The costs to comply with future changes in state or federal
regulations, which could require us to modify existing filtration facilities
and/or construct new ones, or to replace any reduction of the safe yield from
any of our current sources of supply, could be substantial.
Connecticut
Water derives its rights and franchises to operate from special Connecticut acts
that are subject to alteration, amendment or repeal and do not grant us
exclusive rights to our service areas. Our franchises are free from burdensome
restrictions, are unlimited as to time, and authorize us to sell potable water
in all the towns we now serve. There is the possibility that the
State of Connecticut could attempt to revoke our franchises and allow a
governmental entity to take over some or all of our systems. While we
would vigorously oppose any such attempts, from time to time such legislation is
contemplated.
The rates
we charge our water customers are established under the jurisdiction of and are
approved by the Connecticut Department of Utility Control
(“DPUC”). It is our policy to seek rate relief as necessary to enable
us to achieve an adequate rate of return. Connecticut Water’s allowed
return on equity and return on rate base are 10.125% and 8.07%,
respectively.
5
On July
23, 2008, the Company announced that it had reached a definitive agreement with
Ellington Acres Company (Ellington Acres) to purchase all of Ellington Acres’
outstanding stock for approximately $1.5 million. Ellington Acres was
a regulated water company serving approximately 750 customers in Ellington and
Somers, Connecticut, situated between two systems in the Company’s Northern
Region that the Company had planned to interconnect. The Company was
able to complete the interconnection between the systems in the second quarter
of 2009, saving ratepayers of both Connecticut Water and Ellington Acres
significant capital expenditures. The DPUC approved the acquisition
in December 2008 and the Company completed the transaction on January 16,
2009. The Company merged Ellington Acres with and into Connecticut
Water during 2009.
On
October 10, 2008, the Company filed its Infrastructure Assessment Report (IAR)
under the Water Infrastructure and Conservation Adjustment (WICA) Act which was
passed into law in 2007. WICA allows the Company to add a surcharge
to customers’ bills, subject to an expedited review and approval by the DPUC, to
reflect the costs of replacement of certain types of aging utility
plant. The purpose of the IAR is to clearly define the criteria for
determining the priority of future replacement projects. The Company
received approval of its IAR from the DPUC on March 26, 2009. The
Company filed for a 1% surcharge under the WICA mechanism on April 24,
2009. On July 1, 2009, the Company was approved to add a 0.95% WICA
surcharge on customers’ bills issued on and after July 2, 2009.
On April
30, 2009, the Company filed with the DPUC an agreement negotiated by and between
the Company and the Office of Consumer Counsel to accomplish three
goals: First, a request to equalize depreciation rates across
divisions, which would lower Depreciation Expense, resulting in a temporary
1.84% reduction of rates for all Connecticut Water customers, during the period
July 1 through December 31, 2009. Secondly, an increase in allowed
Operation and Maintenance expense equal to the 1.84% of the Company’s previously
allowed revenue requirements, effective January 1, 2010. Finally, an
extension of the “stay out” period such that Connecticut Water would not file a
new general rate adjustment prior to January 1, 2010, which would result in new
rates prior to July 1, 2010. The net effect of these three items is a
reduction in Depreciation Expense, offset by a temporary rate reduction of 1.84%
for the last six months of 2009, and a delay of at least six months in
Connecticut Water’s next general rate filing. Effective January 1,
2010, the Company’s rates reverted to the rates that were in effect during the
first half of 2009. The DPUC approved the agreement on July 1, 2009
and the new rates took effect at that time.
On August
25, 2009, the Company completed the acquisition of a small water system serving
a condominium complex in the Town of Madison, CT that was found to have uranium
levels above established standards. By acquiring the system, the
Company was able to solve a problem for the condominium residents and to assist
the Town of Madison, CT in addressing uranium found in the water of two public
schools adjacent to the system. The Company has already installed the
treatment system necessary to remove the uranium from the system and was able to
connect to the schools prior to the start of the school year. Due to
the contamination issues, the Company acquired the system for a nominal
fee. The acquisition added the equivalent of approximately 120
customers to the Company.
On
October 29, 2009, the Company filed its second WICA application with the DPUC,
requesting a 2.15% surcharge to customers’ bills, inclusive of the 0.95%
surcharge approved in July 2009. The surcharges can be placed on
customers’ bills at the start of a calendar quarter following the receipt of
DPUC approval. The DPUC approved a cumulative WICA surcharge of 2.1%
on December 23, 2009. The surcharge mechanism became effective
January 1, 2010.
On
January 6, 2010, the Company’s regulated water subsidiary, The Connecticut Water
Company, filed a rate application with the DPUC, requesting a multi-year
increase totaling $19.1 million, over a three year period. The
Company has proposed options for regulatory consideration, including a
multi-year phase-in of rates that, if approved, would be a first in Connecticut
for water utilities. In addition to the phased-in rate increase, the
Company is also seeking a Water Conservation Adjustment Mechanism (“WCAM”), to
allow the Company to continue to aggressively promote water conservation in an
effective manner while addressing the financial impact of increased conservation
by its customers. The WCAM seeks to minimize the effects of
conservation on the Company’s revenues through a recovery mechanism that would
be limited to a change in non-weather related residential sales, while at the
same time allowing for the promotion of conservation to the benefit of customers
and the environment, usually two opposing concerns. In addition to
the conservation efforts that have impacted sales, the need for an increase in
rates is, in part, based upon an investment of approximately $62 million in Net
Utility Plant since 2006, the last time the Company filed a general rate
increase. In addition, increased operating costs for labor, employee
benefits and other general operating needs, including chemicals, is being
requested. No assurance can be given that the DPUC will approve any
or all of the rate relief, the phased-in approach or the WCAM requested by the
Company. The Company expects a decision in this rate case in July
2010, with new rates effective at that time.
On
February 16, 2010, the Company announced the acquisition of the assets of water
systems in Killingworth and Mansfield, Connecticut. These
acquisitions added approximately 500 customers to the Company. The
system acquired in Killingworth has water quality issues that the previous
owners were unable to address. The Company will evaluate
options, obtain regulatory approval and invest in the technology necessary to
bring the system into compliance with water quality standards in effect in
Connecticut. Additionally, the Company announced that it had reached
an agreement to acquire a water system in Old Lyme, Connecticut. It
is expected, upon approval by the DPUC, that this acquisition will add
approximately 100 customers to the Company.
Our
Water Systems
Our water
infrastructure consists of 60 noncontiguous water systems in the State of
Connecticut. Our system, in total, consists of approximately 1,500
miles of water main and reservoir storage capacity of 7.0 billion gallons. The
safe, dependable yield from our 208 active wells and 18 reservoirs is
approximately 54 million gallons per
day. Water sources vary among the individual systems, but overall
approximately 34% of the total dependable yield comes from reservoirs and 66%
from wells.
For the
year-ended December 31, 2009, Connecticut Water’s 88,534 customers consumed
approximately 6.5 billion gallons of water generating $59,391,000 in
revenue. We supply water, and in most cases, fire protection to all
or portions of 54 towns in Connecticut.
6
The
following table breaks down the above total figures by customer class as of
December 31, 2009, 2008 and 2007:
|
2009
|
2008
|
2007
|
||||||||||
|
Customers:
|
||||||||||||
|
Residential
|
78,820 | 78,254 | 75,579 | |||||||||
|
Commercial
|
5,690 | 5,646 | 5,532 | |||||||||
|
Industrial
|
425 | 425 | 426 | |||||||||
|
Public
Authority
|
608 | 606 | 602 | |||||||||
|
Fire
Protection
|
1,705 | 1,648 | 1,599 | |||||||||
|
Other
(including non-metered accounts)
|
1,286 | 782 | 680 | |||||||||
|
Total
|
88,534 | 87,361 | 84,418 | |||||||||
|
Water Revenues (in
thousands):
|
||||||||||||
|
Residential
|
$ | 36,471 | $ | 37,963 | $ | 38,354 | ||||||
|
Commercial
|
6,729 | 7,150 | 6,762 | |||||||||
|
Industrial
|
1,459 | 1,822 | 1,764 | |||||||||
|
Public
Authority
|
1,926 | 2,027 | 1,924 | |||||||||
|
Fire
Protection
|
10,958 | 10,606 | 9,482 | |||||||||
|
Other
(including non-metered accounts)
|
1,848 | 1,702 | 740 | |||||||||
|
Total
|
$ | 59,391 | $ | 61,270 | $ | 59,026 | ||||||
|
Customer Water
Consumption (millions of
gallons):
|
||||||||||||
|
Residential
|
4,737 | 4,954 | 5,186 | |||||||||
|
Commercial
|
1,078 | 1,180 | 1,259 | |||||||||
|
Industrial
|
306 | 396 | 423 | |||||||||
|
Public
Authority
|
351 | 365 | 389 | |||||||||
|
Total
|
6,472 | 6,895 | 7,257 | |||||||||
Connecticut
Water owns various small, discrete parcels of land that are no longer required
for water supply purposes. At December 31, 2009, this land totaled
approximately 490 acres. Over the past several years, we have been
disposing of these land parcels. For more information, please refer to Segments of Our Business
below.
Additional
information on land dispositions can be found in Item 7 – Management’s
Discussion and Analysis of Financial Conditions and Results of Operations –
Commitments and Contingencies.
Competition
Connecticut
Water faces competition from a few small privately-owned water systems operating
within, or adjacent to, our franchise areas and from municipal and public
authority systems whose service areas in some cases overlap portions of our
franchise areas.
Employees
As of
December 31, 2009, we employed a total of 225 persons, a decrease of one
employee over December 31, 2008. Our employees are not covered by
collective bargaining agreements.
7
Executive
Officers of the Registrant
The
following is a list of the executive officers of the Company:
|
Name
|
Age
in 2010*
|
Office
|
Period
Held or Prior Position
|
Term
of Office Expires
|
||||
|
E.
W. Thornburg
|
49
|
Chairman,
President, and Chief Executive Officer
|
Held
position since March 2006
|
2009
Annual Meeting
|
||||
|
D.
C. Benoit
|
53
|
Vice
President – Finance, Chief Financial Officer and Treasurer
|
Held
current position or other executive position with the Company since April
1996
|
2009
Annual Meeting
|
||||
|
T.
P. O’Neill
|
55
|
Vice
President – Service Delivery
|
Held
current position or other engineering position with the Company since
February 1980
|
2009
Annual Meeting
|
||||
|
M.
P. Westbrook
|
51
|
Vice
President – Customer and Regulatory Affairs
|
Held
current position or other management position with the Company since
September 1988
|
2009
Annual Meeting
|
||||
|
T.
R. Marston
|
57
|
Vice
President – Business Development
|
Held
current position or other position with the Company since June
1974
|
2009
Annual Meeting
|
||||
|
D.
J. Meaney
|
49
|
Corporate
Secretary
|
Held
current position or other communications position with the Company since
August 1994
|
2009
Annual Meeting
|
||||
|
K.
A. Johnson
|
43
|
Vice
President – Human Resources
|
Held
current position or other human resources position with the Company since
May 2007
|
2009
Annual Meeting
|
* - Age
shown is as of filing date of March 15, 2010.
For
further information regarding the executive officers see the Company’s Proxy
Statement dated March 31, 2010.
Segments
of Our Business
For
management and financial reporting purposes we divide our business into three
segments: Water Activities, Real Estate Transactions, and Services and
Rentals.
Water Activities – The Water
Activities segment is comprised of our core regulated water activities to supply
public drinking water to our customers. This segment encompasses all
transactions of our regulated water company with the exception of certain real
estate transactions.
Real Estate Transactions – Our
Real Estate Transactions segment involves the sale or donation for income tax
benefits of our real estate holdings. These transactions can be
effected by any of our subsidiary companies. Through land donations
and discount sales in previous years, the Company earned tax credits to use in
future years. The Company is limited by time and the amount of
taxable income when using these credits. Each year, the Company
assesses its ability to use these credits going forward and makes adjustments to
its valuation allowances, accordingly. During 2009, the Company
completed the sale of a conservation easement of approximately 200 acres to the
Town of Windsor Locks, CT. Additionally, the Company made adjustments
to tax valuation allowances associated with land donations made in previous
years. Finally, Chester Realty sold a non-regulated rental property
in Killingly, CT for a small profit. The Company currently has no
other specific plans for land transactions in 2010 and beyond.
During
2008, the Company did not sell any land; however, the Company did make
adjustments to valuation allowances for land sold in prior
periods. During 2007, the Company engaged in two land transactions
totaling 33 acres and increased its valuation allowance, resulting in a net
profit of $167,000.
A
breakdown of the net income of this segment between our regulated and
unregulated companies for the past three years is as follows:
|
Income
(Loss) from Real Estate Transactions from Continuing
Operations
|
||||||||||||
|
Regulated
|
Unregulated
|
Total
|
||||||||||
|
2009
|
$ | 1,427,000 | $ | 22,000 | $ | 1,449,000 | ||||||
|
2008
|
$ | (160,000 | ) | -- | $ | (160,000 | ) | |||||
|
2007
|
$ | 199,000 | $ | (32,000 | ) | $ | 167,000 | |||||
Services and Rentals – Our
Services and Rentals segment provides contracted services to water and
wastewater utilities and other clients and also leases certain of our properties
to third parties through our unregulated companies. The types of
services provided include contract operations of water and wastewater
facilities; Linebacker®, our
service line protection plan for public drinking water customers; and providing
bulk deliveries of emergency drinking water to businesses and residences via
tanker truck. Our lease and rental income comes primarily from the
renting of residential and commercial property.
8
Linebacker® is an optional service line protection program offered by the Company to eligible residential and commercial customers through NEWUS covering the cost of repairs for leaking or broken water service lines which provide the drinking water to a customer’s home or business. For customers who enroll in this program, the Company will repair or replace a leaking or broken water service line, curb box, curb box cover, meter pit, meter pit cover, meter pit valve plus in-home water main shut off valve before the meter. The program does not cover non-standard items such as pressure reducing valves, booster pumps, and lawn and/or fire sprinkler protection systems. The Linebacker® program costs $70 per year for residential customers and $96 per year for commercial customers. The program has no deductible or limits on number or cost of leaks repaired each year. As of December 31, 2009 and 2008, the Company had 22,171 and 21,670 customers enrolled in its Linebacker® protection program, respectively.
Some of
the services listed above, including the service line protection plan, have
little or no competition. But there can be considerable competition
for contract operations of large water and wastewater facilities and
systems. However, we have sought to develop a niche market by seeking
to serve smaller facilities and systems in our service areas where there is less
competition. The Services and Rentals segment, while still a
relatively small portion of our overall business, has grown significantly over
the past five years and now provides approximately 9% of our overall net income
in 2009. Net income generated by this segment of our business was
$929,000, $790,000 and $651,000 for the years 2009, 2008 and 2007,
respectively.
Our
business, financial condition, operating results and cash flows can be impacted
by a number of factors, including, but not limited to, those set forth below,
any one of which could cause our actual results to vary materially from recent
results or anticipated future results. For a discussion identifying additional
risk factors and important factors that could cause actual results to differ
materially from those anticipated, see the discussion in “Forward Looking
Information” in Item 7 below – “Management’s Discussion and Analysis of
Financial Condition and Results of Operations” and “Notes to Consolidated
Financial Statements.”
Because
we incur significant capital expenditures annually, we depend on the rates we
charge our customers.
The water
utility business is capital intensive. On an annual basis, we spend significant
sums for additions to or replacement of property, plant and equipment. Our
ability to maintain and meet our financial objectives is dependent upon the
rates we charge our customers. These rates are subject to approval by the
DPUC. The Company is entitled to file rate increase requests, from
time to time, to recover our investments in utility plant and expenses. Once a
rate increase petition is filed with the DPUC, the ensuing administrative and
hearing process may be lengthy and costly. We can provide no
assurances that any future rate increase requests will be approved by the DPUC,
including the rate application applied for on January 6, 2010; and, if approved,
we cannot guarantee that any such rate increase requests will be granted in a
timely or sufficient manner to cover the investments and expenses for which we
initially sought the rate increase. Additionally, the DPUC may rule
that a company must reduce its rates.
Under a
2007 law, the DPUC may authorize regulated water companies to use a rate
adjustment mechanism, known as a Water Infrastructure and Conservation
Adjustment (WICA), for eligible projects completed and in service for the
benefit of the customers. For more information related to WICA,
please refer to the “Executive Overview” found in Item 7 of this Form
10-K.
If
we are unable to pay the principal and interest on our indebtedness as it comes
due, or we default under certain other provisions of our loan documents, our
indebtedness could be accelerated and our results of operations and financial
condition could be adversely affected.
As of
December 31, 2009, we had $112.0 million in long-term debt outstanding and $25.0
million in bank loans payable. Our ability to pay the principal and
interest on our indebtedness as it comes due will depend upon our current and
future performance. Our performance is affected by many factors, some
of which are beyond our control. We believe that our cash generated
from operations, and, if necessary, borrowing under our existing and planned
credit facilities, will be sufficient to enable us to make our debt payments as
they become due. If, however, we do not generate sufficient cash, we
may be required to refinance our obligations or sell additional equity, which
may be on terms that are not favorable to the Company as current
terms.
No
assurance can be given that any refinancing or sale of equity will be possible
when needed or that we will be able to negotiate acceptable terms. In
addition, our failure to comply with certain provisions contained in our trust
indentures and loan agreements relating to our outstanding indebtedness could
lead to a default on these documents, which could result in an acceleration of
our indebtedness.
Credit
market volatility may affect our ability to refinance our existing debt, borrow
funds under our existing lines of credit or incur additional debt.
The
credit market volatility lessened in the second half of 2009. During
certain periods over the past two years, the volatility and disruption reached
unprecedented levels. In many cases, the markets contained limited
credit capacity for certain issuers, and lenders had requested shorter
terms. The market for new debt financing was limited and in some
cases not available at all. In addition, the markets had increased
the uncertainty that lenders will be able to comply with their previous
commitments. The Company noted improvements during the second half of
2009. If market disruption and volatility return, the Company may not
be able to refinance our existing debt when it comes due, draw upon our existing
lines of credit or incur additional debt, which may require us to seek other
funding sources to meet our liquidity needs or to fund our capital expenditures
budget. We cannot assure you that we will be able to obtain debt or
other financing on reasonable terms, or at all.
Failure
to maintain our existing credit ratings could affect our cost of funds and
related margins and liquidity position.
Since
2003, Standard & Poor's Ratings Services has rated our outstanding debt and
has given credit ratings to us and our subsidiary The Connecticut Water
Company. Their evaluations are based on a number of factors, which
include financial strength as well as transparency with rating agencies and
timeliness of financial reporting. On August 28, 2009, Standard &
Poor's Ratings Services reaffirmed their ‘A’ credit rating on the Connecticut
Water Service and The Connecticut Water Company, both with an outlook of
"stable". In light of the difficulties in the financial services
industry and the difficult financial markets, however, there can be no assurance
that we will be able to maintain our current strong credit
ratings. Failure to do so could adversely affect our cost of funds
and related margins and liquidity position.
9
Market
disruptions caused by the worldwide financial crisis could affect our ability to
meet our liquidity needs at reasonable cost and our ability to meet long-term
commitments, which could adversely affect our financial condition and results of
operations.
During
2009, the Company increased its lines of credit from $21 million to $40
million. We rely on our revolving credit facilities and the capital
markets to satisfy our liquidity needs. A return to disruptions in the credit
markets or further deterioration of the banking industry’s financial condition,
may discourage or prevent lenders from meeting their existing lending
commitments, extending the terms of such commitments or agreeing to new
commitments. Market disruptions may also limit our ability to issue debt
securities in the capital markets.
Our
inability to comply with debt covenants under our credit facilities could result
in prepayment obligations.
We are
obligated to comply with debt covenants under our loan and debt
agreements. Failure to comply with covenants under our credit
facilities could result in an event of default, which if not cured or waived,
could result in us being required to repay or finance these borrowings before
their due date, could limit future borrowings, and result in cross default
issues and increase borrowing costs. The covenants are normal and
customary in bank and loan agreements. The Company was in compliance
with the covenants at December 31, 2009.
Market
conditions may unfavorably impact the value of our benefit plan assets and
liabilities which then could require significant additional
funding.
The
performance of the capital markets affects the values of the assets that are
held in trust to satisfy future obligations under the Company’s pension and
postretirement benefit plans and could significantly impact our results of
operations and financial position. As detailed in the Notes to
Consolidated Financial Statements, the Company has significant obligations in
these areas and the Company holds significant assets in these
trusts. These assets are subject to market fluctuations, which may
affect investment returns, which may fall below the Company’s projected return
rates. A decline in the market value of the pension and
postretirement benefit plan assets will increase the funding requirements under
the Company’s pension and postretirement benefit plans if the actual asset
returns do not recover these declines in value. Additionally, the
Company’s pension and postretirement benefit plan liabilities are sensitive to
changes in interest rates. As interest rates decrease, the
liabilities increase, potentially increasing benefit expense and funding
requirements. Further, changes in demographics, including increased
numbers of retirements or changes in life expectancy assumptions may also
increase the funding requirements of the obligations related to the pension and
other postretirement benefit plans. Also, future increases in pension
and other postretirement costs as a result of reduced plan assets may not be
fully recoverable from our customers, and our the results of operations and
financial position of the Company could be negatively affected.
Our
operating costs could be significantly increased because of state and federal
environmental and health and safety laws and regulations.
Our water
and wastewater operations are governed by extensive federal and state
environmental protection and health and safety laws and regulations, including
the federal Safe Drinking Water Act, the Clean Water Act and similar state laws,
and federal and state regulations issued under these laws by the U.S.
Environmental Protection Agency and state environmental regulatory
agencies. These laws and regulations establish, among other things,
criteria and standards for drinking water and for discharges into the waters of
the United States and/or Connecticut. Pursuant to these laws, we are required to
obtain various environmental permits from environmental regulatory agencies for
our operations. We cannot assure that we have been or will be at all
times in full compliance with these laws, regulations and permits. If we violate
or fail to comply with these laws, regulations or permits, we could be fined or
otherwise sanctioned by regulators.
Environmental
laws and regulations are complex and change frequently. These laws,
and the enforcement thereof, have tended to become more stringent over
time. While we have budgeted for future capital and operating
expenditures to maintain compliance with these laws and our permits, it is
possible that new or stricter standards could be imposed that will raise our
operating costs. Although these costs may be recovered in the form of
higher rates, there can be no assurance that the DPUC would approve rate
increases to enable us to recover such costs. In summary, we cannot
be assured that our costs of complying with, or discharging liabilities under,
current and future environmental and health and safety laws will not adversely
affect our business, results of operations or financial condition.
Climate
change laws and regulations may be adopted that could require compliance with
greenhouse gas emissions standards and other climate change initiatives.
Additional capital expenditures could be required and our operating costs could
be increased in order to comply with new regulatory standards imposed by federal
and state environmental agencies.
Climate
change is receiving ever increasing attention worldwide. Many
scientists, legislators, and others attribute global warming to increased levels
of greenhouse gases, including carbon dioxide, which has led to significant
legislative and regulatory efforts to limit greenhouse gas
emissions. Possible new climate change laws and regulations, if
enacted, may require us to monitor and/or change our utility
operations. It is possible that new standards could be imposed that
will require additional capital expenditures or raise our operating
costs. Because it is uncertain what laws will be enacted, we cannot
predict the potential impact of such laws on our future consolidated financial
condition, results of operations, or cash flows. Although these
expenditures and costs may be recovered in the form of higher rates, there can
be no assurance that the various state public utility commissions or similar
regulatory bodies that govern our business would approve rate increases to
enable us to recover such expenditures and costs. We cannot assure
you that our costs of complying with new standards or laws will not adversely
affect our business, results of operations or financial condition.
New
streamflow regulations could potentially impact our ability to serve our
customers.
The
Connecticut Department of Environmental Protection is seeking to promulgate new
regulations relative to the flow of water in the State’s rivers and streams and
we are assessing the impact that any such regulation would have on our
operations, capital requirements and our ability to serve our customers with
sufficient quantities of water. It is uncertain if the State will
adopt the streamflow rule as it is currently drafted. However, any
new streamflow regulation has the potential to restrict our access to water,
raise our capital and operating expenses and adversely affect our revenues and
earnings. Although these costs may be recovered in the form of higher
rates, there can be no assurance the DPUC would approve rate increases to enable
us to recover such costs.
Our
business is subject to seasonal fluctuations which could adversely affect demand
for our water services and our revenues.
Demand
for our water during the warmer months is generally greater than during cooler
months due primarily to additional requirements for water in connection with
irrigation systems, swimming pools, cooling systems and other outside water use.
Throughout the year, and particularly during typically warmer months, demand
will vary with temperature and rainfall levels. In the event that temperatures
during the typically warmer months are cooler than normal, or if there is more
rainfall than normal, the demand for our water may decrease and adversely affect
our revenues.
10
Declining
per customer residential water usage may reduce our revenues, financial
condition and results of operations in future years.
A trend
of declining per customer residential water usage in Connecticut has been
observed for the last several years, which we would attribute to increased water
conservation, including the use of more efficient household fixtures and
appliances among residential users. Our regulated business is heavily
dependent on revenue generated from rates we charge to our residential customers
for the volume of water they use. The rate we charge for our water is
regulated by the DPUC and we may not unilaterally adjust our rates to reflect
changes in demand. Declining volume of residential water usage may
have a negative impact on our operating revenues in the future if regulators do
not reflect any usage declines in the rate setting design process.
Potential
regulatory changes or drought conditions may impact our ability to serve our
current and future customers’ demand for water and our financial
results.
We depend
on an adequate water supply to meet the present and future demands of our
customers. Changes in regulatory requirements could affect our
ability to utilize existing supplies and/or secure new sources, as
required. Insufficient supplies or an interruption in our water
supply could have a material adverse effect on our financial condition and
results of operations. Although not occurring in 2009, drought
conditions could interfere with our sources of water supply and could adversely
affect our ability to supply water in sufficient quantities to our existing and
future customers. An interruption in our water supply could have a material
adverse effect on our financial condition and results of
operations. Moreover, governmental restrictions on water usage during
drought conditions may result in a decreased demand for our water, even if our
water reserves are sufficient to serve our customers during these drought
conditions, which may adversely affect our revenues and earnings.
We
are increasingly dependent on the continuous and reliable operation of our
information technology systems.
We rely
on our information technology systems in connection with the operation of our
business, especially with respect to customer service and billing, accounting
and, in some cases, the monitoring and operation of our treatment, storage and
pumping facilities. A loss of these systems or major problems with
the operation of these systems could affect our operations and have a
significant material adverse effect on our results of operations.
The
failure of, or the requirement to repair, upgrade or dismantle, any of our dams
may adversely affect our financial condition and results of
operations.
We own
and operate 32 dams throughout the state of Connecticut. While the
Company maintains robust dam maintenance and inspection programs, a failure of
any of those dams could result in injuries and damage to residential and/or
commercial property downstream for which we may be responsible, in whole or in
part. The failure of a dam could also adversely affect our ability to
supply water in sufficient quantities to our customers and could adversely
affect our financial condition and results of operations. Any losses
or liabilities incurred due to the failure of one of our dams might not be
covered by insurance policies or be recoverable in rates, and such losses may
make it difficult for us to secure insurance in the future at acceptable
rates.
Any
failure of our reservoirs, storage tanks, mains or distribution networks could
result in losses and damages that may affect our financial condition and
reputation.
Connecticut
Water distributes water through an extensive network of mains and stores water
in reservoirs and storage tanks located across Connecticut. A failure
of major mains, reservoirs, or tanks could result in injuries and damage to
residential and/or commercial property for which we may be responsible, in whole
or in part. The failure of major mains, reservoirs or tanks may also
result in the need to shut down some facilities or parts of our water
distribution network in order to conduct repairs. Such failures and
shutdowns may limit our ability to supply water in sufficient quantities to our
customers and to meet the water delivery requirements prescribed by governmental
regulators, including the DPUC, and adversely affect our financial condition,
results of operations, cash flow, liquidity and reputation. Any
business interruption or other losses might not be covered by insurance policies
or be recoverable in rates, and such losses may make it difficult for us to
secure insurance in the future at acceptable rates.
Any
future acquisitions we may undertake may involve risks and
uncertainties.
An
important element of our growth strategy is the acquisition and integration of
water systems in order to move into new service areas and to broaden our current
service areas. Since the beginning of 2008, we have acquired five
water systems. As of the date of this filing, which includes small
acquisitions completed after December 31, 2009, the Connecticut Water Company
now serves more than 88,000 customers, or a population of over 300,000 people,
in 55 Connecticut towns. We will not be able to acquire other
businesses if we cannot identify suitable acquisition opportunities or reach
mutually agreeable terms with acquisition candidates. It is our
intent, when practical, to integrate any businesses we acquire with our existing
operations. The negotiation of potential acquisitions as well as the
integration of acquired businesses could require us to incur significant costs
and cause diversion of our management's time and resources. Future
acquisitions by us could result in:
|
·
|
dilutive
issuances of our equity securities;
|
|
·
|
incurrence
of debt and contingent liabilities;
|
|
·
|
failure
to have effective internal control over financial
reporting;
|
|
·
|
fluctuations
in quarterly results; and
|
|
·
|
other
acquisition-related expenses.
|
Some or
all of these items could have a material adverse effect on our business as well
as our ability to finance our business and comply with regulatory
requirements. The businesses we acquire in the future may not achieve
sales and profitability that would justify our investment and any difficulties
we encounter in the integration process, including in the integration of
controls necessary for internal control and financial reporting, could interfere
with our operations, reduce our operating margins and adversely affect our
internal controls. In addition, as consolidation becomes more
prevalent in the water and wastewater industries, the prices for suitable
acquisition candidates may increase to unacceptable levels and limit our ability
to grow through acquisitions.
Water
supply contamination may adversely affect our business.
Our water
supplies are subject to contamination, including contamination from the
development of naturally-occurring compounds, chemicals in groundwater systems,
pollution resulting from man-made sources, such as Methyl Tertiary Butyl
Ether (MTBE), and
possible terrorist attacks. In the event that our water supply is contaminated,
we may have to interrupt the use of that water supply until we are able to
substitute the flow of water from an uncontaminated water source or provide
additional treatment. We may incur significant costs in order to
treat the contaminated source through expansion of our current treatment
facilities, or development of new treatment methods. If we are unable
to substitute water supply from an uncontaminated water source, or to adequately
treat the contaminated water source in a cost-effective manner, there may be an
adverse effect on our revenues, operating results and financial
condition. The costs we incur to decontaminate a water source or an
underground water system could be significant and could adversely affect our
business, operating results and financial condition and may not be recoverable
in rates. We could also be held liable for consequences arising out
of human exposure to hazardous substances in our water supplies or other
environmental damage. For example, private plaintiffs have the right
to bring personal injury or other toxic tort claims arising from the presence of
hazardous substances in our drinking water supplies. Our insurance
policies may not be sufficient to cover the costs of these claims.
11
The
need to increase security may continue to increase our operating
costs.
In
addition to the potential pollution of our water supply as described above, we
have taken steps to increase security measures at our facilities and heighten
employee awareness of threats to our water supply. We have also
tightened our security measures regarding the delivery and handling of certain
chemicals used in our business. We have and will continue to bear
increased costs for security precautions to protect our facilities, operations
and supplies. These costs may be significant. We are currently not
aware of any specific threats to our facilities, operations or supplies;
however, it is possible that we would not be in a position to control the
outcome of terrorist events should they occur.
The
accuracy of our judgments and estimates about financial and accounting matters
will impact our operating results and financial condition.
We make
certain estimates and judgments in preparing our financial statements regarding,
among others:
|
·
|
the
number of years to depreciate certain
assets;
|
|
·
|
amounts
to set aside for uncollectible accounts receivable, inventory obsolescence
and uninsured losses;
|
|
·
|
our
legal exposure and the appropriate accrual for claims, including medical
and workers’ compensation claims;
|
|
·
|
future
costs for pensions and other post-retirement benefit obligations,
and;
|
|
·
|
possible
tax allowances.
|
The
quality and accuracy of those estimates and judgments will have an impact on our
operating results and financial condition.
In
addition, we must estimate unbilled revenues and costs at the end of each
accounting period. If our estimates are not accurate, we will be
required to make an adjustment in a future period.
Key
employee turnover may adversely affect our operating results.
Our
success depends significantly on the continued individual and collective
contributions of our management team. The loss of the services of any member of
our senior management team or the inability to hire and retain experienced
management personnel could harm our operating results.
None
The
properties of our regulated water company consist of land, easements, rights
(including water rights), buildings, reservoirs, standpipes, dams, wells, supply
lines, treatment plants, pumping plants, transmission and distribution mains and
conduits, mains and other facilities and equipment used for the collection,
purification, storage and distribution of water. In certain cases,
our water company may be a party to limited contractual arrangements for the
provision of water supply from neighboring utilities. We believe that
our properties are in good operating condition. Water mains are
located, for the most part, in public streets and, in a few instances, are
located on land that we own in fee simple and/or land utilized pursuant to
easement right, most of which are perpetual and adequate for the purpose for
which they are held.
The net
utility plant of the Company at December 31, 2009 was solely owned by
Connecticut Water. Connecticut Water’s net utility plant balance as
of December 31, 2009 was $325,202,000, approximately $26 million more than the
balance of net utility plant as of December 31, 2008, due primarily to normal
plant additions and construction spending related to infrastructure
improvements.
Sources
of water supply owned, maintained, and operated by Connecticut Water include
eighteen reservoirs and eighty-seven well fields. In addition,
Connecticut Water has agreements with various neighboring water utilities to
provide water, at negotiated rates, to our water
systems. Collectively, these sources have the capacity to deliver
approximately fifty-two million gallons of potable water daily to the thirteen
major operating systems in the following table. In addition to the principal
systems identified, Connecticut Water owns, maintains, and operates forty-seven
small, non-interconnected satellite and consecutive water systems that, combined
have the ability to deliver about two million gallons of additional water per
day to their respective systems. For some small consecutive water systems,
purchased water may comprise substantially all of the total available supply of
the system. During 2009, the Company integrated the former Ellington
Acres Water System and Somers System with and into the Western
System.
12
Connecticut
Water owns and operates 22 water filtration facilities, having a combined
treatment capacity of approximately 29.55 million gallons per day.
The
Company’s estimated available water supply, including purchased water
agreements, but excluding non-principal systems, is as follows:
|
System
|
Estimated
Available Supply
(million
gallons per day)
|
|||
|
Chester
System
|
1.69 | |||
|
Collinsville
System
|
1.65 | |||
|
Danielson
System
|
3.76 | |||
|
Gallup
System
|
0.60 | |||
|
Guilford
System
|
10.10 | |||
|
Naugatuck
System
|
6.77 | |||
|
Northern
Western System
|
16.55 | |||
|
Plainfield
System
|
1.01 | |||
|
Stafford
System
|
1.00 | |||
|
Terryville
System
|
0.91 | |||
|
Thomaston
System
|
1.73 | |||
|
Thompson
System
|
0.29 | |||
|
Unionville
System
|
6.02 | |||
|
Total
|
52.08 | |||
As of
December 31, 2009, the transmission and distribution systems of Connecticut
Water consisted of approximately 1,500 miles of main. On that date,
approximately 77 percent of our mains were eight-inch diameter or
larger. Substantially all new main installations are cement-lined
ductile iron pipe of eight-inch diameter or larger.
We
believe that our properties are maintained in good condition and in accordance
with current regulations and standards of good waterworks industry
practice.
We are
involved in various legal proceedings from time to time. Although the results of
legal proceedings cannot be predicted with certainty, there are no pending legal
proceedings to which we, or any of our subsidiaries are a party, or to which any
of our properties is subject, that presents a reasonable likelihood of a
material adverse impact on the Company’s financial condition, results of
operations or cash flows.
PART
II
Our
Common Stock is traded on the NASDAQ Global Select Market under the symbol
“CTWS”. Our quarterly high and low stock prices as reported by NASDAQ
and the cash dividends we paid during 2009 and 2008 are listed as
follows:
|
Price
|
Dividends
|
|||||||||||
|
Period
|
High
|
Low
|
Paid
|
|||||||||
|
2009
|
||||||||||||
|
First
Quarter
|
$ | 24.76 | $ | 17.31 | $ | .2225 | ||||||
|
Second
Quarter
|
22.63 | 19.31 | .2225 | |||||||||
|
Third
Quarter
|
22.86 | 20.57 | .2275 | |||||||||
|
Fourth
Quarter
|
26.45 | 21.68 | .2275 | |||||||||
|
2008
|
||||||||||||
|
First
Quarter
|
$ | 25.48 | $ | 23.00 | $ | .2175 | ||||||
|
Second
Quarter
|
24.98 | 21.82 | .2175 | |||||||||
|
Third
Quarter
|
28.95 | 22.28 | .2225 | |||||||||
|
Fourth
Quarter
|
28.71 | 19.26 | .2225 | |||||||||
As of
March 1, 2010, there were approximately 3,900 holders of record of our common
stock.
We
presently intend to pay quarterly cash dividends in 2010 on March 15, June 15,
September 15 and December 15, subject to our earnings and financial condition,
regulatory requirements and other factors our Board of Directors may deem
relevant.
The
Company’s Annual Meeting of Shareholders is scheduled for May 14, 2010 in
Groton, Connecticut.
Purchases of Equity Securities by the
Company – In May 2005, the Company adopted a common stock repurchase
program (Share Repurchase Program). The Share Repurchase Program
allows the Company to repurchase up to 10% of its outstanding common stock, at a
price or prices that are deemed appropriate. As of December 31, 2009,
no shares have been repurchased. Currently, the Company has no plans
to repurchase shares under the Share Repurchase Program.
13
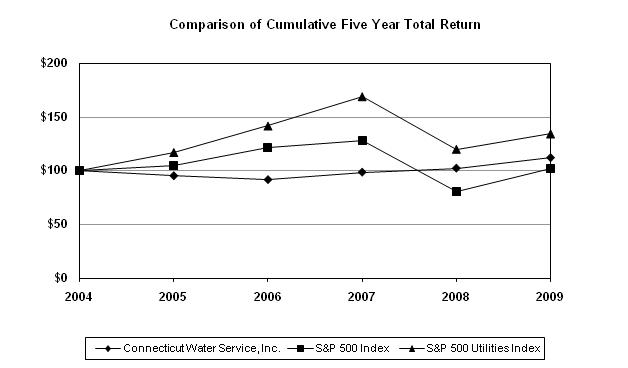
Performance Graph – Set forth
below is a line graph comparing the cumulative total shareholder return for each
of the years 2004 – 2009 on the Company’s Common Stock, based on the market
price of the Common Stock and assuming reinvestment of dividends, with the
cumulative total shareholder return of companies in the Standard & Poor’s
500 Index and the Standard and Poor’s 500 Utility Index.
|
2004
|
2005
|
2006
|
2007
|
2008
|
2009
|
|||||||||||||||||||
|
Connecticut
Water Service, Inc.
|
100.00 | 95.65 | 92.12 | 98.94 | 102.64 | 112.26 | ||||||||||||||||||
|
Standard
& Poor’s 500 Index
|
100.00 | 104.91 | 121.48 | 128.16 | 80.74 | 102.11 | ||||||||||||||||||
|
Standard
& Poor’s 500 Utilities Index
|
100.00 | 116.84 | 141.36 | 168.76 | 119.85 | 134.12 | ||||||||||||||||||
(Source: Standard
& Poor’s Institutional Market Service)
14
|
SELECTED
FINANCIAL DATA
|
||||||||||||||||||||
|
Years
Ended December 31, (thousands of dollars except per share
|
||||||||||||||||||||
|
amounts
and where otherwise indicated)
|
2009
|
2008
|
2007
|
2006
|
2005
|
|||||||||||||||
|
CONSOLIDATED
STATEMENTS OF INCOME
|
||||||||||||||||||||
|
Continuing
Operations
|
||||||||||||||||||||
|
Operating
Revenues
|
$ | 59,391 | $ | 61,270 | $ | 59,026 | $ | 46,945 | $ | 47,453 | ||||||||||
|
Operating
Expenses
|
$ | 47,003 | $ | 47,874 | $ | 46,324 | $ | 39,962 | $ | 37,486 | ||||||||||
|
Other
Utility Income, Net of Taxes
|
$ | 704 | $ | 579 | $ | 552 | $ | 542 | $ | 571 | ||||||||||
|
Total
Utility Operating Income
|
$ | 13,092 | $ | 13,975 | $ | 13,254 | $ | 7,525 | $ | 10,538 | ||||||||||
|
Interest
and Debt Expense
|
$ | 4,744 | $ | 5,198 | $ | 4,411 | $ | 4,461 | $ | 3,583 | ||||||||||
|
Net
Income
|
$ | 10,209 | $ | 9,424 | $ | 8,781 | $ | 6,708 | $ | 7,166 | ||||||||||
|
Cash
Common Stock Dividends Paid
|
$ | 7,671 | $ | 7,373 | $ | 7,146 | $ | 7,014 | $ | 6,773 | ||||||||||
|
Dividend
Payout Ratio from Continuing Operations
|
75 | % | 78 | % | 81 | % | 105 | % | 95 | % | ||||||||||
|
Weighted
Average Common Shares Outstanding
|
8,447,950 | 8,377,428 | 8,270,494 | 8,187,801 | 8,094,346 | |||||||||||||||
|
Basic
Earnings Per Common Share from Continuing Operations
|
$ | 1.20 | $ | 1.12 | $ | 1.06 | $ | 0.81 | $ | 0.89 | ||||||||||
|
Number
of Shares Outstanding at Year End
|
8,573,744 | 8,463,269 | 8,376,842 | 8,270,394 | 8,169,627 | |||||||||||||||
|
ROE
on Year End Common Equity
|
9.4 | % | 9.1 | % | 8.8 | % | 7.0 | % | 7.6 | % | ||||||||||
|
Declared
Common Dividends Per Share
|
$ | 0.900 | $ | 0.880 | $ | 0.865 | $ | 0.855 | $ | 0.845 | ||||||||||
|
CONSOLIDATED
BALANCE SHEET
|
||||||||||||||||||||
|
Common
Stockholders' Equity
|
$ | 108,569 | $ | 103,476 | $ | 100,098 | $ | 95,938 | $ | 94,076 | ||||||||||
|
Long-Term
Debt (Consolidated, Excluding Current Maturities)
|
111,955 | 92,227 | 92,285 | 77,347 | 77,404 | |||||||||||||||
|
Preferred
Stock
|
772 | 772 | 772 | 772 | 847 | |||||||||||||||
|
Total
Capitalization
|
$ | 221,296 | $ | 196,475 | $ | 193,155 | $ | 174,057 | $ | 172,327 | ||||||||||
|
Stockholders'
Equity (Includes Preferred Stock)
|
49 | % | 53 | % | 52 | % | 56 | % | 55 | % | ||||||||||
|
Long-Term
Debt
|
51 | % | 47 | % | 48 | % | 44 | % | 45 | % | ||||||||||
|
Net
Utility Plant
|
$ | 325,202 | $ | 299,233 | $ | 277,662 | $ | 263,187 | $ | 247,703 | ||||||||||
|
Total
Assets
|
$ | 415,276 | $ | 372,431 | $ | 360,813 | $ | 328,140 | $ | 306,035 | ||||||||||
|
Book
Value - Per Common Share
|
$ | 12.66 | $ | 12.23 | $ | 11.95 | $ | 11.60 | $ | 11.52 | ||||||||||
|
OPERATING
REVENUES BY
|
||||||||||||||||||||
|
REVENUE
CLASS
|
||||||||||||||||||||
|
Residential
|
$ | 36,471 | $ | 37,963 | $ | 38,354 | $ | 29,067 | $ | 29,980 | ||||||||||
|
Commercial
|
6,729 | 7,150 | 6,762 | 5,652 | 5,619 | |||||||||||||||
|
Industrial
|
1,459 | 1,822 | 1,764 | 1,589 | 1,538 | |||||||||||||||
|
Public
Authority
|
1,926 | 2,027 | 1,924 | 1,507 | 1,625 | |||||||||||||||
|
Fire
Protection
|
10,958 | 10,606 | 9,482 | 8,708 | 8,267 | |||||||||||||||
|
Other
(Including Non-Metered Accounts)
|
1,848 | 1,702 | 740 | 422 | 424 | |||||||||||||||
|
Total
Operating Revenues
|
$ | 59,391 | $ | 61,270 | $ | 59,026 | $ | 46,945 | $ | 47,453 | ||||||||||
|
Number
of Customers (Average)
|
88,390 | 87,028 | 84,023 | 82,552 | 81,211 | |||||||||||||||
|
Billed
Consumption (Millions of Gallons)
|
6,472 | 6,895 | 7,257 | 6,918 | 7,276 | |||||||||||||||
|
Number
of Employees
|
225 | 226 | 206 | 200 | 191 | |||||||||||||||
15
FINANCIAL
CONDITION
Executive
Overview
The
Company is a non-operating holding company, whose income is derived from the
earnings of its four wholly-owned subsidiary companies: The Connecticut Water
Company (Connecticut Water), New England Water Utility Services, Inc. (NEWUS),
Chester Realty Company (Chester Realty), and Barnstable Holding Company
(Barnstable Holding).
In 2009,
approximately 77% of the Company’s net income was attributable to the water
activities of its largest subsidiary, Connecticut Water, a regulated water
utility with 88,534 customers throughout 54 Connecticut towns, as of December
31, 2009. The rates charged for service by Connecticut Water are
subject to review and approval by the Connecticut Department of Public Utility
Control (DPUC).
In the
mid 1990s, Connecticut Water made a conscious decision to minimize its reliance
on rate increase requests to drive its financial
performance. Instead, it relied upon unregulated operations and cost
containment to grow the earnings of the Company without seeking higher
rates. After a successful extended period of meeting these
objectives, it became clear in 2006 that a rate increase was needed to continue
to provide shareholder value through increased earnings. The Company
decided to return to the more traditional model of recurring rate increase
filings to efficiently collect its cost of both annual expenses and its
investment in the infrastructure of the regulated business. In 2006,
the Connecticut Water communicated to its customers, regulators and shareholders
that it expected to seek rate relief on a more recurring basis.
On
January 6, 2010, the Company’s regulated water subsidiary, The Connecticut Water
Company, filed a rate application with the DPUC, requesting a multi-year
increase totaling $19.1 million, over a three year period. The
Company has proposed options for regulatory consideration, including a
multi-year phase-in of rates that, if approved, would be a first in Connecticut
for water utilities. In addition to the phased-in rate increase, the
Company is also seeking a Water Conservation Adjustment Mechanism (“WCAM”), to
allow the Company to continue to aggressively promote water conservation in an
effective manner while addressing the financial impact of increased conservation
by its customers. The WCAM seeks to minimize the effects of
conservation on the Company’s revenues through a recovery mechanism that would
be limited to a change in non-weather related residential sales, while at the
same time allowing for the promotion of conservation to the benefit of customers
and the environment, usually two opposing concerns. In addition to
the conservation efforts that have impacted sales, the need for an increase in
rates is, in part, based upon an investment of approximately $62 million in Net
Utility Plant since 2006, the last time the Company filed a general rate
increase. In addition, increased operating costs for labor, employee
benefits and other general operating needs, including chemicals, is being
requested. No assurance can be given that the DPUC will approve any
or all of the rate relief, the phased-in approach or the WCAM requested by the
Company. The Company expects a decision in this rate case in July
2010, with new rates effective at that time.
Over the
next twenty years, the Environmental Protection Agency expects water companies
to spend over $275 billion in infrastructure costs nationwide to ensure
compliance with existing and future water regulations. Recognizing
the importance of timely infrastructure replacement and improvement, the
Company, along with other investor-owned regulated water companies in the state,
campaigned for the passage of the Water Infrastructure and Conservation
Adjustment (WICA) Act in the Connecticut General Assembly, which was adopted in
2007. WICA allows the Company to add a surcharge to customers’ bills,
subject to an expedited review and approval by the DPUC and no more than twice a
year, to reflect the replacement of certain types of aging utility plant;
principally water mains, meters, service lines and water conservation related
investments.
The
passage of the WICA legislation has helped augment the Company’s current
strategy of seeking to collect its costs of operating the regulated utility on a
timely basis through a mechanism even more efficient than a general rate filing
with the DPUC. The use of WICA minimizes the regulatory lag from the
time the Company invests in infrastructure replacement, or certain qualified
new, plant and when it can begin to recover that investment in the rates charged
to customers. On October 10, 2008, the Company filed its
Infrastructure Assessment Report (IAR) under WICA. The purpose of the
IAR is to clearly define the criteria for determining the priority of future
replacement projects. The Company received approval of its IAR from
the DPUC on March 26, 2009. The Company filed for a 1% surcharge
under the WICA mechanism on April 24, 2009. On July 1, 2009, the
Company was approved to add a 0.95% WICA surcharge on customers’ bills issued on
and after July 2, 2009.
On
October 29, 2009, the Company filed its second WICA application with the DPUC,
requesting a 2.15% surcharge to customers’ bills, inclusive of the 0.95%
surcharge approved in July 2009. The surcharges can be placed on
customers’ bills at the start of a calendar quarter following the receipt of
DPUC approval. The DPUC approved a cumulative WICA surcharge of 2.1%
on December 23, 2009. The surcharge mechanism became effective
January 1, 2010.
The
Company has and will continue to focus on minimizing operating costs that are
passed along to its customers without sacrificing the quality service it values
and the customers demand. At the same time, the Company will continue
to employ its current strategy of timely collection of appropriate costs and a
fair rate of return for its shareholders through appropriate rates for its
regulated water service. Recognizing the economic hardship seen in
Connecticut over the preceding 18 months, on April 30, 2009, the Company filed
with the DPUC an agreement negotiated by and between the Company and the Office
of Consumer Counsel to accomplish three goals: First, a request to
equalize depreciation rates across divisions, which would lower depreciation
expense, resulting in a temporary 1.84% reduction of rates for all Connecticut
Water customers, during the period July 1 through December 31,
2009. Secondly, an increase in allowed Operation and Maintenance
expense equal to the 1.84% of the Company’s previously allowed revenue
requirements, effective January 1, 2010. Finally, an extension of the
“stay out” period such that Connecticut Water would not file a new general rate
adjustment prior to January 1, 2010, which would result in new rates prior to
July 1, 2010. The net effect of these three items was a reduction in
Depreciation Expense, offset by a temporary rate reduction of 1.84% for the last
six months of 2009, and a delay of at least six months in Connecticut Water’s
next general rate filing. The DPUC approved the agreement on July 1,
2009 and the new rates took effect at that time. Effective January 1,
2010, the Company’s rates reverted to the rates that were in effect during the
first half of 2009.
The
Company prides itself on being able to help water systems that do not have the
resources to deliver the best water possible to their customers. On
August 25, 2009, the Company completed the acquisition of a small water system
serving a condominium complex in the Town of Madison, CT that was found to have
uranium levels above established standards. By acquiring the system,
the Company was able to solve a problem for the condominium residents and to
assist the Town of Madison, CT in addressing uranium found in the water of two
public schools adjacent to the system. The Company has already
installed the treatment system necessary to remove the uranium from the system
and was able to connect to the schools prior to the start of the school
year. Due to the contamination issues, the Company acquired the
system for a nominal fee. The acquisition added the equivalent of
approximately 120 customers to the Company. As discussed in Item 1,
above, the Company announced, in February 2010, the acquisition of another water
system with water quality issues in Killingworth, CT.
16
In 2010
and beyond, the Company will continue to look for acquisition candidates that we
would easily be able to “tuck-in” to existing service territories, as well as
possible acquisitions outside of our service territories, including outside the
State of Connecticut. Additionally, the Company plans to continue its
efforts to tie-in private well owners whose homes are in close proximity to our
mains. In 2009, Connecticut Water added 66 private well owners in our
existing service territories. Lastly, the Company will continue to
work with developers to encourage public water use for new residential
construction within Connecticut Water’s service areas.
While the
Company plans to file timely rate cases, continue to make acquisitions and, in
the future, utilize the WICA adjustment to allow for more timely recovery of
investment in utility plant, it will also look to NEWUS to increase its earnings
in the unregulated business. The Company will continue to seek out
maintenance and service contracts with new customers and renew existing
contracts that have proven to be beneficial to the Company, as well as to
continue the expansion of the Linebacker®
program. In January 2010, NEWUS acquired the assets of Home Service
USA. Prior to the acquisition Home Service USA offered Connecticut
Water customers coverage for failure of home plumbing and septic drainage
lines. NEWUS agreed to purchase the right to provide the service to
Connecticut Water customers and began offering its own comparable
coverage. As part of the agreement, Home Service USA will not offer
its products to Connecticut Water customers for a period of ten
years. The new products offered by NEWUS will be integrated into the
Linebacker®
program.
In 2009,
the Company completed the sale of a conservation easement on a well field
property no longer needed as a source of supply to the Town of Windsor Locks,
Connecticut for $2.0 million. Windsor Locks was awarded a grant from
the Connecticut Department of Environmental Protection to assist in purchasing
the conservation easement in order to permanently protect the approximate
200-acre property from development and guarantee public access to the land for
passive recreation. The Company filed an application with the DPUC
and submitted the draft agreement and the form of Conservation Easement to the
DPUC on April 3, 2009. The DPUC approved the transaction on September
9, 2009 and the transaction closed on September 18, 2009. The sale of
the conservation easement generated approximately $1.2 million in net income for
the Real Estate segment for the year ending December 31, 2009. The
Company currently has no other specific plans for land transactions in 2010 and
beyond.
Regulatory
Matters and Inflation
The
Company, like all other businesses, is affected by inflation, most notably by
the continually increasing costs required to maintain, improve, and expand its
service capabilities. The cumulative effect of inflation over time
results in significantly higher operating costs and facility replacement costs,
which must be recovered from future cash flows.
Connecticut
Water’s ability to recover its increased expenses and/or investment in utility
plant is dependent on the rates we charge our customers. Changes to
these rates must be approved by the DPUC through formal rate
proceedings. Due to the subjectivity of certain items involved in the
process of establishing rates such as customer usage, future customer growth,
inflation, and allowed return on investment, we have no assurance that we will
be able to raise our rates to a level we consider appropriate, or to raise rates
at all, through any future rate proceeding.
Connecticut
Water is also subject to environmental and water quality regulations, which are
continually modified and refined to ensure the safety of the Company’s water
sources and, ultimately, the public’s health. Costs to comply with
environmental and water quality regulations are substantial. The
costs to comply with future changes in state or federal regulations, which could
require us to modify current filtration facilities and/or construct new ones, or
to replace any reduction of the safe yield from any of our current sources of
supply, could be substantial. While there can be no guarantee that
all expenditures related to increased regulation will be recoverable in rate
proceedings, the Company believes that the regulatory environment in Connecticut
would allow prudent expenditures to be recovered in rates. To date,
the Company has never had any costs associated with water quality and
environmental spending refused in a general rate proceeding. The
Company believes that it is in compliance with current regulations, but the
regulations are subject to change at any time. During 2009, the
Company incurred approximately $0.8 million in capital expenditures on Safe
Drinking Water Act projects. The Company expects to spend
approximately $1.7 million on Safe Water Drinking Act projects in 2010,
primarily to bring newly acquired systems up to the Company’s
standards.
Critical
Accounting Policies and Estimates
The
Company’s consolidated financial statements are prepared in conformity with
accounting principles generally accepted in the United States of America (GAAP)
and as directed by the regulatory commissions to which the Company’s
subsidiaries are subject. (See Note 1 to the Consolidated Financial
Statements for a discussion of our significant accounting
policies). The Company believes the following policies and estimates
are critical to the presentation of its consolidated financial
statements.
Public Utility Regulation –
Financial Accounting Standards Board (“FASB”) Accounting Standards Codification
(“ASC”) 980 “Regulated Operations” (“FASB ASC 980”), requires cost-based,
rate-regulated enterprises such as Connecticut Water to reflect the impact of
regulatory decisions in their financial statements. The state
regulators, through the rate regulation process, can create regulatory assets
that result when costs are allowed for ratemaking purposes in a period after the
period in which costs would be charged to expense by an unregulated
enterprise. The balance sheet includes regulatory assets and
liabilities as appropriate, primarily related to income taxes and
post-retirement benefit costs. The Company believes, based on current
regulatory circumstances, that the regulatory assets recorded are likely to be
recovered and that its use of regulatory accounting is appropriate and in
accordance with the provisions of FASB ASC 980. Material regulatory
assets, other than deferred revenue, are earning a return.
Revenue Recognition – The
Company’s accounting policies regarding revenue recognition by segment are as
follows:
Water Activities –
Most of our water customers are billed quarterly, with the exception of larger
commercial and industrial customers, as well as public and private fire
protection customers who are billed monthly. Most customers, except
fire protection customers, are metered. Revenues from metered
customers are based on their water usage multiplied by approved, regulated rates
and are earned when water is delivered. Public fire protection
revenues are based on the length of the water main, and number of hydrants in
service and are earned on a monthly basis. Private fire protection
charges are based on the diameter of the connection to the water
main. Our water companies accrue an estimate for metered customers
for the amount of revenues earned relating to water delivered but unbilled at
the end of each quarter.
Real Estate
Transactions – Revenues are recorded when a sale or other transaction has
been completed and title to the real estate has been transferred.
Services and Rentals
– Revenues are recorded when the Company has delivered the services called for
by contractual obligation.
17
Employee Benefit Plan
Accounting – Management evaluates the appropriateness of the discount
rate through the modeling of a bond portfolio which approximates the pension and
postretirement plan liabilities. Management further considers rates
of high quality corporate bonds of approximate maturities as published by
nationally recognized rating agencies consistent with the duration of the
Company’s pension and postretirement plans.
The
discount rate assumption we use to value our pension and postretirement benefit
obligations has a material impact on the amount of expense we record in a given
period. Our 2009 and 2008 pension expense was calculated using
assumed discount rates of 6.25% and 6.30%, respectively. Our 2009 and 2008
post-retirement welfare expense was calculated using assumed discount rates of
6.20% and 6.30%, respectively. In 2010, our pension and
postretirement welfare expense will be calculated using an assumed discount rate
of 5.95% and 5.80%, respectively. The following table shows how much
a one percent change in our assumed discount rate would have changed our
reported 2009 pension and postretirement expense:
|
Increase
(Decrease) in Pension Expense
|
Increase
(Decrease) in Postretirement Expense
|
|||||||
|
1%
Increase in the discount rate
|
$ | (338,000 | ) | $ | (144,000 | ) | ||
|
1%
Decrease in the discount rate
|
$ | 392,000 | $ | 173,000 | ||||
Other
assumptions that affect the costs associated with our benefit plans include the
assumed rate of return on plan assets and the expected rate of compensation
increase. The Company has a assumed an 8% return on plan investments
and a 4.5% rate of compensation increase for our pension and post-retirement
welfare plans, in 2009 and 2008.
Outlook
The
Company’s earnings and profitability are primarily dependent upon the sale and
distribution of water, the amount of which is dependent on seasonal weather
fluctuations, particularly during the summer months when water demand will vary
with rainfall and temperature levels. The Company’s earnings and
profitability in future years will also depend upon a number of other factors,
such as the ability to maintain our operating costs at current or lower levels,
customer growth in the Company’s core regulated water utility business, growth
in revenues attributable to non-water sales operations, and the timing and
adequacy of rate relief when requested, from time to time, by our regulated
water company.
The
Company believes that the factors described above and those described in detail
below under the heading “Commitments and Contingencies” may have significant
impact, either alone or in the aggregate, on the Company’s earnings and
profitability in fiscal years 2010 and beyond. Please also review
carefully the risks and uncertainties described in Item 1A – Risk Factors and
those described above under the heading “Special Note Regarding Forward Looking
Information”.
Based
upon the Company’s need to seek a rate increase, and the timing of an increase,
if granted, the Company can not characterize its expectations for Net Income in
2010 when compared to 2009. The Company will likely have the ability
to better gauge its 2010 financial results at the conclusion of the rate
proceeding, which is expected in the second quarter of 2010. During
2010 and subsequent years, the ability of the Company to maintain and increase
its Net Income will principally depend upon the effect on the Company of the
factors described above in this “Outlook” section, those factors described in
the section entitled “Commitments and Contingencies” and the risks and
uncertainties described in the “Special Note Regarding Forward-Looking
Statements” and Item 1A – Risk Factors.
FINANCIAL
CONDITION
Liquidity
and Capital Resources
In
November 2008, the Company was authorized by its Board of Directors to increase
the available lines of credit from $21 million to $40 million. On
June 30, 2009, the Company let expire one line of credit totaling $6 million and
entered into a new $15 million line of credit agreement, which expires on June
25, 2010. On August 12, 2009, the Company replaced an existing $3
million line of credit with a $10 million line of credit, which expires on
August 11, 2010. Finally, on September 15, 2009, the Company
increased a third line of credit from $12 million to $15 million, with an
expiration date of June 1, 2011. Interim Bank Loans Payable at
December 31, 2009 and 2008 was approximately $25.0 million and $12.1 million,
respectively, and represents the outstanding aggregate balance on these lines of
credit. As of December 31, 2009, the Company had $15.0 million in
unused lines of credit. Interest expense charged on interim bank
loans will fluctuate based on market interest rates.
At
December 31, 2009 and 2008, the weighted average interest rates on these
short-term borrowings outstanding were 2.23% and 1.96%,
respectively.
In 2009,
the Company spent $27.6 million on capital projects. The Company used
a combination of its internally generated funds, borrowing under its available
lines of credit, and a long term debt issuance to fund this construction
budget. The Company issued $20 million in private activity bonds
issued through the Connecticut Development Authority (CDA), for a long term debt
issuance in December 2009. In May 2009, the CDA authorized $20
million of volume capacity for the Company’s capital projects in 2009; the CDA
reaffirmed the authorization in October 2009. On September 8, 2009,
the Company filed with the DPUC an application for the issuance of $20 million
in CDA backed bonds. A final decision was issued by the DPUC on
November 12, 2009. The bonds were issued on December 1, 2009 at five
and one-tenth percent and are due December 1, 2039.
Standard
and Poor’s, on August 28, 2009, affirmed their 'A' corporate credit rating on
the Company with a stable outlook. The affirmation of the corporate credit
rating follows their annual review of the Company and incorporates their
expectation of adequate and timely rate relief and maintenance of our current
financial risk profile. The stable outlook reflects improving regulation and
timely rate relief in Connecticut.
The
Company offers a dividend reinvestment plan (DRIP) to all registered
shareholders, whereby shareholders can elect to have cash dividends directly
reinvested into additional shares of the Company’s common
stock. During the years ended December 31, 2009 and 2008,
shareholders reinvested $1,323,000 and $1,281,000, respectively, as part of the
DRIP.
From 1999
through 2003, the Company issued stock options to certain employees of the
Company. No stock options have been issued by the Company since
2003. During the year ended December 31, 2009, 17,498 options were
exercised resulting in approximately $390,000 in proceeds to the
Company. For the same period in 2008, 11,775 options were exercised
resulting in approximately $218,000 in proceeds to the Company
18
The
following table shows the total construction expenditures excluding non-cash
contributed utility plant for each of the last three years and what we expect to
invest on construction projects in 2010.
|
Gross
Construction Expenditures
|
Construction
Funded by Developers & Others
|
Construction
Funded by Company
|
||||||||||
|
2009
|
$ | 28,349,000 | $ | 751,000 | $ | 27,598,000 | ||||||
|
2008
|
$ | 20,737,000 | $ | 860,000 | $ | 19,877,000 | ||||||
|
2007
|
$ | 19,841,000 | $ | 1,092,000 | $ | 18,749,000 | ||||||
|
2010
(Projected)
|
$ | 25,800,000 | ** | $ | 25,800,000 | |||||||
** – The
Company cannot predict the amount of construction funded by others.
During
2009, the Company incurred approximately $28.3 million of construction
expenditures, including approximately $800,000 funded by developers and
others. The Company financed the expenditures through internally
generated funds, long-term debt issuances, proceeds from its dividend
reinvestment plan, customers’ advances, contributions in aid of construction and
short-term borrowings.
Our Board
of Directors has approved a $25.8 million construction budget for 2010, net of
amounts to be financed by customer advances and contributions in aid of
construction. The Company will use a combination of its internally
generated funds, borrowing under its available lines of credit and, depending on
capital market conditions, a long term debt issuance.
Off-Balance
Sheet Arrangements and Contractual Obligations
We do not
use off-balance sheet arrangements such as securitization of receivables with
any unconsolidated entities or other parties. The Company does not engage in
trading or risk management activities (other than an interest rate swap
agreement that expired in 2009) and does not have material transactions
involving related persons.
The
following table summarizes the Company’s future contractual cash obligations as
of December 31, 2009:
|
Payments
due by Periods
|
||||||||||||||||||||
|
(in
thousands)
|
||||||||||||||||||||
|
Contractual
Obligations
|
Total
|
Less
than
1
year
|
Years
2
and 3
|
Years
4
and 5
|
More
than
5
years
|
|||||||||||||||
|
Long-Term
Debt (LTD)
|
$ | 111,955 | $ | -- | $ | -- | $ | -- | $ | 111,955 | ||||||||||
|
Interest
on LTD
|
122,242 | 4,874 | 9,748 | 9,748 | 97,872 | |||||||||||||||
|
Operating
Lease Obligations
|
778 | 283 | 471 | 24 | -- | |||||||||||||||
|
Purchase
Obligations (1)
(2)
|
95,498 | 1,000 | 1,977 | 2,127 | 90,394 | |||||||||||||||
|
Long-Term
Compensation Agreement(3)
|
42,618 | 5,256 | 3,989 | 3,984 | 29,389 | |||||||||||||||
|
Total
(4)
(5)
|
$ | 373,091 | $ | 11,413 | $ | 16,185 | $ | 15,883 | $ | 329,610 | ||||||||||
(1)
Connecticut Water has an agreement with the South Central Connecticut Regional
Water Authority (RWA) to purchase water from RWA. The agreement was
signed on April 24, 2006 and will remain in effect for a minimum of fifty (50)
years from that date. Connecticut Water has agreed to purchase a
maximum of one million (1,000,000) gallons of water per day year from
RWA. The Company is required to pay $75,000 per year for access to
this water.
(2)
Connecticut Water has an agreement with The Metropolitan District (MDC) to
purchase water from MDC. The agreement became effective on October 6,
2000 for a term of fifty (50) years beginning May 19, 2003, the date the water
supply facilities related to the agreement were placed in service.
(3)
Pension and post retirement contributions cannot be reasonably estimated beyond
2010 and may be impacted by such factors as return on pension assets, changes in
the number of plan participants and future salary increases. The
amounts included for pension and post retirement contributions are management’s
best estimate, including the Company’s planned $3.4 million pension contribution
in 2010.
(4) We
pay refunds on Advances for Construction over a specific period of time based on
operating revenues related to developer-installed water mains or as new
customers are connected to and take service from such mains. After
all refunds are paid, any remaining balance is transferred to Contributions in
Aid of Construction. The refund amounts are not included in the above
table because the refund amounts and timing are dependent upon several
variables, including new customer connections, customer consumption levels and
future rate increases, which cannot be accurately estimated. Portions
of these refund amounts are payable annually through 2020 and amounts not paid
by the contract expiration dates become non-refundable.
(5) We
intend to fund these contractual obligations with cash flows from operations and
liquidity sources held by or available to us.
19
RESULTS
OF OPERATIONS
Overview
of 2009 Results from Continuing Operations
Net
Income for 2009 was $10,209,000, or $1.20 basic earnings per share, an increase
of $785,000, or $0.08 basic earnings per share, compared to 2008. The
increase in earnings was due to higher net income in our Real Estate and
Services and Rentals segments partially offset by decreases in net income in our
Water Activities segment. Changes in net income for our segments were
as follows:
|
Business
Segment
|
2009
Net Income
|
2008
Net Income (Loss)
|
Increase
(Decrease)
|
|||||||||
|
Water
Activities
|
$ | 7,831,000 | $ | 8,794,000 | $ | (963,000 | ) | |||||
|
Real
Estate
|
1,449,000 | (160,000 | ) | 1,609,000 | ||||||||
|
Services
and Rentals
|
929,000 | 790,000 | 139,000 | |||||||||
|
Total
|
$ | 10,209,000 | $ | 9,424,000 | $ | 785,000 | ||||||
Water
Activities
The
decrease in net income from Water Activities for 2009 over 2008 results was
$963,000. A breakdown of the components of this decrease was as
follows:
|
2009
|
2008
|
Increase
(Decrease)
|
||||||||||
|
Operating
Revenues
|
$ | 59,391,000 | $ | 61,270,000 | $ | (1,879,000 | ) | |||||
|
Operation
and Maintenance
|
32,181,000 | 31,877,000 | 304,000 | |||||||||
|
Depreciation
|
6,403,000 | 6,438,000 | (35,000 | ) | ||||||||
|
Income
Taxes
|
2,466,000 | 3,518,000 | (1,052,000 | ) | ||||||||
|
Taxes
Other than Income Taxes
|
5,953,000 | 6,041,000 | (88,000 | ) | ||||||||
|
Other
Utility Income
|
704,000 | 579,000 | 125,000 | |||||||||
|
Other
Deductions
|
(784,000 | ) | (143,000 | ) | (641,000 | ) | ||||||
|
Interest
and Debt Expense (net of AFUDC)
|
4,477,000 | 5,038,000 | (561,000 | ) | ||||||||
|
Total
Income from Water Activities
|
$ | 7,831,000 | $ | 8,794,000 | $ | (963,000 | ) | |||||
Revenues
from our water customers declined $1,879,000 or 3.1% to $59,391,000 for the year
ended December 31, 2009. Specific details of the decline in revenue
are as follows:
|
-
|
On
July 1, 2009, the Company’s first WICA surcharge and the voluntarily
enacted rate decrease, each discussed above in “Regulatory Matters and
Inflation”, became effective. The net effect of these two new
items on customers’ bills was a decrease to operating revenue of
approximately $287,000, or approximately 15% of the total year over year
decrease in customer revenues. WICA charges will continue to
appear on customer’s bills until the Company’s next general rate case,
including increases to WICA charges between cases, while the rate
reduction was eliminated on January 1,
2010.
|
|
-
|
Water
production for the year ended December 31, 2009 decreased by
4%. A portion of this decline was related to lower residential
demand due to the extremely wet and cool weather experienced in the second
quarter of 2009. In addition, our residential customers
continued the declining usage throughout
2009.
|
|
-
|
Industrial
revenues decreased by $363,000, or 20%, to $1,459,000 when compared to
2008, primarily due to the economic downturn affecting companies in our
service regions. A portion of the decrease was due to
industrial customers cutting back on shifts and other budget
cuts.
|
|
-
|
Partially
offsetting the declining usage described above, was the implementation of
the second phase of the Company’s 2006 rate increase that was effective
April 1, 2008. As a result, the first quarter of 2009 included
an increase of rates of approximately 4.5% that was not included in rates
in the first quarter of 2008.
|
|
-
|
The
January 2009 acquisition of Ellington Acres added approximately $261,000
in new revenues from the additional customers
served.
|
The
$304,000, or 1.0%, increase in Operation and Maintenance (O&M) expense was
due to the following changes in expenses:
|
Components
of O&M
|
2009
|
2008
|
Increase
(Decrease)
|
|||||||||
|
Medical
expense
|
$ | 2,220,000 | $ | 1,477,000 | $ | 743,000 | ||||||
|
Pension
costs
|
1,718,000 | 1,258,000 | 460,000 | |||||||||
|
Water
treatment (including chemicals)
|
2,253,000 | 2,051,000 | 202,000 | |||||||||
|
Other
employee benefit costs
|
414,000 | 269,000 | 145,000 | |||||||||
|
Purchased
water
|
1,121,000 | 993,000 | 128,000 | |||||||||
|
Property
and Liability Insurance
|
1,119,000 | 993,000 | 126,000 | |||||||||
|
Customer
|
947,000 | 826,000 | 121,000 | |||||||||
|
Vehicle
|
1,351,000 | 1,442,000 | (91,000 | ) | ||||||||
|
Utility
costs
|
3,433,000 | 3,534,000 | (101,000 | ) | ||||||||
|
Labor
|
11,637,000 | 11,935,000 | (298,000 | ) | ||||||||
|
Post-retirement
medical costs
|
725,000 | 1,565,000 | (840,000 | ) | ||||||||
|
Other
|
5,243,000 | 5,534,000 | (291,000 | ) | ||||||||
|
Total
O&M Expense
|
$ | 32,181,000 | $ | 31,877,000 | $ | 304,000 | ||||||
20
Operation
and Maintenance costs for the year ended December 31, 2009 increased 1.0%, when
compared to the prior year, largely due to the employee focus on capital
projects, both administrative and field related. The primary
administrative capital project is the implementation of the Enterprise Resource
Planning (ERP) system the Company began implementing in 2008. The ERP
system will update the Company’s accounting and customer information systems, as
well as other improvements to our Information Technology. Medical
expenses increased primarily due to an increase in medical claims filed by
employees, partially offset by an increase in the amount contributed by
employees. Pension costs increased primarily due to an increase to
the discount rate. Water treatment costs increased primarily due to
an increase in the cost of key chemicals, despite a decrease in water production
when compared to prior year. The increase in other employee benefits
relates primarily to increases in stock-based compensation costs for executives
and increased expenses related to the Company’s 401(k)
plan. Purchased water costs increased in the period primarily due to
an increase in water purchased in our Unionville and Mansfield systems, off-set
by a reduction in purchased water costs in Naugatuck. Additionally,
the Company negotiated a reduction of bills related to 2007 purchased water that
the Company realized as a reduction of expense in the first quarter of
2008. During 2009, the Company was billed for water as it was
purchased from neighboring utilities at the negotiated
rates. Insurance costs increased over 2008 levels due to an increase
in the Company’s general liability premiums. The Company saw an
increase in its customer costs due to increases in uncollectible accounts and to
an increase in customer communication costs. The largest driver of
decreased vehicle costs during 2009 was a reduction in fuel
costs. The Company saw a decrease in utility costs primarily due to
decreased communication charges and lower electricity costs. Labor
costs have decreased compared to 2008 due to a large number of ongoing capital
projects, including the implementation of the ERP system, where approximately
25% of our employees spent a portion of their time directly participating in the
design and implementation of the new system. For the year ended
December 31, 2009, approximately $757,000 in Labor costs were related to the ERP
system and not part of O&M expense. Post-retirement medical costs
decreased over 2008 levels due to changes in plan benefits.
The
Company saw a slight decrease in its Depreciation expense from 2008 to
2009. A higher utility plant in service balance and a large amount of
capital projects during 2009 increased depreciation expense, however those
increases were offset by the reduction in depreciation rates that resulted in a
temporary reduction in rates for customers. Additionally, the Company
benefited from the amortization of the acquisition adjustment, as allowed by the
DPUC, related to the acquisition of the assets of Birmingham Utilities’ Eastern
Division (“Eastern”) in 2008.
The
decrease in Income Tax expense associated with the Water Activities segment of
$1,052,000 was due primarily to a lower effective income tax rate in 2009 when
compared to 2008 and lower pre-tax income on Water Activities. The
drivers of the lower effective tax rate are increases to flow through timing
differences, including planned pension contributions, and the generation of
state tax credits associated with infrastructure investment made by the
Company.
The
decrease in Taxes Other Than Income Taxes was primarily due to both lower
payroll tax and property taxes due to a resolution of property tax liability
related to the acquisition of Eastern in 2008.
The
increase in Other Utility Operating Income was due to higher revenues generated
from antenna sites on our utility property leased to telecommunication
companies.
The
increase in Other Deductions was primarily due to higher executive employee
benefit costs in 2009 than during the same period in 2008. The
Company’s Supplemental Executive Retirement Plan (SERP) expense increased in
part due to the decision by the Company in 2009 to characterize the individual
SERP contracts, which were accounted for under APB 12, as a plan, now accounted
for under FASB ASC 715 “Compensation – Retirement Benefits”.
Interest
and Debt Expense decreased due interest rates on our variable rate debt being
lower throughout 2009 than 2008. The Company expects interest expense
to increase during 2010 due to the December 2009 debt issuance.
Real
Estate
During
2009, the Company completed the sale of a conservation easement to the Town of
Windsor Locks, CT for $2 million. The transaction generated $1.2
million in net income for the Company. Through land donations and
discount land sales in previous years, the Company earned tax credits to use in
future years. The Company is limited by time and the amount of
taxable income when using these credits. Each year, the Company
assesses its ability to use these credits going forward and makes adjustments to
its valuation allowances, accordingly. During 2009, the Company also
adjusted tax valuation allowances associated with land donations made in
previous years generating approximately $207,000 in net income in the Real
Estate segment. Additionally, Chester Realty sold a rental property
in Killingly, CT during the third quarter of 2009, generating a small
profit.
While the
Company did not complete any real estate transactions in 2008, an adjustment to
the valuation allowances recorded in earlier years negatively impacted net
income in 2008 by $160,000.
Income
from the Real Estate segment is largely dependent on the tax deductions received
on donations and, or, sales of available land. This typically occurs
when utility-owned land is deemed to be not necessary to protect water
sources. The Company plans to continue to utilize land donations and
sales in 2010, and beyond, to generate income for this segment of our
business.
Services
and Rentals
Net
income generated from the Services and Rental segment increased in 2009 by
$139,000, over 2008 levels, with a $0.02 increase to basic earnings per
share. The increased net income was primarily due to decreases in
general and administrative expenses and higher margins realized on individual
management contracts in 2009.
21
Overview
of 2008 Results from Continuing Operations
Net
Income for 2008 was $9,424,000, or $1.12 per basic share, an increase of
$643,000, or $0.06 per basic share, compared to 2007. The increase in
earnings was due to higher net income in our Water Activities and Services and
Rentals segments partially offset by decreases in net income in our Real Estate
segment. Changes in net income for our segments were as
follows:
|
Business
Segment
|
2008
Net Income (Loss)
|
2007
Net Income
|
Increase
(Decrease)
|
|||||||||
|
Water
Activities
|
$ | 8,794,000 | $ | 7,963,000 | $ | 831,000 | ||||||
|
Real
Estate
|
(160,000 | ) | 167,000 | (327,000 | ) | |||||||
|
Services
and Rentals
|
790,000 | 651,000 | 139,000 | |||||||||
|
Total
|
$ | 9,424,000 | $ | 8,781,000 | $ | 643,000 | ||||||
Water
Activities
The
increase in net income from Water Activities in 2008, over 2007 results was
$831,000, or $0.09 per share. A breakdown of the components of this increase was
as follows:
|
2008
|
2007
|
Increase
(Decrease)
|
||||||||||
|
Operating
Revenues
|
$ | 61,270,000 | $ | 59,026,000 | $ | 2,244,000 | ||||||
|
Operation
and Maintenance
|
31,877,000 | 29,864,000 | 2,013,000 | |||||||||
|
Depreciation
|
6,438,000 | 6,525,000 | (87,000 | ) | ||||||||
|
Income
Taxes
|
3,518,000 | 4,195,000 | (677,000 | ) | ||||||||
|
Taxes
Other than Income Taxes
|
6,041,000 | 5,740,000 | 301,000 | |||||||||
|
Other
Utility Income
|
579,000 | 552,000 | 27,000 | |||||||||
|
Other
Deductions
|
(143,000 | ) | (972,000 | ) | 829,000 | |||||||
|
Interest
and Debt Expense (net of AFUDC)
|
5,038,000 | 4,319,000 | 719,000 | |||||||||
|
Total
Income from Water Activities
|
$ | 8,794,000 | $ | 7,963,000 | $ | 831,000 | ||||||
The 3.8%
increase in Operating Revenues was primarily due to the January 2008 acquisition
of Eastern and the second phase of the 2006 rate case, partially offset by a
decrease in consumption among all customer classes, due primarily to unfavorable
weather conditions in 2008. Significant rainfall in 2008 reduced
residential demand for water. This was a stark contrast to 2007 when
extremely dry weather was experienced in much of our service
territory. Specific details are as follows:
|
-
|
The
Eastern acquisition added approximately $1.7 million in new revenues from
both the additional customers served and the make whole payments received
from the RWA.
|
|
-
|
The
second phase of the 2006 rate case, which became effective April 1, 2008,
contributed approximately $2.0 million in additional revenues over 2007
levels.
|
|
-
|
The
weather impact was most notable in the Company’s northern service area,
which is the Company’s largest service area, where there were 96 days
during the period May 1, 2008 through October 31, 2008 with at least a
trace of rain, totaling 34.8 inches of rain in the aggregate, compared to
17.4 inches during the same period in 2007. The change in
weather conditions between years resulted in an approximate $1.5 million
revenue disparity between years. The impact of the unfavorable
weather can be seen in Operating Revenues from residential
customers. Despite increasing the customer count in this class
of customer by over 2,600 additional customers (or 3.5%), consumption
decreased by approximately 232 million gallons (or -4.5%). In
fact, despite a decrease in consumption across all customer classes, only
the residential class saw a decrease in Operating
Revenues.
|
The
$2,013,000, or 6.7%, increase in Operation and Maintenance (O&M) expense was
due to the following changes in expenses:
|
Components
of O&M
|
2008
|
2007
|
Increase
(Decrease)
|
|||||||||
|
Labor
|
$ | 11,935,000 | $ | 10,842,000 | $ | 1,093,000 | ||||||
|
Medical
expense
|
1,477,000 | 1,097,000 | 380,000 | |||||||||
|
Water
treatment (including chemicals)
|
2,051,000 | 1,754,000 | 297,000 | |||||||||
|
Utility
costs
|
3,534,000 | 3,282,000 | 252,000 | |||||||||
|
Vehicle
|
1,442,000 | 1,214,000 | 228,000 | |||||||||
|
Customer
|
826,000 | 709,000 | 117,000 | |||||||||
|
Outside
services
|
1,556,000 | 1,480,000 | 76,000 | |||||||||
|
Other
employee benefit costs
|
269,000 | 206,000 | 63,000 | |||||||||
|
Purchased
water
|
993,000 | 1,291,000 | (298,000 | ) | ||||||||
|
Pension
costs
|
1,258,000 | 1,465,000 | (207,000 | ) | ||||||||
|
Post-retirement
medical costs
|
1,565,000 | 1,759,000 | (194,000 | ) | ||||||||
|
Other
|
4,971,000 | 4,765,000 | 206,000 | |||||||||
|
Total
O&M Expense
|
$ | 31,877,000 | $ | 29,864,000 | $ | 2,013,000 | ||||||
The
Company saw an increase in its labor expense driven primarily by the addition of
twenty additional employees hired, primarily due to the acquisition of the
assets of Eastern and due to annual wage increases. Medical expenses
increased primarily due to an increase in medical and dental claims filed by
employees, partially offset by an increase in the amount contributed by
employees. Water treatment costs increased primarily due to the
rising cost of chemicals during the year. The Company saw an increase
in utility costs primarily due to increased communication charges and an
increase in electric costs. The largest driver of increased vehicle
costs during 2008 was an increase in gasoline costs. Additionally,
during 2007, the Company made the decision to purchase a majority of its
vehicles rather than to lease them; this has caused the maintenance and repairs
costs and depreciation on vehicles to increase during 2008 as the Company now
typically keeps the vehicles in service longer than when they were leased,
partially offset by a decrease in lease expense. The Company saw an
increase in its customer costs due to increases in customer communications,
including increased postage costs, and to an increase in uncollectible
accounts. The increase in outside services used by the Company were
primarily related to increased legal fees during 2008 and to a consultant hired
to assist the Company in defining its information technology
needs. The increase in other employee benefits relates primarily to
increases to executive compensation, including stock-based compensation,
employee training and workers’ compensation insurance, offset by decreases in
fringe benefits. Purchased water costs decreased compared to 2007
levels due to a renegotiated rate with a neighboring water
utility. Pension expense decreased due to an increase in discount
rates. Post-retirement medical expense decreased due to lower claim
history when comparing 2008 data to 2007.
22
Despite a
higher utility plant in service balance and a large amount of capital projects
during 2008, the Company saw a decrease in Depreciation expense of $87,000, or
1.3%. The main driver of the decrease is the amortization of the
acquisition adjustment, as allowed by the DPUC, related to the acquisition of
Eastern.
The
decrease in Income Tax expense associated with the Water Activities segment of
$677,000 was due primarily to a lower effective income tax rate in 2008 when
compared to 2007 as a result of the establishment of a deferred tax asset
related to unused state tax credits.
The
increase in Taxes Other Than Income Taxes was primarily due to higher property
taxes due to towns charging higher property tax rates on our increasing property
balances, as well as increased asset balances due to acquisitions.
The
increase in Other Utility Operating Income was due to higher revenues generated
from antenna sites on our utility property leased to telecommunication companies
and the sale of timber cleared from Company owned land.
The
decrease in Other Deductions was primarily due to lower executive employee
benefit costs in 2008 than during the same period in 2007, due primarily to the
retirement of a former executive during 2007.
Interest
and Debt Expense increased due to the $15 million bond issuance in December 2007
and higher interest on interim bank loans payable.
Real
Estate
While the
Company did not complete any real estate transactions in 2008, an adjustment to
the valuation allowances recorded in earlier years negatively impacted net
income in 2008 by $160,000. Through land donations and discount land
sales in previous years, the Company earned tax credits to use in future
years. The Company is limited by time and the amount of taxable
income when using these credits. Each year, the Company assesses its
ability to use these credits going forward and makes adjustments to its
valuation allowances, accordingly.
During
2007, the Company sold 33 acres, in two separate transactions, generating
approximately $201,000 in net income. Additionally, upon completion
of the 2006 tax return in the third quarter of 2007, the Company received an
additional tax benefit relating to the 2006 BARLACO land sale transaction of
approximately $20,000. Offsetting these gains, the Company increased
its valuation allowance by approximately $54,000, generating an overall net gain
in the Real Estate Transactions segment of $167,000.
Income
from this business segment is largely dependent on the tax deductions received
on donations and, or, sales of available land. This typically occurs
when utility-owned land is deemed to be not necessary to protect water
sources.
Services
and Rentals
Net
income generated from the Services and Rental segment increased in 2008 by
$139,000, over 2007 levels, with a $0.01 increase to basic earnings per share.
The increased net income was primarily due to the acquisition of operation and
maintenance contracts related to the acquisition of the unregulated assets of
Birmingham H2O Services, Inc. and an increase in profit from Linebacker®
customers.
COMMITMENTS
AND CONTINGENCIES
Security – Investment in
security-related improvements is a continuing process and management believes
that the costs associated with any such improvements will be eligible for
recovery in future rate proceedings.
Reverse Privatization –
Connecticut Water derives its rights and franchises to operate from state laws
that are subject to alteration, amendment or repeal, and do not grant permanent
exclusive rights to our service areas. Our franchises are free from
burdensome restrictions, are unlimited as to time, and authorize us to sell
potable water in all towns we now serve. There is the possibility
that states could revoke our franchises and allow a governmental entity to take
over some or all of our systems. From time to time such legislation
is contemplated.
Environmental and Water Quality
Regulation – The Company is subject to environmental and water quality
regulations. Costs to comply with environmental and water quality
regulations are substantial. We are presently in compliance with
current regulations, but the regulations are subject to change at any
time. The costs to comply with future changes in state or federal
regulations, which could require us to modify current filtration facilities
and/or construct new ones, or to replace any reduction of the safe yield from
any of our current sources of supply, could be substantial.
Rate Relief – Connecticut
Water is a regulated public utility, which provides water services to its
customers. The rates that regulated companies charge their water
customers are subject to the jurisdiction of the regulatory authority of the
DPUC. Connecticut Water’s allowed rate of return on equity and return
on rate base are 10.125% and 8.07%, respectively.
In June
2007, the State of Connecticut adopted legislation which permits regulated water
companies to recapture money spent on eligible infrastructure improvements
without a full rate case proceeding. The DPUC may authorize regulated
water companies to use a rate adjustment mechanism, such as a Water
Infrastructure and Conservation Adjustment (WICA), for eligible projects
completed and in service for the benefit of the customers. Regulated
water companies may only charge customers such an adjustment to the extent
allowed by the DPUC based on a water company’s infrastructure assessment report,
as approved by the DPUC and upon semiannual filings which reflect plant
additions consistent with such report.
On
October 29, 2009, the Company filed its second WICA application with the DPUC,
requesting a 2.15% surcharge to customers’ bills, inclusive of the 0.95%
surcharge approved in July 2009. The surcharges can be placed on
customers’ bills at the start of a calendar quarter following the receipt of
DPUC approval. The DPUC approved a cumulative WICA surcharge of 2.1%
on December 23, 2009. The surcharge mechanism became effective
January 1, 2010.
23
On
January 6, 2010, the Company’s regulated water subsidiary, The Connecticut Water
Company, filed a rate application with the DPUC, requesting a multi-year
increase totaling $19.1 million, over a three year period. The
Company has proposed options for regulatory consideration, including a
multi-year phase-in of rates that, if approved, would be a first in Connecticut
for water utilities. In addition to the phased-in rate increase, the
Company is also seeking a Water Conservation Adjustment Mechanism (“WCAM”), to
allow the Company to continue to aggressively promote water conservation in an
effective manner while addressing the financial impact of increased conservation
by its customers. The WCAM seeks to minimize the effects of
conservation on the Company’s revenues through a recovery mechanism that would
be limited to a change in non-weather related residential sales, while at the
same time allowing for the promotion of conservation to the benefit of customers
and the environment, usually two opposing concerns. In addition to
the conservation efforts that have impacted sales, the need for an increase in
rates is, in part, based upon an investment of approximately $62 million in Net
Utility Plant since 2006, the last time the Company filed a general rate
increase. In addition, increased operating costs for labor, employee
benefits and other general operating needs, including chemicals, is being
requested. No assurance can be given that the DPUC will approve any
or all of the rate relief, the phased-in approach or the WCAM requested by the
Company. The Company expects a decision in this rate case in July
2010, with new rates effective at that time.
Land Dispositions – The
Company and its subsidiaries own additional parcels of land in Connecticut,
which may be suitable in the future for disposition, either by sale or by
donation to municipalities, other local governments or private charitable
entities. These additional parcels would include certain Class I and
II parcels previously identified for long term conservation by the Connecticut
DEP, which have restrictions on development and resale based on provisions of
the Connecticut General Statutes.
The
Company made no land dispositions during the fiscal year ended December 31,
2008. However, during 2008, the Company entered into negotiations
with the Town of Windsor Locks, Connecticut and ultimately agreed to sell a
conservation easement on a well field property no longer needed as a source of
supply for $2.0 million. Windsor Locks was awarded a grant from the
Connecticut Department of Environmental Protection to assist in purchasing the
conservation easement in order to permanently protect the approximate 200-acre
property from development and guarantee public access to the land for passive
recreation. The Company filed an application with the DPUC and
submitted the draft agreement and the form of Conservation Easement to the DPUC
on April 3, 2009. The DPUC approved the transaction on September 9,
2009 and the transaction closed on September 18, 2009. The sale of
the conservation easement generated approximately $1.2 million in net income for
the Real Estate segment for the year ending December 31, 2009. The
Company currently has no other specific plans for land transactions in 2010 and
beyond.
19 Perry Street Litigation –
Connecticut Water’s Unionville division has for many years operated a well field
located at 19 Perry Street, Farmington, Connecticut, pursuant to a 99-year lease
entered into in 1975 with the property owner. This well field
provides approximately half of the daily water supply requirements to the
customers of the Unionville division. In 2004, the original property
owner ceased business operations. The property is now owned by 19
Perry Street, LLC, which obtained the property through a foreclosure
proceeding. In June 2007, the new property owner commenced a lawsuit
in Hartford Superior Court (Housing Section), asserting that Connecticut Water
is in unlawful possession of the property under several theories, including that
the lease is invalid and that Connecticut Water has failed to pay rent when due.
We asserted that we have a valid lease, and did not vacate the
premises. A trial before a judge was held in November 2007, and a
decision was issued on April 30, 2008. In its decision, the Court
ruled that the lease is valid. However, in deciding the parties’
contentions regarding the proper form and amount of rental payments due, the
Court ruled that Connecticut Water was in breach of its obligation to pay rent
on the property and therefore entered an order of eviction.
On May 5,
2008, Connecticut Water filed a timely appeal of the decision in the Connecticut
Appellate Court. Subsequently, the Connecticut Supreme Court
transferred the case to itself for determination. On February 2,
2010, the Connecticut Supreme Court issued its decision reinstating the lease
and allowing Connecticut Water to retain possession of the premises, contingent
upon the Company paying the property owner all back rent, together with interest
and court costs. We have presented the property owner with our
calculations as to the rent and interest due, and have requested the property
owner's calculation as to court costs.
On August
5, 2008, Connecticut Water was served with a related lawsuit in which 19 Perry
Street, LLC seeks the payment of back rent with respect to the
property. In February, 2009, the lawsuit for back rent was stayed
pending the resolution of the appeal related to the eviction case. We
have been accruing rent going back to when 19 Perry Street, LLC became the
property owner. However, we have not yet confirmed that the property
owner agrees with our calculation as to either the amount due or the time over
which back rent is owed. If the property owner does not agree with
our calculation and chooses to pursue this case, we intend to vigorously defend
the action for back rent as to all amounts over the amount which has been set
aside. That action notwithstanding, with the Supreme Court decision,
the Company maintains its use of the property to provide water to customers of
its Unionville division.
Capital Expenditures – The
Company has received approval from its Board of Directors to spend $25.8 million
on capital expenditures in 2010, in part due to increased spending primarily for
infrastructure improvements.
The
primary market risk faced by the Company is interest rate risk. As of December
31, 2009, the Company had no exposure to derivative financial instruments or
financial instruments with significant credit risk or off-balance-sheet
risks. In addition, the Company is not subject in any material
respect to any currency or other commodity risk.
The
Company is subject to the risk of fluctuating interest rates in the normal
course of business. The Company's exposure to interest fluctuations is managed
at the Company and subsidiary operations levels through the use of a combination
of fixed rate long-term debt (and variable rate borrowings) under financing
arrangements entered into by the Company and its subsidiaries and the use of the
interest rate swap agreement discussed below. In November 2008, the
Company was authorized by its Board of Directors to increase the available lines
of credit from $21 million to $40 million. On June 30, 2009, the
Company let expire one line of credit totaling $6 million and entered into a new
$15 million line of credit agreement, which expires on June 25,
2010. On August 12, 2009, the Company replaced an existing $3 million
line of credit with a $10 million line of credit, which expires on August 11,
2010. Finally, on September 15, 2009, the Company increased a third
line of credit from $12 million to $15 million, with an expiration date of June
1, 2011. Interim Bank Loans Payable at December 31, 2009 and 2008 was
approximately $25.0 million and $12.1 million, respectively, and represents the
outstanding aggregate balance on these lines of credit. Interest
expense charged on interim bank loans will fluctuate based on market interest
rates.
During
the first quarter of 2004, Connecticut Water entered into a five-year interest
rate swap transaction in connection with the refunding of its First Mortgage
Bonds (Series V). The swap agreement provides for Connecticut
Water’s exchange of floating rate interest payment obligations for fixed rate
interest payment obligations on a notional principal amount of
$12,500,000. The purpose of the interest rate swap was to manage the
Company’s exposure to fluctuations in prevailing interest rates. The
interest rate swap expired on March 3, 2009. The Company is
evaluating whether or not to enter into a new interest rate swap agreement on
our variable rate bonds. See the “Liquidity and Capital Resources”
section of Item 7 – “Management’s Discussion and Analysis and Results of
Operations” above for further information. The Company does not enter
into derivative financial contracts for trading or speculative purposes and does
not use leveraged instruments.
24
The
Consolidated Financial Statements of Connecticut Water Service, Inc., and the
Notes to Consolidated Financial Statements together with the report of
PricewaterhouseCoopers LLP, independent registered public accounting firm are
included herein on pages F-2 through F-27.
None
Disclosure Controls and
Procedures – As of December 31, 2009, management, including the Company’s
Chief Executive Officer and Chief Financial Officer, evaluated the effectiveness
of the design and operation of the Company’s disclosure controls and procedures
(as defined in Exchange Act Rule 13a-15(e)). Based upon, and as of
the date of that evaluation, the Chief Executive Officer and Chief Financial
Officer concluded that the Company’s disclosure controls and procedures were
effective.
Management’s Report on Internal
Control Over Financial Reporting – Internal control over financial
reporting (as defined in Exchange Act Rule 13a-15(f)) is a process designed to
provide reasonable assurance regarding the reliability of financial reporting
and the preparation of financial statements for external purposes in accordance
with accounting principles generally accepted in the United States of
America.
Management
of the Company is responsible for establishing and maintaining adequate internal
control over financial reporting. We have used the criteria
established in Internal
Control – Integrated Framework issued by the Committee of Sponsoring
Organizations of the Treadway Commission (COSO) in conducting our evaluation of
the effectiveness of the internal control over financial
reporting. Based on our evaluation, we concluded that the Company’s
internal control over financial reporting was effective as of December 31,
2009. The effectiveness of the Company’s internal control over
financial reporting as of December 31, 2009 has been audited by
PricewaterhouseCoopers LLP, an independent registered public accounting firm, as
stated in their report which appears herein.
Because
of its inherent limitations, internal control over financial reporting may not
prevent or detect misstatements. Also, projections of any evaluation
of effectiveness to future periods are subject to the risk that controls may
become inadequate because of changes in conditions, or that the degree of
compliance with the policies or procedures may deteriorate.
Changes in Internal Control Over
Financial Reporting – There were no significant changes in the Company’s
internal control over financial reporting that occurred during the Company’s
most recent fiscal quarter that have materially affected, or are reasonably
likely to materially affect, the Company’s internal control over financial
reporting.
None
PART
III
Pursuant
to General Instruction G(3), the information called for by Items 10, 11, 12, 13
and 14 is hereby incorporated by reference to the Company’s definitive proxy
statement to be filed on EDGAR on or about March 31, 2010. Certain
information concerning the executive officers of the Company is included as Item
1 of this report.
25
PART
IV
|
(a)
|
1. |
Financial
Statements:
|
|||||||
|
The
report of independent registered public accounting firm and the Company’s
Consolidated Financial Statements listed in the Index to Consolidated
Financial Statements on page F-1 hereof are filed as part of this report,
commencing on page F-2
|
|||||||||
|
Page
|
|||||||||
|
Index
to Consolidated Financial Statements and Schedule
|
F-1 | ||||||||
|
Report
of Independent Registered Pubic Accounting Firm
|
F-2 | ||||||||
|
Consolidated
Statements of Income for the years ended December 31, 2009, 2008 and
2007
|
F-3 | ||||||||
|
Consolidated
Statements of Comprehensive Income for the years ended December 31, 2009,
2008 and 2007
|
F-3 | ||||||||
|
Consolidated
Balance Sheets at December 31, 2009 and 2008
|
F-4 | ||||||||
|
Consolidated
Statements of Cash Flows for the years ended December 31, 2009, 2008 and
2007
|
F-5 | ||||||||
|
Notes
to Consolidated Financial Statements
|
F-6 | ||||||||
| 2. |
Financial
Statement Schedule:
|
||||||||
|
The
following schedule of the Company is included on the attached page as
indicated
|
|||||||||
|
Schedule
II Valuation and Qualifying Accounts and Reserves for the years ended
December 31, 2009, 2008 and 2007
|
S-1 | ||||||||
|
All
other schedules provided for in the applicable regulations of the
Securities and Exchange Commission have been omitted because of the
absence of conditions under which they are required or because the
required information is set forth in the financial statements or notes
thereto.
|
|||||||||
|
(b)
|
Exhibits
|
||||||||
|
Exhibits
for Connecticut Water Service Inc, are in the Index to
Exhibits
|
E-1 | ||||||||
|
Exhibits
heretofore filed with the Securities and Exchange Commission as indicated
below are incorporated herein by reference and made a part hereof as if
filed herewith. Exhibits marked by asterisk (*) are being filed
herewith.
|
|||||||||
26
INDEX
TO CONSOLIDATED FINANCIAL STATEMENTS AND SCHEDULE
|
Page
|
||||
|
Index
to Consolidated Financial Statements and Schedule
|
F-1 | |||
|
Report
of Independent Registered Pubic Accounting Firm
|
F-2 | |||
|
Consolidated
Statements of Income for the years ended December 31, 2009, 2008 and
2007
|
F-3 | |||
|
Consolidated
Statements of Comprehensive Income for the years ended December 31, 2009,
2008 and 2007
|
F-3 | |||
|
Consolidated
Balance Sheets at December 31, 2009 and 2008
|
F-4 | |||
|
Consolidated
Statements of Cash Flows for the years ended December 31, 2009, 2008 and
2007
|
F-5 | |||
|
Notes
to Consolidated Financial Statements
|
F-6 | |||
|
Schedule
II – Valuation Accounts
|
S-1 | |||
F-1
Report
of Independent Registered Public Accounting Firm
To the
Board of Directors and Stockholders of Connecticut Water Service,
Inc.:
In our
opinion, the accompanying consolidated balance sheets and the related
consolidated statements of income, of cash flows and of comprehensive income
present fairly, in all material respects, the financial position of Connecticut
Water Service, Inc. and its subsidiaries (the “Company”) at December 31, 2009
and 2008, and the results of their operations and their cash flows for each of
the three years in the period ended December 31, 2009 in conformity with
accounting principles generally accepted in the United States of
America. In addition, in our opinion, the financial statement
schedule listed in the accompanying index presents fairly, in all material
respects, the information set forth therein when read in conjunction with the
related consolidated financial statements. Also in our opinion, the
Company maintained, in all material respects, effective internal control over
financial reporting as of December 31, 2009, based on criteria established in
Internal Control - Integrated
Framework issued by the Committee of Sponsoring Organizations of the
Treadway Commission (COSO). The Company's management is responsible
for these financial statements and financial statement schedule, for maintaining
effective internal control over financial reporting and for its assessment of
the effectiveness of internal control over financial reporting, included in the
accompanying Management’s Report on Internal Control over Financial
Reporting. Our responsibility is to express opinions on these
financial statements, on the financial statement schedule, and on the Company's
internal control over financial reporting based on our integrated
audits. We conducted our audits in accordance with the standards of
the Public Company Accounting Oversight Board (United States). Those
standards require that we plan and perform the audits to obtain reasonable
assurance about whether the financial statements are free of material
misstatement and whether effective internal control over financial reporting was
maintained in all material respects. Our audits of the financial
statements included examining, on a test basis, evidence supporting the amounts
and disclosures in the financial statements, assessing the accounting principles
used and significant estimates made by management, and evaluating the overall
financial statement presentation. Our audit of internal control over
financial reporting included obtaining an understanding of internal control over
financial reporting, assessing the risk that a material weakness exists, and
testing and evaluating the design and operating effectiveness of internal
control based on the assessed risk. Our audits also included
performing such other procedures as we considered necessary in the
circumstances. We believe that our audits provide a reasonable basis for our
opinions.
A
company’s internal control over financial reporting is a process designed to
provide reasonable assurance regarding the reliability of financial reporting
and the preparation of financial statements for external purposes in accordance
with generally accepted accounting principles. A company’s internal
control over financial reporting includes those policies and procedures that
(i) pertain to the maintenance of records that, in reasonable detail,
accurately and fairly reflect the transactions and dispositions of the assets of
the company; (ii) provide reasonable assurance that transactions are recorded as
necessary to permit preparation of financial statements in accordance with
generally accepted accounting principles, and that receipts and expenditures of
the company are being made only in accordance with authorizations of management
and directors of the company; and (iii) provide reasonable assurance regarding
prevention or timely detection of unauthorized acquisition, use, or disposition
of the company’s assets that could have a material effect on the financial
statements.
Because
of its inherent limitations, internal control over financial reporting may not
prevent or detect misstatements. Also, projections of any evaluation
of effectiveness to future periods are subject to the risk that controls may
become inadequate because of changes in conditions, or that the degree of
compliance with the policies or procedures may deteriorate.
/s/ PricewaterhouseCoopers
LLP
PricewaterhouseCoopers
LLP
Stamford,
Connecticut
March 12,
2010
F-2
|
CONSOLIDATED
STATEMENTS OF INCOME
|
||||||||||||
|
For
the Years Ended December 31, (in thousands, except per share
data)
|
2009
|
2008
|
2007
|
|||||||||
|
Operating
Revenues
|
$ | 59,391 | $ | 61,270 | $ | 59,026 | ||||||
|
Operating
Expenses
|
||||||||||||
|
Operation
and Maintenance
|
32,181 | 31,877 | 29,864 | |||||||||
|
Depreciation
|
6,403 | 6,438 | 6,525 | |||||||||
|
Income
Taxes
|
2,466 | 3,518 | 4,195 | |||||||||
|
Taxes
Other Than Income Taxes
|
5,953 | 6,041 | 5,740 | |||||||||
|
Total
Operating Expenses
|
47,003 | 47,874 | 46,324 | |||||||||
|
Net
Operating Revenues
|
12,388 | 13,396 | 12,702 | |||||||||
|
Other
Utility Income, Net of Taxes
|
704 | 579 | 552 | |||||||||
|
Total
Utility Operating Income
|
13,092 | 13,975 | 13,254 | |||||||||
|
Other
Income (Deductions), Net of Taxes
|
||||||||||||
|
Gain
(Loss) on Real Estate Transactions
|
1,449 | (160 | ) | 167 | ||||||||
|
Non-Water
Sales Earnings
|
929 | 790 | 651 | |||||||||
|
Allowance
for Funds Used During Construction
|
267 | 160 | 92 | |||||||||
|
Other
|
(784 | ) | (143 | ) | (972 | ) | ||||||
|
Total
Other Income (Deductions), Net of Taxes
|
1,861 | 647 | (62 | ) | ||||||||
|
Interest
and Debt Expenses
|
||||||||||||
|
Interest
on Long-Term Debt
|
3,937 | 4,241 | 3,500 | |||||||||
|
Other
Interest Charges
|
393 | 560 | 537 | |||||||||
|
Amortization
of Debt Expense
|
414 | 397 | 374 | |||||||||
|
Total
Interest and Debt Expenses
|
4,744 | 5,198 | 4,411 | |||||||||
|
Net
Income
|
10,209 | 9,424 | 8,781 | |||||||||
|
Preferred
Stock Dividend Requirement
|
38 | 38 | 38 | |||||||||
|
Total
Net Income Applicable to Common Stock
|
$ | 10,171 | $ | 9,386 | $ | 8,743 | ||||||
|
Weighted
Average Common Shares Outstanding:
|
||||||||||||
|
Basic
|
8,448 | 8,377 | 8,270 | |||||||||
|
Diluted
|
8,523 | 8,430 | 8,333 | |||||||||
|
Earnings
Per Common Share:
|
||||||||||||
|
Basic
|
$ | 1.20 | $ | 1.12 | $ | 1.06 | ||||||
|
Diluted
|
$ | 1.19 | $ | 1.11 | $ | 1.05 | ||||||
|
CONSOLIDATED
STATEMENTS OF COMPREHENSIVE INCOME
|
||||||||||||
|
For
the Years Ended December 31, (in thousands)
|
2009 | 2008 | 2007 | |||||||||
|
Net
Income Applicable to Common Stock
|
$ | 10,171 | $ | 9,386 | $ | 8,743 | ||||||
|
Other
Comprehensive Income, net of tax
|
||||||||||||
|
Qualified
cash flow hedging instrument net of tax expense (benefit)
|
||||||||||||
|
of
$48, $(52), and $(148) in 2009, 2008, and 2007,
respectively
|
4 | (81 | ) | (222 | ) | |||||||
|
Adjustment
to post-retirement benefit plans, net of tax (benefit)
|
||||||||||||
|
expense
of $(49), $(189) and $56 in 2009, 2008 and 2007,
respectively
|
(140 | ) | (296 | ) | 143 | |||||||
|
Unrealized
Investment loss, net of tax (benefit) of $(158) and $(162)
|
||||||||||||
|
in
2009 and 2008, respectively
|
247 | (254 | ) | -- | ||||||||
|
Comprehensive
Income
|
$ | 10,282 | $ | 8,755 | $ | 8,664 | ||||||
|
The
accompanying notes are an integral part of these consolidated financial
statements.
|
||||||||||||
F-3
|
CONSOLIDATED
BALANCE SHEETS
|
||||||||||
|
December
31, (in thousands, except share amounts)
|
2009
|
2008
|
||||||||
|
ASSETS
|
||||||||||
|
Utility
Plant
|
$ | 441,412 | $ | 410,471 | ||||||
|
Construction
Work in Progress
|
6,751 | 4,577 | ||||||||
| 448,163 | 415,048 | |||||||||
|
Accumulated
Provision for Depreciation
|
(122,961 | ) | (115,815 | ) | ||||||
|
Net
Utility Plant
|
325,202 | 299,233 | ||||||||
|
Other
Property and Investments
|
5,513 | 6,034 | ||||||||
|
Cash
and Cash Equivalents
|
5,437 | 684 | ||||||||
|
Accounts
Receivable (Less Allowance, 2009 - $472; 2008 - $376)
|
6,502 | 6,653 | ||||||||
|
Accrued
Unbilled Revenues
|
5,416 | 5,372 | ||||||||
|
Materials
and Supplies, at Average Cost
|
1,136 | 1,095 | ||||||||
|
Prepayments
and Other Current Assets
|
1,471 | 1,976 | ||||||||
|
Total
Current Assets
|
19,962 | 15,780 | ||||||||
|
Restricted
Cash
|
12,697 | -- | ||||||||
|
Unamortized
Debt Issuance Expense
|
7,766 | 7,318 | ||||||||
|
Unrecovered
Income Taxes
|
25,649 | 22,856 | ||||||||
|
Pension
Benefits
|
6,897 | 8,911 | ||||||||
|
Post-Retirement
Benefits Other Than Pension
|
2,496 | 2,570 | ||||||||
|
Goodwill
|
3,608 | 3,608 | ||||||||
|
Deferred
Charges and Other Costs
|
5,486 | 6,121 | ||||||||
|
Total
Regulatory and Other Long-Term Assets
|
64,599 | 51,384 | ||||||||
|
Total
Assets
|
$ | 415,276 | $ | 372,431 | ||||||
|
CAPITALIZATION
AND LIABILITIES
|
||||||||||
|
Common
Stockholders' Equity:
|
||||||||||
|
Common
Stock Without Par Value:
|
||||||||||
|
Authorized
- 25,000,000 Shares - Issued and Outstanding:
|
||||||||||
| 2009 - 8,573,744; 2008 - 8,463,269 | $ | 67,286 | $ | 64,804 | ||||||
|
Retained
Earnings
|
41,785 | 39,285 | ||||||||
|
Accumulated
Other Comprehensive Income
|
(502 | ) | (613 | ) | ||||||
|
Common
Stockholders' Equity
|
108,569 | 103,476 | ||||||||
|
Preferred
Stock
|
772 | 772 | ||||||||
|
Long-Term
Debt
|
111,955 | 92,227 | ||||||||
|
Total
Capitalization
|
221,296 | 196,475 | ||||||||
|
Interim
Bank Loans Payable
|
25,000 | 12,074 | ||||||||
|
Current
Portion of Long-Term Debt
|
-- | 8 | ||||||||
|
Accounts
Payable and Accrued Expenses
|
6,538 | 5,700 | ||||||||
|
Accrued
Taxes
|
18 | -- | ||||||||
|
Accrued
Interest
|
954 | 870 | ||||||||
|
Other
Current Liabilities
|
546 | 418 | ||||||||
|
Total
Current Liabilities
|
33,056 | 19,070 | ||||||||
|
Advances
for Construction
|
39,543 | 38,928 | ||||||||
|
Contributions
in Aid of Construction
|
52,072 | 49,420 | ||||||||
|
Deferred
Federal and State Income Taxes
|
32,454 | 30,472 | ||||||||
|
Unfunded
Future Income Taxes
|
20,451 | 18,128 | ||||||||
|
Long-Term
Compensation Arrangements
|
14,898 | 18,331 | ||||||||
|
Unamortized
Investment Tax Credits
|
1,437 | 1,497 | ||||||||
|
Other
Long-Term Liabilities
|
69 | 110 | ||||||||
|
Commitments
and Contingencies
|
||||||||||
|
Total
Capitalization and Liabilities
|
$ | 415,276 | $ | 372,431 | ||||||
|
The
accompanying notes are an integral part of these consolidated financial
statements.
|
||||||||||
F-4
|
CONSOLIDATED
STATEMENTS OF CASH FLOWS
|
||||||||||||
|
For
the Years Ended December 31, (in thousands)
|
2009
|
2008
|
2007
|
|||||||||
|
Operating
Activities:
|
||||||||||||
|
Net
Income
|
$ | 10,209 | $ | 9,424 | $ | 8,781 | ||||||
|
Adjustments
to Reconcile Net Income to Net Cash
|
||||||||||||
|
Provided
by Operating Activities:
|
||||||||||||
|
Deferred
Revenues
|
527 | (777 | ) | (3,823 | ) | |||||||
|
Allowance
for Funds Used During Construction
|
(238 | ) | (123 | ) | (131 | ) | ||||||
|
Depreciation
(including $763 in 2009, $642 in 2008,
|
||||||||||||
|
and
$338 in 2007 charged to other accounts)
|
7,166 | 7,080 | 7,173 | |||||||||
|
Change
in Assets and Liabilities:
|
||||||||||||
|
Decrease
(Increase) in Accounts Receivable and Accrued Unbilled
Revenues
|
175 | (974 | ) | (1,513 | ) | |||||||
|
Decrease
(Increase) in Other Current Assets
|
328 | 204 | (129 | ) | ||||||||
|
Decrease
(Increase) in Other Non-Current Items, net
|
551 | (146 | ) | 2,072 | ||||||||
|
(Decrease)
Increase in Accounts Payable, Accrued
|
||||||||||||
|
Expenses
and Other Current Liabilities
|
438 | (879 | ) | 1,258 | ||||||||
|
Increase
(Decrease) in Deferred Income Taxes and Investment Tax Credits,
Net
|
1,575 | 1,878 | 1,893 | |||||||||
|
Total
Adjustments
|
10,522 | 6,263 | 6,800 | |||||||||
|
Net
Cash and Cash Equivalents Provided by Continuing
Operations
|
20,731 | 15,687 | 15,581 | |||||||||
|
Investing
Activities:
|
||||||||||||
|
Company
Financed Additions to Utility Plant
|
(27,598 | ) | (19,877 | ) | (18,749 | ) | ||||||
|
Advances
from Others for Construction
|
(513 | ) | (737 | ) | (961 | ) | ||||||
|
Net
Additions to Utility Plant Used in Continuing Operations
|
(28,111 | ) | (20,614 | ) | (19,710 | ) | ||||||
|
Purchase
of water systems, net of cash acquired of $26 in 2009
|
(1,469 | ) | (3,500 | ) | -- | |||||||
|
Release
of Restricted Cash
|
-- | 8,393 | -- | |||||||||
|
Net
Cash and Cash Equivalents Used in Investing Activities in Continuing
Operations
|
(29,580 | ) | (15,721 | ) | (19,710 | ) | ||||||
|
Financing
Activities:
|
||||||||||||
|
Net
Proceeds from Interim Bank Loans
|
25,000 | 12,074 | 6,459 | |||||||||
|
Net
Repayment of Interim Bank Loans
|
(12,074 | ) | (6,459 | ) | (5,250 | ) | ||||||
|
Repayment
of Long-Term Debt Including Current Portion
|
(280 | ) | (57 | ) | (62 | ) | ||||||
|
Proceeds
from Issuance of Long-Term Debt
|
6,903 | -- | 6,482 | |||||||||
|
Proceeds
from Issuance of Common Stock
|
1,323 | 1,281 | 1,238 | |||||||||
|
Proceeds
from Exercise of Stock Options
|
390 | 218 | 809 | |||||||||
|
Costs
Incurred to Issue Long-Term Debt and Common Stock
|
(464 | ) | (2 | ) | (367 | ) | ||||||
|
Advances
from Others for Construction
|
513 | 737 | 961 | |||||||||
|
Cash
Dividends Paid
|
(7,709 | ) | (7,411 | ) | (7,181 | ) | ||||||
|
Net
Cash and Cash Equivalents Provided by Financing Activities
|
13,602 | 381 | 3,089 | |||||||||
|
Net
Increase (Decrease) in Cash and Cash Equivalents
|
4,753 | 347 | (1,040 | ) | ||||||||
|
Cash
and Cash Equivalents at Beginning of Year
|
684 | 337 | 1,377 | |||||||||
|
Cash
and Cash Equivalents at End of Year
|
$ | 5,437 | $ | 684 | $ | 337 | ||||||
|
Non-Cash
Investing and Financing Activities:
|
||||||||||||
|
Non-Cash
Contributed Utility Plant (see Note 1 for details)
|
$ | 1,664 | $ | 4,089 | $ | 2,116 | ||||||
|
Short-term
Investment of Bond Proceeds Held in Trust
|
$ | 12,697 | $ | -- | $ | 8,220 | ||||||
|
Supplemental
Disclosures of Cash Flow Information:
|
||||||||||||
|
Cash
Paid for Continuing Operations During the Year for:
|
||||||||||||
|
Interest
|
$ | 4,366 | $ | 4,876 | $ | 4,398 | ||||||
|
State
and Federal Income Taxes
|
$ | 2,907 | $ | 3,273 | $ | 2,096 | ||||||
|
The
accompanying notes are an integral part of these consolidated financial
statements.
|
||||||||||||
F-5
NOTE
1: SUMMARY OF SIGNIFICANT ACCOUNTING POLICIES
BASIS OF PRESENTATION – The
consolidated financial statements include the operations of Connecticut Water
Service, Inc. (the “Company”), an investor-owned holding company and its four
wholly-owned subsidiaries, listed below:
The
Connecticut Water Company (“Connecticut Water”)
Chester
Realty, Inc. (“Chester Realty”)
New
England Water Utility Services, Inc. (“NEWUS”)
Barnstable
Holding Company (“Barnstable Holding”)
Connecticut
Water is our sole public water utility company, which served 88,534 customers in
54 towns throughout Connecticut as of December 31, 2009.
Chester
Realty is a real estate company whose net profits from rental of property are
included in the Other Income (Deductions), Net of Taxes section of the
Consolidated Statements of Income in the Non-Water Sales Earnings
category.
NEWUS is
engaged in water-related services, including the Linebackerâ
program, emergency drinking water, pool water and contract
operations. Its earnings are included in the Non-Water Sales Earnings
category of the Consolidated Statements of Income.
Barnstable
Holding is an inactive holding company, which previously owned the stock of two
other inactive companies, Barnstable Water Company (“Barnstable Water”) and
BARLACO, Inc. (“BARLACO”) prior to their merger with and into Barnstable
Holding. BARLACO was a real estate company which held real estate for
sale. In February 2006, BARLACO sold all of its real estate holdings
to the Town of Barnstable.
On July
23, 2008, the Company announced that it had reached a definitive agreement with
Ellington Acres Company (Ellington Acres) to purchase all of Ellington Acres’
outstanding stock for approximately $1.5 million. Ellington Acres was
a regulated water company serving approximately 750 customers in Ellington and
Somers, Connecticut, situated between two systems in the Company’s Northern
Region that the Company had planned to interconnect. The Company was
able to complete the interconnection between the systems in the second quarter
of 2009, saving ratepayers of both Connecticut Water and Ellington Acres
significant capital expenditures. The DPUC approved the acquisition
in December 2008 and the Company completed the transaction on January 16,
2009. The Company merged Ellington Acres with and into Connecticut
Water during 2009.
On August
25, 2009, the Company completed the acquisition of a small water system serving
a condominium complex in the Town of Madison, CT that was found to have uranium
levels above recently established standards. By acquiring the system,
the Company was able to solve a problem for the condominium residents and to
assist the Town of Madison, CT in addressing uranium found in the water of two
public schools adjacent to the system. The Company has already
installed the treatment system necessary to remove the uranium from the system
and was able to connect to the schools prior to the start of the school
year. Due to the contamination issues, the Company acquired the
system for a nominal fee. The acquisition added the equivalent of
approximately 120 customers to the Company.
The
Company has evaluated all subsequent events through the date the financial
statements were issued.
Intercompany
accounts and transactions have been eliminated.
PUBLIC UTILITY REGULATION –
Our public water utility company is subject to regulation for rates and other
matters by the Connecticut Department of Public Utility Control (“DPUC”) and
follows accounting policies prescribed by the DPUC. The Company
prepares its financial statements in accordance with accounting principles
generally accepted in the United States of America (“GAAP”), which
includes the provisions of Financial Accounting Standards Board’s (“FASB”)
Accounting Standards Codification (“ASC”) 980 “Regulated Operations” (“FASB ASC
980”). FASB ASC 980 requires cost-based, rate-regulated enterprises,
such as Connecticut Water, to reflect the impact of regulatory decisions in
their financial statements. The state regulators, through the rate regulation
process, can create regulatory assets that result when costs are allowed for
ratemaking purposes in a period after the period in which the costs would be
charged to expense by an unregulated enterprise. The balance sheets
include regulatory assets and liabilities as appropriate, primarily related to
income taxes and post-retirement benefit costs. In accordance with
FASB ASC 980, costs which benefit future periods, such as tank painting, are
expensed over the periods they benefit. The Company believes, based on current
regulatory circumstances, that the regulatory assets recorded are likely to be
recovered and that its use of regulatory accounting is appropriate and in
accordance with the provisions of FASB ASC 980. Material regulatory
assets are earning a return.
Regulatory
assets and liabilities are comprised of the following:
|
(in
thousands)
|
December
31
|
|||||||
|
2009
|
2008
|
|||||||
|
Assets:
|
||||||||
|
Postretirement
benefits
|
$ | 9,393 | $ | 11,481 | ||||
|
Unrecovered
income taxes and other
|
20,451 | 18,128 | ||||||
|
Deferred
revenue (included in deferred charges)
|
4,361 | 4,600 | ||||||
|
Other
(included in deferred charges)
|
1,075 | 1,363 | ||||||
|
Total
regulatory assets
|
$ | 35,280 | $ | 35,572 | ||||
|
Liabilities:
|
||||||||
|
Investment
Tax Credits
|
$ | 1,437 | $ | 1,497 | ||||
|
Unfunded
future income taxes and other
|
20,451 | 18,128 | ||||||
|
Total
regulatory liabilities
|
$ | 21,888 | $ | 19,625 | ||||
Postretirement
benefits include pension and other postretirement benefit costs. The
costs include actuarially determined pension and post-retirement benefits costs
in excess of amounts funded. Connecticut Water believes these costs
will be recoverable in future years, through rates, as funding is
required. The recovery period is dependent on contributions made to
the plans and the discount rate used to value the obligations.
F-6
Certain
items giving rise to deferred state income taxes, as well as a portion of
deferred federal income taxes related primarily to differences between book and
tax depreciation expense, are recognized for ratemaking purposes on a cash or
flow-through basis and will be recovered in rates as they reverse.
Deferred
revenue represents a portion of the rate increase granted in Connecticut Water’s
2007 rate decision. The regulator’s decision required the Company to
defer for future collection, beginning in 2008, a portion of the
increase.
Regulatory
liabilities include deferred investment tax credits. These
liabilities will be given back to customers in rates as tax deductions occur in
the future.
USE OF ESTIMATES – The
preparation of financial statements in conformity with GAAP requires management
to make estimates and assumptions that affect the reported amounts of assets and
liabilities, and disclosure of contingent assets and liabilities at the date of
the financial statements, and the reported amounts of revenue and expenses
during the reporting period. Actual results could differ from these
estimates.
REVENUES – The Company’s
accounting policies regarding revenue recognition by segment are as
follows:
Water Activities – Most of our
water customers are billed quarterly, with the exception of larger commercial
and industrial customers, as well as public and private fire protection
customers who are billed monthly. Most customers, except fire
protection customers, are metered. Revenues from metered customers
are based on their water usage multiplied by approved, regulated rates and are
earned when water is delivered. Public fire protection revenues are
based on the length of the water main, and number of hydrants in service and are
earned on a monthly basis. Private fire protection charges are based
on the diameter of the connection to the water main. Our water
companies accrue an estimate for metered customers for the amount of revenues
earned relating to water delivered but unbilled at the end of each quarter,
which is reflected as Accrued Unbilled Revenues in the accompanying balance
sheets.
Real Estate Transactions –
Revenues are recorded when a sale or other transaction has been completed and
title to the real estate has been transferred.
Services and Rentals –
Revenues are recorded when the Company has delivered the services called for by
contractual obligation.
UTILITY PLANT – Utility plant
is stated at the original cost of such property when first devoted to public
service. Utility plant accounts are charged with the cost of
improvements and replacements of property including an allowance for funds used
during construction. Retired or disposed of depreciable plant is
charged to accumulated provision for depreciation together with any costs
applicable to retirement, less any salvage received. Maintenance of
utility plant is charged to expense. Accounting policies relating to
other areas of utility plant are listed below:
Allowance For Funds Used During
Construction – Allowance for Funds Used During Construction (AFUDC) is
the cost of debt and equity funds used to finance the construction of utility
plant. The amount shown on the Consolidated Statements of Income relates to the
equity portion. The debt portion is included as an offset to Other
Interest Charges. Generally, utility plant under construction is not
recognized as part of rate base for ratemaking purposes until facilities are
placed into service, and accordingly, AFUDC is charged to the construction cost
of utility plant. Capitalized AFUDC, which does not represent current
cash income, is recovered through rates over the service lives of the
facilities.
In order
for certain water system acquisitions made in and after 1995 to not degrade
earnings, Connecticut Water has received DPUC approval to record AFUDC on
certain of its investments in these systems. Through December 31, 2006,
Connecticut Water has capitalized approximately $3.9 million of AFUDC relating
to financing these acquisitions. As part of the Company’s most recent
rate decision, approved on January 16, 2007 and effective as of January 1, 2007,
the DPUC has approved the inclusion of this capitalized amount in rate
base. The Company did not record any AFUDC on water system
acquisitions in 2009, 2008 or 2007.
Connecticut
Water’s allowed rate of return on rate base is used to calculate its
AFUDC.
Customers’ Advances For Construction,
Contributed Plant and Contributions In Aid Of Construction –Under the
terms of construction contracts with real estate developers and others,
Connecticut Water periodically receives either advances for the costs of new
main installations or title to the main after it is constructed and financed by
the developer. Refunds are made, without interest, as services are
connected to the main, over periods not exceeding fifteen years and not in
excess of the original advance. Unrefunded balances, at the end of
the contract period, are credited to contributions in aid of construction (CIAC)
and are no longer refundable.
Utility
Plant is added in two ways. The majority of the Company’s plant
additions occur from direct investment of Company funds that originated through
operating activities or financings. The Company manages the
construction of these plant additions. These plant additions are part of the
Company’s depreciable utility plant and are generally part of rate
base. The Company’s rate base is a key component of how its regulated
rates are set, and is recovered through the depreciation component of the
Company’s rates. The second way in which plant additions occur are
through developer advances and contributions. Under this scenario
either the developer funds the additions through payments to the Company, who in
turn manages the construction of the project, or the developer pays for the
plant construction directly and contributes the asset to the Company after it is
complete. Plant additions that are financed by a developer, either
directly or indirectly, are excluded from the Company’s rate base and not
recovered through the rates process, and are also not depreciated.
F-7
The components that comprise Net Additions to Utility Plant during the last three years are as follows:
|
(in
thousands)
|
2009
|
2008
|
2007
|
|||||||||
|
Additions
to Utility Plant:
|
||||||||||||
|
Company
Financed
|
$ | 27,598 | $ | 19,877 | $ | 18,749 | ||||||
|
Allowance
for Funds Used During Construction
|
238 | 123 | 131 | |||||||||
|
Subtotal
– Utility Plant Increase to Rate Base
|
27,836 | 20,000 | 18,880 | |||||||||
|
Advances
from Others for Construction
|
513 | 737 | 961 | |||||||||
|
Net
Additions to Utility Plant
|
$ | 28,349 | $ | 20,737 | $ | 19,841 | ||||||
Depreciation – Depreciation is
computed on a straight-line basis at various rates as approved by the state
regulator on a company by company basis. Depreciation allows the
Company to recover the investment in utility plant over its useful
life. The overall consolidated company depreciation rate, based on
the average balances of depreciable property, was 1.6%, 2.2%, and 2.0% for 2009,
2008, and 2007, respectively.
INCOME TAXES – The Company
provides income tax expense for its utility operations in accordance with the
regulatory accounting policies of the applicable jurisdictions. The
Connecticut DPUC requires the flow-through method of accounting for most state
tax temporary differences as well as for certain federal temporary
differences.
The
Company computed deferred tax liabilities for all temporary book-tax differences
using the liability method prescribed in FASB ASC 740 “Income Taxes” (“FASB ASC
740”). Under the liability method, deferred income taxes are
recognized at currently enacted income tax rates to reflect the tax effect of
temporary differences between the financial reporting and tax bases of assets
and liabilities. Such temporary differences are the result of
provisions in the income tax law that either require or permit certain items to
be reported on the income tax return in a different period than they are
reported in the financial statements. Deferred tax liabilities that
have not been reflected in tax expense due to regulatory treatment are reflected
as Unfunded Future Income Taxes, and are expected to be recoverable in future
years’ rates.
The
Company believes that the majority of deferred income tax assets will be
realized in the future. The majority of unfunded future income taxes
relate to deferred state income taxes.
Deferred
Federal Income Taxes consist primarily of amounts that have been provided for
accelerated depreciation subsequent to 1980, as required by federal income tax
regulations. Deferred taxes have also been provided for temporary
differences in the recognition of certain expenses for tax and financial
statement purposes as allowed by DPUC ratemaking policies.
MUNICIPAL TAXES – Municipal
taxes which are reflected as Taxes Other than Income Taxes are generally
expensed over the twelve-month period beginning on July 1 following the lien
date, corresponding with the period in which the municipal services are
provided.
STOCK OPTIONS – In the past,
the Company has issued stock options to certain employees; but has not done so
since 2003. For more information regarding stock based compensation,
see Note 12, Stock Based Compensation Plans.
UNAMORTIZED DEBT ISSUANCE
EXPENSE – The issuance costs of long-term debt, including the remaining
balance of issuance costs on long-term debt issues that have been refinanced
prior to maturity, and related call premiums, are amortized over the respective
lives of the outstanding debt, as approved by the DPUC.
GOODWILL – As part of the
purchase of the Unionville Water Company in October 2002, the Company recorded
goodwill of $3.6 million representing the amount of the purchase price over net
book value of the assets acquired. The Company accounts for goodwill
in accordance with Accounting Standards Codification 350 “Intangibles – Goodwill
and Other” (“FASB ASC 350”).
In
accordance with FASB ASC 350, goodwill must be allocated to reporting units and
reviewed for impairment at least annually. The Company utilized a net
income valuation approach in the performance of the annual goodwill impairment
test. As of December 31, 2009, there was no impairment of the
Company’s goodwill.
EARNINGS PER SHARE – The
following is a reconciliation of the numerators and denominators of the basic
and diluted earnings per share for the years ended December 31, 2009, 2008, and
2007.
|
Years
ended December 31,
|
2009
|
2008
|
2007
|
|||||||||
|
Numerator
(in thousands)
|
||||||||||||
|
Basic
Net Income Applicable to Common Stock
|
$ | 10,171 | $ | 9,386 | $ | 8,743 | ||||||
|
Diluted
Net Income Applicable to Common Stock
|
$ | 10,171 | $ | 9,386 | $ | 8,743 | ||||||
|
Denominator
(in thousands)
|
||||||||||||
|
Basic
Weighted Average Shares Outstanding
|
8,448 | 8,377 | 8,270 | |||||||||
|
Dilutive
Effect of Stock Awards
|
75 | 53 | 63 | |||||||||
|
Diluted
Weighted Average Shares Outstanding
|
8,523 | 8,430 | 8,333 | |||||||||
|
Earnings
per Share
|
||||||||||||
|
Basic
Earnings per Share
|
$ | 1.20 | $ | 1.12 | $ | 1.06 | ||||||
|
Dilutive
Effect of Stock Awards
|
0.01 | 0.01 | 0.01 | |||||||||
|
Diluted
Earnings per Share
|
$ | 1.19 | $ | 1.11 | $ | 1.05 | ||||||
F-8
NEW ACCOUNTING PRONOUNCEMENTS – In June 2009, the FASB issued Accounting Standards Codification 105-10 “Generally Accepted Accounting Principles” (“FASB ASC 105-10”). FASB ASC 105-10 establishes the FASB Accounting Standards Codification (“ASC”) as the source of authoritative U.S. Generally Accepted Accounting Principles (GAAP) recognized by the FASB to be applied to nongovernmental entities and rules and interpretive releases of the SEC as authoritative GAAP for SEC registrants. The ASC will supersede all the existing non-SEC accounting and reporting standards upon its effective date and subsequently, the FASB will not issue new standards in the form of Statements, FASB Staff Positions, or Emerging Issues Task Force Abstracts. Instead, it will issue Accounting Standards Updates (“ASU”), which will serve to update the Codification, provide background information about the guidance and provide the basis for conclusions on the changes to the Codification. FASB ASC 105-10 is effective for interim and annual periods ending after September 15, 2009. The Company has included references to the Codification , as applicable, in these financial statements.
FASB ASC
820, “Fair Value Measurements and Disclosures” (“FASB ASC 820”) provides a
single definition of fair value, a framework for measuring fair value, and
requires additional disclosure about the use of fair value to measure assets and
liabilities. FASB ASC 820 was effective for fiscal years beginning
after November 15, 2007; as such we partially adopted FASB ASC 820 in the first
quarter of 2008. In February 2008, the FASB issued FASB ASC
820-10-15, which delayed the effective date of FASB ASC 820 for non-financial
assets and liabilities that are recognized or disclosed in the financial
statements on a nonrecurring basis to fiscal years beginning after November 15,
2008. In October 2008, the FASB issued FASB ASC
820-10-35. In April 2009, the FASB issued FASB ASC
820-10-65. The Company currently does not have any financial assets
or liabilities that are valued in inactive or non-orderly markets, and as such
is not currently impacted by the issuance of FASB ASC 820-10-35 or FASB ASC
820-10-65. The Company has adopted FASB ASC 820 for financial assets
and liabilities as of January 1, 2008 and for non-financial assets and
liabilities as of January 1, 2009. See Note 5 for additional
disclosures regarding fair value.
FASB ASC
805-10, “Business Combinations” (“FASB ASC 805-10”), establishes principles and
requirements for how the acquiring company shall recognize and measure in its
financial statements the identifiable assets acquired, liabilities assumed, any
non-controlling interest in the acquired company and goodwill acquired in a
business combination. FASB ASC 805-10 is effective for business combinations for
which the acquisition date is on or after the beginning of the first annual
reporting period beginning on or after December 15, 2008. FASB ASC
805-10 became effective for the Company beginning January 1, 2009.
FASB ASC
815-10-65, “Derivatives and Hedging” (“FASB ASC 815-10-65”) requires enhanced
disclosures about an entity’s derivative and hedging
activities. Under FASB ASC 815-10-65, entities are required to
provide enhanced disclosures about (a) how and why an entity uses derivative
instruments, (b) how derivative instruments and related hedged items are
accounted for, and (c) how derivative instruments and related hedged items
affect an entity’s financial position, financial performance, and cash
flows. The Company does not hold any derivative financial instruments
at December 31, 2009. The Company adopted the provisions of FASB ASC
815-10-65 effective January 1, 2009.
FASB ASC
260-10-45, “Earnings Per Share” (“FASB ASC 260-10-45”) states that unvested
awards of share-based payments with rights to receive dividends or dividend
equivalents are considered participating securities for purposes of calculating
earnings per share. As a result, these participating securities will
be included in the weighted average number of shares outstanding as disclosed on
the face of the income statement. FASB ASC 260-10-45 is effective for
fiscal years beginning after December 15, 2008, and interim periods within those
years. All prior period earnings per share data presented in
financial reports after the effective date shall be adjusted retrospectively to
conform to the provisions of FASB ASC 260-10-45. Early application is
not permitted. The Company adopted FASB ASC 260-10-45 in the first
quarter of 2009. The Company does not have any unvested awards or
payments with nonforfeitable rights to dividends.
FASB ASC
715-20-65, “Compensation – Retirement Benefits” (“FASB ASC 715-20-65”) is
intended to improve disclosures about a company’s postretirement benefit plan
assets by requiring more information about how investment allocation decisions
are made, major categories of plan assets, fair value assumptions and
concentrations of risk. The disclosures required by FASB ASC
715-20-65 have been included in the Company’s December 31, 2009 financial
statements. This statement did not impact the consolidated financial
results of operations, as the requirements are disclosure-only in
nature. Please see Note 11 for disclosures relating to the Company’s
retirement plans.
FASB ASC
825-10-65, “Financial Instruments” (“FASB ASC 825-10-65”) requires disclosures
about fair value of financial instruments for interim periods as well as in
annual financial statements. The disclosures required by FASB ASC
825-10-65 are required for interim periods ending after June 15,
2009. This ASC did not impact the consolidated financial results of
operations, as the requirements are disclosure-only in nature.
FASB ASC
320-10-65 “Investments – Debt and Equity Securities” (“FASB ASC 320-10-65”)
amends the other-than-temporary impairment guidance for debt securities and
improves the presentation and disclosure of other-than-temporary impairments for
both debt and equity securities. This ASC became effective for
interim and annual reporting periods ending after June 15, 2009. The
adoption of this standard did not have an impact on the Company’s operations,
financial position or cash flows.
FASB ASC
860 “Transfers and Servicing” (“FASB ASC 860”) improves the relevance and
comparability of information that a reporting entity provides in its financial
statements about transfers of financial assets. The provisions of
FASB ASC 860 are applicable on January 1, 2010 and will be applied prospectively
to transfer of financial assets completed after December 31,
2009. The Company does not anticipate these provisions will have a
material impact on its financial statements.
FASB ASC
810 “Consolidation” (“FASB ASC 810”) amends the consolidation guidance for
variable interest entities. The provisions are applicable on January
1, 2010. The Company does not anticipate these provisions will have a
material impact on its financial statements.
In August
2009, the FASB issued ASU 2009-5, “Fair Value Measurements and Disclosures
(Topic 820) – Measuring Liabilities at Fair Value” (“FASB ASU
2009-5”). This update provides clarification of the fair value
measurement of financial liabilities when a quoted price in an active market for
an identical liability (level 1 input of the valuation hierarchy) is not
available. FASB ASU 2009-5 is effective in the fourth quarter of
2009. The adoption of this update did not have a material impact on
the Company’s financial statements or disclosures.
In
January 2010, the FASB issued ASU 2010-06, “Fair Value Measurements and
Disclosures (Topic 820): Improving Disclosures about Fair Value Measurements”
(“ASU 2010-06”). This update will require additional information to
be disclosed principally in respect to Level 3 fair value measurements and
transfers to and from Level 1 and Level 2 measurements. In addition,
enhanced disclosures will be required concerning inputs and valuation techniques
used to determine Level 2 and Level 3 fair value measurements. ASU
2010-06 is effective for interim and annual reporting periods beginning after
December 1, 2009, however, the requirements to disclose separately purchases,
sales, issuances, and settlements in the Level 3 reconciliation are effective
for fiscal years beginning after December 15, 2010. The Company does
not anticipate this update will have a material impact on its financial
statements or disclosures.
F-9
NOTE
2: INCOME TAX EXPENSE
Under
ASC 740, we must recognize the tax benefit
from an uncertain tax position only if it is more likely than not that the tax
position will be sustained on examination by the taxing authorities, based on
the technical merits of the position. The tax benefits recognized in the
financial statements from such a position are measured based on the largest
benefit that has a greater than 50% likelihood of being realized upon ultimate
resolution. The reassessment of our tax positions did not have an impact on our
results of operations, financial condition or liquidity. From time to
time, the Company is assessed interest and penalties by taxing
authorities. In those cases, the charges would appear on the Other
line item on the Income Statement. During 2007, the Company was
charged approximately $2,000 in interest relating to the 2003 federal tax
examination. There were no such charges for the years ending December
31, 2009 and 2008. Additionally, there were no accruals relating to
interest or penalties as of December 31, 2009 and 2008. The Company
remains subject to examination by federal authorities for the 2006 through 2008
tax years and by state authorities for the tax years 2006 through
2008.
Income
Tax Expense for the years ended December 31, is comprised of the
following:
|
(in
thousands)
|
2009
|
2008
|
2007
|
|||||||||
|
Federal
Classified as Operating Expense
|
$ | 3,566 | $ | 3,631 | $ | 3,834 | ||||||
|
Federal
Classified as Other Utility Income
|
342 | 267 | 238 | |||||||||
|
Federal
Classified as Other Income
|
||||||||||||
|
Land
Sales
|
640 | -- | 61 | |||||||||
|
Land
Donations
|
(231 | ) | 178 | 83 | ||||||||
|
Non-Water
Sales
|
469 | 360 | 332 | |||||||||
|
Other
|
(162 | ) | (195 | ) | (529 | ) | ||||||
|
Total
Federal Income Tax Expense
|
4,624 | 4,241 | 4,019 | |||||||||
|
State
Classified as Operating Expense
|
(1,100 | ) | (113 | ) | 361 | |||||||
|
State
Classified as Other Utility Income
|
90 | 64 | 57 | |||||||||
|
State
Classified as Other Income
|
||||||||||||
|
Land
Sales
|
3 | -- | 14 | |||||||||
|
Land
Donations
|
24 | (19 | ) | (199 | ) | |||||||
|
Non-Water
Sales
|
123 | 90 | 79 | |||||||||
|
Other
|
(17 | ) | (23 | ) | (101 | ) | ||||||
|
Total
State Income Tax Expense
|
(877 | ) | (1 | ) | 211 | |||||||
|
Total
Income Tax Expense
|
$ | 3,747 | $ | 4,240 | $ | 4,230 | ||||||
The
components of the Federal and State income tax provisions are:
|
(in
thousands)
|
2009
|
2008
|
2007
|
|||||||||
|
Current
Income Taxes
|
||||||||||||
|
Federal
|
$ | 2,338 | $ | 1,906 | $ | 1,938 | ||||||
|
State
|
154 | 110 | 158 | |||||||||
|
Total
Current
|
2,492 | 2,016 | 2,096 | |||||||||
|
Deferred
Income Taxes, Net
|
||||||||||||
|
Federal
|
||||||||||||
|
Investment
Tax Credit
|
(63 | ) | (63 | ) | (63 | ) | ||||||
|
Deferred
Revenue
|
(75 | ) | 264 | 1,202 | ||||||||
|
Land
Donations
|
272 | 187 | 260 | |||||||||
|
Depreciation
|
2,254 | 1,583 | 1,206 | |||||||||
|
Other
|
(102 | ) | 364 | (524 | ) | |||||||
|
Total
Federal
|
2,286 | 2,335 | 2,081 | |||||||||
|
State
|
||||||||||||
|
Land
Donations
|
35 | 85 | (108 | ) | ||||||||
|
Other
(A)
|
(1,066 | ) | (196 | ) | 161 | |||||||
|
Total
State
|
(1,031 | ) | (111 | ) | 53 | |||||||
|
Total
Deferred Income Taxes
|
1,255 | 2,224 | 2,134 | |||||||||
|
Total
Income Tax
|
$ | 3,747 | $ | 4,240 | $ | 4,230 | ||||||
|
(A)
|
–
Fixed capital credits account for $(1,089) of Other in
2009.
|
Deferred
income tax (assets) and liabilities are categorized as follows on the
Consolidated Balance Sheets:
|
(in
thousands)
|
2009
|
2008
|
||||||
|
Unrecovered
Income Taxes
|
$ | (25,648 | ) | $ | (22,856 | ) | ||
|
Deferred
Federal and State Income Taxes
|
32,440 | 30,472 | ||||||
|
Unfunded
Future Income Taxes
|
20,451 | 18,128 | ||||||
|
Unamortized
Investment Tax Credit
|
1,437 | 1,497 | ||||||
|
Other
|
(140 | ) | (142 | ) | ||||
|
Net
Deferred Income Tax Liability
|
$ | 28,540 | $ | 27,099 | ||||
F-10
Deferred
income tax (assets) and liabilities are comprised of the following:
|
(in
thousands)
|
2009
|
2008
|
||||||
|
Charitable
Contribution Carryforward (1)
|
$ | (2,216 | ) | $ | (2,705 | ) | ||
|
Valuation
Allowance
|
1,623 | 2,064 | ||||||
|
Tax
Credit Carryforward (2)
|
(2,350 | ) | (1,624 | ) | ||||
|
Prepaid
Income Taxes on CIAC
|
(66 | ) | (120 | ) | ||||
|
Prepaid
FIT on Services
|
(145 | ) | (112 | ) | ||||
|
Other
Comprehensive Income
|
(289 | ) | (432 | ) | ||||
|
Accelerated
Depreciation
|
30,626 | 28,438 | ||||||
|
Net
of AFUDC and Capitalized Interest
|
257 | 234 | ||||||
|
Unamortized
Investment Tax Credit
|
1,437 | 1,497 | ||||||
|
Other
|
(337 | ) | (141 | ) | ||||
|
Net
Deferred Income Tax Liability
|
$ | 28,540 | $ | 27,099 | ||||
|
(1)
|
2009
charitable contribution carryover expires in
2011.
|
|
(2)
|
State
tax credit carry-forwards expire beginning 2013 and ending in
2032.
|
The
calculation of Pre-Tax Income is as follows:
|
(in
thousands)
|
2009
|
2008
|
2007
|
|||||||||
|
Pre-Tax
Income
|
||||||||||||
|
Net
Income
|
$ | 10,209 | $ | 9,424 | $ | 8,781 | ||||||
|
Income
Taxes
|
3,747 | 4,240 | 4,230 | |||||||||
|
Total
Pre-Tax Income
|
$ | 13,956 | $ | 13,664 | $ | 13,011 | ||||||
In
accordance with required regulatory treatment, deferred income taxes are not
provided for certain timing differences. This treatment, along with other items,
causes differences between the statutory income tax rate and the effective
income tax rate. The differences between the effective income tax
rate recorded by the Company and the statutory federal tax rate are as
follows:
|
2009
|
2008
|
2007
|
||||||||||
|
Federal
Statutory Tax Rate
|
34.0 | % | 34.0 | % | 34.0 | % | ||||||
|
Tax
Effect Differences:
|
||||||||||||
|
State
Income Taxes Net of Federal Benefit
|
(4.3 | %) | -- | 1.1 | % | |||||||
|
Depreciation
|
1.7 | % | 1.6 | % | 1.7 | % | ||||||
|
Charitable
Contributions – Land Donation (Net of Valuation Allowance)
|
(1.3 | %) | 1.5 | % | 0.4 | % | ||||||
|
Pension
Costs
|
(4.1 | %) | (5.1 | %) | (5.3 | %) | ||||||
|
Allowance
for Funds Used During Construction
|
(0.6 | %) | (0.3 | %) | (0.3 | %) | ||||||
|
Change
in Estimate of Prior Year Income Tax Expense
|
0.9 | % | (0.5 | %) | 0.2 | % | ||||||
|
Rate
Case Expense
|
0.4 | % | 0.6 | % | 0.6 | % | ||||||
|
Other
|
0.2 | % | (0.7 | %) | 0.1 | % | ||||||
|
Effective
Income Tax Rate
|
26.9 | % | 31.1 | % | 32.5 | % | ||||||
NOTE
3: COMMON STOCK
The
Company has 25,000,000 authorized shares of common stock, no par
value. A summary of the changes in the common stock accounts for the
period January 1, 2007 through December 31, 2009, appears below:
|
(in
thousands, except share data)
|
Shares
|
Issuance
Amount
|
Expense
|
Total
|
||||||||||||
|
Balance,
January 1, 2007
|
8,270,394 | $ | 61,766 | $ | (1,601 | ) | $ | 60,165 | ||||||||
|
Stock
and equivalents issued through Performance Stock Program, Net of
Forfeitures
|
13,975 | 420 | -- | 420 | ||||||||||||
|
Dividend
Reinvestment Plan
|
54,567 | 1,326 | -- | 1,326 | ||||||||||||
|
Stock
Options Exercised and Expensed
|
37,906 | 902 | (5 | ) | 897 | |||||||||||
|
Balance,
December 31, 2007
|
8,376,842 | $ | 64,414 | $ | (1,606 | ) | $ | 62,808 | ||||||||
|
Stock
and equivalents issued through Performance Stock Program, Net of
Forfeitures
|
22,046 | 465 | -- | 465 | ||||||||||||
|
Dividend
Reinvestment Plan
|
52,606 | 1,287 | -- | 1,287 | ||||||||||||
|
Stock
Options Exercised and Expensed
|
11,775 | 246 | (2 | ) | 244 | |||||||||||
|
Balance,
December 31, 2008
|
8,463,269 | $ | 66,412 | $ | (1,608 | ) | $ | 64,804 | ||||||||
|
Stock
and equivalents issued through Performance Stock Program, Net of
Forfeitures
|
31,515 | 767 | -- | 767 | ||||||||||||
|
Dividend
Reinvestment Plan
|
61,462 | 1,323 | -- | 1,323 | ||||||||||||
|
Stock
Options Exercised and Expensed
|
17,498 | 394 | (2 | ) | 392 | |||||||||||
|
Balance,
December 31, 2009 (1)
|
8,573,744 | $ | 68,896 | $ | (1,610 | ) | $ | 67,286 | ||||||||
|
(1)
|
Includes
42,351 restricted shares and 75,644 common stock equivalent shares
issued through the Performance Stock Programs through December 31,
2009.
|
The
Company may not pay any dividends on its common stock unless full cumulative
dividends to the preceding dividend date for all outstanding shares of Preferred
Stock of the Company have been paid or set aside for payment. All
such Preferred Stock dividends have been paid.
F-11
NOTE
4: RETAINED EARNINGS
The
summary of the changes in Retained Earnings for the period January 1, 2007
through December 31, 2009, appears below:
|
(in
thousands, except per share data)
|
2009
|
2008
|
2007
|
|||||||||
|
Balance,
beginning of year
|
$ | 39,285 | $ | 37,272 | $ | 35,676 | ||||||
|
Net
Income
|
10,209 | 9,424 | 8,781 | |||||||||
|
Sub-total
|
49,494 | 46,696 | 44,457 | |||||||||
|
Dividends
declared:
|
||||||||||||
|
Cumulative
Preferred Stock, Series A, $0.80 per share
|
12 | 12 | 12 | |||||||||
|
Cumulative
Preferred Stock, Series $0.90, $0.90 per share
|
26 | 26 | 26 | |||||||||
|
Common
Stock:
|
||||||||||||
|
2009
$0.900 per Common Share
|
7,671 | -- | -- | |||||||||
|
2008
$0.880 per Common Share
|
-- | 7,373 | -- | |||||||||
|
2007
$0.865 per Common Share
|
-- | -- | 7,147 | |||||||||
|
Total
Dividends Declared
|
7,709 | 7,411 | 7,185 | |||||||||
|
Balance,
end of year
|
$ | 41,785 | $ | 39,285 | $ | 37,272 | ||||||
NOTE
5: FAIR VALUE OF FINANCIAL INSTRUMENTS
FASB ASC
820, “Fair Value Measurements and Disclosures” (“FASB ASC 820”) provides
enhanced guidance for using fair value to measure assets and liabilities and
expands disclosure with respect to fair value measurements. In 2008,
the Company elected the one year deferral option of adoption of FASB ASC 820 for
nonfinancial assets and nonfinancial liabilities that are recognized or
disclosed at fair value in the financial statements on a non-recurring
basis. The Company adopted FASB ASC 820 for financial assets and
liabilities as of January 1, 2008 and FASB ASC 820 as of January 1, 2009 for
non-financial assets and liabilities
FASB ASC
820 establishes a fair value hierarchy that distinguishes between assumptions
based on market data (observable inputs) and the Company’s assumptions
(unobservable inputs). The hierarchy consists of three broad levels,
as follows:
|
|
Level
1 –
|
Quoted
market prices in active markets for identical assets or
liabilities
|
|
|
Level
2 –
|
Inputs
other than Level 1 that are either directly or indirectly
observable
|
|
|
Level
3 –
|
Unobservable
inputs developed using the Company’s estimates and assumptions, which
reflect those that the Company believes market participants would
use.
|
The
following table summarizes our financial instruments measured at fair value on a
recurring basis within the fair value hierarchy as of December 31,
2009:
|
(in
thousands)
|
Level
1
|
Level
2
|
Level
3
|
|||||||||
|
Assets:
|
||||||||||||
|
Investments
|
$ | 1,151 | $ | -- | $ | -- | ||||||
The
following table summarizes our financial instruments measured at fair value on a
recurring basis within the fair value hierarchy as of December 31,
2008:
|
(in
thousands)
|
Level
1
|
Level
2
|
Level
3
|
|||||||||
|
Assets:
|
||||||||||||
|
Investments
|
$ | 1,288 | $ | -- | $ | -- | ||||||
|
Liabilities
|
||||||||||||
|
Interest
Rate Swap
|
$ | -- | $ | 88 | $ | -- | ||||||
The
following methods and assumptions were used to estimate the fair value of each
of the following financial instruments, which are not reported at market value
on the financial statements.
CASH AND CASH EQUIVALENTS –
Cash equivalents consist of highly liquid instruments with original maturities
at the time of purchase of three months or less. The carrying amount
approximates fair value.
RESTRICTED CASH – As part of
the December 2009 bond offering, described in Note 6 to the Notes to the
Consolidated Financial Statements, the Company recorded unused proceeds from
this bond issuance as restricted cash as the funds can only be used for certain
capital expenditures. The Company expects to use the remainder of the
proceeds during 2010. The carrying amount approximates fair
value
LONG-TERM DEBT – The fair
value of the Company's fixed rate long-term debt is based upon borrowing rates
currently available to the Company. As of December 31, 2009 and 2008,
the estimated fair value of the Company's long-term debt was $110,479,000 and
$77,228,000, respectively, as compared to the carrying amounts of $111,955,000
and $92,227,000, respectively.
The fair
values shown above have been reported to meet the disclosure requirements of
FASB ASC 825, “Financial Instruments” (“FASB ASC 825”) and do not purport to
represent the amounts at which those obligations would be settled.
INTEREST RATE SWAP – In 2004,
Connecticut Water entered into a five-year interest rate swap associated with
its $12.5 million 2004 series variable rate unsecured water facilities revenue
refinancing bonds to manage the Company’s exposure to fluctuations in prevailing
interest rates. The swap agreement qualifies for hedge treatment
under FASB ASC 815, “Derivatives and Hedging” (“FASB ASC 815”). The
fair value of the interest rate swap included in the Company’s Consolidated
Balance Sheet in “Other Current Liabilities” at December 31, 2008 was
approximately $88,000. The interest rate swap agreement expired on
March 3, 2009, and was not renewed, and therefore was not on the Company’s
Consolidated Balance Sheet as of December 31, 2009.
F-12
NOTE
6: LONG-TERM DEBT
Long-Term
Debt at December 31, consisted of the following:
|
(in
thousands)
|
2009
|
2008
|
|||||||||
|
The
Connecticut Water Company:
|
|||||||||||
|
Unsecured
Water Facilities Revenue Bonds
|
|||||||||||
| 5.05 | % |
1998
Series A, Due 2028
|
$ | 9,625 | $ | 9,635 | |||||
| 5.125 | % |
1998
Series B, Due 2028
|
7,600 | 7,615 | |||||||
| 4.40 | % |
2003A
Series, Due 2020
|
8,000 | 8,000 | |||||||
| 5.00 | % |
2003C
Series, Due 2022
|
14,795 | 14,915 | |||||||
|
Var.
|
2004
Series Variable Rate, Due 2029
|
12,500 | 12,500 | ||||||||
|
Var.
|
2004
Series A, Due 2028
|
5,000 | 5,000 | ||||||||
|
Var.
|
2004
Series B, Due 2028
|
4,550 | 4,550 | ||||||||
| 5.00 | % |
2005
A Series, Due 2040
|
14,885 | 14,935 | |||||||
| 5.00 | % |
2007
A Series, Due 2037
|
15,000 | 15,000 | |||||||
| 5.10 | % |
2009
A Series, Due 2039
|
20,000 | -- | |||||||
|
Total
The Connecticut Water Company
|
111,955 | 92,150 | |||||||||
|
Chester
Realty:
|
|||||||||||
|
Secured
|
|||||||||||
| 6.39 | % |
NewAlliance
Bank, Due 2017
|
-- | 85 | |||||||
|
Total
Chester Realty
|
-- | 85 | |||||||||
|
Total
Connecticut Water Service, Inc.
|
111,955 | 92,235 | |||||||||
|
Less
Current Portion
|
-- | (8 | ) | ||||||||
|
Total
Long-Term Debt
|
$ | 111,955 | $ | 92,227 | |||||||
The
Company does not have any principal payments required for years 2010 –
2014.
In
December 2009, Connecticut Water borrowed $20 million through the issuance of
Water Facilities Revenue Bonds by the Connecticut Development Authority
(Authority) sold in a single series with an interest rate of five and one-tenth
percent, maturing on December 1, 2039. The proceeds from the sale of
the bonds will be used to finance construction and installation of various
capital improvements to the Company’s existing water system.
During
September 2009, the Company sold a rental property in Killingly,
Connecticut. As part of the sale, the Chester Realty Secured
mortgage, shown above, was paid off in-full.
In
December 2007, Connecticut Water borrowed $15 million through the issuance of
Water Facilities Revenue Bonds by the Authority sold in a single series with an
interest rate of five percent, maturing on December 1, 2037. The
proceeds from the sale of the bonds have been used to finance construction and
installation of various capital improvements to the Company’s existing water
system.
In
November 2005, Connecticut Water borrowed $10 million through the issuance of
Water Facilities Revenue Bonds by the Authority sold in a single series with an
interest rate of five percent, maturing on October 1, 2040.
In
November 2005, Crystal borrowed $5 million through the issuance of Water
Facilities Revenue Bonds by the Authority sold in a single series with an
interest rate of five percent maturing on October 1, 2040. In the
table above, the $5 million Water Facilities Revenue Bonds has been combined
with Connecticut Water $10 million Water Facilities Revenue Bonds.
There are
no mandatory sinking fund payments required on Connecticut Water’s outstanding
Unsecured Water Facilities Revenue Refinancing Bonds. However, the
1998 Series A and B and the 2003 Series A and C Unsecured Water Facilities
Revenue Refinancing Bonds provide for an estate redemption right whereby the
estate of deceased bondholders or surviving joint owners may submit bonds to the
Trustee for redemption at par, subject to a $25,000 per individual holder and a
3% annual aggregate limitation.
Financial Covenants – The
Company is required to comply with certain covenants in connection with various
long term loan agreements. The covenants are normal and customary in
bank and loan agreements. The Company was in compliance with the
covenants at December 31, 2009.
NOTE
7: PREFERRED STOCK
The
Company’s Preferred Stock at December 31, consisted of the
following:
|
(in
thousands, except share data)
|
2009
|
2008
|
||||||
|
Connecticut
Water Service, Inc.
|
||||||||
|
Cumulative
Series A Voting, $20 Par Value; Authorized, Issued and Outstanding 15,000
Shares
|
$ | 300 | $ | 300 | ||||
|
Cumulative
Series $0.90 Non-Voting, $16 Par Value; Authorized 50,000 Shares, Issued
and Outstanding 24,999
|
472 | 472 | ||||||
|
Total
Preferred Stock
|
$ | 772 | $ | 772 | ||||
All or
any part of any series of either class of the Company's issued Preferred Stock
may be called for redemption by the Company at any time. The per
share redemption prices of the Series A and Series $0.90 Preferred Stock, if
called by the Company, are $21.00 and $16.00, respectively.
The
Company is authorized to issue 400,000 shares of an additional class of
Preferred Stock, $25 par value, the general preferences, voting powers,
restrictions and qualifications of which are similar to the Company's existing
Preferred Stock. No shares of the $25 par value Preferred Stock have
been issued.
The
Company is also authorized to issue 1,000,000 shares of $1 par value Preference
Stock, junior to the Company's existing Preferred Stock in rights to dividends
and upon liquidation of the Company. 150,000 of such shares have been
designated as “Series A Junior Participating Preference Stock”..
F-13
NOTE
8: BANK LINES OF CREDIT
In
November 2008, the Company was authorized by its Board of Directors to increase
the available lines of credit from $21 million to $40 million. On
June 30, 2009, the Company let expire one line of credit totaling $6 million and
entered into a new $15 million line of credit agreement, which expires on June
25, 2010. On August 12, 2009, the Company replaced an existing $3
million line of credit with a $10 million line of credit, which expires on
August 11, 2010. Finally, on September 15, 2009, the Company
increased a third line of credit from $12 million to $15 million, with an
expiration date of June 1, 2011. Interim Bank Loans Payable at
December 31, 2009 and 2008 was approximately $25.0 million and $12.1 million,
respectively, and represents the outstanding aggregate balance on these lines of
credit. Interest expense charged on interim bank loans will fluctuate
based on market interest rates.
At
December 31, 2009 and 2008, the weighted average interest rates on these
short-term borrowings outstanding were 2.23% and 1.96%,
respectively.
NOTE
9: UTILITY PLANT AND CONSTRUCTION PROGRAM
The
components of utility plant and equipment at December 31, were as
follows:
|
(in
thousands)
|
2009
|
2008
|
||||||
|
Land
|
$ | 10,391 | $ | 9,917 | ||||
|
Source
of supply
|
28,922 | 27,605 | ||||||
|
Pumping
|
28,511 | 27,646 | ||||||
|
Water
treatment
|
55,377 | 54,643 | ||||||
|
Transmission
and distribution
|
292,140 | 268,927 | ||||||
|
General
|
32,493 | 28,921 | ||||||
|
Held
for future use
|
478 | 419 | ||||||
|
Acquisition
Adjustment
|
(6,900 | ) | (7,607 | ) | ||||
|
Total
|
$ | 441,412 | $ | 410,471 | ||||
The
amounts of depreciable utility plant at December 31, 2009 and 2008 included in
total utility plant were $393,021,000 and $360,440,000,
respectively. Non-depreciable plant is primarily funded through
CIAC.
NOTE
10: TAXES OTHER THAN INCOME TAXES
Taxes
Other than Income Taxes consist of the following:
|
(in
thousands)
|
2009
|
2008
|
2007
|
|||||||||
|
Municipal
Property Taxes
|
$ | 5,052 | $ | 5,129 | $ | 4,903 | ||||||
|
Payroll
Taxes
|
901 | 912 | 837 | |||||||||
|
Total
Taxes Other than Income Taxes
|
$ | 5,953 | $ | 6,041 | $ | 5,740 | ||||||
NOTE
11: LONG-TERM COMPENSATION ARRANGEMENTS
The
Company has accrued for the following long-term compensation arrangements as of
December 31, 2009 and 2008:
|
(in
thousands)
|
2009
|
2008
|
||||||
|
Defined
Benefit Pension Plan
|
$ | 5,899 | $ | 9,624 | ||||
|
Post
Retirement Benefit Other than Pension
|
3,340 | 3,347 | ||||||
|
Supplemental
Executive Retirement Plan
|
4,012 | 3,723 | ||||||
|
Deferred
Compensation
|
1,358 | 1,342 | ||||||
|
Other
Long-Term Compensation
|
289 | 295 | ||||||
|
Total
Long-Term Compensation Arrangements
|
$ | 14,898 | $ | 18,331 | ||||
Investment Strategy – The
Corporate Finance and Investment Committee (the Committee) reviews and approves
the investment strategy of the investments made on behalf of various pension and
post-retirement benefit plans existing under the Company and certain of its
subsidiaries. The Company uses a variety of mutual funds, managed by
different fund managers, to achieve its investment goals. The
Committee wants to ensure that the plans establish a target mix that is expected
to achieve investment objectives, by assuring a broad diversification of
investment assets among investment types, while avoiding short-term changes to
the target asset mix, unless unusual market conditions make such a move
appropriate to reduce risk.
The
targeted asset allocation ratios for those plans as set by the Committee at
December 31, 2009 and 2008 were:
|
2009
|
2008
|
|||||||
|
Equity
|
65 | % | 65 | % | ||||
|
Fixed
Income
|
35 | % | 35 | % | ||||
|
Total
|
100 | % | 100 | % | ||||
The
Committee recognizes that a variation of up to 5% in either direction from its
targeted asset allocation mix is acceptable due to market
fluctuations.
Our
expected long-term rate of return on the various benefit plan assets is based
upon the plan’s expected asset allocation, expected returns on various classes
of plan assets as well as historical returns. The expected long-term
rate of return on the Company’s pension plan is 8%.
F-14
PENSION
Defined Benefit Plan – The
Company and certain of its subsidiaries have a noncontributory defined benefit
pension plan covering qualified employees. In general, the Company’s
policy is to fund accrued pension costs as permitted by federal income tax and
Employee Retirement Income Security Act of 1974 regulations. The
Company amortizes actuarial gains and losses over the average remaining service
period of active participants, without regard to a specified corridor of a
percentage of the greater of the obligation or market-related value of
assets. A contribution of $3,300,000 was made in 2009 for the 2008
plan year. The Company expects to make a contribution of
approximately $3,410,000 in 2010 for the 2009 plan year.
The
Company has amended its pension plan to exclude employees hired after January 1,
2009.
The
following tables set forth the benefit obligation and fair value of the assets
of the Company’s retirement plans at December 31, the latest valuation
date:
|
Pension Benefits (in
thousands)
|
2009
|
2008
|
||||||
|
Change
in benefit obligation:
|
||||||||
|
Benefit
obligation, beginning of year
|
$ | 32,886 | $ | 30,365 | ||||
|
Service
cost
|
1,454 | 1,259 | ||||||
|
Interest
cost
|
2,024 | 1,906 | ||||||
|
Actuarial
loss (gain)
|
1,969 | 410 | ||||||
|
Benefits
paid
|
(1,151 | ) | (1,054 | ) | ||||
|
Benefit
obligation, end of year
|
$ | 37,182 | $ | 32,886 | ||||
|
Change
in plan assets:
|
||||||||
|
Fair
value, beginning of year
|
$ | 23,262 | $ | 28,166 | ||||
|
Actual
return on plan assets
|
5,872 | (7,350 | ) | |||||
|
Employer
contributions
|
3,300 | 3,500 | ||||||
|
Benefits
paid
|
(1,151 | ) | (1,054 | ) | ||||
|
Fair
value, end of year
|
$ | 31,283 | $ | 23,262 | ||||
|
Funded
Status
|
$ | (5,899 | ) | $ | (9,624 | ) | ||
|
Amount
Recognized in Consolidated Balance Sheets Consisted of:
|
||||||||
|
Non-current
asset
|
$ | -- | $ | -- | ||||
|
Current
liability
|
-- | -- | ||||||
|
Non-current
liability
|
(5,899 | ) | (9,624 | ) | ||||
|
Net
amount recognized
|
$ | (5,899 | ) | $ | (9,624 | ) | ||
The
accumulated benefit obligation for all defined benefit pension plans was
approximately $29,719,000 and $26,291,000 at December 31, 2009 and 2008,
respectively.
|
Weighted-average
assumptions used to determine benefit obligations at December
31:
|
2009
|
2008
|
||||||
|
Discount
rate
|
5.95 | % | 6.25 | % | ||||
|
Rate
of compensation increase
|
4.50 | % | 4.50 | % | ||||
|
Weighted-average
assumptions used to determine net periodic cost for years ended December
31:
|
||||||||
|
Discount
rate
|
6.25 | % | 6.30 | % | ||||
|
Expected
long-term return on plan assets
|
8.00 | % | 8.00 | % | ||||
|
Rate
of compensation increase
|
4.50 | % | 4.50 | % | ||||
Prior to
the 2007, the Company used Moody’s AA Corporate Bond Yields when selecting its
Discount Rate for each of the pension plan. Beginning with the year
ended December 31, 2007, in an attempt to move away from generic yield curves
and indices, the Company used a spot yield curve that attempts to mimic expected
benefit payments. The Company based its discount rate assumption on a
single rate on the Citigroup Pension Discount Curve that approximated present
value of the plan’s payment streams.
F-15
The
following table shows the components of periodic benefit costs:
|
Pension Benefits (in
thousands)
|
2009
|
2008
|
2007
|
|||||||||
|
Components
of net periodic benefit costs
|
||||||||||||
|
Service
cost
|
$ | 1,454 | $ | 1,259 | $ | 1,277 | ||||||
|
Interest
cost
|
2,024 | 1,906 | 1,789 | |||||||||
|
Expected
return on plan assets
|
(2,229 | ) | (2,120 | ) | (2,017 | ) | ||||||
|
Amortization
of:
|
||||||||||||
|
Net
transition obligation
|
2 | 2 | 2 | |||||||||
|
Net
loss
|
69 | 69 | 69 | |||||||||
|
Prior
service cost
|
398 | 142 | 345 | |||||||||
|
Net
Periodic Pension Benefit Costs
|
$ | 1,718 | $ | 1,258 | $ | 1,465 | ||||||
The
following table shows the other changes in plan assets and benefit obligations
recognized as a regulatory asset (liability):
|
Pension Benefits (in
thousands)
|
2009
|
2008
|
||||||
|
Change
in net (gain) loss
|
$ | (1,674 | ) | $ | 9,880 | |||
|
Amortization
of transition obligation
|
(2 | ) | (2 | ) | ||||
|
Amortization
of net loss
|
(69 | ) | (69 | ) | ||||
|
Amortization
of prior service cost
|
(398 | ) | (142 | ) | ||||
|
Total
recognized to Regulatory (Liability) Asset
|
$ | (2,143 | ) | $ | 9,667 | |||
|
Amounts
Recognized as a Regulatory Asset (Liability) at December 31: (in
thousands)
|
2009
|
2008
|
||||||
|
Transition
obligation
|
$ | 4 | $ | 6 | ||||
|
Prior
service cost
|
447 | 516 | ||||||
|
Net
(gain) loss
|
6,912 | 8,984 | ||||||
|
Total
Recognized as a Regulatory Asset (Liability)
|
$ | 7,363 | $ | 9,506 | ||||
|
Estimated
Net Periodic Benefit Cost Amortizations for the periods January 1 -
December 31,: (in
thousands)
|
2010
|
|||
|
Amortization
of transition obligation
|
$ | 2 | ||
|
Amortization
of prior service cost
|
69 | |||
|
Amortization
of net loss
|
553 | |||
|
Total
Estimated Net Periodic Benefit Cost Amortizations
|
$ | 624 | ||
Plan
Assets
The
Company’s pension plan weighted-average asset allocations at December 31, 2009,
and 2008 by asset category were as follows:
|
2009
|
2008
|
|||||||
|
Equity
|
66 | % | 58 | % | ||||
|
Fixed
Income
|
34 | % | 42 | % | ||||
|
Total
|
100 | % | 100 | % | ||||
During
the last part of 2008, the Company’s investments in equity securities had lost
value in relation to the overall holdings in the pension plan. Due to
market uncertainty and volatility at the end of 2008, the Company had not
rebalanced the pension plan assets to more closely align with the stated target
allocation. During 2009, the pension plan’s weighted average asset
allocation returned closer to the target allocation.
See Note
5 for discussion on how fair value is determined. The fair value of
the Company’s pension plan assets at December 31, 2009 are as
follows:
|
(in
thousands)
|
Level
1
|
Level
2
|
Level
3
|
|||||||||
|
Asset
Type:
|
||||||||||||
|
Money
Market Fund
|
$ | 208 | $ | -- | $ | -- | ||||||
|
Mutual
Funds:
|
||||||||||||
|
Fixed
Income Funds (1)
|
10,529 | -- | -- | |||||||||
|
Equity
Funds (2)
|
13,017 | -- | -- | |||||||||
|
Index
Funds (3)
|
7,529 | -- | -- | |||||||||
|
Total
|
$ | 31,283 | $ | -- | $ | -- | ||||||
|
(1)
|
Mutual
funds consisting primarily of fixed income
securities.
|
|
(2)
|
Mutual
funds consisting primarily of equity
securities.
|
|
(3)
|
Mutual
funds consisting primarily of funds linked to
indices.
|
The
Plan’s expected future benefit payments are:
|
(in
thousands)
|
||||
|
2010
|
$ | 2,056 | ||
|
2011
|
1,495 | |||
|
2012
|
2,515 | |||
|
2013
|
2,161 | |||
|
2014
|
2,616 | |||
|
Years
2015 – 2019
|
18,428 | |||
F-16
POST-RETIREMENT BENEFITS OTHER THAN
PENSION (PBOP) – In addition to providing pension benefits, Connecticut
Water, provides certain medical, dental and life insurance benefits to retired
employees partially funded by a 501(c)(9) Voluntary Employee Beneficiary
Association Trust that has been approved by the DPUC. Substantially
all of Connecticut Water’s employees may become eligible for these benefits if
they retire on or after age 55 with 10 years of service. The
contribution for calendar years 2009 and 2008 was $650,600 and $841,600,
respectively.
A
regulatory asset has been recorded to reflect the amount which represents the
future FASB ASC 715 costs expected to be recovered in customer
rates. In 1997, Connecticut Water requested and received approval
from the DPUC to include FASB ASC 715 costs in customer rates. The
DPUC’s 1997 limited reopener of Connecticut Water’s general rate proceeding
allowed it to increase customer rates $208,000 annually for FASB ASC 715
costs. Prior to the January 2007 rate decision, Connecticut Water’s
rates allowed for recovery of $473,100 annually for post-retirement benefit
costs other than pension. As a result of the January 2007 rate
decision, the Company will follow the provisions of FASB ASC 715 for regulated
companies that allows the creation of a regulatory asset for costs that will be
recovered in the future under provisions of FASB ASC 980.
The
Company amortizes actuarial gains and losses over the average remaining service
period of active participants, without regard to a specified corridor of a
percentage of the greater of the obligation or market-related value of
assets. Connecticut Water has elected to recognize the transition
obligation on a delayed basis over a period equal to the plan participants' 21.6
years of average future service.
Another
subsidiary company, Barnstable Water, also provides certain health care benefits
to eligible retired employees. Substantially all Barnstable Water
employees may become eligible for these benefits if they retire on or after age
65 with at least 15 years of service. Post-65 medical coverage is
provided for employees up to a maximum coverage of $500 per quarter. Barnstable
Water’s PBOP currently is not funded. Barnstable Water no longer has
any employees; therefore, no new participants will be entering Barnstable
Water’s PBOP. The tables below do not include Barnstable Water’s
PBOP. Barnstable Water’s PBOP had a Benefit Obligation of $52,000 and
$53,000 at December 31, 2009 and 2008, respectively. Additionally,
this plan did not hold any assets as of December 31, 2009 and
2008. Barnstable Water’s PBOP’s net periodic benefit costs were less
than $1,000 in 2009 and 2008.
The
Company has amended its PBOP to exclude employees hired after January 1,
2009. In addition, effective April 1, 2009, the Company will no
longer provide prescription drug coverage for its retirees age 65 and
over. Those retirees, who are entitled to Medicare coverage, will
continue to receive the current non-prescription medical coverage.
The
following tables set forth the benefit obligation and fair value of the assets
of the Connecticut Water’s post-retirement health care benefits at December 31,
the latest valuation date:
|
PBOP Benefits (in
thousands)
|
2009
|
2008
|
||||||
|
Change
in benefit obligation:
|
||||||||
|
Benefit
obligation, beginning of year
|
$ | 7,989 | $ | 12,316 | ||||
|
Service
cost
|
473 | 632 | ||||||
|
Interest
cost
|
488 | 657 | ||||||
|
Plan
participant contributions
|
94 | 144 | ||||||
|
Plan
amendments
|
-- | (3,088 | ) | |||||
|
Actuarial
(gain) loss
|
875 | (2,249 | ) | |||||
|
Benefits
paid
|
(401 | ) | (423 | ) | ||||
|
Benefit
obligation, end of year
|
$ | 9,518 | $ | 7,989 | ||||
|
Change
in plan assets:
|
||||||||
|
Fair
value, beginning of year
|
$ | 4,694 | $ | 5,906 | ||||
|
Actual
return on plan assets
|
1,185 | (1,774 | ) | |||||
|
Employer
contributions
|
658 | 842 | ||||||
|
Plan
participant contributions
|
94 | 143 | ||||||
|
Benefits
paid
|
(401 | ) | (423 | ) | ||||
|
Fair
value, end of year
|
$ | 6,230 | $ | 4,694 | ||||
|
Funded
Status
|
$ | (3,288 | ) | $ | (3,295 | ) | ||
|
Amount
Recognized in Consolidated Balance Sheets Consisted of:
|
||||||||
|
Non-current
asset
|
$ | -- | $ | -- | ||||
|
Current
liability
|
-- | -- | ||||||
|
Non-current
liability
|
(3,288 | ) | (3,295 | ) | ||||
|
Net
amount recognized
|
$ | (3,288 | ) | $ | (3,295 | ) | ||
|
Weighted-average
assumptions used to determine benefit obligations at December
31:
|
2009
|
2008
|
||||||
|
Discount
rate
|
5.80 | % | 6.20 | % | ||||
|
Rate
of compensation increase
|
4.50 | % | 4.50 | % | ||||
|
Weighted-average
assumptions used to determine net periodic cost for years ended December
31:
|
||||||||
|
Discount
rate
|
6.20 | % | 6.30 | % | ||||
|
Expected
long-term return on plan assets
|
5.00 | % | 5.00 | % | ||||
|
Rate
of compensation increase
|
4.50 | % | 4.50 | % | ||||
Prior to
the 2007, the Company used Moody’s AA Corporate Bond Yields when selecting its
Discount Rate for each of the PBOP. Beginning with the year ended
December 31, 2007, in an attempt to move away from generic yield curves and
indices, the Company used a spot yield curve that attempts to mimic expected
benefit payments. The Company based its discount rate assumption on a
single rate on the Citigroup Pension Discount Curve that approximated present
value of the plan’s payment streams.
F-17
The
following table shows the components of periodic benefit costs:
|
PBOP Benefits (in
thousands)
|
2009
|
2008
|
2007
|
|||||||||
|
Components
of net periodic benefit costs
|
||||||||||||
|
Service
cost
|
$ | 473 | $ | 632 | $ | 651 | ||||||
|
Interest
cost
|
488 | 657 | 610 | |||||||||
|
Expected
return on plan assets
|
(272 | ) | (271 | ) | (189 | ) | ||||||
|
Other
|
225 | 225 | 225 | |||||||||
|
Amortization
of:
|
||||||||||||
|
Net
transition obligation
|
(406 | ) | 120 | 120 | ||||||||
|
Recognized
net loss
|
217 | 202 | 342 | |||||||||
|
Net
Periodic Post Retirement Benefit Costs
|
$ | 725 | $ | 1,565 | $ | 1,759 | ||||||
The
following table shows the other changes in plan assets and benefit obligations
recognized as a regulatory asset (liability):
|
PBOP Benefits (in
thousands)
|
2009
|
2008
|
||||||
|
Change
in prior service (credit)
|
$ | -- | $ | (3,088 | ) | |||
|
Change
in net (gain) loss
|
(37 | ) | (203 | ) | ||||
|
Amortization
of transition obligation
|
-- | (120 | ) | |||||
|
Amortization
of prior service credit
|
406 | -- | ||||||
|
Amortization
of net loss
|
(218 | ) | (203 | ) | ||||
|
Total
recognized to Regulatory Asset (Liability)
|
$ | 151 | $ | (3,614 | ) | |||
|
Amounts
Recognized as a Regulatory Asset at December 31: (in
thousands)
|
2009
|
2008
|
||||||
|
Transition
obligation
|
$ | -- | $ | -- | ||||
|
Prior
service cost
|
(2,200 | ) | (2,606 | ) | ||||
|
Net
(gain) loss
|
2,950 | 3,205 | ||||||
|
Total
Recognized as a Regulatory Asset
|
$ | 750 | $ | 599 | ||||
There
were no other changes in plan assets and benefit obligations recognized as a
regulatory asset.
|
Estimated
Benefit Cost Amortizations for the periods January 1 - December 31,: (in
thousands)
|
2010
|
|||
|
Amortization
of transition obligation
|
$ | -- | ||
|
Amortization
of prior service cost
|
(406 | ) | ||
|
Amortization
of net loss (gain)
|
266 | |||
|
Total
Estimated Net Periodic Benefit Cost Amortizations
|
$ | (140 | ) | |
|
Assumed
health care cost trend rates at December 31:
|
2009
|
2008
|
||||||||||||||
|
Medical
|
Dental
|
Medical
|
Dental
|
|||||||||||||
|
Health
care cost trend rate assumed for next year (1)
|
10.0 | % | 10.0 | % | 10.0 | % | 10.0 | % | ||||||||
|
Rate
to which the cost trend rate is assumed to decline
|
5.0 | % | 5.0 | % | 5.0 | % | 5.0 | % | ||||||||
|
Year
that the rate reaches the ultimate trend rate
|
2020 | 2020 | 2019 | 2019 | ||||||||||||
(1) –
Zero percent trend rate from 2008 to 2009.
Assumed
health care cost trend rates have a significant effect on the amounts reported
for the health care plans. A one-percentage-point change in assumed
health care cost trend rates would have the following effects on Connecticut
Water’s plan and would have no impact on the Barnstable Water plan:
|
(in
thousands)
|
1
Percentage-Point
|
|||||||
|
Increase
|
Decrease
|
|||||||
|
Effect
on total of service and interest cost components
|
$ | 139 | $ | (114 | ) | |||
|
Effect
on post-retirement benefit obligation
|
$ | 1,071 | $ | (900 | ) | |||
Plan
Assets
Barnstable
Water’s other post-retirement benefit plan has no assets. Connecticut
Water’s other post-retirement benefit plan weighted-average asset allocations at
December 31, 2009 and 2008 by asset category were as follows:
|
2009
|
2008
|
|||||||
|
Equity
|
65 | % | 56 | % | ||||
|
Fixed
Income
|
35 | % | 44 | % | ||||
|
Total
|
100 | % | 100 | % | ||||
During
the last part of 2008, the Company’s investments in equity securities had lost
value in relation to the overall holdings in the PBOP.
F-18
See Note
5 for discussion on how fair value is determined. The fair value of
the Company’s PBOP assets at December 31, 2009 are as follows:
|
(in
thousands)
|
Level
1
|
Level
2
|
Level
3
|
|||||||||
|
Asset
Type:
|
||||||||||||
|
Money
Market
|
$ | 163 | $ | -- | $ | -- | ||||||
|
Mutual
Funds:
|
||||||||||||
|
Fixed
Income Funds (1)
|
2,043 | -- | -- | |||||||||
|
Equity
Funds (2)
|
2,553 | -- | -- | |||||||||
|
Index
Funds (3)
|
1,471 | -- | -- | |||||||||
|
Total
|
$ | 6,230 | $ | -- | $ | -- | ||||||
|
(1)
|
Mutual
funds consisting primarily of fixed income
securities.
|
|
(2)
|
Mutual
funds consisting primarily of equity
securities.
|
|
(3)
|
Mutual
funds consisting primarily of funds linked to
indices.
|
Cash
Flows
Connecticut
Water contributed $658,000 to its other post-retirement benefit plan in 2009 for
plan year 2009. The Company expects to make a contribution of
approximately $552,000 in 2010 for plan year 2010.
Expected
future benefit payments are:
|
(in
thousands)
|
||||
|
2010
|
$ | 414 | ||
|
2011
|
443 | |||
|
2012
|
483 | |||
|
2013
|
506 | |||
|
2014
|
538 | |||
|
Years
2015 – 2019
|
3,535 | |||
SUPPLEMENTAL EXECUTIVE RETIREMENT
PLAN (SERP) – The Company and certain of its subsidiaries provide
additional pension benefits to senior management through supplemental executive
retirement contracts. At December 31, 2009 and 2008, the actuarial
present values of the projected benefit obligation of these contracts were
$3,636,000 and $3,188,000, respectively. Expense associated with
these contracts was approximately $354,000 for 2009, $48,000 for 2008, and
$1,363,000 for 2007 and is reflected in Other Income (Deductions) in the
Statements of Income. The 2007 SERP expense included costs associated
with the retirement of a former executive.
Included
in Other Property and Investments at December 31, 2009 and 2008 is $3,026,000
and $2,987,000 of investments purchased by the Company to fund these
obligations.
SAVINGS PLAN (401(k)) – The
Company and certain of its subsidiaries maintain an employee savings plan which
allows participants to contribute from 1% to 50% of pre-tax compensation plus
for those aged 50 years and older catch-up contributions as allowed by
law. Effective January 1, 2009, the Company changed its 401(k) plan
to meet the requirements of a special IRS safe harbor. Under the
provisions of this safe harbor plan, the Company will make an automatic
contribution of 3% of compensation for all eligible employees, even if the
employee does not make their own contributions. For employees hired
after January 1, 2009 and ineligible to participate in the Company’s pension
plan, the Company will contribute an additional 1.5% of
compensation. Prior to January 1, 2009, the Company matches 50 cents
for each dollar contributed by the employee up to 4% of the employee’s
compensation. The Company contribution charged to expense in 2009,
2008 and 2007 was $433,000, $231,000, and $213,000, respectively.
The Plan
creates the possibility for an “incentive bonus” contribution to the 401(k) plan
tied to the attainment of a specific goal or goals to be identified each
year. If the specific goal or goals are attained by the end of the
year, all eligible employees, except officers and certain key employees, may
receive up to an additional 1% of their annual base salary as a direct
contribution to their 401(k) account. No incentive bonus was awarded in 2009,
2008 or 2007.
NOTE
12: STOCK BASED COMPENSATION PLANS
The
Company follows FASB ASC 718, “Compensation – Stock Compensation” (“FASB ASC
718”) to account for all share-based payments to employees.
For
purposes of calculating the fair value of each stock grant at the date of grant,
the Company used the Black Scholes Option Pricing model. Options
begin to become exercisable one year from the date of grant. Vesting periods
range from one to five years. The maximum term ranges from five to
ten years.
The
Company’s 2004 Performance Stock Program (2004 PSP), approved by shareholders in
2004, authorizes the issuance of up to 700,000 shares of Company Common
Stock. As of December 31, 2009, there were 561,122 shares available
for grant. There are four forms of awards under the 2004
PSP. Stock options are one form of award. The Company has
not issued any stock options since 2003, and does not anticipate issuing any for
the foreseeable future. The other three forms of award which the
Company has continued to issue are: Restricted Stock, Performance
Shares and Cash Units.
Under the
original Plans (1994 PSP) there were 700,000 shares authorized and 221,215
shares available for payment of dividend equivalents on shares already awarded
under the 1994 PSP as performance shares at December 31, 2009.
Under the
2004 PSP and 1994 PSP (collectively, the PSPs), restricted shares of Common
Stock, common stock equivalents or cash units may be awarded annually to
officers and key employees. Based upon the occurrence of certain
events, including the achievement of goals established by the Compensation
Committee, the restrictions on the stock can be removed. Amounts
charged to expense on account of restricted shares of Common Stock, common stock
equivalents or cash units pursuant to the PSPs were $962,000, $714,000 and
$542,000, for 2009, 2008 and 2007, respectively.
F-19
STOCK OPTIONS – The Company
determined the fair value of each stock grant at the date of grant by using the
Black Scholes Option Pricing model. Options began to become
exercisable one year from the date of grant. Vesting periods ranged
from one to five years. The maximum term ranged from five to ten
years.
No stock
options were awarded or issued during 2009, 2008 or 2007.
|
2009
|
2008
|
2007
|
||||||||||||||||||||||
|
Shares
|
Weighted
Average Exercise Price
|
Shares
|
Weighted
Average Exercise Price
|
Shares
|
Weighted
Average Exercise Price
|
|||||||||||||||||||
|
Options:
|
||||||||||||||||||||||||
|
Outstanding,
beginning of year
|
94,886 | 25.52 | 106,661 | $ | 24.74 | 180,853 | $ | 24.62 | ||||||||||||||||
|
Granted
|
-- | -- | -- | -- | -- | -- | ||||||||||||||||||
|
Forfeited
|
-- | -- | -- | -- | -- | -- | ||||||||||||||||||
|
Terminated
|
-- | -- | -- | -- | (36,286 | ) | 27.71 | |||||||||||||||||
|
Exercised
|
(17,498 | ) | 22.33 | (11,775 | ) | 18.47 | (37,906 | ) | 21.33 | |||||||||||||||
|
Outstanding,
end of year
|
77,388 | $ | 26.24 | 94,886 | $ | 25.52 | 106,661 | $ | 24.74 | |||||||||||||||
|
Exercisable,
end of year
|
77,388 | $ | 26.24 | 94,886 | $ | 25.52 | 106,661 | $ | 24.74 | |||||||||||||||
The
intrinsic value of options exercised during the year ended December 31, 2009 was
$10,000. The following table summarizes the price ranges of the
options outstanding and options exercisable as of December 31,
2009:
|
Options
Outstanding and Exercisable
|
||||||||||||||
|
Shares
|
Weighted
Average Remaining Contractual Life (years)
|
Weighted
Average Exercise Price
|
||||||||||||
|
Range
of prices:
|
||||||||||||||
| $18.00 - $20.99 | 14,074 | 0.9 | $ | 20.42 | ||||||||||
| $21.00 - $23.99 | -- | -- | -- | |||||||||||
| $24.00 - $26.99 | 22,535 | 2.9 | 25.78 | |||||||||||
| $27.00 - $29.99 | 40,779 | 2.9 | 28.51 | |||||||||||
| 77,388 | 2.6 | $ | 26.24 | |||||||||||
The
intrinsic value of exercisable options as of December 31, 2009 was approximately
$63,000. The average remaining contractual term of exercisable
options as of December 31, 2009 was approximately 2.6 years.
RESTRICTED STOCK AND COMMON STOCK
EQUIVALENTS – The Company has granted restricted shares of Common Stock
and Performance Shares to key members of management under the 2004
PSP. These Common Stock share awards provide the grantee with the
rights of a shareholder, including the right to receive dividends and to vote
such shares, but not the right to sell or otherwise transfer the shares during
the restriction period. The value of these restricted shares is based
on the market price of the Company’s Common Stock on the date of grant and
compensation expense is recorded on a straight-line basis over the awards’
vesting periods.
RESTRICTED STOCK
(Non-Performance-Based Awards) – The following tables summarize the
non-performance-based restricted stock amounts and activity:
|
For
the years ended December 31,
|
2009
|
2008
|
||||||||||||||
|
Number
of Shares
|
Grant
Date Weighted Average Fair Value
|
Number
of Shares
|
Grant
Date Weighted Average Fair Value
|
|||||||||||||
|
Non-vested
at beginning of year
|
12,220 | $ | 25.18 | 15,993 | $ | 25.17 | ||||||||||
|
Granted
|
-- | -- | -- | -- | ||||||||||||
|
Vested
|
(3,771 | ) | 25.18 | (3,773 | ) | 25.18 | ||||||||||
|
Forfeited
|
-- | -- | -- | -- | ||||||||||||
|
Non-vested
at end of year
|
8,449 | $ | 25.18 | 12,220 | $ | 25.18 | ||||||||||
The
restricted stock shares began vesting during 2007. There were no
forfeitures during 2009 or 2008.
Total
stock-based compensation recorded in the statement of income related to the
non-performance-based restricted stock awards was $95,000, $95,000 and $48,000
during the years ended December 31, 2009, 2008 and 2007,
respectively. The Compensation Committee of the Board of Directors
may approve retirement of key employees that trigger accelerating
vesting.
As of
December 31, 2009, $187,000 of unrecognized compensation costs related to
non-performance-based restricted stock is expected to be recognized over a
straight-line basis for a period of 6 years.
F-20
RESTRICTED STOCK AND COMMON STOCK
EQUIVALENTS (Performance-Based) – The following tables summarize the
performance-based restricted stock amounts and activity:
|
For
the years ended December 31,
|
2009
|
2008
|
||||||||||||||
|
Number
of Shares
|
Grant
Date Weighted Average Fair Value
|
Number
of Shares
|
Grant
Date Weighted Average Fair Value
|
|||||||||||||
|
Non-vested
at beginning of year
|
32,444 | $ | 24.43 | 22,703 | $ | 24.45 | ||||||||||
|
Granted
|
26,157 | 23.28 | 17,108 | 23.92 | ||||||||||||
|
Vested
|
(10,548 | ) | 23.68 | (5,126 | ) | 22.88 | ||||||||||
|
Forfeited
|
(2,796 | ) | 23.92 | (2,241 | ) | 24.26 | ||||||||||
|
Non-vested
at end of year
|
45,257 | $ | 23.97 | 32,444 | $ | 24.43 | ||||||||||
Total
stock based compensation recorded in the Consolidated Statements of Income
related to performance-based restricted stock awards was $867,000, $619,000, and
$494,000 for the year ended December 31, 2009, 2008, and 2007,
respectively.
The
Company is estimating a forfeiture rate of 30%. Upon meeting specific
performance targets, 10,300 shares, reduced for actual performance targets
achieved in 2009, will begin vesting in the first quarter of 2010 and the
remaining earned shares will vest over three years. The cost is being
recognized ratably over the vesting period. The aggregate intrinsic
value of performance-based restricted stock as of December 31, 2009 was
$468,000.
NOTE
13: SEGMENT REPORTING
Our
Company operates principally in three segments: water activities, real estate
transactions, and services and rentals. The water segment is
comprised of our core regulated water activities to supply water to our
customers. Our real estate transactions segment involves selling or
donating for income tax benefits our limited excess real estate
holdings. Our services and rentals segment provides services on a
contract basis and also leases certain of our properties to third
parties. The accounting policies of each reportable segment are the
same as those described in the summary of significant accounting
policies.
Financial
data for reportable segments is as follows:
|
(in
thousands)
|
Revenues
|
Depreciation
|
Other
Operating Expenses
|
Other
Income (Deductions)
|
Interest
Expense (net of AFUDC)
|
Income
Taxes
|
Net
Income (Loss)
|
|||||||||||||||||||||
|
For
the year ended December 31, 2009
|
||||||||||||||||||||||||||||
|
Water
Activities
|
$ | 60,648 | $ | 6,403 | $ | 38,255 | $ | (934 | ) | $ | 4,506 | $ | 2,719 | $ | 7,831 | |||||||||||||
|
Real
Estate Transactions
|
2,160 | -- | 275 | -- | -- | 436 | 1,449 | |||||||||||||||||||||
|
Services
and Rentals
|
4,735 | 14 | 3,204 | -- | (5 | ) | 593 | 929 | ||||||||||||||||||||
|
Total
|
$ | 67,543 | $ | 6,417 | $ | 41,734 | $ | (934 | ) | $ | 4,501 | $ | 3,748 | $ | 10,209 | |||||||||||||
|
For
the year ended December 31, 2008
|
||||||||||||||||||||||||||||
|
Water
Activities
|
$ | 62,288 | $ | 6,438 | $ | 38,027 | $ | (326 | ) | $ | 5,075 | $ | 3,628 | $ | 8,794 | |||||||||||||
|
Real
Estate Transactions
|
-- | -- | -- | -- | -- | 160 | (160 | ) | ||||||||||||||||||||
|
Services
and Rentals
|
4,855 | 23 | 3,596 | -- | (6 | ) | 452 | 790 | ||||||||||||||||||||
|
Total
|
$ | 67,143 | $ | 6,461 | $ | 41,623 | $ | (326 | ) | $ | 5,069 | $ | 4,240 | $ | 9,424 | |||||||||||||
|
For
the year ended December 31, 2007
|
||||||||||||||||||||||||||||
|
Water
Activities
|
$ | 60,025 | $ | 6,525 | $ | 35,755 | $ | (1,641 | ) | $ | 4,281 | $ | 3,860 | $ | 7,963 | |||||||||||||
|
Real
Estate Transactions
|
227 | -- | 101 | -- | -- | (41 | ) | 167 | ||||||||||||||||||||
|
Services
and Rentals
|
4,411 | 25 | 3,304 | -- | 20 | 411 | 651 | |||||||||||||||||||||
|
Total
|
$ | 64,663 | $ | 6,550 | $ | 39,160 | $ | (1,641 | ) | $ | 4,301 | $ | 4,230 | $ | 8,781 | |||||||||||||
The
Revenues shown in Water Activities above consist of revenues from water
customers of $59,391,000, $61,270,000 and $59,026,000 in the years 2009, 2008
and 2007, respectively. Additionally, there were revenues associated
with utility plant leased to others of $1,257,000, $1,018,000 and $999,000 in
the years 2009, 2008 and 2007, respectively.
The table
below shows assets by segment:
|
At
December 31 (in thousands):
|
2009
|
2008
|
||||||
|
Total
Plant and Other Investments:
|
||||||||
|
Water
|
$ | 330,151 | $ | 304,591 | ||||
|
Non-Water
|
564 | 676 | ||||||
|
Total
Plant and Other Investments
|
330,715 | 305,267 | ||||||
|
Other
Assets:
|
||||||||
|
Water
|
77,622 | 64,734 | ||||||
|
Non-Water
|
6,939 | 2,430 | ||||||
|
Total
Other Assets
|
84,561 | 67,164 | ||||||
|
Total
Assets
|
$ | 415,276 | $ | 372,431 | ||||
F-21
NOTE
14: COMMITMENTS AND CONTINGENCIES
Security – Investment in
security-related improvements is a continuing process and management believes
that the costs associated with any such improvements will be eligible for
recovery in future rate proceedings.
Reverse Privatization –
Connecticut Water derives its rights and franchises to operate from state laws
that are subject to alteration, amendment or repeal, and do not grant permanent
exclusive rights to our service areas. Our franchises are free from
burdensome restrictions, are unlimited as to time, and authorize us to sell
potable water in all towns we now serve. There is the possibility
that states could revoke our franchises and allow a governmental entity to take
over some or all of our systems. From time to time such legislation
is contemplated.
Environmental and Water Quality
Regulation – The Company is subject to environmental and water quality
regulations. Costs to comply with environmental and water quality
regulations are substantial. We are presently in compliance with
current regulations, but the regulations are subject to change at any
time. The costs to comply with future changes in state or federal
regulations, which could require us to modify current filtration facilities
and/or construct new ones, or to replace any reduction of the safe yield from
any of our current sources of supply, could be substantial.
Rate Relief – Connecticut
Water is a regulated public utility, which provides water services to its
customers. The rates that regulated companies charge their water
customers are subject to the jurisdiction of the regulatory authority of the
DPUC. Connecticut Water’s allowed rate of return on equity and return
on rate base are 10.125% and 8.07%, respectively.
In June
2007, the State of Connecticut adopted legislation which permits regulated water
companies to recapture money spent on eligible infrastructure improvements
without a full rate case proceeding. The DPUC may authorize regulated
water companies to use a rate adjustment mechanism, such as a Water
Infrastructure and Conservation Adjustment (WICA), for eligible projects
completed and in service for the benefit of the customers. Regulated
water companies may only charge customers such an adjustment to the extent
allowed by the DPUC based on a water company’s infrastructure assessment report,
as approved by the DPUC and upon semiannual filings which reflect plant
additions consistent with such report.
On
October 29, 2009, the Company filed its second WICA application with the DPUC,
requesting a 2.15% surcharge to customers’ bills, inclusive of the 0.95%
surcharge approved in July 2009. The surcharges can be placed on
customers’ bills at the start of a calendar quarter following the receipt of
DPUC approval. The DPUC approved a cumulative WICA surcharge of 2.1%
on December 23, 2009. The surcharge mechanism became effective
January 1, 2010.
On
January 6, 2010, the Company’s regulated water subsidiary, The Connecticut Water
Company, filed a rate application with the DPUC, requesting a multi-year
increase totaling $19.1 million, over a three year period. The
Company has proposed options for regulatory consideration, including a
multi-year phase-in of rates that, if approved, would be a first in Connecticut
for water utilities. In addition to the phased-in rate increase, the
Company is also seeking a Water Conservation Adjustment Mechanism (“WCAM”), to
allow the Company to continue to aggressively promote water conservation in an
effective manner while addressing the financial impact of increased conservation
by its customers. The WCAM seeks to minimize the effects of
conservation on the Company’s revenues through a recovery mechanism that would
be limited to a change in non-weather related residential sales, while at the
same time allowing for the promotion of conservation to the benefit of customers
and the environment, usually two opposing concerns. In addition to
the conservation efforts that have impacted sales, the need for an increase in
rates is, in part, based upon an investment of approximately $62 million in Net
Utility Plant since 2006, the last time the Company filed a general rate
increase. In addition, increased operating costs for labor, employee
benefits and other general operating needs, including chemicals, is being
requested. No assurance can be given that the DPUC will approve any
or all of the rate relief, the phased-in approach or the WCAM requested by the
Company. The Company expects a decision in this rate case in July
2010, with new rates effective at that time.
Land Dispositions – The
Company and its subsidiaries own additional parcels of land in Connecticut,
which may be suitable in the future for disposition, either by sale or by
donation to municipalities, other local governments or private charitable
entities. These additional parcels would include certain Class I and
II parcels previously identified for long term conservation by the Connecticut
DEP, which have restrictions on development and resale based on provisions of
the Connecticut General Statutes.
The
Company made no land dispositions during the fiscal year ended December 31,
2008. However, during 2008, the Company entered into negotiations
with the Town of Windsor Locks, Connecticut and ultimately agreed to sell a
conservation easement on a well field property no longer needed as a source of
supply for $2.0 million. Windsor Locks was awarded a grant from the
Connecticut Department of Environmental Protection to assist in purchasing the
conservation easement in order to permanently protect the approximate 200-acre
property from development and guarantee public access to the land for passive
recreation. The Company filed an application with the DPUC and
submitted the draft agreement and the form of Conservation Easement to the DPUC
on April 3, 2009. The DPUC approved the transaction on September 9,
2009 and the transaction closed on September 18, 2009. The sale of
the conservation easement generated approximately $1.2 million in net income for
the Real Estate segment for the year ending December 31, 2009. The
Company currently has no other specific plans for land transactions in 2010 and
beyond.
19 Perry Street Litigation –
Connecticut Water’s Unionville division has for many years operated a well field
located at 19 Perry Street, Farmington, Connecticut, pursuant to a 99-year lease
entered into in 1975 with the property owner. This well field
provides approximately half of the daily water supply requirements to the
customers of the Unionville division. In 2004, the original property
owner ceased business operations. The property is now owned by 19
Perry Street, LLC, which obtained the property through a foreclosure
proceeding. In June 2007, the new property owner commenced a lawsuit
in Hartford Superior Court (Housing Section), asserting that Connecticut Water
is in unlawful possession of the property under several theories, including that
the lease is invalid and that Connecticut Water has failed to pay rent when due.
We asserted that we have a valid lease, and did not vacate the
premises. A trial before a judge was held in November 2007, and a
decision was issued on April 30, 2008. In its decision, the Court
ruled that the lease is valid. However, in deciding the parties’
contentions regarding the proper form and amount of rental payments due, the
Court ruled that Connecticut Water was in breach of its obligation to pay rent
on the property and therefore entered an order of eviction.
On May 5,
2008, Connecticut Water filed a timely appeal of the decision in the Connecticut
Appellate Court. Subsequently, the Connecticut Supreme Court
transferred the case to itself for determination. On February 2,
2010, the Connecticut Supreme Court issued its decision reinstating the lease
and allowing Connecticut Water to retain possession of the premises, contingent
upon the Company paying the property owner all back rent, together with interest
and court costs. We have presented the property owner with our
calculations as to the rent and interest due, and have requested the property
owner's calculation as to court costs.
F-22
On August
5, 2008, Connecticut Water was served with a related lawsuit in which 19 Perry
Street, LLC seeks the payment of back rent with respect to the
property. In February, 2009, the lawsuit for back rent was stayed
pending the resolution of the appeal related to the eviction case. We
have been accruing back rent going back to when 19 Perry Street, LLC became
the property owner. However, we have not yet confirmed that the
property owner agrees with our calculation as to either the amount due or the
time over which back rent is owed. If the property owner does not
agree with our calculation and chooses to pursue this case, we intend to
vigorously defend the action for back rent as to all amounts over the amount
which has been set aside. That action notwithstanding, with the
Supreme Court decision, the Company maintains its use of the property to provide
water to customers of its Unionville division.
Capital Expenditures – The
Company has received approval from its Board of Directors to spend $25.8 million
on capital expenditures in 2010, in part due to increased spending primarily for
infrastructure improvements.
NOTE
15: SUBSEQUENT EVENTS
Acquisitions
In
January 2010, NEWUS acquired the assets of Home Service USA. Prior to
the acquisition Home Service USA offered Connecticut Water customers coverage
for failure of home plumbing and septic drainage lines. NEWUS agreed
to purchase the right to provide the service to Connecticut Water customers and
began offering its own comparable coverage. As part of the agreement,
Home Service USA will not offer its products to Connecticut Water customers for
a period of ten years. The new products offered by NEWUS will be
integrated into the Linebacker®
program.
On
February 16, 2010, the Company announced the acquisition of the assets of water
systems in Killingworth and Mansfield, Connecticut. These
acquisitions added approximately 500 customers to the Company. The
system acquired in Killingworth has water quality issues that the previous
owners were unable to address. The Company will evaluate options,
obtain regulatory approval and invest in the technology necessary to bring the
system into compliance with water quality standards in effect in
Connecticut. Additionally, the Company announced that it had reached
an agreement to acquire a water system in Old Lyme, Connecticut. It
is expected, upon approval by the DPUC, that this acquisition will add
approximately 100 customers to the Company.
Rate
Relief
On
January 6, 2010, the Company’s regulated water subsidiary, The Connecticut Water
Company, filed a rate application with the DPUC, requesting a multi-year
increase totaling $19.1 million, over a three year period. The
Company has proposed options for regulatory consideration, including a
multi-year phase-in of rates that, if approved, would be a first in Connecticut
for water utilities. In addition to the phased-in rate increase, the
Company is also seeking a Water Conservation Adjustment Mechanism (“WCAM”), to
allow the Company to continue to aggressively promote water conservation in an
effective manner while addressing the financial impact of increased conservation
by its customers. The WCAM seeks to minimize the effects of
conservation on the Company’s revenues through a recovery mechanism that would
be limited to a change in non-weather related residential sales, while at the
same time allowing for the promotion of conservation to the benefit of customers
and the environment, usually two opposing concerns. In addition to
the conservation efforts that have impacted sales, the need for an increase in
rates is, in part, based upon an investment of approximately $62 million in Net
Utility Plant since 2006, the last time the Company filed a general rate
increase. In addition, increased operating costs for labor, employee
benefits and other general operating needs, including chemicals, is being
requested. No assurance can be given that the DPUC will approve any
or all of the rate relief, the phased-in approach or the WCAM requested by the
Company. The Company expects a decision in this rate case in July
2010, with new rates effective at that time.
NOTE
16: QUARTERLY FINANCIAL DATA (Unaudited)
Selected
quarterly financial data for the years ended December 31, 2009 and 2008 appears
below:
(in
thousands, except for per share data)
|
First
Quarter
|
Second
Quarter
|
Third
Quarter
|
Fourth
Quarter
|
|||||||||||||||||||||||||||||
|
2009
|
2008
|
2009
|
2008
|
2009
|
2008
|
2009
|
2008
|
|||||||||||||||||||||||||
|
Operating
Revenues
|
$ | 13,381 | $ | 13,569 | $ | 15,147 | $ | 16,020 | $ | 16,659 | $ | 17,040 | $ | 14,204 | $ | 14,641 | ||||||||||||||||
|
Total
Utility Operating Income
|
2,223 | 2,812 | 3,215 | 3,982 | 5,451 | 3,994 | 2,203 | 3,187 | ||||||||||||||||||||||||
|
Net
Income
|
1,144 | 1,705 | 2,266 | 2,951 | 5,759 | 2,835 | 1,040 | 1,933 | ||||||||||||||||||||||||
|
Basic
Earnings per Common Share
|
0.13 | 0.20 | 0.27 | 0.35 | 0.67 | 0.34 | 0.13 | 0.23 | ||||||||||||||||||||||||
|
Diluted
Earnings per Common Share
|
0.13 | 0.20 | 0.27 | 0.35 | 0.67 | 0.34 | 0.12 | 0.22 | ||||||||||||||||||||||||
F-23
|
Exhibit
Number
|
Description
|
||
| 3.1 |
Certificate
of Incorporation of Connecticut Water Service, Inc. amended and restated
as of April, 1998. (Exhibit 3.1 to Form 10-K for the year ended
12/31/98).
|
||
| 3.2 |
By-Laws,
as amended, of Connecticut Water Service, Inc. as amended and restated as
of August 16, 2007. (Exhibit 3.1 to Form 8-K filed on August 21,
2007).
|
||
| 3.3 |
Certification
of Incorporation of The Connecticut Water Company effective April, 1998.
(Exhibit 3.3 to Form 10-K for the year ended 12/31/98).
|
||
| 3.4 |
Certificate
of Amendment to the Amended and Restated Certificate of Incorporation of
Connecticut Water Service, Inc. dated August 6, 2001. (Exhibit 3.4 to Form
10-K for the year ended 12/31/01).
|
||
| 3.5 |
Certificate
of Amendment to the Amended and Restated Certificate of Incorporation of
Connecticut Water Service, Inc. dated April 23, 2004. (Exhibit 3.5 to Form
10-Q for the quarter ended 3/31/03).
|
||
| 4.1 |
Loan
Agreement dated as of October 1, 2003 between the Connecticut Development
Authority and The Connecticut Water Company. (Exhibit 4.12 to Form 10-K
for the year ended 12/31/03).
|
||
| 4.2 |
Indenture
of Trust dated as of October 1, 2003 between the Connecticut Development
Authority and The Connecticut Water Company. (Exhibit 4.13 to Form 10-K
for the year ended 12/31/03).
|
||
| 4.3 |
Loan
Agreement dated as of October 1, 2003 between the Connecticut Development
Authority and The Connecticut Water Company. (Exhibit 4.14 to Form 10-K
for the year ended 12/31/03).
|
||
| 4.4 |
Indenture
of Trust dated as of October 1, 2003 between the Connecticut Development
Authority and The Connecticut Water Company. (Exhibit 4.15 to
Form 10-K for the year ended 12/31/03).
|
||
| 4.5 |
Bond
Purchase Agreement dated as of October 10, 2003 among Connecticut
Development Authority, The Connecticut Water Company and A.G. Edwards and
Sons, Inc. (Exhibit 4.16 to Form 10-K for the year ended
12/31/03).
|
||
| 4.6 |
Line
of Credit Agreement dated as of March 12, 2004 between Webster Bank and
Connecticut Water Service, Inc. (Exhibit 4.17 to Form 10-Q for the quarter
ended 3/31/04).
|
||
| 4.7 |
Bond
Purchase Agreement dated as of March 12, 2004, among The Connecticut Water
Company and A.G. Edwards & Sons, Inc. (Exhibit 4.18 to Form 10-Q for
the quarter ended 3/31/04).
|
||
| 4.8 |
Indenture
of Trust, dated as of March 1, 2004, between The Connecticut Water Company
and U.S. Bank National Association, as Trustee. (Exhibit 4.19
to Form 10-Q for the quarter ended 3/31/04).
|
||
| 4.9 |
Reimbursement
and Credit Agreement, dated as of March 1, 2004, between The Connecticut
Water Company and Citizen’s Bank of Rhode Island. (Exhibit 4.20 to Form
10-Q for the quarter ended 3/31/04).
|
||
| 4.10 |
Letter
of Credit issued by Citizen’s Bank of Rhode Island, dated as of March 4,
2004. (Exhibit 4.21 to Form 10-Q for the quarter ended
3/31/04).
|
||
| 4.11 |
Agreement
No. DWSRF 200103-C Project Loan Agreement between the State of Connecticut
and Unionville Water Company under the Drinking Water State Revolving Fund
(DWSRF) Program, dated as of April 19, 2004. (Exhibit 4.22 to
Form 10-Q for the quarter ended 6/30/04).
|
||
| 4.12 |
Collateral
Assignment of Water Service Charges and Right to Receive Water Service
Expense Assessments and Security Agreement between Unionville Water
Company and the State of Connecticut, dated as of June 3,
2004. (Exhibit 4.23 to Form 10-Q for the quarter ended
6/30/04).
|
||
| 4.13 |
Bond
Purchase Agreement, dated September 1, 2004, among The Connecticut Water
Company, Connecticut Development Authority, and A.G. Edwards & Sons,
Inc. (Exhibit 4.24 to Form 10-Q for the quarter ended
9/30/04).
|
||
| 4.14 |
Indenture
of Trust, dated August 1, 2004, between The Connecticut Water Company and
U.S. Bank National Association, as Trustee, 2004A
Series. (Exhibit 4.25 to Form 10-Q for the quarter ended
9/30/04).
|
||
| 4.15 |
Indenture
of Trust, dated August 1, 2004, between The Connecticut Water Company and
U.S. Bank National Association, as Trustee, 2004B
Series. (Exhibit 4.26 to Form 10-Q for the quarter ended
9/30/04).
|
||
| 4.16 |
Loan
Agreement, dated August 1, 2004, between The Connecticut Water Company and
Connecticut Development Authority for 2004 Series. (Exhibit
4.27 to Form 10-Q for the quarter ended 9/30/04).
|
||
| 4.17 |
Loan
Agreement, dated August 1, 2004, between The Connecticut Water Company and
Connecticut Development Authority for 2004B Series. (Exhibit
4.28 to Form 10-Q for the quarter ended 9/30/04).
|
||
| 4.18 |
Reimbursement
and Credit Agreement, dated as of August 1, 2004, between The Connecticut
Water Company and Citizen’s Bank of Rhode Island, 2004A
Series. (Exhibit 4.29 to Form 10-Q for the quarter ended
9/30/04).
|
||
| 4.19 |
Reimbursement
and Credit Agreement, dated as of August 1, 2004, between The Connecticut
Water Company and Citizen’s Bank of Rhode Island, 2004B
Series. (Exhibit 4.30 to Form 10-Q for the quarter ended
9/30/04).
|
||
| 4.20 |
Letters
of Credit, each dated September 2, 2004, between The Connecticut Water
Company and Citizen’s Bank of Rhode Island, with respect to each of the
2004A and 2004B Series Bonds. (Exhibit 4.31 to Form 10-Q for
the quarter ended 9/30/04).
|
||
| 4.21 |
Bond
Purchase Agreement, dated October 28, 2005, among The Connecticut Water
Company, Connecticut Development Authority and A.G. Edwards & Sons,
Inc., Connecticut Water 2005A Series. (Exhibit 4.24 to Form 10-K for the
year ended 12/31/05).
|
||
| 4.22 |
Loan
Agreement, dated October 1, 2005, between The Connecticut Water Company
and Connecticut Development Authority, Connecticut Water 2005A Series.
(Exhibit 4.25 to Form 10-K for the year ended
12/31/05).
|
||
| 4.23 |
Indenture
of Trust, dated October 1, 2005, between Connecticut Development Authority
and U.S. Bank National Association, as Trustee, Connecticut Water 2005A
Series. (Exhibit 4.26 to Form 10-K for the year ended
12/31/05).
|
||
| 4.24 |
Insurance
Agreement, dated November 30, 2005, between The Connecticut Water Company
and Financial Guaranty Insurance Company, as Insurer for The Connecticut
Water 2005A Series. (Exhibit 4.27 to Form 10-K for the year ended
12/31/05).
|
||
| 4.25 |
Bond
Purchase Agreement, dated November 16, 2005, among The Crystal Water
Company of Danielson, Connecticut Water Service, Inc., Connecticut
Development Authority and A.G. Edwards & Sons, Inc., Crystal Water
2005A Series. (Exhibit 4.28 to Form 10-K for the year ended
12/31/05).
|
||
| 4.26 |
Guaranty
dated as of October 1, 2005 from Connecticut Water Service, Inc. to U.S.
Bank National Association, as Trustee, Crystal Water 2005A Series.
(Exhibit 4.29 to Form 10-K for the year ended
12/31/05).
|
||
| 4.27 |
Loan
Agreement, dated October 1, 2005, between The Crystal Water Company of
Danielson and Connecticut Development Authority, Crystal Water 2005A
Series. (Exhibit 4.30 to Form 10-K for the year ended
12/31/05).
|
||
| 4.28 |
Indenture
of Trust, dated October 1, 2005, between Connecticut Development Authority
and U.S. Bank National Association, as Trustee, Crystal Water 2005A
Series. (Exhibit 4.31 to Form 10-K for the year ended
12/31/05).
|
||
| 4.29 |
Insurance
Agreement, dated November 30, 2005, between The Crystal Water Company of
Danielson and Financial Guaranty Insurance Company, as Insurer for the
Crystal Water 2005A Series. (Exhibit 4.32 to Form 10-K for the year ended
12/31/05).
|
||
| 4.30 |
First
Amendment to Reimbursement and Credit Agreement, dated as of April 28,
2006, between The Connecticut Water Company and Citizen’s Bank of Rhode
Island, 2004A Series. (Exhibit 10.1 to Form 10-Q for the period
ending 3/31/06).
|
||
| 4.31 |
First
Amendment to Reimbursement and Credit Agreement, dated as of April 28,
2006, between The Connecticut Water Company and Citizen’s Bank of Rhode
Island, 2004B Series. (Exhibit 10.2 to Form 10-Q for the period
ending 3/31/06).
|
||
| 4.32 |
First
Amendment to Reimbursement and Credit Agreement, dated as of April 28,
2006, between The Connecticut Water Company and Citizen’s Bank of Rhode
Island, 2004 Series Variable Rate, due 2029. (Exhibit 10.3 to Form 10-Q
for the period ending 3/31/06).
|
||
| 4.33 |
Bond
Purchase Agreement, dated December 5, 2007, among The Connecticut Water
Company, Connecticut Development Authority, and Edward Jones and Company,
L.P. water facilities Revenue Bonds – 2007A Series
(AMT). (Exhibit 4.33 to Form 10-K for the year ended
12/31/07)
|
||
| 4.34 |
Loan
Agreement dated as of December 5, 2007, among The Connecticut Water
Company, and Connecticut Development Authority, Water Facilities Revenue
Bonds – 2007A Series (AMT). (Exhibit 4.34 to Form 10-K for the
year ended 12/31/07)
|
||
| 4.35 |
Indenture
of Trust dated as of December 5, 2007, among The Connecticut Water
Company, and Connecticut Development Authority, Water Facilities Revenue
Bonds – 2007A Series (AMT). (Exhibit 4.35 to Form 10-K for the
year ended 12/31/07)
|
||
| 4.36 |
Second
Amendment to Reimbursement and Credit Agreement, dated as of August 23,
2007 between The Connecticut Water Company and Citizen’s Bank of Rhode
Island 2004 A Series. (Exhibit 10.2 to the Form 10-Q for the
period ending June 30, 2009)
|
||
| 4.37 |
Second
Amendment to Reimbursement and Credit Agreement, dated as of August 23,
2007 between The Connecticut Water Company and Citizen’s Bank of Rhode
Island 2004 B Series. (Exhibit 10.3 to the Form 10-Q for the
period ending June 30, 2009)
|
||
| 4.38 |
Second
Amendment to Reimbursement and Credit Agreement, dated as of August 23,
2007 between The Connecticut Water Company and Citizen’s Bank of Rhode
Island 2004 Series Variable Rate, due 2009. (Exhibit 10.4 to
the Form 10-Q for the period ending June 30, 2009)
|
||
| 4.39 |
Third
Amendment to Reimbursement and Credit Agreement, dated as of August 23,
2007 between The Connecticut Water Company and Citizen’s Bank of Rhode
Island 2004 A Series. (Exhibit 10.5 to the Form 10-Q for the
period ending June 30, 2009)
|
||
| 4.40 |
Third
Amendment to Reimbursement and Credit Agreement, dated as of August 23,
2007 between The Connecticut Water Company and Citizen’s Bank of Rhode
Island 2004 B Series. (Exhibit 10.6 to the Form 10-Q for the
period ending June 30, 2009)
|
||
| 4.41 |
Third
Amendment to Reimbursement and Credit Agreement, dated as of August 23,
2007 between The Connecticut Water Company and Citizen’s Bank of Rhode
Island 2004 Series Variable Rate, due 2009. (Exhibit 10.7 to
the Form 10-Q for the period ending June 30, 2009)
|
||
| 4.42 | * |
Bond
Purchase Agreement among The Connecticut Water Company, the Connecticut
Development Authority and Edward D. Jones &Co., L.P., as underwriter
dated December 2, 2009.
|
|
| 4.43 | * |
Loan
Agreement between The Connecticut Water Company and the Connecticut
Development Authority, dated as of December 1, 2009.
|
|
| 4.44 | * |
Indenture
of Trust for the Bonds between the Connecticut Development Authority and
U.S. Bank National Associations, as Trustee, dated December 1,
2009.
|
|
| 10.1 |
Pension
Plan Fiduciary Liability Insurance for The Connecticut Water Company
Employees' Retirement Plan and Trust, Savings Plan of The Connecticut
Water Company and The Connecticut Water Company VEBA Trust
Fund. (Exhibit 10.1 to Registration Statement No.
2-74938).
|
||
| 10.2 |
Directors
and Officers Liability and Corporation Reimbursement
Insurance. (Exhibit 10.2 to Registration Statement No.
2-74938).
|
||
| 10.3 |
Directors
Deferred Compensation Plan, effective as of January 1, 1980, as amended as
of January 1, 2008. (Exhibit 10.7 to Form 8-K filed on January
30, 2008).
|
||
| 10.4 |
Savings
Plan of The Connecticut Water Company, amended and restated effective as
of October 1, 2000. (Exhibit 10.12 to Form 10-K for the year ended
12/31/01).
|
||
| 10.4 | a |
Trust
Agreement between Connecticut Water Company and Riggs Bank N.A., Trustee,
dated as of June 1, 2002. (Exhibit 10.12.1 to Form 10-K for the
year ended 12/31/03).
|
|
| 10.4 | b |
Post-EGTRRA
Amendment to the Savings Plan of The Connecticut Water Company, effective
January 1, 2002. (Exhibit 10.12.2 to Form 10-K for the year
ended 12/31/03).
|
|
| 10.4 | c |
Supplemental
Participation Agreement to the Savings Plan of The Connecticut Water
Company between The Unionville Water Company and Connecticut Water
Company, dated December 30, 2003. (Exhibit 10.12.3 to Form 10-K
for the year ended 12/31/03).
|
|
| 10.4 | d |
Supplemental
Participation Agreement to the Savings Plan of The Connecticut Water
Company between The Crystal Water Company of Danielson and Connecticut
Water Company, dated December 30, 2003. (Exhibit 10.12.4 to
Form 10-K for the year ended 12/31/03).
|
|
| 10.4 | e |
Supplemental
Participation Agreement to the Savings Plan of The Connecticut Water
Company between Unionville Water Company and Connecticut Water Company,
dated February 23, 2004. (Exhibit 10.12.5 to Form 10-K for the
year ended 12/31/04).
|
|
| 10.4 | f |
Nonstandardized
Adoption Agreement Prototype Cash or Deferred Profit-Sharing Plan,
effective as of January 1, 2009.
|
|
| 10.5 |
The
Connecticut Water Company Employees’ Retirement Plan as amended and
restated as of January 1, 1997. (Exhibit 10.11 to Form 10-K for
the year ended 12/31/98).
|
||
| 10.5 | a |
First
Amendment, dated August 16, 2000 to the amended and restated Connecticut
Water Company Employees’ Retirement Plan effective January 1,
1997. (Exhibit 10.13.1 to Form 10-K for the year ended
12/31/02).
|
|
| 10.5 | b |
Second
Amendment, dated November 14, 2000 to the amended and restated Connecticut
Water Company Employees’ Retirement Plan effective January 1, 1997.
(Exhibit 10.13.2 to Form 10-K for the year ended
12/31/02).
|
|
| 10.5 | c |
Third
Amendment, dated November 14, 2001 to the amended and restated Connecticut
Water Company Employees’ Retirement Plan effective January 1, 1997.
(Exhibit 10.13.3 to Form 10-K for the year ended
12/31/02).
|
|
| 10.5 | d |
Fourth
Amendment, dated August 14, 2002 to the amended and restated Connecticut
Water Company Employees’ Retirement Plan effective January 1, 1997.
(Exhibit 10.13.4 to Form 10-K for the year ended
12/31/02).
|
|
| 10.5 | e |
Fifth
Amendment, dated August 14, 2002 to the amended and restated Connecticut
Water Company Employees’ Retirement Plan effective January 1,
1997. (Exhibit 10.13.5 to Form 10-K for the year ended
12/31/02).
|
|
| 10.5 | f |
Sixth
Amendment, dated November 10, 2003 to the amended and restated Connecticut
Water Company Employees’ Retirement Plan effective November 12,
2003. (Exhibit 10.13.6 to Form 10-K for the year ended
12/31/03).
|
|
| 10.5 | g |
Seventh
Amendment, dated May 12, 2004 to the amended and restated Connecticut
Water Employees’ Retirement Plan effective January 1,
1997. (Exhibit 10.13.7 to Form 10-K for the year ended
12/31/04).
|
|
| 10.5 | h |
Eighth
Amendment, effective March 28, 2005, to the amended and restated
Connecticut Water Company Employees’ Retirement Plan effective January 1,
1997. (Exhibit 10.5h to Form 10-K for the year ended
12/31/07).
|
|
| 10.5 | i |
Ninth
Amendment, effective August 9, 2006, to the amended and restated
Connecticut Water Company Employees’ Retirement Plan effective January 1,
1997. (Exhibit 10.5i to Form 10-K for the year ended
12/31/07).
|
|
| 10.5 | j |
Tenth
Amendment, effective January 1, 2008, to the amended and restated
Connecticut Water Company Employees’ Retirement plan effective January 1,
1997. (Exhibit 10.1 to Form 8-K dated
1/13/09).
|
|
| 10.5 | k |
Eleventh
Amendment, effective January 1, 2009, to the amended and restated
Connecticut Water Company Employees’ Retirement Plan effective January 1,
1997. (Exhibit 10.2 to Form 8-K dated
1/13/09).
|
|
| 10.5 | l |
Twelfth
Amendment, dated November 20, 2009, to the amended and restated
Connecticut Water Company Employees’ Retirement Plan effective January 1,
1997. (Exhibit 10.2 to Form 8-K dated
11/24/09).
|
|
| 10.6 |
November
4, 1994 Amendment to Agreement dated December 11, 1957 between The
Connecticut Water Company (successor to the Thomaston Water Company) and
the City of Waterbury. (Exhibit 10.16 to Form 10-K for year
ended 12/31/94).
|
||
| 10.7 |
Agreement
dated August 13, 1986 between The Connecticut Water Company and the
Metropolitan District. (Exhibit 10.14 to Form 10-K for the year
ended 12/31/86).
|
||
| 10.8 |
Report
of the Commission to Study the Feasibility of Expanding the Water Supply
Services of the Metropolitan District. (Exhibit 14 to
Registration Statement No. 2-61843).
|
||
| 10.9 |
Bond
Exchange Agreements between Connecticut Water Service, Inc., The
Connecticut Water Company Bankers Life Company and Connecticut Mutual Life
Insurance Company dated October 23, 1978. (Exhibit 14 to
Form 10-K for the year ended 12/31/78).
|
||
| 10.10 |
Dividend
Reinvestment and Common Stock Purchase Plan, as amended and restated as of
August 19, 2008. (Exhibit 4 to Form S-3, Registration Statement
No. 333-153910, filed on October 8, 2008).
|
||
| 10.11 |
Contract
for Supplying Bradley International Airport. (Exhibit 10.21 to
Form 10-K for the year ended 12/31/84).
|
||
| 10.12 |
Report
of South Windsor Task Force. (Exhibit 10.23 to Form 10-K for
the year ended 12/31/87).
|
||
| 10.13 |
Trust
Agreement for The Connecticut Water Company Welfare Benefits Plan (VEBA)
dated January 1, 1989. (Exhibit 10.21 to Form 10-K for year
ended 12/31/89).
|
||
| 10.14 |
1994
Performance Stock Program, as amended and restated as of April 26, 2002.
(Exhibit A to Proxy Statement dated 3/19/02).
|
||
| 10.14 | a |
First
Amendment to The Connecticut Water Service, Inc. Performance Stock Program
Amended and Restated as of April 26, 2002 (the “Plan”) dated December 1,
2005. (Exhibit
10.22a to Form 10-K for the year ended
12/31/05).
|
|
| 10.14 | b |
Second
Amendment to The Connecticut Water Service, Inc. Performance Stock Program
Amended and Restated as of April 26, 2002 (the “Plan”) dated January 1,
2008. (Exhibit 10.5 to 8-K filed on 1/30/08).
|
|
| 10.15 |
2004
Performance Stock Program, as of April 23, 2004. (Appendix A to
Proxy Statement dated 3/12/04).
|
||
| 10.15 | a |
First
Amendment to The Connecticut Water Service, Inc. 2004 Performance Stock
Program, dated January 7, 2004. (Exhibit 10.23f to Form 10-K for the year
ended 12/31/05).
|
|
| 10.15 | b |
Second
Amendment to The Connecticut Water Service, Inc. 2004 Performance Stock
Program, dated January 1, 2008. (Exhibit 10.6 to Form 8-K filed on
1/30/08).
|
|
| 10.15 | c |
Connecticut
Water Service, Inc. Performance Stock Program Incentive Stock Option Grant
Form. (Exhibit 10.1 to Form 10-Q for the quarter ended
9/30/04).
|
|
| 10.15 | d |
Connecticut
Water Service, Inc. Performance Stock Program Non-Qualified Stock Option
Grant Form. (Exhibit 10.2 to Form 10-Q for the quarter ended
9/30/04).
|
|
| 10.15 | e |
Restricted
Stock Agreement, standard form for officers, dated December 1, 2005
(Exhibit 10.1 to Form 8-K dated 1/13/06).
|
|
| 10.15 | f |
Long-Term
Performance Award Agreement, standard form for officers, dated January 11,
2006 (Exhibit 10.2 to Form 8-K dated 1/13/06).
|
|
| 10.15 | g |
Performance
Award Agreement, standard form for officers, dated January 11, 2006
(Exhibit 10.3 to Form 8-K dated 1/13/06).
|
|
| 10.16 |
Settlement
Agreement between Connecticut Water Company, Mary J. Healey, Office of
Consumer Counsel of the State of Connecticut, and the Prosecutorial Staff
of the DPUC, dated December 4, 2006. (Exhibit 10.1 to Form 8-K
dated 12/6/06).
|
||
| 10.16 | a |
Revised
Settlement Agreement between Connecticut Water Company, Mary J. Healey,
Office of Consumer Counsel of the State of Connecticut, and the
Prosecutorial Staff of the DPUC, dated December 20,
2006. (Exhibit 99.1 to Form 8-K dated
1/18/07).
|
|
| 10.16 | b |
Final
Decision of the Connecticut DPUC, Docket No. 06-07-08, dated January 16,
2007. (Exhibit 99.2 to Form 8-K dated 1/18/07).
|
|
| 10.16 | c |
Final
Decision of the Connecticut DPUC, Docket No. 06-07-08, dated March 28,
2008. (Exhibit 99.1 to Form 8-K dated 4/3/08).
|
|
| 10.17 |
Connecticut
Water Service, Inc. and Subsidiaries Employee Code of Conduct, January 24,
2008.
|
||
| 10.18 |
Stock
Purchase Agreement between The Connecticut Water Company and Ellington
Acres Company and the shareholders of Ellington Acres Company, dated as of
July 21, 2008 (Exhibit 10.1 to Form 10-Q for the quarter ended June 30,
2008).
|
||
| 10.19 |
Form
of Amended Restated Employment Agreement with the Company’s executive
officers (Exhibit 10.19 to Form 10-K for year ended December 31, 2008),
including:
a) Peter
J. Bancroft
b) David
C. Benoit
c) Thomas
R. Marston
d) Terrance
P. O’Neill
e) Eric
W. Thornburg
f) Maureen
P. Westbrook
|
||
| 10.20 |
Form
of Amended Restated Employment Agreement with the Company’s executive
officers (Exhibit 10.20 to Form 10-K for year ended December 31, 2008),
including:
a) Kristen
A. Johnson
b) Daniel
J. Meaney
c) Nicholas
A. Rinaldi
|
||
| 10.21 |
Form
of Amended and Restated Supplemental Executive Retirement Agreement with
the Company’s executive officers (Exhibit 10.21 to Form 10-K for year
ended December 31, 2008), including:
a) Peter
J. Bancroft
b) David
C. Benoit
c) Kristen
A. Johnson
d) Thomas
R. Marston
e) Daniel
J. Meaney
f) Terrance
P. O’Neill
g) Nicholas
A. Rinaldi
h) Eric
W. Thornburg
i) Maureen
P. Westbrook
|
||
| 10.22 |
Form
of Amended and Restated Deferred Compensation Agreement with the Company’s
executive officers (Exhibit 10.3 to Form 8-K filed on January 30, 2008),
including:
a) Peter
J. Bancroft
b) David
C. Benoit
c) Kristen
A. Johnson
d) Thomas
R. Marston
e) Daniel
J. Meaney
f) Terrance
P. O’Neill
g) Nicholas
A. Rinaldi
h) Eric
W. Thornburg
i) Maureen
P. Westbrook
|
||
| 10.23 |
Master
Loan Agreement and Promissory Note between Connecticut Water Service, Ind.
and CoBank, ACB, dated June 29, 2009. (Exhibit 10.1 to Form 8-K
filed on July 2, 2009)
|
||
| 10.24 |
Line
of credit agreement dated August 12, 2009 between Bank of America, N.A.
and Connecticut Water Service, Inc. (Exhibit 10.1 to Form 10-Q
for the quarter ending September 30, 2009)
|
||
| 10.25 |
Line
of credit agreement dated August 12, 2009 between RBS Citizens, National
Association and Connecticut Water Service, Inc. (Exhibit 10.2
to Form 10-Q for the quarter ending September 30, 2009)
|
||
| 21 | * |
Connecticut
Water Service, Inc. Subsidiaries Listing.
|
|
| 23.1 | * |
Consent
of Independent Registered Public Accounting Firm.
|
|
| 31.1 | * |
Rule
13a-14 Certification of Eric W. Thornburg, Chief Executive
Officer.
|
|
| 31.2 | * |
Rule
13a-14 Certification of David C. Benoit, Chief Financial
Officer.
|
|
| 32.1 | * |
Certification
of Eric W. Thornburg, Chief Executive Officer, pursuant to Section 906 of
the Sarbanes-Oxley Act of 2002.
|
|
| 32.2 | * |
Certification
of David C. Benoit, Chief Financial Officer, pursuant to Section 906 of
the Sarbanes-Oxley Act of 2002.
|
|
|
Note:
|
Exhibits
10.1 through 10.5l, 10.13 through 10.15g, and 10.19 through 10.22 set
forth each management contract or compensatory plan or arrangement
required to be filed as an exhibit to this Form
10-K.
|
||
* = filed
herewith
E-1
Pursuant to the requirements of Section
13 or 15(d) of the Securities Exchange Act of 1934, Registrant has duly caused
this report to be signed on its behalf by the undersigned, thereunto duly
authorized.
|
CONNECTICUT
WATER SERVICE, INC.
Registrant
|
|
|
March
15, 2010
|
By /s/ Eric
W. Thornburg
Eric
W. Thornburg
Chairman,
President and Chief Executive
Officer
|
Pursuant to the requirements of the
Securities Exchange Act of 1934, this report has been signed by the following
persons on behalf of Connecticut Water Service, Inc. in the capacities and on
the dates indicated.
|
Signature
|
Title
|
Date
|
||
|
/s/ Eric W.
Thornburg
Eric
W. Thornburg
|
Chairman,
President, and Chief Executive Officer (Principal Executive
Officer)
|
March
15, 2010
|
||
|
/s/ David C.
Benoit
David
C. Benoit
|
Vice
President – Finance, Chief Financial Officer and Treasurer (Principal
Financial Officer)
|
March
15, 2010
|
||
|
/s/ Nicholas A.
Rinaldi
Nicholas
A. Rinaldi
|
Controller
(Principal Accounting Officer)
|
March
15, 2010
|
|
Signature
|
Title
|
Date
|
||
|
/s/ Mary Ann
Hanley
Mary
Ann Hanley
|
Director
|
March
9, 2010
|
||
|
/s/ Heather
Hunt
Heather
Hunt
|
Director
|
March
9, 2010
|
||
|
/s/ Mark G.
Kachur
Mark
G. Kachur
|
Director
|
March
9, 2010
|
||
|
/s/ David A.
Lentini
David
A. Lentini
|
Director
|
March
9, 2010
|
||
|
/s/ Arthur C.
Reeds
Arthur
C. Reeds
|
Director
|
March 9,
2010
|
||
|
/s/ Lisa J.
Thibdaue
Lisa
J. Thibdaue
|
Director
|
March
9, 2010
|
||
|
/s/ Carol P.
Wallace
Carol
P. Wallace
|
Director
|
March
9, 2010
|
||
|
/s/ Donald B.
Wilbur
Donald
B. Wilbur
|
Director
|
March
9, 2010
|
27
CONNECTICUT
WATER SERVICE, INC. and SUBSIDIARIES
SCHEDULE
II – VALUATION AND QUALIFYING ACCOUNTS
(in
thousands)
|
Description
|
Balance
Beginning of Year
|
Additions
Charged to Income
|
Deductions
From Reserves(1)
|
Balance
End of Year
|
||||||||||||
|
Allowance
for Uncollectible Accounts
|
||||||||||||||||
|
Year
Ended December 31, 2009
|
$ | 376 | $ | 401 | $ | 305 | $ | 472 | ||||||||
|
Year
Ended December 31, 2008
|
$ | 352 | $ | 286 | $ | 262 | $ | 376 | ||||||||
|
Year
Ended December 31, 2007
|
$ | 285 | $ | 265 | $ | 198 | $ | 352 | ||||||||
(1)
Amounts charged off as uncollectible after deducting
recoveries.
S-1