Attached files
| file | filename |
|---|---|
| 8-K - FORM 8-K - VERIFONE SYSTEMS, INC. | d8k.htm |
 Financial Results for the
Year Ended October 31, 2010
1
Exhibit 99.1 |
 Forward-Looking Statements
Today’s
discussion
may
include
“forward-looking
statements”
within
the
meaning
of
the
Private
Securities
Litigation
Reform
Act
of
1995.
Such
statements relate to future events and expectations and involve known
and unknown risks and uncertainties. VeriFone’s actual results or
actions may differ materially from those projected in the forward-looking
statements. For a summary of the specific risk factors that could cause
results to differ materially from those expressed in the forward-looking
statements, please refer to VeriFone’s filings with the Securities and
Exchange Commission, including its annual report on Form 10-K and
quarterly reports on Form 10-Q. VeriFone is under no obligation to, and
expressly disclaims any obligation to, update or alter its
forward-looking statements, whether as a result of new information,
future events, changes in assumptions or otherwise.
2
2 |
 Important Information
In connection with the proposed Hypercom transaction, VeriFone intends to file with
the Securities and Exchange Commission (“SEC”) a registration
statement on Form S-4 that will include a proxy statement of Hypercom
relating to the proposed transaction. INVESTORS ARE URGED TO READ THE FORM S-4
AND
PROXY
STATEMENT
(AND
ALL
AMENDMENTS
AND
SUPPLEMENTS
THERETO)
AND
ANY
OTHER RELEVANT DOCUMENTS FILED WITH THE SEC WHEN THEY BECOME AVAILABLE
BECAUSE THEY WILL CONTAIN IMPORTANT INFORMATION. You will be able to obtain copies
of the S-4 and proxy statement, as well as VeriFone’s other
filings, free of charge at the website maintained by the SEC at
www.sec.gov when they become available. In addition, you may obtain
documents filed with the SEC by VeriFone free of charge at its Web site
(www.verifone.com) or by directing a request to: VeriFone, 2099 Gateway
Place, Suite 600, San Jose, CA 95110 (Tel: 1-408-232-7979) Attention:
Company Secretary). You may obtain documents filed with the SEC by Hypercom free of
charge by contacting: Scott Tsujita
(Tel: 1-480-642-5161).
VeriFone and Hypercom, and their respective directors and executive officers, may
be deemed to be participants in the solicitation of proxies from Hypercom
stockholders in connection with the merger. Information about the directors
and executive officers of VeriFone and is set forth in the proxy statement
for VeriFone’s 2010 Annual Meeting of Stockholders filed with the SEC on May
19, 2010. Information about the directors and executive officers of Hypercom
is set forth in Hypercom’s Annual Report on Form 10-K filed with
the SEC on March 12, 2010 and the proxy statement for Hypercom’s 2010 Annual
Meeting of Stockholders filed with the SEC on April 26, 2010. Investors may obtain
additional information regarding
the
interests
of
such
participants
by
reading
the
Form
S-4
and
proxy
statement
for
the
merger
when they become available.
3
3 |
 Non-GAAP Financial Measures
With respect to any Non-GAAP financial measures presented in the
information, reconciliations of Non-GAAP to GAAP financial measures
may be found in VeriFone’s quarterly earnings release as filed with the
Securities and Exchange Commission. Management uses Non-GAAP
financial measures only in addition to and in conjunction with results
presented in accordance with GAAP. Management believes that these
Non-GAAP financial measures help it to evaluate VeriFone’s
performance and to compare VeriFone’s current results with those for
prior periods as well as with the results of peer companies. These Non-
GAAP financial measures contain limitations and should be considered
as a supplement to, and not as a substitute for, or superior to,
disclosures made in accordance with GAAP.
4
4 |
 Non-GAAP Profit & Loss Overview
($ in thousands, except EPS)
Q409
Q310
Q410
% SEQ
Inc(Dec)
% YoY
Inc(Dec)
Revenue
217,898
261,455
276,000
5.6%
26.7%
Gross Margin
82,531
101,005
110,262
9.2%
33.6%
Gross Margin %
37.9%
38.6%
40.0%
Operating Expense
47,814
58,298
61,697
5.8%
29.0%
Operating Expense %
21.9%
22.3%
22.4%
Operating Profit
34,717
42,707
48,565
13.7%
39.9%
Operating Margin %
15.9%
16.3%
17.6%
Net Interest and Other
(4,229)
(2,803)
(3,388)
20.9%
-19.9%
Pre-tax Profit
30,488
39,904
45,177
13.2%
48.2%
Taxes
8,537
7,981
9,035
13.2%
5.8%
Net Income
21,951
31,923
36,142
13.2%
64.6%
Net Income %
10.1%
12.2%
13.1%
EPS
0.26
0.36
0.40
11.1%
53.8%
Q410
5
5 |
 Non-GAAP Revenue Profile
Services
17.3%
System
Solutions
82.7%
Q410
Revenue
LAC
19.5%
NA
44.3%
Asia
10.8%
Europe
25.4%
6
6
($ in thousands)
Q409
Q310
Q410
% SEQ
Inc(Dec)
% YoY
Inc(Dec)
North America
87,067
123,211
122,139
-0.9%
40.3%
Europe
68,485
62,120
70,165
13.0%
2.45%
Latin America
35,563
52,806
53,887
2.0%
51.5%
Asia
26,783
23,318
29,809
27.8%
11.3%
Total
217,898
261,455
276,000
5.6%
26.7%
Q410 |
 7
7
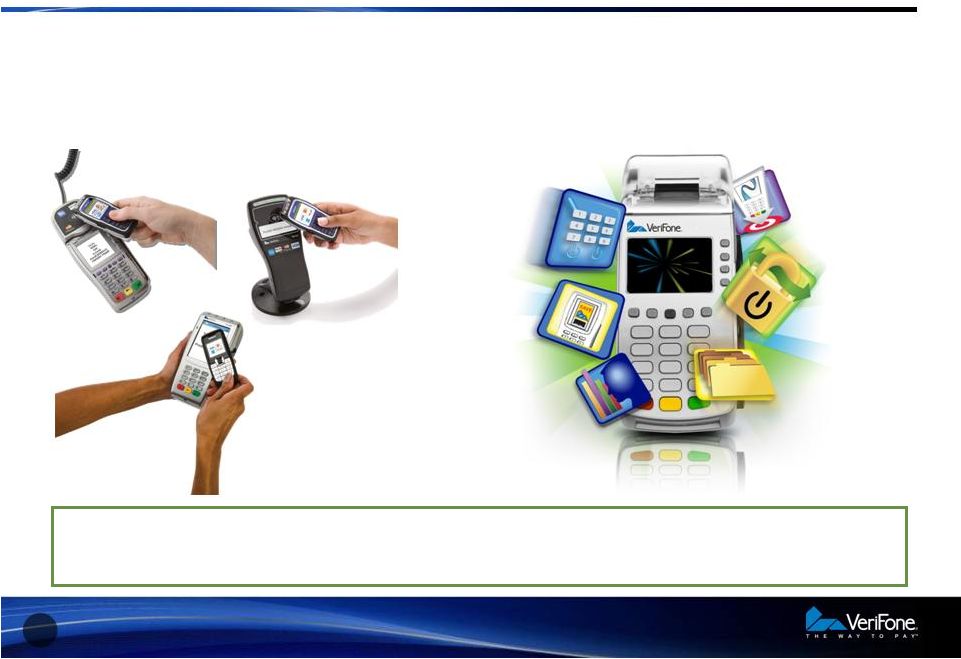
Mobile-Based Payments
Mobile-Based Payments
VeriFone offers a variety of options when it comes to accepting Mobile-Based
contactless transactions, providing merchants/consumers the flexibility of
managing their loyalty/couponing/payments via their cell phone or NFC-based
cards For consumers:
Fast, easy mobile-based payments
For merchants:
A host of value added services
Targeted
A
Advertising
& Promotion
End-to-
end
security
services
Portfolio
Management
Consumer
Analytics
Alternative
Payments
Digital
Couponing
Taking Contactless Payments to the Next Level |
 8
8
Growing Commitment to VeriFone Encryption Technology (U.S.)
Market Share % of US Transaction Volume
Of Top 100 Processors
Announced
VeriShield™
Processors
|
 Financial Results and
Guidance
9
9 |
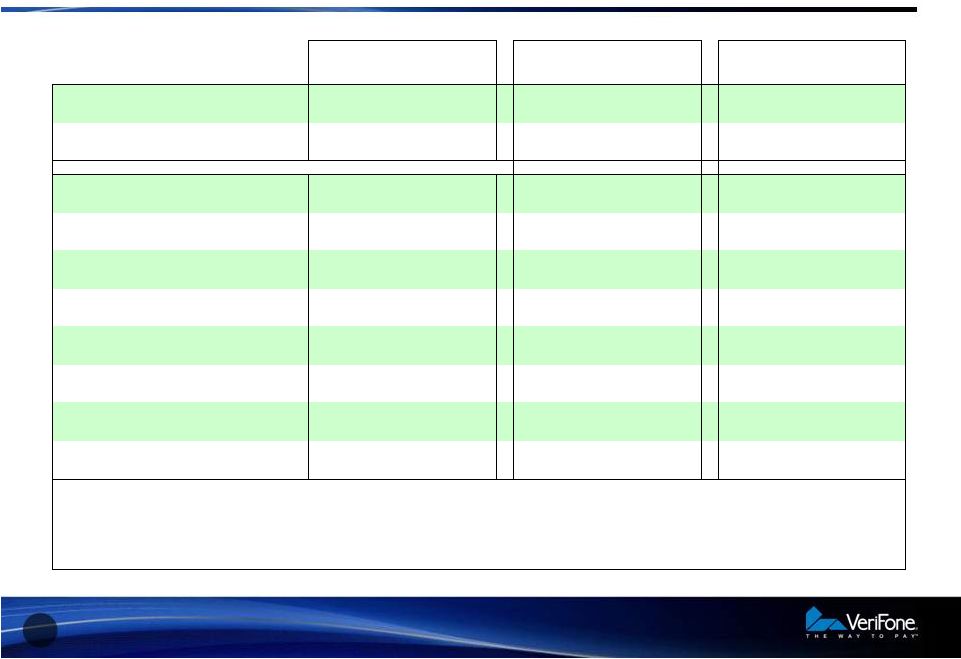
 Non-GAAP Gross Margin Review
10
10
Q409
Q310
Q410
System Solutions
37.1%
37.4%
38.7%
Services
42.3%
44.3%
46.0%
Total
37.9%
38.6%
40.0%
% of Revenue |
 Non-GAAP Operating Expenses
11
11
Q409
Q310
Q410
Research and Development
7.0%
7.0%
7.1%
Sales and Marketing
8.2%
8.4%
8.7%
G&A
6.7%
6.9%
6.6%
Total
21.9%
22.3%
22.4%
Non-GAAP Operating Expenses
as Reported ($M)
47.8
58.3
61.7
Non-GAAP Operating Expenses,
Constant Currency ($M)
48.1
58.5
61.7
% of Revenue |
 Cash
Flow and Balance Sheet 12
12
($ in thousands, except Days)
$
$
$
Cash Flow from Operations before
Changes in Working Capital
26,779
36,662
51,858
Cash Flow from Operations
75,259
25,994
54,038
Key Balance Sheet Items:
Cash
324,996
400,462
445,137
Accounts Receivables, net
157,357
68
137,705
49
132,988
46
Accounts Receivables Reserves
(4,556)
(4,671)
(5,862)
Inventories, net
95,921
62
111,415
62
111,901
61
Inventories Reserves
(33,045)
(22,332)
(23,257)
Accounts Payable
87,094
58
71,252
40
64,016
35
Deferred Revenue, net
63,962
71,981
77,607
Note: Accounts Receivable Days Sales Outstanding is
calculated based on Gross Accounts Receivable Net of Reserve for Product
Returns. Days in Inventory is calculated as Average Net Inventory divided by
Total Cost of Goods Sold. Days in Accounts Payable is calculated as Accounts
Payable divided by Total Cost of Goods Sold. Q409
Days
Q410
Days
Q310
Days |
 Guidance
•
For the first quarter ending January 31, 2011, VeriFone expects net
revenues to be between $265 million and $270 million. Non-GAAP
net income per share is projected to be in the range of $0.38 to
$0.39.
•
For the full year of fiscal 2011, VeriFone expects net revenues to be
between $1,130 million and $1,150 million. Non-GAAP net income
per share is projected to be in the range of $1.60 to $1.70 for the
same time period.
13
13 |
 Conclusions
14
14 |