Attached files
Table of Contents
UNITED STATES
SECURITIES AND EXCHANGE COMMISSION
WASHINGTON, DC 20549
FORM 10-K
(Mark One)
| x | ANNUAL REPORT PURSUANT TO SECTION 13 OR 15(d) OF THE SECURITIES EXCHANGE ACT OF 1934 |
For the fiscal year ended October 3, 2010
OR
| ¨ | TRANSITION REPORT PURSUANT TO SECTION 13 OR 15(d) OF THE SECURITIES EXCHANGE ACT OF 1934 |
For the transition period from to
Commission file number # 000-08866
MICROSEMI CORPORATION
(Exact name of Registrant as specified in its charter)
| Delaware | 95-2110371 | |
| (State or other jurisdiction of incorporation or organization) |
(I.R.S. Employer Identification No.) |
2381 Morse Ave., Irvine, California 92614
(Address of principal executive offices) (Zip Code)
(949) 221-7100
Registrant’s telephone number, including area code
Securities registered pursuant to Section 12(b) of the Act:
| Title of each class |
Name of each exchange on which registered | |
| Common Stock, $0.20 par value; Rights to Purchase Series A Junior Participating Preferred Stock |
NASDAQ Stock Market LLC (NASDAQ Global Select Market) |
Securities registered pursuant to Section 12(g) of the Act:
None
Indicate by check mark if the registrant is a well-known seasoned issuer, as defined in Rule 405 of the Securities Act. Yes x No ¨
Indicate by check mark if the registrant is not required to file reports pursuant to Section 13 or Section 15(d) of the Act. Yes ¨ No x
Indicate by check mark whether the registrant (1) has filed all reports required to be filed by Section 13 or 15(d) of the Securities Exchange Act of 1934 during the preceding 12 months (or for such shorter period that the registrant was required to file such reports), and (2) has been subject to such filing requirements for the past 90 days. Yes x No ¨
Indicate by check mark whether the registrant has submitted electronically and posted on its corporate Web site, if any, every Interactive Data File required to be submitted and posted pursuant to Rule 405 of Regulation S-T (§ 232.405 of this chapter) during the preceding 12 months (or for such shorter period that the registrant was required to submit and post such filed). Yes x No ¨
Indicate by check mark if disclosure of delinquent filers pursuant to Item 405 of Regulation S-K is not contained herein, and will not be contained, to the best of registrant’s knowledge, in definitive proxy or information statements incorporated by reference in Part III of this Form 10-K or any amendment to this Form 10-K. ¨
Indicate by check mark whether the registrant is a large accelerated filer, an accelerated filer, a non-accelerated filer, or a smaller reporting company. See definitions of “large accelerated filer,” “accelerated filer” and “smaller reporting company” in Rule 12b-2 of the Exchange Act. (Check one):
| Large Accelerated Filer x | Accelerated Filer ¨ | |
| Non-Accelerated Filer ¨ | Smaller Reporting Company ¨ |
(Do not check if a smaller reporting company)
Indicate by check mark whether the registrant is a shell company (as defined in Rule 12b-2 of the Exchange Act. Yes ¨ No x
The aggregate market value of Common Stock held by non-affiliates of the registrant, based upon the closing sale price on March 26, 2010 was approximately $1,377,747,000.
The number of outstanding shares of Common Stock on November 16, 2010 was 83,538,211.
Documents Incorporated by Reference
Part III: Incorporated by reference are portions of the definitive Proxy Statement for the Annual Meeting of Stockholders to be held on or about January 19, 2011. This proxy statement will be filed not later than 120 days after the close of the registrant’s fiscal year ended October 3, 2010.
Table of Contents
| Item |
Page | |||||
| PART I | ||||||
| 1 |
Business | 4 | ||||
| 1A |
Risk Factors | 10 | ||||
| 1B |
Unresolved Staff Comments | 25 | ||||
| 2 |
Properties | 25 | ||||
| 3 |
Legal Proceedings | 26 | ||||
| 4 |
Removed and Reserved | 26 | ||||
| PART II | ||||||
| 5 |
27 | |||||
| 6 |
29 | |||||
| 7 |
Management’s Discussion and Analysis of Financial Condition and Results of Operations |
30 | ||||
| 7A. |
45 | |||||
| 8 |
47 | |||||
| 9 |
Changes in and Disagreements with Accountants on Accounting and Financial Disclosure |
82 | ||||
| 9A. |
82 | |||||
| 9B. |
83 | |||||
| PART III | ||||||
| 10 |
84 | |||||
| 11 |
84 | |||||
| 12 |
Security Ownership of Certain Beneficial Owners and Management and Related Stockholder Matters |
84 | ||||
| 13 |
Certain Relationships and Related Transactions, and Director Independence |
84 | ||||
| 14 |
84 | |||||
| PART IV | ||||||
| 15 |
85 | |||||
2
Table of Contents
IMPORTANT FACTORS RELATED TO FORWARD-LOOKING STATEMENTS AND ASSOCIATED RISKS
This Annual Report on Form 10-K must be read in its entirety and contains forward-looking statements within the meaning of the federal securities laws. Any statements that do not relate to historical or current facts or matters are forward-looking statements. You can identify some of the forward-looking statements by the use of forward-looking words, such as “may,” “will,” “could,” “should,” “project,” “believe,” “anticipate,” “expect,” “plan,” “estimate,” “forecast,” “potential,” “intend,” “maintain,” “continue” and variations of these words and comparable words. In addition, all of the information herein that does not state a historical fact is forward-looking, including any statement or implication about an estimate or a judgment, or an expectation as to a future time, future result or other future circumstance. Statements concerning current conditions may also be forward-looking if they imply a continuation of current conditions. Examples of forward-looking statements in this Annual Report on Form 10-K include, but are not limited to, statements concerning:
| • | expectations that we will successfully complete announced and to-be-announced plant consolidations on the anticipated schedules and without unanticipated costs or expenses, and that such consolidations will result in anticipated cost savings; |
| • | expectations that we will be able to successfully integrate acquired companies and personnel with our existing operations; |
| • | demand, growth and sales expectations for our products; |
| • | expectations regarding tax exposures and future tax rates and ability to realize deferred tax assets; |
| • | expectations regarding competitive conditions; |
| • | new market opportunities and emerging applications for our products; |
| • | the uncertainty of litigation, the costs and expenses of litigation, and the potential material adverse effect litigation could have on our business and results of operations; |
| • | beliefs that our customers will not cancel orders or terminate or renegotiate their purchasing relationships with us; |
| • | expectation that we will not suffer production delays as a result of a supplier’s inability to supply parts; |
| • | beliefs that we stock adequate supplies of all materials; |
| • | beliefs that we will be able to successfully resolve any disputes and other business matters as anticipated; |
| • | beliefs that we will be able to meet our operating cash and capital commitment requirements in the foreseeable future; |
| • | critical accounting estimates; |
| • | expectations regarding financial and operating results; |
| • | expectations regarding our performance and competitive position in future periods; and |
| • | expectations regarding our outlook for our end markets. |
Forward-looking statements are subject to risks and uncertainties that could cause actual results to differ materially from the results that the forward-looking statements suggest. You are urged to carefully review the disclosures we make in this report concerning risks and other factors that may affect our business and operating results, including those made under the heading “Item 1A. RISK FACTORS” included below in this Annual Report on Form 10-K, as well as in our other reports filed with the Securities and Exchange Commission (“SEC”). Forward-looking statements are not a guarantee of future performance and should not be regarded as a representation by us or any other person that all of our estimates will necessarily prove correct or that all of our objectives or plans will necessarily be achieved. You are cautioned, therefore, not to place undue reliance on these forward-looking statements, which are made only as of the date of this report. We do not intend, and undertake no obligation, to update or revise the forward-looking statements to reflect events or circumstances after the date of this report, whether as a result of new information, future events or otherwise.
3
Table of Contents
| ITEM 1. BUSINESS |
INTRODUCTION
Microsemi Corporation was incorporated in Delaware in 1960. Our name was changed from Microsemiconductor Corporation in February 1983. Unless the context otherwise requires, the “Company,” “Microsemi,” “we,” “our,” “ours” and “us” refer to Microsemi Corporation and its consolidated subsidiaries. Our principal executive offices are located at 2381 Morse Avenue, Irvine, California 92614 and our telephone number is (949) 221-7100.
We are a leading designer, manufacturer and marketer of high performance analog and mixed-signal integrated circuits and high-reliability semiconductors. Our semiconductors manage and control or regulate power, protect against transient voltage spikes and transmit, receive and amplify signals.
Our products include individual components as well as integrated circuit solutions that enhance customer designs by improving performance, reliability and battery optimization, reducing size or protecting circuits.
We operate in a single industry segment as a manufacturer of semiconductors in different geographic areas.
Our website address is http://www.microsemi.com. Our filings with the SEC of annual reports on Form 10-K, quarterly reports on Form 10-Q and current reports on Form 8-K, and all amendments to such forms, are made accessible on such website as soon as reasonably practicable after such documents are electronically filed with or furnished to the SEC and are always available free of charge. Also accessible on our website are our code of ethics, governance guidelines and charters for the Executive Committee, Governance and Nominating Committee, Compensation Committee and Audit Committee of our Board of Directors. Such website is not intended to constitute any part of this report.
Please read the information under the heading “IMPORTANT FACTORS RELATED TO FORWARD-LOOKING STATEMENTS AND ASSOCIATED RISKS” above, which describes and refers to some of the important risks and uncertainties that could affect Microsemi’s future business and prospects.
We report results of operations on the basis of fifty-two and fifty-three week periods. The fiscal year ended on October 3, 2010, consisted of fifty-three weeks and each of the fiscal years ended on September 27, 2009 and September 28, 2008 consisted of fifty-two weeks. In referencing a year, we are referring to the fiscal year ended on or about the Sunday closest to September 30.
PRODUCTS
Microsemi is a leading designer, manufacturer and marketer of high-performance analog and mixed-signal integrated circuits and high-reliability semiconductors. Our semiconductors manage and control or regulate power, protect against transient voltage spikes and transmit, receive and amplify signals.
Our products include individual components as well as integrated circuit solutions that enhance customer designs by improving performance, reliability and battery optimization, reducing size or protecting circuits. The principal end markets that we serve include security & defense, aerospace, enterprise & commercial and industrial & alternative energy.
Our integrated circuits (“IC”) products offer light, sound and power management for desktop and mobile computing platforms, LCD TVs and other power control applications. Power management generally refers to a class of standard linear integrated circuits (“SLICs”) that perform voltage regulation and reference in most electronic systems. The definition of power management has broadened in recent years to encompass other
4
Table of Contents
devices and modules, often application-specific standard products (“ASSPs”), which address particular aspects of power management, such as audio or display related ICs. This business is composed of both a core platform of traditional SLICs, such as low dropout regulators (“LDOs”) and pulse width modulators (“PWMs”), and differentiated ASSPs such as backlight inverters, audio amplification ICs and small computer standard interface terminators. Our IC products are used in notebook computers, data storage, wireless LAN, LCD backlighting, LCD TVs, LCD monitors, automobiles, telecommunications, test instruments, defense and aerospace equipment, high-quality sound reproduction and data transfer equipment.
Our individual component semiconductor products include silicon rectifiers, zener diodes, low leakage and high voltage diodes, temperature compensated zener diodes, transistors, subminiature high power transient suppressor diodes and pin diodes used in magnetic resonance imaging (“MRI”) machines. We also manufacture semiconductors for commercial applications, such as automatic surge protectors, transient suppressor diodes used for telephone applications and switching diodes used in computer systems. A partial list of these products includes: implantable cardioverter defibrillator and heart pacer switching, charging and transient shock protector diodes, low leakage diodes, transistors used in jet aircraft engines and high performance test equipment, high temperature diodes used in oil drilling sensing elements operating at 200 degrees centigrade, temperature compensated zener or rectifier diodes used in missile systems and power transistors.
MARKETING
We also serve a variety of end markets, which we generally classify as follows:
| • | Defense & Security – Products in this end market include mixed-signal analog integrated circuits, JAN, JANTX, JANTXV and JANS high-reliability semiconductors and modules including diodes, zeners, diode arrays, transient voltage suppressors, bipolar transistors, metal-oxide-semiconductor field-effect-transistors (“MOSFETs”), insulated gate bipolar transistors (“IGBTs”), small signal analog integrated circuits, small signal transistors, relays, silicon-controlled rectifiers (“SCRs”) and radio frequency (“RF”) transceivers and subsystems. These products are utilized in a variety of applications including radar and communications, defense electronics, homeland security, threat detection, targeting and fire control and other power conversion and related systems in military platforms. |
| • | Aerospace – Products in this end market include offerings such as JAN, JANTX, JANTXV and JANS high-reliability semiconductors and modules and analog mixed-signal products including diodes, zeners, diode arrays, transient voltage suppressors, bipolar transistors, small signal analog integrated circuits, relays, small signal transistors, SCRs, MOSFETs and IGBTs. These products are utilized in a variety of applications including electronic applications for large aircraft and regional jets, commercial radar and communications, satellites, cockpit electronics, and other power conversion and related systems in space and aerospace platforms. |
| • | Industrial & Alternative Energy – Products in this end market include MOSFETs, IGBTs, power modules, ultra thin bypass diodes, bridge rectifiers, and high-voltage assemblies for use in industrial equipment, semiconductor capital equipment and solar power applications. Industrial applications also include zener diodes, high-voltage diodes, MOSFETs, IGBTs, transient voltage suppressors and thyristor surge protection devices that are designed into implantable defibrillators, pacemakers and neurostimulators and PIN diode switches, dual diode modules and switched-most power supplies (“SMPS”) for use in MRI systems. |
| • | Enterprise & Commercial – Products in this end market include broadband power amplifiers and monolithic microwave integrated circuits (“MMICs”) targeted at 802.11 a/b/g/n/e, multiple-in multiple-out (“MIMO”), light emitting diode (“LED”), cold cathode fluorescent lamp (“CCFL”) controllers, visible light sensors, PWM controllers, voltage regulators, EMI/RFI filters, transient voltage suppressors and class-D audio circuits. Applications for these products include wi-max and wireless local area network (“LAN”) devices, power-over-ethernet (“PoE”) devices, portable devices, set top box and telecom applications, notebook computers, monitors, storage devices and televisions. |
5
Table of Contents
Our products are marketed through electronic component distributors and independent sales representatives, as well as our inside sales personnel. We have direct sales offices in many metropolitan areas around the world.
Net sales were $518.3 million, $453.0 million and $514.1 million in 2010, 2009 and 2008. Net sales by originating geographic area and end market are disclosed in Note 12 of the notes to the consolidated financial statements included in this Annual Report on Form 10-K, which information is incorporated herein by reference. A discussion of the risks attendant to our international operations are included in Item 1A, Risk Factors, under the heading, “International operations and sales expose us to material risks and may increase the volatility of our operating results,” which information is incorporated herein by reference.
RESEARCH AND DEVELOPMENT
We believe that continuing timely development and introduction of new products is essential to maintaining our competitive position. We currently conduct most of our product development effort in-house. We also employ outside consultants to assist with product design.
We expense the cost of research and development as incurred. Research and development expenses principally comprise payroll and related costs, consulting costs, supplies, and the cost of prototypes.
We spent approximately $55.4 million, $41.4 million and $45.0 million in 2010, 2009 and 2008 respectively, for research and development. The principal focus of our research and development activities has been to improve processes and to develop new products that support the growth of our businesses.
The spending on research and development was principally to develop new higher-margin application-specific products, including, among others, PoE, CCFL and LED drivers, class-D audio amplifiers, InGaP RF power amplifiers for wireless LAN applications, development and adoption of silicon carbide technology, VDMOS products for high frequency communications and S-band products for RF applications.
PATENTS, LICENSES, AND OTHER INTELLECTUAL PROPERTY RIGHTS
We have registered several of our trademarks with the U.S. Patent and Trademark Office and in foreign jurisdictions. We rely to some extent upon confidential trade secrets and patents to develop and maintain our competitive position. It is our policy to seek patent protection for significant inventions that may be patented, though we may elect, in appropriate cases, not to seek patent protection even for significant inventions if other protection, such as maintaining the invention as a trade secret, is considered more advantageous or cost-effective. We believe that patent and mask work protection could grow in significance but presently is of less significance in our business than experience, innovation, and management skill. No individual patent contributed significantly to our 2010, 2009 or 2008 net sales.
Due to the many technological developments and the technical complexity of the semiconductor industry, it is possible that certain of our designs or processes may involve infringement of patents or other intellectual property rights held by others. From time to time, we have received, and in the future may receive, notice of claims of infringement by our products on intellectual property rights of third parties. If any such infringements were alleged to exist, we might be obligated to seek a license from the holder of the rights and might have liability for past infringement. In the past, it has been common semiconductor industry practice for patent holders to offer licenses on reasonable terms and rates. Although in some situations, typically where the patent directly relates to a specific product or family of products, patent holders have refused to grant licenses, the practice of offering licenses appears to be generally continuing. However, no assurance can be given that we will be able to obtain licenses as needed in all cases or that the terms of any license that may be offered will be acceptable to us. In those circumstances where an acceptable license is not available, we would need either to change the process or product so that it no longer infringes or stop manufacturing the product or products involved in the infringement, which might be costly and could adversely affect our revenues and operating results.
6
Table of Contents
Please see the information that is set forth under the subheading “Any failure by us to protect our proprietary technologies or maintain the right to use certain technologies may negatively affect our ability to compete,” within the section below entitled “ITEM 1A. RISK FACTORS.”
MANUFACTURING AND SUPPLIERS
Our principal domestic manufacturing operations are located in Garden Grove, La Mirada, Folsom and Santa Clara, California; Bend, Oregon; Phoenix, Arizona and Lawrence and Lowell, Massachusetts. We have assembly, testing and screening facilities at these locations and wafer processing at most domestic manufacturing locations. In addition, we have manufacturing operations in Shanghai, China; Bordeaux, France; and the Philippines and screening and testing operations in Ennis, Ireland.
At our plants with wafer processing capabilities, we manufacture and process products, starting from purchased silicon wafers. At our locations without wafer processing capabilities, processed wafers are sourced from third parties or our other facilities. Processed silicon wafers are separated into individual dice that are then assembled in packages and tested in accordance with our test procedures. A major portion of our semiconductor manufacturing effort takes place after the semiconductor is assembled. Parts are tested a number of times, visually screened and environmentally subjected to shock, vibration, “burn in” and electrical tests in order to prove and assure reliability. Certain subcontract suppliers provide packaging and testing for our products necessary to deliver finished products. We pay those suppliers for assembled or fully-tested products meeting predetermined specifications. Manufacturing and processing operations are controlled in accordance with military as well as other rigid commercial and industrial specifications.
In 2009, we approved consolidation plans that will result in the closure of our manufacturing facility in Scottsdale, Arizona with production activities expected to cease in February 2011. The consolidation of Scottsdale is expected to result, subsequent to its completion, in annualized cost savings of an estimated $24 million from the elimination of redundant resources and related expenses and employee reductions. Scottsdale has approximately 230 employees and occupies a 135,000 square foot leased facility. Scottsdale shipped approximately 6%, 14% and 15% of net sales in 2010, 2009 and 2008, respectively.
We purchase silicon wafers, other semiconductor materials and packaging piece parts from domestic and foreign suppliers generally on long-term purchase commitments, that are cancelable on 30 to 90-days’ notice. Significantly all materials are available from multiple sources. In the case of sole source items, we have never suffered production delays as a result of suppliers’ inability to supply the parts. We believe that we stock adequate supplies for all materials, based upon backlog, delivery lead-time and anticipated new business. In the ordinary course of business, we enter into cancelable purchase agreements with some of our major suppliers to supply products over periods of up to 18 months. We also purchase a portion of our finished wafers from several foundry sources.
RAW MATERIALS
Our manufacturing processes use certain key raw materials critical to our products. These include silicon wafers, certain chemicals and gases, ceramic and plastic packaging materials and various precious metals. We also rely on subcontractors to supply finished or semi-finished products that are marketed through our various sales channels. We obtain raw materials and semi-finished or finished products from various sources, although the number of sources for any particular material or product may be limited. We feel that our current supply of essential materials is adequate; however, shortages have occurred from time to time and could occur again.
SEASONALITY
Generally, we are affected by the seasonal trends of the semiconductor and related industries. The impacts of seasonality are to some extent dependent on product and market mix of products shipped. These impacts can
7
Table of Contents
change from time to time and are not predictable. Factors that increase seasonality include, for example, holiday work schedules during our first fiscal quarter that tend to limit production and holiday demand that tends to increase net sales in the Enterprise & Commercial end market during our fiscal first and fourth quarters.
COMPETITIVE CONDITIONS
The semiconductor industry, including the areas in which we do business, is highly competitive. We expect intensified competition from existing competitors and new entrants. Competition is based on price, product performance, product availability, quality, reliability and customer service. We compete in various markets with companies of various sizes, many of which are larger and have greater financial and other resources than we have, and thus may be better able to pursue acquisition candidates and to withstand adverse economic or market conditions. In addition, companies not currently in direct competition with us may introduce competing products in the future. Some of our current major competitors are Freescale Semiconductor, Inc., National Semiconductor Corp., Texas Instruments, Inc., Koninklijke Philips Electronics, ON Semiconductor Corp., Fairchild Semiconductor International, Inc., Micrel Incorporated, International Rectifier Corp., Semtech Corp., Linear Technology Corp., Maxim Integrated Products, Inc., Skyworks Solutions, Inc., Diodes, Inc., Vishay Intertechnology, Inc., O2Micro International, Ltd., Semicoa Corporation, Supertex, Inc. and Monolithic Power Systems, Inc. Some of our competitors in developing markets are Triquint Semiconductor, Inc., Mitel Corporation, RF Micro Devices, Inc., Anadigics, Inc. and Skyworks Solutions, Inc. We may not be able to compete successfully in the future or competitive pressures may harm our financial condition, operating results or cash flows.
Microsemi has implemented a growth strategy through continuous innovation complemented by strategic acquisitions with the intent of increasing our technology footprint in customers’ end designs. This allows us to offer an increased value proposition, gather a larger portion of the bill of materials, and engage with customers as a strategic partner as opposed to a socket provider. We believe this strategy strengthens Microsemi’s position in the industry as it protects and grows our share within those markets with the highest barriers to entry.
Recent industry leading innovations include:
| • | Precision target-seeking and secure guidance solutions resulting in substantial improvements in size, accuracy, and cost efficient weaponry; |
| • | Microwave technology that gives defense and commercial radar systems the horsepower to operate over distances of 500 miles and more; |
| • | Leading edge wireless and wired network solutions for 80.2.11n Wi-Fi and PoE technology; |
| • | Millimeter-wave RF devices and systems that ensure fast and safe full-body security screening and higher resolution MRI systems; |
| • | LED driver products that enable better image quality and power savings in the latest big-screen LCD TVs and more efficient lighting solutions for solid state lighting; |
| • | Power ICs and devices enabling substantial panel and battery efficiency gains for solar electric systems and hybrid-powered vehicles; and |
| • | Breakthrough plastic packaging technology for transient voltage suppression devices. |
SALES TO U.S. GOVERNMENT
Approximately 40% of total net sales in 2010 were in the security & defense end market, with a very significant amount to customers whose principal sales are to the U.S. Government or to subcontractors whose material sales are to the U.S. Government. We, as a subcontractor, sell our products to higher-tier subcontractors or to prime contractors based upon purchase orders that usually do not contain all of the conditions included in
8
Table of Contents
the prime contract with the U.S. Government. However, these sales are usually subject to termination and/or price renegotiations by virtue of their reference to a U.S. Government prime contract. Therefore, we believe that all of our product sales that ultimately are sold to the U.S. Government may be subject to termination, at the convenience of the U.S. Government or to price renegotiations under the Renegotiation Act. While one of our contracts was terminated in the past due to the termination of the underlying government contracts, we have never experienced a material loss due to termination of a U.S. Government contract. We have never had to renegotiate our price under any government contract. There can be no assurance that we will not have contract termination or price renegotiation in the future.
ENVIRONMENTAL REGULATIONS
To date, our compliance with federal, state and local laws or regulations that have been enacted to regulate the environment has not had a material adverse effect on our capital expenditures, earnings, or competitive or financial position.
Federal, state and local laws and regulations impose various restrictions and controls on the discharge of materials, chemicals and gases used in semiconductor manufacturing processes. In addition, under some laws and regulations, we could be held financially responsible for remedial measures if our properties are contaminated or if we send waste to a landfill or recycling facility that becomes contaminated, even if we did not cause the contamination. Also, we may be subject to common law claims if we release substances that damage or harm third parties. Further, future changes in environmental laws or regulations may require additional investments in capital equipment or the implementation of additional compliance programs in the future. Any failure to comply with environmental laws or regulations could subject us to serious liabilities and could have material adverse effects on our operating results and financial condition.
In the conduct of our manufacturing operations, we have handled and do handle materials that are considered hazardous, toxic or volatile under federal, state or local laws. The risk of accidental release of such materials cannot be completely eliminated. In addition, we operate or own facilities located on or near real property that was formerly owned and operated by others. These properties were used in ways that involved hazardous materials. Contaminants may migrate from or within or through property. These risks may give rise to claims. We may be financially responsible for third parties, who are responsible for contamination, if they do not have funds, or if they do not make funds available when needed, to pay remediation costs imposed under environmental laws and regulations.
In Broomfield, Colorado, the owner of a property located adjacent to a manufacturing facility owned by one of our subsidiaries, Microsemi Corp. – Colorado had notified the subsidiary and other parties of a claim that contaminants migrated to his property, thereby diminishing its value. In August 1995, the subsidiary, together with Coors Porcelain Company, FMC Corporation and Siemens Microelectronics, Inc. (former owners of the manufacturing facility), agreed to settle the claim and to indemnify the owner of the adjacent property for remediation costs. Although trichloroethylene (“TCE”) and other contaminants previously used by former owners at the facility are present in soil and groundwater on the subsidiary’s property, we vigorously contest any assertion that the subsidiary caused the contamination. In November 1998, we signed an agreement with the three former owners of this facility whereby they have 1) reimbursed us for $530,000 of past costs, 2) assumed responsibility for 90% of all future clean-up costs, and 3) promised to indemnify and protect us against any and all third-party claims relating to the contamination of the facility. An Integrated Corrective Action Plan was submitted to the State of Colorado. Sampling and management plans were prepared for the Colorado Department of Public Health & Environment. State and local agencies in Colorado are reviewing current data and considering study and cleanup options. The most recent forecast estimated that the total project cost, up to the year 2020, would be approximately $5,300,000; accordingly, we recorded a one-time charge of $530,000 for this project in 2003. There has not been any significant development since September 28, 2003.
9
Table of Contents
EMPLOYEES
At the end of the most recently completed fiscal year, we employed approximately 1,600 persons domestically and 650 persons at our international facilities. None of our employees are represented by a labor union; however, our employees in Bordeaux, France are represented by an employee works council pursuant to French industrial relations law. We have experienced no work stoppages and believe our employee relations are good.
ACQUISITIONS
We have in the past acquired a number of businesses or companies, additional product lines and assets. We currently expect to continue to expand and diversify our operations with additional acquisitions.
During 2009, we entered into a stock purchase agreement in which we acquired all the shares of Electro Module, Inc. and its wholly-owned subsidiary, Babcock, Inc. Babcock, Inc. is a leading manufacturer of high-reliability power supplies, relays and flat panel displays and supplies. We subsequently renamed Babcock, Inc., “Microsemi Corp. – Power Management Group” (“PMG”). Also during 2009, we entered into an asset purchase agreement in which we acquired substantially all the assets of the Defense and Security business of Endwave Corporation. This business designs, manufactures and markets radio frequency modules that enable the transmission, reception and processing of high frequency signals. Markets for these products include defense electronics, homeland security systems and other applications that require high frequency radio frequency circuitry and subsystems. We subsequently renamed the Defense and Security business of Endwave Corporation, “Microsemi Corp. – RF Integrated Solutions.” Our final acquisition of 2009, was the purchase of substantially all the assets of Nexsem, Inc., a designer and marketer of high-voltage DC to DC conversion devices for applications such as in LCD televisions, set top boxes, notebooks and netbooks.
During 2010, we acquired all of the outstanding common stock of White Electronic Designs Corporation (“White Electronic”), a defense electronics manufacturer and supplier that designs, develops and manufactures innovative electronic components and systems for inclusion in high technology products for the defense and aerospace markets. We also acquired substantially all the assets of VT Silicon, a designer and manufacturer of multi-band radio frequency integrated circuit (“RFIC”) solutions for the mobile wireless broadband market and all the shares of Arxan Defense Systems, Inc., a leading provider of anti-tamper solutions, providing full-service support to defense clients in securing systems against tampering, piracy and reverse engineering.
As referenced in a subsequent events footnote to our consolidated financial statements, at the beginning of 2011, we completed the acquisition of Actel Corporation, a leading supplier of low-power, mixed-signal, and radiation-tolerant field programmable gate arrays (“FPGAs”) serving all of our markets. Actel is the leader in the satellite and space markets as a result of its deep knowledge of radiation tolerance, space-level qualifications, and its long history of service excellence.
| ITEM 1A. RISK | FACTORS |
We are closing and have closed, combined, sold or disposed of certain subsidiaries or divisions, which in the past has reduced our sales volume and resulted in restructuring costs.
In October 2003, we announced the consolidation of the manufacturing operations of Microsemi Corp. – Santa Ana, of Santa Ana, California into some of our other facilities. The Santa Ana facility, whose manufacturing represented approximately 13% of our annual net sales in 2004, had approximately 380 employees and occupied 123,000 square feet. In April 2005, we announced the consolidation of the high-reliability products operations of Microsemi Corp. – Colorado of Broomfield, Colorado (“Broomfield”) into some of our other facilities. Broomfield represented approximately 5% of our annual net sales in 2009, had approximately 50 employees and occupied a 130,000 square foot owned facility. In September 2009, we approved consolidation plans that will result in the closure of our manufacturing facility in Scottsdale, Arizona
10
Table of Contents
(“Scottsdale”) with production activities expected to cease in February 2011. Scottsdale represented approximately 6% of our annual net sales in 2010, currently has approximately 230 employees and operates in a 135,000 square foot leased facility.
The consolidation of Scottsdale is expected to result, subsequent to its completion, in annualized cost savings of an estimated $24 million from the elimination of redundant resources and related expenses and employee reductions. However, we face major technical challenges in regard to transferring component manufacturing between locations. Before a transfer of manufacturing, we must be finished qualifying the new facility appropriately with the U.S. government or certain customers. While we plan generally to retain all of the revenues and income of those operations by transferring the manufacturing elsewhere within Microsemi’s subsidiaries, our plans may change at any time based on reassessment of the alternatives and consequences. While we hope to benefit overall from increased gross margins and increased capacity utilization rates at remaining operations, the remaining operations will need to bear the corporate administrative and overhead costs, which are charges to income that had been allocated to the discontinued business units. Moreover, delays in effecting our consolidations could result in changes in the timing of realized costs savings and in greater than anticipated costs incurred to achieve the anticipated longer-range savings.
We may make further specific determinations to consolidate, close or sell additional facilities, which could be announced at any time. Possible adverse consequences resulting from or related to such announcements may include various accounting charges such as for workforce reduction, including severance and other termination benefits, for inventory write-offs and disposals and for excess facilities, including lease termination fees, future contractual commitments to pay lease charges, facility remediation costs and moving costs to remove property and equipment from facilities. We may also be adversely impacted from inventory buildup in preparation for the transition of manufacturing, disposition costs, impairments of goodwill, a possible immediate loss of revenues, and other items in addition to normal or attendant risks and uncertainties. We may be unsuccessful in any of our current or future efforts to consolidate our business into a smaller number of facilities. Our plans to minimize or eliminate any loss of revenues during consolidation may not be achieved.
Negative or uncertain worldwide economic conditions could prevent us from accurately forecasting demand for our products, which could adversely affect our operating results or market share.
Recent negative worldwide economic conditions and market instability have made it increasingly difficult for us, our customers and our suppliers to accurately forecast future product demand trends. If signs of improvement in the global economy do not progress as expected and global economic conditions worsen, our forecasts of product demand trends could prove to be incorrect and could cause us to produce excess products that can depress product prices, increase our inventory carrying costs and result in obsolete inventory. Alternatively, this forecasting difficulty could cause a shortage of products, or materials used in our products, that could result in an inability to satisfy demand for our products and a loss of market share.
Negative or uncertain worldwide economic conditions may adversely affect our business, financial condition, cash flow and results of operations.
Recent domestic and global economic conditions have presented unprecedented and challenging conditions reflecting continued concerns about the availability and cost of credit, the mortgage market, declining real estate values, increased energy costs, decreased consumer confidence and spending and added concerns fueled by the federal government’s interventions in the financial and credit markets. These conditions have contributed to instability in both the domestic and international capital and credit markets and diminished expectations for the global economy. In addition, these conditions make it extremely difficult for our customers to accurately forecast and plan future business activities and could cause businesses to slow spending on our products, which could cause our sales to decrease or result in an extension of our sales cycles. If signs of improvement in the global economy do not progress as expected and global economic conditions worsen, our customers may have difficulties obtaining capital at adequate or historical levels to finance their ongoing business and operations,
11
Table of Contents
which could impair their ability to make timely payments to us. If that were to occur, we may be required to increase our allowance for doubtful accounts and our days sales outstanding would be negatively impacted. We cannot predict the timing, strength or duration of any economic slowdown or subsequent economic recovery, worldwide or within our industry. If signs of improvement in the global economy do not progress as expected and economic conditions worsen, our business, financial condition, cash flows and results of operations will be adversely affected.
Our operating results may fluctuate in future periods, which could cause our stock price to decline.
We have experienced, and expect to experience in future periods, fluctuations in net sales and operating results from period to period. Our projections and results may be subject to significant fluctuations as a result of a number of factors including:
| • | the timing of orders from and shipment of products to major customers; |
| • | our product mix; |
| • | changes in the prices of our products; |
| • | manufacturing delays or interruptions; |
| • | delays or failures in testing and processing products for defense, security and aerospace applications; |
| • | inventory obsolescence or write-downs; |
| • | restructuring charges; |
| • | variations in the cost of components for our products; |
| • | limited availability of components that we obtain from a single or a limited number of suppliers; and |
| • | seasonal and other fluctuations in demand for our products. |
Unanticipated changes in our tax provisions or exposure to additional income tax liabilities could affect our financial results.
We are subject to income taxes in the United States and numerous foreign jurisdictions. Our tax liabilities are affected by the amounts we record in intercompany transactions for inventory, services, licenses, funding and other items. We are subject to ongoing tax audits in various jurisdictions. Tax authorities may disagree with our intercompany charges or other matters and assess additional taxes. We regularly assess the likely outcomes of these audits in order to determine the appropriateness of our tax provision. However, there can be no assurance that we will accurately predict the outcomes of these audits, and the actual outcomes of these audits could have a material impact on our financial condition. In addition, our effective tax rate in the future could be adversely affected by changes in the mix of earnings in countries with differing statutory tax rates, changes in the valuation of deferred tax assets and liabilities, changes in tax laws, especially tax laws related to foreign operations, and the discovery of new information in the course of our tax return preparation process. Any of these changes could affect our operating results, cash flows and financial condition.
We may be unable to successfully implement our acquisitions strategy or integrate acquired companies and personnel with existing operations.
We have in the past acquired a number of businesses or companies, additional product lines and assets, and we may continue to expand and diversify our operations with additional acquisitions. We may be unable to identify or complete prospective acquisitions for many reasons, including competition from other companies in the semiconductor industry and high valuations of business candidates. In addition, applicable antitrust laws and other regulations may limit our ability to acquire targets or force us to divest an acquired business, such as occurred with our attempt to acquire SEMICOA. If we are unable to identify suitable targets or complete
12
Table of Contents
acquisitions, our growth prospects may suffer, and we may not be able to realize sufficient scale advantages to compete effectively in all markets. To the extent that we are successful in making acquisitions, if we are unsuccessful in integrating acquired companies or product lines with existing operations, or if integration is more difficult or more costly than anticipated, we may experience disruptions that could have a material adverse effect on our business, financial condition and results of operations. In addition, the market price of our common stock could be adversely affected if the effect of any acquisitions on the Microsemi consolidated group’s financial results is dilutive or is below the market’s or financial analysts’ expectations. Some of the risks that may affect our ability to integrate or realize any anticipated benefits from acquired companies, businesses or assets include those associated with:
| • | unexpected losses of key employees or customers of the acquired company; |
| • | conforming the acquired company’s standards, processes, procedures and controls with our operations; |
| • | coordinating new product and process development; |
| • | complications due to our understanding of acquired technologies and products; |
| • | increasing the scope, geographic diversity and complexity of our operations; |
| • | difficulties in consolidating facilities and transferring processes and know-how; |
| • | other difficulties in the assimilation of acquired operations, technologies or products; |
| • | diversion of management’s attention from other business concerns; and |
| • | adverse effects on existing business relationships with customers. |
In connection with acquisitions, we may:
| • | use a significant portion of our available cash; |
| • | issue equity securities, which would dilute current stockholders’ percentage ownership; |
| • | incur substantial debt; |
| • | incur or assume contingent liabilities, known or unknown; |
| • | incur impairment charges related to goodwill or other intangibles; |
| • | incur large, immediate accounting write-offs; and |
| • | face antitrust or other regulatory inquiries or actions. |
There can be no assurance that the benefits of any acquisitions will outweigh the attendant costs, and if they do not, our results of operations and stock price may be adversely affected.
We must commit resources to research and development, design, and production prior to receipt of purchase commitments and could lose some or all of the associated investment.
We sell products primarily pursuant to purchase orders for current delivery, rather than pursuant to long-term supply contracts. Many of these purchase orders may be revised or cancelled without penalty. As a result, we must commit resources to the research, design and production of products without any advance purchase commitments from customers. Any inability to sell a product after we devote significant resources to it could have a material adverse effect on our business, financial condition, results of operations and cash flows.
International operations and sales expose us to material risks and may increase the volatility of our operating results.
Net sales from international markets represent a significant portion of total net sales. Our net sales to international customers represented approximately 40% for 2010, 30% for 2009 and 40% for 2008. These sales
13
Table of Contents
were principally to customers in Europe and Asia. Foreign sales are classified as shipments to foreign destinations. We maintain facilities or contracts with entities in several foreign countries, including Korea, Japan, China, Ireland, Thailand, the Philippines, Malaysia, France, Taiwan, Macau, Israel and India. There are risks inherent in doing business internationally, including:
| • | legislative or regulatory requirements and potential changes in or interpretations of requirements in the United States and in the countries in which we manufacture or sell our products; |
| • | tax regulations and treaties and potential changes in regulations and treaties in the United States and in and between countries in which we manufacture or sell our products; |
| • | fluctuations in income tax expense and net income due to differing statutory tax rates in various domestic and international jurisdictions; |
| • | trade restrictions; |
| • | availability of transportation services, including disruptions related to work stoppages, security incidents or natural events at shipping or receiving points or along transportation routes; |
| • | work stoppages or disruption of local labor supply; |
| • | communication interruptions; |
| • | economic and political instability, including the recent uncertainty in the global financial markets; |
| • | acts of war or terrorism, or health issues (such as Sudden Acute Respiratory Syndrome, Avian Influenza or the H1N1 Virus), which could disrupt our manufacturing and logistical activities; |
| • | changes in import/export regulations, tariffs and freight rates; |
| • | difficulties in collecting receivables and enforcing contracts generally; |
| • | restrictions in the transfer or repatriation of funds; and |
| • | currency exchange rate fluctuations, devaluation of foreign currencies, hard currencies shortages and exchange rate fluctuations. |
If political, military, transportation, health or other issues in foreign countries result in cancellations of customer orders or contribute to a general decrease in economic activity or corporate spending, or directly impact Microsemi’s marketing, manufacturing, financial and logistics functions, our consolidated results of operations and financial condition could be materially adversely affected. In addition, the laws of certain foreign countries may not protect our products, assets or intellectual property rights to the same extent as do U.S. laws. Therefore, the risk of piracy of our technology and products, which could result in a material adverse effect on our financial condition, operating results and cash flows, may be greater in those foreign countries.
There may be unanticipated costs associated with appropriately scaling our manufacturing capacity to meet expected changes in customer demand.
We may incur unanticipated costs as we scale our manufacturing capacity to meet expected changes in customer demand. During periods of anticipated increases in customer demand, we may determine that our business will require increased manufacturing capacity on our part and on the part of certain outside foundries, assembly shops, or testing facilities for some of our integrated circuit products or other products. Expansion activities are subject to a number of risks, including:
| • | unavailability or late delivery of the advanced, and often customized, equipment used in the production of our specialized products; |
| • | availability of qualified manufacturing personnel; |
| • | delays in bringing new production equipment on-line; |
14
Table of Contents
| • | delays in supplying satisfactory designs or products to our existing customers; |
| • | unforeseen environmental, engineering or manufacturing qualification problems relating to existing or new facilities; and |
| • | overexpansion may result in unfavorable manufacturing variances, restructuring costs and impairments. |
These and other risks may affect the ultimate cost and timing of any expansion of our capacity.
Downturns in the highly cyclical semiconductor industry have in the past adversely affected our operating results, cash flows and the value of our business, and may continue to do so in the future.
The semiconductor industry is highly cyclical and is characterized by constant technological change, rapid product obsolescence and price erosion, short product life-cycles and fluctuations in product supply and demand. During recent years we, as well as many others in our industry, have experienced significant declines in the pricing of, as well as demand for, products during the “down” portions of these cycles, which have sometimes been severe and prolonged. In the future, these downturns may prove to be as, or possibly even more, severe than past ones. Our ability to sell our products depends, in part, on continued demand in a large number of markets, including all of our reported end markets. Each of these end markets has in the past experienced reductions in demand, and current and future downturns in any of these markets may continue to adversely affect our revenues, operating results, cash flows and financial condition.
The semiconductor business is subject to downward price pressure.
The market for our products has been characterized by declining selling prices, and we anticipate that our average selling prices will decrease in future periods, although the timing and amount of these decreases cannot be predicted with any certainty. The pricing pressure in the semiconductor industry in past years has been due to a large number of factors, many of which were not easily foreseeable, such as the Asian currency crisis, industry-wide excess manufacturing capacity, weak economic growth, the slowdown in capital spending that followed the “dot-com” collapse, the reduction in capital spending by telecom companies and satellite companies, and the effects of the tragic events of terrorism on September 11, 2001. Similar to past years, recent unfavorable economic conditions have resulted in a tightening of the credit markets. If signs of improvement in the global economy do not progress as expected and global economic conditions worsen, we may experience a decline in our average selling prices. In addition, our competitors have in the past, and may again in the future, lower prices in order to increase their market share. Continued downward price pressure in the industry may reduce our operating results and harm our financial and competitive position.
The semiconductor industry is highly competitive.
The semiconductor industry, including most of the markets in which we do business, is highly competitive. We have numerous competitors in the various markets in which we sell products. Some of our current major competitors are Freescale Semiconductor, Inc., National Semiconductor Corp., Texas Instruments, Inc., Koninklijke Philips Electronics, ON Semiconductor Corp., Fairchild Semiconductor International, Inc., Micrel Incorporated, International Rectifier Corp., Semtech Corp., Linear Technology Corp., Maxim Integrated Products, Inc., Skyworks Solutions, Inc., Diodes, Inc., Vishay Intertechnology, Inc., O2Micro International, Ltd. and Monolithic Power Systems, Inc. Some of our competitors in developing markets are Triquint Semiconductor, Inc., RF Micro Devices, Inc., Anadigics, Inc. and Skyworks Solutions, Inc. Many of these companies are larger than we are and have greater resources than we have and may therefore be better able than we are to penetrate new markets, pursue acquisition candidates, and withstand adverse economic or market conditions. We expect intensified competition from both these existing competitors and new entrants into our markets. To the extent we are not able to compete successfully in the future, our financial condition, operating results or cash flows could be harmed.
15
Table of Contents
We may not be able to develop new technologies and products to satisfy changes in customer demand, and our competitors could develop products that decrease the demand for our products.
Rapidly changing technologies and industry standards, along with frequent new product introductions, characterize the semiconductor industry. Our financial performance depends, in part, on our ability to design, develop, manufacture, assemble, test, market and support new products and enhancements on a timely and cost-effective basis. If we are unable to continue to reduce package sizes, improve manufacturing yields and expand sales, we may not remain competitive. The competitiveness of designs that we have introduced, including integrated circuits and subsystems such as class D audio subsystems for newly-introduced home theatre DVD players supporting surround sound, power-over-ethernet, PDA backlighting subsystems, backlight control and power management solutions for the automotive notebook computer, monitors and the LCD TV market, LED driver solutions and power amplifiers for certain wireless LAN components, are subject to various risks and uncertainties that we are not able to control, including changes in customer demand and the introduction of new or superior technologies by others. Moreover, any failure by us in the future to develop new technologies or timely react to changes in existing technologies could materially delay our development of new products, which could result in product obsolescence, decreased revenues and a loss of our market share to our competitors. New technologies or products that we may develop may not lead to an incremental increase in revenues, and there is a risk that these new technologies or products will decrease the demand for our existing products and result in an offsetting reduction in revenues. In addition, products or technologies developed by others may render our products or technologies obsolete or non-competitive. A fundamental shift in technologies in our product markets could have a material adverse effect on our competitive position within the industry.
Compound semiconductor products may not successfully compete with silicon-based products.
Our choices of technologies for development and future implementation may not reflect future market demand. The production of gallium arsenide (GaAs), indium gallium phosphide (InGaP), silicon germanium (SiGe), indium gallium arsenide phosphide (InGaAsP) or silicon carbide (SiC) integrated circuits is more costly than the production of silicon circuits, and we believe it will continue to be more costly in the future. The costs differ because of higher costs of raw materials, lower production yields and higher unit costs associated with lower production volumes. Silicon semiconductor technologies are widely used in process technologies for integrated circuits, and these technologies continue to improve in performance. As a result, we must offer compound semiconductor products that provide vastly superior performance to that of silicon for specific applications in order for our products to be competitive with silicon products. If we do not offer compound semiconductor products that provide sufficiently superior performance to offset the cost differential and otherwise successfully compete with silicon-based products, our revenues and operating results may be materially and adversely affected.
Production delays related to new compound semiconductors could adversely affect our future results.
We utilize process technology to manufacture compound semiconductors such as GaAs, InGaP, SiGe, SiC and InGaAsP primarily to manufacture semiconductor components. We are pursuing this development effort internally as well as with third party foundries. Our efforts sometimes may not result in commercially successful products. Certain of our competitors offer this capability and our customers may purchase our competitors’ products instead of ours for this reason. In addition, the third party foundries that we use may delay delivery of, or even completely fail to deliver, technology and products to us. Our business and financial prospects could be materially and adversely affected by any failure by us to timely produce these products.
We may be unable to retain our customers due in part to our inability to fulfill our customer demand and other factors.
Our ability to fulfill our customers’ demand for our products is and will continue to be dependent in part on our order volumes and long lead times with regard to our manufacturing and testing of certain high-reliability
16
Table of Contents
products. The lead time for manufacture and testing of high-reliability products can be many months. In response to this current demand, we have recently increased our capital expenditures for production equipment as well as increased expenses for personnel at certain manufacturing locations. We may have delays or other difficulties in regard to increasing our production and in hiring and retaining qualified personnel. In addition, we have raised prices on certain products, primarily in our security & defense and aerospace end markets. Manufacturing delays and price increases may result in our customers reducing their purchase levels with us and/or seeking alternative solutions to meet their demand. In addition, the current demand may not continue in the future. Decreased sales as a result of a loss of one or more significant customers could materially and adversely impact our business and results of operations.
Unfavorable or uncertain conditions in certain retail markets that our OEM customers address may cause fluctuations in our rate of revenue growth or financial results.
Some of the principal markets we serve include consumer markets, such as mobile/connectivity and notebooks, monitors and LCD televisions. If domestic and global economic conditions worsen, overall consumer spending may be reduced or shifted to products other than those made by our customers, which would adversely impact demand for products in these market. Reduced sales by our customers in these end markets will adversely impact demand by our customers for our products and could also slow new product introductions by our customers and by us. Lower net sales of our products would have an adverse effect on our revenue, cash flow and results of operations.
Fluctuations in sales of high-reliability products for use in implantable defibrillators may adversely affect our financial results.
Although the market for implantable defibrillators is growing, customers in this market could reduce their reliance on outside suppliers. The implantable defibrillator market also fluctuates based on several other factors, such as product recalls and the need to secure regulatory approvals. Product recalls can from time to time accelerate sales to levels that cannot be sustained for long periods of time. The timing and qualification of new generations of products brought to market by OEMs can also result in fluctuations in order rates.
Variability of our manufacturing yields may affect our gross margins and profits.
Our manufacturing yields vary significantly among products, depending on the complexity of a particular product’s design and our experience in manufacturing that type of product. We have in the past experienced difficulties in achieving planned yields, which have adversely affected our gross margins and profits.
The fabrication of semiconductor products is a highly complex and precise process. Problems in the fabrication process can cause a substantial percentage of wafers to be rejected or numerous circuits on each wafer to be non-functional, thereby reducing yields. These difficulties include:
| • | defects in masks, which are used to transfer circuit patterns onto our wafers; |
| • | impurities in the materials used; |
| • | contamination of the manufacturing environment; and |
| • | equipment failure. |
Because a large portion of our costs of manufacturing is relatively fixed and average selling prices for our products tend to decline over time, it is critical for us to improve the number of shippable circuits per wafer and increase the production volume of wafers in order to maintain and improve our results of operations. Yield decreases can result in substantially higher unit costs, which could materially and adversely affect our operating results and have done so in the past. Moreover, our process technologies have primarily utilized standard silicon semiconductor manufacturing equipment, and production yields of compound integrated circuits have been
17
Table of Contents
relatively low compared with silicon circuit devices. We may be unable to continue to improve yields in the future, and we may suffer periodic yield problems, particularly during the early production of new products or introduction of new process technologies. In either case, our results of operations could be materially and adversely affected.
The concentration of the factories that service the semiconductor industry makes us more susceptible to events or disasters affecting the areas in which they are most concentrated.
Relevant portions of the semiconductor industry, and the factories that serve or supply this industry, tend to be concentrated in certain areas of the world. Disruptive events, such as natural disasters, epidemics and health advisories like those related to Sudden Acute Respiratory Syndrome, Avian Influenza or the H1N1 Virus, power outages and infrastructure disruptions, and civil unrest and political instability in those areas, have from time to time in the past, and may again in the future, adversely affect the semiconductor industry. In particular, events such as these could adversely impact our ability to manufacture our products and result in a loss of sales and revenue. Similarly, a localized health risk affecting our employees or the staff of our suppliers could impair the total volume of products that we are able to manufacture, which could adversely affect our results of operations and financial condition.
Some of our facilities are located near major earthquake fault lines.
Our headquarters, our major operating facilities, and certain other critical business operations are located near known major earthquake fault lines. We presently do not have earthquake insurance. We could be materially and adversely affected in the event of a major earthquake.
Delays in beginning production, implementing production techniques, resolving problems associated with technical equipment malfunctions, or issues related to government or customer qualification of facilities could adversely affect our manufacturing efficiencies and our ability to realize cost savings.
Microsemi’s consolidated manufacturing efficiency will be an important factor in our future profitability, and we may be unsuccessful in our efforts to maintain or increase our manufacturing efficiency. Our manufacturing processes, and those utilized by our third-party subcontractors, are highly complex, require advanced and costly equipment and are sometimes modified in an effort to improve yields and product performance. We have from time to time experienced difficulty in transitions of manufacturing processes to different facilities or adopting new manufacturing processes. As a consequence, we have at times experienced delays in product deliveries and reduced yields. Every silicon wafer fabrication facility utilizes very precise processing, and processing difficulties and reduced yields commonly occur, often as a result of contamination of the material. Reduced manufacturing yields can often result in manufacturing and shipping delays due to capacity constraints. Therefore, manufacturing problems can result in additional operating expense and delayed or lost revenues. In one instance, which occurred in 2005, Microsemi scrapped nonconforming inventory at a cost of approximately $1 million and experienced a delay of approximately two months in realizing approximately $1.5 million of net sales. In an additional instance, which occurred in 2004, Microsemi encountered a manufacturing problem concerning contamination in a furnace that resulted in the quarantine of approximately one million units at a cost of approximately $2 million. The identification and resolution of that manufacturing issue required four months of effort to investigate and resolve, which resulted in a concurrent delay in realizing approximately $2 million of net sales. Microsemi may experience manufacturing problems in achieving acceptable yields or experience product delivery delays in the future as a result of, among other things, upgrading existing facilities, relocating processes to different facilities, or changing its process technologies, any of which could result in a loss of future revenues or an increase in manufacturing costs.
18
Table of Contents
Interruptions, delays or cost increases affecting our materials, parts, equipment or subcontractors may impair our competitive position.
Our manufacturing operations, and the outside manufacturing operations that we use increasingly, in some instances depend upon obtaining a governmental qualification of the manufacturing process, and in all instances, adequate supplies of materials including wafers, parts and equipment (including silicon, mold compounds and lead frames) on a timely basis from third parties. Some of the outside manufacturing operations we use are based in foreign countries. Our results of operations could be adversely affected if we are unable to obtain adequate supplies of materials, parts and equipment in a timely manner or if the costs of materials, parts or equipment increase significantly. From time to time, suppliers may extend lead times, limit supplies or increase prices due to capacity constraints or other factors. Although we generally use materials, parts and equipment available from multiple suppliers, we have a limited number of suppliers for some materials, parts and equipment. In addition, if signs of improvement in the global economy do not progress as expected and global economic conditions worsen, our suppliers may cease operations or be unable to obtain capital at adequate or historical levels to finance their ongoing business and operations, which could impair their ability to continue to supply us. If alternate suppliers for these materials, parts and equipment are not available, our operations could be interrupted, which would have a material adverse effect on our operating results, financial condition and cash flows.
Some of our products are manufactured, assembled and tested by third-party subcontractors, some of whom are based in foreign countries. We generally do not have any long-term agreements with these subcontractors. As a result, we may not have direct control over product delivery schedules or product quality. Outside manufacturers generally will have longer lead times for delivery of products as compared with our internal manufacturing, and therefore, when ordering from these suppliers, we will be required to make longer-term estimates of our customers’ current demand for products, and these estimates are difficult to make accurately. Also, due to the amount of time typically required to qualify assemblers and testers, we could experience delays in the shipment of our products if we are forced to find alternate third parties to assemble or test our products. Any product delivery delays in the future could have a material adverse effect on our operating results, financial condition and cash flows. Our operations and ability to satisfy customer obligations could be adversely affected if our relationships with these subcontractors were disrupted or terminated. In addition, these subcontractors must be qualified by the U.S. government or customers for high-reliability processes. Historically the Defense Supply Center Columbus (DSCC) has rarely qualified any foreign manufacturing or assembly lines for reasons of national security; therefore, our ability to move certain manufacturing offshore may be limited or delayed.
We depend on third party subcontractors in Asia for wafer fabrication, assembly and packaging of an increasing portion of our products. On a unit basis, we currently utilize third-party subcontractors for approximately 80% of our assembly and packaging requirements and 20% of our wafer fabrication. We expect that these percentages may increase due, in part, to the manufacture of our next-generation products by third party subcontractors in Asia. The packaging of our products is performed by a limited group of subcontractors and some of the raw materials included in our products are obtained from a limited group of suppliers. Disruption or termination of any of these sources could occur and such disruptions or terminations could harm our business and operating results. In the event that any of our subcontractors were to experience financial, operational, production or quality assurance difficulties resulting in a reduction or interruption in supply to us, our operating results could suffer until alternate qualified subcontractors, if any, were to become available and active.
Fixed costs may reduce operating results if our sales fall below expectations.
Our expense levels are based, in part, on our expectations for future sales. Many of our expenses, particularly those relating to capital equipment and manufacturing overhead, are relatively fixed. We might be unable to reduce spending quickly enough to compensate for reductions in sales. Accordingly, shortfalls in sales could materially and adversely affect our operating results. This challenge could be made even more difficult if lead times between orders and shipments are shortening.
19
Table of Contents
Reliance on government contracts for a portion of our sales could have a material adverse effect on results of operations.
Some of our sales are or may be derived from customers whose principal sales are to the United States government. These sales are or may be derived from direct and indirect business with the U.S. Department of Defense and other U.S. government agencies. Future sales are subject to the uncertainties of governmental appropriations and national defense policies and priorities and potential changes in these policies and priorities under a new administration. If we experience significant reductions or delays in procurements of our products by the U.S. government or terminations of government contracts or subcontracts, our operating results could be materially and adversely affected. Generally, the U.S. government and its contractors and subcontractors may terminate their contracts with us for cause or for convenience. We have in the past experienced one termination of a contract due to the termination of the underlying government contracts. All government contracts are also subject to price renegotiation in accordance with the U.S. Government Renegotiation Act. By reference to such contracts, all of the purchase orders we receive that are related to government contracts are subject to these possible events. There is no guarantee that we will not experience contract terminations or price renegotiations of government contracts in the future. Microsemi’s aggregate net sales to the security & defense end market represented approximately 40% of total net sales in 2010. From time to time, we have experienced declining security and defense-related sales, primarily as a result of contract award delays and reduced defense program funding. The timing and amount of an increase, if any, in security and defense-related business is uncertain. In the past, expected increases in defense-related spending have occurred at a rate that has been slower than expected. Our prospects for additional security and defense-related sales may be adversely affected in a material manner by numerous events or actions outside our control.
Failure to manage consolidation of operations effectively could adversely affect our margins and earnings.
Our ability to successfully offer and sell our products requires effective planning and management processes. Our consolidations and realignments of operations, and expected future growth, may place a significant strain on our management systems and resources, including our financial and managerial controls, reporting systems, procedures and information technology. In addition, we will need to continue to train and manage our workforce worldwide. Any unmet challenges in that regard could negatively affect our results of operations.
Any failure by us to protect our proprietary technologies or maintain the right to use certain technologies may negatively affect our ability to compete.
We rely heavily on our proprietary technologies. Our future success and competitive position depend in part upon our ability to obtain or maintain protection of certain proprietary technologies used in our principal products. We do not have significant patent protection on many aspects of our technology. The protection of some of our technology as “trade secrets” will not necessarily protect us from all uses by other persons of our technology, or their use of technology that is similar or superior to that which is embodied in our trade secrets. In addition, others may be able to independently duplicate or exceed our technology in whole or in part. In the instances in which we hold patents or patent licenses, such as with respect to some circuit components for notebook computers and LCD TVs, any patents held by us may be challenged, invalidated or circumvented, or the rights granted under any patents may not provide us with competitive advantages. Patents often provide only narrow protection and require public disclosure of information that may otherwise be subject to trade secret protection. In addition, patents eventually expire and are not renewable.
Obtaining or protecting our proprietary rights may require us to defend claims of intellectual property infringement by our competitors. We could also become subject to lawsuits in which it is alleged that we have infringed or are infringing upon the intellectual property rights of others with or without our prior awareness of the existence of those third-party rights, if any. Litigation in connection with our intellectual property, whether instituted by us or others, could be very costly and distract management and other resources from our business.
20
Table of Contents
We are currently involved in certain patent litigation to protect our patents and patent rights, which could cause legal costs to increase above normal levels over the next several years. It is not possible to estimate the exact amounts of these costs, but it is possible that these costs could have a negative effect on our future results.
Moreover, if any infringement, real or imagined, happens to exist, arise or is claimed in the future, we may be exposed to substantial liability for damages and may need to obtain licenses from the patent owners, discontinue or change our processes or products or expend significant resources to develop or acquire non-infringing technologies. We may not be successful in such efforts, or such licenses may not be available under reasonable terms. Any failure by us to develop or acquire non-infringing technologies or to obtain licenses on acceptable terms could have a material adverse effect on our operating results, financial condition and cash flows.
Our products may be found to be defective or hazardous and we may not have sufficient liability insurance.
There is at any time a risk that our products may be found to be defective or to contain, without the customer’s knowledge, certain prohibited hazardous chemicals after we have already shipped the products in volume, perhaps requiring a product replacement or recall. We may be subject to product returns that could impose substantial costs and have a material and adverse effect on our business, financial condition and results of operations. Our aerospace, medical and defense businesses in particular expose us to potential liability risks that are inherent in the manufacturing and marketing of high-reliability electronic components for critical applications. Production of many of these products is sensitive to minute impurities, which can be introduced inadvertently in manufacture. Any production mistake can result in large and unanticipated product returns, product liability and warranty liability. Environmental regulations have imposed on every major participant in the electronics industry a new burden of determining and tracking the presence and quantity of certain chemicals in the content of supplies we buy and add to our products for sale and to inform our customers about each of our finished goods’ relevant chemical contents. The management and execution of this process is very challenging, and mistakes in this information gathering process could have a material adverse effect on our business.
We may be subject to product liability claims with respect to our products. Our product liability insurance coverage may be insufficient to pay all such claims. In addition, product liability insurance may become too costly for us to maintain or may become completely unavailable to us in the future. We may not have sufficient resources to satisfy any product liability claims not covered by insurance, which would materially and adversely affect our financial position.
Environmental liabilities could adversely impact our consolidated financial position.
Federal, state and local laws and regulations impose various restrictions and controls on the discharge of materials, chemicals and gases used in our semiconductor manufacturing processes or in our finished goods. Under recent environmental regulations, we are responsible for determining whether certain toxic metals or certain other toxic chemicals are present in any given component we purchase and in each given product we sell. These environmental regulations have required us to expend a portion of our resources and capital on relevant compliance programs. In addition, under other laws and regulations, we could be held financially responsible for remedial measures if our current or former properties are contaminated or if we send waste to a landfill or recycling facility that becomes contaminated, even if we did not cause the contamination. Also, we may be subject to additional common law claims if we release substances that damage or harm third parties. Further, future changes in environmental laws or regulations may require additional investments in capital equipment or the implementation of additional compliance programs in the future. Any failure to comply with existing or future environmental laws or regulations could subject us to significant liabilities and could have a material adverse effect on our operating results, cash flows and financial condition.
21
Table of Contents
In the conduct of our manufacturing operations, we have handled and do handle materials that are considered hazardous, toxic or volatile under federal, state and local laws. The risk of accidental release of such materials cannot be completely eliminated. In addition, we operate or own facilities located on or near real property that was formerly owned and operated by others. These properties were used in ways that involved hazardous materials. Contaminants may migrate from, within or through any such property, which may give rise to claims against us. Third parties who are responsible for contamination may not have funds, or may not make funds available when needed, to pay remediation costs imposed upon us jointly with them under environmental laws and regulations.
In Broomfield, Colorado, the owner of a property located adjacent to a manufacturing facility owned by one of our subsidiaries, Microsemi Corp. – Colorado, had notified the subsidiary and other parties of a claim that contaminants migrated to his property, thereby diminishing its value. In August 1995, the subsidiary, together with Coors Porcelain Company, FMC Corporation and Siemens Microelectronics, Inc. (former owners of the manufacturing facility), agreed to settle the claim and to indemnify the owner of the adjacent property for remediation costs. Although TCE and other contaminants previously used by former owners at the facility are present in soil and groundwater on the subsidiary’s property, we vigorously contest any assertion that the subsidiary caused the contamination. In November 1998, we signed an agreement with the three former owners of this facility whereby they have 1) reimbursed us for $530,000 of past costs, 2) assumed responsibility for 90% of all future clean-up costs, and 3) promised to indemnify and protect us against any and all third-party claims relating to the contamination of the facility. An Integrated Corrective Action Plan was submitted to the State of Colorado. Sampling and management plans were prepared for the Colorado Department of Public Health & Environment. State and local agencies in Colorado are reviewing current data and considering study and cleanup options. The most recent forecast estimated that the total project cost, up to the year 2020, would be approximately $5,300,000; accordingly, we recorded a one-time charge of $530,000 for this project in 2003. There has not been any significant development since September 28, 2003.
Litigation could adversely impact our consolidated financial position.
We are and have been involved in various litigation matters, including from time to time, litigation relating to employment matters, commercial transactions, contracts, environmental matters and matters related to compliance with governmental regulations. Litigation is inherently uncertain and unpredictable. The potential risks and uncertainties include, but are not limited to, such factors as the costs and expenses of litigation and the time and attention required of management to attend to litigation. An unfavorable resolution of any particular legal claim or proceeding, and/or the costs and expenses incurred in connection with a legal claim or proceeding, could have a material adverse effect on our consolidated financial position or results of operations.
Our future success depends, in part, upon our ability to continue to attract and retain the services of our executive officers or other key management or technical personnel.
We could potentially lose the services of any of our senior management personnel at any time due to a variety of factors that could include, without limitation, death, incapacity, military service, personal issues, retirement, resignation or competing employers. Our ability to execute current plans could be adversely affected by such a loss. We may fail to attract and retain qualified technical, sales, marketing and managerial personnel required to continue to operate our business successfully. Personnel with the expertise necessary for our business are scarce and competition for personnel with proper skills is intense. Also, attrition in personnel can result from, among other things, changes related to acquisitions, retirement and disability. We may not be able to retain existing key technical, sales, marketing and managerial employees or be successful in attracting, assimilating or retaining other highly-qualified technical, sales, marketing and managerial personnel, particularly at such times in the future as we may need to fill a key position. If we are unable to continue to retain existing executive officers or other key employees or are unsuccessful in attracting new highly-qualified employees, our business, financial condition and results of operations could be materially and adversely affected.
22
Table of Contents
The volatility of our stock price could affect the value of an investment in our stock and our future financial position.
The market price of our stock has fluctuated widely. Between October 3, 2010 and September 29, 2008, the market sale price of our common stock ranged between a low of $7.06 and a high of $25.62. The historic market price of our common stock may not be indicative of future market prices. We may not be able to sustain or increase the value of our common stock. The trading price of our common stock may be influenced by factors beyond our control, such as the recent unprecedented volatility of the financial markets and the current uncertainty surrounding domestic and foreign economies. Declines in the market price of our stock could adversely affect our ability to retain personnel with stock incentives, to acquire businesses or assets in exchange for stock and/or to conduct future financing activities with or involving our common stock.
We may not make the sales that are suggested by our order rates, backlog or book-to-bill ratio, and our book-to-bill ratio may be affected by product mix.
Prospective investors should not place undue reliance on our book-to-bill ratios or changes in book-to-bill ratios. We determine bookings substantially based on orders that are scheduled for delivery within 12 months. However, lead times for the release of purchase orders depend, in part, upon the scheduling practices of individual customers, and delivery times of new or non-standard products can be affected by scheduling factors and other manufacturing considerations. The rate of booking new orders can vary significantly from month to month. Customers frequently change their delivery schedules or cancel orders. We have in the past experienced long lead times for some of our products, which may have therefore resulted in orders in backlog being duplicative of other orders in backlog, which would increase backlog without resulting in additional revenues. Because of long lead times in certain products, our book-to-bill ratio may not be an indication of sales in subsequent periods. Uncertain worldwide economic conditions and market instability have also resulted in hesitance of our customers to place orders with long delivery schedules, which contributes to limited visibility into our markets.
At times, our inventory levels have risen, which adversely affects cash flow.
At times, our inventory levels have risen. An increased inventory level adversely affects cash flow. The primary factor contributing to the increase in our inventory levels is work in progress in our satellite products because our satellite products require very long lead times for testing. A second factor impacting our inventory build up is the planned consolidation of our manufacturing operations between facilities. We built inventory cushions during the transition of manufacturing between facilities in order to maintain an uninterrupted supply of product. Obsolescence of any inventory has recently and could in the future result in adverse effects on our future results of operations and future revenue. In 2009, in addition to other inventory write-downs, we recorded inventory write-downs of $10.3 million for product lines that did not meet gross margin targets, products that are being migrated to newer generations, and products that service the large capital spending end markets for which demand has declined and $7.3 million for estimated inventory components that will not be used by the anticipated closure date of our Scottsdale facility and that cannot be used by other manufacturing facilities.
There may be some potential effects of system outages.
We face risks from electrical or telecommunications outages, computer hacking or other general system failure. We rely heavily on our internal information and communications systems and on systems or support services from third parties to manage our operations efficiently and effectively. Any of these are subject to failure. System-wide or local failures that affect our information processing could have a material adverse effect on our business, financial condition, results of operations and cash flows. In addition, insurance coverage does not generally protect from normal wear and tear, which can affect system performance. Any applicable insurance coverage for an occurrence could prove to be inadequate. Coverage may be or become unavailable or inapplicable to any risks then prevalent. We are upgrading and integrating, and have plans to upgrade and
23
Table of Contents
integrate further our enterprise information systems, and these efforts may cause additional strains on personnel and system resources or may result in potential system outages.
Our investments in securities subject us to principal, liquidity and counterparty risks that could adversely affect our financial results.
We invest cash balances in excess of projected liquidity needs primarily in money market funds. All of our investments to date are highly rated; however, current credit market disruptions may adversely the value and liquidity of these investments.
We may have increasing difficulty attracting and retaining qualified outside Board members.
The directors and management of publicly traded corporations are increasingly concerned with the extent of their personal exposure to lawsuits and shareholder claims, as well as governmental and creditor claims that may be made against them in connection with their positions with publicly-held companies. Outside directors are becoming increasingly concerned with the availability of directors’ and officers’ liability insurance to pay on a timely basis the costs incurred in defending shareholder claims. Directors’ and officers’ liability insurance is expensive and difficult to obtain. The SEC and the NASDAQ Stock Market have also imposed higher independence standards and certain special requirements on directors of public companies. Accordingly, it may become increasingly difficult to attract and retain qualified outside directors to serve on our Board.
Delaware law and our charter documents contain provisions that could discourage or prevent a potential takeover of Microsemi that might otherwise result in our stockholders receiving a premium over the market price for their shares.
Provisions of Delaware law, our certificate of incorporation and bylaws, and our Shareholder Rights Plan could make more difficult an acquisition of Microsemi by means of a tender offer, a proxy contest, or otherwise, and the removal of incumbent officers and directors. These provisions include:
| • | The Shareholder Rights Plan, which provides that an acquisition of 20% or more of the outstanding shares without our Board’s approval or ratification results in the exercisability of the Right accompanying each share of our common stock, thereby entitling the holder to purchase 1/4,000th of a share of Series A Junior Participating Preferred Stock for $100, resulting in dilution to the acquirer because each Right under some circumstances entitles the holder upon exercise to receive securities or assets valued at $200 and under other circumstances entitles the holder to ten (10) times the amount of any dividends or distributions on our common stock; |
| • | Section 203 of the Delaware General Corporation Law, which prohibits a merger with a 15%-or-greater stockholder, such as a party that has completed a successful tender offer, without board approval until three years after that party became a 15%-or-greater stockholder; |
| • | The authorization in the certificate of incorporation of undesignated preferred stock, which could be issued without stockholder approval in a manner designed to prevent or discourage a takeover or in a way that may dilute an investment in our common stock; and |
| • | Certain provisions of our charter documents, including provisions eliminating the ability of stockholders to take action by written consent or call special meetings and limiting the ability of stockholders to raise matters at a meeting of stockholders without giving advance notice, may have the effect of delaying or preventing changes in control or management of Microsemi. In addition, our charter documents do not permit cumulative voting, which may make it more difficult for a third party to gain control of our Board of Directors. |
In connection with our Shareholder Rights Plan, each share of our common stock, par value $0.20, also entitles the holder to one redeemable and cancellable Right (not presently exercisable), as adjusted from time to
24
Table of Contents
time, to a given fraction of a share of Series A Junior Participating Preferred Stock, at a given exercise price, as adjusted from time to time under the terms and conditions as set forth in a Shareholder Rights Agreement. The existence of the Rights may make it more difficult or impracticable for a hostile change of control of us, which therefore may affect the anticipated return on an investor’s investment in our common stock.
Our accounting policies and estimates have a material effect on the financial results we report.
Critical accounting policies and estimates have a material effect on our calculations and estimations of amounts in our financial statements. Our operating results and balance sheets may be adversely affected either to the extent that actual results prove to be materially lower than previous accounting estimates or to the extent that accounting estimates are revised adversely. We base our critical accounting policies, including our policies regarding revenue recognition, reserves for returns, stock rotation rights, rebates, price protections, and bad debt and inventory valuation, on various estimates and subjective judgments that we may make from time to time. The judgments made can significantly affect net income and our balance sheets. We are required to make significant judgments concerning inventory, and whether it becomes obsolete or excess, and concerning impairments of long-lived assets and of goodwill. Our judgments, estimates and assumptions are subject to change at any time. In addition, our accounting policies may change at any time as a result of changes in generally accepted accounting principles as they apply to us or changes in other circumstances affecting us. Changes in accounting policy have affected and could further affect, in each case materially and adversely, our results of operations or financial position.
If, in the future, we conclude that our internal control over financial reporting is not effective, investors could lose confidence in the reliability of our financial statements, which could result in a decrease in the value of our common stock.
As directed by Section 404 of the Sarbanes-Oxley Act of 2002, the SEC adopted rules requiring public companies to include a report of management on the companies’ internal control over financial reporting in their annual reports on Form 10-K, including an assessment by management of the effectiveness of the filing company’s internal control over financial reporting. In addition, the independent registered public accounting firm auditing a public company’s financial statements must attest to the effectiveness of the company’s internal control over financial reporting. There is a risk that in the future we may identify internal control deficiencies that suggest that our controls are no longer effective. This could result in an adverse reaction in the financial markets due to a loss of confidence in the reliability of our financial statements, which could cause the market price of our common stock to decline and make it more difficult for us to finance our operations.
| ITEM 1B. UNRESOLVED | STAFF COMMENTS |
None.
| ITEM 2. | PROPERTIES |
Our headquarters are located in a leased building complex in Irvine, California. This complex contains general office and engineering space. We own office, engineering and production facilities in Lawrence, Massachusetts; Garden Grove, California; Broomfield, Colorado and Ennis, Ireland. We also lease office, engineering and/or production facilities, including locations in San Jose, La Mirada, Folsom and Santa Clara, California; Scottsdale and Phoenix, Arizona; West Lafayette, Indiana; Atlanta, Georgia; Lowell, Massachusetts; Bend, Oregon; Melville, New York; Shanghai, China; Taiwan, Hong Kong, Macau, the Philippines, Israel, Ireland and France. Operations have ceased at our Broomfield, Colorado facility and we intend on disposing of this property. We believe that our existing facilities are well maintained and in good operating condition and that they are adequate for our foreseeable business needs.
25
Table of Contents
| ITEM 3. | LEGAL PROCEEDINGS |
In Broomfield, Colorado, the owner of a property located adjacent to a manufacturing facility owned by one of our subsidiaries, Microsemi Corp. – Colorado had notified the subsidiary and other parties of a claim that contaminants migrated to his property, thereby diminishing its value. In August 1995, the subsidiary, together with Coors Porcelain Company, FMC Corporation and Siemens Microelectronics, Inc. (former owners of the manufacturing facility), agreed to settle the claim and to indemnify the owner of the adjacent property for remediation costs. Although TCE and other contaminants previously used by former owners at the facility are present in soil and groundwater on the subsidiary’s property, we vigorously contest any assertion that the subsidiary caused the contamination. In November 1998, we signed an agreement with the three former owners of this facility whereby they have 1) reimbursed us for $530,000 of past costs, 2) assumed responsibility for 90% of all future clean-up costs, and 3) promised to indemnify and protect us against any and all third-party claims relating to the contamination of the facility. An Integrated Corrective Action Plan was submitted to the State of Colorado. Sampling and management plans were prepared for the Colorado Department of Public Health & Environment. State and local agencies in Colorado are reviewing current data and considering study and cleanup options. The most recent forecast estimated that the total project cost, up to the year 2020, would be approximately $5,300,000; accordingly, we recorded a one-time charge of $530,000 for this project in fiscal year 2003. There has not been any significant development since September 28, 2003.
We are also involved in other pending litigation matters arising out of the normal conduct of our business, including litigation relating to acquisitions, employment matters, commercial transactions, contracts, environmental matters and matters related to compliance with governmental regulations. Although the ultimate aggregate amount of monetary liability or financial impact with respect to these matters is subject to many uncertainties and is therefore not predictable with assurance. In the opinion of management, the final outcome of these matters, if they are adverse, will not have a material adverse effect on our financial position, results of operations or cash flows. However, there can be no assurance with respect to such result, and monetary liability or financial impact on us from these litigation matters could differ materially from those projected.
| ITEM 4. | REMOVED AND RESERVED |
26
Table of Contents
| ITEM 5. | MARKET FOR REGISTRANT’S COMMON EQUITY, RELATED STOCKHOLDER MATTERS AND ISSUER PURCHASES OF EQUITY SECURITIES |
(a) Market Information
Our Common Stock is traded on the NASDAQ Global Select Market under the symbol MSCC. The following table sets forth the high and low sales prices at which our Common Stock traded as reported on the NASDAQ Global Select Market.
| Fiscal Year ended October 3, 2010 |
HIGH | LOW | ||||||
|
1st Quarter |
$ | 17.99 | $ | 12.85 | ||||
|
2nd Quarter |
$ | 18.50 | $ | 14.67 | ||||
|
3rd Quarter |
$ | 18.00 | $ | 14.18 | ||||
|
4th Quarter |
$ | 17.65 | $ | 13.83 | ||||
| Fiscal Year ended September 27, 2009 |
HIGH | LOW | ||||||
|
1st Quarter |
$ | 25.62 | $ | 10.34 | ||||
|
2nd Quarter |
$ | 13.91 | $ | 7.06 | ||||
|
3rd Quarter |
$ | 15.69 | $ | 10.75 | ||||
|
4th Quarter |
$ | 16.13 | $ | 12.77 | ||||
POSSIBLE VOLATILITY OF STOCK PRICES
The market prices of securities issued by technology companies, including ours, have been and will be volatile. The securities of many technology companies have experienced extreme price and volume fluctuations, which have often not necessarily been related to their respective operating performances. Quarter to quarter variations in operating results, changes in earnings estimates by analysts, announcements of technological innovations or new products, announcements of major contract awards, events involving other companies in or out of the industry, economic conditions, events involving war or terrorism, and other events or factors may have a significant impact (positive or negative) on the market price of our Common Stock.
(b) Approximate Number of Common Equity Security Holders
| Title of Class |
Approximate Number of Record Holders (as of November 16, 2010) |
|||
| Common Stock, $0.20 Par Value |
515 | (1) | ||
| (1) | The number of stockholders of record treats all of the beneficial holders of shares held in one “nominee” or “street name” as a unit. |
(c) Dividends
We have not paid cash dividends in the last five years and have no current plans to do so. Our credit facility contains covenants that restrict the amount of cash dividends we may pay.
27
Table of Contents
(d) Performance Graph
The following graph, which is furnished rather than filed, compares the five-year cumulative total return on the Company’s Common Stock to the total returns of 1) NASDAQ Stock Market and 2) NASDAQ Stock Market—Electronics & Electrical Equipment & Components Index, excluding Computer Equipment. This comparison assumes in each case that $100 was invested on or about September 30, 2005 and all dividends were reinvested. The Company’s fiscal year ends on a Sunday on or about September 30 each year.
COMPARISON OF 5 YEAR CUMULATIVE TOTAL RETURN*
Among Microsemi Corporation, The NASDAQ Composite Index
And the NASDAQ Electronic Components Index
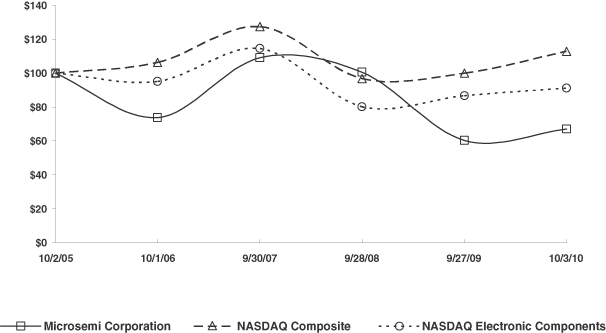
| * | $100 invested on October 2, 2005 in stock or on September 30, 2005 in index – including reinvestment of dividends. Indexes calculated on month-end basis. |
28
Table of Contents
| ITEM 6. | SELECTED FINANCIAL DATA |
| For the five fiscal years in the period ended on or
about October 3, 2010 (Amounts in thousands, except per share data) |
||||||||||||||||||||
| 2010 | 2009 | 2008 | 2007 | 2006 | ||||||||||||||||
| Selected Consolidated Income Statement Data: |
||||||||||||||||||||
| Net sales |
$ | 518,268 | $ | 452,972 | $ | 514,067 | $ | 442,252 | $ | 370,477 | ||||||||||
| Gross profit |
$ | 248,211 | $ | 180,407 | $ | 228,972 | $ | 181,038 | $ | 164,801 | ||||||||||
| Operating expenses |
$ | 192,330 | $ | 190,477 | $ | 165,429 | $ | 159,850 | $ | 106,991 | ||||||||||
| Net income (loss) |
$ | 59,038 | $ | (26,823 | ) | $ | 49,654 | $ | 9,818 | $ | 35,665 | |||||||||
| Earnings (loss) per share: |
||||||||||||||||||||
| Basic |
$ | 0.73 | $ | (0.33 | ) | $ | 0.64 | $ | 0.13 | $ | 0.52 | |||||||||
| Diluted |
$ | 0.72 | $ | (0.33 | ) | $ | 0.62 | $ | 0.13 | $ | 0.50 | |||||||||
| Weighted-average shares outstanding |
||||||||||||||||||||
| Basic |
80,797 | 80,943 | 77,897 | 74,027 | 68,887 | |||||||||||||||
| Diluted |
81,541 | 80,943 | 79,859 | 76,154 | 71,816 | |||||||||||||||
| Selected Consolidated Balance Sheet Data: |
||||||||||||||||||||
| Working capital |
$ | 360,846 | $ | 353,953 | $ | 351,460 | $ | 267,671 | $ | 294,035 | ||||||||||
| Total assets |
$ | 879,886 | $ | 811,130 | $ | 760,608 | $ | 637,280 | $ | 509,990 | ||||||||||
| Long-term liabilities |
$ | 42,120 | $ | 34,010 | $ | 20,212 | $ | 6,630 | $ | 4,875 | ||||||||||
| Stockholders’ equity |
$ | 766,443 | $ | 676,351 | $ | 673,170 | $ | 569,405 | $ | 453,127 | ||||||||||
The selected financial data should be read in conjunction with the Consolidated Financial Statements and Notes thereto, and “Management’s Discussion and Analysis of Financial Condition and Results of Operations” in Item 7 of this Form 10-K.
29
Table of Contents
| ITEM 7. | MANAGEMENT’S DISCUSSION AND ANALYSIS OF FINANCIAL CONDITION AND RESULTS OF OPERATIONS |
This Annual Report on Form 10-K includes current beliefs, expectations and other forward looking statements, the realization of which may be adversely impacted by any of the factors discussed or referenced throughout this Form 10-K, including but not limited to, factors under the heading, “Item 1A. Risk Factors” in Part I above. This Form 10-K must be read in its entirety.
Overview
We a leading designer, manufacturer and marketer of high-performance analog and mixed-signal integrated circuits and high-reliability semiconductors. Our semiconductors manage and control or regulate power, protect against transient voltage spikes and transmit, receive and amplify signals.
Our products include individual components as well as integrated circuit solutions that enhance customer designs by improving performance, reliability and battery optimization, reducing size or protecting circuits. The principal end markets that we serve include security & defense, aerospace, enterprise & commercial and industrial & alternative energy.
Our integrated circuits (“IC”) products offer light, sound and power management for desktop and mobile computing platforms, LCD TVs and other power control applications. Power management generally refers to a class of standard linear integrated circuits (“SLICs”) that perform voltage regulation and reference in most electronic systems. The definition of power management has broadened in recent years to encompass other devices and modules, often application-specific standard products (“ASSPs”), which address particular aspects of power management, such as audio or display related ICs. This business is composed of both a core platform of traditional SLICs, such as low dropout regulators (“LDOs”) and pulse width modulators (“PWMs”), and differentiated ASSPs such as backlight inverters, audio amplification ICs and small computer standard interface terminators. Our IC products are used in notebook computers, data storage, wireless LAN, LCD backlighting, LCD TVs, LCD monitors, automobiles, telecommunications, test instruments, defense and aerospace equipment, high-quality sound reproduction and data transfer equipment.
Our individual component semiconductor products include silicon rectifiers, zener diodes, low leakage and high voltage diodes, temperature compensated zener diodes, transistors, subminiature high power transient suppressor diodes and pin diodes used in magnetic resonance imaging (“MRI”) machines. We also manufacture semiconductors for commercial applications, such as automatic surge protectors, transient suppressor diodes used for telephone applications and switching diodes used in computer systems. A partial list of these products includes: implantable cardioverter defibrillator and heart pacer switching, charging and transient shock protector diodes, low leakage diodes, transistors used in jet aircraft engines and high performance test equipment, high temperature diodes used in oil drilling sensing elements operating at 200 degrees centigrade, temperature compensated zener or rectifier diodes used in missile systems and power transistors.
Microsemi has implemented a growth strategy through continuous innovation complemented by strategic acquisitions with the intent of increasing our technology footprint in customers’ end designs. This allows us to offer an increased value proposition, gather a larger portion of the bill of materials, and engage with customers as a strategic partner as opposed to a socket provider. We believe this strategy strengthens Microsemi’s position in the industry as it protects and grows our share within those markets with the highest barriers to entry.
Recent industry leading innovations include:
| • | Precision target-seeking and secure guidance solutions resulting in substantial improvements in size, accuracy, and cost efficient weaponry; |
30
Table of Contents
| • | Microwave technology that gives defense and commercial radar systems the horsepower to operate over distances of 500 miles and more; |
| • | Leading edge wireless and wired network solutions for 80.2.11n Wi-Fi and PoE technology; |
| • | Millimeter-wave RF devices and systems that ensure fast and safe full-body security screening and higher resolution MRI systems; |
| • | LED driver products that enable better image quality and power savings in the latest big-screen LCD TVs and more efficient lighting solutions for solid state lighting; |
| • | Power ICs and devices enabling substantial panel and battery efficiency gains for solar electric systems and hybrid-powered vehicles; and |
| • | Breakthrough plastic packaging technology for transient voltage suppression devices. |
Our growth strategy is dependent on our ability to successfully develop new technologies and products, and complemented by our ability to implement our selective acquisitions strategy. New technologies or products that we may develop may not lead to an incremental increase in revenues, and there is a risk that these new technologies or products will decrease the demand for our existing products and result in an offsetting reduction in revenues. There can be no assurance that the benefits of any acquisitions will outweigh the attendant costs, and if they do not, our results of operations and stock price may be adversely affected.
Net sales increased $65.3 million or 14% between 2010 and 2009 to $518.3 million for 2010 from $453.0 million for 2009. Net sales decreased $61.1 million or 12% between 2009 and 2008 from $514.1 million for 2008. Between 2010 and 2009, increases in net sales were driven by growth in our Security & Defense and Enterprise & Commercial end markets. The growth in the Security & Defense end market was attributable to products we added from the acquisition of White Electronic Designs Corporation and the ramping of millimeter wave scan subsystem and military radar applications. Enterprise & Commercial net sales rebounded in 2010 with increases in both enterprise and consumer demand. Enterprise demand particularly supported sales of our PoE products and our market share in backlighting products continued to increase at Tier 1 suppliers and Tier 2 original equipment manufacturers (“OEMs”) and original design manufacturers (“ODMs”). Between 2009 and 2008, while net sales in our Security & Defense and Aerospace markets grew, our Enterprise & Commercial and Industrial & Alternative Energy end markets declined. These two end markets were particularly impacted by difficult economic conditions which reduced capital spending by companies and discretionary spending by consumers.
On November 11, 2010, we announced that we expect that our consolidated net sales for the first quarter of fiscal year 2011, including contributions from our recently announced acquisition of Actel Corporation, will increase between 19 to 23 percent, sequentially.
Recent negative worldwide economic conditions and market instability have made it increasingly difficult for us, our customers and our suppliers to accurately forecast future product demand trends. If signs of improvement in the global economy do not progress as expected and the global economic conditions slowdown continues or worsens, our forecasts of product demand trends could prove to be incorrect and could cause us to produce excess products that can depress product prices, increase our inventory carrying costs and result in obsolete inventory. Alternatively, this forecasting difficulty could cause a shortage of products, or materials used in our products, that could result in an inability to satisfy demand for our products and a loss of market share.
Operating income increased $66.0 million between 2010 and 2009 to $55.9 million from an operating loss of $10.1 million for 2009. Operating income decreased $73.6 million between 2009 and 2008 from $63.5 million in 2008. Operating income in 2010 benefited from increased net sales, which have surpassed 2008 levels and from restructuring and cost control measures. Operating income in 2009 was impacted by a decline in net sales and charges incurred in restructuring our operations.
31
Table of Contents
We expect that future improvements in operating income will occur upon the successful consolidation of our Scottsdale facility and continued focus on cost controls. The consolidation of Scottsdale is expected to result, subsequent to its completion, in annualized cost savings of approximately $24 million from the elimination of redundant resources and related expenses and employee reductions. However, we face major technical challenges in regard to transferring component manufacturing between locations. Before a transfer of manufacturing, we must be finished qualifying the new facility appropriately with the U.S. government or certain customers. While we plan generally to retain all of the revenues and income of those operations by transferring the manufacturing elsewhere within Microsemi’s subsidiaries, our plans may change at any time based on reassessment of the alternatives and consequences. While we hope to benefit overall from increased gross margins and increased capacity utilization rates at remaining operations, the remaining operations will need to bear the corporate administrative and overhead costs, which are charges to income that had been allocated to the discontinued business units. Moreover, delays in effecting our consolidations could result in greater than anticipated costs incurred to achieve the anticipated longer-range savings.
Marketing
Our products include individual components as well as integrated circuit solutions that enhance customer designs by improving performance, reliability and battery optimization, reducing size or protecting circuits. The principal end markets that we serve include:
| • | Defense & Security – Products in this end market include mixed-signal analog integrated circuits, JAN, JANTX, JANTXV and JANS high-reliability semiconductors and modules including diodes, zeners, diode arrays, transient voltage suppressors, bipolar transistors, metal-oxide-semiconductor field-effect-transistors (“MOSFETs”), insulated gate bipolar transistors (“IGBTs”), small signal analog integrated circuits, small signal transistors, relays, silicon-controlled rectifiers (“SCRs”) and radio frequency (“RF”) transceivers and subsystems. These products are utilized in a variety of applications including radar and communications, defense electronics, homeland security, threat detection, targeting and fire control and other power conversion and related systems in military platforms. |
| • | Aerospace – Products in this end market include offerings such as JAN, JANTX, JANTXV and JANS high-reliability semiconductors and modules and analog mixed-signal products including diodes, zeners, diode arrays, transient voltage suppressors, bipolar transistors, small signal analog integrated circuits, relays, small signal transistors, SCRs, MOSFETs and IGBTs. These products are utilized in a variety of applications including electronic applications for large aircraft and regional jets, commercial radar and communications, satellites, cockpit electronics, and other power conversion and related systems in space and aerospace platforms. |
| • | Industrial & Alternative Energy – Products in this end market include MOSFETs, IGBTs, power modules, ultra thin bypass diodes, bridge rectifiers, and high-voltage assemblies for use in industrial equipment, semiconductor capital equipment and solar power applications. Industrial applications also include zener diodes, high-voltage diodes, MOSFETs, IGBTs, transient voltage suppressors and thyristor surge protection devices that are designed into implantable defibrillators, pacemakers and neurostimulators and PIN diode switches, dual diode modules and switched-most power supplies (“SMPS”) for use in MRI systems. |
| • | Enterprise & Commercial – Products in this end market include broadband power amplifiers and monolithic microwave integrated circuits (“MMICs”) targeted at 802.11 a/b/g/n/e, multiple-in multiple-out (“MIMO”), light emitting diode (“LED”), cold cathode fluorescent lamp (“CCFL”) controllers, visible light sensors, PWM controllers, voltage regulators, EMI/RFI filters, transient voltage suppressors and class-D audio circuits. Applications for these products include wi-max and wireless local area network (“LAN”) devices, power-over-ethernet (“PoE”) devices, portable devices, set top box and telecom applications, notebook computers, monitors, storage devices and televisions. |
32
Table of Contents
During the year ended October 3, 2010, we have actively taken steps to integrate the management of our various operations, including management of our recent acquisitions. Production has been transferred among our facilities to share resources and technology, as well as to increase efficiency. We strive to make the best possible use of our engineering capabilities by sharing research and production methods across our divisions and, where appropriate, assigning engineers to the same projects, regardless of the facility that incurs the personnel expense. Our manufacturing management team has also been reorganized to increase efficiency.
Restructuring and Severance Charges
In 2005, we announced consolidation plans for our facility in Broomfield, Colorado (“Broomfield”). Broomfield ceased operations at the end of the third quarter of 2009. Substantially all accrued severance amounts related to Broomfield have been paid.
In 2009, we approved consolidation plans that will result in the closure of our manufacturing facility in Scottsdale, Arizona (“Scottsdale”), with production activities expected to cease in February 2011. Scottsdale currently has approximately 230 employees and occupies a 135,000 square foot leased facility. Shipments from the Scottsdale facility accounted for approximately 6% of net sales for the fiscal year ended October 3, 2010. At September 27, 2009, we had recorded severance accruals of $5,491,000 that are expected to be paid through 2012.
The following table reflects the restructuring activities for the Scottsdale facility and the accrued liabilities in the consolidated balance sheets at the dates below (amounts in thousands):
| Employee Severance |
Other
Associated Costs |
|||||||
| Balance at September 27, 2009 |
$ | 5,491 | $ | — | ||||
| Provisions |
— | 20 | ||||||
| Cash expenditures |
(1,367 | ) | (20 | ) | ||||
| Balance at October 3, 2010 |
$ | 4,124 | $ | — | ||||
At September 27, 2009, we had recorded severance accruals of $2,186,000 from reductions in force at our various facilities other than Broomfield and Scottsdale. We recorded additional severance accruals related to provisions totaling $2,087,000 during the fiscal year ended October 3, 2010. These restructuring activities covered approximately 300 individuals in manufacturing, engineering and sales. Substantially all accrued amounts are expected to be paid within twelve months. The following table reflects the restructuring activities and the accrued liabilities in the consolidated balance sheets at the dates below (amounts in thousands):
| Employee Severance |
||||
| Balance at September 27, 2009 |
$ | 2,186 | ||
| Provisions |
2,087 | |||
| Cash expenditures |
(2,188 | ) | ||
| Other non-cash settlement |
(443 | ) | ||
| Balance at October 3, 2010 |
$ | 1,642 | ||
Acquisitions and Divestiture
We have in the past acquired a number of businesses or companies, additional product lines and assets. We currently expect to continue to expand and diversify our operations with additional acquisitions.
In the first quarter of 2008, we acquired substantially all the assets of Microwave Device Technology Corporation and all the common stock of TSI Microelectronics Corporation for $8.8 million in cash, net of cash
33
Table of Contents
acquired. In the fourth quarter of 2008, we acquired substantially all the assets of SEMICOA for $28.7 million, including $26.7 million in cash consideration to SEMICOA and certain creditors, the assumption of $1.2 million in liabilities, $0.6 million related to a lease agreement with a party related to SEMICOA shareholders and $0.2 million in transaction fees and expenses. We funded these acquisitions with cash on hand.
During 2009, we entered into a stock purchase agreement in which we acquired all the shares of Electro Module, Inc. and its wholly-owned subsidiary, Babcock, Inc. for $21.9 million, net of cash acquired. Babcock, Inc. is a leading manufacturer of high-reliability power supplies, relays and flat panel displays and supplies. We subsequently renamed Babcock, Inc., “Microsemi Corp. – Power Management Group” (“PMG”). Also during 2009, we entered into an asset purchase agreement in which we acquired substantially all the assets of the Defense and Security business of Endwave Corporation for $29.0 million. This business designs, manufactures and markets radio frequency modules that enable the transmission, reception and processing of high frequency signals. Markets for these products include defense electronics, homeland security systems and other applications that require high frequency radio frequency circuitry and subsystems. We subsequently renamed the Defense and Security business of Endwave Corporation, “Microsemi Corp. – RF Integrated Solutions.” Our final acquisition of 2009, was of Nexsem, Inc. in which we entered into an asset purchase agreement to acquire substantially all of its assets for $5.2 million. Nexsem, Inc. is a designer and marketer of high-voltage DC to DC conversion devices for applications such as in LCD televisions, set top boxes, notebooks and netbooks. This acquisition was integrated into the existing operations of Microsemi Corp. – Analog Mixed Signal Group.
In the fourth quarter of 2009 and in connection with a settlement with the United States Department of Justice, we entered into an agreement that, in substance, resulted in the divestiture of the assets purchased from SEMICOA. Proceeds from this transaction totaled $6.6 million, of which $0.5 million was deposited with an escrow agent to be released one year subsequent to the transaction date. We sold accounts receivable, inventories, equipment, and intangible assets with net book values of $0.5 million, $2.0 million, $1.0 million and $1.4 million, respectively. In addition, we reduced goodwill by $1.4 million based on the proceeds received relative to Microsemi’s total market capitalization on the transaction date. Direct transaction expenses related to the sale amounted to $0.4 million.
During 2010, we acquired all of the outstanding common stock of White Electronic Designs Corporation (“White Electronic”), a defense electronics manufacturer and supplier that designs, develops and manufactures innovative electronic components and systems for inclusion in high technology products for the defense and aerospace markets, for a net $103.7 million in cash. We also acquired substantially all the assets of VT Silicon, a designer and manufacturer of multi-band radio frequency integrated circuit (“RFIC”) solutions for the mobile wireless broadband market and all the shares of Arxan Defense Systems, Inc., a leading provider of anti-tamper solutions, providing full-service support to defense clients in securing systems against tampering, piracy and reverse engineering.
In the aggregate, acquisitions in 2010 met the minimum thresholds for reporting historical results on a pro forma basis. Historical results on a pro forma basis and additional disclosures related to our acquisitions are included in the accompanying notes to consolidated financial statements
CRITICAL ACCOUNTING POLICIES AND ESTIMATES
The consolidated financial statements have been prepared in accordance with accounting principles generally accepted in the United States that require us to make estimates and assumptions that affect the reported amounts of assets and liabilities at the date of the consolidated financial statements and revenues and expenses during the periods reported. Actual results could differ from those estimates. Information with respect to our critical accounting policies which we believe could have the most significant effect on our reported results and require subjective or complex judgments is contained herein.
34
Table of Contents
Accounts receivable and allowance for doubtful accounts
Trade accounts receivable are recorded at the invoiced amount and do not bear interest. The accounts receivable amount shown in the balance sheet are trade accounts receivable balances at the respective dates, net of allowance for doubtful accounts. The allowance for doubtful accounts is our best estimate of the amount of probable credit losses in our existing accounts receivable. We determine the allowance based on our historical write-off experience. We review our allowance for doubtful accounts quarterly. Past due balances over 90 days and over a specified amount are reviewed individually for collectability. All other balances are reviewed on a pooled basis by type of receivable. Account balances are charged off against the allowance when we determine that it is probable the receivable will not be recovered. We do not have any off-balance-sheet credit exposure related to our customers.
Inventories
Inventories are stated at the lower of cost, as determined using the first-in, first-out (“FIFO”) method, or market. Costs include materials, labor and manufacturing overhead. We evaluate the carrying value of our inventories taking into account such factors as historical and anticipated future sales compared with quantities on hand and the price we expect to obtain for our products in their respective markets. We also evaluate the composition of our inventories to identify any slow-moving or obsolete products. Additionally, inventory reserves are established based upon such judgments for any inventories that are identified as having a net realizable value less than their cost, which is further reduced by related selling expenses. Historically, the net realizable value of our inventories has generally been within management’s estimates.
Long-Lived Assets
We assess the impairment of property, plant and equipment and amortizable intangible assets whenever events or changes in circumstances indicate that their carrying value may not be recoverable from the undiscounted estimated future cash flows expected to result from their use.
We are required to make judgments and assumptions in identifying those events or changes in circumstances that may trigger impairment. Some of the factors we consider include:
| • | Significant decrease in the market value of an asset. |
| • | Significant changes in the extent or manner for which the asset is being used or in its physical condition including manufacturing plant closures. |
| • | A significant change, delay or departure in our business strategy related to the asset. |
| • | Significant negative changes in the business climate, industry or economic conditions. |
| • | Current period operating losses or negative cash flow combined with a history of similar losses or a forecast that indicates continuing losses associated with the use of an asset. |
If events or circumstances indicate that the carrying amount of a long-lived asset or asset group may not be recoverable and the expected undiscounted future cash flows attributable to the asset group are less than the carrying value, an impairment loss equal to the excess of the carrying value of the assets within the asset group over their fair value is recorded. The appropriate asset group is determined based on the lowest level of largely independent cash inflows and outflows for the related assets. Depending on the nature of the primary assets in the asset group, fair value is estimated using one of several approaches including replacement cost, appraised values, market quotes or estimated expected future cash flows using a discount rate commensurate with the risk involved. During 2009, we recorded a held for sale impairment of $1.7 million related to the real estate and building for our closed manufacturing facility in Broomfield, Colorado and a held and used impairment of $4.5 million for the anticipated closure of our manufacturing facility in Scottsdale, Arizona to reflect our long-lived assets at their lower fair value.
35
Table of Contents
Goodwill and Intangible Assets
We account for goodwill on an impairment-only approach and amortize intangible assets with definite useful lives over their respective useful lives. At least annually, and whenever events or changes in circumstances indicate that it is more likely than not that an impairment loss has been incurred, we are required to reassess goodwill. Whenever we determine that there has been an impairment of goodwill or other intangible assets with indefinite lives, we will record an impairment charge against earnings. We operate as one reporting unit and an impairment charge would equal the excess of the carrying value of goodwill in our one reporting unit over its then fair value. The identification of intangible assets and determination of the fair value and useful lives are subjective in nature and often involve the use of significant estimates and assumptions. The judgments made in determining the estimated useful lives assigned to each class of assets can significantly affect net income. We perform our annual review for goodwill impairment in the fourth quarter of each fiscal year.
Revenue Recognition, Sales Returns and Allowances
We primarily recognize revenue from customers, including distributors, when title and risk of loss have passed to the customer provided that: 1) evidence of an arrangement exists; 2) delivery has occurred; 3) the fee is fixed or determinable; and 4) collectability is reasonably assured. For substantially all sales, revenue is recognized at the time the product is shipped.
We enter into contracts with certain distributors, and these contracts may permit limited stock rotation returns. We provide an estimated allowance for such returns, and corresponding reductions in revenue are concurrently recorded, based on several factors including past history and notification from customers of pending returns. Actual returns have been within management’s expectations. Estimated reductions to revenue are also recorded for customer incentive programs consisting of price protection and volume purchase rebates. Such programs are limited and actual reductions to revenue have been within management’s expectations.
We also derive a portion of our revenue from fixed-price contracts. Revenue for these contracts are recorded under a percentage of completion method, which is based on the ratio of total costs incurred to date to estimated total costs at completion. Gross profit expected to be realized on fixed-price contracts are based on periodic estimates of total revenues and costs for each contract. Losses on contracts are accrued when estimated total costs exceed total revenues. Occasionally, we will enter into contracts on a cost plus fee basis. We recognize revenue based on reimbursements for actual expenses plus the contractually agreed upon fee with the customer.
Restructuring Charges
We recognize a liability for restructuring costs when the liability is incurred. The restructuring accruals are based upon management estimates at the time they are recorded and can change depending upon changes in facts and circumstances subsequent to the date the original liability is recorded. The main components of our restructuring charges are workforce reductions and elimination of excess facilities. Workforce-related charges are accrued when it is determined that a liability exists, which is generally when individuals have been notified of their expected termination dates and expected severance payments or when formal severance plans exist, when the severance payments are probable and reasonably estimable. The elimination of excess facilities results in charges for lease termination fees, future contractual commitments to pay lease charges net of estimated sublease income, facility remediation costs and moving costs to remove property and equipment from the facilities. We recognize charges for elimination of excess facilities when we have vacated the premises or ceased use of the facility.
Stock-Based Compensation
Compensation expense for stock options was calculated based on the date of grant or conversion using the Black-Scholes option pricing model with exercise prices equal to the closing price of our common stock on the
36
Table of Contents
date of grant. Restricted stock awards were granted to employees with compensation expense determined based on the closing price of our common stock on the date of grant. Stock options and restricted stock awards are subject to forfeiture if length of service requirements are unmet. Expected life was estimated based on historical exercise data that was stratified between members of the Board of Directors, executive employees and all other recipients. Expected volatility was estimated based on historical volatility using equally weighted daily price observations over a period approximately equal to the expected life of each option. The risk free interest rate is based on the implied yield currently available on U.S. Treasury securities with an equivalent remaining term. No dividends are expected to be paid.
Accounting For Income Taxes
We account for income taxes under the asset and liability method, whereby deferred tax assets and liabilities are recognized for the future tax consequences attributable to differences between the financial statement carrying amounts of existing assets and liabilities and their respective tax bases. Deferred tax assets and liabilities are measured using enacted tax rates expected to apply in the years in which those temporary differences are expected to be recovered or settled. The effect on deferred tax assets and liabilities of a change in tax rates is recognized in income in the period that includes the enactment date. We evaluate the need to establish a valuation allowance for deferred tax assets based upon the amount of existing temporary differences, the period in which they are expected to be recovered and expected levels of taxable income. A valuation allowance to reduce deferred tax assets is established when it is more likely than not that some or all of the deferred tax assets will not be realized. We recognize uncertain tax positions when they meet a more-likely-than-not threshold. We recognize potential accrued interest and penalties related to unrecognized tax benefits within operations as income tax expense.
We file U.S. federal, state and foreign income tax returns in jurisdictions with varying statutes of limitation. The 2007 through 2009 tax years generally remain subject to examination by federal and most state tax authorities. In significant foreign jurisdictions, the 2007 through 2009 tax years generally remain subject to examination by tax authorities. Each quarter, we reassess our uncertain tax positions for any additions, deletions due to statute of limitation expiration, interest and penalties.
Segment Information
We use the management approach for segment disclosure, which designates the internal organization that is used by management for making operating decisions and assessing performance as the source of our reportable segments. We manage our business on the basis of one reportable segment, as a manufacturer of semiconductors in different geographic areas, including the United States, Europe and Asia.
RESULTS OF OPERATIONS FOR 2010 COMPARED TO 2009 AND 2008
Net sales increased $65.3 million or 14% between 2010 and 2009 to $518.3 million for 2010 from $453.0 million for 2009. Net sales decreased $61.1 million or 12% between 2009 and 2008 from $514.1 million for 2008. Estimated sales by end markets are based on our understanding of end market uses of our products. We believe an estimated breakout of net sales by end markets for the last three fiscal years is approximately as follows (amounts in thousands):
| 2010 | 2009 | 2008 | ||||||||||
| Security & Defense |
$ | 208,098 | $ | 170,653 | $ | 167,737 | ||||||
| Aerospace |
107,587 | 112,847 | 103,942 | |||||||||
| Enterprise & Commercial |
116,369 | 70,102 | 135,450 | |||||||||
| Industrial & Alternative Energy |
86,214 | 99,370 | 106,938 | |||||||||
| Total |
$ | 518,268 | $ | 452,972 | $ | 514,067 | ||||||
37
Table of Contents
Net sales in the Security & Defense end market increased $37.4 million to $208.1 million in 2010 from $170.7 million in 2009 and increased $3.0 million between 2009 and 2008 from $167.7 million. The increase between 2010 and 2009 was due primarily to the contributions from products we added from the acquisition of White Electronic, as well as contributions from the ramping of millimeter wave scan subsystems used in whole-body scanners and radar applications. While net sales increased between 2009 and 2008, this end market was impacted by our decision to reduce distributor sales of parts where we are the sole-source supplier and begin to supply our end customers directly. We expect growth in this end market as we believe the Department of Defense and Homeland Security budgets for electronic content, an area of Microsemi focus, will continue to expand. We also believe that international defense sales will increase, enabled in part by our anti-tamper process technology base, and that Microsemi’s dollar content in defense programs will increase as our products move up the value chain. As such, we believe that this end market will grow in the upcoming quarter.
Net sales in the Aerospace end market decreased $5.2 million to $107.6 million in 2010 from $112.8 million in 2009 and increased $8.9 million between 2009 and 2008 from $103.9 million. Net sales in 2010 have maintained relative stability when compared to 2009, though this end market has been negatively impacted by global economic conditions. The increase in net sales between 2009 and 2008 was driven primarily by demand and order rates for commercial aircraft at aircraft manufacturers and tier one suppliers, growing electronic content in current aircraft, refurbishment programs for older aircraft and demand for the high-reliability radar and avionics solutions we provide. Sales into satellite applications have remained stable as generally these applications are in a less economically sensitive market and are expected to grow as we develop power management ICs and DC/DC converter solutions. We noted a report from by the International Air Transport Association that commercial air traffic is above pre-recession levels, with passenger traffic up over 10% year over year, while cargo traffic is up almost 15%. In reviewing these encouraging statistics, we believe that sales in this end market will grow in the upcoming quarter.
Net sales in the Enterprise & Commercial end market increased $46.3 million to $116.4 million in 2010 from $70.1 million in 2009 and decreased $65.4 million between 2009 and 2008 from $135.5 million. Net sales in 2009 were negatively impacted as enterprise demand waned in a challenging economic environment and demand for parts used in automotive navigation systems and notebook storage products declined. As economic conditions have improved, net sales increased sequentially in recent quarters, driven by PoE and wireless LAN products. We believe that rapid market adoption of PoE technology, especially by enterprise customers, has increased our market share and our wireless LAN products are well accepted. We have also gained market share at Tier 1 suppliers and Tier 2 OEMs and ODMs in the television market, though sales into these larger customers have recently declined and were offset by gains with newer China-based manufacturers. While this is our most economically sensitive end market, based on current and expected backlog, we expect that net sales in this end market will remain stable in the upcoming quarter.
Net sales in the Industrial & Alternative Energy end market decreased $13.2 million to $86.2 million in 2010 from $99.4 million in 2009 and decreased $7.5 million between 2009 and 2008 from $106.9 million. The declines between 2010 and 2009 were due to products in medical applications that were impacted by lower procurement levels of ICD products that are coming in line with moderating growth in the ICD space. Sales into medical applications in 2009 also benefited from our support of a product launch schedule of a principal ICD customer. Declines in this end market were offset in 2010 by growth in products for semiconductor capital equipment, an area which experienced substantial declines in 2009 due to decreased capital spending during the recent economic downturn. We expect that increased shipments of industrial products, as well as contributions from our solar and plasma generation targeted products, will result in net sales increases in the upcoming quarter.
38
Table of Contents
An estimated breakout of net sales by originating geographic area for 2010, 2009 and 2008 is approximately as follows (amounts in thousands):
| 2010 | 2009 | 2008 | ||||||||||
| United States |
$ | 243,822 | $ | 215,611 | $ | 223,690 | ||||||
| Europe |
125,209 | 135,844 | 129,605 | |||||||||
| Asia |
149,237 | 101,517 | 160,772 | |||||||||
| Total |
$ | 518,268 | $ | 452,972 | $ | 514,067 | ||||||
Net sales originating from Asia increased $47.7 million between 2010 and 2009 and decreased $59.3 million between 2009 and 2008 primarily due to fluctuations in net sales of products, primarily in the Enterprise & Commercial end market, shipped from our facilities and subcontractors in Asia.
Gross profit increased $67.8 million between 2010 and 2009, to $248.2 million (47.9% of sales) for 2010 from $180.4 million (39.8% of sales) for 2009 and decreased $48.6 million between 2009 and 2008 from $229.0 million (44.5% of sales) for 2008. Gross profit percentage for 2010 was favorably impacted by cost optimization programs, which included the closure of our facility in Colorado, ramp down of our facility in Scottsdale, transfer of manufacturing to lower cost and more efficient facilities and reductions in personnel. In 2009, gross profit percentage was impacted 400 basis points from inventory write-downs related to product lines that do not meet gross margin targets, products that are being migrated to newer generations, products that service large capital spending end markets for which demand has declined and inventory at our Scottsdale facility that we announced we are closing. The remaining decline in gross profit percentage was due substantially to the effects of fixed costs allocated over lower sales volume.
Selling, general and administrative expenses increased $1.6 million between 2010 and 2009 to $114.7 million for 2010 from $113.1 million for 2009 and increased $7.8 million between 2009 and 2008 from $105.3 million in 2008. Selling, general and administrative expenses in 2010 were favorably impacted from restructuring and cost control measures but included $4.8 million in acquisition-related costs that are expenses under current GAAP but would have been allocated to the fair value of net assets acquired in accordance with GAAP in effect in prior years.
Research and development expense increased $14.0 million between 2010 and 2009 to $55.4 million in 2010 from $41.4 million in 2009 and decreased $3.6 million between 2009 and 2008 from $45.0 million in 2008. The increase between 2010 and 2009 was due to higher purchases of materials, masks and other supplies related to new product development for both high reliability and analog mixed signal products, as well as additional spending related to the White acquisition. The decrease between 2009 and 2008 was primarily due to the effects of restructuring and cost control measures. The principal focus of our research and development activities has been to improve processes and to develop new products that support the growth of our businesses. The spending on research and development was principally to develop new higher-margin application-specific products, including, among others, PoE, CCFL and LED drivers, class-D audio amplifiers, InGaP RF power amplifiers for wireless LAN applications, development and adoption of silicon carbide technology, VDMOS products for high frequency communications and S-band products for RF applications.
Amortization of intangible assets increased $5.0 million between 2010 and 2009 to $20.2 million in 2010 from $15.2 million in 2009 and increased $3.4 million between 2009 and 2008 from $11.8 million in 2008. The increases reflect additional amortization expense related to acquisitions consummated in 2010 and 2009.
Restructuring charges amounted to $2.1 million in 2010 compared to $13.3 million in 2009 and $2.9 million in 2008. Restructuring costs in 2009 consisted of $13.1 million in severance and $0.2 million in other related costs and included amounts from the anticipated closure of our Scottsdale manufacturing facility. We anticipate that we will incur additional future restructuring charges related to the Scottsdale closure for lease termination
39
Table of Contents
and facility remediation costs estimated to be approximately $8.0 million. These costs are expected to be incurred through 2011. Restructuring charges in 2010, 2009 and 2008 also included costs related to optimizing our personnel levels to meet production and costs goals.
Impairment charges in 2009 related to facility closures represented the held for sale impairment for the building and real estate related to our closed Broomfield, Colorado facility amounting to $1.7 million and the held and used impairment for our Scottsdale manufacturing facility amounting to $4.5 million to reflect our long-lived assets at their lower fair value.
Interest income decreased $0.8 million to $0.4 million in 2010 from $1.2 million in 2009 and decreased $2.2 million between 2009 and 2008 from $3.4 million. The decreases were due primarily to lower interest rates earned on our cash, cash equivalents and investments.
We recorded a benefit for income taxes of $4.0 million on pretax income of $55.0 million in 2010 compared to a provision for income taxes of $17.9 million on a pre-tax loss of $8.9 million in 2009. We had cumulative operating losses over the three years ended in 2009 for our U.S. operations. During the fourth quarter of 2009, we determined that it was more likely than not that the benefits of certain U.S. deferred tax assets would not be realized. Key positive and negative evidence we considered in making this determination included recent history of cumulative operating losses for our U.S. operations; future estimates of operating results for our U.S. operations; and our ability to carry back our U.S. operating losses, tax credits and reversing temporary differences to recover previously paid taxes. Based on this assessment, we determined that a valuation allowance was required for the deferred tax assets related to our U.S. operations that could not be carried back to recover previously paid taxes. Accordingly, we recorded a $28.4 million valuation allowance on a substantial portion of our U.S. deferred tax assets, which is included in the total tax provision of $17.9 million. Without this valuation allowance, we would have reported a tax benefit of approximately $10.5 million due to higher tax benefits in the jurisdictions with losses than tax expenses in the jurisdictions with income.
During 2010 we decreased the valuation allowance by $15.6 million primarily due to the utilization of certain foreign net operating losses and the recording of the deferred tax liability related to the acquisition of White Electronic Designs Corporation. As referenced in the subsequent events footnote to our consolidated financial statements, we acquired Actel Corporation in November 2010, and as a result, we anticipate that we may record a deferred tax liability related to the acquired intangible assets, and; therefore, release a portion or all of the remaining valuation allowance on our domestic deferred tax assets. In addition, due to historical and projected levels of foreign income, we anticipate that we may release a portion or all of the remaining valuation allowance on our foreign deferred tax assets.
CAPITAL RESOURCES AND LIQUIDITY
We had $200.0 million and $216.7 million in cash and cash equivalents at October 3, 2010 and September 27, 2009, respectively. During 2010, we financed our operations with cash generated from operations.
40
Table of Contents
Net cash provided by operating activities increased $0.4 million to $107.6 million in 2010 from $107.2 million in 2009. A summary of net cash provided by operating activities in 2010 and 2009 are as follows (amounts in thousands):
| 2010 | 2009 | |||||||
| Net income (loss) |
$ | 59,038 | $ | (26,823 | ) | |||
| Depreciation and amortization |
39,436 | 33,145 | ||||||
| Provision for doubtful accounts |
(324 | ) | 571 | |||||
| Loss on disposition of assets |
— | 953 | ||||||
| Impairment related to facility closures |
— | 6,185 | ||||||
| In process research and development |
— | 1,310 | ||||||
| Deferred income taxes |
21,561 | (18,610 | ) | |||||
| Valuation allowance on deferred income taxes |
(15,616 | ) | 39,389 | |||||
| Stock-based compensation |
25,277 | 26,933 | ||||||
| Net change in working capital accounts |
(20,217 | ) | 48,760 | |||||
| Net change in other long term assets and liabilities |
(1,544 | ) | (4,613 | ) | ||||
| Net cash provided by operating activities |
$ | 107,611 | $ | 107,200 | ||||
Accounts receivable increased $16.2 million to $78.7 million at October 3, 2010 from $62.5 million at September 27, 2009. The increase in accounts receivable was primarily due to higher sales in the fourth quarter of 2010 versus the fourth quarter of 2009, but also benefited from increased collection efforts.
Inventories increased $30.8 million to $126.2 million at October 3, 2010 from $95.4 million at September 27, 2009. A majority of the increase was due to inventory balances related to the acquisition of White Electronic Designs Corporation. The remaining increase was due to additional build in anticipation of the Scottsdale facility closure and increased inventory to support continued business growth.
Other current assets decreased $8.1 million to $14.7 million at October 3, 2010 from $22.8 million at September 27, 2009. The decrease was primarily due to the receipt of income tax refunds.
Current liabilities decreased $29.5 million to $71.3 million at October 3, 2010 from $100.8 million at September 27, 2009. The decrease was due to a reduction of $46.6 million, which is classified in financing activities, in amounts outstanding under our auction rate securities credit facility following issuer redemptions of auction rate bonds we held offset by higher accounts payable due primarily to increased inventory purchases.
Net cash used in investing activities was $82.0 million for 2010 and $47.2 million for 2009, respectively. Net cash used in investing activities in fiscal year 2010 primarily consisted of $112.3 million in net cash consideration for three acquisitions, purchases of property and equipment of $16.2 million, partially offset by $46.6 million from the disposition of investments in available for sale securities. The increase in purchases of property and equipment between 2010 and 2009 was due primarily to the start up of our Philippine operations. Net cash used in investing activities in 2009 primarily consisted of $55.4 million in net cash consideration for three acquisitions, and purchases of property and equipment of $12.6 million, partially offset by $15.5 million from the disposition of investments in available for sale securities and $5.8 million in net proceeds from the divesture of assets related to the SEMICOA business.
Net cash (used in) provided by financing activities was $(42.4) million and $49.5 million in 2010 and in 2009, respectively. Net cash used in financing activities in 2010 consisted of $5.2 million related to stock award activity partially offset by $46.6 million used to repay amounts outstanding under our auction rate securities credit facility. Net cash provided by financing activities in 2009 consisted primarily of $46.6 million in proceeds from our auction rate securities credit facility and $2.9 million related to stock award activity.
41
Table of Contents
As of October 3, 2010 all auction rate securities held on September 27, 2009 were redeemed at par plus accrued interest by the issuers of the securities. We held no auction rate securities at October 3, 2010. The proceeds from the redemption of the auction rate securities were used to repay amounts outstanding on the auction rate securities credit facility.
On October 5, 2009, we entered into a Credit Agreement with Bank of America, N.A. (the “Revolving Credit Facility”). The Revolving Credit Facility was scheduled to mature on October 5, 2012. The Revolving Credit Facility provided for a revolving line of credit of up to $50 million (the “Maximum Commitment”). The Revolving Credit Facility was available for direct borrowings and, subject to the Maximum Commitment, up to $20 million of the Revolving Credit Facility was available for the issuance of letters of credit. Borrowings under the Revolving Credit Facility could be used for working capital and other lawful corporate purposes. As of October 3, 2010, the Company had no direct borrowings and $400,000 in letters of credit outstanding under the Revolving Credit Facility. On October 28, 2010, the Revolving Credit Facility was terminated and all letters of credit outstanding thereunder were cancelled in anticipation of the Company entering into the new credit facility described below.
On November 2, 2010, we entered into a Credit Agreement with Morgan Stanley Senior Funding, Inc. (“MSSF”), Morgan Stanley & Co. Incorporated, East West Bank, Raymond James Bank, FSB and the lenders referred to therein (the “Credit Agreement”). Pursuant to the Credit Agreement, MSSF has provided $425,000,000 senior secured first lien credit facilities (the “Facilities”), consisting of a term loan facility in an aggregate principal amount of $375,000,000 and a revolving credit facility (the “Revolving Facility”) in an aggregate principal amount of $50,000,000. The Facilities financed the acquisition of Actel Corporation and fees and expenses related thereto. The Revolving Facility is also available for working capital requirements and other general corporate purposes. For further information regarding the Credit Agreement, including interest rates, fees, and financial covenants, please refer to the subsequent events footnote to our consolidated financial statements.
As further described in the subsequent events footnote to our consolidated financial statements, on October 2, 2010 we entered into an Agreement and Plan of Merger to acquire Actel Corporation for $20.88 per share. We completed the acquisition on November 2, 2010.
As of October 3, 2010, we had no material commitments for capital expenditures. Based upon information currently available to us, we believe that we can meet our cash requirements and capital commitments in the foreseeable future with cash balances, internally generated funds from ongoing operations and, if necessary, from the available line of credit.
Contractual Obligations
The following table summarizes our contractual payment obligations and commitments, excluding liability related to uncertain tax positions, at October 3, 2010 (amounts in thousands):
| Payments due by period | ||||||||||||||||||||||||
| Total | Less than 1 year |
1-3 years |
3-5 years |
More than 5 years |
Imputed Interest |
|||||||||||||||||||
| Capital leases |
$ | 3,244 | $ | 355 | $ | 600 | $ | 586 | $ | 5,265 | $ | (3,562 | ) | |||||||||||
| Operating leases |
22,033 | 6,531 | 8,316 | 5,973 | 1,213 | — | ||||||||||||||||||
| Purchase obligations |
38,394 | 32,092 | 6,302 | — | — | — | ||||||||||||||||||
| Other long-term liabilities |
5,697 | 89 | 178 | 38 | 5,392 | — | ||||||||||||||||||
| Total |
$ | 69,368 | $ | 39,067 | $ | 15,396 | $ | 6,597 | $ | 11,870 | $ | (3,562 | ) | |||||||||||
42
Table of Contents
As of October 3, 2010, we recorded $14.1 million in long-term liabilities for accrued taxes related to uncertain tax positions and are not able to reasonably estimate the timing of the long-term payments, or the amount by which our liability will increase or decrease over time; therefore, the liability related to uncertain tax positions has not been included in the contractual obligations table.
In acquiring Actel Corporation, we assumed their contractual payments obligations and commitments. The following table summarizes our current estimate of contractual payment obligations related to this acquisition as October 3, 2010 (amounts in thousands):
| Payments due by period | ||||||||||||||||||||
| Total | Less than 1 year |
1-3 years |
3-5 years |
More than 5 years |
||||||||||||||||
| Capital leases |
$ | 297 | $ | 25 | $ | 272 | $ | — | $ | — | ||||||||||
| Operating leases |
15,468 | 3,911 | 10,675 | 882 | — | |||||||||||||||
| Purchase obligations |
11,169 | 986 | 10,183 | — | — | |||||||||||||||
| Total |
$ | 26,934 | $ | 4,922 | $ | 21,130 | $ | 882 | $ | — | ||||||||||
RECENTLY ISSUED ACCOUNTING STANDARDS
In September 2006, the FASB issued authoritative guidance that defines fair value, establishes a framework for measuring fair value and expands disclosures regarding fair value measurements. Additional authoritative guidance issued in February 2008 deferred the effective date of this authoritative guidance for all nonfinancial assets and nonfinancial liabilities, except those that are recognized or disclosed at fair value in the financial statements on a recurring basis (at least annually) to fiscal years beginning after November 15, 2008 and interim periods within those years (our fiscal year 2010). The FASB issued in October 2008 and April 2009 additional authoritative guidance on determining fair value in an inactive market and when volume and level of activity have significantly decreased. The adoption did not result in a material impact on our consolidated financial position, results of operations or cash flows.
In December 2007, the FASB issued authoritative guidance that requires the acquiring entity in a business combination to recognize all assets acquired and liabilities assumed in the transaction, establishes the acquisition date fair value as the measurement objective for all assets acquired and liabilities assumed, establishes principles and requirements for how an acquirer recognizes and measures any non-controlling interest in the acquiree and the goodwill acquired, and requires the acquirer to disclose the nature and financial effect of the business combination. Among other changes, this statement also requires that “negative goodwill” be recognized in earnings as a gain attributable to the acquisition and that acquisition related costs be recognized separately from the acquisition and expensed as incurred. In December 2007, the FASB also issued authoritative guidance related to non-controlling interests in consolidated financial statements. In the event an entity holds less than a full ownership interest, this guidance provides for the recognition, measurement and subsequent accounting for the non-controlling interest included in the entity’s consolidated financial statements. This authoritative guidance is effective at the beginning of the first annual reporting period beginning on or after December 15, 2008 (our fiscal year 2010). The adoption did not result in a material impact on our consolidated financial position, results of operations or cash flows.
In June 2008, the FASB issued authoritative guidance that clarified that share-based payment awards that entitle their holders to receive non-forfeitable dividends before vesting should be considered participating securities. As participating securities, these instruments should be included in the calculation of basic earnings per share. This authoritative guidance became effective for our quarter ended December 27, 2009 and early adoption was not permitted. Once effective, all prior period earnings per share data are to be adjusted retrospectively. The adoption did not result in a material impact on our consolidated financial position, results of operations or cash flows.
43
Table of Contents
In November 2008, the Emerging Issues Task Force (“EITF”) of the FASB reached a final consensus on authoritative guidance that concluded that a defensive intangible asset should be considered a separate unit of accounting and not combined with an existing asset whose value it may enhance. In addition, a useful life should be assigned that reflects the acquiring entity’s consumption of the defensive asset’s expected benefits. This authoritative guidance will be applied prospectively for intangible assets acquired on or after the beginning of the first annual reporting period beginning on or after December 15, 2008 (our fiscal year 2010). Subsequent to the adoption of this guidance, we have not entered into a transaction that is impacted by this guidance and as such, the adoption has not had an impact on our consolidated financial position, results of operations or cash flows.
In August 2009, the FASB issued Accounting Standards Update (“ASU”) No. 2009-05, which provides clarification for measuring fair value when a quoted price in an active market for the identical liability is not available. ASU No. 2009-05 also clarifies that when estimating the fair value of a liability, a reporting entity is not required to include a separate input or adjustment to other inputs relating to the existence of a restriction that prevents the transfer of the liability. ASU No. 2009-05 was effective for us beginning after September 27, 2009. The adoption did not result in a material impact on our consolidated financial position, results of operations or cash flows.
In September 2009, the FASB issued ASU No. 2009-13, which eliminates the criterion for objective and reliable evidence of fair value for the undelivered products or services. Instead, revenue arrangements with multiple deliverables should be divided into separate units of accounting provided the deliverables meet certain criteria. ASU No. 2009-13 provides a hierarchy for estimating the selling price for each of the deliverables. ASU No. 2009-13 eliminates the use of the residual method of allocation and requires that arrangement consideration be allocated at the inception of the arrangement to all deliverables based on their relative selling price. ASU No. 2009-13 is effective prospectively for revenue arrangements entered into or materially modified in fiscal years beginning on or after June 15, 2010 (our fiscal year 2011). Early adoption is permitted. We are currently assessing the impact of this accounting standards update on our consolidated financial position and results of operations.
In January 2010, the FASB issued ASU No. 2010-06, which requires new fair value disclosures pertaining to significant transfers in and out of Level 1 and Level 2 fair value measurements and the reasons for the transfers and activity. For Level 3 fair value measurements, purchases, sales, issuances and settlements must be reported on a gross basis. Further, additional disclosures are required by class of assets or liabilities, as well as inputs used to measure fair value and valuation techniques. ASU No. 2010-06 is effective for interim and annual reporting periods beginning after December 15, 2009 (our second quarter of fiscal year 2010), except for the disclosures about purchases, sales, issuances and settlements on a gross basis, which is effective for fiscal years beginning after December 15, 2010 (our fiscal year 2012). The adoption of the effective portions of this ASU did not result in a material impact on our consolidated financial position, results of operations or cash flows. We do not anticipate that the adoption of the remaining portions of this ASU will result in a material impact on our consolidated financial position, results of operations or cash flows.
In February 2010, the FASB issued ASU No. 2010-09, which amends subsequent event disclosure requirements for SEC filers. An entity that is an SEC filer is not required to disclose the date through which subsequent events have been evaluated. This ASU was effective upon issuance and adoption did not result in a material impact on our consolidated financial position, results or operations or cash flows.
In April 2010, the FASB issued ASU No. 2010-17, which provides guidance on defining a milestone under FASB Codification Topic 605 and determining when it may be appropriate to apply the milestone method of revenue recognition for research or development transactions. Consideration that is contingent on achievement of a milestone in its entirety may be recognized as revenue in the period in which the milestone is achieved only if the milestone is judged to meet certain criteria to be considered substantive. Milestones should be considered substantive in their entirety and may not be bifurcated. An arrangement may contain both substantive and nonsubstantive milestones that should be evaluated individually. The amendments to this ASU are effective on a
44
Table of Contents
prospective basis for milestones achieved in fiscal years and interim periods within those years, beginning on or after June 15, 2010 (the fourth quarter of our fiscal year 2010). The adoption did not result in a material impact on our consolidated financial position, results of operations or cash flows, but may affect the timing of revenue recognition in future periods should future contracts include milestone provisions.
| ITEM 7A. QUANTITATIVE | AND QUALITATIVE DISCLOSURES ABOUT MARKET RISK |
Market risk is the potential loss arising from adverse changes in credit risk, foreign currency exchange rates, interest rates or the stock market. We are exposed to various market risks, which are related to credit risks, changes in certain foreign currency exchange rates and changes in certain interest rates.
We conduct a relatively small portion of our business in a number of foreign currencies, principally the European Union Euro, British Pound, Israeli Shekel and Chinese RMB. We may receive some revenues in foreign currencies and purchase some inventory and services in foreign currencies. Accordingly, we are exposed to transaction gains and losses that could result from changes in exchange rates of foreign currencies relative to the U.S. dollar. Transactions in foreign currencies have represented a relatively small portion of our business. As a result, foreign currency fluctuations have not had a material impact historically on our revenues or results of operations. However, there can be no assurance that future fluctuations in the value of foreign currencies will not have material adverse effects on our results of operations, cash flows or financial condition. We have not conducted a foreign currency hedging program thus far. We have and may continue to consider the adoption of a foreign currency hedging program.
We are potentially subject to concentrations of credit risk consisting principally of trade accounts receivable. Concentrations of credit risk exist because we rely on a significant portion of customers whose principal sales are to the U.S. Government. Approximately 40% of total net sales in 2010 were in the security & defense end market, with a very significant amount to customers whose principal sales are to the U.S. Government or to subcontractors whose material sales are to the U.S. Government. We, as a subcontractor, sell our products to higher-tier subcontractors or to prime contractors based upon purchase orders that usually do not contain all of the conditions included in the prime contract with the U.S. Government. However these sales are usually subject to termination and/or price renegotiations by virtue of their reference to a U.S. Government prime contract. Therefore, we believe that all of our product sales that ultimately are sold to the U.S. Government may be subject to termination, at the convenience of the U.S. Government or to price renegotiations under the Renegotiation Act. We have never experienced a material loss due to termination of a U.S Government contract. We have never had to renegotiate our price under any government contract.
On October 5, 2009, we entered into a Credit Agreement with Bank of America, N.A. (the “Revolving Credit Facility”). The Revolving Credit Facility was scheduled to mature on October 5, 2012. The Revolving Credit Facility provided for a revolving line of credit of up to $50 million (the “Maximum Commitment”). The Revolving Credit Facility was available for direct borrowings and, subject to the Maximum Commitment, up to $20 million of the Revolving Credit Facility was available for the issuance of letters of credit. Borrowings under the Revolving Credit Facility could be used for working capital and other lawful corporate purposes. As of October 3, 2010, the Company had no direct borrowings and $400,000 in letters of credit outstanding under the Revolving Credit Facility. On October 28, 2010, the Revolving Credit Facility was terminated and all letters of credit outstanding thereunder were cancelled in anticipation of the Company entering into the new credit facility described below.
Interest accruing on the amount of direct borrowings under the New Credit Facility was determined based upon our choice of either a Base Rate Loan or a Eurodollar Rate Loan. The interest rate per annum for Base Rate Loans was determined by reference to the higher of (1) the federal funds rate plus 0.50%, (2) the prime rate as announced by Bank of America, N.A. and (3) a LIBOR rate determined as provided in the New Credit Facility plus 1.50%, in each case plus an applicable margin. The applicable margin for Base Rate Loans was initially 1.50% per annum but could decrease to 1.25% or increase to 1.75% based upon a leverage ratio of Consolidated
45
Table of Contents
Funded Indebtedness to Consolidated EBITDA (as each such term was defined in the New Credit Facility). Eurodollar Rate Loans bore interest at the Eurodollar Rate defined in the New Credit Facility, plus an applicable margin. The applicable margin for Eurodollar Rate Loans was initially 2.50% per annum but could decrease to 2.25% or increase to 2.75% based upon a leverage ratio of Consolidated Funded Indebtedness to Consolidated EBITDA.
On November 2, 2010, we entered into a Credit Agreement with Morgan Stanley Senior Funding, Inc. (“MSSF”), Morgan Stanley & Co. Incorporated, East West Bank, Raymond James Bank, FSB and the lenders referred to therein (the “Credit Agreement”). Pursuant to the Credit Agreement, MSSF has provided $425,000,000 senior secured first lien credit facilities (the “Facilities”), consisting of a term loan facility in an aggregate principal amount of $375,000,000 and a revolving credit facility (the “Revolving Facility”) in an aggregate principal amount of $50,000,000. The Facilities financed the acquisition of Actel Corporation and fees and expenses related thereto. The Revolving Facility is also available for working capital requirements and other general corporate purposes. For further information regarding the Credit Agreement, including interest rates, fees, and financial covenants, please refer to the subsequent events footnote to our consolidated financial statements.
Interest under the Facilities are, at our option, Base Rate (as defined below) or LIBOR, plus a margin ranging from 2.00% to 3.00% for Base Rate-based loans that are either term loans or revolving loans and ranging from 3.00% to 4.00% for LIBOR-based loans that are either term loans or revolving loans, depending on our consolidated leverage ratio. The “Base Rate” for term loans is equal to 2.5% per annum and for revolving loans is a fluctuating interest rate per annum equal to the highest of (a) the prime rate, (b) 1/2 of 1% per annum above the federal funds effective rate and (c) one-month LIBOR plus 1%. Interest for Base Rate-based loans is calculated on the basis of a 365-day year and interest for LIBOR-based loans is calculated on the basis of a 360-day year. We have not entered into derivative financial instruments to hedge our exposure to interest rate risks. However, pursuant to the requirements of the Credit Agreement, we will hedge at least 30% of the initial aggregate principal amount of the term loan for a weighted average term of at least three years.
46
Table of Contents
| ITEM 8. | FINANCIAL STATEMENTS AND SUPPLEMENTARY DATA |
MICROSEMI CORPORATION AND SUBSIDIARIES
Index to Consolidated Financial Statements
| Page | ||||||
| 1. |
Consolidated Financial Statements | |||||
| Report of Independent Registered Public Accounting Firm | 48 | |||||
| Consolidated Balance Sheets at October 3, 2010 and September 27, 2009 | 49 | |||||
| 50 | ||||||
| 51 | ||||||
| 52 | ||||||
| Notes to Consolidated Financial Statements | 53 | |||||
| 2. |
Financial Statement Schedule | |||||
| Schedule for the fiscal years ended October 3, 2010, September 27, 2009 and September 28, 2008 | ||||||
| II – Valuation and Qualifying Accounts | 82 | |||||
| Financial statement schedules not listed above are either omitted because they are not applicable or the required information is shown in the consolidated financial statements or in the notes thereto. | ||||||
47
Table of Contents
Report of Independent Registered Public Accounting Firm
To the Board of Directors and
Stockholders of Microsemi Corporation:
In our opinion, the consolidated financial statements listed in the accompanying index appearing under Item 8(1) present fairly, in all material respects, the financial position of Microsemi Corporation and its subsidiaries at October 3, 2010 and September 27, 2009 and the results of their operations and their cash flows for each of the three years in the period ended October 3, 2010 in conformity with accounting principles generally accepted in the United States of America. In addition, in our opinion, the financial statement schedule listed in the accompanying index appearing under Item 8(2) presents fairly, in all material respects, the information set forth therein when read in conjunction with the related consolidated financial statements. Also in our opinion, the Company maintained, in all material respects, effective internal control over financial reporting as of October 3, 2010, based on criteria established in Internal Control—Integrated Framework issued by the Committee of Sponsoring Organizations of the Treadway Commission (COSO). The Company’s management is responsible for these financial statements and financial statement schedule, for maintaining effective internal control over financial reporting and for its assessment of the effectiveness of internal control over financial reporting, included in Management’s Report to Stockholders on Internal Control over Financial Reporting. Our responsibility is to express opinions on these financial statements, on the financial statement schedule, and on the Company’s internal control over financial reporting based on our integrated audits. We conducted our audits in accordance with the standards of the Public Company Accounting Oversight Board (United States). Those standards require that we plan and perform the audits to obtain reasonable assurance about whether the financial statements are free of material misstatement and whether effective internal control over financial reporting was maintained in all material respects. Our audits of the financial statements included examining, on a test basis, evidence supporting the amounts and disclosures in the financial statements, assessing the accounting principles used and significant estimates made by management, and evaluating the overall financial statement presentation. Our audit of internal control over financial reporting included obtaining an understanding of internal control over financial reporting, assessing the risk that a material weakness exists, and testing and evaluating the design and operating effectiveness of internal control based on the assessed risk. Our audits also included performing such other procedures as we considered necessary in the circumstances. We believe that our audits provide a reasonable basis for our opinions.
As discussed in Note 7 to the consolidated financial statements, for the year ended September 28, 2008, the Company changed the manner in which it accounts for uncertain tax positions.
A company’s internal control over financial reporting is a process designed to provide reasonable assurance regarding the reliability of financial reporting and the preparation of financial statements for external purposes in accordance with generally accepted accounting principles. A company’s internal control over financial reporting includes those policies and procedures that (i) pertain to the maintenance of records that, in reasonable detail, accurately and fairly reflect the transactions and dispositions of the assets of the company; (ii) provide reasonable assurance that transactions are recorded as necessary to permit preparation of financial statements in accordance with generally accepted accounting principles, and that receipts and expenditures of the company are being made only in accordance with authorizations of management and directors of the company; and (iii) provide reasonable assurance regarding prevention or timely detection of unauthorized acquisition, use, or disposition of the company’s assets that could have a material effect on the financial statements.
Because of its inherent limitations, internal control over financial reporting may not prevent or detect misstatements. Also, projections of any evaluation of effectiveness to future periods are subject to the risk that controls may become inadequate because of changes in conditions, or that the degree of compliance with the policies or procedures may deteriorate.
As described in Management’s report on internal control over financial reporting appearing under Item 9A, management has excluded White Electronic Designs Corporation (“White Electronic”) from its assessment of internal control over financial reporting as of October 3, 2010 because White Electronic was acquired in a purchase business combination during the year ended October 3, 2010. The total assets and total revenues excluded represented approximately 5% of consolidated total assets and revenues, as of and for the year ended October 3, 2010.
/s/ PricewaterhouseCoopers LLP
Irvine, California
November 23, 2010
48
Table of Contents
MICROSEMI CORPORATION AND SUBSIDIARIES
CONSOLIDATED BALANCE SHEETS
(amounts in thousands, except per share data)
| October 3, 2010 |
September 27, 2009 |
|||||||
| ASSETS | ||||||||
| Current assets: |
||||||||
| Cash and cash equivalents |
$ | 199,950 | $ | 216,742 | ||||
| Investment in auction rate securities |
— | 46,550 | ||||||
| Accounts receivable, net of allowance for doubtful accounts of $1,978 at October 3, 2010 and $2,302 at September 27, 2009 |
78,722 | 62,543 | ||||||
| Inventories |
126,151 | 95,372 | ||||||
| Deferred income taxes |
12,620 | 10,697 | ||||||
| Other current assets |
14,726 | 22,818 | ||||||
| Total current assets |
432,169 | 454,722 | ||||||
| Property and equipment, net |
75,913 | 68,698 | ||||||
| Goodwill |
270,832 | 222,731 | ||||||
| Intangible assets, net |
92,343 | 55,283 | ||||||
| Other assets |
8,629 | 9,696 | ||||||
| TOTAL ASSETS |
$ | 879,886 | $ | 811,130 | ||||
| LIABILITIES AND STOCKHOLDERS’ EQUITY | ||||||||
| Current liabilities: |
||||||||
| Accounts payable |
$ | 33,827 | $ | 15,211 | ||||
| Accrued liabilities |
37,052 | 38,577 | ||||||
| Auction rate securities credit facility |
— | 46,550 | ||||||
| Current maturity of long-term liabilities |
444 | 431 | ||||||
| Total current liabilities |
71,323 | 100,769 | ||||||
| Long-term liabilities |
42,120 | 34,010 | ||||||
| Commitments and contingencies (Note 10) |
||||||||
| Stockholders’ equity: |
||||||||
| Preferred stock, $1.00 par value; authorized 1,000 shares; none issued |
— | — | ||||||
| Common stock, $0.20 par value; 250,000 authorized, 83,240 issued and outstanding at October 3, 2010 and 81,413 issued and outstanding at September 27, 2009 |
16,648 | 16,282 | ||||||
| Capital in excess of par value of common stock |
543,628 | 512,862 | ||||||
| Retained earnings |
205,713 | 146,675 | ||||||
| Accumulated other comprehensive income |
454 | 532 | ||||||
| Total stockholders’ equity |
766,443 | 676,351 | ||||||
| TOTAL LIABILITIES AND STOCKHOLDERS’ EQUITY |
$ | 879,886 | $ | 811,130 | ||||
The accompanying notes are an integral part of these statements.
49
Table of Contents
MICROSEMI CORPORATION AND SUBSIDIARIES
CONSOLIDATED STATEMENTS OF OPERATIONS
For each of the three fiscal years in the period ended October 3, 2010
(amounts in thousands, except earnings per share)
| 2010 | 2009 | 2008 | ||||||||||
| Net sales |
$ | 518,268 | $ | 452,972 | $ | 514,067 | ||||||
| Cost of sales |
270,057 | 272,565 | 285,095 | |||||||||
| Gross profit |
248,211 | 180,407 | 228,972 | |||||||||
| Operating expenses: |
||||||||||||
| Selling, general and administrative |
114,663 | 113,080 | 105,297 | |||||||||
| Research and development costs |
55,395 | 41,435 | 45,008 | |||||||||
| In-process research & development |
— | 1,310 | 440 | |||||||||
| Amortization of intangible assets |
20,165 | 15,203 | 11,828 | |||||||||
| Restructuring and severance charges |
2,107 | 13,264 | 2,856 | |||||||||
| Impairment charges related to facility closures |
— | 6,185 | — | |||||||||
| Total operating expenses |
192,330 | 190,477 | 165,429 | |||||||||
| Operating income (loss) |
55,881 | (10,070 | ) | 63,543 | ||||||||
| Other income (expenses): |
||||||||||||
| Interest expense |
(756 | ) | (352 | ) | (214 | ) | ||||||
| Interest income |
432 | 1,221 | 3,414 | |||||||||
| Other, net |
(526 | ) | 327 | (272 | ) | |||||||
| Total other income (loss) |
(850 | ) | 1,196 | 2,928 | ||||||||
| Income (loss) before income taxes |
55,031 | (8,874 | ) | 66,471 | ||||||||
| Provision (benefit) for income taxes |
(4,007 | ) | 17,949 | 16,817 | ||||||||
| Net income (loss) |
$ | 59,038 | $ | (26,823 | ) | $ | 49,654 | |||||
| Earnings (loss) per share: |
||||||||||||
| Basic |
$ | 0.73 | $ | (0.33 | ) | $ | 0.64 | |||||
| Diluted |
$ | 0.72 | $ | (0.33 | ) | $ | 0.62 | |||||
| Weighted-average common shares outstanding: |
||||||||||||
| Basic |
80,797 | 80,943 | 77,897 | |||||||||
| Diluted |
81,541 | 80,943 | 79,859 | |||||||||
The accompanying notes are an integral part of these statements.
50
Table of Contents
MICROSEMI CORPORATION AND SUBSIDIARIES
CONSOLIDATED STATEMENTS OF STOCKHOLDERS’ EQUITY
For each of the three fiscal years in the period ended October 3, 2010
(amounts in thousands)
| Common Stock | Capital in Excess of Par value of Common Stock |
Retained Earnings |
Accumulated Other Comprehensive Income |
Total | ||||||||||||||||||||
| Shares | Amount | |||||||||||||||||||||||
| Balance at September 30, 2007 |
77,154 | $ | 15,431 | $ | 429,277 | $ | 124,257 | $ | 440 | $ | 569,405 | |||||||||||||
| Proceeds from exercise of stock options |
2,144 | 428 | 25,935 | — | — | 26,363 | ||||||||||||||||||
| Shares exchanged for options exercised |
(15 | ) | (3 | ) | (325 | ) | — | — | (328 | ) | ||||||||||||||
| Grants, conversions and cancellations of restricted share awards |
514 | 103 | (103 | ) | — | — | — | |||||||||||||||||
| Tax benefit – stock-based compensation |
— | — | 7,903 | — | — | 7,903 | ||||||||||||||||||
| Stock-based compensation |
— | — | 20,546 | — | — | 20,546 | ||||||||||||||||||
| Cumulative impact of the adoption of authoritative guidance on accounting for uncertain tax positions |
— | — | — | (413 | ) | — | (413 | ) | ||||||||||||||||
| Other Comprehensive income |
— | — | — | — | 40 | 40 | ||||||||||||||||||
| Net income |
— | — | — | 49,654 | — | 49,654 | ||||||||||||||||||
| Balance at September 28, 2008 |
79,797 | $ | 15,959 | $ | 483,233 | $ | 173,498 | $ | 480 | $ | 673,170 | |||||||||||||
| Proceeds from exercise of stock options |
277 | 55 | 2,805 | — | — | 2,860 | ||||||||||||||||||
| Grants and cancellations of restricted share awards |
1,339 | 268 | (268 | ) | — | — | — | |||||||||||||||||
| Tax benefit – stock-based compensation |
— | — | 41 | — | — | 41 | ||||||||||||||||||
| Stock-based compensation |
— | — | 27,051 | — | — | 27,051 | ||||||||||||||||||
| Other Comprehensive income |
— | — | — | — | 52 | 52 | ||||||||||||||||||
| Net loss |
— | — | — | (26,823 | ) | — | (26,823 | ) | ||||||||||||||||
| Balance at September 27, 2009 |
81,413 | $ | 16,282 | $ | 512,862 | $ | 146,675 | $ | 532 | $ | 676,351 | |||||||||||||
| Proceeds from exercise of stock options |
464 | 93 | 4,714 | — | — | 4,807 | ||||||||||||||||||
| Grants and cancellations of restricted share awards |
1,363 | 273 | (273 | ) | — | — | — | |||||||||||||||||
| Issuance of stock awards related to acquisition |
— | — | 161 | — | — | 161 | ||||||||||||||||||
| Tax benefit – stock-based compensation |
— | — | 730 | — | — | 730 | ||||||||||||||||||
| Stock-based compensation |
— | — | 25,434 | — | — | 25,434 | ||||||||||||||||||
| Other Comprehensive loss |
— | — | — | — | (78 | ) | (78 | ) | ||||||||||||||||
| Net income |
— | — | — | 59,038 | — | 59,038 | ||||||||||||||||||
| Balance at October 3, 2010 |
83,240 | $ | 16,648 | $ | 543,628 | $ | 205,713 | $ | 454 | $ | 766,443 | |||||||||||||
The accompanying notes are an integral part of these statements.
51
Table of Contents
MICROSEMI CORPORATION AND SUBSIDIARIES
CONSOLIDATED STATEMENTS OF CASH FLOWS
For each of the three fiscal years in the period ended October 3, 2010
(amounts in thousands)
| 2010 | 2009 | 2008 | ||||||||||
| Cash flows from operating activities: |
||||||||||||
| Net income (loss) |
$ | 59,038 | $ | (26,823 | ) | $ | 49,654 | |||||
| Adjustments to reconcile net income to net cash provided by operating activities: |
||||||||||||
| Depreciation and amortization |
39,436 | 33,145 | 28,840 | |||||||||
| Provision for doubtful accounts |
(324 | ) | 571 | 307 | ||||||||
| Loss on disposition of assets |
— | 953 | 143 | |||||||||
| Impairment charges related to facility closures |
— | 6,185 | — | |||||||||
| In process research and development |
— | 1,310 | 440 | |||||||||
| Deferred income taxes |
21,561 | (18,610 | ) | (8,446 | ) | |||||||
| Valuation allowance on deferred income taxes |
(15,616 | ) | 39,389 | 3,671 | ||||||||
| Charge for stock based compensation |
25,277 | 26,933 | 20,973 | |||||||||
| Change in assets and liabilities (net of acquisitions and disposition): |
||||||||||||
| Accounts receivable |
(8,068 | ) | 46,450 | (19,722 | ) | |||||||
| Inventories |
(20,295 | ) | 30,188 | (4,134 | ) | |||||||
| Other current assets |
(1,669 | ) | (6,229 | ) | (37 | ) | ||||||
| Other assets |
1,320 | (2,762 | ) | 208 | ||||||||
| Accounts payable |
15,153 | (17,048 | ) | 2,983 | ||||||||
| Accrued liabilities |
(6,658 | ) | (4,601 | ) | 101 | |||||||
| Other long-term liabilities |
(1,544 | ) | (1,851 | ) | 16,812 | |||||||
| Net cash provided by operating activities |
107,611 | 107,200 | 91,793 | |||||||||
| Cash flows from investing activities: |
||||||||||||
| Purchases of property and equipment |
(16,224 | ) | (12,625 | ) | (25,202 | ) | ||||||
| Purchases of available for sale securities |
— | — | (62,875 | ) | ||||||||
| Proceeds from sale of available for sale securities |
46,550 | 15,450 | 875 | |||||||||
| Proceeds from the divestiture of Semicoa |
— | 5,817 | — | |||||||||
| Proceeds from sales of property, plant and equipment |
— | 60 | — | |||||||||
| Acquisition of certain business assets and businesses, net of cash acquired |
(112,270 | ) | (55,355 | ) | (35,681 | ) | ||||||
| Changes in other assets |
(100 | ) | (501 | ) | (333 | ) | ||||||
| Net cash used in investing activities |
(82,044 | ) | (47,154 | ) | (123,216 | ) | ||||||
| Cash flows from financing activities: |
||||||||||||
| Proceeds from (repayments of) auction rate securities credit facility |
(46,550 | ) | 46,550 | — | ||||||||
| Borrowings from loan facility |
(981 | ) | — | 981 | ||||||||
| Excess tax benefit from stock awards |
365 | 89 | 3,916 | |||||||||
| Exercise proceeds from stock awards |
4,807 | 2,860 | 26,038 | |||||||||
| Net cash (used in) provided by financing activities |
(42,359 | ) | 49,499 | 30,935 | ||||||||
| Net increase (decrease) in cash and cash equivalents |
(16,792 | ) | 109,545 | (488 | ) | |||||||
| Cash and cash equivalents at beginning of year |
216,742 | 107,197 | 107,685 | |||||||||
| Cash and cash equivalents at end of year |
$ | 199,950 | $ | 216,742 | $ | 107,197 | ||||||
| Supplemental disclosure of cash flow information |
||||||||||||
| Cash paid during the year for: |
||||||||||||
| Interest |
$ | 790 | $ | 340 | $ | 214 | ||||||
| Income taxes |
$ | 8,398 | $ | 4,705 | $ | 3,536 | ||||||
The accompanying notes are an integral part of these statements.
52
Table of Contents
MICROSEMI CORPORATION AND SUBSIDIARIES
NOTES TO CONSOLIDATED FINANCIAL STATEMENTS
| 1. | DESCRIPTION OF BUSINESS AND SUMMARY OF SIGNIFICANT ACCOUNTING POLICIES |
Description of Business
We are a leading designer, manufacturer and marketer of high performance analog and mixed-signal integrated circuits and high-reliability semiconductors. Our semiconductors manage and control or regulate power, protect against transient voltage spikes and transmit, receive and amplify signals.
Our products include individual components as well as integrated circuit solutions that enhance customer designs by reducing size, protecting circuits, improving performance, reliability, and battery optimization. The principal markets we serve include Security & Defense, Aerospace, Enterprise & Commercial and Industrial & Alternative Energy.
During 2009, we entered into a stock purchase agreement in which we acquired all the shares of Electro Module, Inc. and its wholly-owned subsidiary, Babcock, Inc. Babcock, Inc. is a leading manufacturer of high-reliability power supplies, relays and flat panel displays and supplies. We subsequently renamed Babcock, Inc., “Microsemi Corp. – Power Management Group” (“PMG”). Also during 2009, we entered into an asset purchase agreement in which we acquired substantially all the assets of the Defense and Security business of Endwave Corporation. The Defense and Security business designs, manufactures and markets radio frequency modules that enable the transmission, reception and processing of high frequency signals. Markets for these products include defense electronics, homeland security systems and other applications that require high frequency radio frequency circuitry and subsystems. We subsequently renamed the Defense and Security business of Endwave Corporation, “Microsemi Corp. – RF Integrated Solutions.” Our final acquisition in 2009, was of Nexsem, Inc. in which we entered into an asset purchase agreement to acquire substantially all of its assets. Nexsem, Inc. is a designer and marketer of high-voltage DC to DC conversion devices for applications such as in LCD televisions, set top boxes, notebooks and netbooks. In the fourth quarter of 2009 and in connection with a settlement with the United States Department of Justice, we entered into an agreement which, in substance, resulted in the divestiture of the assets purchased from SEMICOA.
During 2010, we acquired all of the outstanding common stock of White Electronic Designs Corporation (“White Electronic”), a defense electronics manufacturer and supplier that designs, develops and manufactures innovative electronic components and systems for inclusion in high technology products for the defense and aerospace markets, for a net $103.7 million in cash. We also acquired substantially all the assets of VT Silicon, a designer and manufacturer of multi-band radio frequency integrated circuit (“RFIC”) solutions for the mobile wireless broadband market and all the shares of Arxan Defense Systems, Inc., a leading provider of anti-tamper solutions, providing full-service support to defense clients in securing systems against tampering, piracy and reverse engineering.
Fiscal Year
We report results of operations on the basis of fifty-two and fifty-three week periods. The fiscal year ended on October 3, 2010 (“2010”), consisted of fifty-three week and each of the fiscal years ended on September 27, 2009 (“2009”) and September 28, 2008 (“2008”) consisted of fifty-two weeks.
Principles of Consolidation and Presentation of Financial Information
The consolidated financial statements include the accounts of Microsemi and our subsidiaries. All intercompany transactions and balances have been eliminated.
53
Table of Contents
MICROSEMI CORPORATION AND SUBSIDIARIES
NOTES TO CONSOLIDATED FINANCIAL STATEMENTS—(Continued)
Use of Estimates
The preparation of financial statements in conformity with generally accepted accounting principles requires management to make estimates and assumptions that affect the reported amounts of assets and liabilities and disclosures of contingent assets and liabilities at the date of the financial statements and the reported amounts of revenues and expenses during the respective reporting periods. Actual results could differ from those estimates.
Cash and Cash Equivalents
We consider all short-term, highly liquid investments with maturities of three months or less at date of acquisition to be cash equivalents.
Accounts receivable and allowance for doubtful accounts
Trade accounts receivable are recorded at the invoiced amount and do not bear interest. The accounts receivable amount shown in the balance sheet are trade accounts receivable balances at the respective dates, net of allowance for doubtful accounts. The allowance for doubtful accounts is our best estimate of the amount of probable credit losses in our existing accounts receivable. We determine the allowance based on our historical write-off experience. We review our allowance for doubtful accounts quarterly. Past due balances over 90 days and over a specified amount are reviewed individually for collectability. All other balances are reviewed on a pooled basis by type of receivable. Account balances are charged off against the allowance when we determine that it is probable the receivable will not be recovered. We do not have any off-balance-sheet credit exposure related to our customers.
Inventories
Inventories are stated at the lower of cost, as determined using the first-in, first-out (“FIFO”) method, or market. Costs include materials, labor and manufacturing overhead. We evaluate the carrying value of our inventories taking into account such factors as historical and anticipated future sales compared with quantities on hand and the price we expect to obtain for our products in their respective markets. We also evaluate the composition of our inventories to identify any slow-moving or obsolete products. Additionally, inventory reserves are established based upon such judgments for any inventories that are identified as having a net realizable value less than their cost, which is further reduced by related selling expenses. Historically, the net realizable value of our inventories has generally been within management’s estimates.
Investment in Available for Sale Securities
As of October 3, 2010, all auction rate securities held on September 27, 2009 were redeemed at par plus accrued interest by the issuers of the securities. We held no auction rate securities at October 3, 2010. The proceeds from the redemption of the auction rate securities were used to repay amounts outstanding on the auction rate securities credit facility. The auction rate securities held on September 27, 2009 were subject to a settlement agreement and, per the terms of the settlement agreement: a) we held rights to sell our remaining investment in auction rate bonds back to the financial institution at par plus accrued interest beginning June 30, 2010 through July 2, 2012 and b) we were permitted to borrow at “no net cost” the full par value of our investment in auction rate bonds. We concluded that any other-than-temporary impairment in the fair value of our auction rate securities held on September 27, 2009 would be offset substantially by the fair value recognized for the rights provided to us in the settlement agreement. As such, the investment in auction rate securities and the fair value of the auction rate securities settlement agreement at September 27, 2009 were recorded at the par value of the auction rate securities.
54
Table of Contents
MICROSEMI CORPORATION AND SUBSIDIARIES
NOTES TO CONSOLIDATED FINANCIAL STATEMENTS—(Continued)
Fair Value of Financial Instruments
The carrying values of cash equivalents, accounts receivable, investment in marketable securities, accounts payable, accrued liabilities, notes payable and certain other current assets approximate their fair values because of their short maturity or ability for us to convert them into cash. The carrying value of our long-term liabilities at October 3, 2010 and September 27, 2009 approximates fair value based upon the current rate offered to us for obligations of the same remaining maturities.
Property and Equipment
Property and equipment are stated at lower of cost or realizable values. Depreciation is computed on the straight-line method over the estimated useful lives of the assets. Leasehold improvements are amortized over the shorter of the lease terms or the estimated useful lives. Maintenance and repairs are charged to expense as incurred and the costs of additions and betterments that increase the useful lives of the assets are capitalized.
Long-Lived Assets
We assess the impairment of property, plant and equipment and amortizable intangible assets whenever events or changes in circumstances indicate that their carrying value may not be recoverable from the undiscounted estimated future cash flows expected to result from their use.
We are required to make judgments and assumptions in identifying those events or changes in circumstances that may trigger impairment. Some of the factors we consider include:
| • | Significant decrease in the market value of an asset. |
| • | Significant changes in the extent or manner for which the asset is being used or in its physical condition including manufacturing plant closures. |
| • | A significant change, delay or departure in our business strategy related to the asset. |
| • | Significant negative changes in the business climate, industry or economic conditions. |
| • | Current period operating losses or negative cash flow combined with a history of similar losses or a forecast that indicates continuing losses associated with the use of an asset. |
If events or circumstances indicate that the carrying amount of a long-lived asset or asset group may not be recoverable and the expected undiscounted future cash flows attributable to the asset group are less than the carrying value, an impairment loss equal to the excess of the carrying value of the assets within the asset group over their fair value is recorded. The appropriate asset group is determined based on the lowest level of largely independent cash inflows and outflows for the related assets. Depending on the nature of the primary assets in the asset group, fair value is estimated using one of several approaches including replacement cost, appraised values, market quotes or estimated expected future cash flows using a discount rate commensurate with the risk involved. During 2009, we recorded a held for sale impairment of $1.7 million related to the real estate and building for our closed manufacturing facility in Broomfield, Colorado and a held and used impairment of $4.5 million for the anticipated closure of our manufacturing facility in Scottsdale, Arizona to reflect our long-lived assets at their lower fair value.
Goodwill and Intangible Assets
We account for goodwill on an impairment-only approach and amortize intangible assets with definite useful lives over their respective useful lives. At least annually, and whenever events or changes in circumstances
55
Table of Contents
MICROSEMI CORPORATION AND SUBSIDIARIES
NOTES TO CONSOLIDATED FINANCIAL STATEMENTS—(Continued)
indicate that it is more likely than not that an impairment loss has been incurred, we are required to reassess goodwill. Whenever we determine that there has been an impairment of goodwill or other intangible assets with indefinite lives, we will record an impairment charge against earnings. We operate as one reporting unit and an impairment charge would equal the excess of the carrying value of goodwill in our one reporting unit over its then fair value. The identification of intangible assets and determination of the fair value and useful lives are subjective in nature and often involve the use of significant estimates and assumptions. The judgments made in determining the estimated useful lives assigned to each class of assets can significantly affect net income. We perform our annual review for goodwill impairment in the fourth quarter of each fiscal year.
Revenue Recognition, Sales Returns and Allowances
We primarily recognize revenue from customers, including distributors, when title and risk of loss have passed to the customer provided that: 1) evidence of an arrangement exists; 2) delivery has occurred; 3) the fee is fixed or determinable; and 4) collectability is reasonably assured. For substantially all sales, revenue is recognized at the time the product is shipped.
We enter into contracts with certain distributors, and these contracts may permit limited stock rotation returns. We provide an estimated allowance for such returns, and corresponding reductions in revenue are concurrently recorded, based on several factors including past history and notification from customers of pending returns. Actual returns have been within management’s expectations. Estimated reductions to revenue are also recorded for customer incentive programs consisting of price protection and volume purchase rebates. Such programs are limited and actual reductions to revenue have been within management’s expectations.
We also derive a portion of our revenue from fixed-price contracts. Revenue for these contracts are recorded under a percentage of completion method, which is based on the ratio of total costs incurred to date to estimated total costs at completion. Gross profit expected to be realized on fixed-price contracts are based on periodic estimates of total revenues and costs for each contract. Losses on contracts are accrued when estimated total costs exceed total revenues. Occasionally, we will enter into contracts on a cost plus fee basis. We recognize revenue based on reimbursements for actual expenses plus the contractually agreed upon fee with the customer.
Research and Development
We expense the cost of research and development as incurred. Research and development expenses principally comprise payroll and related costs, supplies, and the cost of prototypes.
Restructuring Charges
We recognize a liability for restructuring costs when the liability is incurred. The restructuring accruals are based upon management estimates at the time they are recorded and can change depending upon changes in facts and circumstances subsequent to the date the original liability is recorded. The main components of our restructuring charges are workforce reductions and elimination of excess facilities. Workforce-related charges are accrued when it is determined that a liability exists, which is generally when individuals have been notified of their expected termination dates and expected severance payments or when formal severance plans exist, when the severance payments are probable and reasonably estimable. The elimination of excess facilities results in charges for lease termination fees, future contractual commitments to pay lease charges net of estimated sublease income, facility remediation costs and moving costs to remove property and equipment from the facilities. We recognize charges for elimination of excess facilities when we have vacated the premises or ceased use of the facility.
56
Table of Contents
MICROSEMI CORPORATION AND SUBSIDIARIES
NOTES TO CONSOLIDATED FINANCIAL STATEMENTS—(Continued)
Stock-Based Compensation
Compensation expense for stock options was calculated based on the date of grant or conversion using the Black-Scholes option pricing model with exercise prices equal to the closing price of our common stock on the date of grant. Restricted stock awards were granted to employees with compensation expense determined based on the closing price of our common stock on the date of grant. Stock options and restricted stock awards are subject to forfeiture if length of service requirements are unmet. Expected life was estimated based on historical exercise data that was stratified between members of the Board of Directors, executive employees and all other recipients. Expected volatility was estimated based on historical volatility using equally weighted daily price observations over a period approximately equal to the expected life of each option. The risk free interest rate is based on the implied yield currently available on U.S. Treasury securities with an equivalent remaining term. No dividends are expected to be paid.
Accounting For Income Taxes
We account for income taxes under the asset and liability method, whereby deferred tax assets and liabilities are recognized for the future tax consequences attributable to differences between the financial statement carrying amounts of existing assets and liabilities and their respective tax bases. Deferred tax assets and liabilities are measured using enacted tax rates expected to apply in the years in which those temporary differences are expected to be recovered or settled. The effect on deferred tax assets and liabilities of a change in tax rates is recognized in income in the period that includes the enactment date. We evaluate the need to establish a valuation allowance for deferred tax assets based upon the amount of existing temporary differences, the period in which they are expected to be recovered and expected levels of taxable income. A valuation allowance to reduce deferred tax assets is established when it is more likely than not that some or all of the deferred tax assets will not be realized. We recognize uncertain tax positions when they meet a more-likely-than-not threshold. We recognize potential accrued interest and penalties related to unrecognized tax benefits within operations as income tax expense.
We file U.S. federal, state and foreign income tax returns in jurisdictions with varying statutes of limitation. The 2007 through 2009 tax years generally remain subject to examination by federal and most state tax authorities. In significant foreign jurisdictions, the 2007 through 2009 tax years generally remain subject to examination by tax authorities. Each quarter, we reassess our uncertain tax positions for any additions, deletions due to statute of limitation expiration, interest and penalties.
Segment Information
We use the management approach for segment disclosure, which designates the internal organization that is used by management for making operating decisions and assessing performance as the source of our reportable segments. We manage our business on the basis of one reportable segment, as a manufacturer of semiconductors in different geographic areas, including the United States, Europe and Asia.
Foreign Currency
Our subsidiaries in Ireland and Israel use the United States Dollar (“USD”) as their functional currency. Our subsidiary in China uses the Chinese RMB as its functional currency. Our subsidiary in France uses the European Union Euro as its functional currency. For subsidiaries that use the US dollar as the function currency, assets and liabilities are remeasured to USD at the exchange rate in effect at the balance sheet date except for non-monetary assets and capital accounts which are measured at historical rates; revenues, expenses, gains and losses are remeasured at rates of exchange that approximate the rates in effect at the transaction date. For subsidiaries that
57
Table of Contents
MICROSEMI CORPORATION AND SUBSIDIARIES
NOTES TO CONSOLIDATED FINANCIAL STATEMENTS—(Continued)
use the local currency as the functional currency, all assets and liabilities are remeasured to USD using exchange rates in effect at the end of the period. Resulting translation gains or losses are recognized as a component of other comprehensive income. We also conduct a relatively small portion of our business in a number of foreign currencies, principally the European Union Euro, British Pound, Israeli Shekel and Chinese RMB.
Earnings Per Share
Basic earnings per share have been computed based upon the weighted-average number of common shares outstanding during the respective periods. Diluted earnings per share have been computed, when the result is dilutive, using the treasury stock method for stock awards outstanding during the respective periods. Earnings per share for the 2010, 2009 and 2008 were calculated as follows (amounts in thousands, except per share data):
| Fiscal Years | ||||||||||||
| 2010 | 2009 | 2008 | ||||||||||
| BASIC |
||||||||||||
| Net income (loss) |
$ | 59,038 | $ | (26,823 | ) | $ | 49,654 | |||||
| Weighted-average common shares outstanding |
80,797 | 80,943 | 77,897 | |||||||||
| Basic earnings (loss) per share |
$ | 0.73 | $ | (0.33 | ) | $ | 0.64 | |||||
| DILUTED |
||||||||||||
| Net income (loss) |
$ | 59,038 | $ | (26,823 | ) | $ | 49,654 | |||||
| Weighted-average common shares outstanding for basic |
80,797 | 80,943 | 77,897 | |||||||||
| Dilutive effect of stock awards |
744 | — | 1,962 | |||||||||
| Weighted-average common shares outstanding on a diluted basis |
81,541 | 80,943 | 79,859 | |||||||||
| Diluted earnings (loss) per share |
$ | 0.72 | $ | (0.33 | ) | $ | 0.62 | |||||
For the fiscal year ended October 3, 2010, approximately 7,388,000 awards were excluded in the computation of diluted EPS as these stock awards would have been anti-dilutive. All stock awards in 2009 were excluded from the computation of diluted earnings per shares as we incurred a net loss. Approximately 6,639,000 stock awards in 2008 were excluded from the computation of diluted earnings per share because their inclusion would have been antidilutive.
In June 2008, the Financial Accounting Standards Board (“FASB”) issued authoritative guidance that clarified that share-based payment awards that entitle their holders to receive non-forfeitable dividends before vesting should be considered participating securities. As participating securities, these instruments should be included in the calculation of basic earnings per share. This authoritative guidance became effective at the beginning of 2010, and early adoption was not permitted. Once effective, all prior period earnings per share data are to be adjusted retrospectively. Our weighted-average common states outstanding and the resulting impact on earnings (loss) per share have been reflected in these consolidated financial statements.
Concentration of Credit Risk and Foreign Sales
We are potentially subject to concentrations of credit risk consisting principally of trade accounts receivable. Concentrations of credit risk exist because we rely on a significant portion of customers whose principal sales are to the U.S. Government. Approximately 40% of total net sales in 2010 were in the security & defense end market, with a very significant amount to customers whose principal sales are to the
58
Table of Contents
MICROSEMI CORPORATION AND SUBSIDIARIES
NOTES TO CONSOLIDATED FINANCIAL STATEMENTS—(Continued)
U.S. Government or to subcontractors whose material sales are to the U.S. Government. We, as a subcontractor, sell our products to higher-tier subcontractors or to prime contractors based upon purchase orders that usually do not contain all of the conditions included in the prime contract with the U.S. Government. However, these sales are usually subject to termination and/or price renegotiations by virtue of their reference to a U.S. Government prime contract. Therefore, we believe that all of our product sales that ultimately are sold to the U.S. Government may be subject to termination, at the convenience of the U.S. Government or to price renegotiations under the Renegotiation Act. We have never experienced a material loss due to termination of a U.S Government contract. We have never had to renegotiate our price under any government contract.
In addition, net sales from international markets represent a significant portion of total net sales. Our net sales to international customers represented approximately 40% for 2010, 30% for 2009 and 40% for 2008. These sales were principally to customers in Europe and Asia. We maintain reserves for potential credit losses and such losses have been within management’s expectations.
RECENTLY ISSUED ACCOUNTING STANDARDS
In September 2006, the FASB issued authoritative guidance that defines fair value, establishes a framework for measuring fair value and expands disclosures regarding fair value measurements. Additional authoritative guidance issued in February 2008 deferred the effective date of this authoritative guidance for all nonfinancial assets and nonfinancial liabilities, except those that are recognized or disclosed at fair value in the financial statements on a recurring basis (at least annually) to fiscal years beginning after November 15, 2008 and interim periods within those years (our fiscal year 2010). The FASB issued in October 2008 and April 2009 additional authoritative guidance on determining fair value in an inactive market and when volume and level of activity have significantly decreased. The adoption did not result in a material impact on our consolidated financial position, results of operations or cash flows.
In December 2007, the FASB issued authoritative guidance that requires the acquiring entity in a business combination to recognize all assets acquired and liabilities assumed in the transaction, establishes the acquisition date fair value as the measurement objective for all assets acquired and liabilities assumed, establishes principles and requirements for how an acquirer recognizes and measures any non-controlling interest in the acquiree and the goodwill acquired, and requires the acquirer to disclose the nature and financial effect of the business combination. Among other changes, this statement also requires that “negative goodwill” be recognized in earnings as a gain attributable to the acquisition and that acquisition related costs be recognized separately from the acquisition and expensed as incurred. In December 2007, the FASB also issued authoritative guidance related to non-controlling interests in consolidated financial statements. In the event an entity holds less than a full ownership interest, this guidance provides for the recognition, measurement and subsequent accounting for the non-controlling interest included in the entity’s consolidated financial statements. This authoritative guidance is effective at the beginning of the first annual reporting period beginning on or after December 15, 2008 (our fiscal year 2010). The adoption did not result in a material impact on our consolidated financial position, results of operations or cash flows.
In June 2008, the FASB issued authoritative guidance that clarified that share-based payment awards that entitle their holders to receive non-forfeitable dividends before vesting should be considered participating securities. As participating securities, these instruments should be included in the calculation of basic earnings per share. This authoritative guidance became effective for our quarter ended December 27, 2009 and early adoption was not permitted. Once effective, all prior period earnings per share data are to be adjusted retrospectively. The adoption did not result in a material impact on our consolidated financial position, results of operations or cash flows.
59
Table of Contents
MICROSEMI CORPORATION AND SUBSIDIARIES
NOTES TO CONSOLIDATED FINANCIAL STATEMENTS—(Continued)
In November 2008, the Emerging Issues Task Force (“EITF”) of the FASB reached a final consensus on authoritative guidance that concluded that a defensive intangible asset should be considered a separate unit of accounting and not combined with an existing asset whose value it may enhance. In addition, a useful life should be assigned that reflects the acquiring entity’s consumption of the defensive asset’s expected benefits. This authoritative guidance will be applied prospectively for intangible assets acquired on or after the beginning of the first annual reporting period beginning on or after December 15, 2008 (our fiscal year 2010). Subsequent to the adoption of this guidance, we have not entered into a transaction that is impacted by this guidance and as such, the adoption has not had an impact on our consolidated financial position, results of operations or cash flows.
In August 2009, the FASB issued Accounting Standards Update (“ASU”) No. 2009-05, which provides clarification for measuring fair value when a quoted price in an active market for the identical liability is not available. ASU No. 2009-05 also clarifies that when estimating the fair value of a liability, a reporting entity is not required to include a separate input or adjustment to other inputs relating to the existence of a restriction that prevents the transfer of the liability. ASU No. 2009-05 was effective for us beginning after September 27, 2009. The adoption did not result in a material impact on our consolidated financial position, results of operations or cash flows.
In September 2009, the FASB issued ASU No. 2009-13, which eliminates the criterion for objective and reliable evidence of fair value for the undelivered products or services. Instead, revenue arrangements with multiple deliverables should be divided into separate units of accounting provided the deliverables meet certain criteria. ASU No. 2009-13 provides a hierarchy for estimating the selling price for each of the deliverables. ASU No. 2009-13 eliminates the use of the residual method of allocation and requires that arrangement consideration be allocated at the inception of the arrangement to all deliverables based on their relative selling price. ASU No. 2009-13 is effective prospectively for revenue arrangements entered into or materially modified in fiscal years beginning on or after June 15, 2010 (our fiscal year 2011). Early adoption is permitted. We are currently assessing the impact of this accounting standards update on our consolidated financial position and results of operations.
In January 2010, the FASB issued ASU No. 2010-06, which requires new fair value disclosures pertaining to significant transfers in and out of Level 1 and Level 2 fair value measurements and the reasons for the transfers and activity. For Level 3 fair value measurements, purchases, sales, issuances and settlements must be reported on a gross basis. Further, additional disclosures are required by class of assets or liabilities, as well as inputs used to measure fair value and valuation techniques. ASU No. 2010-06 is effective for interim and annual reporting periods beginning after December 15, 2009 (our second quarter of fiscal year 2010), except for the disclosures about purchases, sales, issuances and settlements on a gross basis, which is effective for fiscal years beginning after December 15, 2010 (our fiscal year 2012). The adoption of the effective portions of this ASU did not result in a material impact on our consolidated financial position, results of operations or cash flows. We do not anticipate that the adoption of the remaining portions of this ASU will result in a material impact on our consolidated financial position, results of operations or cash flows.
In February 2010, the FASB issued ASU No. 2010-09, which amends subsequent event disclosure requirements for SEC filers. An entity that is an SEC filer is not required to disclose the date through which subsequent events have been evaluated. This ASU was effective upon issuance and adoption did not result in a material impact on our consolidated financial position, results or operations or cash flows.
In April 2010, the FASB issued ASU No. 2010-17, which provides guidance on defining a milestone under FASB Codification Topic 605 and determining when it may be appropriate to apply the milestone method of revenue recognition for research or development transactions. Consideration that is contingent on achievement of
60
Table of Contents
MICROSEMI CORPORATION AND SUBSIDIARIES
NOTES TO CONSOLIDATED FINANCIAL STATEMENTS—(Continued)
a milestone in its entirety may be recognized as revenue in the period in which the milestone is achieved only if the milestone is judged to meet certain criteria to be considered substantive. Milestones should be considered substantive in their entirety and may not be bifurcated. An arrangement may contain both substantive and nonsubstantive milestones that should be evaluated individually. The amendments to this ASU are effective on a prospective basis for milestones achieved in fiscal years and interim periods within those years, beginning on or after June 15, 2010 (the fourth quarter of our fiscal year 2010). The adoption did not result in a material impact on our consolidated financial position, results of operations or cash flows, but may affect the timing of revenue recognition in future periods should future contracts include milestone provisions.
| 2. | INVENTORIES |
Inventories are summarized as follows (amounts in thousands):
| October 3, 2010 |
September 27, 2009 |
|||||||
| Raw materials |
$ | 38,135 | $ | 24,148 | ||||
| Work in progress |
55,375 | 43,209 | ||||||
| Finished goods |
32,641 | 28,015 | ||||||
| $ | 126,151 | $ | 95,372 | |||||
| 3. | INVESTMENT IN AVAILABLE FOR SALE AUCTION RATE SECURITIES AND SETTLEMENT AGREEMENT |
As of October 3, 2010, all auction rate securities held on September 27, 2009 were redeemed at par plus accrued interest by the issuers of the securities. We held no auction rate securities at October 3, 2010. The proceeds from the redemption of the auction rate securities were used to repay all amounts outstanding on the auction rate securities credit facility. The auction rate securities held on September 27, 2009 were subject to a settlement agreement and, per the terms of the settlement agreement: a) we held rights to sell our remaining investment in auction rate bonds back to the financial institution at par plus accrued interest beginning June 30, 2010 through July 2, 2012 and b) we were permitted to borrow at “no net cost” the full par value of our investment in auction rate bonds. We concluded that any other-than-temporary impairment in the fair value of our auction rate securities held on September 27, 2009 would be offset substantially by the fair value recognized for the rights provided to us in the settlement agreement. As such, the investment in auction rate securities and the fair value of the auction rate securities settlement agreement at September 27, 2009 were recorded at the par value of the auction rate securities.
61
Table of Contents
MICROSEMI CORPORATION AND SUBSIDIARIES
NOTES TO CONSOLIDATED FINANCIAL STATEMENTS—(Continued)
| 4. | PROPERTY AND EQUIPMENT |
Property and equipment consisted of the following components (amounts in thousands):
| Asset Life | October 3, 2010 |
September 27, 2009 |
||||||||||
| Buildings |
20-40 years | $ | 37,327 | $ | 35,574 | |||||||
| Property and equipment |
3-10 years | 147,041 | 137,867 | |||||||||
| Furniture and fixtures |
5-10 years | 5,904 | 4,382 | |||||||||
| Leasehold improvements |
|
Shorter of asset life or life of lease |
|
21,470 | 17,221 | |||||||
| 211,742 | 195,044 | |||||||||||
| Accumulated depreciation |
(142,897 | ) | (130,119 | ) | ||||||||
| Land |
1,484 | 1,118 | ||||||||||
| Construction in progress |
5,584 | 2,655 | ||||||||||
| $ | 75,913 | $ | 68,698 | |||||||||
Depreciation expense was $19,271,000, $17,942,000 and $17,012,000 in 2010, 2009 and 2008, respectively.
| 5. | GOODWILL AND INTANGIBLE ASSETS, NET |
Goodwill and intangible assets, net consisted of the following components (amounts in thousands):
| October 3, 2010 | September 27, 2009 | Life (in years) |
||||||||||||||||||
| Gross Carrying Value |
Accumulated Amortization |
Gross Carrying Value |
Accumulated Amortization |
|||||||||||||||||
| Amortizable intangible assets |
||||||||||||||||||||
| Completed technology |
$ | 99,747 | $ | (46,637 | ) | $ | 73,914 | $ | (35,505 | ) | 2 to 15 | |||||||||
| Customer relationships |
40,220 | (6,436 | ) | 17,015 | (2,574 | ) | 4 to 15 | |||||||||||||
| Backlog |
9,880 | (6,029 | ) | 6,400 | (4,972 | ) | 1 to 2 | |||||||||||||
| Other |
3,183 | (1,585 | ) | 2,060 | (1,055 | ) | 5 | |||||||||||||
| $ | 153,030 | $ | (60,687 | ) | $ | 99,389 | $ | (44,106 | ) | |||||||||||
| Non-amortizing intangible assets |
||||||||||||||||||||
| Goodwill |
$ | 270,832 | $ | 222,731 | ||||||||||||||||
During 2010, goodwill increased related to the acquisitions of White Electronic, Arxan Defense Systems, Inc. and VT Silicon, in the amounts of $45,562,000, $1,598,000 and $941,000, respectively.
During 2009, goodwill increased related to the Microsemi Corp. – Power Management Group, Microsemi Corp. – RF Integrated Solutions and Nexsem, Inc. acquisitions in the amounts of $9,777,000, $12,304,000 and $786,000, respectively. In addition, we reduced goodwill by $1,413,000 for the pro-rata amount of goodwill allocable to the sale of SEMICOA assets. The pro-rata portion of goodwill adjusted for the disposition was based on the ratio of the relative fair value of the disposed business compared to the total fair value of our reporting unit on the transaction date.
62
Table of Contents
MICROSEMI CORPORATION AND SUBSIDIARIES
NOTES TO CONSOLIDATED FINANCIAL STATEMENTS—(Continued)
Amortization expense for intangible assets in 2010, 2009 and 2008 was $20,165,000, $15,203,000 and $11,828,000, respectively. Estimated amortization in each of the five succeeding years is as follows (amounts in thousands):
| Fiscal Year | ||||||||||||||||||||
| 2011 | 2012 | 2013 | 2014 | Thereafter | ||||||||||||||||
| Amortization expense |
$ | 21,259 | $ | 16,246 | $ | 15,409 | $ | 12,875 | $ | 26,554 | ||||||||||
| 6. | ACCRUED LIABILITIES |
Accrued liabilities consisted of the following components (amounts in thousands):
| October 3, 2010 |
September 27, 2009 |
|||||||
| Payroll, bonus, vacation, sick and other employee benefits |
$ | 18,021 | $ | 14,275 | ||||
| Restructuring |
5,832 | 8,256 | ||||||
| Other |
13,199 | 16,046 | ||||||
| $ | 37,052 | $ | 38,577 | |||||
| 7. | INCOME TAXES |
Pretax income (loss) was generated from the following sources (amounts in thousands):
| For each of the three fiscal years in the period ended on or about October 3, 2010 |
||||||||||||
| 2010 | 2009 | 2008 | ||||||||||
| Domestic |
$ | (19,878 | ) | $ | (61,840 | ) | $ | 14,370 | ||||
| Foreign |
74,909 | 52,966 | 52,101 | |||||||||
| Total |
$ | 55,031 | $ | (8,874 | ) | $ | 66,471 | |||||
The provision for income taxes consisted of the following components (amounts in thousands):
| For each of the three fiscal years in the period ended on or about October 3, 2010 |
||||||||||||
| 2010 | 2009 | 2008 | ||||||||||
| Current: |
||||||||||||
| Federal |
$ | (17,830 | ) | $ | (10,791 | ) | $ | 12,292 | ||||
| State |
533 | 1,227 | 3,260 | |||||||||
| Foreign |
7,345 | 6,733 | 6,040 | |||||||||
| Deferred |
||||||||||||
| Federal |
5,352 | 13,708 | (4,431 | ) | ||||||||
| State |
373 | 7,293 | (700 | ) | ||||||||
| Foreign |
220 | (221 | ) | 356 | ||||||||
| $ | (4,007 | ) | $ | 17,949 | $ | 16,817 | ||||||
63
Table of Contents
MICROSEMI CORPORATION AND SUBSIDIARIES
NOTES TO CONSOLIDATED FINANCIAL STATEMENTS—(Continued)
We recorded a benefit for income taxes of $4,007,000 on pretax income of $55,031,000 in 2010 compared to a provision for income taxes of $17,949,000 on a pre-tax loss of $8,874,000 in 2009. We had cumulative operating losses over the three years ended in 2009 for our U.S. operations. During the fourth quarter of 2009, we determined that it was more likely than not that the benefits of certain U.S. deferred tax assets would not be realized. Key positive and negative evidence we considered in making this determination included recent history of cumulative operating losses for our U.S. operations; future estimates of operating results for our U.S. operations; and our ability to carry back our U.S. operating losses, tax credits and reversing temporary differences to recover previously paid taxes. Based on this assessment, we determined that a valuation allowance was required for the deferred tax assets related to our U.S. operations that could not be carried back to recover previously paid taxes. Accordingly, we recorded a $28,446,000 valuation allowance on a substantial portion of our U.S. deferred tax assets, which was included in the total tax provision of $17,949,000.
During fiscal year 2010 we decreased the valuation allowance by $15,616,000 primarily due to the utilization of certain foreign net operating losses and the recording of the deferred tax liability related to the acquisition of White Electronic Designs Corporation. As referenced in the subsequent events footnote to our consolidated financial statements, we acquired Actel Corporation in November 2010, and as a result, we anticipate that we may record a deferred tax liability related to the acquired intangible assets, and; therefore, release a portion or all of the remaining valuation allowance on our domestic deferred tax assets. In addition, due to historical and projected levels of foreign income, we anticipate that we may release a portion or all of the remaining valuation allowance on our foreign deferred tax assets.
We have state net operating losses (“NOLs”) of approximately $28,361,000 that begin expiring in 2014, foreign NOLs of approximately $62,441,000 that carryforward indefinitely, federal and state research and experimentation credits of approximately $5,369,000 and $14,022,000, respectively; and federal and state enterprise zone credits of approximately $536,000 and $186,000, respectively, that have an indefinite carry forward.
The utilization of the NOL’s and credits acquired with the Advance Power Technology, Inc. which we acquired in fiscal year 2006, and renamed Microsemi Corp. – Power Products Group (“PPG”) as well as the NOL’s and credits acquired with White Electronic which we acquired in fiscal year 2010, will be subject to limitations due to ownership changes. At this time, based upon the purchase price of PPG and White Electronic, we do not believe that these limitations will affect the utilization of the NOL’s.
No provision has been made for future U.S. income taxes on certain undistributed earnings of foreign operations since they have been indefinitely reinvested in these operations. Determination of the amount of unrecognized deferred tax liability for temporary differences related to these undistributed earnings is not practicable. At the end of fiscal years 2010 and 2009, these undistributed earnings aggregated approximately $191,402,000 and $116,494,000, respectively.
64
Table of Contents
MICROSEMI CORPORATION AND SUBSIDIARIES
NOTES TO CONSOLIDATED FINANCIAL STATEMENTS—(Continued)
The following is a reconciliation of income tax computed at the federal statutory rate to our actual tax expense (amounts in thousands):
| For each of the three fiscal years in the period ended October 3, 2010 |
||||||||||||
| 2010 | 2009 | 2008 | ||||||||||
| Tax computed at federal statutory rate |
$ | 19,261 | $ | (3,107 | ) | $ | 23,264 | |||||
| State taxes, net of federal impact |
2,147 | (2,495 | ) | 578 | ||||||||
| Foreign income taxed at different rates |
(14,621 | ) | (22,969 | ) | (14,042 | ) | ||||||
| Tax credits |
(3,025 | ) | (1,899 | ) | (512 | ) | ||||||
| Stock award compensation |
3,288 | 3,225 | 3,183 | |||||||||
| Unrecognized tax benefits |
2,325 | 3,298 | 1,020 | |||||||||
| Imputed interest |
61 | 335 | — | |||||||||
| Executive compensation |
1,312 | 1,558 | — | |||||||||
| Other differences, net |
861 | 614 | (345 | ) | ||||||||
| Valuation allowance |
(15,616 | ) | 39,389 | 3,671 | ||||||||
| $ | (4,007 | ) | $ | 17,949 | $ | 16,817 | ||||||
The tax affected deferred tax assets (liabilities) are comprised of the following components (amounts in thousands):
| October 3, 2010 |
September 27, 2009 |
|||||||
| Accounts receivable, net |
$ | 1,161 | $ | 1,371 | ||||
| Inventories |
10,313 | 13,384 | ||||||
| Accrued employee benefit expenses |
2,603 | 1,778 | ||||||
| Net operating losses |
16,840 | 22,587 | ||||||
| Tax credits |
12,319 | 7,655 | ||||||
| Accrued other expenses |
4,343 | 9,695 | ||||||
| Deferred equity compensation |
8,683 | 9,424 | ||||||
| Property and equipment, net |
1,403 | — | ||||||
| Other assets |
3,826 | 2,664 | ||||||
| Total deferred tax assets |
61,491 | 68,558 | ||||||
| Intangible assets |
(30,781 | ) | (15,928 | ) | ||||
| Property and equipment, net |
— | (358 | ) | |||||
| Total deferred tax liabilities |
(30,781 | ) | (16,286 | ) | ||||
| Less valuation allowance |
(37,604 | ) | (53,220 | ) | ||||
| $ | (6,894 | ) | $ | (948 | ) | |||
65
Table of Contents
MICROSEMI CORPORATION AND SUBSIDIARIES
NOTES TO CONSOLIDATED FINANCIAL STATEMENTS—(Continued)
We adopted authoritative guidance related to accounting for uncertain tax positions on October 1, 2007. As a result of the adoption, the Company recognized a $5,308,000 increase to the liability for unrecognized tax benefits, which was accounted for as a net $413,000 reduction to the October 1, 2007 balance of retained earnings. As of the adoption date, the Company had estimated accrued interest and penalties related to the unrecognized tax benefits of $1,470,000. A reconciliation of the beginning and ending amount of unrecognized tax benefits is as follows (amounts in thousands):
| October 3, 2010 |
September 27, 2009 |
September 28, 2008 |
||||||||||
| Beginning gross unrecognized tax benefits |
$ | 16,431 | $ | 12,819 | $ | 12,713 | ||||||
| Additions based on tax positions related to the current year |
4,757 | 2,411 | 2,532 | |||||||||
| Additions based on current year acquisitions |
349 | — | — | |||||||||
| Additions based on tax positions of prior years |
2,408 | 2,236 | 1,541 | |||||||||
| Reductions for lapses and settlements |
(2,226 | ) | (1,035 | ) | (3,967 | ) | ||||||
| Ending gross unrecognized tax benefit |
$ | 21,719 | $ | 16,431 | $ | 12,819 | ||||||
We recognize interest and penalties accrued related to unrecognized tax benefits in tax expense. During the years ended October 3, 2010 and September 27, 2009, we recognized approximately $216,000 and $757,000, respectively, in interest and penalties. The cumulative interest and penalties at October 3, 2010 and September 27, 2009 were $3,497,000 and $3,281,000, respectively.
Unrecognized tax benefits of $23,136,000 at October 3, 2010 would impact the effective tax rate if recognized. We anticipate a decrease in gross unrecognized tax benefits of approximately $3,705,000 within the next twelve months based on federal, state, and foreign expirations in various jurisdictions.
We file U.S. state, and foreign income tax returns in jurisdictions with varying statutes of limitations. Fiscal years 2007 to 2010 generally remain subject examination by federal and most state tax authorities. In significant foreign jurisdictions, the 2007 to 2010 tax years generally remain subject to examination by tax authorities. We establish liabilities for possible assessments by tax authorities resulting from known tax exposures including, but not limited to, international tax issues and certain tax credits. We do not believe the results of any audits would have a material impact on our financial position, results of operations or cash flows.
| 8. | LONG-TERM LIABILITIES |
Long-term liabilities consisted of (amounts in thousands):
| October 3, 2010 |
September 27, 2009 |
|||||||
| Capital leases |
$ | 3,244 | $ | 3,300 | ||||
| Other long-term liabilities: |
||||||||
| Unrecognized tax benefits |
14,110 | 15,475 | ||||||
| Deferred tax liabilities |
19,513 | 11,645 | ||||||
| Accrued retirement |
3,813 | 3,370 | ||||||
| Environmental |
314 | 357 | ||||||
| Other |
1,570 | 294 | ||||||
| Total long-term liabilities |
42,564 | 34,441 | ||||||
| Current portion |
(444 | ) | (431 | ) | ||||
| Long-term portion |
$ | 42,120 | $ | 34,010 | ||||
66
Table of Contents
MICROSEMI CORPORATION AND SUBSIDIARIES
NOTES TO CONSOLIDATED FINANCIAL STATEMENTS—(Continued)
We lease a building in Santa Ana, California, under a long-term capital lease obligation. We also lease certain equipment under a capital lease with terms ranging from one to three years. Building and equipment under capital lease obligations are reflected in property and equipment, net, in the accompanying consolidated balance sheets. Other long-term liabilities include environmental reserves and statutory and supplemental retirement benefits.
Payments for capital lease obligations and other long-term liabilities, including the current portion, that are due in each of five succeeding years are as follows, (amounts in thousands):
| Fiscal Year | ||||||||||||||||||||||||
| 2011 | 2012 | 2013 | 2014 | 2015 | Thereafter | |||||||||||||||||||
| Capital leases |
$ | 355 | $ | 303 | $ | 297 | $ | 293 | $ | 293 | $ | 1,703 | ||||||||||||
| Other long-term liabilities |
89 | 139 | 39 | 19 | 19 | 5,392 | ||||||||||||||||||
| Total |
$ | 444 | $ | 442 | $ | 336 | $ | 312 | $ | 312 | $ | 7,095 | ||||||||||||
| 9. | STOCK BASED COMPENSATION AND EMPLOYEE BENEFIT PLANS |
Stock Based Compensation
In February 2008, our stockholders approved the Microsemi Corporation 2008 Performance Incentive Plan (the “2008 Plan”). The 2008 Plan replaced the 1987 Plan, as amended, previously approved by our stockholders. The 2008 Plan includes a share limit of 4,063,000 shares of the Company’s common stock for delivery under awards that have been and may be granted under the 2008 Plan. Awards authorized by the 2008 Plan include options, stock appreciation rights, restricted stock, stock bonuses, stock units, performance share awards, and other cash or share-based awards (each an “Award”). The shares of common stock delivered under the 2008 Plan may be newly-issued shares or shares held by the Company as treasury stock.
The share limit under the 2008 Plan increases on the first day of each year for the first five consecutive years by an amount equal to the lowest of (i) three percent of the total number of shares of common stock issued and outstanding on the last day of the immediately preceding fiscal year, (ii) 7,500,000 shares of common stock or (iii) such number of shares of common stock as may be established by the Board of Directors. Shares issued in respect of any “Full-Value Award” granted under the 2008 Plan shall be counted against the share limit as 2.25 shares for every one share actually issued in connection with such award. “Full-Value Award” means any award under the 2008 Plan that is not a stock option grant or a stock appreciation right grant. The maximum term of a stock option grant or a stock appreciation right grant is six years.
For 2010, 2009 and 2008, total compensation expense for stock awards amounted to $25,277,000, $26,933,000 and $20,973,000, respectively.
67
Table of Contents
MICROSEMI CORPORATION AND SUBSIDIARIES
NOTES TO CONSOLIDATED FINANCIAL STATEMENTS—(Continued)
Compensation expense for stock awards were calculated based on the date of grant or conversion using the Black-Scholes option pricing model. Awards granted, weighted-average exercise price, weighted-average fair value and weighted-average assumptions used in the calculation of compensation expense are as follows:
| # of Awards |
Per Award | Risk Free Rate |
Expected Dividend Yield |
Expected Life (Years) |
Expected Volatility |
|||||||||||||||||||||||
| Fiscal Year Ended |
Exercise Price |
Fair Value |
||||||||||||||||||||||||||
| October 3, 2010 |
||||||||||||||||||||||||||||
| Option grants |
27,601 | $ | 13.87 | $ | 5.25 | 0.2 | % | 0.0 | % | 0.5 | 34.3 | % | ||||||||||||||||
| Restricted stock awards |
1,399,589 | $ | 14.99 | |||||||||||||||||||||||||
| September 27, 2009 |
||||||||||||||||||||||||||||
| Option grants |
8,800 | $ | 21.32 | $ | 6.35 | 1.9 | % | 0.0 | % | 3.0 | 41.3 | % | ||||||||||||||||
| Restricted stock awards |
1,370,667 | $ | 20.70 | |||||||||||||||||||||||||
| September 28, 2008 |
||||||||||||||||||||||||||||
| Option grants |
2,295,340 | $ | 26.76 | $ | 7.57 | 3.6 | % | 0.0 | % | 2.7 | 38.3 | % | ||||||||||||||||
| Restricted stock awards |
515,672 | $ | 28.40 | |||||||||||||||||||||||||
During 2010, 27,601 stock options and 2,039 restricted stock units were assumed grants related to the acquisition of White Electronic. Options are granted at exercise prices equal to the closing price of our common stock on the date of grant. Restricted stock awards are granted to employees with compensation expense determined based on the closing price of our common stock on the date of grant. Options and restricted stock awards are subject to forfeiture if length of service requirements are unmet. Expected life was estimated based on historical exercise data that was stratified between members of the Board of Directors, executive employees and all other recipients. Expected volatility was estimated based on historical volatility using equally weighted daily price observations over a period approximately equal to the expected life of each option. The risk free interest rate is based on the implied yield currently available on U.S. Treasury securities with an equivalent remaining term. No dividends are expected to be paid.
Activity and price information related to stock options are as follows:
| Stock Options |
Weighted- Average Exercise Price |
|||||||
| Outstanding September 30, 2007 |
11,808,363 | $ | 18.05 | |||||
| Granted |
2,295,340 | 26.76 | ||||||
| Exercised |
(1,993,554 | ) | 13.22 | |||||
| Expired or Canceled |
(338,099 | ) | 23.97 | |||||
| Outstanding September 28, 2008 |
11,772,050 | $ | 20.39 | |||||
| Granted |
8,800 | 21.32 | ||||||
| Exercised |
(276,487 | ) | 10.34 | |||||
| Expired or Canceled |
(841,377 | ) | 22.60 | |||||
| Outstanding September 27, 2009 |
10,662,986 | $ | 20.48 | |||||
| Granted |
27,601 | 13.87 | ||||||
| Exercised |
(464,458 | ) | 10.35 | |||||
| Expired or Canceled |
(999,971 | ) | 23.43 | |||||
| Outstanding October 3, 2010 |
9,226,158 | $ | 20.65 | |||||
68
Table of Contents
MICROSEMI CORPORATION AND SUBSIDIARIES
NOTES TO CONSOLIDATED FINANCIAL STATEMENTS—(Continued)
Stock options exercisable under the Plan were 8,901,189, 8,387,761 and 7,387,940 at October 3, 2010, September 27, 2009 and September 28, 2008, respectively, at weighted-average exercise prices of $20.58, $19.66 and $18.96, respectively. The total intrinsic value of options exercised during the 2010, 2009 and 2008 was $2,683,000, $995,000 and $24,145,000, respectively.
Intrinsic value and weighted-average remaining life related to outstanding and unvested stock options are as follows (intrinsic value in thousands):
| Intrinsic Value |
Weighted- Average Remaining Life |
|||||||
| September 28, 2008 |
||||||||
| Outstanding |
$ | 78,853 | 5.4 | |||||
| Unvested |
$ | 24,501 | 4.8 | |||||
| September 27, 2009 |
||||||||
| Outstanding |
$ | 11,356 | 4.3 | |||||
| Unvested |
$ | 180 | 3.9 | |||||
| October 3, 2010 |
||||||||
| Outstanding |
$ | 13,156 | 3.4 | |||||
| Unvested |
$ | — | 3.4 | |||||
During 2008, we granted 49,000 shares to non-employee directors with restrictions that lapsed immediately at grant. Grants to employees included 16,667 shares with restrictions that lapse annually in nearly equal amounts over two years, 175,000 shares with restrictions that lapse in the amounts of 50,000 after one year, 100,000 after two years and 175,000 after three years and 275,005 shares with restrictions that lapse annually over three years. During 2009, we granted 49,000 shares to non-employee directors with restrictions that lapsed immediately at grant. Grants to employees included 100,000 shares with restrictions that lapse in the amounts of 25,000 after one year and 75,000 after two years with remaining grants issued with restrictions that lapse annually over three years. During 2010, we granted 49,000 shares to non-employee directors with restrictions that lapsed immediately at grant. Grants to employees included 100,000 shares with restrictions that lapse in the amounts of 40,000 after one year and 60,000 after two years with remaining grants issued with restrictions that lapse annually over three years. During the restriction period, the shares have the same voting rights as common stock but are non-transferable.
69
Table of Contents
MICROSEMI CORPORATION AND SUBSIDIARIES
NOTES TO CONSOLIDATED FINANCIAL STATEMENTS—(Continued)
Activity and price information related to restricted stock awards are as follows:
| Restricted Stock Awards |
Weighted- Average Grant Price |
|||||||
| Outstanding and Unvested September 30, 2007 |
149,731 | $ | 19.96 | |||||
| Granted |
515,672 | 28.40 | ||||||
| Vested |
(70,233 | ) | 24.57 | |||||
| Canceled |
(1,641 | ) | 17.88 | |||||
| Outstanding and Unvested September 28, 2008 |
593,529 | $ | 26.75 | |||||
| Granted |
1,370,667 | 20.70 | ||||||
| Vested |
(313,136 | ) | 24.58 | |||||
| Canceled |
(31,364 | ) | 18.49 | |||||
| Outstanding and Unvested September 27, 2009 |
1,619,696 | $ | 22.21 | |||||
| Granted |
1,399,589 | 14.99 | ||||||
| Vested |
(1,059,469 | ) | 22.09 | |||||
| Canceled |
(43,539 | ) | 16.37 | |||||
| Outstanding and Unvested October 3, 2010 |
1,916,277 | $ | 17.14 | |||||
At October 3, 2010, unamortized compensation expense related to unvested options and restricted stock awards, net of estimated forfeitures, was approximately $21,853,000. The weighted average period over which compensation expense related to these grants will be recognized is 1.3 years.
Remaining shares available for grant at October 3, 2010, September 27, 2009 and September 28, 2008 under the Plan were 4,380,000, 3,985,000 and 3,461,000, respectively.
Cash Bonus Plan
Our Cash Bonus Plan, first adopted by the Board of Directors in fiscal year 1984, covers substantially all full-time employees who meet certain minimum employment requirements and provides terms and conditions for current bonuses based upon our earnings. The Compensation Committee of the Board of Directors determines annual contributions to the plan. Total charges to income were $7,300,000, $2,600,000 and $8,141,000 in 2010, 2009 and 2008, respectively.
401(k) Plan
We sponsor a 401(k) Savings Plan whereby participating employees may elect to contribute up to 50% of their eligible wages up to the statutory contribution limit. In 2008, we provided a match on an employee’s contribution. During the third quarter of 2009, we suspended the employer match and did not reinstate the match during 2010. Employees 50 years of age and older may contribute a further 75% of their eligible wages up to the statutory contribution limit. We do not match this supplemental contribution. We contributed $2,176,000 and $3,114,000 to this plan during 2009 and 2008, respectively.
70
Table of Contents
MICROSEMI CORPORATION AND SUBSIDIARIES
NOTES TO CONSOLIDATED FINANCIAL STATEMENTS—(Continued)
| 10. | COMMITMENTS AND CONTINGENCIES |
Operating Leases
We occupy premises and lease equipments under operating lease agreements expiring through 2029. The aggregate undiscounted future minimum rental payments under these leases are as follows (amounts in thousands):
| Payments due by period | ||||||||||||
| Total |
2011 |
2012 | 2013 | 2014 | 2015 | Thereafter | ||||||
| $22,033 |
$6,531 | $4,635 | $3,681 | $3,367 | $2,606 | $1,213 | ||||||
Lease expense charged to income was $7,804,000, $7,652,000 and $5,769,000 in 2010, 2009 and 2008, respectively.
Purchase Obligations
We have entered into agreements to buy material with certain vendors. The minimum annual payments are as follows (amounts in thousands):
| Payments due by period |
||||||||||||||||||||||||
| Total |
2011 | 2012 | 2013 | 2014 | 2015 | Thereafter | ||||||||||||||||||
| $38,394 |
$ | 32,092 | $ | 6,302 | $ | — | $ | — | $ | — | $ | — | ||||||||||||
Contingencies
In Broomfield, Colorado, the owner of a property located adjacent to a manufacturing facility owned by one of our subsidiaries, Microsemi Corp. – Colorado had notified the subsidiary and other parties of a claim that contaminants migrated to his property, thereby diminishing its value. In August 1995, the subsidiary, together with Coors Porcelain Company, FMC Corporation and Siemens Microelectronics, Inc. (former owners of the manufacturing facility), agreed to settle the claim and to indemnify the owner of the adjacent property for remediation costs. Although tricholorethylene and other contaminants previously used by former owners at the facility are present in soil and groundwater on the subsidiary’s property, we vigorously contest any assertion that the subsidiary caused the contamination. In November 1998, we signed an agreement with the three former owners of this facility whereby they have 1) reimbursed us for $530,000 of past costs, 2) assumed responsibility for 90% of all future clean-up costs, and 3) promised to indemnify and protect us against any and all third-party claims relating to the contamination of the facility. An Integrated Corrective Action Plan was submitted to the State of Colorado. Sampling and management plans were prepared for the Colorado Department of Public Health & Environment. State and local agencies in Colorado are reviewing current data and considering study and cleanup options. The most recent forecast estimated that the total project cost, up to the year 2020, would be approximately $5,300,000; accordingly, we recorded a one-time charge of $530,000 for this project in 2003. There has not been any significant development since September 28, 2003.
We are generally self-insured for losses and liabilities related to Workers’ Compensation and Employer’s Liability Insurance. Accrued workers’ compensation liability was $1,208,000 and $781,000 at October 3, 2010 and September 27, 2009, respectively. Our self-insurance accruals are based on estimates and, while we believe that the amounts accrued are adequate, the ultimate claims may be in excess of the amounts provided.
We are also involved in other pending litigation matters arising out of the normal conduct of our business, including litigation relating to acquisitions, employment matters, commercial transactions, contracts,
71
Table of Contents
MICROSEMI CORPORATION AND SUBSIDIARIES
NOTES TO CONSOLIDATED FINANCIAL STATEMENTS—(Continued)
environmental matters and matters related to compliance with governmental regulations. Although the ultimate aggregate amount of monetary liability or financial impact with respect to these matters is subject to many uncertainties and is therefore not predictable with assurance. In the opinion of management, the final outcome of these matters, if they are adverse, will not have a material adverse effect on our financial position, results of operations or cash flows. However, there can be no assurance with respect to such result, and monetary liability or financial impact on us from these litigation matters could differ materially from those projected.
| 11. | RESTRUCTURING CHARGES AND SEVERANCE CHARGES |
In 2005, we announced consolidation plans for our facility in Broomfield, Colorado (“Broomfield”). Broomfield ceased operations at the end of the third quarter of 2009. Substantially all accrued severance amounts related to Broomfield have been paid.
In 2009, we approved consolidation plans that will result in the closure of our manufacturing facility in Scottsdale, Arizona (“Scottsdale”), with production activities expected to cease in February 2011. Scottsdale currently has approximately 230 employees and occupies a 135,000 square foot leased facility. Shipments from the Scottsdale facility accounted for approximately 6% of net sales for the fiscal year ended October 3, 2010. At September 27, 2009, we had recorded severance accruals of $5,491,000 that are expected to be paid through 2012.
The following table reflects the restructuring activities for the Scottsdale facility and the accrued liabilities in the consolidated balance sheets at the dates below (amounts in thousands):
| Employee Severance |
Other Associated Costs |
|||||||
| Balance at September 27, 2009 |
$ | 5,491 | $ | — | ||||
| Provisions |
— | 20 | ||||||
| Cash expenditures |
(1,367 | ) | (20 | ) | ||||
| Balance at October 3, 2010 |
$ | 4,124 | $ | — | ||||
At September 27, 2009, we had recorded severance accruals of $2,186,000 from reductions in force at our various facilities other than Broomfield and Scottsdale. We recorded additional severance accruals related to provisions totaling $2,087,000 during the fiscal year ended October 3, 2010. These restructuring activities covered approximately 300 individuals in manufacturing, engineering and sales. Substantially all accrued amounts are expected to be paid within twelve months. The following table reflects the restructuring activities and the accrued liabilities in the consolidated balance sheets at the dates below (amounts in thousands):
| Employee Severance |
||||
| Balance at September 27, 2009 |
$ | 2,186 | ||
| Provisions |
2,087 | |||
| Cash expenditures |
(2,188 | ) | ||
| Other non-cash settlement |
(443 | ) | ||
| Balance at October 3, 2010 |
$ | 1,642 | ||
72
Table of Contents
MICROSEMI CORPORATION AND SUBSIDIARIES
NOTES TO CONSOLIDATED FINANCIAL STATEMENTS—(Continued)
| 12. | SEGMENT INFORMATION |
We manage our business on the basis of one reportable segment, as a manufacturer of semiconductors in different geographic areas, including the United States, Europe and Asia. We derive revenue from sales of our high-performance analog/mixed signal integrated circuits and power and high-reliability individual component semiconductors. These products include individual components as well as integrated circuit solutions that enhance customer designs by improving performance, reliability and battery optimization, reducing size or protecting circuits. The principal markets that we serve include Security & Defense, Aerospace, Industrial & Alternative Energy, and Enterprise & Commercial. We evaluate sales by end-market based on our understanding of end market uses of our products.
Net sales by the originating geographic area, end market and long lived assets by geographic area are as follows (amounts in thousands):
| 2010 | 2009 | 2008 | ||||||||||
| Net Sales: |
||||||||||||
| United States |
$ | 243,822 | $ | 215,611 | $ | 223,690 | ||||||
| Europe |
125,209 | 135,844 | 129,605 | |||||||||
| Asia |
149,237 | 101,517 | 160,772 | |||||||||
| Total |
$ | 518,268 | $ | 452,972 | $ | 514,067 | ||||||
| Security & Defense |
$ | 208,098 | $ | 170,653 | $ | 167,737 | ||||||
| Aerospace |
107,587 | 112,847 | 103,942 | |||||||||
| Enterprise & Commercial |
116,369 | 70,102 | 135,450 | |||||||||
| Industrial & Alternative Energy |
86,214 | 99,370 | 106,938 | |||||||||
| Total |
$ | 518,268 | $ | 452,972 | $ | 514,067 | ||||||
| Long lived assets: |
||||||||||||
| United States |
$ | 55,737 | $ | 51,874 | $ | 64,674 | ||||||
| Europe |
14,212 | 13,619 | 10,030 | |||||||||
| Asia |
5,964 | 3,205 | 3,885 | |||||||||
| Total |
$ | 75,913 | $ | 68,698 | $ | 78,589 | ||||||
| 13. | REVOLVING CREDIT FACILITY |
On October 5, 2009, we entered into a Credit Agreement with Bank of America, N.A. (the “Revolving Credit Facility”). The Revolving Credit Facility was scheduled to mature on October 5, 2012. The Revolving Credit Facility provided for a revolving line of credit of up to $50 million (the “Maximum Commitment”). The Revolving Credit Facility was available for direct borrowings and, subject to the Maximum Commitment, up to $20 million of the Revolving Credit Facility was available for the issuance of letters of credit. Borrowings under the Revolving Credit Facility could be used for working capital and other lawful corporate purposes. The Company had as of October 3, 2010 no direct borrowings and $400,000 in letters of credit outstanding under the Revolving Credit Facility.
Interest accruing on the amount of direct borrowings under the Revolving Credit Facility was determined based upon the Company’s choice of either a Base Rate Loan or a Eurodollar Rate Loan. The interest rate per annum for Base Rate Loans was determined by reference to the higher of (1) the federal funds rate plus 0.50%, (2) the prime rate as announced by Bank of America, N.A. and (3) a LIBOR rate determined as provided in the
73
Table of Contents
MICROSEMI CORPORATION AND SUBSIDIARIES
NOTES TO CONSOLIDATED FINANCIAL STATEMENTS—(Continued)
Revolving Credit Facility plus 1.50%, in each case plus an applicable margin. The applicable margin for Base Rate Loans was initially 1.50% per annum but could decrease to 1.25% or increase to 1.75% based upon a leverage ratio of Consolidated Funded Indebtedness to Consolidated EBITDA (as each such term is defined in the Revolving Credit Facility). Eurodollar Rate Loans bore interest at the Eurodollar Rate defined in the Revolving Credit Facility, plus an applicable margin. The applicable margin for Eurodollar Rate Loans was initially 2.50% per annum but could decrease to 2.25% or increase to 2.75% based upon a leverage ratio of Consolidated Funded Indebtedness to Consolidated EBITDA.
In addition to paying interest on outstanding borrowings under the Revolving Credit Facility, the Company was required to pay a quarterly commitment fee based on the applicable commitment fee rate multiplied by the actual daily amount by which the Maximum Commitment exceeded the aggregate outstanding amount of all loans and all letter of credit obligations under the Revolving Credit Facility. The commitment fee rate was initially 0.50% per annum but could decrease to 0.40% based upon a leverage ratio of Consolidated Funded Indebtedness to Consolidated EBITDA. The Company was also required to pay a quarterly letter of credit fee for each letter of credit based on the daily maximum amount available to be drawn under the letter of credit multiplied by the letter of credit fee rate. The letter of credit fee rate was initially 2.50% per annum but could decrease to 2.25% or increase to 2.75% based upon a leverage ratio of Consolidated Funded Indebtedness to Consolidated EBITDA.
The Revolving Credit Facility required the Company to maintain: (1) a minimum leverage ratio of Consolidated Funded Indebtedness to Consolidated EBITDA of 2.00:1.00, (2) a minimum Fixed Charge Coverage Ratio (as defined in the Revolving Credit Facility) of not less than 3.00:1.00, and (3) a Consolidated Liquidity Ratio (as defined in the Revolving Credit Facility) of not less than 1.50:1.00. The Revolving Credit Facility also contained customary limitations on the Company’s ability to incur liens or indebtedness, make investments or certain restricted payments, merge with or acquire other companies, liquidate or dissolve, dispose of assets, substantially change the nature of the Company’s business, and engage in transactions with affiliates. Upon the occurrence of an event of default under the Revolving Credit Facility, the lender was permitted to cease making loans, terminate the Revolving Credit Facility, and declare all amounts outstanding to be immediately due and payable. The Revolving Credit Facility specified a number of events of default (some of which are subject to applicable grace or cure periods), including, among other things, non-payment of principal and interest when due, failure to satisfy the covenants in the Revolving Credit Facility, including the financial covenants described above, default of certain other indebtedness, bankruptcy or insolvency and a change of control. As noted in the subsequent event footnote, on October 28, 2010, the Revolving Credit Facility was terminated and all letters of credit outstanding thereunder were cancelled in anticipation of the Company entering into the new credit facility described below.
| 14. | ACQUISITIONS AND DIVESTITURE |
2009
In the first quarter of 2009, we entered into a stock purchase agreement in which we acquired all the shares of Electro Module, Inc. and its wholly-owned subsidiary, Babcock, Inc. Babcock, Inc. is a leading manufacturer of high-reliability power supplies, relays and flat panel displays and supplies. We subsequently renamed Babcock, Inc., “Microsemi Corp. – Power Management Group” (“PMG”).
74
Table of Contents
MICROSEMI CORPORATION AND SUBSIDIARIES
NOTES TO CONSOLIDATED FINANCIAL STATEMENTS—(Continued)
The purchase consideration is as follows (amounts in thousands):
| Cash consideration to Electro Module, Inc. stockholders |
$ | 23,198 | ||
| Direct transaction fees and expenses |
83 | |||
| Total consideration |
$ | 23,281 | ||
The purchase consideration has been allocated based on the estimated fair values of assets acquired and liabilities assumed. Management’s estimate of the purchase price allocation is as follows (amounts in thousands):
| Cash and cash equivalents |
$ | 1,372 | ||
| Accounts receivable |
5,725 | |||
| Inventories |
1,402 | |||
| Other current assets |
4,590 | |||
| Property and equipment |
1,105 | |||
| Goodwill |
9,777 | |||
| Intangible assets |
11,400 | |||
| Accounts payable |
(2,072 | ) | ||
| Accrued liabilities |
(5,469 | ) | ||
| Deferred income tax liability – long term |
(4,549 | ) | ||
| Total consideration |
$ | 23,281 | ||
Other intangible assets and their estimated useful lives are as follows (amounts in thousands, except useful life):
| Asset Amount |
Useful Life (Years) |
|||||||
| Completed technology |
$ | 3,970 | 3 to 8 | |||||
| Backlog |
2,780 | 3 | ||||||
| Customer relationships |
4,330 | 10 | ||||||
| Trade name |
320 | 3 | ||||||
| $ | 11,400 | |||||||
In the third quarter of 2009, we entered into an asset purchase agreement in which we acquired substantially all the assets of the Defense and Security business of Endwave Corporation. The Defense and Security business designs, manufactures and markets radio frequency modules that enable the transmission, reception and processing of high frequency signals. Markets for these products include defense electronics, homeland security systems and other applications that require high frequency radio frequency circuitry and subsystems. This acquisition was integrated into a new entity – Microsemi Corp. – RF Integrated Solutions.
The purchase consideration is as follows (amounts in thousands):
| Cash consideration to Endwave Corporation |
$ | 28,000 | ||
| Assumed liabilities |
578 | |||
| Direct transaction fees and expenses |
398 | |||
| Total consideration |
$ | 28,976 | ||
75
Table of Contents
MICROSEMI CORPORATION AND SUBSIDIARIES
NOTES TO CONSOLIDATED FINANCIAL STATEMENTS—(Continued)
The purchase consideration has been allocated based on the estimated fair values of assets acquired and liabilities assumed. Management’s estimate of the purchase price allocation is as follows (amounts in thousands):
| Accounts receivable |
$ | 1,055 | ||
| Inventories |
3,966 | |||
| Other current assets |
6 | |||
| Property and equipment |
2,575 | |||
| Goodwill |
12,304 | |||
| Intangible assets |
9,070 | |||
| Total consideration |
$ | 28,976 | ||
Other intangible assets and their estimated useful lives are as follows (amounts in thousands, except useful life):
| Asset Amount |
Useful Life (Years) |
|||||||
| Completed technology |
$ | 3,330 | 6 | |||||
| Backlog |
2,000 | 2 | ||||||
| Customer relationships |
3,740 | 6 | ||||||
| $ | 9,070 | |||||||
In the third quarter of 2009, we entered into an asset purchase agreement in which we acquired substantially all the assets of Nexsem, Inc. Nexsem, Inc. is a designer and marketer of high-voltage DC to DC conversion devices for applications such as in LCD televisions, set top boxes, notebooks and netbooks. This acquisition was integrated into the existing operations of Microsemi Corp. – Analog Mixed Signal Group. The purchase consideration was $4,800,000 in cash, assumed $363,000 in liabilities and paid $18,000 in direct transaction fees and expenses. The purchase consideration was allocated based on the estimated fair values of assets acquired and liabilities assumed and we allocated $1,290,000 to customer relationships with a useful life of four years, $520,000 to complete technology with a use life of four years and backlog of $90,000 with a useful life of one year. We also expensed $1,310,000 related to the estimated fair value of in-process research and development.
In the fourth quarter of 2009 and in connection with a settlement with the United States Department of Justice, we entered into an agreement which, in substance, resulted in the divestiture of the assets purchased from SEMICOA in 2008. Proceeds from this transaction totaled $6,625,000, of which $500,000 was deposited with an escrow agent to be released one year subsequent to the transaction date. We sold accounts receivable, inventories, equipment, and intangible assets with net book values of $543,000, $1,973,000, $1,008,000 and $1,355,000, respectively, and reversed $41,000 in related net deferred expenses. In addition, we reduced goodwill by $1,413,000 for the pro-rata amount of goodwill allocable to the sale of SEMICOA assets. The pro-rata portion of goodwill adjusted for the disposition was based on the ratio of the relative fair value of the disposed business compared to the total fair value of our reporting unit on the transaction date. Direct transaction expenses related to the sale amounted to $358,000. We recorded a gain of $16,000 related to this divestiture.
2010
In the third quarter of 2010, Microsemi acquired all of the outstanding common stock of White Electronic Designs Corporation, a defense electronics manufacturer and supplier that designs, develops and manufactures innovative electronic components and systems for inclusion in high technology products for the defense and
76
Table of Contents
MICROSEMI CORPORATION AND SUBSIDIARIES
NOTES TO CONSOLIDATED FINANCIAL STATEMENTS—(Continued)
aerospace markets. The transaction was structured as a cash tender offer at $7.00 per share that expired on April 27, 2010, by Rabbit Acquisition Corp. (“Rabbit”), a direct wholly-owned subsidiary of Microsemi, for all outstanding shares of White Electronic’s common stock, followed by a merger of Rabbit into White Electronic whereby White Electronic became a direct wholly-owned subsidiary of Microsemi. This transaction is expected to further Microsemi’s integrated solution offerings primarily in the defense and homeland security end market. We financed this transaction with our cash and cash equivalents.
The total estimated consideration as shown in the table below is allocated to White Electronic’s tangible and intangible assets and liabilities based on their estimated fair values as of the date of the completion of the acquisition. The preliminary estimated consideration is allocated as follows (in thousands):
| Preliminary calculation of consideration: |
||||
| Cash consideration to White Electronic stockholders |
$ | 165,648 | ||
| Cash consideration paid on vested and non-assumed equity awards |
1,657 | |||
| Fair value of vested equity awards assumed by Microsemi |
162 | |||
| Total preliminary calculation of consideration |
$ | 167,467 | ||
| Preliminary allocation of consideration: |
||||
| Book value of White Electronic’s net assets |
$ | 85,199 | ||
| Adjustments to historical net book value: |
||||
| Inventories |
262 | |||
| Intangible assets |
51,500 | |||
| Adjustment to goodwill |
45,562 | |||
| Deferred tax liability |
(15,056 | ) | ||
| Total preliminary calculation of consideration |
$ | 167,467 | ||
A final determination of fair values relating to the transaction may differ materially from preliminary estimates and will include management’s final purchase price allocation of the fair value of assets acquired and liabilities assumed. This final purchase price allocation will be based on the actual net tangible and intangible assets of White Electronic that existed as of the date of the completion of the acquisition. The final purchase price allocation may materially change the allocation of the purchase price, which could materially affect the fair values assigned to the assets and liabilities.
Identifiable intangible assets and their estimated useful lives are as follows (amounts in thousands):
| Asset Amount |
Weighted Average Useful Life (Years) |
|||||||
| Completed technology |
$ | 22,900 | 7 | |||||
| Backlog |
5,100 | 3 | ||||||
| Customer relationships |
22,600 | 8 | ||||||
| Trade name |
900 | 5 | ||||||
| $ | 51,500 | |||||||
We utilized the straight line method of amortization for completed technology, customer relationships and trade name and the estimated fulfillment period for backlog. This allocation is preliminary and is based on our
77
Table of Contents
MICROSEMI CORPORATION AND SUBSIDIARIES
NOTES TO CONSOLIDATED FINANCIAL STATEMENTS—(Continued)
estimates. The amount ultimately allocated to intangible assets may differ materially from this preliminary allocation. A $1,000,000 increase or decrease in value allocated to completed technology, backlog, customer relationships and trade name would increase or decrease annual amortization expense by approximately $143,000, $333,000, $125,000 and $200,000, respectively.
The fair value of the identified intangible assets was estimated by performing a discounted cash flow analysis using the “income” approach. This method includes a forecast of direct revenues and costs associated with the respective intangible assets and charges for economic returns on tangible and intangible assets utilized in cash flow generation. Net cash flows attributable to the identified intangible assets are discounted to their present value at a rate commensurate with the perceived risk. The projected cash flow assumptions considered contractual relationships, customer attrition, eventual development of new technologies and market competition.
The useful lives of completed technologies rights are based on the number of years in which net cash flows have been projected. The useful life of backlog is estimated based upon the fulfillment period. The useful lives of customer relationships are estimated based upon the length of the relationships currently in place, historical attrition patterns and natural growth and diversification of other potential customers. The useful life of trade name is estimated based on the period in which a benefit could be ascribed to the White Electronic trade name.
Assumptions used in forecasting cash flows for each of the identified intangible assets included consideration of the following:
| • | Historical performance including sales and profitability. |
| • | Business prospects and industry expectations. |
| • | Estimated economic life of asset. |
| • | Development of new technologies. |
| • | Acquisition of new customers. |
| • | Attrition of existing customers. |
| • | Obsolescence of technology over time. |
The factors that contributed to a purchase price resulting in the recognition of goodwill include:
| • | The premium paid over the pre-merger announcement market capitalization of White Electronic. |
| • | Our belief that the merger will create a more diverse semiconductor company with expansive offerings which will enable us to expand our product offerings. |
| • | Our belief that we are each committed to improving cost structures and that our combined efforts after the merger should result in a realization of cost savings and an improvement of overall efficiencies. |
In the fourth quarter of 2010, we acquired substantially all the assets of VT Silicon, a designer and manufacturer of multi-band radio frequency integrated circuit (“RFIC”) solutions for the mobile wireless broadband market and all the shares of Arxan Defense Systems, Inc., a leading provider of anti-tamper solutions, providing full-service support to defense clients in securing systems against tampering, piracy and reverse engineering.
The following pro forma data summarizes the results of operations for the fiscal years ended October 3, 2010 and September 27, 2009, as if the 2010 acquisitions had occurred on September 28, 2009 and
78
Table of Contents
MICROSEMI CORPORATION AND SUBSIDIARIES
NOTES TO CONSOLIDATED FINANCIAL STATEMENTS—(Continued)
September 29, 2008. The pro forma information presented is for illustrative purposes only and is not necessarily indicative of the financial position or results of operations that would have been realized if the transaction had been completed on the dates indicated, nor is it indicative of future operating results or financial position. The pro forma adjustments are based upon currently available information and certain assumptions that Microsemi believes are reasonable under the circumstances.
The unaudited pro-forma data reports actual operating results, adjusted to include the pro-forma effect of, among others, amortization expense of identified intangible assets, changes in stock compensation expense, foregone interest income and the related tax effect of these items (amounts in thousands, except per share data):
| Fiscal Year Ended | ||||||||
| October 3, 2010 |
September 27, 2009 |
|||||||
| Net sales |
$ | 549,234 | $ | 520,682 | ||||
| Net income (loss) |
$ | 32,862 | $ | (34,099 | ) | |||
| Net income (loss) per share |
||||||||
| Basic |
$ | 0.41 | $ | (0.42 | ) | |||
| Diluted |
$ | 0.40 | $ | (0.42 | ) | |||
| 15. | UNAUDITED SELECTED QUARTERLY FINANCIAL DATA |
Selected quarterly financial data are as follows (amounts in thousands, except earnings per share):
| Quarters ended in fiscal year 2010 | ||||||||||||||||
| October 3, 2010 |
June 27, 2010 |
March 28, 2010 |
December 27, 2009 |
|||||||||||||
| Net sales |
$ | 151,201 | $ | 136,017 | $ | 118,218 | $ | 112,832 | ||||||||
| Gross profit |
$ | 74,170 | $ | 65,772 | $ | 56,001 | $ | 52,268 | ||||||||
| Net income |
$ | 6,560 | $ | 33,032 | $ | 11,486 | $ | 7,960 | ||||||||
| Basic earnings per share |
$ | 0.08 | $ | 0.40 | $ | 0.14 | $ | 0.10 | ||||||||
| Diluted earnings per share |
$ | 0.08 | $ | 0.40 | $ | 0.14 | $ | 0.10 | ||||||||
| Quarters ended in fiscal year 2009 | ||||||||||||||||
| September 27, 2009 |
June 28, 2009 |
March 29, 2009 |
December 28, 2008 |
|||||||||||||
| Net sales |
$ | 109,678 | $ | 107,007 | $ | 105,693 | $ | 130,594 | ||||||||
| Gross profit |
$ | 42,093 | $ | 45,169 | $ | 32,712 | $ | 60,433 | ||||||||
| Net income (loss) |
$ | (31,261 | ) | $ | 7,842 | $ | (16,612 | ) | $ | 13,208 | ||||||
| Basic earnings (loss) per share |
$ | (0.39 | ) | $ | 0.10 | $ | (0.21 | ) | $ | 0.17 | ||||||
| Diluted earnings (loss) per share |
$ | (0.39 | ) | $ | 0.10 | $ | (0.21 | ) | $ | 0.16 | ||||||
| 16. | SUBSEQUENT EVENTS |
Credit Agreement
On November 2, 2010, we entered into a Credit Agreement with Morgan Stanley Senior Funding, Inc. (“MSSF”), Morgan Stanley & Co. Incorporated, East West Bank, Raymond James Bank, FSB and the lenders referred to therein (the “Credit Agreement”). Pursuant to the Credit Agreement, MSSF has provided $425,000,000 senior secured first lien credit facilities (the “Facilities”), consisting of a term loan facility in an aggregate principal amount of $375,000,000 and a revolving credit facility (the “Revolving Facility”) in an
79
Table of Contents
MICROSEMI CORPORATION AND SUBSIDIARIES
NOTES TO CONSOLIDATED FINANCIAL STATEMENTS—(Continued)
aggregate principal amount of $50,000,000. The Facilities financed the acquisition of Actel Corporation and fees and expenses related thereto. The Revolving Facility is also available for working capital requirements and other general corporate purposes. In connection with entering into the Credit Agreement, we terminated our existing Revolving Credit Facility with Bank of America, N.A.
We can request, at any time and from time to time, the establishment of one or more incremental term loans and/or revolving credit facilities with commitments in an aggregate amount not to exceed $100,000,000, the proceeds of which can be used for working capital requirements and other general corporate purposes. MSSF will act as sole bookrunner, sole lead arranger and administrative agent.
Interest under the Facilities are, at our option, Base Rate (as defined below) or LIBOR, plus a margin ranging from 2.00% to 3.00% for Base Rate-based loans that are either term loans or revolving loans and ranging from 3.00% to 4.00% for LIBOR-based loans that are either term loans or revolving loans, depending on our consolidated leverage ratio. The “Base Rate” for term loans is equal to 2.5% per annum and for revolving loans is a fluctuating interest rate per annum equal to the highest of (a) the prime rate, (b) 1/2 of 1% per annum above the federal funds effective rate and (c) one-month LIBOR plus 1%. Interest for Base Rate-based loans is calculated on the basis of a 365-day year and interest for LIBOR-based loans is calculated on the basis of a 360-day year.
We paid upfront fees or original issue discount equal to 1.00% of the aggregate principal amount of the loans on the initial funding date and commitment fees equal to 2.00% of the initial term loan and revolving loan commitments. Additionally, we expect to pay an undrawn commitment fee ranging from 0.25% to 0.75% depending on our consolidated leverage ratio, on the unused portion of the Revolving Facility. In connection with letters of credit issued under the Facilities, we are required to pay a fronting fee equal to 0.25% per annum of the aggregate face amount of each letter of credit and a participation fee on all outstanding letters of credit at a per annum rate equal to the margin then in effect with respect to LIBOR-based loans under the Revolving Facility on the face amount of such letter of credit.
Subject to certain customary exceptions, all of our obligations under the Facilities are unconditionally guaranteed by each of our existing and subsequently acquired or organized direct and indirect wholly-owned domestic subsidiaries whose assets or revenues exceed 5%, as the case may be, of the consolidated assets or revenues (the “Guarantors”). Other domestic subsidiaries will be required to become a Guarantor to the extent that domestic subsidiaries excluded from such guarantee obligation represent more than 15%, as the case may be, of the consolidated assets or revenues.
The Facilities are subject to certain representations and warranties, certain affirmative covenants, certain negative covenants, certain financial covenants, certain conditions and events of default that are customarily required for similar financings.
Acquisition
On October 2, 2010, we entered into an Agreement and Plan of Merger by and among Artful Acquisition Corp., a California corporation and a wholly owned subsidiary of Microsemi (“Purchaser”), and Actel Corporation, a California corporation (“Actel”), pursuant to which, and on the terms and subject to the conditions thereof, Purchaser commenced a cash tender offer (the “Offer”) on October 4, 2010 to purchase all of the outstanding shares of Actel’s common stock, par value $0.001 per share, together with the associated preferred stock purchase rights issued in connection with and subject to the Preferred Stock Rights Agreement dated as of October 17, 2003, between Actel and Wells Fargo Bank, N.A., as amended (such rights together with the shares
80
Table of Contents
MICROSEMI CORPORATION AND SUBSIDIARIES
NOTES TO CONSOLIDATED FINANCIAL STATEMENTS—(Continued)
of common stock, the “Shares”), or such reduced amount of Shares as described therein, at a purchase price of $20.88 per Share, net to the tendering shareholder in cash, without interest and less any required withholding taxes (the “Per Share Amount”).
At 12:00 midnight, New York City time, on November 1, 2010, the Offer expired. Based on information provided by Wells Fargo Bank, N.A., the depositary for the Offer, a total of 23,099,124 Shares (excluding Shares tendered by notice of guaranteed delivery), representing approximately 87.9% of the outstanding Shares, were validly tendered and not withdrawn as of the expiration of the Offer. On November 2, 2010, Purchaser accepted for payment all Shares validly tendered and not withdrawn prior to the expiration of the Offer. Based on the Per Share Amount and the number of Shares validly tendered and accepted for payment (including approximately 860,000 Shares tendered by notice of guaranteed delivery) at the expiration of the Offer, as of November 2, 2010, the value of the Shares purchased by Purchaser in connection with the Offer was approximately $500 million. Microsemi has funded the purchase of the tendered Shares from cash on hand and from the Credit Agreement.
On November 2, 2010, Purchaser exercised its option to purchase Shares pursuant to the terms and conditions of the Merger Agreement (the “Top-Up Option”), to acquire 7,000,000 newly issued Shares at a purchase price per Share equal to the Per Share Amount. As a result, Purchaser then owned more than 90% of the outstanding Shares (excluding Shares tendered by notice of guaranteed delivery and not yet delivered).
On November 2, 2010, pursuant to the terms and conditions of the Merger Agreement, Purchaser was merged with and into Actel with Actel continuing as the surviving corporation and as a wholly owned subsidiary of Microsemi. At the effective time of the Merger, each Share outstanding (other than Shares owned by Actel, Microsemi, Purchaser, or any direct or indirect wholly owned subsidiary of Microsemi or Actel, or held by shareholders who properly demand and perfect dissenters’ rights under California law) was converted into the right to receive the Per Share Amount.
81
Table of Contents
MICROSEMI CORPORATION AND SUBSIDIARIES
SCHEDULE II—VALUATION AND QUALIFYING ACCOUNTS
(amounts in thousands)
| Column A |
Column B | Column C | Column D | Column E | Column F | |||||||||||||||
| Classification |
Balance at beginning of period |
Charged to costs and expenses |
Charged to other accounts |
Deductions- recoveries and write-offs |
Balance at end of period |
|||||||||||||||
| Allowance for doubtful accounts |
||||||||||||||||||||
| September 28, 2008 |
$ | 1,424 | $ | 307 | $ | — | $ | — | $ | 1,731 | ||||||||||
| September 27, 2009 |
$ | 1,731 | $ | 712 | $ | — | $ | (141 | ) | $ | 2,302 | |||||||||
| October 3, 2010 |
$ | 2,302 | $ | 425 | $ | — | $ | (749 | ) | $ | 1,978 | |||||||||
| Tax valuation allowance |
||||||||||||||||||||
| September 28, 2008 |
$ | 10,160 | $ | 3,671 | $ | — | $ | — | $ | 13,831 | ||||||||||
| September 27, 2009 |
$ | 13,831 | $ | 39,389 | $ | — | $ | — | $ | 53,220 | ||||||||||
| October 3, 2010 |
$ | 53,220 | $ | (15,616 | ) | $ | — | $ | — | $ | 37,604 | |||||||||
| ITEM 9. | CHANGES IN AND DISAGREEMENTS WITH ACCOUNTANTS ON ACCOUNTING AND FINANCIAL DISCLOSURE. |
None
| ITEM 9A. | CONTROLS AND PROCEDURES. |
(a) Evaluation of disclosure controls and procedures.
As of October 3, 2010, under the supervision and with the participation of the Company’s management, including the Company’s Chief Executive Officer and Chief Financial Officer, the Company carried out an evaluation of the effectiveness of the design and operation of the Company’s disclosure controls and procedures as defined in Exchange Act Rules 13a-15(e) and 15d-15(e). These disclosure controls and procedures are designed to ensure that the information required to be disclosed by the Company in the reports that it files or submits under the Exchange Act is recorded, processed, summarized and reported within the time periods specified by the SEC’s rules and forms, and that the information is accumulated and communicated to the Company’s management, including the Chief Executive Officer and Chief Financial Officer, as appropriate to allow timely decisions regarding required disclosure.
Based upon their evaluation, the Chief Executive Officer and Chief Financial Officer concluded that the Company’s disclosure controls and procedures were effective as of October 3, 2010.
(b) Changes in internal control over financial reporting.
There have been no changes in the Company’s internal control over financial reporting during the fiscal quarter ended October 3, 2010 that have materially affected, or are reasonably likely to materially affect, the Company’s internal control over financial reporting.
(c) Management’s Report on Internal Control over Financial Reporting
Management is responsible for establishing and maintaining adequate internal control over financial reporting. The Company maintains internal control over financial reporting designed to provide reasonable assurance regarding the reliability of financial reporting and the preparation of financial statements for external purposes in accordance with generally accepted accounting principles.
82
Table of Contents
Because of its inherent limitations, internal control over financial reporting may not prevent or detect misstatements. Also, projections of any evaluation of effectiveness to future periods are subject to the risks that controls may become inadequate because of changes in conditions or that the degree of compliance with the policies or procedures may deteriorate.
Under the supervision and with the participation of management, including the Company’s Chief Executive Officer and Chief Financial Officer, the Company conducted an evaluation of the effectiveness of its internal control over financial reporting as defined in Exchange Act Rules 13a-15(f) and 15d-15(f) based on the framework in Internal Control – Integrated Framework issued by the Committee of Sponsoring Organizations of the Treadway Commission. This evaluation included an assessment of the design of the Company’s internal control over financial reporting and testing of the operational effectiveness of its internal control over financial reporting. Based on the Company’s evaluation, management concluded that the Company’s internal control over financial reporting was effective as of October 3, 2010.
Management excluded White Electronic Designs Corporation from our assessment of internal control over financial reporting as of October 3, 2010 because it was acquired in a purchase business combination during the year ended October 3, 2010. The total assets and total revenues excluded represented approximately 5% of the related consolidated financial statement amounts as of and for the year ended October 3, 2010.
PricewaterhouseCoopers LLP, the Company’s independent registered public accounting firm that audited the consolidated financial statements included in this Form 10-K, has audited the effectiveness of the Company’s internal control over financial reporting, as stated within their report which appears herein.
| ITEM 9B. OTHER | INFORMATION |
On November 2, 2010, Microsemi entered into a credit agreement with Morgan Stanley Senior Funding, Inc., Morgan Stanley & Co. Incorporated, East West Bank, Raymond James Bank, FSB and the lenders referred to therein (the “Credit Agreement”), which consisted of a term loan facility in an aggregate principal amount of $375 million and a revolving credit facility in an aggregate principal amount of $50 million. The Credit Agreement replaced a credit agreement dated October 5, 2009 with Bank of America, N.A., which provided for a revolving line of credit of up to $50 million (the “Revolving Credit Facility”). The material terms of the Revolving Credit Facility are described in Note 13 of the notes to the consolidated financial statements included in this Annual Report on Form 10-K, which description is incorporated herein by reference. The Revolving Credit Facility, which was scheduled to mature on October 5, 2012, was terminated on November 2, 2010, except for certain indemnity provisions in the Revolving Credit Facility, which by their terms expressly survive termination of the agreement.
83
Table of Contents
Except to the extent set forth below, Items 10, 11, 12, 13 and 14 are omitted since the Company intends to file a definitive proxy statement with the Securities and Exchange Commission pursuant to Regulation 14A within 120 days after the Company’s fiscal year ended October 3, 2010. The information required by those items will be set forth in that definitive proxy statement and such information is hereby incorporated by reference into such respective items in this Form 10-K.
| ITEM 10. | DIRECTORS, EXECUTIVE OFFICERS AND CORPORATE GOVERNANCE |
The information required by this item is incorporated by reference from the Company’s Proxy Statement for the 2011 Annual Meeting of Stockholders under the headings “Election of Directors,” “Executive Officers,” “Corporate Governance, Board Meetings and Committees,” and “Section 16(a) Beneficial Ownership Reporting Compliance.”
| ITEM 11. | EXECUTIVE COMPENSATION |
The information required by this item is incorporated by reference from the Company’s Proxy Statement for the 2011 Annual Meeting of Stockholders under the headings “Executive Compensation” and “Director Compensation,” “Compensation Committee Interlocks and Insider Participation,” and “Report of the Compensation Committee.”
| ITEM 12. | SECURITY OWNERSHIP OF CERTAIN BENEFICIAL OWNERS AND MANAGEMENT AND RELATED STOCKHOLDER MATTERS. |
The information required by this item is incorporated by reference from the Company’s Proxy Statement for the 2011 Annual Meeting of Stockholders under the heading “Security Ownership of Certain Beneficial Owners and Management” and “Equity Compensation Plan Information.”
| ITEM 13. | CERTAIN RELATIONSHIPS AND RELATED TRANSACTIONS, AND DIRECTOR INDEPENDENCE |
The information required by this item is incorporated by reference from the Company’s Proxy Statement for the 2011 Annual Meeting of Stockholders under the heading “Corporate Governance, Board Meetings and Committees” and “Transactions with Related Persons.”
| ITEM 14. | PRINCIPAL ACCOUNTANT FEES AND SERVICES. |
The information required by this item is incorporated by reference from the Company’s Proxy Statement for the 2011 Annual Meeting of Stockholders under the heading “Audit Matters.”
84
Table of Contents
| ITEM 15. | EXHIBITS AND FINANCIAL STATEMENT SCHEDULES |
| (a) | 1. | Financial | Statements. See Index under Item 8. |
| 2. | Financial Statement Schedule. See Index under Item 8. |
| (b) | Exhibits |
The exhibits to this report are listed in the Exhibit Index
| (c) | Financial statements of unconsolidated affiliates. |
None
85
Table of Contents
SIGNATURES
Pursuant to the requirements of Section 13 or 15(d) of the Securities Exchange Act of 1934, the Registrant has duly caused this report to be signed on its behalf by the undersigned, thereunto duly authorized.
| MICROSEMI CORPORATION | ||
| By |
/S/ JOHN W. HOHENER | |
| John W. Hohener | ||
| Executive Vice President, Chief Financial Officer, Secretary and Treasurer (Principal Financial and Accounting Officer and duly authorized to sign on behalf of the Registrant) | ||
Dated: November 23, 2010
86
Table of Contents
POWER OF ATTORNEY
The undersigned hereby constitutes and appoints James J. Peterson and John W. Hohener, or either of them, his true and lawful attorney-in-fact and agent, with full power of substitution and re-substitution, to sign the report on Form 10-K and any or all amendments thereto and to file the same, with all exhibits thereto, and other documents in connection therewith, with the Securities and Exchange Commission, hereby ratifying and confirming all that said attorney-in-fact, or his substitute or substitutes, may do or cause to be done by virtue hereof in any and all capacities.
Pursuant to the requirements of Securities Exchange Act of 1934, this report has been signed by the following persons on behalf of the Registrant and in the capacities and on the dates indicated.
| Signature |
Title |
Date | ||
| /s/ DENNIS R. LEIBEL Dennis R. Leibel |
Chairman of the Board |
November 23, 2010 | ||
| /s/ JAMES J. PETERSON James J. Peterson |
President, Chief Executive Officer and Director (Principal Executive Officer) |
November 23, 2010 | ||
| /s/ JOHN W. HOHENER John W. Hohener |
Executive Vice President, Chief Financial Officer, Secretary and Treasurer (Principal Financial and Accounting Officer) |
November 23, 2010 | ||
| /s/ WILLIAM E. BENDUSH William E. Bendush |
Director |
November 23, 2010 | ||
| /s/ WILLIAM L. HEALEY William L. Healey |
Director |
November 23, 2010 | ||
| /s/ MATTHEW E. MASSENGILL Matthew E. Massengill |
Director |
November 23, 2010 | ||
| /s/ THOMAS R. ANDERSON Thomas R. Anderson |
Director |
November 23, 2010 | ||
| /s/ PAUL F. FOLINO Paul F. Folino |
Director |
November 23, 2010 | ||
87
Table of Contents
EXHIBIT INDEX
| Exhibit |
Description | |||
| 2.1 | Agreement and Plan of Merger dated as of November 2, 2005 by and among Microsemi Corporation, APT Acquisition Corp. and Advanced Power Technology, Inc., including the following exhibits: | |||
| Form of Voting Agreement | ||||
| Form of Non-Competition Agreement | ||||
| Form of Lock-up Agreement | ||||
| Form of Option Assumption Agreement | ||||
| Exhibits omitted but to be made available to the SEC at the SEC’s request: | ||||
| Form of Employment Agreement | ||||
| Form of Certificate of Merger | ||||
| List of Parties to Ancillary Agreements(12) | ||||
| 2.1.1 | Amendment No. 1 to Agreement and Plan of Merger dated April 25, 2006(17) | |||
| 2.2 | Agreement and Plan of Merger dated October 24, 2006 by and among Microsemi Corporation, PowerDsine Ltd. and Pinnacle Acquisition Ltd.(19) | |||
| 2.3 | Agreement and Plan of Merger, dated October 2, 2010, by and among Microsemi Corporation, Artful Acquisition Corp. and Actel Corporation(29) | |||
| 3.1 | Amended and Restated Certificate of Incorporation of Microsemi Corporation(4)* | |||
| 3.2 | Certificate of Designation of Series A Junior Participating Preferred Stock(3) | |||
| 3.2.1 | Certificate of Amendment to Certificate of Designation of Series A Junior Participating Preferred Stock(13) | |||
| 3.3 | Amended and Restated Bylaws of Microsemi Corporation(23)* | |||
| 4.1 | Rights Agreement dated December 22, 2000 between Microsemi Corporation and Mellon Investor Services, as Rights Agent, and the exhibits thereto(3) | |||
| 4.1.1 | Amendment No. 1 dated December 16, 2005 to Rights Agreement dated December 22, 2000 between Microsemi Corporation and Mellon Investor Services, LLC, as Rights Agent, and the exhibits thereto(13) | |||
| 4.2 | Specimen certificate for the shares of common stock of Microsemi Corporation(13) | |||
| 10.1 | Advanced Power Technology, Inc. Stock Option Plan dated December 31, 1995, as amended by Amendments Nos. 1 and 2(2)* | |||
| 10.1.1 | Amendments Nos. 3, 4 and 5 to Advanced Power Technology Stock Option Plan dated December 31, 1995, as amended(8)* | |||
| 10.1.2 | Form of Non-Qualified Stock Option Letter Agreement under the Advanced Power Technology, Inc. Stock Option Plan dated December 31, 1995(18)* | |||
| 10.1.3 | Form of Incentive Stock Option Letter Agreement under the Advanced Power Technology, Inc. Stock Option Plan dated December 31, 1995(18)* | |||
| 10.2 | Advanced Power Technology, Inc. Equity Incentive Plan dated May 3, 2005(9)* | |||
| 10.2.1 | Form of Incentive Stock Option Letter Agreement under the Advanced Power Technology, Inc. Equity Incentive Plan dated May 3, 2005(18)* | |||
| 10.3 | Form of Option Assumption Agreement, entered into between Microsemi Corporation and each of the holders of Advanced Power Technology, Inc. options assumed by Microsemi Corporation(18)* | |||
| 10.4 | Microsemi Corporation 1987 Stock Plan, and amendments thereto(10)* | |||
88
Table of Contents
| Exhibit |
Description | |||
| 10.4.1 | Form of Employee Stock Option Agreement prior to August 17, 2004(7)* | |||
| 10.4.2 | Form of Employee Stock Option Agreement from and after August 17, 2004(7)* | |||
| 10.4.3 | Form of Employee Stock Option Agreement from and after September 26, 2005(11)* | |||
| 10.4.4 | Form of Employee Stock Option Agreement from and after February 22, 2006(14)* | |||
| 10.4.5 | Form of Employee Stock Option Agreement from and after March 28, 2006(16)* | |||
| 10.4.6 | Form of Non-Employee Stock Option Agreement prior to February 22, 2006(7)* | |||
| 10.4.7 | Form of Non-Employee Stock Option Agreement from and after February 22, 2006(14)* | |||
| 10.4.8 | Form of Stock Option Exchange Grant and Replacement Option Agreement(5)* | |||
| 10.4.9 | Form of Amendment of Eligible Unvested Options(10)* | |||
| 10.4.10 | Form of Notice of Restricted Stock Award and Restricted Stock Agreement(20)* | |||
| 10.4.11 | Form of Notice of Restricted Stock Award and Employee Restricted Stock Agreement(21)* | |||
| 10.4.12 | Form of Notice of Restricted Stock Award and Non-Employee Restricted Stock Agreement(21)* | |||
| 10.4.13 | Summary of Automatic Annual Additions under 1987 Stock Plan(20)* | |||
| 10.5 | Microsemi Corporation 2008 Performance Incentive Plan(22)* | |||
| 10.5.1 | Form of Notice of Grant of Restricted Stock Award under Terms and Conditions of 2008 Performance Incentive Plan(25)* | |||
| 10.5.2 | Form of Notice of Grant of Stock Option under Terms and Conditions of 2008 Performance Incentive Plan(25)* | |||
| 10.6 | Microsemi Corporation Cash Bonus Plan(25)* | |||
| 10.7 | Microsemi Corporation 2007 Executive Cash Bonus Plan(20)* | |||
| 10.8 | Agreement dated November 10, 2008 between James J. Peterson and Microsemi Corporation(25)* | |||
| 10.8.1 | Letter Agreement, dated January 28, 2009, between James J. Peterson and Microsemi Corporation Relating to Amendment of Restricted Stock Award Agreement(26)* | |||
| 10.8.2 | Executive Retention Agreement dated March 31, 2009 between James J. Peterson and Microsemi Corporation(27)* | |||
| 10.9 | Executive Retention Agreement dated March 31, 2009 between John W. Hohener and Microsemi Corporation (27)* | |||
| 10.10 | Form of Executive Retention Agreement for Named Executive Officers other than James J. Peterson and John W. Hohener(27)* | |||
| 10.11 | Supplemental Executive Retirement Plan(1)* | |||
| 10.12 | Supplemental Medical Plan(7)* | |||
| 10.13 | Summary of Compensation Arrangements for Named Executive Officers † | |||
| 10.14 | Directors’ Compensation Policy † | |||
| 10.15 | Board Member Retirement Process(6)* | |||
| 10.16 | Form of Officers and Directors Indemnification Agreement(23)* | |||
| 10.17 | Motorola-Microsemi PowerMite® Technology Agreement(14) | |||
| 10.18 | Credit Agreement, dated as of October 5, 2009 between Microsemi Corporation and Bank of America, N.A. (28) | |||
| 10.19 | Settlement Agreement dated July 8, 1998 by and between Microsemi Corp. - Colorado, FMC Corporation, Siemens Microelectronics, Inc. and Coors Porcelain Company(15) | |||
89
Table of Contents
| Exhibit |
Description | |||
| 10.20 | Credit Agreement, dated as of November 2, 2010, by and among Microsemi Corporation, Morgan Stanley Senior Funding, Inc., Morgan Stanley & Co. Incorporated, East West Bank, Raymond James Bank, FSB and the lenders referred to therein(30) | |||
| 21 | List of Subsidiaries† | |||
| 23 | Consent of Independent Registered Public Accounting Firm† | |||
| 24 | Power of Attorney (see signature page) | |||
| 31.1 | Certification of Chief Executive Officer Pursuant to Securities Exchange Act Rules 13a-14(a) and 15d-14(a) as Adopted Pursuant to Section 302 of the Sarbanes-Oxley Act of 2002, dated November 20, 2009† | |||
| 31.2 | Certification of Chief Financial Officer Pursuant to Securities Exchange Act Rules 13a-14(a) and 15d-14(a) as Adopted Pursuant to Section 302 of the Sarbanes-Oxley Act of 2002, dated November 20, 2009† | |||
| 32 | Certification of Chief Executive Officer and Chief Financial Officer pursuant to 18 U.S.C. Section 1350 as Adopted Pursuant to Section 906 of the Sarbanes-Oxley Act of 2002, dated November 20, 2009† | |||
| 101 | The following financial statements are from Microsemi Corporation’s Annual Report on Form 10-K for the fiscal year ended October 3, 2010, formatted in XBRL (eXtensible Business Reporting Language): (i) Consolidated Balance Sheets; (ii) Consolidated Income Statements; (iii) Consolidated Statements of Stockholders’ Equity; (iv) Consolidated Statements of Cash Flows; and (v) Notes to Consolidated Financial Statements, tagged as blocks of text.† | |||
| † | Filed with this report. |
| * | Management contract or compensatory plan or arrangement required to be filed as an exhibit pursuant to applicable rules of the Securities and Exchange Commission. |
| (1) | Incorporated by reference to the indicated Exhibit to the Registrant’s Quarterly Report on Form 10-Q (File No. 0-08866) as filed with the Commission on February 9, 1998. |
| (2) | Previously filed by Advanced Power Technology, Inc. (File No. 1-16047) on June 2, 2000 as Exhibit 10.1 to its Registration Statement on Form S-1 (Registration No. 333-38418) and incorporated herein by reference. |
| (3) | Incorporated by reference to the indicated Exhibit to the Registrant’s Registration Statement on Form 8-A12G (File No. 0-08866) as filed with the Commission on December 29, 2000. |
| (4) | Incorporated by reference to the indicated Exhibit to the Registrant’s Current Report on Form 8-K (File No. 0-08866) as filed with the Commission on August 29, 2001. |
| (5) | Incorporated by reference to Exhibit 99(D)(2) to the Registrant’s Tender Offer Statement on Schedule TO (File No. 005-20930) as filed on November 1, 2002. |
| (6) | Incorporated by reference to the indicated Exhibit to the Registrant’s Annual Report on Form 10-K (File No. 0-08866) as filed with the Commission on December 19, 2002. |
| (7) | Incorporated by reference to the indicated Exhibit to the Registrant’s Current Report on Form 8-K (File No. 0-08866) as filed with the Commission on September 24, 2004. |
| (8) | Previously filed by Advanced Power Technology, Inc. on March 8, 2005 as Exhibit 10.21 to its Annual Report on Form 10-K (File No. 1-16047) and incorporated herein by reference. |
| (9) | Previously filed by Advanced Power Technology, Inc. on May 6, 2005 as Exhibit 10.35 to its Current Report on Form 8-K (File No. 1-16047) and incorporated herein by reference. |
| (10) | Incorporated by reference to Exhibit 99(D)(1) to the Registrant’s Tender Offer Statement on Schedule TO (File No. 005-30432) as filed with the Commission on August 17, 2005. |
| (11) | Incorporated by reference to the indicated Exhibit to the Registrant’s Current Report on Form 8-K (File No. 0-08866) as filed with the Commission on September 28, 2005. |
90
Table of Contents
| (12) | Incorporated by reference to the indicated Exhibit to the Registrant’s Current Report on Form 8-K (File No. 0-08866) as filed with the Commission on November 7, 2005. |
| (13) | Incorporated by reference to the indicated Exhibit to the Registrant’s Annual Report on Form 10-K (File No. 0-08866) as filed with the Commission on December 16, 2005. |
| (14) | Incorporated by reference to the indicated Exhibit to the Registrant’s Current Report on Form 8-K (File No. 0-08866) as filed with the Commission on February 28, 2006. |
| (15) | Incorporated by reference to the indicated Exhibit to the Registrant’s Pre-Effective Amendment No. 2 to Form S-4 (Reg. No. 333-130655) as filed with the Commission on March 3, 2006. |
| (16) | Incorporated by reference to the indicated Exhibit to the Registrant’s Current Report on Form 8-K (File No. 0-08866) as filed with the Commission on April 3, 2006. |
| (17) | Incorporated by reference to the indicated Exhibit to the Registrant’s Post-Effective Amendment No. 1 to Form S-4 (Reg. No. 333-130655) as filed with the Commission on April 27, 2006. |
| (18) | Incorporated by reference to the indicated Exhibit to the Registrant’s Post-Effective Amendment No. 2 to Form S-4 on Form S-8 (Reg. No. 333-135678) as filed with the Commission on July 10, 2006. |
| (19) | Incorporated by reference to the indicated Exhibit to the Registrant’s Current Report on Form 8-K (File No. 0-08866) as filed with the Commission on October 30, 2006. |
| (20) | Incorporated by reference to the indicated Exhibit to the Registrant’s Current Report on Form 8-K (File No. 0-08866) as filed with the Commission on April 4, 2007. |
| (21) | Incorporated by reference to the indicated Exhibit to the Registrant’s Current Report on Form 8-K (File No. 0-08866) as filed with the Commission on October 3, 2007. |
| (22) | Incorporated by reference to Appendix B to the Registrant’s Definitive Proxy Statement on Schedule 14A as filed with the Commission on January 18, 2008. |
| (23) | Incorporated by reference to the indicated Exhibit to the Registrant’s Current Report on Form 8-K (File No. 0-08866) as filed with the Commission on September 3, 2008. |
| (24) | Incorporated by reference to the indicated Exhibit to the Registrant’s Current Report on Form 8-K (File No. 0-08866) as filed with the Commission on November 13, 2008. |
| (25) | Incorporated by reference to the indicated Exhibit to the Registrant’s Annual Report on Form 10-K (File No. 0-08866) as filed with the Commission on November 21, 2008. |
| (26) | Incorporated by reference to the indicated Exhibit to the Registrant’s Quarterly Report on Form 10-Q (File No. 0-08866) as filed with the Commission on April 30, 2009. |
| (27) | Incorporated by reference to the indicated Exhibit to the Registrant’s Quarterly Report on Form 10-Q (File No. 0-08866) as filed with the Commission on July 30, 2009. |
| (28) | Incorporated by reference to the indicated Exhibit to the Registrant’s Current Report on Form 8-K (File No. 0-08866) as filed with the Commission on October 7, 2009. |
| (29) | Incorporated by reference to the indicated Exhibit to the Registrant’s Current Report on Form 8-K (File No. 0-08866) as filed with the Commission on October 4, 2010. |
| (30) | Incorporated by reference to the indicated Exhibit to the Registrant’s Current Report on Form 8-K (File No. 0-08866) as filed with the Commission on November 5, 2010. |
91