Attached files
| file | filename |
|---|---|
| 8-K - STERLING FINANCIAL CORPORATION 8-K - STERLING FINANCIAL CORP /WA/ | a6505923.htm |
Exhibit 99.1

Investor Update Third Quarter 2010 Results November 11, 2010 Ticker: STSA Spokane, Washington STERLING Financial Corporation
Safe Harbor (1) The Reform Act defines the term "forward-looking statements" to include: statements of management plans and objectives, statements regarding the future economic performance, and projections of revenues and other financial data, among others. The Reform Act precludes liability for oral or written forward-looking statements if the statement is identified as such and accompanied by "meaningful cautionary statements identifying important factors that could cause actual results to differ materially from those made in the forward-looking statements." In the course of our presentation, we may discuss matters that are deemed to be forward-looking statements, which are intended to be covered by the safe harbor for “forward-looking statements” provided by the Private Securities Litigation Reform Act of 1995 (the “Reform Act”)(1). Forward-looking statements, including those relating to our position and strategy as a result of our recapitalization transactions discussed herein, involve substantial risks and uncertainties, many of which are difficult to predict and are generally beyond our control and actual results may differ from management’s view and our projected financial results. For example, our strategy of acquiring troubled institutions in FDIC-assisted transactions is subject to the risk that we remain not qualified to bid or are otherwise prohibited by regulators from bidding. We assume no obligation to update any forward-looking statements (including any projections) to reflect any changes or events occurring after the date hereof. Additional information about risks of the company achieving results suggested by any forward-looking statements may be found in the Company’s 10-K, 10-Q and other SEC filings, including under the headings “Risk Factors” and “Management’s Discussion and Analysis of Financial Condition and Results of Operations.” This presentation contains certain Non-GAAP financial measures. Reconciliations to the comparable GAAP measures are set forth on page 10 2
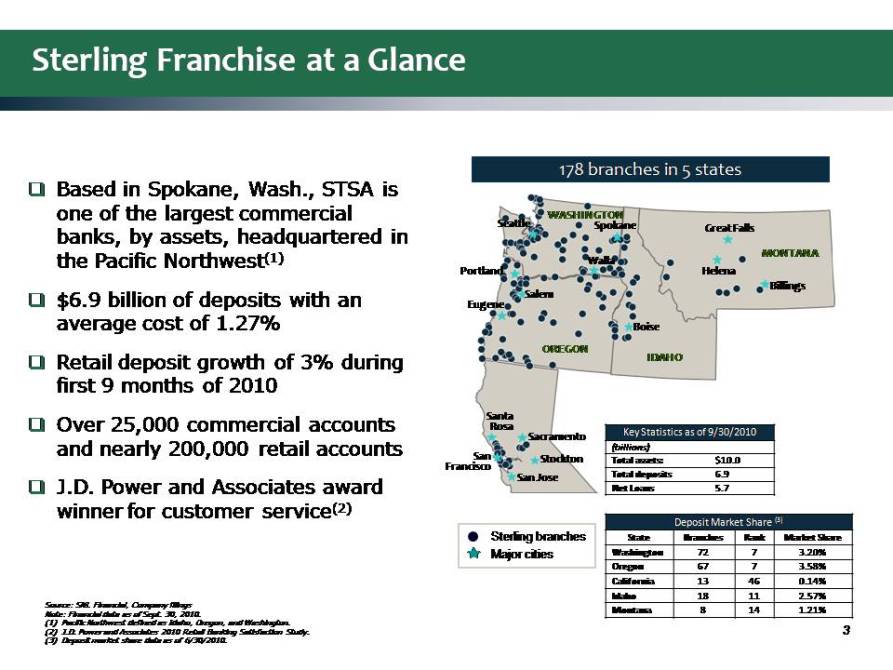
Based in Spokane, Wash., STSA is one of the largest commercial banks, by assets, headquartered in the Pacific Northwest (1) $6.9 billion of deposits with an average cost of 1.27% Retail deposit growth of 3% during first 9 months of 2010 Over 25,000 commercial accounts and nearly 200,000 retail accounts J.D. Power and Associates award winner for customer service (2) 178 branches in 5 states Source: SNL Financial, Company filings Note: Financial data as of Sept. 30, 2010. Pacific Northwest defined as Idaho, Oregon, and Washington. J.D. Power and Associates 2010 Retail Banking Satisfaction Study. Deposit market share data as of 6/30/2010. MONTANA IDAHO OREGON WASHINGTON San Jose San Francisco Stockton Sacramento Santa Rosa Eugene Salem Portland Seattle Spokane Walla Great Falls Helena Billings Boise (Gp:) Major cities (Gp:) Sterling branches Sterling Franchise at a Glance 3 Key Statistics as of 9/30/2010 (billions) Total assets: $10.0 Total deposits 6.9 J.D. Power and Associates award winner for customer service(2) Major cities Sterling branches Net Loans 5.7 Deposit Market Share (3) State Branches Rank Market Share Washington 72 7 3.20% Oregon 67 7 3.58% Source: SNL Financial, Company filings Note: Financial data as of Sept. 30, 2010. (1) Pacific Northwest defined as Idaho, Oregon, and Washington. (2) J.D. Power and Associates 2010 Retail Banking Satisfaction Study. (3) Deposit market share data as of 6/30/2010. California 13 46 0.14% Idaho 18 11 2.57% Montana 8 14 1.21%
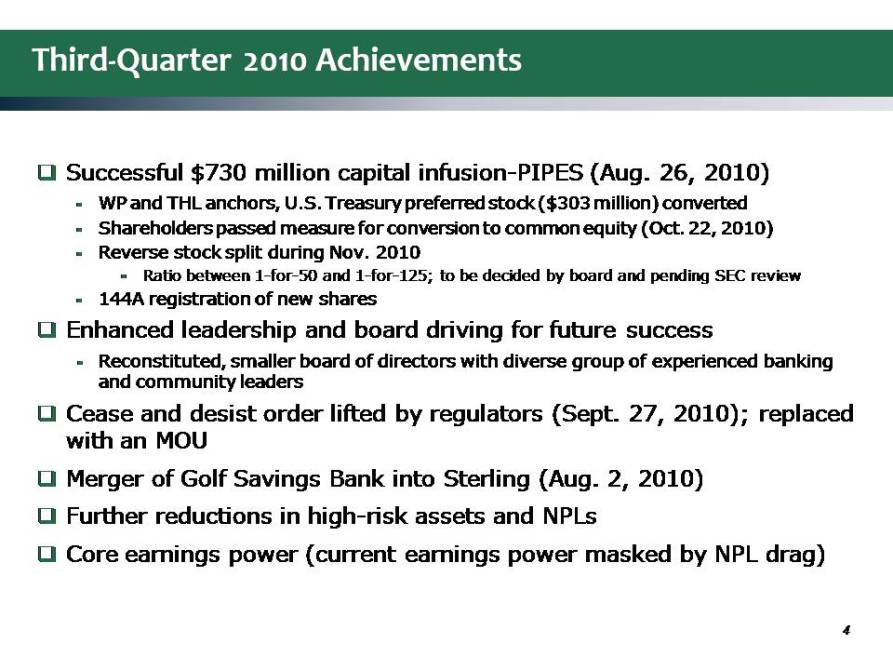
Third-Quarter 2010 Achievements Successful $730 million capital infusion-PIPES (Aug. 26, 2010) WP and THL anchors, U.S. Treasury preferred stock ($303 million) converted Shareholders passed measure for conversion to common equity (Oct. 22, 2010) Reverse stock split during Nov. 2010 Ratio between 1-for-50 and 1-for-125; to be decided by board and pending SEC review 144A registration of new shares Enhanced leadership and board driving for future success Reconstituted, smaller board of directors with diverse group of experienced banking and community leaders Cease and desist order lifted by regulators (Sept. 27, 2010); replaced with an MOU Merger of Golf Savings Bank into Sterling (Aug. 2, 2010) Further reductions in high-risk assets and NPLs Core earnings power (current earnings power masked by NPL drag) 4

Les Biller–Non-Executive Chairman Former vice chairman and chief operating officer of Wells Fargo & Co. David Coulter–Warburg Pincus Board Representative Former chairman and CEO of BankAmerica Corp. and former Vice Chairman of JP Morgan Chase & Co. Scott Jaeckel Thomas H. Lee Partners, LLC Board Representative Currently a director of Ceridian Corp., MoneyGram Intl., Sedgwick CMS Holdings and Warner Music Group Robert Donegan-President of Ivars, Inc. of Seattle, Wash. Former director at Golf Savings Bank Robert Hartheimer – Former FDIC division director, regulatory consultant and investment banker. President of Washington, D.C.-based Hartheimer LLC. Greg Seibly–President & CEO Former president of U.S. Bank California; Commercial Banking – Wells Fargo and Bank of America Ezra Eckhardt–Chief Operating Officer Former management at Honeywell and Microsoft Dan Byrne–Chief Financial Officer 27 years banking experience David DePillo– Chief Credit Officer Former vice chairman, president and COO of Commercial Capital Bancorp; credit and operating experience at H.F. Ahmanson; and former vice chairman of the Board of Fremont General Corporation 5 Corporate Governance and Management Enhanced with Additions of Key Banking and Community Leaders New Board Members Executive Management
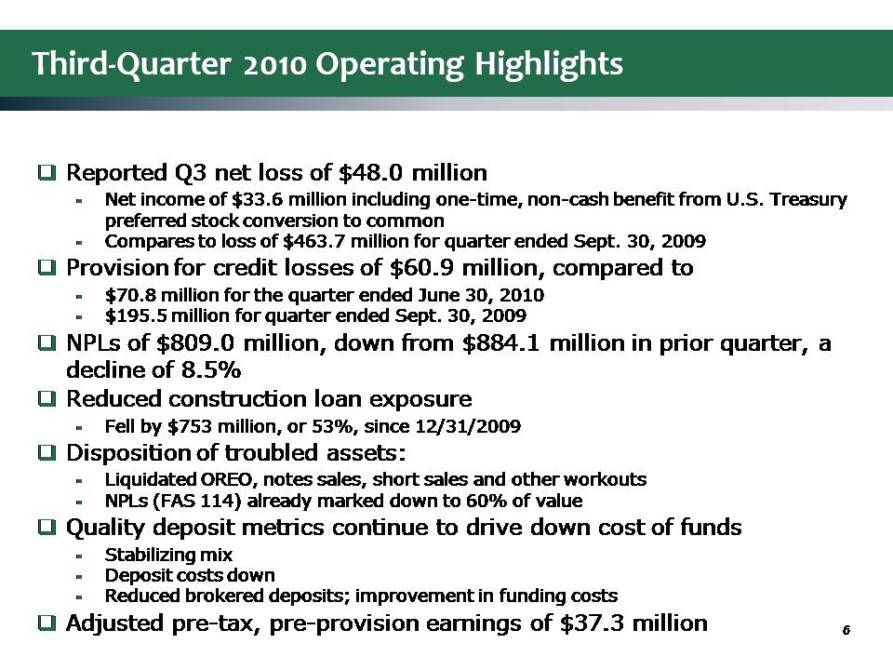
Third-Quarter 2010 Operating Highlights Reported Q3 net loss of $48.0 million Net income of $33.6 million including one-time, non-cash benefit from U.S. Treasury preferred stock conversion to common Compares to loss of $463.7 million for quarter ended Sept. 30, 2009 Provision for credit losses of $60.9 million, compared to $70.8 million for the quarter ended June 30, 2010 $195.5 million for quarter ended Sept. 30, 2009 NPLs of $809.0 million, down from $884.1 million in prior quarter, a decline of 8.5% Reduced construction loan exposure Fell by $753 million, or 53%, since 12/31/2009 Disposition of troubled assets: Liquidated OREO, notes sales, short sales and other workouts NPLs (FAS 114) already marked down to 60% of value Quality deposit metrics continue to drive down cost of funds Stabilizing mix Deposit costs down Reduced brokered deposits; improvement in funding costs Adjusted pre-tax, pre provision earnings of $37.3 million 6
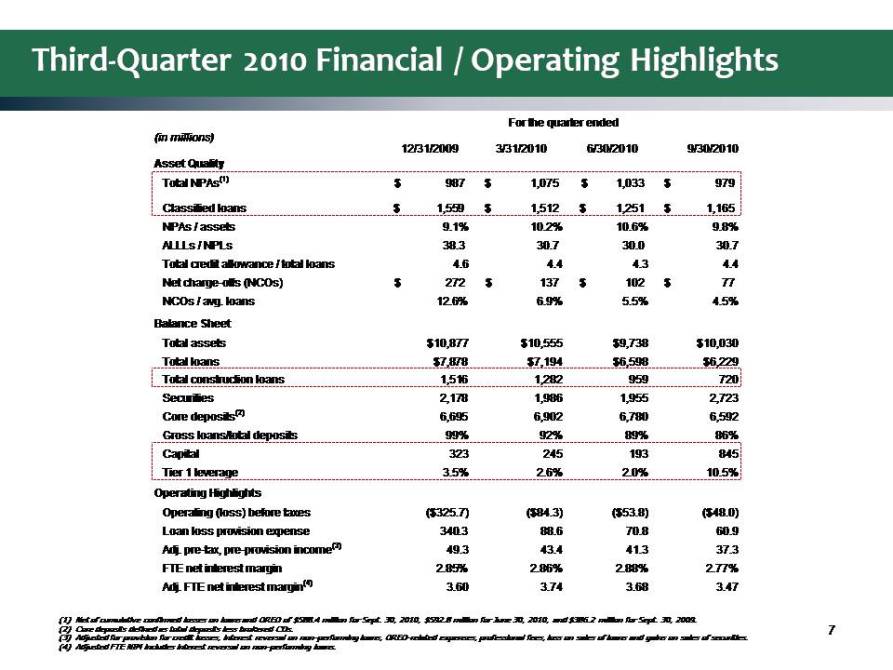
Third-Quarter 2010 Financial / Operating Highlights 7 (1) Net of cumulative confirmed losses on loans and OREO of $588.4 million for Sept. 30, 2010, $592.8 million for June 30, 2010, and $386.2 million for Sept. 30, 2009. (2) Core deposits defined as total deposits less brokered CDs. (3) Adjusted for provision for credit losses, interest reversal on non-performing loans, OREO related expenses, professional fees, loss on sales of loans and gains on sales of securities. (4) Adjusted FTE NIM includes interest reversal on non-performing loans. Third‐Quarter 2010 Financial / Operating Highlights (in millions) 12/31/2009 3/31/2010 6/30/2010 9/30/2010 Asset Quality Total NPAs (1) $987 $1,075 $1,033 $979 For the quarter ended Classified loans $1,559 $1,512 $1,251 $1,165 NPAs / assets 9.1% 10.2% 10.6% 9.8% ALLLs / NPLs 38.3 30.7 30.0 30.7 Total credit allowance / total loans 4.6 4.4 4.3 4.4 Net charge-offs (NCOs) $272 $137 $102 $77 NCOs / avg. loans 12.6% 6.9% 5.5% 4.5% Balance Sheet Total assets $10,877 $10,555 $9,738 $10,030 Total loans $7,878 $7,194 $6,598 $6,229 Total construction loans 1,516 1,282 959 720 Securities 2,178 1,986 1,955 2,723 Core deposits(2) 6,695 6,902 6,780 6,592 Gross loans/total deposits 99% 92% 89% 86% Capital 323 245 193 845 Tier 1 leverage 3.5% 2.6% 2.0% 10.5% Operating Highlights Operating (loss) before taxes ($325.7) ($84.3) ($53.8) ($48.0) Loan loss provision expense 340.3 88.6 70.8 60.9 Adj. pre-tax, pre-provision income(3) 49.3 43.4 41.3 37.3 FTE net interest margin 2.85% 2.86% 2.88% 2.77% 7 Adj. FTE net interest margin(4) 3.60 3.74 3.68 3.47
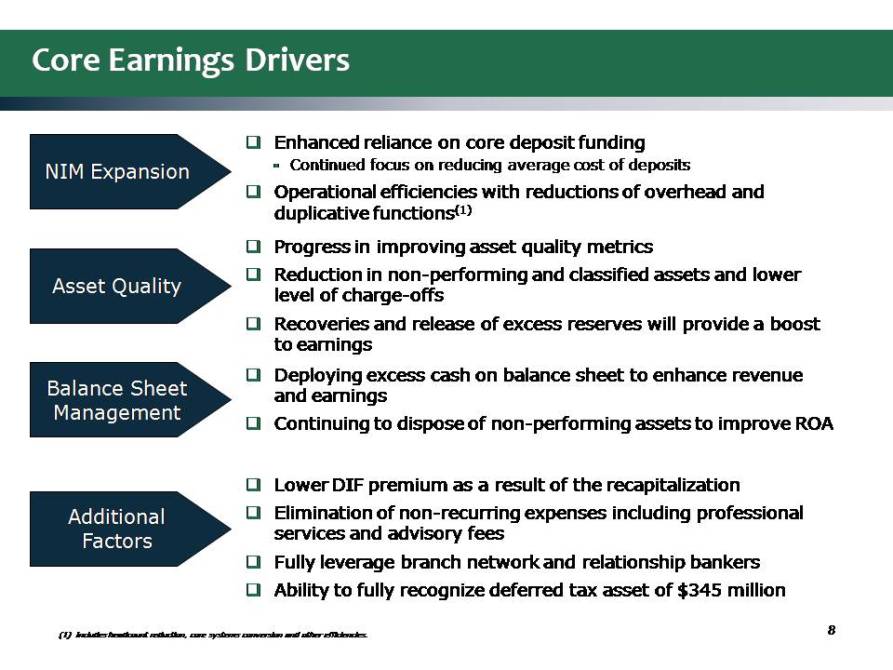
Core Earnings Drivers NIM Expansion Asset Quality Balance Sheet Management Additional Factors Enhanced reliance on core deposit funding Continued focus on reducing average cost of deposits Operational efficiencies with reductions of overhead and duplicative functions(1) (1 Includes headcount reduction, core systems conversion and other efficiencies. 8 Lower DIF premium as a result of the recapitalization Elimination of non-recurring expenses including professional services and advisory fees Fully leverage branch network and relationship bankers Ability to fully recognize deferred tax asset of $345 million Progress in improving asset quality metrics Reduction in non-performing and classified assets and lower level of charge offs Recoveries and release of excess reserves will provide a boost to earnings Deploying excess cash on balance sheet to enhance revenue and earnings Continuing to dispose of non performing assets to improve ROA
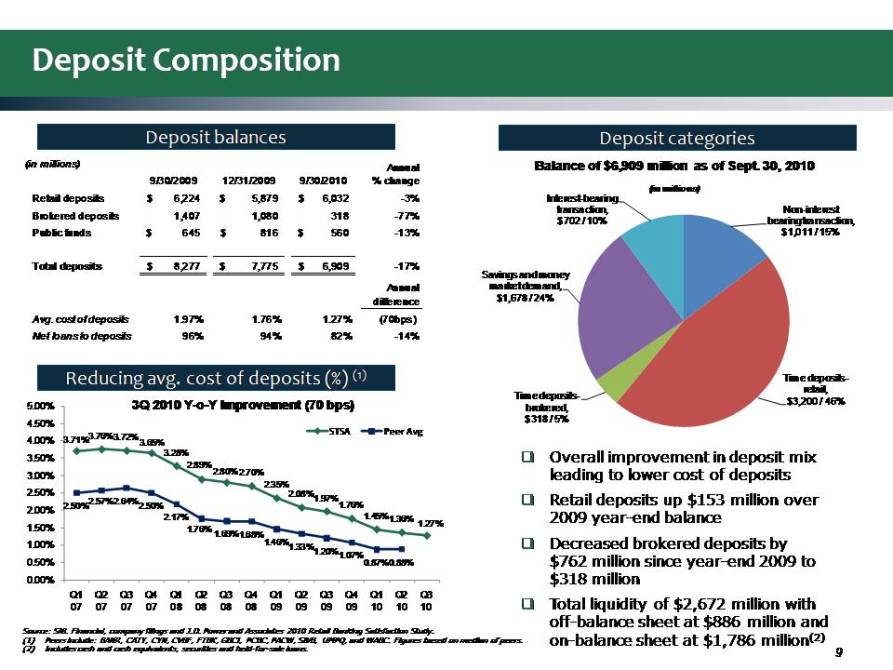
Balance of $6,909 million as of Sept. 30, 2010 (in millions) Deposit balances Deposit categories (in millions) 9/30/2009 12/31/2009 9/30/2010 Annual % change Non-interest bearing transaction, $1,011 / 15% Savings and money market demand Interest-bearing transaction, $702 / 10% Retail deposits $6 ,224 $5,879 $6,032 -3% Brokered deposits 1,407 1,080 318 -77% Public funds $645 $816 $560 -13% Total deposits $8,277 $7,775 $6,909 -17% Annual Time deposits marketdemand, $1,678 / 24% Reducing avg. cost of deposits (%) (1) difference Avg. cost of deposits 1.97% 1.76% 1.27% (70bps) Net loans to deposits 96% 94% 82% -14% Overall improvement in deposit mix of retail, Time deposits- $3,200 / 46% brokered, $318 / 5% 3.71%3.76%3.72%3.65% 3.28% 2.89% 3 00% 2.80%2.70% 3.50% 4.00% 4.50% 5.00% 3Q 2010 Y-o-Y Improvement (70 bps) STSA Peer Avg leading to lower cost deposits Retail deposits up $153 million over 2009 year-end balance Decreased brokered deposits by $762 million since year-end 2009 to $318 illi 2.35% 2.08%1.97% 1.76% 1.45%1.36% 1.27% 2.50%2.57%2.64%2.50% 2.17% 1.76% 1.69%1.68% 1.46%1.33%1.20%1.07% 0.50% 0.87%0.88% 1.00% 1.50% 2.00% 2.50% 3.00% 9 Source: SNL Financial, company filings and J.D. Power and Associates 2010 Retail Banking Satisfaction Study. (1) Peers include: BANR, CATY, CYN, CVBF, FTBK, GBCI, PCBC, PACW, SIVB, UMPQ, and WABC. Figures based on median of peers. (2) Includes cash and cash equivalents, securities and held-for-sale loans. Million Total liquidity of $2,672 million with off-balance sheet at $886 million and on-balance sheet at $1,786 million(2) 0.00% Q1 07 Q2 07 Q3 07 Q4 07 Q1 08 Q2 08 Q3 08 Q4 08 Q1 09 Q2 09 Q3 09 Q4 09 Q1 10 Q2 10 Q3 10
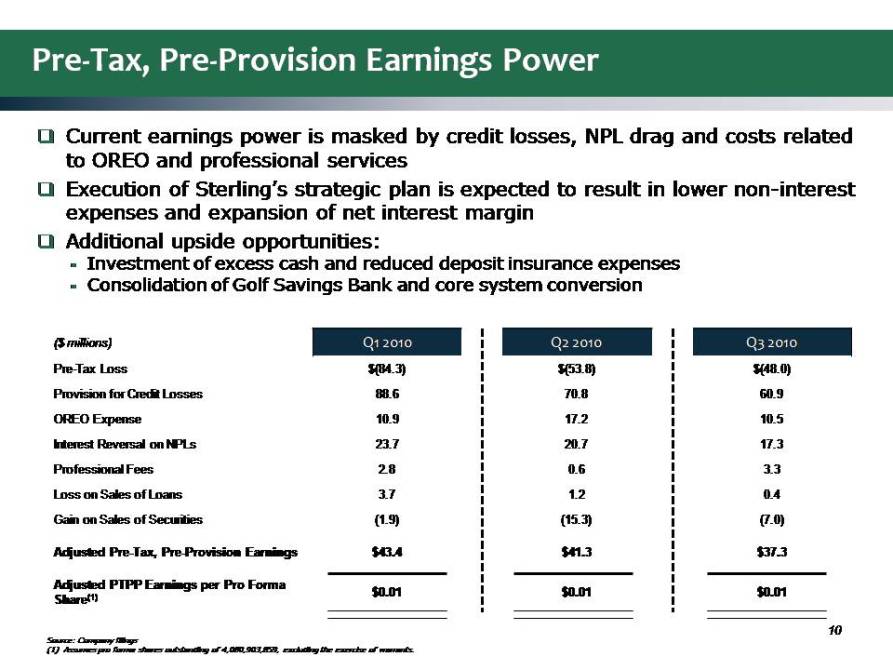
Current earnings power is masked by credit losses, NPL drag and costs related to OREO and professional services Execution of Sterling’s strategic plan is expected to result in lower non-interest expenses and expansion of net interest margin Additional upside opportunities: Investment of excess cash and reduced deposit insurance expenses Consolidation of Golf Savings Bank and core system conversion ($ millions) Q1 2010 Q2 2010 Q3 2010 Pre-Tax Loss $(84.3) $(53.8) $(48.0 Provision for Credit Losses 88.6 70.8 60.9 OREO Expense 10.9 17.2 10.5 Interest Reversal on NPLs 23.7 20.7 17.3 Professional Fees 2.8 0.6 3.3 Loss on Sales of Loans 3.7 1.2 0.4 Gain on Sales of Securities (1.9) (15.3) (7.0) Adjusted Pre-Tax, Pre Provision Earnings $43.4 $41.3 $37.3 Adjusted PTPP Earnings per Pro Forma Share(1) $0.01 $0.01 $0.01 Source: Company filings (1) Assumes pro forma shares outstanding of 4,080,903,859, excluding the exercise of warrants. 10 Pre-Tax, Pre-Provision Earnings Power
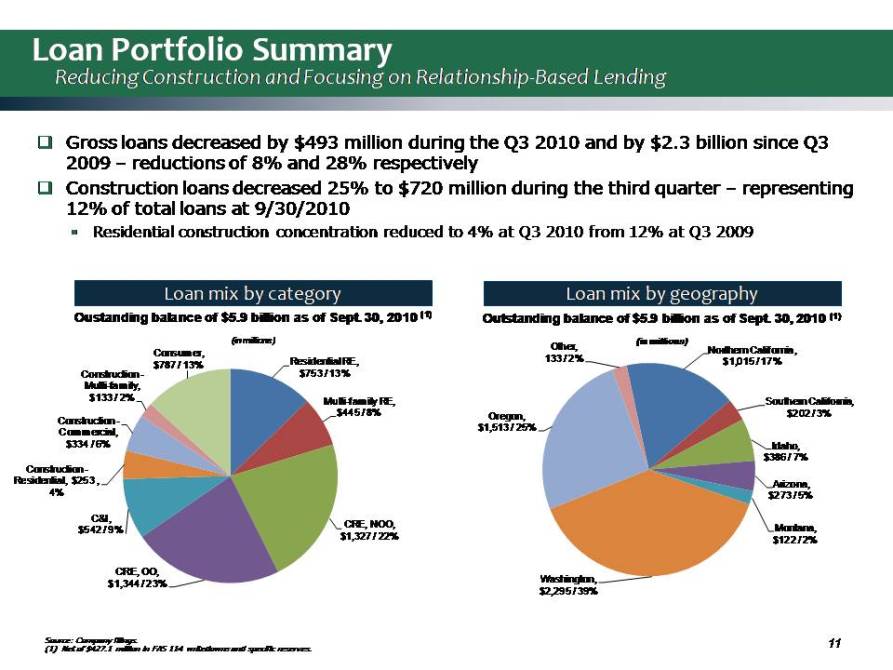
Loan Portfolio Summary Reducing Construction and Focusing on Relationship‐Based Lending Gross loans decreased by $493 million during the Q3 2010 and by $2.3 billion since Q3 2009 – reductions of 8% and 28% respectively Construction loans decreased 25% to $720 million during the third quarter – representing 12% of total loans at 9/30/2010 Residential construction concentration reduced to 4% at Q3 2010 from 12% at Q3 2009 Northern California, $1,015 / 17% Other, 133 / 2% Outstanding balance of $5.9 billion as of Sept. 30, 2010 (1) (in millions) Loan mix by category Loan mix by geography Residential RE, Construction - $753 / 13% Consumer, $787 / 13% Oustanding balance of $5.9 billion as of Sept. 30, 2010 (1) (in millions) Southern California, $202 / 3% Idaho, $386 / 7% Oregon, $1,513 / 25% Multi-family RE, $445 / 8% Construction - Construction - Commercial, $334 / 6% Multi-family, $133 / 2% Arizona, $273 / 5% Montana, $122 / 2% CRE, NOO, $1,327 / 22% CRE OO C&I , $542 / 9% Residential, $253 4% Source: Company filings. (1) Net of $427.1 million in FAS 114 writedowns and specific reserves. 11 Washington, $2,295 / 39% CRE, OO, $1,344 / 23%
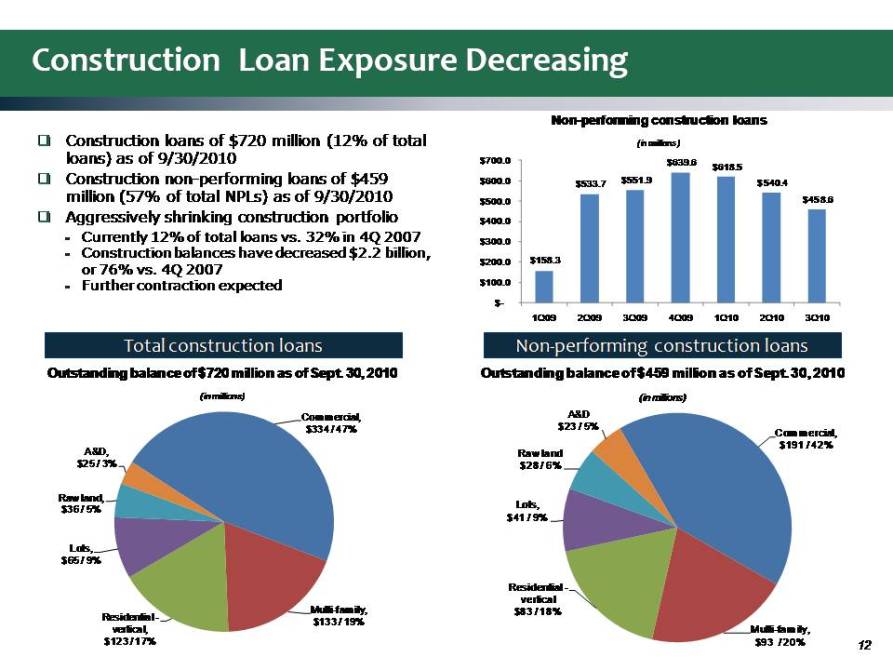
Construction Loan Exposure Decreasing Construction loans of $720 million (12% of total loans) as of 9/30/2010 Construction non-performing loans of $459 million (57% of total NPLs ) 30/2010 $533.7 $551.9 $639.6 $618.5 $600.0 $540.4 $700.0 Non-performing construction loans (in millions) million of total NPLs) as of 9/ Aggressively shrinking construction portfolio Currently 12% of total loans vs. 32% in 4Q 2007 Construction balances have decreased $2.2 billion, or 76% vs. 4Q 2007 expected $158.3 $458.6 $100.0 $200.0 $300.0 $400.0 $500.0 Further contraction Total construction loans Non‐performing construction loans Outstanding balance of $720 million as of Sept. 30, 2010 Outstanding balance of $459 million as of Sept. 30, 2010 $- 1Q09 2Q09 3Q09 4Q09 1Q10 2Q10 3Q10 Commercial, $191 / 42% Raw land $28 / 6% A&D $23 / 5% (in millions) Commercial, $334 / 47% A&D, $25 / 3% (in millions) Lots, $41 / 9% Lots, $65 / 9% Raw land, $36 / 5% 12 Multi-family, $93 / 20% Residential – vertical Multi-family, $83 / 18% Residential - $133 / 19% vertical, $123 / 17% 12
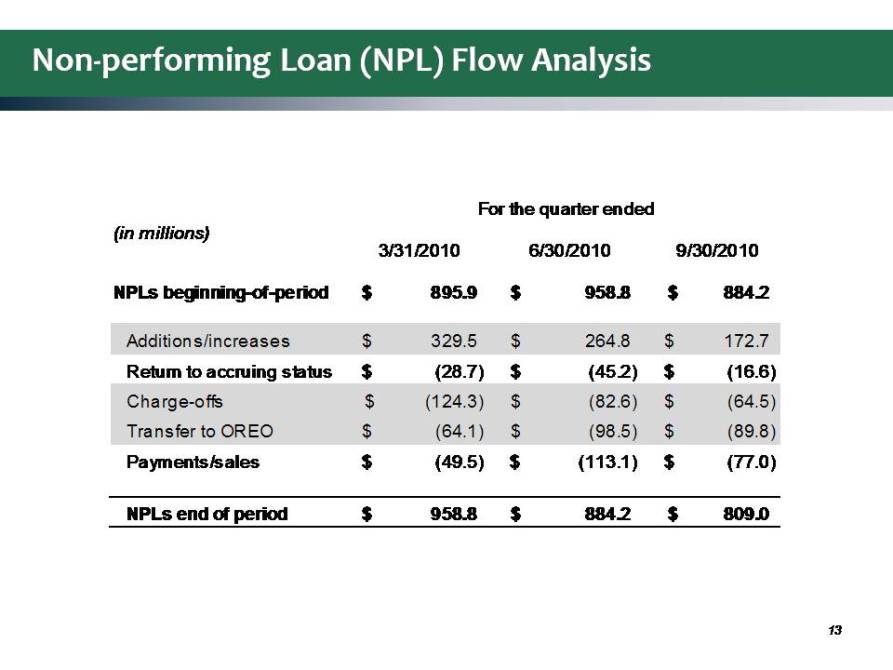
Non-performing Loan (NPL) Flow Analysis 13 (in millions) 3/31/2010 6/30/2010 9/30/2010 NPL $895.9 $958.8 $884.2 For the quarter ended NPLs beginning-of-period 895.9 958.8 884.2 Additions/increases $ 3 29.5 $ 2 64.8 $ 172.7 Return to accruing status $ ( 28.7) $ (45.2) $ (16.6) Charge-offs $ ( 124.3) $ ( 82.6) $ (64.5) Transfer to OREO $ ( 64.1) $ (98.5) $ (89.8) Payments/sales $ ( 49.5) $ (113.1) $ (77.0) NPLs end of period $ 9 58.8 $ 884.2 $ 809.0 13
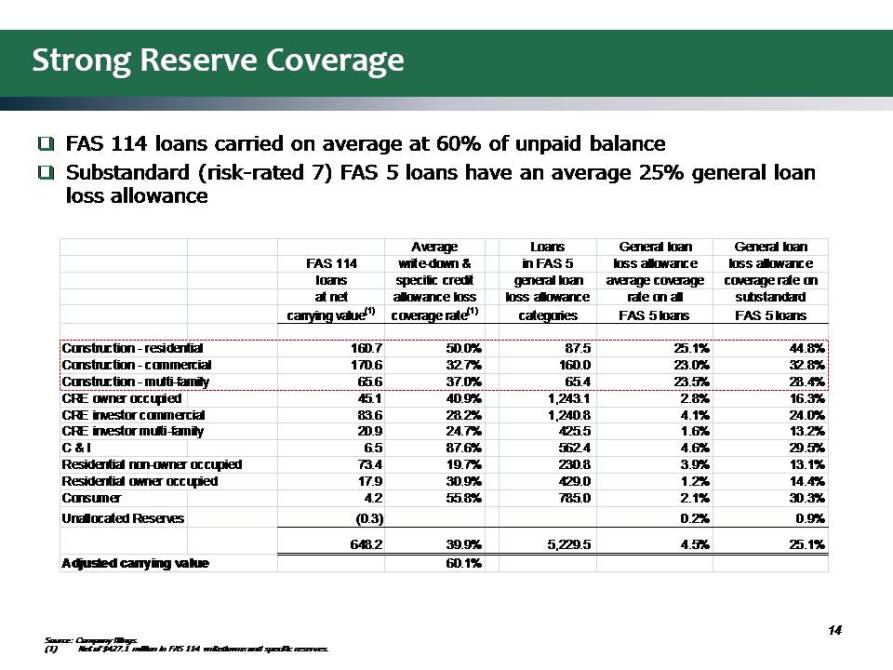
Strong Reserve Coverage 14 FAS 114 loans carried on average at 60% of unpaid balance Substandard (risk-rated 7) FAS 5 loans have an average 25% general loan loss allowance Source: Company filings. (1) Net of $427.1 million in FAS 114 writedowns and specific reserves. Average Loans General loan General loan FAS 114 write-down & in FAS 5 loss allowance loss allowance loans specific credit general loan average coverage coverage rate on at net allowance loss loss allowance rate on all substandard carrying value(1) coverage rate(1) categories FAS 5 loans FAS 5 loans Construction - residential 160.7 50.0% 87.5 25.1% 44.8% Construction - commercial 170.6 32.7% 160.0 23.0% 32.8% Construction - multi-family 65.6 37.0% 65.4 23.5% 28.4% CRE owner occupied 45.1 40.9% 1,243.1 2.8% 16.3% CRE investor commercial 83.6 28.2% 1,240.8 4.1% 24.0% CRE investor multi-family 20.9 24.7% 425.5 1.6% 13.2% C & I 6.5 87.6% 562.4 4.6% 29.5% Residential non-owner occupied 73.4 19.7% 230.8 3.9% 13.1% Residential owner occupied 17.9 30.9% 429.0 1.2% 14.4% Consumer 4.2 55.8% 785.0 2.1% 30.3% Unallocated Reserves (0.3) 0.2% 0.9% 648.2 39.9% 5,229.5 4.5% 25.1% Adjusted carrying value 60.1%
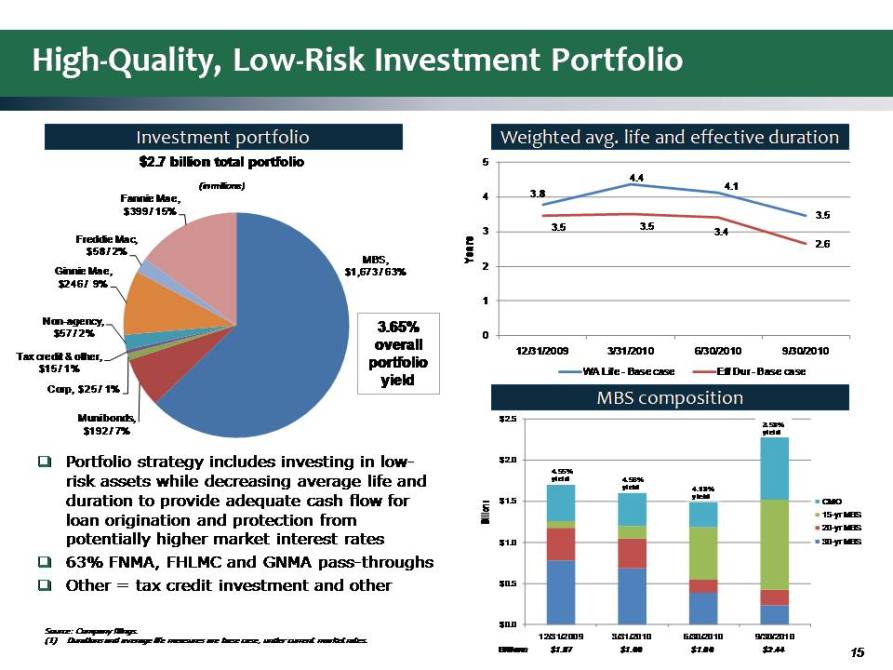
High-Quality, Low-Risk Investment Portfolio Portfolio strategy includes investing in low-risk assets while decreasing average life and duration to provide adequate cash flow for loan origination and protection from potentially higher market interest rates 63% FNMA, FHLMC and GNMA pass-throughs Other = tax credit investment and other Source: Company filings.(1) Durations and average life measures are base case, under current market rates. Investment portfolio Weighted avg. life and effective duration 3.65% overall portfolio yield MBS composition 15 3.8 4.4 4.1 $2.7 billion total portfolio 5 ( in millions) 3.8 3.5 3.5 3.5 3.4 2.6 2 3 4 Years MBS, Ginnie Mae, $1,673 / 63% $246 Freddie Mac, $58 / 2% Fannie Mae, $399 / 15% ) 0 1 12/31/2009 3/31/2010 6/30/2010 9/30/2010 WA Life - Base case Eff Dur - Base case Tax credit & other, $15 / 1% Non-agency, $57 / 2% / 9% 3.65% overall portfolio yield average and Muni bonds, $192 / 7% Corp, $25 / 1% $2.0 $2.5 4.55% yield 4 56% 3.58% yield MBS composition risk assets while decreasing life duration to provide adequate cash flow for loan origination and protection from potentially higher market interest rates 63% FNMA, FHLMC and GNMA pass-throughs $1.0 $1.5 Billions CMO 15-yr MBS 20-yr MBS 30-yr MBS 4.56% yield 4.18% yield Other = tax credit investment and other $0.0 $0.5 12/31/2009 3/31/2010 6/30/2010 9/30/2010 Billions $1.87 $1.66 $1.66 $2.44 15
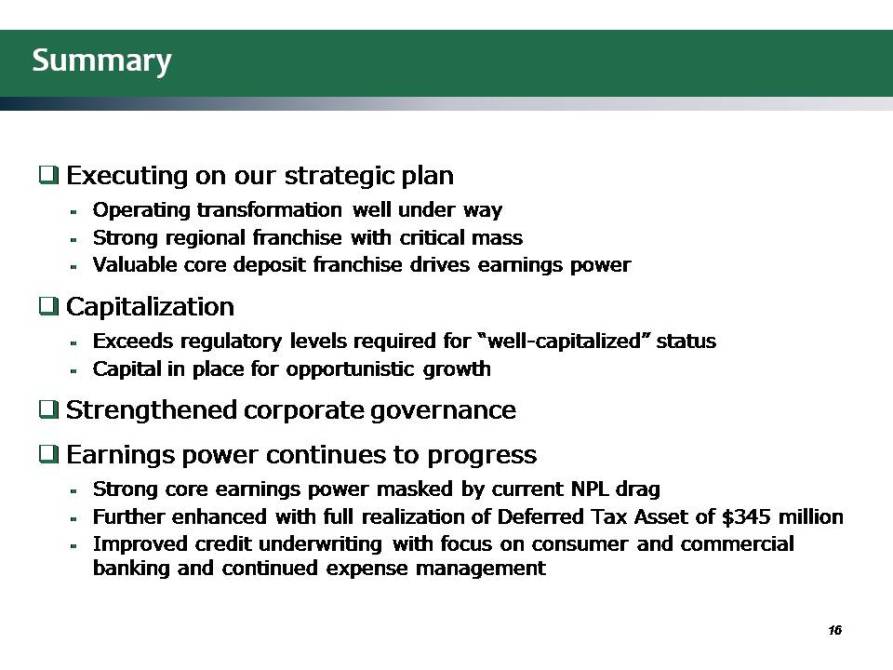
Summary Executing on our strategic plan Operating transformation well under way Strong regional franchise with critical mass Valuable core deposit franchise drives earnings power Capitalization Exceeds regulatory levels required for “well-capitalized” status Capital in place for opportunistic growth Strengthened corporate governance Earnings power continues to progress Strong core earnings power masked by current NPL drag Further enhanced with full realization of Deferred Tax Asset of $345 million Improved credit underwriting with focus on consumer and commercial banking and continued expense management 16

Appendix 17
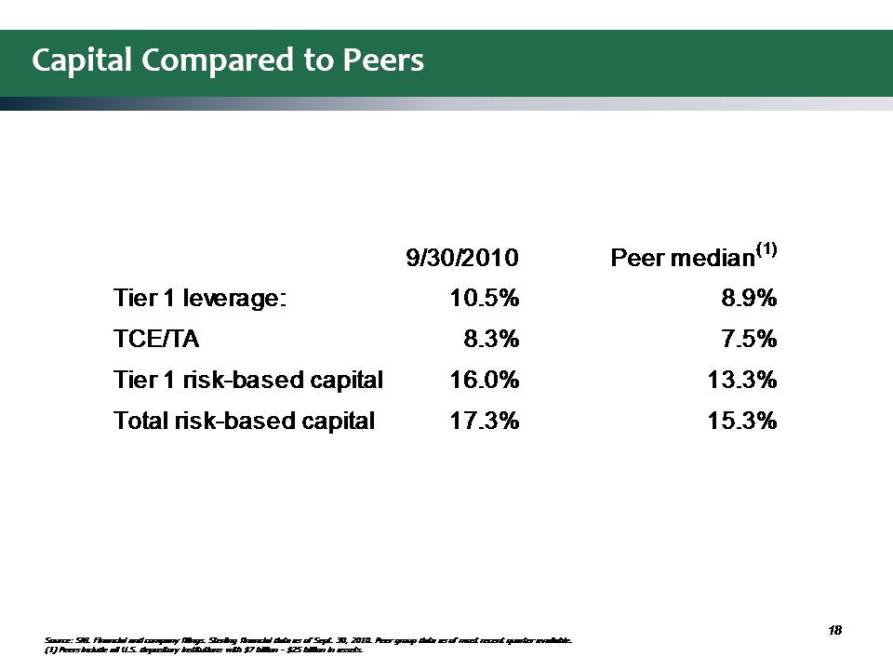
Capital Compared to Peers 9/30/2010 Peer median(1) Tier 1 leverage: 10.5% 8.9% TCE/TA 8.3% 7.5% Tier 1 risk-based capital 16.0% 13.3% Total risk-based capital 17.3% 15.3% 18 Source: SNL Financial and company filings. Sterling financial data as of Sept. 30, 2010. Peer group data as of most recent quarter available. (1) Peers include all U.S. depository institutions with $7 billion - $25 billion in assets.
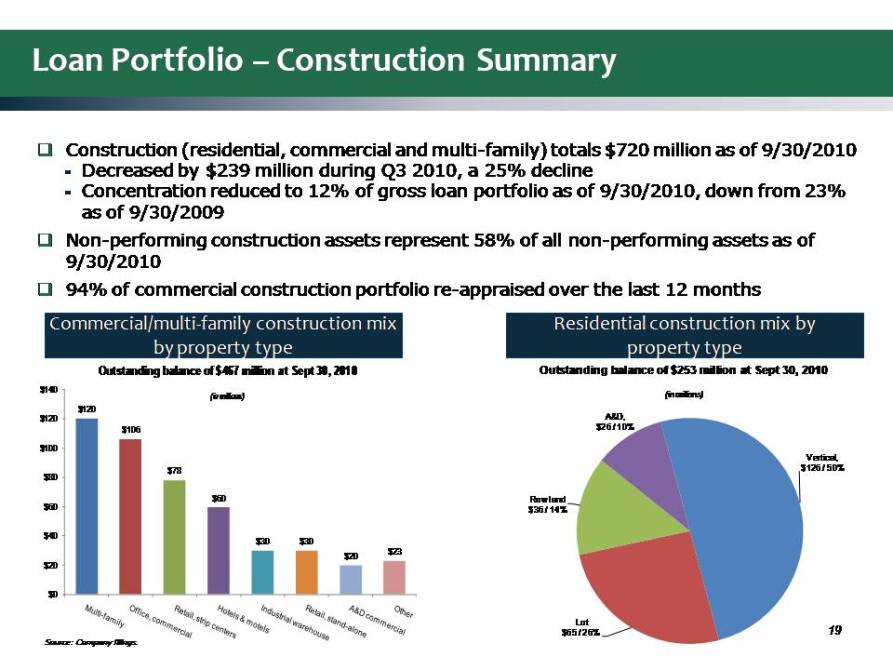
Loan Portfolio – Construction Summary Construction (residential, commercial and multi family) totals $720 million as of 9/30/2010 Decreased by $239 million during Q3 2010, a 25% decline Concentration reduced to 12% of gross loan portfolio as of 9/30/2010, down from 23% as of 9/30/2009 Non-performing construction assets represent 58% of all non-performing assets as of 9/30/2010 94% of construction portfolio re months Outstanding balance of $467 million at Sept 30, 2010 Outstanding balance of $253 million at Sept 30, 2010 commercial re-appraised over the last 12 Commercial/multi‐family construction mix by property type Residential construction mix by property type Vertical, $126 / 50% A&D, $26 / 10% (in millions) $120 $106 $78 $80 $100 $120 $140 (in millions) Raw land $36 / 14% $60 $30 $30 $20 $23 $20 $40 $60 Lot $65 / 26% $0 Source: Company filings. 19 Multi-family Office commercial Retail, strip centers Hotels & motels Industrial warehouse Retails, stand-alone A&D commercial Other
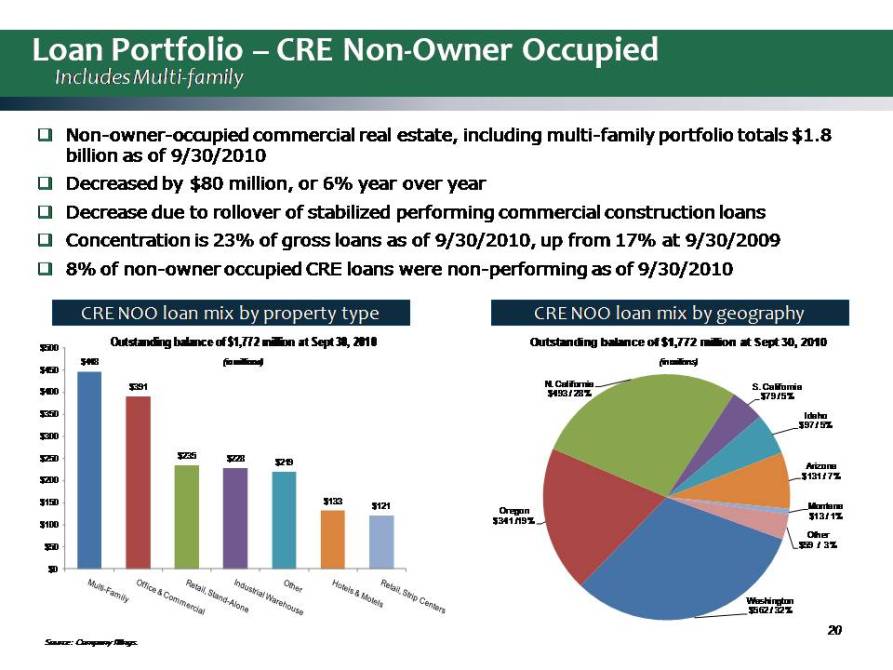
Loan Portfolio – CRE Non‐Owner Occupied Includes Multi‐family Non-owner-occupied commercial real estate, including multi-family portfolio totals $1.8 billion as of 9/30/2010 Decreased by $80 million, or 6% year over year Decrease due to rollover of stabilized performing commercial construction loans Concentration is 23% of gross loans as of 9/30/2010, up from 17% at 9/30/2009 8% of non-owner occupied CRE loans were non-performing as of 9/30/2010 CRE NOO loan mix by property type CRE NOO loan mix by geography Outstanding balance of $1,772 million at Sept 30, 2010 $448 (in millions) $450 $500 Outstanding balance of $1,772 million at Sept 30, 2010 (in millions) N. California $493 / 28% S. California $79 / 5% Idaho $97 / 5% Arizona $131 $391 $235 $228 $219 $200 $250 $300 $350 $400 Oregon $341 /19% / 7% Montana $13 / 1% Other $59 / 3% $133 $121 $0 $50 $100 $150 Source: Company filings. 20 Washington $562 / 32% Multi-family Office & Commercial Retails, Stand-Alone Industrial Warehouse Other Hotels & Motels Retail, Strip Centers
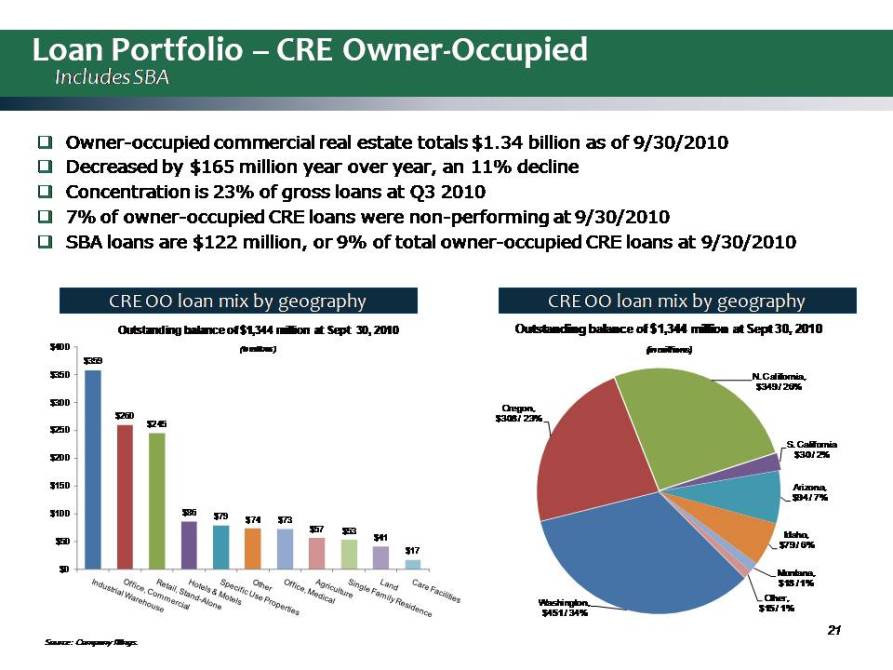
Loan Portfolio – CRE Owner‐Occupied Includes SBA Owner-occupied commercial real estate totals $1.34 billion as of 9/30/2010 Decreased by $165 million year over year, an 11% decline Concentration is 23% of gross loans at Q3 2010 7% of owner-occupied CRE loans were non performing at 9/30/2010 SBA loans are $122 million, or 9% of total owner-occupied CRE loans at 9/30/2010 N. California, Outstanding balance of $1,344 million at Sept 30, 2010 (in millions) CRE OO loan mix by geography CRE OO loan mix by geography $359 $350 $400 Outstanding balance of $1,344 million at Sept 30, 2010 (in millions) Oregon, $308 / 23% $349 / 26% S. California $30 / 2% $260 $245 $200 $250 $300 Arizona, $94 / 7% Idaho, $79 / 6% Montana $86 $79 $74 $73 $57 $53 $41 $17 $0 $50 $100 $150 Source: Company filings. 21 Washington, $451 / 34% Montana, $18 / 1% Other, $15 / 1% Industrial Warehouse Office, Commercial Retail, Stand-Alone Hotels & Motels Specific Use Properties Other Office, Medical Agriculture Single Family Residence Land Care Facilities

Investor Update Third Quarter 2010 Results November 11, 2010 Ticker: STSA Spokane, Washington Investor Contacts Daniel G. Byrne David Brukardt EVP/Chief Financial Officer EVP/Investor and Corporate Relations (509) 458-3711 (509) 863-5423 Media Contact Cara Coon VP/Communications and Public Affairs Director (509) 626-5348