Attached files
| file | filename |
|---|---|
| 8-K - 8-K - VEECO INSTRUMENTS INC | a10-19850_18k.htm |
| EX-99.1 - EX-99.1 - VEECO INSTRUMENTS INC | a10-19850_1ex99d1.htm |
Exhibit 99.2
|
|
Q3 2010 Highlights Earnings Conference Call 10/25/10 |
|
|
Introduction: Deb Wasser, SVP, Investor Relations |
|
|
Safe Harbor Statement To the extent that this presentation discusses expectations or otherwise makes statements about the future, such statements are forward-looking and are subject to a number of risks and uncertainties that could cause actual results to differ materially from the statements made. These items include the risk factors discussed in the Business Description and Management's Discussion and Analysis sections of Veeco's Annual Report on Form 10-K for the year ended December 31, 2009 and subsequent Quarterly Reports on Form 10-Q and current reports on Form 8-K. Veeco does not undertake any obligation to update any forward-looking statements to reflect future events or circumstances after the date of such statements. In addition, this presentation includes non-GAAP financial measures. For GAAP reconciliation, please refer to the reconciliation section in this presentation as well as Veeco’s financial press releases and 10-K and 10-Q filings available on www.veeco.com Note: All results presented herein are for Veeco’s “Continuing Operations” which excludes the Metrology business sold to Bruker Corporation on October 7, 2010. |
|
|
John Peeler, CEO |
|
|
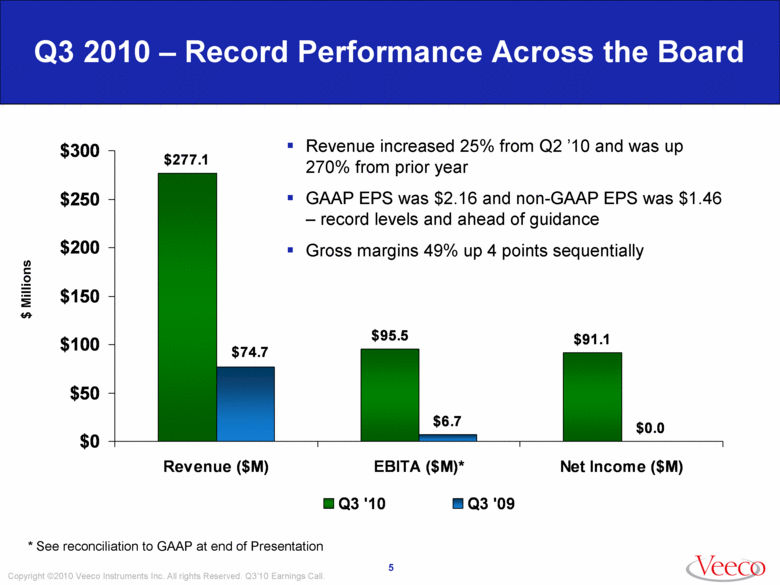
Q3 2010 – Record Performance Across the Board Revenue increased 25% from Q2 ’10 and was up 270% from prior year GAAP EPS was $2.16 and non-GAAP EPS was $1.46 – record levels and ahead of guidance Gross margins 49% up 4 points sequentially * See reconciliation to GAAP at end of Presentation $ Millions $277.1 $95.5 $91.1 $0.0 $6.7 $74.7 $0 $50 $100 $150 $200 $250 $300 Revenue ($M) EBITA ($M)* Net Income ($M) Q3 '10 Q3 '09 |
|
|
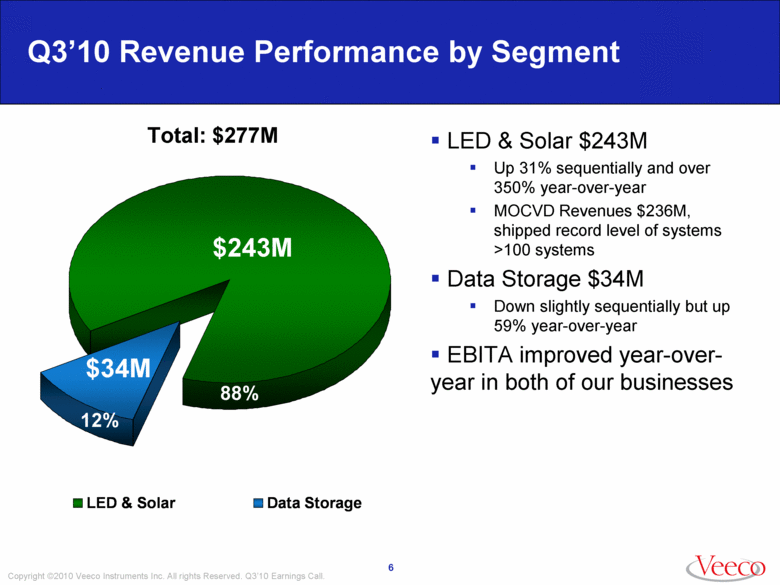
Q3’10 Revenue Performance by Segment LED & Solar $243M Up 31% sequentially and over 350% year-over-year MOCVD Revenues $236M, shipped record level of systems >100 systems Data Storage $34M Down slightly sequentially but up 59% year-over-year EBITA improved year-over-year in both of our businesses $243M $34M Total: $277M $243M $34M 88% 12% LED & Solar Data Storage |
|
|
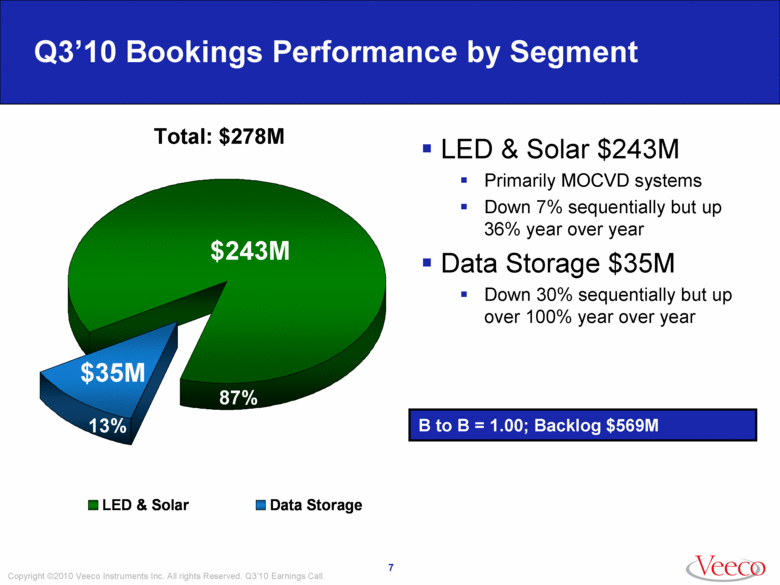
Q3’10 Bookings Performance by Segment LED & Solar $243M Primarily MOCVD systems Down 7% sequentially but up 36% year over year Data Storage $35M Down 30% sequentially but up over 100% year over year B to B = 1.00; Backlog $569M $243M $35M Total: $278M $243M $35M 87% 13% LED & Solar Data Storage |
|
|
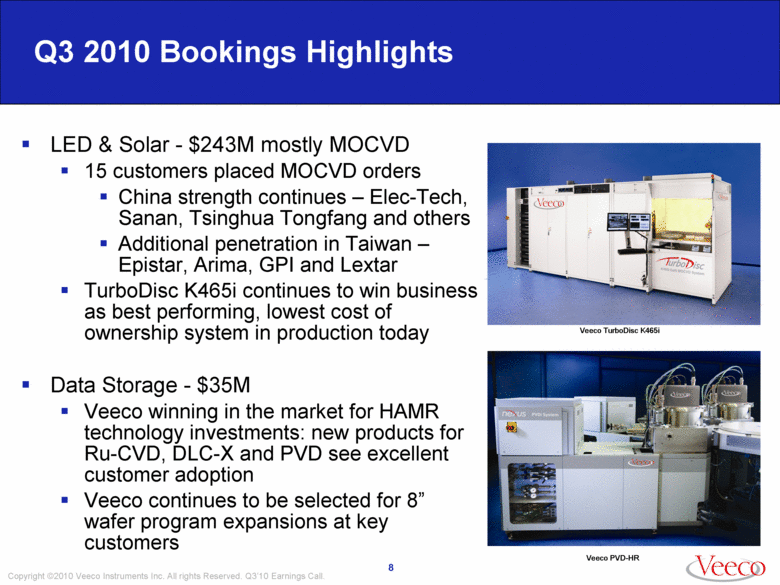
Q3 2010 Bookings Highlights LED & Solar - $243M mostly MOCVD 15 customers placed MOCVD orders China strength continues – Elec-Tech, Sanan, Tsinghua Tongfang and others Additional penetration in Taiwan – Epistar, Arima, GPI and Lextar TurboDisc K465i continues to win business as best performing, lowest cost of ownership system in production today Data Storage - $35M Veeco winning in the market for HAMR technology investments: new products for Ru-CVD, DLC-X and PVD see excellent customer adoption Veeco continues to be selected for 8” wafer program expansions at key customers Veeco TurboDisc K465i Veeco PVD-HR |
|
|
Veeco’s Broad-Based Investment in Asia – Infrastructure, Equipment and People 10/14/10: Veeco announces >$25M investment to help ensure customers’ successful LED industry ramp Three new state-of-the-art facilities Expansion to include ~50 new process applications and technical support personnel LED focused today... leveraged to other Clean-Tech markets in future Goal: Bring Process Support, Training and Know-How Directly to our Customers – “Go Faster to Lighting” |
|
|
Additional Financial Highlights Dave Glass, CFO |
|
|
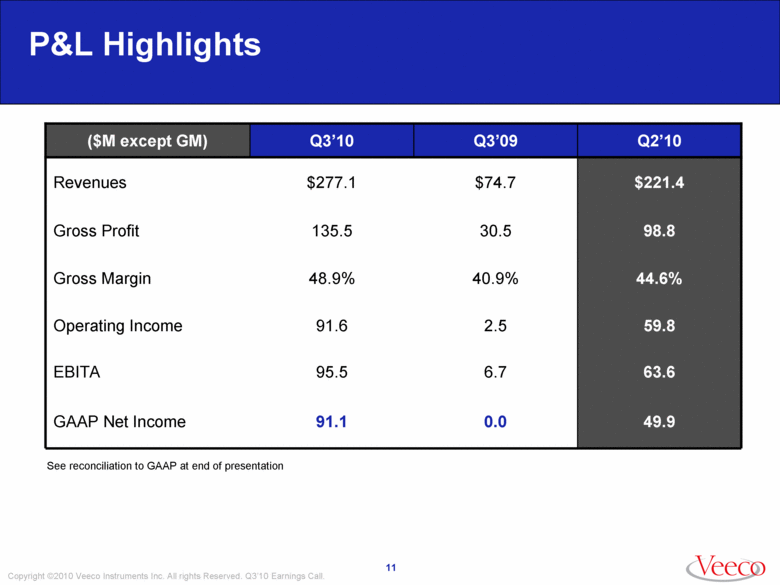
P&L Highlights 49.9 0.0 91.1 GAAP Net Income 63.6 6.7 95.5 EBITA 59.8 2.5 91.6 Operating Income 44.6% 40.9% 48.9% Gross Margin 98.8 30.5 135.5 Gross Profit $221.4 $74.7 $277.1 Revenues Q2’10 Q3’09 Q3’10 ($M except GM) See reconciliation to GAAP at end of presentation |
|
|
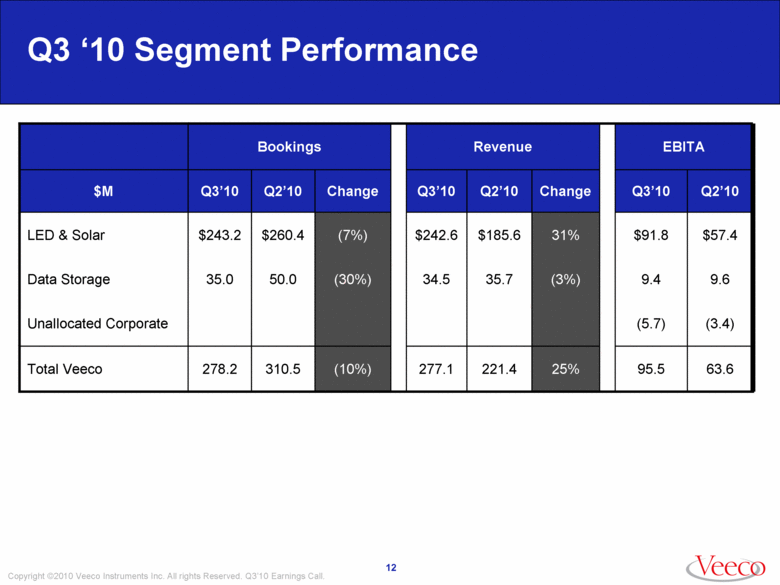
Q3 ‘10 Segment Performance (10%) (30%) (7%) Change 63.6 95.5 25% 221.4 277.1 310.5 278.2 Total Veeco (3.4) (5.7) Unallocated Corporate 9.6 9.4 (3%) 35.7 34.5 50.0 35.0 Data Storage EBITA Revenue Bookings $260.4 Q2’10 $242.6 Q3’10 $185.6 Q2’10 31% Change $91.8 Q3’10 $57.4 $243.2 LED & Solar Q2’10 Q3’10 $M |
|
|
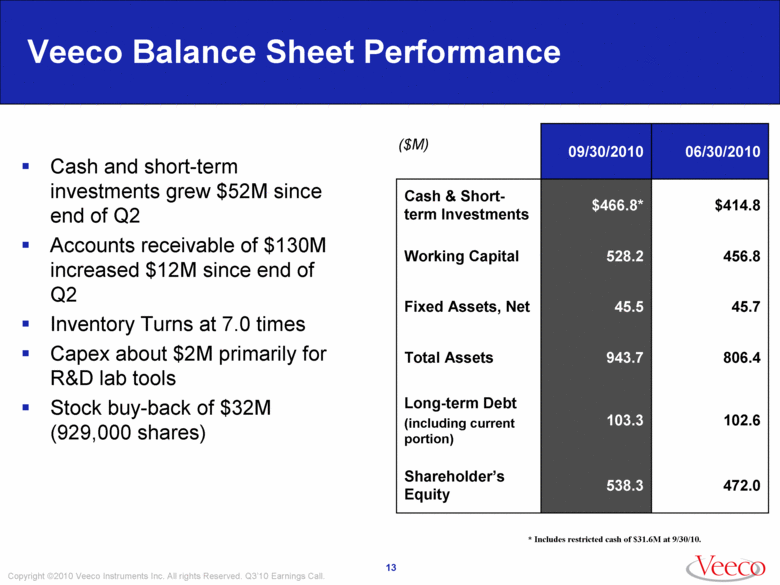
Veeco Balance Sheet Performance 538.3 103.3 943.7 45.5 528.2 $466.8* 09/30/2010 06/30/2010 472.0 Shareholder’s Equity 102.6 Long-term Debt (including current portion) 806.4 Total Assets 45.7 Fixed Assets, Net 456.8 Working Capital $414.8 Cash & Short-term Investments ($M) * Includes restricted cash of $31.6M at 9/30/10. Cash and short-term investments grew $52M since end of Q2 Accounts receivable of $130M increased $12M since end of Q2 Inventory Turns at 7.0 times Capex about $2M primarily for R&D lab tools Stock buy-back of $32M (929,000 shares) |
|
|
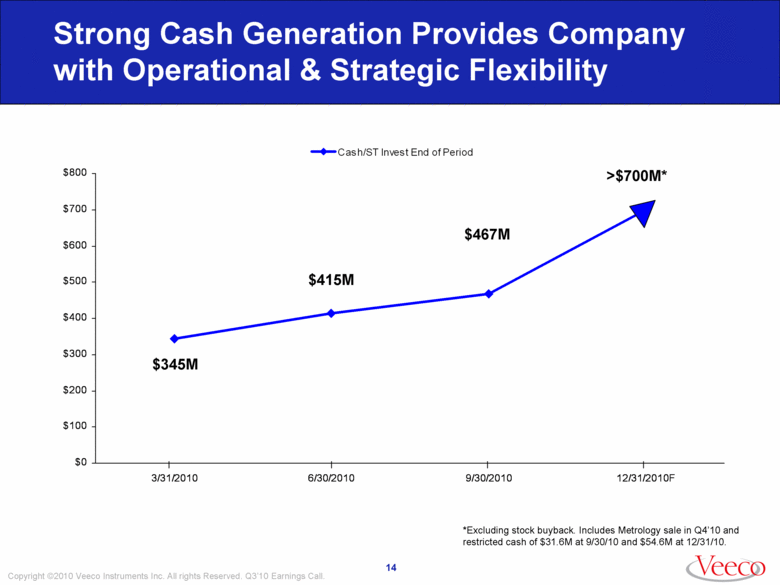
Strong Cash Generation Provides Company with Operational & Strategic Flexibility *Excluding stock buyback. Includes Metrology sale in Q4’10 and restricted cash of $31.6M at 9/30/10 and $54.6M at 12/31/10. >$700M* $467M $415M $345M $0 $100 $200 $300 $400 $500 $600 $700 $800 3/31/2010 6/30/2010 9/30/2010 12/31/2010F Cash/ST Invest End of Period |
|
|
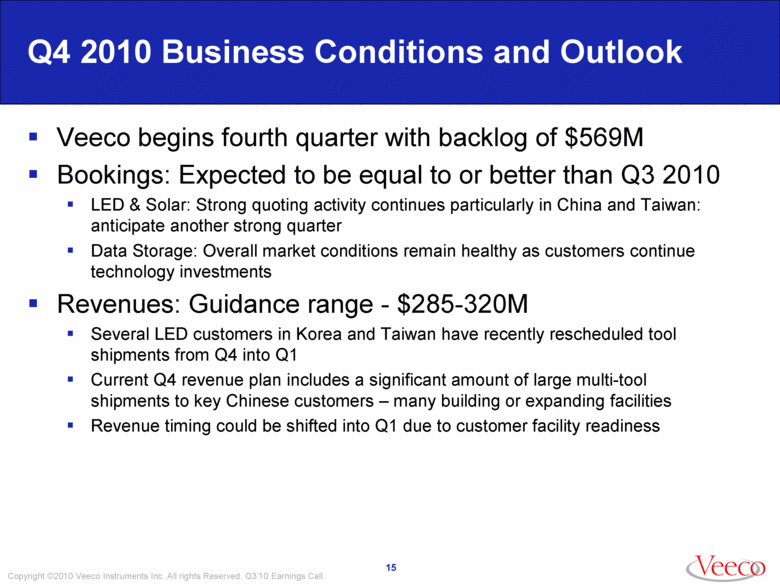
Q4 2010 Business Conditions and Outlook Veeco begins fourth quarter with backlog of $569M Bookings: Expected to be equal to or better than Q3 2010 LED & Solar: Strong quoting activity continues particularly in China and Taiwan: anticipate another strong quarter Data Storage: Overall market conditions remain healthy as customers continue technology investments Revenues: Guidance range - $285-320M Several LED customers in Korea and Taiwan have recently rescheduled tool shipments from Q4 into Q1 Current Q4 revenue plan includes a significant amount of large multi-tool shipments to key Chinese customers – many building or expanding facilities Revenue timing could be shifted into Q1 due to customer facility readiness |
|
|
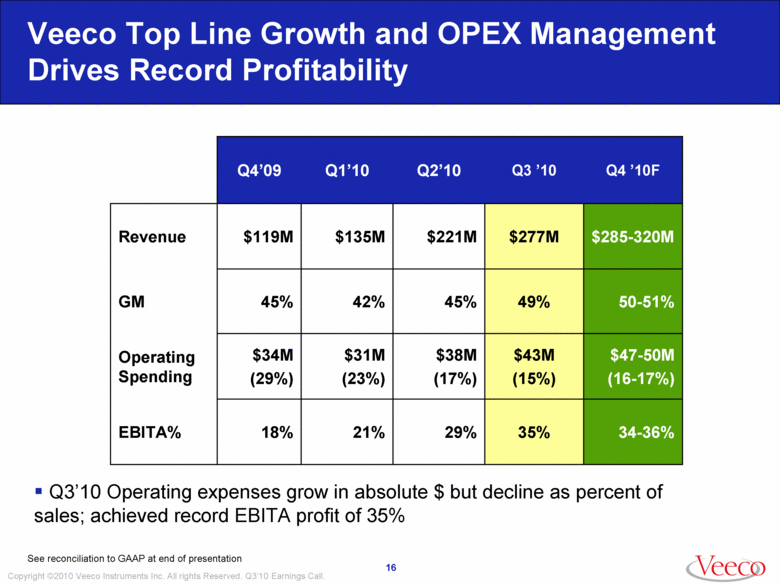
Veeco Top Line Growth and OPEX Management Drives Record Profitability 35% $43M (15%) 49% $277M Q3 ’10 34-36% $47-50M (16-17%) 50-51% $285-320M Q4 ’10F 29% $38M (17%) 45% $221M Q2’10 21% 18% EBITA% $31M (23%) $34M (29%) Operating Spending 42% 45% GM $135M $119M Revenue Q1’10 Q4’09 See reconciliation to GAAP at end of presentation Q3’10 Operating expenses grow in absolute $ but decline as percent of sales; achieved record EBITA profit of 35% |
|
|
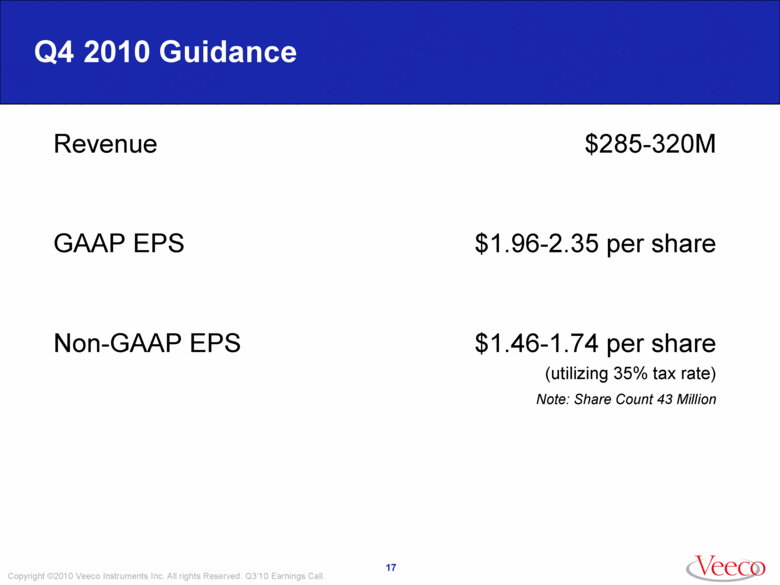
Q4 2010 Guidance Revenue $285-320M GAAP EPS $1.96-2.35 per share Non-GAAP EPS $1.46-1.74 per share (utilizing 35% tax rate) Note: Share Count 43 Million |
|
|
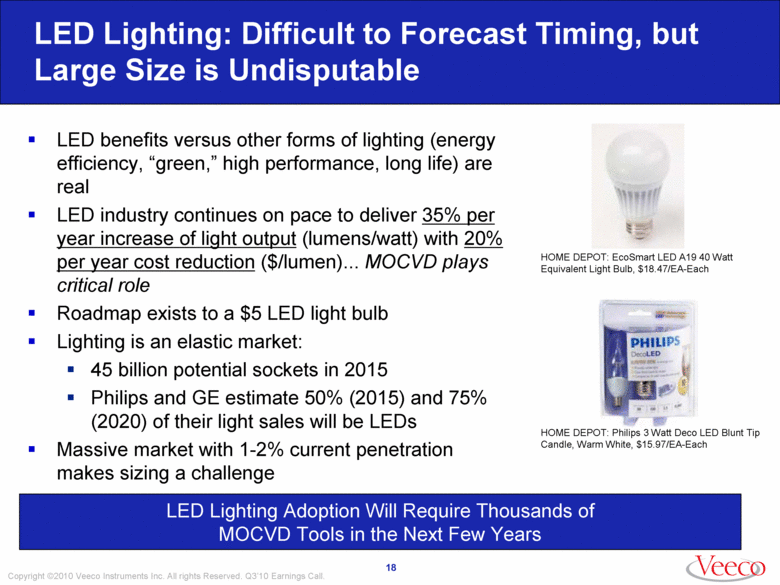
LED Lighting: Difficult to Forecast Timing, but Large Size is Undisputable LED benefits versus other forms of lighting (energy efficiency, “green,” high performance, long life) are real LED industry continues on pace to deliver 35% per year increase of light output (lumens/watt) with 20% per year cost reduction ($/lumen)... MOCVD plays critical role Roadmap exists to a $5 LED light bulb Lighting is an elastic market: 45 billion potential sockets in 2015 Philips and GE estimate 50% (2015) and 75% (2020) of their light sales will be LEDs Massive market with 1-2% current penetration makes sizing a challenge LED Lighting Adoption Will Require Thousands of MOCVD Tools in the Next Few Years HOME DEPOT: EcoSmart LED A19 40 Watt Equivalent Light Bulb, $18.47/EA-Each HOME DEPOT: Philips 3 Watt Deco LED Blunt Tip Candle, Warm White, $15.97/EA-Each |
|
|
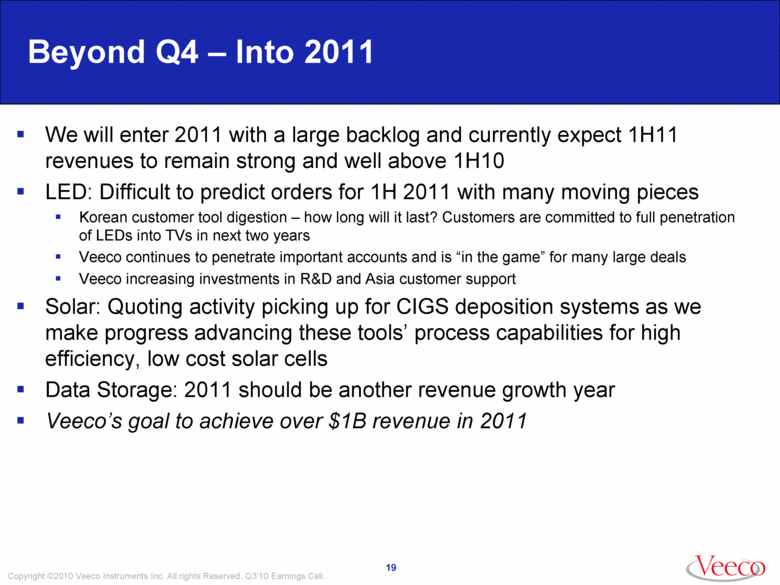
Beyond Q4 – Into 2011 We will enter 2011 with a large backlog and currently expect 1H11 revenues to remain strong and well above 1H10 LED: Difficult to predict orders for 1H 2011 with many moving pieces Korean customer tool digestion – how long will it last? Customers are committed to full penetration of LEDs into TVs in next two years Veeco continues to penetrate important accounts and is “in the game” for many large deals Veeco increasing investments in R&D and Asia customer support Solar: Quoting activity picking up for CIGS deposition systems as we make progress advancing these tools’ process capabilities for high efficiency, low cost solar cells Data Storage: 2011 should be another revenue growth year Veeco’s goal to achieve over $1B revenue in 2011 |
|
|
Q&A Session |
|
|
Back-Up |
|
|
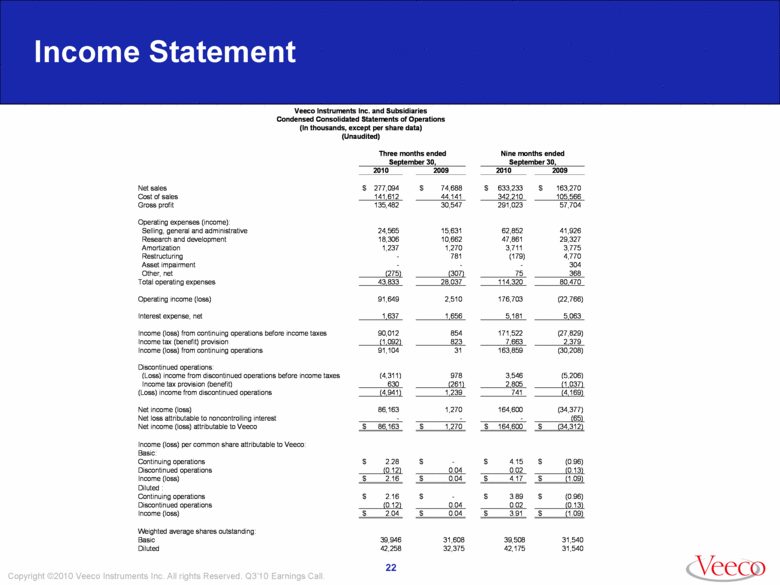
Income Statement 31,540 42,175 32,375 42,258 Diluted 31,540 39,508 31,608 39,946 Basic Weighted average shares outstanding: $ (1.09) $ 3.91 $ 0.04 $ 2.04 Income (loss) (0.13) 0.02 0.04 (0.12) Discontinued operations $ (0.96) $ 3.89 $ - $ 2.16 Continuing operations Diluted : $ (1.09) $ 4.17 $ 0.04 $ 2.16 Income (loss) (0.13) 0.02 0.04 (0.12) Discontinued operations $ (0.96) $ 4.15 $ - $ 2.28 Continuing operations Basic: Income (loss) per common share attributable to Veeco: $ (34,312) $ 164,600 $ 1,270 $ 86,163 Net income (loss) attributable to Veeco (65) - - - Net loss attributable to noncontrolling interest (34,377) 164,600 1,270 86,163 Net income (loss) (4,169) 741 1,239 (4,941) (Loss) income from discontinued operations (1,037) 2,805 (261) 630 Income tax provision (benefit) (5,206) 3,546 978 (4,311) (Loss) income from discontinued operations before income taxes Discontinued operations: (30,208) 163,859 31 91,104 Income (loss) from continuing operations 2,379 7,663 823 (1,092) Income tax (benefit) provision (27,829) 171,522 854 90,012 Income (loss) from continuing operations before income taxes 5,063 5,181 1,656 1,637 Interest expense, net (22,766) 176,703 2,510 91,649 Operating income (loss) 80,470 114,320 28,037 43,833 Total operating expenses 368 75 (307) (275) Other, net 304 - - - Asset impairment 4,770 (179) 781 - Restructuring 3,775 3,711 1,270 1,237 Amortization 29,327 47,861 10,662 18,306 Research and development 41,926 62,852 15,631 24,565 Selling, general and administrative Operating expenses (income): 57,704 291,023 30,547 135,482 Gross profit 105,566 342,210 44,141 141,612 Cost of sales $ 163,270 $ 633,233 $ 74,688 $ 277,094 Net sales 2009 2010 2009 2010 September 30, September 30, Nine months ended Three months ended (Unaudited) (In thousands, except per share data) Condensed Consolidated Statements of Operations Veeco Instruments Inc. and Subsidiaries |
|
|
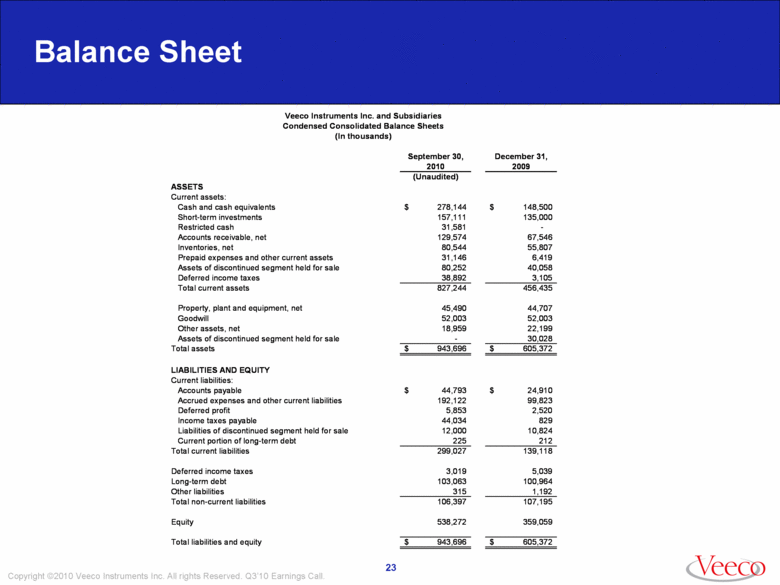
Balance Sheet $ 605,372 $ 943,696 Total liabilities and equity 359,059 538,272 Equity 107,195 106,397 Total non-current liabilities 1,192 315 Other liabilities 100,964 103,063 Long-term debt 5,039 3,019 Deferred income taxes 139,118 299,027 Total current liabilities 212 225 Current portion of long-term debt 10,824 12,000 Liabilities of discontinued segment held for sale 829 44,034 Income taxes payable 2,520 5,853 Deferred profit 99,823 192,122 Accrued expenses and other current liabilities $ 24,910 $ 44,793 Accounts payable Current liabilities: LIABILITIES AND EQUITY $ 605,372 $ 943,696 Total assets 30,028 - Assets of discontinued segment held for sale 22,199 18,959 Other assets, net 52,003 52,003 Goodwill 44,707 45,490 Property, plant and equipment, net 456,435 827,244 Total current assets 3,105 38,892 Deferred income taxes 40,058 80,252 Assets of discontinued segment held for sale 6,419 31,146 Prepaid expenses and other current assets 55,807 80,544 Inventories, net 67,546 129,574 Accounts receivable, net - 31,581 Restricted cash 135,000 157,111 Short-term investments $ 148,500 $ 278,144 Cash and cash equivalents Current assets: ASSETS (Unaudited) 2009 2010 December 31, September 30, (In thousands) Condensed Consolidated Balance Sheets Veeco Instruments Inc. and Subsidiaries |
|
|
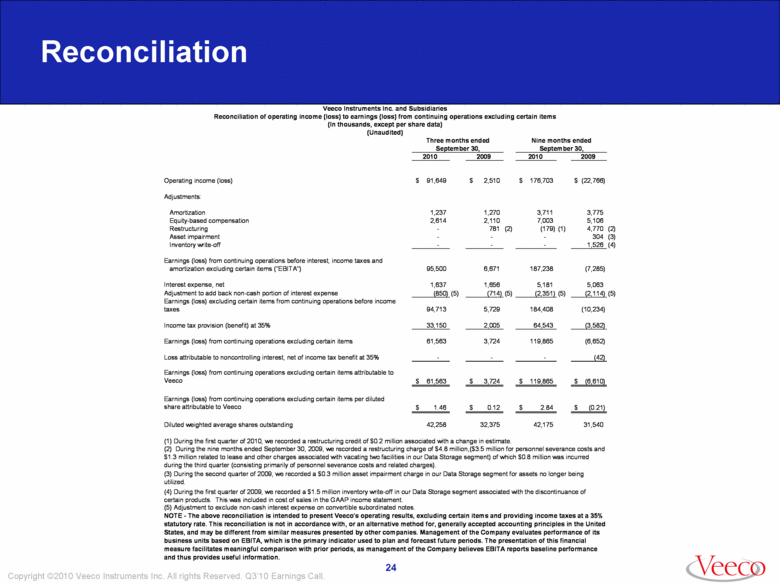
Reconciliation NOTE - The above reconciliation is intended to present Veeco's operating results, excluding certain items and providing income taxes at a 35% statutory rate. This reconciliation is not in accordance with, or an alternative method for, generally accepted accounting principles in the United States, and may be different from similar measures presented by other companies. Management of the Company evaluates performance of its business units based on EBITA, which is the primary indicator used to plan and forecast future periods. The presentation of this financial measure facilitates meaningful comparison with prior periods, as management of the Company believes EBITA reports baseline performance and thus provides useful information. (5) Adjustment to exclude non-cash interest expense on convertible subordinated notes. (4) During the first quarter of 2009, we recorded a $1.5 million inventory write-off in our Data Storage segment associated with the discontinuance of certain products. This was included in cost of sales in the GAAP income statement. (3) During the second quarter of 2009, we recorded a $0.3 million asset impairment charge in our Data Storage segment for assets no longer being utilized. (2) During the nine months ended September 30, 2009, we recorded a restructuring charge of $4.8 million,($3.5 million for personnel severance costs and $1.3 million related to lease and other charges associated with vacating two facilities in our Data Storage segment) of which $0.8 million was incurred during the third quarter (consisting primarily of personnel severance costs and related charges). (1) During the first quarter of 2010, we recorded a restructuring credit of $0.2 million associated with a change in estimate. 31,540 42,175 32,375 42,258 Diluted weighted average shares outstanding $ (0.21) $ 2.84 $ 0.12 $ 1.46 Earnings (loss) from continuing operations excluding certain items per diluted share attributable to Veeco $ (6,610) $ 119,865 $ 3,724 $ 61,563 Earnings (loss) from continuing operations excluding certain items attributable to Veeco (42) - - - Loss attributable to noncontrolling interest, net of income tax benefit at 35% (6,652) 119,865 3,724 61,563 Earnings (loss) from continuing operations excluding certain items (3,582) 64,543 2,005 33,150 Income tax provision (benefit) at 35% (10,234) 184,408 5,729 94,713 Earnings (loss) excluding certain items from continuing operations before income taxes (5) (2,114) (5) (2,351) (5) (714) (5) (850) Adjustment to add back non-cash portion of interest expense 5,063 5,181 1,656 1,637 Interest expense, net (7,285) 187,238 6,671 95,500 amortization excluding certain items ("EBITA") Earnings (loss) from continuing operations before interest, income taxes and (4) 1,526 - - - Inventory write-off (3) 304 - - - Asset impairment (2) 4,770 (1) (179) (2) 781 - Restructuring 5,106 7,003 2,110 2,614 Equity-based compensation 3,775 3,711 1,270 1,237 Amortization Adjustments: $ (22,766) $ 176,703 $ 2,510 $ 91,649 Operating income (loss) 2009 2010 2009 2010 September 30, September 30, Nine months ended Three months ended (Unaudited) (In thousands, except per share data) Reconciliation of operating income (loss) to earnings (loss) from continuing operations excluding certain items Veeco Instruments Inc. and Subsidiaries |
|
|
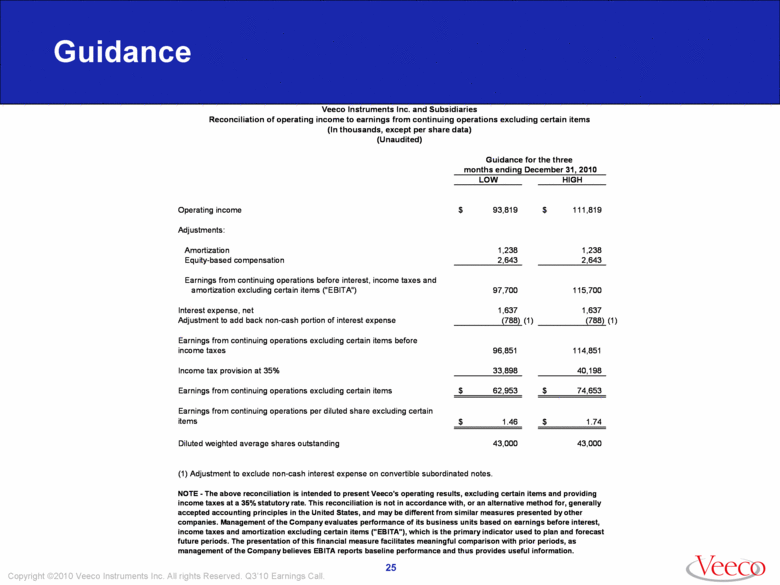
Guidance NOTE - The above reconciliation is intended to present Veeco's operating results, excluding certain items and providing income taxes at a 35% statutory rate. This reconciliation is not in accordance with, or an alternative method for, generally accepted accounting principles in the United States, and may be different from similar measures presented by other companies. Management of the Company evaluates performance of its business units based on earnings before interest, income taxes and amortization excluding certain items ("EBITA"), which is the primary indicator used to plan and forecast future periods. The presentation of this financial measure facilitates meaningful comparison with prior periods, as management of the Company believes EBITA reports baseline performance and thus provides useful information. (1) Adjustment to exclude non-cash interest expense on convertible subordinated notes. 43,000 43,000 Diluted weighted average shares outstanding $ 1.74 $ 1.46 Earnings from continuing operations per diluted share excluding certain items $ 74,653 $ 62,953 Earnings from continuing operations excluding certain items 40,198 33,898 Income tax provision at 35% 114,851 96,851 Earnings from continuing operations excluding certain items before income taxes (1) (788) (1) (788) Adjustment to add back non-cash portion of interest expense 1,637 1,637 Interest expense, net 115,700 97,700 amortization excluding certain items ("EBITA") Earnings from continuing operations before interest, income taxes and 2,643 2,643 Equity-based compensation 1,238 1,238 Amortization Adjustments: $ 111,819 $ 93,819 Operating income HIGH LOW months ending December 31, 2010 Guidance for the three (Unaudited) (In thousands, except per share data) Reconciliation of operating income to earnings from continuing operations excluding certain items Veeco Instruments Inc. and Subsidiaries |
|
|
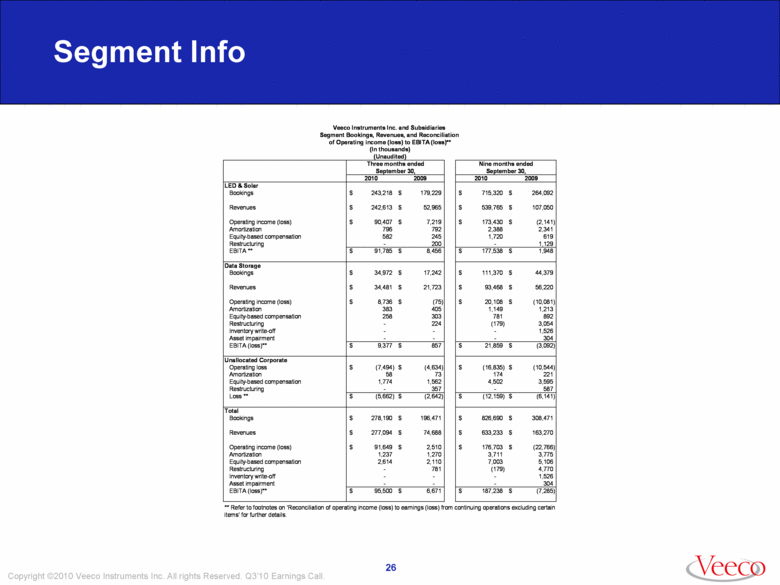
Segment Info ** Refer to footnotes on 'Reconciliation of operating income (loss) to earnings (loss) from continuing operations excluding certain items' for further details. $ (7,285) $ 187,238 $ 6,671 $ 95,500 EBITA (loss)** 304 - - - Asset impairment 1,526 - - - Inventory write-off 4,770 (179) 781 - Restructuring 5,106 7,003 2,110 2,614 Equity-based compensation 3,775 3,711 1,270 1,237 Amortization $ (22,766) $ 176,703 $ 2,510 $ 91,649 Operating income (loss) $ 163,270 $ 633,233 $ 74,688 $ 277,094 Revenues $ 308,471 $ 826,690 $ 196,471 $ 278,190 Bookings Total $ (6,141) $ (12,159) $ (2,642) $ (5,662) Loss ** 587 - 357 - Restructuring 3,595 4,502 1,562 1,774 Equity-based compensation 221 174 73 58 Amortization $ (10,544) $ (16,835) $ (4,634) $ (7,494) Operating loss Unallocated Corporate $ (3,092) $ 21,859 $ 857 $ 9,377 EBITA (loss)** 304 - - - Asset impairment 1,526 - - - Inventory write-off 3,054 (179) 224 - Restructuring 892 781 303 258 Equity-based compensation 1,213 1,149 405 383 Amortization $ (10,081) $ 20,108 $ (75) $ 8,736 Operating income (loss) $ 56,220 $ 93,468 $ 21,723 $ 34,481 Revenues $ 44,379 $ 111,370 $ 17,242 $ 34,972 Bookings Data Storage $ 1,948 $ 177,538 $ 8,456 $ 91,785 EBITA ** 1,129 - 200 - Restructuring 619 1,720 245 582 Equity-based compensation 2,341 2,388 792 796 Amortization $ (2,141) $ 173,430 $ 7,219 $ 90,407 Operating income (loss) $ 107,050 $ 539,765 $ 52,965 $ 242,613 Revenues $ 264,092 $ 715,320 $ 179,229 $ 243,218 Bookings LED & Solar 2009 2010 2009 2010 September 30, September 30, Nine months ended Three months ended (Unaudited) (In thousands) of Operating income (loss) to EBITA (loss)** Segment Bookings, Revenues, and Reconciliation Veeco Instruments Inc. and Subsidiaries |
|
|
Historic Results Reclassified for Continuing Operations (Excluding Metrology Business) |
|
|
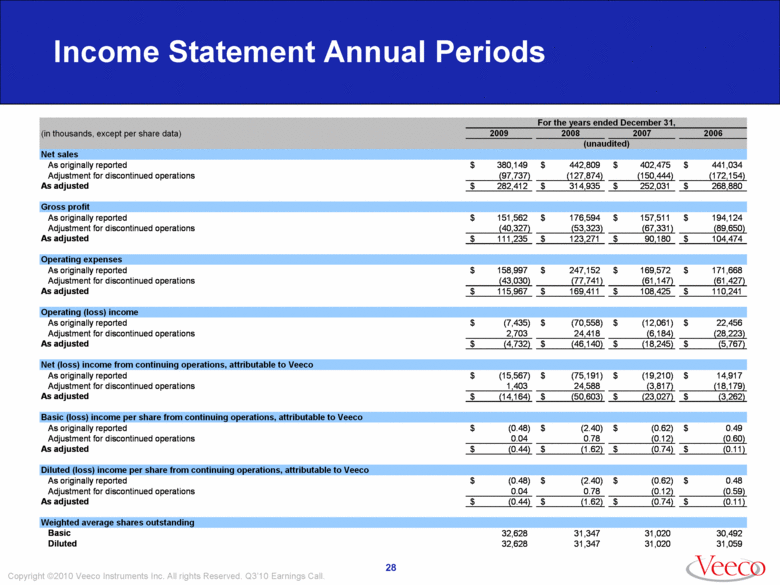
Income Statement Annual Periods 31,059 31,020 31,347 32,628 Diluted 30,492 31,020 31,347 32,628 Basic Weighted average shares outstanding $ (0.11) $ (0.74) $ (1.62) $ (0.44) As adjusted (0.59) (0.12) 0.78 0.04 Adjustment for discontinued operations $ 0.48 $ (0.62) $ (2.40) $ (0.48) As originally reported Diluted (loss) income per share from continuing operations, attributable to Veeco $ (0.11) $ (0.74) $ (1.62) $ (0.44) As adjusted (0.60) (0.12) 0.78 0.04 Adjustment for discontinued operations $ 0.49 $ (0.62) $ (2.40) $ (0.48) As originally reported Basic (loss) income per share from continuing operations, attributable to Veeco $ (3,262) $ (23,027) $ (50,603) $ (14,164) As adjusted (18,179) (3,817) 24,588 1,403 Adjustment for discontinued operations $ 14,917 $ (19,210) $ (75,191) $ (15,567) As originally reported Net (loss) income from continuing operations, attributable to Veeco $ (5,767) $ (18,245) $ (46,140) $ (4,732) As adjusted (28,223) (6,184) 24,418 2,703 Adjustment for discontinued operations $ 22,456 $ (12,061) $ (70,558) $ (7,435) As originally reported Operating (loss) income $ 110,241 $ 108,425 $ 169,411 $ 115,967 As adjusted (61,427) (61,147) (77,741) (43,030) Adjustment for discontinued operations $ 171,668 $ 169,572 $ 247,152 $ 158,997 As originally reported Operating expenses $ 104,474 $ 90,180 $ 123,271 $ 111,235 As adjusted (89,650) (67,331) (53,323) (40,327) Adjustment for discontinued operations $ 194,124 $ 157,511 $ 176,594 $ 151,562 As originally reported Gross profit $ 268,880 $ 252,031 $ 314,935 $ 282,412 As adjusted (172,154) (150,444) (127,874) (97,737) Adjustment for discontinued operations $ 441,034 $ 402,475 $ 442,809 $ 380,149 As originally reported Net sales (unaudited) 2006 2007 2008 2009 (in thousands, except per share data) For the years ended December 31, |
|
|
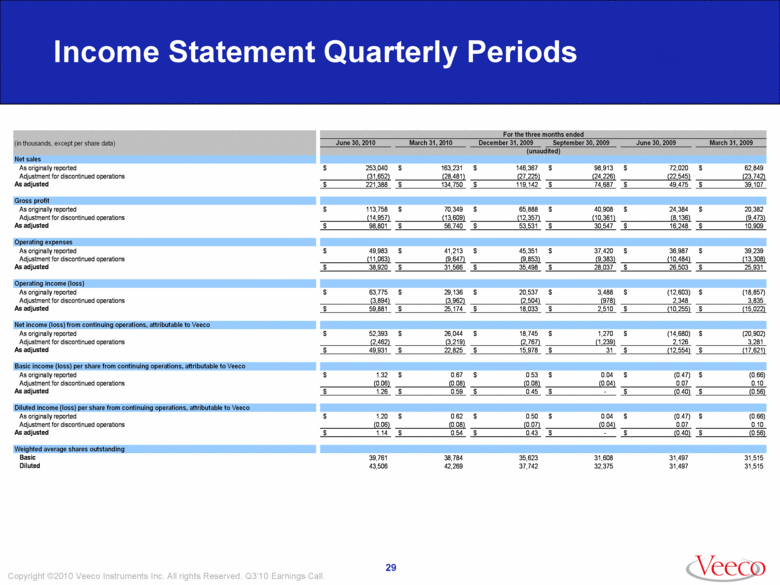
Income Statement Quarterly Periods 31,515 31,497 32,375 37,742 42,269 43,506 Diluted 31,515 31,497 31,608 35,623 38,784 39,761 Basic Weighted average shares outstanding $ (0.56) $ (0.40) $ - $ 0.43 $ 0.54 $ 1.14 As adjusted 0.10 0.07 (0.04) (0.07) (0.08) (0.06) Adjustment for discontinued operations $ (0.66) $ (0.47) $ 0.04 $ 0.50 $ 0.62 $ 1.20 As originally reported Diluted income (loss) per share from continuing operations, attributable to Veeco $ (0.56) $ (0.40) $ - $ 0.45 $ 0.59 $ 1.26 As adjusted 0.10 0.07 (0.04) (0.08) (0.08) (0.06) Adjustment for discontinued operations $ (0.66) $ (0.47) $ 0.04 $ 0.53 $ 0.67 $ 1.32 As originally reported Basic income (loss) per share from continuing operations, attributable to Veeco $ (17,621) $ (12,554) $ 31 $ 15,978 $ 22,825 $ 49,931 As adjusted 3,281 2,126 (1,239) (2,767) (3,219) (2,462) Adjustment for discontinued operations $ (20,902) $ (14,680) $ 1,270 $ 18,745 $ 26,044 $ 52,393 As originally reported Net income (loss) from continuing operations, attributable to Veeco $ (15,022) $ (10,255) $ 2,510 $ 18,033 $ 25,174 $ 59,881 As adjusted 3,835 2,348 (978) (2,504) (3,962) (3,894) Adjustment for discontinued operations $ (18,857) $ (12,603) $ 3,488 $ 20,537 $ 29,136 $ 63,775 As originally reported Operating income (loss) $ 25,931 $ 26,503 $ 28,037 $ 35,498 $ 31,566 $ 38,920 As adjusted (13,308) (10,484) (9,383) (9,853) (9,647) (11,063) Adjustment for discontinued operations $ 39,239 $ 36,987 $ 37,420 $ 45,351 $ 41,213 $ 49,983 As originally reported Operating expenses $ 10,909 $ 16,248 $ 30,547 $ 53,531 $ 56,740 $ 98,801 As adjusted (9,473) (8,136) (10,361) (12,357) (13,609) (14,957) Adjustment for discontinued operations $ 20,382 $ 24,384 $ 40,908 $ 65,888 $ 70,349 $ 113,758 As originally reported Gross profit $ 39,107 $ 49,475 $ 74,687 $ 119,142 $ 134,750 $ 221,388 As adjusted (23,742) (22,545) (24,226) (27,225) (28,481) (31,652) Adjustment for discontinued operations $ 62,849 $ 72,020 $ 98,913 $ 146,367 $ 163,231 $ 253,040 As originally reported Net sales (unaudited) March 31, 2009 June 30, 2009 September 30, 2009 December 31, 2009 March 31, 2010 June 30, 2010 (in thousands, except per share data) For the three months ended |
|
|
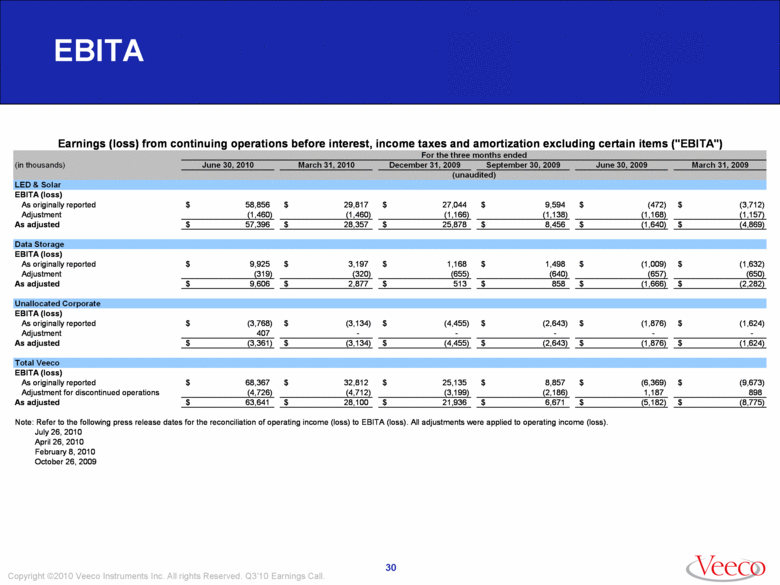
EBITA October 26, 2009 April 26, 2010 July 26, 2010 Note: Refer to the following press release dates for the reconciliation of operating income (loss) to EBITA (loss). All adjustments were applied to operating income (loss). $ (8,775) $ (5,182) $ 6,671 $ 21,936 $ 28,100 $ 63,641 As adjusted 898 1,187 (2,186) (3,199) (4,712) (4,726) Adjustment for discontinued operations $ (9,673) $ (6,369) $ 8,857 $ 25,135 $ 32,812 $ 68,367 As originally reported EBITA (loss) Total Veeco $ (1,624) $ (1,876) $ (2,643) $ (4,455) $ (3,134) $ (3,361) As adjusted - - - - - 407 Adjustment $ (1,624) $ (1,876) $ (2,643) $ (4,455) $ (3,134) $ (3,768) As originally reported EBITA (loss) Unallocated Corporate $ (2,282) $ (1,666) $ 858 $ 513 $ 2,877 $ 9,606 As adjusted (650) (657) (640) (655) (320) (319) Adjustment $ (1,632) $ (1,009) $ 1,498 $ 1,168 $ 3,197 $ 9,925 As originally reported EBITA (loss) Data Storage $ (4,869) $ (1,640) $ 8,456 $ 25,878 $ 28,357 $ 57,396 As adjusted (1,157) (1,168) (1,138) (1,166) (1,460) (1,460) Adjustment $ (3,712) $ (472) $ 9,594 $ 27,044 $ 29,817 $ 58,856 As originally reported EBITA (loss) LED & Solar (unaudited) March 31, 2009 June 30, 2009 September 30, 2009 December 31, 2009 March 31, 2010 June 30, 2010 (in thousands) For the three months ended Earnings (loss) from continuing operations before interest, income taxes and amortization excluding certain items ("EBITA") |

