Attached files
| file | filename |
|---|---|
| EX-3.8 - EX-3.8 - VEECO INSTRUMENTS INC | a2202112zex-3_8.htm |
| EX-32.1 - EX-32.1 - VEECO INSTRUMENTS INC | a2202112zex-32_1.htm |
| EX-21.1 - EX-21.1 - VEECO INSTRUMENTS INC | a2202112zex-21_1.htm |
| EX-31.2 - EX-31.2 - VEECO INSTRUMENTS INC | a2202112zex-31_2.htm |
| EX-31.1 - EX-31.1 - VEECO INSTRUMENTS INC | a2202112zex-31_1.htm |
| EX-32.2 - EX-32.2 - VEECO INSTRUMENTS INC | a2202112zex-32_2.htm |
| EX-23.1 - EX-23.1 - VEECO INSTRUMENTS INC | a2202112zex-23_1.htm |
UNITED STATES
SECURITIES AND EXCHANGE COMMISSION
Washington, D.C. 20549
FORM 10-K
| (Mark One) | ||
ý |
ANNUAL REPORT PURSUANT TO SECTION 13 OR 15(d) OF THE SECURITIES EXCHANGE ACT OF 1934 |
|
For the fiscal year ended December 31, 2010 |
||
OR |
||
o |
TRANSITION REPORT PURSUANT TO SECTION 13 OR 15(d) OF THE SECURITIES EXCHANGE ACT OF 1934 |
|
For the transition period from to . |
||
Commission file number 0-16244
VEECO INSTRUMENTS INC.
(Exact Name of Registrant as Specified in Its Charter)
| Delaware (State or Other Jurisdiction of Incorporation or Organization) |
11-2989601 (I.R.S. Employer Identification No.) |
|
Terminal Drive Plainview, New York (Address of Principal Executive Offices) |
11803 (Zip Code) |
Registrant's telephone number, including area code (516) 677-0200
Website: www.veeco.com
Securities
registered pursuant to Section 12(b) of the Act:
Common Stock, par value $.01 per share
Securities
registered pursuant to Section 12(g) of the Act:
None
Indicate by check mark if the Registrant is a well-known seasoned issuer, as defined in Rule 405 of the Securities Act. Yes ý No o
Indicate by check mark whether the registrant has submitted electronically and posted on its corporate Web site, if any, every Interactive Data File required to be submitted and posted pursuant to Rule 405 of Regulation S-T (§ 232.405 of this chapter) during the preceding 12 months (or for such shorter period that the registrant was required to submit and post such files.) Yes o No o
Indicate by check mark if the Registrant is not required to file reports pursuant to Section 13 or Section 15(d) of the Act. Yes o No ý
Indicate by check mark whether the Registrant: (1) has filed all reports required to be filed by Section 13 or 15(d) of the Securities Exchange Act of 1934 during the preceding 12 months (or for such shorter period that the Registrant was required to file such reports), and (2) has been subject to such filing requirements for the past 90 days. Yes ý No o
Indicate by check mark if disclosure of delinquent filers pursuant to Item 405 of Regulation S-K is not contained herein, and will not be contained, to the best of Registrant's knowledge, in definitive proxy or information statements incorporated by references in Part III of this Form 10-K or any amendment to this Form 10-K. o
Indicate by check mark whether the Registrant is a large accelerated filer, an accelerated filer, a non-accelerated filer, or a smaller reporting company. See the definitions of "large accelerated filer," "accelerated filer," and "smaller reporting company" in Rule 12b-2 of the Exchange Act.
| Large accelerated filer ý | Accelerated filer o | Non-accelerated filer o (Do not check if a smaller reporting company) |
Smaller reporting company o |
Indicate by check mark whether the Registrant is a shell company (as defined in Rule 12b-2 of the Exchange Act). o Yes ý No
The aggregate market value of the voting stock held by non-affiliates of the Registrant, based on the closing price of the common stock on June 27, 2010 as reported on The Nasdaq National Market, was $1,566,934,944. Shares of common stock held by each officer and director and by each person who owns 10% or more of the outstanding common stock have been excluded from this computation in that such persons may be deemed to be affiliates. This determination of affiliate status is not necessarily a conclusive determination for other purposes.
At February 22, 2011, the Registrant had 40,616,024 outstanding shares of common stock.
DOCUMENTS INCORPORATED BY REFERENCE
Portions of the Registrant's Proxy Statement for the Annual Meeting of Stockholders to be held on May 19, 2011 are incorporated by reference into Part III of this Annual Report on Form 10-K.
This Annual Report on Form 10-K (the "Report") contains forward-looking statements within the meaning of the Private Securities Litigation Reform Act of 1995. Discussions containing such forward-looking statements may be found in Items 1, 3, 7 and 7A hereof, as well as within this Report generally. In addition, when used in this Report, the words "believes," "anticipates," "expects," "estimates," "plans," "intends" and similar expressions are intended to identify forward-looking statements. All forward-looking statements are subject to a number of risks and uncertainties that could cause actual results to differ materially from projected results. These risks and uncertainties include, without limitation, the following:
- •
- Our failure to successfully manage our outsourcing activities or failure of our outsourcing partners to perform as
anticipated could adversely affect our results of operations and our ability to realize the benefits of the increased MOCVD order volume;
- •
- The reduction or elimination of foreign government subsidies and economic incentives may adversely affect the future order
rate for our MOCVD equipment;
- •
- Manufacturing interruptions or delays could affect our ability to meet customer demand, while the failure to estimate
customer demand accurately could result in excess or obsolete inventory and/or liabilities to our suppliers for products no longer needed;
- •
- We rely on a limited number of suppliers, some of whom are our sole source for particular components;
- •
- Our backlog is subject to customer cancellation or modification and such cancellation could result in decreased sales and
increased provisions for excess and obsolete inventory and/or liabilities to our suppliers for products no longer needed;
- •
- Our sales to HB LED and data storage manufacturers are highly dependent on these manufacturers' sales for consumer
electronics applications, which can experience significant volatility due to seasonal and other factors. This could materially adversely impact our future results of operations;
- •
- Negative worldwide economic conditions could result in a decrease in our net sales and an increase in our operating costs,
which could adversely affect our business and operating results;
- •
- We are exposed to the risks of operating a global business, including the need to obtain export licenses for certain of
our shipments and political risks in the countries we operate;
- •
- We are exposed to risks associated with our entrance into the emerging solar industry;
- •
- The timing of our orders, shipments, and revenue recognition may cause our quarterly operating results to fluctuate
significantly;
- •
- We operate in industries characterized by rapid technological change;
- •
- We face significant competition;
- •
- We depend on a limited number of customers that operate in highly concentrated industries;
- •
- The cyclicality of the industries we serve directly affects our business;
- •
- Our sales cycle is long and unpredictable;
- •
- Our inability to attract, retain, and motivate key employees could have a material adverse effect on our business;
- •
- The price of our common shares may be volatile and could decline significantly;
1
- •
- We are subject to foreign currency exchange risks;
- •
- The enforcement and protection of our intellectual property rights may be expensive and could divert our limited
resources;
- •
- We may be subject to claims of intellectual property infringement by others;
- •
- Our acquisition strategy subjects us to risks associated with evaluating and pursuing these opportunities and integrating
these businesses;
- •
- We may be required to take additional impairment charges for goodwill and indefinite-lived intangible assets or
definite-lived intangible and long-lived assets;
- •
- We may not receive the escrowed proceeds from the sale of our Metrology business;
- •
- Changes in accounting pronouncements or taxation rules or practices may adversely affect our financial results;
- •
- We are subject to the internal control evaluations and attestation requirements of Section 404 of the
Sarbanes-Oxley Act;
- •
- We are subject to risks of non-compliance with environmental, health and safety regulations;
- •
- We have significant operations in locations which could be materially and adversely impacted in the event of a natural
disaster or other significant disruption;
- •
- We have adopted certain measures that may have anti-takeover effects which may make an acquisition of our
Company by another company more difficult; and
- •
- The matters set forth in this Report generally, including the risk factors set forth in "Item 1A. Risk Factors."
Consequently, such forward-looking statements should be regarded solely as the Company's current plans, estimates, and beliefs. The Company does not undertake any obligation to update any forward-looking statements to reflect future events or circumstances after the date of such statements.
2
The Company
Veeco Instruments Inc. (together with its consolidated subsidiaries, "Veeco," the "Company" or "we") designs, manufactures and markets equipment to make light emitting diodes ("LEDs"), solar panels, hard-disk drives and other devices. We have leading technology positions in our two segments: Light Emitting Diode ("LED") & Solar and Data Storage.
In our LED & Solar segment, we design and manufacture metal organic chemical vapor deposition ("MOCVD") systems, molecular beam epitaxy ("MBE") systems, Copper, Indium, Gallium, Selenide ("CIGS") deposition systems and thermal deposition sources that we sell to manufacturers of high brightness LEDs ("HB LED") and solar panels, as well as to research customers.
In our Data Storage segment, we design and manufacture ion beam etch, ion beam deposition, diamond-like carbon, physical vapor deposition, chemical vapor deposition, and dicing and slicing systems that are primarily used to create thin film magnetic heads ("TFMHs") that read and write data on hard disk drives.
We support our customers through product development, manufacturing, and sales and service sites in the U.S., Korea, Taiwan, China, Singapore, Japan, Europe and other locations.
Veeco Instruments was organized as a Delaware corporation in 1989.
Our Strategy
Our strategy for growth and improved profitability focuses on the following key activities:
- •
- Focusing our efforts on those technologies in which we have a leading market share, providing differentiated technology
solutions to address customers' next generation product development roadmaps;
- •
- Leveraging our research and development spending into end markets that we believe offer high-growth
opportunities, such as our LED & Solar segment;
- •
- Improving our operational efficiency through better supply chain management, best cost manufacturing and other activities
to lower costs and increase profitability, and;
- •
- Developing strategic relationships with worldwide technology leaders and offering these customers high-quality, differentiated products that support their cost of ownership requirements as well as service and applications support in order to improve their time-to-market on leading edge devices.
Business Overview and Industry Trends
General Introduction: Our thin film deposition, etch and other technologies are applicable to the creation of a broad range of microelectronic components, including HB LEDs, solar cells, thin film magnetic heads and compound semiconductor devices. Our customers who manufacture these devices continue to invest in new technology equipment in order to advance their next generation products and deliver more efficient and cost effective technology solutions.
Following the global recession, Veeco experienced a rapid improvement in business conditions in late 2009 and continuing into 2010. The combination of an improvement in capital spending by our global customers as well as our focus on high-growth end markets, particularly HB LED, and successful new product introduction enabled the Company to benefit from accelerated growth in 2010.
The following is a review of our two reportable segments and the multi-year technology trends that impact each.
3
LED & Solar Business Overview and Trends: We are a leading supplier of solutions used to create HB LEDs and solar cells. MOCVD and MBE technologies are used to grow compound semiconductor materials (such as GaAs (gallium arsenide), GaN (gallium nitride), As/P (arsenic phosphide) and InP (indium phosphide)) at the atomic scale. Epitaxy is the critical first step in compound semiconductor wafer fabrication and is considered to be the highest value added process, ultimately determining device functionality and performance.
We believe that the HB LED market, while cyclical, represents a high-growth opportunity for us due to the expanding applications for HB LEDs, such as backlighting for large screen flat panel TVs (LCD—liquid crystal displays), laptop computers, automotive applications, and general illumination. In 2009 and 2010 the LED industry experienced significant growth as LEDs penetrated laptop and television backlighting applications. Strategies Unlimited, an LED industry research organization, forecasted in its June 2010 report that growth in these applications will continue, resulting in a compound annual growth rate ("CAGR") exceeding 80% from 2009 through 2014. LEDs are also starting to experience increased adoption for general lighting, with Strategies Unlimited forecasting a CAGR of 45.4% during that same time period. Overall, the market for HB LEDs is expected to grow from $5.4 billion in 2009 to $19.6 billion in 2014, for a CAGR of 29.5%.
In order to gain market share and capitalize on this growth opportunity, we have accelerated our R&D investments to introduce several generations of MOCVD tools, most recently our TurboDisc® K-Series™ and MaxBright™ MOCVD systems. By introducing new systems, we are focused on delivering better uniformity and repeatability, which helps our customers to make HB LEDs of consistent quality, ultimately with the goal to deliver more, high quality LEDs at a lower manufacturing cost. We intend to continue to invest heavily in research and development in order to deliver more advanced MOCVD solutions to our customers. A related application for us is in the solar market, since the same MOCVD tool that is critical to the LED manufacturing process can also be used to manufacture high-efficiency triple junction solar cells. The Company currently sells a small number of MOCVD systems each year for this concentrator solar (CPV) application and is also beginning to sell tools to an emerging growth market for power devices.
Veeco has also identified the thin film solar cell market as offering significant growth opportunities. The global energy dilemma has triggered a significant amount of new research and spending in solar technologies as an alternative energy solution, since it is non-polluting and has the potential to supply the world with high energy efficiency at low cost. While many of today's solar panels are based upon silicon technologies, thin film CIGS solar cells offer the potential for lower manufacturing costs, and have the highest efficiency of the thin film technologies. According to an October 2010 report released by Greentech Media Research ("GTM"), CIGS module manufacturing costs are projected to be lower than those associated with silicon wafer-based modules. CIGS solar panels have broad-based end market applications for solar farms, commercial and residential rooftops, building integrated and building applied PV (BIPV/BAPV) and portable devices.
Since PV manufacturers often build their own equipment, there is a market opportunity emerging for equipment suppliers such as Veeco. In its October 2010 report, GTM forecasted that CIGS global module capacity will have a CAGR of 49% from 2010 to 2013 with capacity reaching 3.4GW in 2013. We plan to expand our deposition product line to create "best of breed" deposition systems that can deposit materials on flexible (stainless steel) or rigid (glass) substrates. Today Veeco supplies thermal evaporation components to over 50% of CIGS companies worldwide and has begun to penetrate CIGS customers with our deposition system solutions. We are shipping our FastFlex Web Coating Systems for the front and back contact and absorber layer CIGS deposition. These new systems are capable of processing up to 1m web widths that will enable PV manufacturers to continue lowering their cost of ownership. We intend to increase our research and development spending in CIGS technology for both the rigid and flexible substrate market since we believe it offers a significant growth opportunity over the next several years.
4
Data Storage Business Overview and Trends: Worldwide storage demand continues to increase, driven by proliferation of laptop and netbook PC's, intelligent internet storage, e-mail, external storage devices, and new consumer applications (e.g. digital video recorders) now reaching higher volume. While much has been written about the competition hard disk drives ("HDDs") face from flash memory, we believe that HDDs will continue to provide the best value for mass storage and will remain at the forefront of large capacity storage applications. In fact, the use of disk drives in many types of consumer applications has resulted in growth in the number of hard drive units shipped, which is expected to continue. According to data storage research firm TrendFocus' February 2011 report, consumer electronic applications of HDDs are forecasted to grow at a CAGR of 9.4% from 2010 to 2015.
While technology change continues in data storage, the industry has gone through a period of maturation, including vertical integration and consolidation. Veeco is focused on remaining a valued equipment supplier to the data storage industry and is well-aligned to the industry's technology requirements and demand for lower cost of ownership tools. Veeco has restructured and refocused its Data Storage business around core technologies where we have a leadership position and utilize a flexible manufacturing strategy. A recovery in capital spending by our key Data Storage customers, combined with the successful introduction of several new deposition tools to advance areal density technologies, enabled Veeco to report a strong growth year in 2010. Going forward, Veeco's product development team has begun to identify non-hard drive market applications (such as LED) for our key Data Storage technologies.
Our Products
We have two business segments, LED & Solar and Data Storage. Net sales for these business segments are illustrated in the following table:
| |
Year ended December 31, | ||||||||||
|---|---|---|---|---|---|---|---|---|---|---|---|
| |
2010 | 2009 | 2008 | ||||||||
| |
(Dollars in millions) |
||||||||||
LED & Solar |
$ | 797.9 | $ | 205.2 | $ | 165.8 | |||||
% of net sales |
85.5 | % | 72.7 | % | 52.7 | % | |||||
Data Storage |
$ | 135.3 | $ | 77.2 | $ | 149.1 | |||||
% of net sales |
14.5 | % | 27.3 | % | 47.3 | % | |||||
Total net sales |
$ | 933.2 | $ | 282.4 | $ | 314.9 | |||||
See Note 11 to our Consolidated Financial Statements for additional information regarding our reportable segments and sales by geographic location.
LED & Solar
Metal Organic Chemical Vapor Deposition Systems: We are one of the world's leading suppliers of MOCVD technology. MOCVD production systems are used to make GaN-based devices (green and blue HB LEDs) and As/P-based devices (red, orange, and yellow HB LEDs), which are used today in television and laptop backlighting, general illumination, large area signage, specialty illumination and many other applications. Our As/P MOCVD Systems also are used to make high-efficiency concentrator solar cells.
Molecular Beam Epitaxy Systems: MBE is the process of precisely depositing epitaxially aligned atomically thin crystal layers, or epilayers, of elemental materials onto a substrate in an ultra-high vacuum environment. For many compound semiconductors, MBE is the critical first step of the fabrication process, ultimately determining device functionality and performance. We provide a broad
5
array of MBE components and systems for research and production applications and thermal evaporation sources for the CIGS solar industry.
Web and Glass Coaters for Thin Film Solar Cells: We are a manufacturer of web deposition equipment used to make CIGS solar cells. We have expanded our product line to include "best of breed" solutions that perform the critical CIGS deposition steps on flexible and rigid (glass) substrates. We believe that our FastFlex™ and FastLine™ systems offer high throughput and excellent performance for thin film solar cell production, contributing to a lower cost of ownership for our customers.
Data Storage
Ion Beam Deposition ("IBD") Systems: Our NEXUS® IBD systems utilize ion beam technology to deposit precise layers of thin films and may be included on our cluster system platform to allow either parallel or sequential etch/deposition processes. IBD systems deposit high purity thin film layers and provide maximum uniformity and repeatability. In addition to IBD systems, we provide a broad array of ion beam sources.
Ion Beam Etch ("IBE") Systems: Our NEXUS IBE systems etch precise, complex features for use primarily by data storage and telecommunications device manufacturers in the fabrication of discrete and integrated microelectronic devices.
Physical Vapor Deposition ("PVD") Systems: Our NEXUS PVD systems offer manufacturers a highly flexible deposition platform for developing next-generation data storage applications.
Diamond-Like Carbon ("DLC") Deposition Systems: Our DLC deposition systems deposit protective coatings on advanced TFMHs.
Chemical Vapor Deposition ("CVD") Systems: Our NEXUS CVD systems, introduced to the market in 2008, deposit conformal films for advanced TFMH applications.
Precision Lapping, Slicing, and Dicing Systems: Our Optium® products generally are used in "back-end" applications in a data storage fab where TFMHs or "sliders" are fabricated. This equipment includes lapping tools, which enable precise material removal within three nanometers, which is necessary for next generation TFMHs. We also manufacture instruments that slice and dice wafers into rowbars and TFMHs.
Service and Sales
We sell our products and services worldwide through various strategically located sales and service facilities in the U.S., Europe and Asia Pacific, and we believe that our customer service organization is a significant factor in our success. We provide service and support on a warranty, service contract or an individual service-call basis. We offer enhanced warranty coverage and services, including preventative maintenance plans, on-call and on-site service plans and other comprehensive service arrangements, product and application training, consultation services, and a 24-hour hotline service for certain products. We believe that offering timely support creates stronger relationships with customers and provides us with a significant competitive advantage. Revenues from the sale of parts, service and support represented approximately 7%, 16% and 21% of our net sales for the years ended December 31, 2010, 2009 and 2008, respectively. Parts sales represented approximately 5%, 9% and 14% of our net sales for those years, respectively, and service and support sales were 2%, 7% and 7%, respectively.
6
Customers
We sell our products to many of the world's major HB LED, solar and hard drive manufacturers as well as to customers in other industries, research centers, and universities. We rely on certain principal customers for a significant portion of our sales. Sales to LG Innotek Co. Ltd. and Seoul OptoDevice Co. Ltd. each accounted for more than 10% of Veeco's total net sales in 2010, LG Innotek Co. Ltd. and Seagate Technology, Inc. each accounted more than 10% of Veeco's total net sales in 2009 and sales to Seagate Technology, Inc. accounted for 10% or more of Veeco's total net sales in 2008. If any principal customer discontinues its relationship with us or suffers economic difficulties, our business, prospects, financial condition and operating results could be materially and adversely affected.
Research and Development
We believe that continued and timely development of new products and enhancements to existing products are necessary to maintain our competitive position. We work collaboratively with our customers to help ensure our technology and product roadmaps are aligned with customer requirements. Our research and development programs are organized by product line and new or improved products have been introduced into each of our product lines in each of the past three years.
Our research and development expenses were approximately $71.4 million, $43.5 million and $39.6 million, or approximately 8%, 15% and 13% of net sales for the years ended December 31, 2010, 2009 and 2008, respectively. These expenses consisted primarily of salaries, project material and other product development and enhancement costs.
Suppliers
We currently outsource certain functions to third parties, including the manufacture of all or substantially all of our new MOCVD systems, data storage systems, solar deposition systems and ion sources. We primarily rely on several suppliers for the manufacturing of these systems. We plan to maintain internal manufacturing capability for these systems at least until such time as we have qualified one or more alternate suppliers to perform this manufacturing. The failure of our present suppliers to meet their contractual obligations under our supply arrangements and our inability to make alternative arrangements or resume the manufacture of these systems ourselves could have a material adverse effect on our revenues, profitability, cash flows and relationships with our customers.
In addition, certain of the components and sub-assemblies included in our products are obtained from a single source or a limited group of suppliers. Our inability to develop alternative sources, if necessary, could result in a prolonged interruption in supply or a significant increase in the price of one or more components, which could adversely affect our operating results.
Product Development, Marketing and Operations
Our principal activities, which consist of product development, integration, test operations and assembly, are organized by product and take place at our facilities in Plainview and Clifton Park, New York; Camarillo, California; Ft. Collins, Colorado; Somerset, New Jersey; St. Paul, Minnesota; and Lowell, Massachusetts.
Our sales, marketing, manufacturing and research and development functions are organized by product families. We believe that this organizational structure allows each product family manager to more closely monitor the products for which he is responsible, resulting in more efficient sales, marketing, manufacturing and research and development. We emphasize customer responsiveness, customer service, high-quality products and an interactive management style. By implementing these
7
management philosophies, we believe that we have increased our competitiveness and are well-positioned for future growth.
Backlog
Our backlog increased to $555.0 million as of December 31, 2010 from $377.3 million as of December 31, 2009. During the year ended December 31, 2010, we experienced net backlog adjustments of approximately $10.7 million, consisting of $12.5 million for order adjustments ($10.2 million is related to our Solar and MBE businesses) offset by $1.8 million of adjustments related to foreign currency translation.
Our backlog consists of product orders for which we received a firm purchase order, a customer-confirmed shipment date within twelve months and a deposit, where required.
Competition
In each of the markets that we serve, we face substantial competition from established competitors, some of which have greater financial, engineering, manufacturing and marketing resources than us, as well as from smaller competitors. In addition, many of our products face competition from alternative technologies, some of which are more established than those used in our products. Significant factors for customer selection of our tools include system performance, accuracy, repeatability, ease of use, reliability, cost of ownership and technical service and support. We believe that we are competitive based on the customer selection factors in each market we serve. None of our competitors compete with us across all of our product lines.
We compete with manufacturers such as Aixtron, Anelva, Applied Materials, Centrotherm, Nippon Sanso, Oerlikon and Riber.
Intellectual Property
Our success depends in part on our proprietary technology. Although we attempt to protect our intellectual property rights through patents, copyrights, trade secrets and other measures, there can be no assurance that we will be able to protect our technology adequately or that competitors will not be able to develop similar technology independently.
We have patents and exclusive and non-exclusive licenses to patents owned by others covering certain of our products, which we believe provide us with a competitive advantage. We have a policy of seeking patents on inventions concerning new products and improvements as part of our ongoing research, development and manufacturing activities. We believe that there is no single patent or exclusive or non-exclusive license to patents owned by others that is critical to our operations, as the success of our business depends primarily on the technical expertise, innovation, customer satisfaction and experience of our employees.
We also rely upon trade secret protection for our confidential and propriety information. There can be no assurance that others will not independently develop substantially equivalent proprietary information and techniques or otherwise gain access to our trade secrets or that we can meaningfully protect our trade secrets. In addition, we cannot be certain that we will not be sued by third parties alleging that we have infringed their patents or other intellectual property rights. If any third party sues us, our business, results of operations or financial condition could be materially adversely affected.
Employees
As of December 31, 2010, we had 900 employees, of which there were 192 in manufacturing and testing, 109 in sales and marketing, 153 in service, 33 in product support, 274 in engineering, research and development and 139 in information technology, general administration and finance. In addition,
8
we also had 123 temporary employees, which support our variable cost strategy. The success of our future operations depends in large part on our ability to recruit and retain engineers, technicians and other highly-skilled professionals who are in considerable demand. We feel that we have adequate programs in place to attract, motivate and retain our employees. We plan to monitor industry practices to make sure that our compensation and employee benefits remain competitive. However, there can be no assurance that we will be successful in recruiting or retaining key personnel. We believe that our relations with our employees are good.
Available Information
We file annual, quarterly and current reports, information statements and other information with the Securities and Exchange Commission (the "SEC"). The public may obtain information by calling the SEC at 1-800-SEC-0330. The SEC also maintains an Internet site that contains reports, proxy and information statements, and other information regarding issuers that file electronically with the SEC. The address of that site is www.sec.gov.
Internet Address
We maintain a website where additional information concerning our business and various upcoming events can be found. The address of our website is www.veeco.com. We provide a link on our website, under Investors—Financial—SEC Filings, through which investors can access our filings with the SEC, including our annual report on Form 10-K, quarterly reports on Form 10-Q, current reports on Form 8-K and all amendments to those reports. These filings are posted to our website, as soon as reasonably practicable after we electronically file such material with the SEC.
Risk Factors That May Impact Future Results
In addition to the other information set forth herein, the following risk factors should be carefully considered by shareholders of and potential investors in the Company.
Our failure to successfully manage our outsourcing activities or failure of our outsourcing partners to perform as anticipated could adversely affect our results of operations and our ability to realize the benefits of the increased MOCVD order volume.
To better align our costs with market conditions, increase the percentage of variable costs relative to total costs and to increase productivity and operational efficiency, we have outsourced certain functions to third parties, including the manufacture of all or substantially all of our new MOCVD systems, data storage systems, solar deposition systems and ion sources. In addition, to supplement our current staffing and our planned hiring to meet the increased MOCVD order volume, we rely heavily on our outsourcing partners and utilize technical staffing firms and contractors to assist with certain aspects of MOCVD system installation at customer sites. In order to meet the substantial increase in MOCVD system orders, we are relying heavily on our outsourcing partners. Dependence on contract manufacturing and outsourcing may adversely affect our ability to satisfy the recent strong demand for our MOCVD equipment and to bring other new products to market. If our outsourcing partners do not perform successfully, our results of operations may be adversely affected and we could suffer damage to our reputation. Although we attempt to select reputable providers, it is possible that one or more of these providers could fail to perform as we expect. In addition, the expanded role of third party providers has required and will continue to require us to implement changes to our existing operations and adopt new procedures and processes for retaining and managing these providers in order to realize operational efficiencies, assure quality, and protect our intellectual property. If we do not effectively manage our outsourcing strategy or if third party providers do not perform as anticipated, we may not
9
realize the benefits of the increase in MOCVD order volume or gross margin or productivity improvements and we may experience operational difficulties, increased costs, manufacturing and/or installation interruptions or delays, inefficiencies in the structure and/or operation of our supply chain, loss of intellectual property rights, quality issues, increased product time-to-market and/or inefficient allocation of human resources, any or all of which could materially and adversely affect our business, financial condition and results of operations.
The reduction or elimination of foreign government subsidies and economic incentives may adversely affect the future order rate for our MOCVD equipment.
The Chinese government has provided various incentives to encourage development of the LED industry, including subsidizing a significant portion of the purchase cost of MOCVD equipment. These subsidies have enabled and encouraged certain customers in this region to purchase more of our MOCVD equipment than these customers might have purchased without these subsidies. These subsidies are expected to decline over time and may end or be reduced at some point in the future. The reduction or elimination of these incentives may result in a reduction in future orders for our MOCVD equipment in this region which could materially and adversely affect our business, financial condition and results of operations.
A related risk is that many customers are using the Chinese government subsidies, in addition to other incentives from the Chinese government, to build new manufacturing facilities or to expand existing manufacturing facilities. Delays in the start-up of these facilities, and other related issues pertaining to customer readiness, could adversely impact the timing of our revenue recognition and have other negative effects on our financial condition and operating results.
Manufacturing interruptions or delays could affect our ability to meet customer demand, while the failure to estimate customer demand accurately could result in excess or obsolete inventory and/or liabilities to our suppliers for products no longer needed.
Our business depends on our ability to supply equipment, services and related products that meet the rapidly changing technical and volume requirements of our customers, which depends in part on the timely delivery of parts, components and subassemblies (collectively, parts) from suppliers. Some key parts may be subject to long lead-times and/or obtainable only from a single supplier or limited group of suppliers, and some sourcing or subassembly is provided by suppliers located in countries other than the United States. We may experience significant interruptions of our manufacturing operations, delays in our ability to deliver products or services, increased costs or customer order cancellations as a result of:
- •
- the failure or inability of suppliers to timely deliver quality parts;
- •
- volatility in the availability and cost of materials;
- •
- difficulties or delays in obtaining required import or export approvals;
- •
- information technology or infrastructure failures;
- •
- natural disasters (such as earthquakes, floods or storms); or
- •
- other causes (such as regional economic downturns, pandemics, political instability, terrorism, or acts of war) could result in delayed deliveries, manufacturing inefficiencies, increased costs or order cancellations.
In addition, our need to rapidly increase our business and manufacturing capacity to meet unanticipated increases in demand may be limited by working capital constraints of our suppliers and may exacerbate any interruptions in our manufacturing operations and supply chain and the associated effect on our working capital. Moreover, if actual demand for our products is different than expected,
10
we may purchase more/fewer parts than necessary or incur costs for canceling, postponing or expediting delivery of parts. The volatility of demand for capital equipment increases capital, technical and other risks for companies in the supply chain. Any or all of these factors could materially and adversely affect our business, financial condition and results of operations.
We rely on a limited number of suppliers, some of whom are our sole source for particular components.
We currently outsource certain functions to third parties, including the manufacture of all or substantially all of our new MOCVD systems, data storage systems, solar deposition systems and ion sources. We primarily rely on several suppliers for the manufacturing of these systems. We plan to maintain internal manufacturing capability for these systems at least until such time as we have qualified one or more alternate suppliers to perform this manufacturing. The failure of our present suppliers to meet their contractual obligations under our supply arrangements and our inability to make alternative arrangements or resume the manufacture of these systems ourselves could have a material adverse effect on our revenues, profitability, cash flows, and relationships with our customers.
In addition, certain of the components and sub-assemblies included in our products are obtained from a single source or a limited group of suppliers. Our inability to develop alternative sources, if necessary, could result in a prolonged interruption in supply or a significant increase in the price of one or more components, which could adversely affect our operating results.
Our backlog is subject to customer cancellation or modification and such cancellation could result in decreased sales and increased provisions for excess and obsolete inventory and/or liabilities to our suppliers for products no longer needed.
Customer purchase orders are subject to cancellation or rescheduling by the customer, generally with limited or no penalties. Often, we have incurred expenses prior to such cancellation without adequate monetary compensation. During the year ended December 31, 2010, we experienced net backlog adjustments of approximately $10.7 million, consisting of $12.5 million for order adjustments ($10.2 million is related to our Solar and MBE businesses), offset by $1.8 million of adjustments related to foreign currency translation. With our current high backlog, a downturn in one or more of our served markets could result in a significant increase in cancellations and/or rescheduling.
We record a provision for excess and obsolete inventory based on historical and future usage trends and other factors including the consideration of the amount of backlog we have on hand at any particular point in time. If our backlog is canceled or modified, our estimates of future product demand may prove to be inaccurate, in which case we may have understated the provision required for excess and obsolete inventory. In the future, if we determine that our inventory is overvalued, we will be required to recognize such costs in our financial statements at the time of such determination. In addition, we place orders with our suppliers based on our customers' orders to us. If our customers cancel their orders with us, we may not be able to cancel our orders with our suppliers and may be required to take a charge for these cancelled commitments to our suppliers. Any such charges could be material to our results of operations and financial condition.
Our sales to HB LED and data storage manufacturers are highly dependent on these manufacturers' sales for consumer electronics applications, which can experience significant volatility due to seasonal and other factors, which could materially adversely impact our future results of operations.
The demand for HB LEDs and hard disk drives is highly dependent on sales of consumer electronics, such as flat-panel televisions and computer monitors, computers, digital video recorders, camcorders, MP3/4 players and cell phones. Our sales to HB LED manufacturers are also highly dependent on end market adoption of LED technology into general illumination applications, including
11
residential, commercial and street lighting markets. Manufacturers of HB LEDs and hard disk drives are among our largest customers and have accounted for a substantial portion of our revenues for the past several years. Factors that could influence the levels of spending on consumer electronic products include consumer confidence, access to credit, volatility in fuel and other energy costs, conditions in the residential real estate and mortgage markets, labor and healthcare costs and other macroeconomic factors affecting consumer spending behavior. These and other economic factors could have a material adverse effect on the demand for our customers' products and, in turn, on our customers' demand for our products and services and on our financial condition and results of operations. Furthermore, if manufacturers of HB LEDs have overestimated their potential market share growth, we may experience cancellations of orders in backlog, postponement of customer deliveries, obsolete inventory and/or liabilities to our suppliers for products no longer needed.
In addition, the demand for some of our customers' products can be even more volatile and unpredictable due to the possibility of competing technologies, such as flash memory as an alternative to hard disk drives. Should flash memory become cost competitive it may result in a rapid shift in demand from the hard disk drives made by our customers to alternative storage technologies. Unpredictable fluctuations in demand for our customers' products or rapid shifts in demand from our customers' products to alternative technologies could materially adversely impact our future results of operations.
Negative worldwide economic conditions could result in a decrease in our net sales and an increase in our operating costs, which could adversely affect our business and operating results.
As a global company with worldwide operations, we are subject to volatility and adverse consequences associated with worldwide economic downturns. In the event of a worldwide downturn, many of our customers may delay or further reduce their purchases of our products and services. If negative conditions in the global credit markets prevent our customers' access to credit, product orders in these channels may decrease which could result in lower revenue. Likewise, if our suppliers face challenges in obtaining credit, in selling their products or otherwise in operating their businesses, they may become unable to continue to offer the materials we use to manufacture our products. Our results of operations would be further adversely affected if we were to experience lower than anticipated order levels, cancellations of orders in backlog, postponement of customer deliveries, or pricing pressure as a result of a prolonged slowdown.
In addition, negative worldwide economic conditions and market instability make it increasingly difficult for us, our customers and our suppliers to accurately forecast future product demand, which could result in obsolete inventory and/or liabilities to our suppliers for products no longer needed.
Furthermore, we finance a portion of our sales through trade credit. In addition to ongoing credit evaluations of our customers' financial condition, we seek to mitigate our credit risk by obtaining deposits and/or letters of credit on certain of our sales arrangements. We could suffer significant losses if a customer whose accounts receivable we have not secured fails or is otherwise unable to pay us. A significant loss in collections on our accounts receivable would have a negative impact on our financial results.
We are exposed to the risks of operating a global business, including the need to obtain export licenses for certain of our shipments and political risks in the countries we operate.
Approximately 90% of our 2010 net sales, 79% of our 2009 net sales and 58% of our 2008 net sales were generated from sales outside of the United States. We expect sales from non-U.S. markets to continue to represent a significant, and possibly increasing, portion of our sales in the future. Our
12
non-U.S. sales and operations are subject to risks inherent in conducting business abroad, many of which are outside our control, including:
- •
- difficulties in managing a global enterprise, including staffing, managing distributors and representatives, and
repatriation of earnings,
- •
- regional economic downturns, varying foreign government support, and unstable political environments,
- •
- political and social attitudes, laws, rules, regulations and policies within countries that favor domestic companies over
non-domestic companies, including government-supported efforts to promote the development and growth of local competitors,
- •
- longer sales cycles and difficulty in collecting accounts receivable,
- •
- multiple, conflicting, and changing governmental laws and regulations, including import/export controls and other trade
barriers,
- •
- the need to provide sufficient levels of technical support in different locations, and
- •
- different customs and ways of doing business.
Many of these challenges are present in China, which accounted for approximately 30% of our total 2010 revenues. These conditions in China and other foreign economies may continue and recur again in the future, which could have a material adverse effect on our business. In addition, political instability, terrorism, acts of war or epidemics in regions where we operate may adversely affect or disrupt our business and results of operations.
Furthermore, products which are either manufactured in the United States or based on U.S. technology are subject to the United States Export Administration Regulations ("EAR") when exported to and re-exported from international jurisdictions, in addition to the local jurisdiction's export regulations applicable to individual shipments. Currently, our MOCVD deposition systems and certain of our other products are controlled for export under the EAR. Licenses or proper license exceptions may be required for the shipment of our products to certain countries. For example, shipment of our MOCVD systems to China and certain other countries generally requires a U.S. export license. Obtaining an export license requires cooperation from the customer and customer-facility readiness, and can add time to the order fulfillment process. While we have generally been very successful in obtaining export licenses in a timely manner, there can be no assurance that this will continue or that an export license can be obtained in each instance where it is required. If an export license is required but cannot be obtained, then we will not be permitted to export the product to the customer. The administrative processing, potential delay and risk of ultimately not obtaining an export license pose a particular disadvantage to us relative to our non-U.S. competitors who are not required to comply with U.S. export controls. Non-compliance with the EAR or other applicable export regulations could result in a wide range of penalties including the denial of export privileges, fines, criminal penalties, and the seizure of commodities. In the event that any export regulatory body determines that any of our shipments violate applicable export regulations, we could be fined significant sums and/or our export capabilities could be restricted, which could have a material adverse impact on our business.
13
We are exposed to risks associated with our entrance into the emerging solar industry.
An increasing strategic focus for Veeco is to supply equipment to the solar industry. In addition to the other risk factors described herein, the solar industry is characterized by other specific risks, including:
- •
- changes in demand for solar photovoltaic ("PV") products arising from, among other things, the cost and performance of
solar PV technology compared to other energy sources, such as oil, coal, wind, hydroelectric and nuclear;
- •
- the adequacy of or changes in government energy policies, including the availability and amount of government subsidies or
incentives for solar power;
- •
- whether thin film solar technologies, in particular Copper Indium Gallium Selenide ("CIGS") technology, will be broadly
adopted as a viable solar technology over various other intensely competitive alternatives; and
- •
- customers' and end-users' access to affordable financial capital.
If we do not successfully manage the risks resulting from these and other changes occurring in the solar industry, its business, financial condition and results of operations could be materially and adversely affected.
In addition, solar is a relatively new market for us and poses the following additional challenges:
- •
- the need to attract, motivate and retain employees with skills and expertise in this new area;
- •
- new and more diverse customers and suppliers, including some with limited operating histories, uncertain and/or limited
funding and/or evolving business models;
- •
- different customer service requirements;
- •
- new and/or different competitors with potentially more financial or other resources and industry experience;
and
- •
- third parties' intellectual property rights and our ability to secure necessary intellectual property rights with respect to our emerging technologies.
If we do not successfully manage the risks resulting from its entry into the solar market, our business, financial condition and results of operations could be materially and adversely affected.
The timing of our orders, shipments, and revenue recognition may cause our quarterly operating results to fluctuate significantly.
We derive a substantial portion of our net sales in any fiscal period from the sale of a relatively small number of high-priced systems. As a result, the timing of recognition of revenue for a single transaction could have a material effect on our sales and operating results for a particular fiscal period. As is typical in our industry, orders, shipments, and customer acceptances often occur during the last few weeks of a quarter. As a result, delay of only a week or two can often shift the related booking or sale into the next quarter, which could adversely affect our reported results for the prior quarter. Our quarterly results have fluctuated significantly in the past, and we expect this trend to continue. If our orders, shipments, net sales or operating results in a particular quarter do not meet expectations, our stock price may be adversely affected.
14
We operate in industries characterized by rapid technological change.
All of our businesses are subject to rapid technological change. Our ability to remain competitive depends on our ability to enhance existing products and develop and manufacture new products in a timely and cost effective manner and to accurately predict technology transitions. Because new product development commitments must be made well in advance of sales, we must anticipate the future demand for products in selecting which development programs to fund and pursue. Our financial results for 2011 and in the future will depend to a great extent on the successful introduction of several new products, many of which require achieving increasingly stringent technical specifications. We cannot be certain that we will be successful in selecting, developing, manufacturing and marketing new products or new technologies or in enhancing existing products.
We face significant competition.
We face significant competition throughout the world in each of our reportable segments, which may increase as certain markets in which we operate continue to expand. Some of our competitors have greater financial, engineering, manufacturing, and marketing resources than us. In addition, we face competition from smaller emerging equipment companies whose strategy is to provide a portion of the products and services we offer, using innovative technology to sell products into specialized markets. New product introductions or enhancements by our competitors could cause a decline in sales or loss of market acceptance of our existing products. Increased competitive pressure could also lead to intensified price competition resulting in lower margins. Our failure to compete successfully with these other companies would seriously harm our business.
We depend on a limited number of customers that operate in highly concentrated industries.
Our customer base is and has been highly concentrated. Orders from a relatively limited number of customers have accounted for, and likely will continue to account for, a substantial portion of our net sales, which may lead customers to demand pricing and other terms less favorable to us. Based on net sales, our five largest customers accounted for 52%, 52% and 43% of our total net sales in 2010, 2009 and 2008, respectively.
If a principal customer discontinues its relationship with us or suffers economic setbacks, our business, financial condition, and operating results could be materially and adversely affected. Our ability to increase sales in the future will depend in part upon our ability to obtain orders from new customers. We cannot be certain that we will be able to do so. In addition, because a relatively small number of large manufacturers, many of whom are our customers, dominate the industries in which they operate, it may be especially difficult for us to replace these customers if we lose their business. A substantial portion of orders in our backlog are orders from our principal customers.
In addition, a substantial investment is required by customers to install and integrate capital equipment into a production line. As a result, once a manufacturer has selected a particular vendor's capital equipment, we believe that the manufacturer generally relies upon that equipment for the specific production line application and frequently will attempt to consolidate its other capital equipment requirements with the same vendor. Accordingly, if a customer selects a competitor's product over ours for technical superiority or other reasons, we could experience difficulty selling to that customer for a significant period of time.
Furthermore, we do not have long-term contracts with our customers. As a result, our agreements with our customers do not provide any assurance of future sales and we are exposed to competitive price pressure on each new order we attempt to obtain. Our failure to obtain new sales orders from new or existing customers would have a negative impact on our results of operations.
15
The cyclicality of the industries we serve directly affects our business.
Our business depends in large part upon the capital expenditures of manufacturers in the HB LED, solar and data storage markets. We are subject to the business cycles of these industries, the timing, length, and volatility of which are difficult to predict. These industries have historically been highly cyclical and have experienced significant economic downturns in the last decade. As a capital equipment provider, our revenues depend in large part on the spending patterns of these customers, who often delay expenditures or cancel or reschedule orders in reaction to variations in their businesses or general economic conditions. In downturns, we must be able to quickly and effectively align our costs with prevailing market conditions, as well as motivate and retain key employees. However, because a proportion of our costs are fixed, our ability to reduce expenses quickly in response to revenue shortfalls may be limited. A downturn in one or more of these industries could have a material adverse effect on our business, financial condition and operating results. During periods of rapid growth, we must be able to acquire and/or develop sufficient manufacturing capacity to meet customer demand, and attract, hire, assimilate and retain a sufficient number of qualified people. We cannot give assurances that our net sales and operating results will not be adversely affected if our customers experience economic downturns or slowdowns in their businesses.
Our sales cycle is long and unpredictable.
Historically, we have experienced long and unpredictable sales cycles (the period between our initial contact with a potential customer and the time when we recognize revenue from that customer). Our sales cycle can range up to twelve months or longer. The timing of an order often depends on the capital expenditure budget cycle of our customers, which is completely out of our control. In addition, the time it takes us to build a product to customer specifications (the "build cycle") typically ranges from one to six months or longer, followed in certain cases by a period of customer acceptance during which the customer evaluates the performance of the system and may potentially reject the system. As a result of the build cycle and evaluation periods, the period between a customer's initial purchase decision and revenue recognition on an order often varies widely, and variations in length of this period can cause further fluctuations in our operating results. As a result of our lengthy sales cycle, we may incur significant research and development expenses and selling and general and administrative expenses before we generate the related revenues for these products. We may never generate the anticipated revenues if a customer cancels or changes plans. Variations in the length of our sales cycle could also cause our net sales and, therefore, our cash flow and net income to fluctuate widely from period to period.
Our inability to attract, retain, and motivate key employees could have a material adverse effect on our business.
Our success depends upon our ability to attract, retain, and motivate key employees, including those in executive, managerial, engineering and marketing positions, as well as highly skilled and qualified technical personnel and personnel to implement and monitor our financial and managerial controls and reporting systems. Attracting, retaining, and motivating such qualified personnel may be difficult due to challenging industry conditions, competition for such personnel by other technology companies, consolidations and relocations of operations and workforce reductions. While we have entered into Employment Agreements with certain key personnel, our inability to attract, retain, and motivate key personnel could have a material adverse effect on our business, financial condition or operating results.
The price of our common shares may be volatile and could decline significantly.
The stock market in general and the market for technology stocks in particular, has experienced volatility that has often been unrelated to the operating performance of companies. If these market or industry-based fluctuations continue, the trading price of our common shares could decline significantly
16
independent of our actual operating performance, and shareholders could lose all or a substantial part of their investment. The market price of our common shares could fluctuate significantly in response to several factors, including among others:
- •
- general stock market conditions and uncertainty, such as those occasioned by the global liquidity crisis, negative
financial news, and the failure of several large financial institutions;
- •
- receipt of substantial orders or cancellations for our products;
- •
- actual or anticipated variations in our results of operations;
- •
- announcements of financial developments or technological innovations;
- •
- our failure to meet the performance estimates of investment research analysts;
- •
- changes in recommendations and/or financial estimates by investment research analysts;
- •
- strategic transactions, such as acquisitions, divestitures or spin-offs; and
- •
- the occurrence of major catastrophic events.
Significant price and value fluctuations have occurred with respect to the publicly traded securities of the Company and technology companies generally. The price of our common shares is likely to be volatile in the future. In the past, securities class action litigation often has been brought against a company following periods of volatility in the market price of its securities. If similar litigation were pursued against us, it could result in substantial costs and a diversion of management's attention and resources, which could materially and adversely affect our results of operations, financial condition and liquidity.
We are subject to foreign currency exchange risks.
We are exposed to foreign currency exchange rate risks that are inherent in our anticipated sales, sales commitments and assets and liabilities that are denominated in currencies other than the United States dollar. Although we attempt to mitigate our exposure to fluctuations in currency exchange rates, these hedging activities may not always be available or adequate to eliminate, or even mitigate, the impact of our exchange rate exposure. Failure to sufficiently hedge or otherwise manage foreign currency risks properly could materially and adversely affect our revenues and gross margins.
The enforcement and protection of our intellectual property rights may be expensive and could divert our limited resources.
Our success depends in part upon the protection of our intellectual property rights. We rely primarily on patent, copyright, trademark and trade secret laws, as well as nondisclosure and confidentiality agreements and other methods, to protect our proprietary information, technologies and processes. We own various United States and international patents and have additional pending patent applications relating to certain of our products and technologies. The process of seeking patent protection is lengthy and expensive, and we cannot be certain that pending or future applications will actually result in issued patents or that issued patents will be of sufficient scope or strength to provide meaningful protection or commercial advantage. In addition, our intellectual property rights may be circumvented, invalidated or rendered obsolete by the rapid pace of technological change. Policing unauthorized use of our products and technologies is difficult and time consuming. Furthermore, the laws of other countries may less effectively protect our proprietary rights than U.S. laws. Our outsourcing strategy requires that we share certain portions of our technology with our outsourcing partners, which poses additional risks of infringement and trade secret misappropriation. Infringement of our rights by a third party could result in uncompensated lost market and revenue opportunities. We cannot be certain that the steps we have taken will prevent the misappropriation or unauthorized use of our proprietary information and technologies, particularly in foreign countries where the laws may not protect our proprietary intellectual property rights as fully or as readily as United States laws.
17
Further, we cannot be certain that the laws and policies of any country, including the United States, with respect to intellectual property enforcement or licensing will not be changed in a way detrimental to the sale or use of our products or technology.
We may need to litigate to enforce our intellectual property rights, protect our trade secrets or determine the validity and scope of proprietary rights of others. As a result of any such litigation, we could lose our ability to enforce one or more patents or incur substantial unexpected operating costs. Any action we take to enforce our intellectual property rights could be costly and could absorb significant management time and attention, which, in turn, could negatively impact our operating results. In addition, failure to protect our trademark rights could impair our brand identity.
We may be subject to claims of intellectual property infringement by others.
From time to time we have received communications from other parties asserting the existence of patent or other rights which they believe cover certain of our products. We also periodically receive notice from customers who believe that we are required to indemnify them for damages they may incur related to infringement claims made against these customers by third parties. Our customary practice is to evaluate such assertions and to consider the available alternatives, including whether to seek a license, if appropriate. However, we cannot ensure that licenses can be obtained or, if obtained, will be on acceptable terms or that costly litigation or other administrative proceedings will not occur. If we are not able to resolve a claim, negotiate a settlement of the matter, obtain necessary licenses on commercially reasonable terms, and/or successfully prosecute or defend our position, our business, financial condition, and results of operations could be materially and adversely affected.
Our acquisition strategy subjects us to risks associated with evaluating and pursuing these opportunities and integrating these businesses.
We have considered numerous acquisition opportunities and completed several significant acquisitions in the past. We may consider acquisitions of, or investments in, other businesses in the future. Acquisitions involve numerous risks, many of which are unpredictable and beyond our control, including:
- •
- difficulties and increased costs in integrating the personnel, operations, technologies and products of acquired
companies;
- •
- diversion of management's attention while evaluating, pursuing, and integrating the business to be acquired;
- •
- potential loss of key employees of acquired companies, especially if a relocation or change in responsibilities is
involved;
- •
- difficulties in managing geographically dispersed operations in a cost-effective manner;
- •
- lack of synergy or inability to realize expected synergies;
- •
- unknown, underestimated and/or undisclosed commitments or liabilities;
- •
- increased amortization expense relating to intangible assets; and
- •
- the potential impairment and write-down of amounts capitalized as intangible assets and goodwill as part of the acquisition, as a result of technological advancements or worse-than-expected performance by the acquired company.
Our inability to effectively manage these risks could materially and adversely affect our business, financial condition, and operating results.
In addition, if we issue equity securities to pay for an acquisition, the ownership percentage of our then-existing shareholders would be reduced and the value of the shares held by these shareholders could be diluted, which could adversely affect the price of our stock and convertible subordinated
18
notes. If we use cash to pay for an acquisition, the payment could significantly reduce the cash that would be available to fund our operations or other purposes, including making payments on the convertible subordinated notes. There can be no assurance that financing for future acquisitions will be available on favorable terms or at all.
We may be required to take additional impairment charges for goodwill and indefinite-lived intangible assets or definite-lived intangible and long-lived assets.
We are required to assess goodwill and indefinite-lived intangible assets annually for impairment, or on an interim basis whenever certain events occur or circumstances change, such as an adverse change in business climate or a decline in the overall industry, that would more likely than not reduce the fair value of a reporting unit below its carrying amount. We are also required to test our definite-lived intangible and long-lived assets, including acquired intangible assets and property, plant and equipment, for recoverability and impairment whenever there are indicators of impairment, such as an adverse change in business climate.
At December 31, 2010, we had $52.0 million of goodwill and $59.2 million of intangible and long-lived assets, including $42.3 million of property, plant and equipment. As part of our long-term strategy, we may pursue future acquisitions of other companies or assets which could potentially increase our goodwill and intangible and long-lived assets. Adverse changes in business conditions could materially impact our estimates of future operations and result in additional impairment charges to these assets. If our goodwill or intangible and long-lived assets were to become further impaired, our results of operations could be materially and adversely affected.
We may not receive the escrowed proceeds from the sale of our Metrology business.
In connection with the sale of our Metrology business to Bruker Corporation ("Bruker") on October 7, 2010, we agreed to indemnify Bruker, subject to certain limitations, for certain losses arising out of breaches of the representations, warranties and covenants that we made in the Stock Purchase Agreement and in certain related documents. To secure these indemnification obligations, we agreed to deposit into escrow $22.9 million of the consideration paid to us by Bruker, such funds to remain in escrow for twelve months following the closing. In the event of any qualifying indemnification claims, and after following the procedures set forth in the escrow agreement, all or a portion of the escrowed amount may be released and returned to Bruker to satisfy such claims. This would result in a reduction in the purchase price received for the sale of our Metrology business, which could result in a material adverse effect on our financial condition.
Changes in accounting pronouncements or taxation rules or practices may adversely affect our financial results.
Changes in accounting pronouncements or taxation rules or practices can have a significant effect on our reported results. See "Item 7. Management's Discussion and Analysis of Financial Condition and Results of Operations—Application of Critical Accounting Policies" below. New accounting pronouncements or taxation rules and varying interpretations of accounting pronouncements or taxation practices have occurred and may occur in the future. New rules, changes to existing rules, if any, or the questioning of current practices may adversely affect our reported financial results or change the way we conduct our business.
We are subject to internal control evaluations and attestation requirements of Section 404 of the Sarbanes-Oxley Act.
Pursuant to Section 404 of the Sarbanes-Oxley Act of 2002, we must include in our Annual Report on Form 10-K a report of management on the effectiveness of our internal control over financial reporting. Ongoing compliance with this requirement is complex, costly and time-consuming. Although our assessment, testing, and evaluation resulted in our conclusion that, as of December 31, 2010, our
19
internal controls over financial reporting were effective, we cannot predict the outcome of our testing in future periods. If our internal controls are ineffective in future periods, or if our management does not timely assess the adequacy of such internal controls, we could be subject to regulatory sanctions, the public's perception of our Company may decline and our financial results or the market price of our shares could be adversely affected.
We are subject to risks of non-compliance with environmental, health and safety regulations.
We are subject to environmental, health and safety regulations in connection with our business operations, including but not limited to regulations related to the development, manufacture, and use of our products. Failure or inability to comply with existing or future environmental and safety regulations could result in significant remediation liabilities, the imposition of fines and/or the suspension or termination of development, manufacture, or use of certain of our products, each of which could have a material adverse effect on our business, financial condition, and results of operations.
We have significant operations in locations which could be materially and adversely impacted in the event of a natural disaster or other significant disruption.
Our operations in the U.S., the Asia-Pacific region and in other areas could be subject to natural disasters or other significant disruptions, including earthquakes, fires, hurricanes, floods, water shortages, other extreme weather conditions, medical epidemics, acts of terrorism, power shortages and blackouts, telecommunications failures, and other natural and manmade disasters or disruptions. In the event of such a natural disaster or other disruption, we could experience disruptions or interruptions to our operations or the operations of our suppliers, distributors, resellers or customers; destruction of facilities; and/or loss of life, all of which could materially increase our costs and expenses and materially and adversely affect our business, revenue and financial condition.
We have adopted certain measures that may have anti-takeover effects which may make an acquisition of our Company by another company more difficult.
We have adopted, and may in the future adopt, certain measures that may have the effect of delaying, deferring or preventing a takeover or other change in control of our Company that a holder of our common stock might not consider in its best interest. These measures include:
- •
- "blank check" preferred stock;
- •
- classified board of directors;
- •
- shareholder rights plan or "poison pill;" and
- •
- certain certificate of incorporation and bylaws provisions.
Our board of directors has the authority to issue up to 500,000 shares of preferred stock and to fix the rights (including voting rights), preferences and privileges of these shares ("blank check" preferred). Such preferred stock may have rights, including economic rights, senior to our common stock. As a result, the issuance of the preferred stock could have a material adverse effect on the price of our common stock and could make it more difficult for a third party to acquire a majority of our outstanding common stock.
Our board of directors is divided into three classes with each class serving a staggered three-year term. The existence of a classified board will make it more difficult for our shareholders to change the composition (and therefore the policies) of our board of directors in a relatively short period of time.
We have adopted a shareholder rights plan, under which we have granted to our shareholders rights to purchase shares of junior participating preferred stock. This plan or "poison pill" could discourage a takeover that is not approved by our board of directors but which a shareholder might consider in its best interest, thereby adversely affecting our stock price.
20
We have adopted certain certificate of incorporation and bylaws provisions which may have anti-takeover effects. These include: (a) requiring certain actions to be taken at a meeting of shareholders rather than by written consent, (b) requiring a super-majority of shareholders to approve certain amendments to our bylaws, (c) limiting the maximum number of directors, and (d) providing that directors may be removed only for "cause." These measures and those described above may have the effect of delaying, deferring or preventing a takeover or other change in control of Veeco that a holder of our common stock might consider in its best interest.
In addition, we are subject to the provisions of Section 203 of the General Corporation Law of the State of Delaware, which prohibits a Delaware corporation from engaging in any business combination, including mergers and asset sales, with an interested stockholder (generally, a 15% or greater stockholder) for a period of three years after the date of the transaction in which the person became an interested stockholder, unless the business combination is approved in a prescribed manner. The operation of Section 203 may have anti-takeover effects, which could delay, defer or prevent a takeover attempt that a holder of our common stock might consider in its best interest.
Item 1B. Unresolved Staff Comments
None.
Our corporate headquarters and our principal product development and marketing, manufacturing, research and development, training, and sales and service facilities, as well as the approximate size and the segments which utilize such facilities, are:
Owned Facilities Location
|
Approximate Size (sq. ft.) |
Mortgaged | Use | ||||
|---|---|---|---|---|---|---|---|
Plainview, NY |
80,000 | No | Data Storage and LED & Solar and Corporate Headquarters | ||||
Somerset, NJ |
80,000 | No | LED & Solar | ||||
St. Paul, MN(1) |
125,000 | Yes | LED & Solar | ||||
Tucson, AZ(2) |
110,000 | No | Former Metrology Site | ||||
Leased Facilities Location
|
Approximate Size (sq. ft.) |
Lease Expires | Use | |||||
|---|---|---|---|---|---|---|---|---|
Camarillo, CA(3) |
26,000 | 2012 | Data Storage and partially held for sublease | |||||
Fort Collins, CO |
26,000 | 2011 | Data Storage | |||||
Clifton Park, NY |
18,000 | 2014 | LED & Solar | |||||
Clifton Park, NY |
8,000 | 2011 | LED & Solar | |||||
Lowell, MA |
28,000 | 2012 | LED & Solar | |||||
Somerset, NJ |
14,500 | 2011 | LED & Solar | |||||
Somerset, NJ |
9,500 | 2012 | LED & Solar | |||||
Shanghai, China |
17,400 | 2012 | Customer Training Center | |||||
Woodbury, NY(4) |
32,000 | 2011 | Former Corporate Headquarters | |||||
- (1)
- Our
LED & Solar segment utilizes approximately 95,000 square feet of this facility. The balance is available for expansion.
- (2)
- We vacated this facility during the fourth quarter of 2010 in conjunction with the sale of our Metrology segment to Bruker. We are currently leasing this office to Bruker in accordance with a transition services agreement which will expire on October 6, 2011.
21
- (3)
- We
vacated this facility during the second quarter of 2009 in conjunction with the outsourcing of manufacturing for certain Data Storage product lines. We
have reoccupied a portion of this space and are marketing the remaining space for sublease.
- (4)
- We vacated our former Woodbury headquarters during the first quarter of 2008 and consolidated our operations into our Plainview manufacturing facility.
The St. Paul, Minnesota facility is subject to a mortgage, which at December 31, 2010, had an outstanding balance of $2.9 million. We also lease small offices in Santa Clara, California, Chelmsford, Massachusetts and Edina, Minnesota for sales and service. Our foreign subsidiaries lease office space in England, France, Germany, Japan, Korea, Malaysia, Singapore, Thailand, China and Taiwan. We believe our facilities are adequate to meet our current needs.
Environmental
We may, under certain circumstances, be obligated to pay up to $250,000 in connection with the implementation of a comprehensive plan of environmental remediation at our Plainview, New York facility. We have been indemnified by the former owner for any liabilities we may incur in excess of $250,000 with respect to any such remediation. No comprehensive plan has been required to date. Even without consideration of such indemnification, we do not believe that any material loss or expense is probable in connection with any remediation plan that may be proposed.
We are aware that petroleum hydrocarbon contamination has been detected in the soil at the site of a facility formerly leased by us in Santa Barbara, California. We have been indemnified for any liabilities we may incur which arise from environmental contamination at the site. Even without consideration of such indemnification, we do not believe that any material loss or expense is probable in connection with any such liabilities.
The former owner of the land and building in Santa Barbara, California in which our former Metrology operations were located (which business was sold to Bruker on October 7, 2010), has disclosed that there are hazardous substances present in the ground under the building. Management believes that the comprehensive indemnification clause that was part of the purchase contract relating to the purchase of such land provides adequate protection against any environmental issues that may arise. We have provided Bruker with similar indemnification as part of the sale.
Non-Environmental
We are involved in various other legal proceedings arising in the normal course of our business. We do not believe that the ultimate resolution of these matters will have a material adverse effect on our consolidated financial position, results of operations or cash flows.
Item 4. (Removed and Reserved).
22
Item 5. Market for Registrant's Common Equity, Related Stockholder Matters and Issuer Purchases of Equity Securities
Our common stock is quoted on The NASDAQ National Market under the symbol "VECO." The 2010 and 2009 high and low closing bid prices by quarter are as follows:
| |
2010 | 2009 | |||||||||||
|---|---|---|---|---|---|---|---|---|---|---|---|---|---|
| |
High | Low | High | Low | |||||||||
First Quarter |
$ | 43.72 | $ | 30.42 | $ | 7.16 | $ | 3.96 | |||||
Second Quarter |
51.61 | 31.79 | 12.99 | 6.19 | |||||||||
Third Quarter |
45.52 | 31.02 | 23.49 | 11.36 | |||||||||
Fourth Quarter |
49.97 | 33.71 | 34.35 | 21.90 | |||||||||
On February 22, 2011, the closing bid price for our common stock on the NASDAQ National Market was $47.04 and we had 144 shareholders of record.
As of December 31, 2010 we had convertible notes of $105.6 million. The notes accrue interest at 4.125% per annum and mature on April 15, 2012. The notes meet the criteria for determining the effect of the assumed conversion using the treasury stock method of accounting, since we have the ability and the intent to settle the principal amount of the notes in cash. Under the terms of the notes, we may pay the principal amount of converted notes in cash or in shares of common stock. We intend to pay such amounts in cash. Holders may convert the notes at any time during the period beginning on January 15, 2012 through the close of business on the second day prior to April 15, 2012 and earlier upon the occurrence of certain events including our common stock trading at prices equal to or above 130% of the conversion price for at least 20 trading days during the final 30 trading days of the immediately preceding fiscal quarter. At the end of the fourth quarter of 2010, our common stock was trading at prices equal to or above 130% of the conversion price for the specified period and, as a result, the convertible notes are convertible during the first quarter of 2011. Accordingly, the balance of the convertible notes at December 31, 2010 has been classified as current in our Consolidated Balance Sheet. On February 14, 2011, at the option of the holder, $7.5 million of notes were tendered for conversion at a price of $45.95 per share in a net share settlement. As a result, we paid the principal amount of $7.5 million in cash and issued 111,318 shares of our common stock. Accordingly, in the first quarter of 2011 we will take a charge for the related unamortized debt discount totaling $0.3 million. We pay interest on these notes on April 15 and October 15 of each year.
We have not paid dividends on our common stock. The Board of Directors will determine future dividend policy based on our consolidated results of operations, financial condition, capital requirements and other circumstances.
23
Stock Performance Graph
COMPARISON OF 5 YEAR CUMULATIVE TOTAL RETURN*
Among
Veeco Instruments Inc., The S&P Smallcap 600 Index,
The PHLX Semiconductor Index And RDG MidCap Technology Index
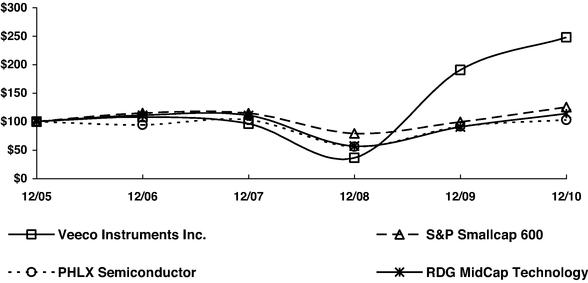
- *
- $100
invested on 12/31/05 in stock or index, including reinvestment of dividends.
Fiscal year ending December 31.
Copyright© 2011 S&P, a division of The McGraw-Hill Companies Inc. All rights reserved.
ASSUMES $100 INVESTED ON DEC. 31, 2005
ASSUMES DIVIDENDS REINVESTED
FISCAL YEAR ENDING DEC. 31
| |
2005 | 2006 | 2007 | 2008 | 2009 | 2010 | |||||||||||||
|---|---|---|---|---|---|---|---|---|---|---|---|---|---|---|---|---|---|---|---|
Veeco Instruments Inc. |
100.00 | 108.08 | 96.36 | 36.58 | 190.65 | 247.89 | |||||||||||||
S&P Smallcap 600 |
100.00 | 115.12 | 114.78 | 79.11 | 99.34 | 125.47 | |||||||||||||
PHLX Semiconductor |
100.00 | 94.47 | 102.99 | 56.15 | 91.67 | 103.11 | |||||||||||||
RDG MidCap Technology |
100.00 | 111.34 | 110.83 | 56.91 | 90.56 | 114.02 | |||||||||||||
24
Treasury Stock
The following table contains the Company's stock repurchases of equity securities in the fourth quarter of 2010:
Period
|
Total Number of Shares Repurchased |
Average Price Paid Per Share |
Total Number of Shares Purchased as Part of Publicly Announced Program(1) |
Approximate Dollar Value of Shares that May Yet Be Purchased Under the Program(1) |
|||||||||
|---|---|---|---|---|---|---|---|---|---|---|---|---|---|
Fiscal month of October 2010 (September 27, 2010—October 24, 2010)(2) |
189,218 | 34.33 | 1,118,600 | 161,901,746 | |||||||||
- (1)
- On
August 24, 2010, we announced that our Board of Directors had authorized the repurchase of up to $200 million of our common stock until
August 26, 2011. The program does not obligate the Company to acquire any particular amount of common stock and may be modified or suspended at any time at the Company's discretion.
- (2)
- We had no repurchases in the fiscal months of November and December 2010.
25
Item 6. Selected Consolidated Financial Data
The financial data set forth below should be read in conjunction with "Management's Discussion and Analysis of Financial Condition and Results of Operations" and with our Consolidated Financial Statements and notes thereto included elsewhere in this Form 10-K.
| |
Year ended December 31, | |||||||||||||||||
|---|---|---|---|---|---|---|---|---|---|---|---|---|---|---|---|---|---|---|
| |
2010(1) | 2009(2) | 2008(3) | 2007(4) | 2006(5) | |||||||||||||
| |
(In thousands, except per share data) |
|||||||||||||||||
Statement of Operations Data: |
||||||||||||||||||
Net sales |
$ | 933,231 | $ | 282,412 | $ | 314,935 | $ | 252,031 | $ | 268,880 | ||||||||
Operating income (loss) from continuing operations |
277,575 | (4,732 | ) | (46,140 | ) | (18,245 | ) | (5,767 | ) | |||||||||
Income (loss) from continuing operations, net of income taxes |
260,531 | (14,229 | ) | (50,833 | ) | (23,655 | ) | (4,620 | ) | |||||||||
Income (loss) from discontinued operations, net of income taxes |
101,229 | (1,403 | ) | (24,588 | ) | 3,817 | 18,179 | |||||||||||
Net loss attributable to noncontrolling interest |
— | (65 | ) | (230 | ) | (628 | ) | (1,358 | ) | |||||||||
Net income (loss) attributable to Veeco |
$ | 361,760 | $ | (15,567 | ) | $ | (75,191 | ) | $ | (19,210 | ) | $ | 14,917 | |||||
Income (loss) per common share attributable to Veeco: |
||||||||||||||||||
Basic: |
||||||||||||||||||
Continuing operations |
$ | 6.60 | $ | (0.44 | ) | $ | (1.62 | ) | $ | (0.74 | ) | $ | (0.11 | ) | ||||
Discontinued operations |
2.56 | (0.04 | ) | (0.78 | ) | 0.12 | 0.60 | |||||||||||
Income (loss) |
$ | 9.16 | $ | (0.48 | ) | $ | (2.40 | ) | $ | (0.62 | ) | $ | 0.49 | |||||
Diluted : |
||||||||||||||||||
Continuing operations |
$ | 6.13 | $ | (0.44 | ) | $ | (1.62 | ) | $ | (0.74 | ) | $ | (0.11 | ) | ||||
Discontinued operations |
2.38 | (0.04 | ) | (0.78 | ) | 0.12 | 0.60 | |||||||||||
Income (loss) |
$ | 8.51 | $ | (0.48 | ) | $ | (2.40 | ) | $ | (0.62 | ) | $ | 0.49 | |||||
Weighted average shares outstanding: |
||||||||||||||||||
Basic |
39,499 | 32,628 | 31,347 | 31,020 | 30,492 | |||||||||||||
Diluted |
42,514 | 32,628 | 31,347 | 31,020 | 30,492 | |||||||||||||
| |
December 31, | |||||||||||||||
|---|---|---|---|---|---|---|---|---|---|---|---|---|---|---|---|---|
| |
2010 | 2009 | 2008 | 2007 | 2006 | |||||||||||
| |
(In thousands) |
|||||||||||||||
Balance Sheet Data: |
||||||||||||||||
Cash and cash equivalents |
$ | 245,132 | $ | 148,500 | $ | 102,521 | $ | 116,875 | $ | 146,880 | ||||||
Short-term investments |
394,180 | 135,000 | — | — | — | |||||||||||
Restricted cash |
76,115 | — | — | — | — | |||||||||||
Working capital |
640,139 | 317,317 | 168,528 | 112,089 | 172,447 | |||||||||||
Goodwill |
52,003 | 52,003 | 51,741 | 71,544 | 71,544 | |||||||||||
Total assets |
1,148,034 | 605,372 | 429,541 | 529,334 | 589,600 | |||||||||||
Long-term debt (including current installments) |
104,021 | 101,176 | 98,526 | 132,118 | 203,774 | |||||||||||
Total equity |
762,512 | 359,059 | 225,026 | 288,144 | 281,751 | |||||||||||
- (1)
- On August 15, 2010, we signed a definitive agreement to sell our Metrology business to Bruker comprising our entire Metrology reporting segment for $229.4 million. Accordingly, Metrology's
26
operating results are accounted for as discontinued operations in determining the consolidated results of operations. The sales transaction closed on October 7, 2010, except for assets located in China due to local restrictions. Total proceeds, which included a working capital adjustment of $1 million, totaled $230.4 million of which $7.2 million relates to the assets in China. As part of our agreement with Bruker, $22.9 million of proceeds is held in escrow and is restricted from use for one year from the closing date of the transaction to secure certain specified losses arising out of breaches of representations, warranties and covenants we made in the stock purchase agreement and related documents. As part of the sale we incurred transaction costs, which consisted of investment bank fees and legal fees, totaling $5.2 million. The Company recognized a pre-tax gain on disposal of $156.3 million and a pre-tax deferred gain of $5.4 million related to the assets in China.
In addition, operating income and income from continuing operations includes a restructuring credit of $0.2 million.
- (2)
- Operating
loss and net loss from continuing operations include restructuring expenses of $4.8 million, as well as an asset impairment charge of
$0.3 million for property, plant and equipment no longer being utilized in our Data Storage segment and a $1.5 million inventory write-off associated with Data Storage legacy
products.
- (3)
- Operating
loss and net loss from continuing operations include a $51.4 million asset impairment charge of which $30.4 million was related to
goodwill and $21.0 million was related to other long-lived assets, a restructuring charge of $9.4 million consisting of lease-related commitments, the mutually
agreed-upon termination of the employment agreement with our former CEO and personnel severance costs and $1.5 million in cost of sales related to the required purchase accounting
adjustment to write up inventory to fair value in connection with the purchase of Mill Lane Engineering. Net loss from continuing operations also reflects a net gain from the early extinguishment of
debt in the amount of $3.8 million.
- (4)
- Operating
loss and net loss from continuing operations include restructuring expenses of $4.8 million, as well as charges of $1.1 million and
$4.8 million associated with the write-off of property and equipment and inventory, respectively, related to product lines discontinued as part of management's cost reduction plan.
Net loss from continuing operations also reflects a net gain from the early extinguishment of debt in the amount of $0.7 million.
- (5)
- Operating income and net loss from continuing operations are net of a write-off of $1.2 million of in-process research and development projects related to the Fluens acquisition. Net loss from continuing operations also reflects a net gain from the early extinguishment of debt in the amount of $0.3 million.
27
Item 7. Management's Discussion and Analysis of Financial Condition and Results of Operations
Executive Summary
We make equipment to develop and manufacture light emitting diodes ("LEDs"), solar panels, hard-disk drives and other devices. We have leading technology positions in our two segments: LED & Solar and Data Storage.
In our LED & Solar segment, we design and manufacture metal organic chemical vapor deposition ("MOCVD") systems, molecular beam epitaxy ("MBE") systems, Copper, Indium, Gallium, Selenide ("CIGS") deposition systems and thermal deposition sources which we sell to manufacturers of high brightness LEDs ("HB LED") and solar panels, as well as to scientific research customers.
In our Data Storage segment, we design and manufacture ion beam etch, ion beam deposition, diamond-like carbon, physical vapor deposition, chemical vapor deposition, and dicing and slicing systems primarily used to create thin film magnetic heads ("TFMHs") that read and write data on hard disk drives.
We support our customers through product development, manufacturing, sales and service sites in the U.S., Korea, Taiwan, China, Singapore, Japan, Europe and other locations.
Summary of Results for 2010
In 2010, Veeco reported the best year in its history in terms of revenue and profitability. Selected financial highlights include:
- •
- Revenue increased 231% to $933.2 million in 2010 from $282.4 million in 2009. LED & Solar revenues
increased 289% to $797.9 million from $205.2 in 2009. Data Storage revenues increased 75% to $135.3 million from $77.2 million in 2009;
- •
- Orders were up 108% to $1,121.6 million in 2010 compared to $538.3 million in 2009;
- •
- Our gross margin increased to 48% for 2010 from 39% in 2009. Gross margins in LED & Solar increased to 47% from 40%
in 2009, and Data Storage gross margins increased to 49% from 37% in 2009.
- •
- Our selling, general and administrative expenses increased to $91.8 million from $62.2 million in 2009.
Selling general and administrative expenses were 10% of net sales in 2010, compared with 22% of net sales in 2009;
- •
- Our research and development expenses increased to $71.4 million from $43.5 million in 2009. Research and
development expenses were 8% of net sales in 2010, compared with 15% in 2009;
- •
- Net income (loss) from continuing operations attributable to Veeco in 2010 was $260.5 million compared ($14.2)
million in 2009;
- •
- Net income (loss) from continuing operations attributable to Veeco per share was $6.13 compared to ($0.44) in 2009; and
- •
- We generated net cash of $96.6 million during 2010, principally due to $45.2 million in proceeds from stock option exercises, $23.3 million of excess tax benefits relating to stock option exercises, and cash provided by operations of $194.2 million, partially offset by treasury stock repurchases of $38.1 million and restricted stock tax withholdings of $4.6 million and cash used in investing activities of $121.6 million, which is net of $225.2 million in net proceeds from the sale of our Metrology segment.
28
Business Highlights of 2010
Veeco's 2010 results were at record levels, with revenue of $933 million and net income from continuing operations of $261 million. These results were achieved through a combination of world-class products, a focus on high-growth market opportunities, operational excellence, our flexible manufacturing strategy, and a deep commitment to satisfying our global customers.
- •
- Veeco increased growth and profitability in our LED & Solar segment, which is also referred to as our "green"
equipment business. In LED we penetrated new customers, significantly increased our market share, increased R&D investment, launched a next-generation MOCVD system and ramped our
manufacturing capacity utilizing a scalable, outsourced model. In Solar we continued to improve the process development of our CIGS product line.
- •
- Veeco's Data Storage business delivered record levels of profitability over the last 5 years as a result of a turnaround in business conditions combined with our flexible manufacturing strategy.
Outlook
With starting backlog of $555 million, and anticipating strong first half 2011 bookings, we currently forecast that Veeco's 2011 revenues will be greater than $1 billion. We are optimistic about the future and believe that we are well positioned from a technology, product and operational standpoint to grow our LED & Solar and Data Storage businesses in 2011 and beyond.
As we look toward the future, we believe that the HB LED industry will continue its multi-year MOCVD tool investment cycle as HB LEDs increase their penetration in backlighting applications and general illumination. We are also seeing strong interest in our thermal deposition solutions for the manufacturing of CIGS solar cells, and believe that Veeco is well positioned to increase our business in this market. In addition, overall business conditions in our Data Storage segment appear to be continuing to improve and with a strong starting-year backlog, we are forecasting revenue growth in this business in 2011.
Our outlook discussion above constitutes "forward-looking statements" within the meaning of Section 27A of the Securities Act of 1933, as amended, and Section 21E of the Securities Exchange Act of 1934, as amended. Our expectations regarding future results are subject to risks and uncertainties. Our actual results may differ materially from those anticipated.
You should not place undue reliance on any forward-looking statements, which speak only as of the dates they are made.
29
Results of Operations
Years Ended December 31, 2010 and 2009
The following table shows our Consolidated Statements of Operations, percentages of sales and comparisons between 2010 and 2009 (dollars in 000s):
| |
Year ended December 31, | Dollar and Percentage Change Year to Year |
||||||||||||||||||
|---|---|---|---|---|---|---|---|---|---|---|---|---|---|---|---|---|---|---|---|---|
| |
2010 | 2009 | ||||||||||||||||||
Net sales |
$ | 933,231 | 100.0 | % | $ | 282,412 | 100.0 | % | $ | 650,819 | 230.5 | % | ||||||||
Cost of sales |
489,406 | 52.4 | 171,177 | 60.6 | 318,229 | 185.9 | ||||||||||||||
Gross profit |
443,825 | 47.6 | 111,235 | 39.4 | 332,590 | 299.0 | ||||||||||||||
Operating expenses (income): |
||||||||||||||||||||
Selling, general and administrative |
91,777 | 9.8 | 62,151 | 22.0 | 29,626 | 47.7 | ||||||||||||||
Research and development |
71,390 | 7.6 | 43,483 | 15.4 | 27,907 | 64.2 | ||||||||||||||
Amortization |
4,876 | 0.5 | 5,168 | 1.8 | (292 | ) | (5.7 | ) | ||||||||||||
Restructuring |
(179 | ) | — | 4,837 | 1.7 | (5,016 | ) | * | ||||||||||||
Asset impairment |
— | — | 304 | 0.1 | (304 | ) | (100.0 | ) | ||||||||||||
Other, net |
(1,614 | ) | (0.2 | ) | 24 | 0.0 | (1,638 | ) | * | |||||||||||
Total operating expenses |
166,250 | 17.8 | 115,967 | 41.1 | 50,283 | 43.4 | ||||||||||||||
Operating income (loss) |
277,575 | 29.7 | (4,732 | ) | (1.7 | ) | 282,307 | * | ||||||||||||
Interest expense, net |
6,572 | 0.7 | 6,850 | 2.4 | (278 | ) | (4.1 | ) | ||||||||||||
Income (loss) from continuing operations before income taxes |
271,003 | 29.0 | (11,582 | ) | (4.1 | ) | 282,585 | * | ||||||||||||
Income tax provision |
10,472 | 1.1 | 2,647 | 0.9 | 7,825 | 295.6 | ||||||||||||||
Income (loss) from continuing operations |
260,531 | 27.9 | (14,229 | ) | (5.0 | ) | 274,760 | * | ||||||||||||
Discontinued operations: |
||||||||||||||||||||
Income (loss) from discontinued operations, before income taxes (includes gain on disposal of $156,290 in 2010) |
155,455 | 16.7 | (2,703 | ) | (1.0 | ) | 158,158 | * | ||||||||||||
Income tax provision (benefit) |
54,226 | 5.8 | (1,300 | ) | (0.5 | ) | 55,526 | * | ||||||||||||
Income (loss) from discontinued operations |
101,229 | 10.8 | (1,403 | ) | (0.5 | ) | 102,632 | * | ||||||||||||
Net income (loss) |
361,760 | 38.8 | (15,632 | ) | (5.5 | ) | 377,392 | * | ||||||||||||
Net loss attributable to noncontrolling interest |
— | — | (65 | ) | 0.1 | 65 | (100.0 | ) | ||||||||||||
Net income (loss) attributable to Veeco |
$ | 361,760 | 38.8 | % | $ | (15,567 | ) | (5.5 | )% | $ | 377,327 | * | ||||||||
- *
- Not Meaningful
30
Net sales of $933.2 million for the year ended December 31, 2010, were up 230.5% compared to 2009. The following is an analysis of sales and orders by segment and by region (dollars in 000s):
| |
Sales | Orders | |||||||||||||||||||||||||||||||
|---|---|---|---|---|---|---|---|---|---|---|---|---|---|---|---|---|---|---|---|---|---|---|---|---|---|---|---|---|---|---|---|---|---|
| |
Year ended December 31, |
Dollar and Percentage Change |
Year ended December 31, |
Dollar and Percentage Change |
Book to Bill Ratio |
||||||||||||||||||||||||||||
| |
2010 | 2009 | Year to Year | 2010 | 2009 | Year to Year | 2010 | 2009 | |||||||||||||||||||||||||
Segment Analysis |
|||||||||||||||||||||||||||||||||
LED & Solar |
$ | 797,904 | $ | 205,153 | $ | 592,751 | 288.9 | % | $ | 968,232 | $ | 440,784 | $ | 527,448 | 119.7 | % | 1.21 | 2.15 | |||||||||||||||
Data Storage |
135,327 | 77,259 | 58,068 | 75.2 | 153,406 | 97,497 | 55,909 | 57.3 | 1.13 | 1.26 | |||||||||||||||||||||||
Total |
$ | 933,231 | $ | 282,412 | $ | 650,819 | 230.5 | % | $ | 1,121,638 | $ | 538,281 | $ | 583,357 | 108.4 | % | 1.20 | 1.91 | |||||||||||||||
Regional Analysis |
|||||||||||||||||||||||||||||||||
Americas |
$ | 94,985 | $ | 60,730 | $ | 34,255 | 56.4 | % | $ | 107,128 | $ | 78,196 | $ | 28,932 | 37.0 | % | 1.13 | 1.29 | |||||||||||||||
Europe, Middle East and Africa ("EMEA") |
92,112 | 50,088 | 42,024 | 83.9 | 83,784 | 47,186 | 36,598 | 77.6 | 0.91 | 0.94 | |||||||||||||||||||||||
Korea |
301,026 | 99,132 | 201,894 | 203.7 | 207,337 | 236,114 | (28,777 | ) | (12.2 | ) | 0.69 | 2.38 | |||||||||||||||||||||
China |
266,813 | 31,114 | 235,699 | 757.5 | 537,740 | 90,724 | 447,016 | 492.7 | 2.02 | 2.92 | |||||||||||||||||||||||
Taiwan |
101,130 | 13,882 | 87,248 | 628.5 | 112,016 | 34,642 | 77,374 | 223.4 | 1.11 | 2.50 | |||||||||||||||||||||||
Other Asia Pacific |
77,165 | 27,466 | 49,699 | 180.9 | 73,633 | 51,419 | 22,214 | 43.2 | 0.95 | 1.87 | |||||||||||||||||||||||
Asia Pacific |
746,134 | 171,594 | 574,540 | 334.8 | 930,726 | 412,899 | 517,827 | 125.4 | 1.25 | 2.41 | |||||||||||||||||||||||
Total |
$ | 933,231 | $ | 282,412 | $ | 650,819 | 230.5 | % | $ | 1,121,638 | $ | 538,281 | $ | 583,357 | 108.4 | % | 1.20 | 1.91 | |||||||||||||||
By segment, LED & Solar sales increased 288.9% in 2010 due to increases in shipments of our newest systems as compared to 2009 (334 system shipments in 2010 versus 72 system shipments in 2009 in our MOCVD business) as a result of an increase in demand for HB LED backlighting applications and general illumination. Data Storage sales also increased 75.2%, primarily as a result of an increase in capital spending by data storage customers for capacity and technology buys. LED & Solar sales represented 85.5% of total sales for the year ended December 31, 2010, up from 72.6% in the prior year. Data Storage sales accounted for 14.5% of net sales, down from 27.4% in the prior year. By region, net sales increased by 334.8% in Asia Pacific, primarily due to MOCVD sales to HB LED customers. In addition, sales in the Americas and EMEA also increased 56.4% and 83.9%, respectively. We believe that there will continue to be year-to-year variations in the geographic distribution of sales.
Orders in 2010 increased 108.4% compared to 2009, primarily attributable to a 119.7% increase in LED & Solar orders that were principally driven by HB LED manufacturers increasing production for television and laptop backlighting applications. Data Storage orders increased 57.3% from the continued increase in our customer's capital spending for capacity and technology buys.
Our book-to-bill ratio for 2010, which is calculated by dividing orders received in a given time period by revenue recognized in the same time period, was 1.20 to 1 compared to 1.91 to 1 in 2009. Our backlog as of December 31, 2010 was $555.0 million, compared to $377.3 million as of December 31, 2009. During the year ended December 31, 2010, we experienced net backlog adjustments of approximately $10.7 million, consisting of $12.5 million for order adjustments ($10.2 million is related to our Solar and MBE businesses), offset by $1.8 million of adjustments related to foreign currency translation. For certain sales arrangements we require a deposit for a portion of the sales price before shipment. As of December 31, 2010 and 2009 we had deposits and advanced billings of $129.2 million and $59.8 million, respectively.
31
Gross Profit
Gross profit was $443.8 million or 47.6% for 2010 compared to $111.2 million or 39.4% in 2009. LED & Solar gross margins increased to 47.4% from 40.4% in the prior year, primarily due to increases in volume (262 additional system shipments and 185 additional final acceptances received compared to prior year in our MOCVD business) and higher average selling prices coupled with lower manufacturing costs. Data Storage gross margins increased to 48.5% from 36.6% in the prior year due to increased sales volume and a favorable product mix. During 2009, Data Storage gross margins were also negatively impacted by a charge to cost of sales of $1.5 million for the write off of inventory associated with discontinued legacy product lines.
Operating Expenses
Selling, general and administrative expenses increased by $29.6 million or 47.7%, from the prior year primarily to support the business ramp in our LED & Solar segment. Selling, general and administrative expenses were 9.8% of net sales in 2010, compared with 22.0% of net sales in the prior year.
Research and development expense increased $27.9 million or 64.2% from the prior year, primarily due to continued product development in areas of high-growth for end market opportunities in our LED & Solar segment. As a percentage of net sales, research and development expense decreased to 7.6% from 15.4% in the prior year.
Amortization expense decreased $0.3 million or 5.7% from the prior year. This decrease is mainly due to certain intangibles being fully amortized at the end of 2009.
Restructuring credit of $0.2 million for the year ended December 31, 2010, was attributable to a change in estimate in our Data Storage segment. Restructuring expense of $4.8 million for the year ended December 31, 2009, consisted primarily of personnel severance costs of $3.4 million associated with the reduction of approximately 164 employees in our workforce. Additionally, we took a $1.4 million charge during the second quarter of 2009 for costs associated with vacating a leased facility in Camarillo, California and the related relocation of 27 employees.
During 2009, the Company recorded a $0.3 million asset impairment charge. The charge was for property, plant and equipment no longer being utilized in our Data Storage segment.
Interest Expense, net
Interest expense, net for 2010 was $6.6 million, comprised of $4.7 million in cash interest and $3.5 million in non-cash interest primarily relating to our convertible debt, partially offset by $1.6 million in interest income earned on our cash and short-term investment balances. Interest expense, net for 2009 was $6.9 million, comprised of $4.9 million in cash interest and $2.8 million in non-cash interest, partially offset by $0.8 million in interest income. The non-cash interest expense is related to accounting rules that requires a portion of convertible debt to be allocated to equity in 2010 and 2009 and accretion of debt discounts and amortization of debt premiums related to our short-term investments in 2010.
Income Taxes
The income tax provision attributable to continuing operations for the year ended December 31, 2010 was $10.5 million compared to $2.6 million or 22.9% of income before taxes in the prior year. The 2010 provision for income taxes included $8.0 million relating to our foreign operations and $2.5 million relating to our domestic operations. The 2009 provision for income taxes included $1.6 million relating to our foreign operations and $1.0 million relating to our domestic operations. Our effective tax rate is lower than the statutory rate as a result of the utilization of our domestic net
32
operating loss and tax credit carry forwards. It is anticipated that our effective tax rate for 2011 will approach the U.S. statutory rate
Discontinued Operations
Discontinued operations represent the results of the operations of our disposed Metrology segment which was sold to Bruker on October 7, 2010, reported as discontinued operations. The 2010 results reflect an operational loss before taxes of $0.8 million and a gain on disposal of $156.3 million before taxes.
Years Ended December 31, 2009 and 2008
The following table shows our Consolidated Statements of Operations, percentages of sales, and comparisons between 2009 and 2008 (dollars in 000s):
| |
Year ended December 31, | Dollar and Percentage Change Year to Year |
||||||||||||||||||
|---|---|---|---|---|---|---|---|---|---|---|---|---|---|---|---|---|---|---|---|---|
| |
2009 | 2008 | ||||||||||||||||||
Net sales |
$ | 282,412 | 100.0 | % | $ | 314,935 | 100.0 | % | $ | (32,523 | ) | (10.3 | )% | |||||||
Cost of sales |
171,177 | 60.6 | 191,664 | 60.9 | (20,487 | ) | (10.7 | ) | ||||||||||||
Gross profit |
111,235 | 39.4 | 123,271 | 39.1 | (12,036 | ) | (9.8 | ) | ||||||||||||
Operating expenses (income): |
||||||||||||||||||||
Selling, general and administrative |
62,151 | 22.0 | 60,542 | 19.2 | 1,609 | 2.7 | ||||||||||||||
Research and development |
43,483 | 15.4 | 39,608 | 12.6 | 3,875 | 9.8 | ||||||||||||||
Amortization |
5,168 | 1.8 | 8,864 | 2.8 | (3,696 | ) | (41.7 | ) | ||||||||||||
Restructuring |
4,837 | 1.7 | 9,424 | 3.0 | (4,587 | ) | (48.7 | ) | ||||||||||||
Asset impairment |
304 | 0.1 | 51,387 | 16.3 | (51,083 | ) | (99.4 | ) | ||||||||||||
Other, net |
24 | — | (414 | ) | (0.1 | ) | 438 | * | ||||||||||||
Total operating expenses |
115,967 | 41.1 | 169,411 | 53.8 | (53,444 | ) | (31.5 | ) | ||||||||||||
Operating loss |
(4,732 | ) | (1.7 | ) | (46,140 | ) | (14.7 | ) | 41,408 | (89.7 | ) | |||||||||
Interest expense, net |
6,850 | 2.4 | 6,729 | 2.1 | 121 | 1.8 | ||||||||||||||
Gain on extinguishment of debt |
— | — | (3,758 | ) | (1.2 | ) | 3,758 | (100.0 | ) | |||||||||||
Loss from continuing operations before income taxes |
(11,582 | ) | (4.1 | ) | (49,111 | ) | (15.6 | ) | 37,529 | (76.4 | ) | |||||||||
Income tax provision |
2,647 | 0.9 | 1,722 | 0.5 | 925 | 53.7 | ||||||||||||||
Loss from continuing operations |
(14,229 | ) | (5.0 | ) | (50,833 | ) | (16.1 | ) | 36,604 | (72.0 | ) | |||||||||
Discontinued operations: |
||||||||||||||||||||
Loss from discontinued operations, before income taxes |
(2,703 | ) | (1.0 | ) | (24,418 | ) | (7.8 | ) | 21,715 | (88.9 | ) | |||||||||
Income tax (benefit) provision |
(1,300 | ) | (0.5 | ) | 170 | 0.1 | (1,470 | ) | * | |||||||||||
Loss from discontinued operations |
(1,403 | ) | (0.5 | ) | (24,588 | ) | (7.8 | ) | 23,185 | (94.3 | ) | |||||||||
Net loss |
(15,632 | ) | (5.5 | ) | (75,421 | ) | (23.9 | ) | 59,789 | (79.3 | ) | |||||||||
Net loss attributable to noncontrolling interest |
(65 | ) | — | (230 | ) | (0.1 | ) | 165 | (71.7 | ) | ||||||||||
Net loss attributable to Veeco |
$ | (15,567 | ) | (5.5 | )% | $ | (75,191 | ) | (23.9 | )% | $ | 59,624 | (79.3 | )% | ||||||
- *
- Not Meaningful
33
Net Sales and Orders
Net sales of $282.4 million for the year ended December 31, 2009, were down 10.3% compared to 2008. The following is an analysis of sales and orders by segment and by region (dollars in 000s):
| |
Sales | Orders | |
|
|||||||||||||||||||||||||||||
|---|---|---|---|---|---|---|---|---|---|---|---|---|---|---|---|---|---|---|---|---|---|---|---|---|---|---|---|---|---|---|---|---|---|
| |
Year ended December 31, | Dollar and Percentage Change | Year ended December 31, | Dollar and Percentage Change | Book to Bill Ratio | ||||||||||||||||||||||||||||
| |
2009 | 2008 | Year to Year | 2009 | 2008 | Year to Year | 2009 | 2008 | |||||||||||||||||||||||||
Segment Analysis |
|||||||||||||||||||||||||||||||||
LED & Solar |
$ | 205,153 | $ | 165,812 | $ | 39,341 | 23.7 | % | $ | 440,784 | $ | 160,162 | $ | 280,622 | 175.2 | % | 2.15 | 0.97 | |||||||||||||||
Data Storage |
77,259 | 149,123 | (71,864 | ) | (48.2 | ) | 97,497 | 138,653 | (41,156 | ) | (29.7 | ) | 1.26 | 0.93 | |||||||||||||||||||
Total |
$ | 282,412 | $ | 314,935 | $ | (32,523 | ) | (10.3 | )% | $ | 538,281 | $ | 298,815 | $ | 239,466 | 80.1 | % | 1.91 | 0.95 | ||||||||||||||
Regional Analysis |
|||||||||||||||||||||||||||||||||
Americas |
$ | 60,730 | $ | 130,573 | $ | (69,843 | ) | (53.5 | )% | $ | 78,196 | $ | 108,172 | $ | (29,976 | ) | (27.7 | )% | 1.29 | 0.83 | |||||||||||||
EMEA |
50,088 | 57,567 | (7,479 | ) | (13.0 | ) | 47,186 | 51,731 | (4,545 | ) | (8.8 | ) | 0.94 | 0.90 | |||||||||||||||||||
Korea |
99,132 | 8,887 | 90,245 | 1,015.5 | 236,114 | 15,864 | 220,250 | 1,388.4 | 2.38 | 1.79 | |||||||||||||||||||||||
China |
31,114 | 19,575 | 11,539 | 58.9 | 90,724 | 32,202 | 58,522 | 181.7 | 2.92 | 1.65 | |||||||||||||||||||||||
Taiwan |
13,882 | 39,124 | (25,242 | ) | (64.5 | ) | 34,642 | 30,999 | 3,643 | 11.8 | 2.50 | 0.79 | |||||||||||||||||||||
Other Asia Pacific |
27,466 | 59,209 | (31,743 | ) | (53.6 | ) | 51,419 | 59,847 | (8,428 | ) | (14.1 | ) | 1.87 | 1.01 | |||||||||||||||||||
Asia Pacific |
171,594 | 126,795 | 44,799 | 35.3 | 412,899 | 138,912 | 273,987 | 197.2 | 2.41 | 1.10 | |||||||||||||||||||||||
Total |
$ | 282,412 | $ | 314,935 | $ | (32,523 | ) | (10.3 | )% | $ | 538,281 | $ | 298,815 | $ | 239,466 | 80.1 | % | 1.91 | 0.95 | ||||||||||||||
By segment, LED & Solar sales increased 23.7% due to an increase in end user demand for HB LED backlighting applications, higher average selling prices and strong customer acceptance of Veeco's newest generation systems. Offsetting this increase, Data Storage sales were down 48.2%, primarily as a result of a slowdown in capital spending by data storage customers. LED & Solar sales represented 72.6% of total sales for the year ended December 31, 2009, up from 52.6% in the prior year. Data Storage sales accounted for 27.4% of net sales, down from 47.4% in the prior year. By region, net sales increased by 35.3% in Asia Pacific, primarily due to MOCVD sales to HB LED customers, while sales in the Americas and EMEA declined 53.5% and 13.0%, respectively.
Orders in 2009 increased 80.1% compared to 2008, primarily attributable to a 175.2% increase in LED & Solar orders that were principally driven by HB LED manufacturers increasing production for television and laptop backlighting applications and demand for CIGS deposition systems and components. Data Storage orders declined 29.7% from the continued slow down in our customers capital spending.
Our book-to-bill ratio for 2009 was 1.91 to 1 compared to 0.95 to 1 in 2008. Our backlog as of December 31, 2009 was $377.3 million, compared to $125.6 million as of December 31, 2008. During the year ended December 31, 2009, we experienced net backlog adjustments of approximately $4.1 million, consisting of $3.2 million for order cancellations, primarily in the first half of the year, and $0.9 million of adjustments related to foreign currency translation. For certain sales arrangements we require a deposit for a portion of the sales price before shipment. As of December 31, 2009 and 2008 we had deposits and advanced billings of $59.8 million and $16.1 million, respectively.
Gross Profit
Gross profit increased to $111.2 million or 39.4% in 2009 compared to $123.3 million or 39.1% in 2008. Despite the overall $32.5 million decrease in sales, gross margin remained flat, primarily due to the favorable impact of significant cost reductions from a reduced workforce, lower facilities costs associated with closing and consolidating facilities and the outsourcing of certain Data Storage product manufacturing to Asia. LED & Solar gross margins increased from 38.3% in the prior year to 40.4%,
34
primarily due to the impact of our lower fixed cost structure and a 23.7% increase in sales volume as well as favorable pricing and higher margins on new MOCVD products. Data Storage gross margins decreased from 40.2% in the prior year to 36.6% mainly due to decreased sales volume partially offset by reduced costs due to our expense reduction plans compared to the prior year. Data Storage gross margins were also negatively impacted by a charge to cost of sales of $1.5 million during 2009 for the write off of inventory associated with discontinued legacy product lines.
Operating Expenses
Selling, general and administrative expenses increased by $1.6 million or 2.7%, from the prior year primarily due to the ramp-up in our MOCVD business in the second half of 2009. Selling, general and administrative expenses were 22.0% of net sales in 2009, compared with 19.2% of net sales in the prior year.
Research and development expense increased $3.9 million or 9.8% from the prior year, primarily due to investments in areas that we believe are higher-growth end market opportunities, particularly in our LED & Solar segment. As a percentage of net sales, research and development expense increased to 15.4% from 12.6% in the prior year.
Amortization expense decreased $3.7 million or 41.7% from the prior year. This decrease is mainly due to certain intangibles in LED & Solar being fully amortized at the end of 2008 as well as the write-off of purchased technology in Data Storage in connection with the asset impairment charges recorded during the fourth quarter of 2008.
Restructuring expense of $4.8 million for the year ended December 31, 2009, consisted primarily of personnel severance costs of $3.4 million associated with the reduction of approximately 164 employees in our workforce. Additionally, we took a $1.4 million charge during 2009 for costs associated with vacating a leased facility in Camarillo, California, during the second quarter and the related relocation of 27 employees.
During the second quarter of 2009, the Company recorded a $0.3 million asset impairment charge. The charge was for property, plant and equipment no longer being utilized in our Data Storage reporting unit. During 2008, the Company recorded a $51.4 million asset impairment charge, of which $51.1 million was recorded during the fourth quarter and $0.3 million was recorded during the first quarter. The fourth quarter charge consisted of $30.4 million related to goodwill, $19.6 million related to intangible assets and $1.1 million in property, plant and equipment. The first quarter charge consisted of $0.3 million associated with property and equipment abandoned as part of the consolidation of our corporate headquarters into our Plainview facility.
Interest Expense, net
Interest expense, net for 2009 was $6.9 million, comprised of $4.9 million in cash interest and $2.8 million in non-cash interest relating to our convertible debt, partially offset by $0.8 million in interest income earned on our cash and short-term investment balances. Interest expense, net for 2008 was $6.7 million, comprised of $6.4 million in cash interest and $2.9 million in non-cash interest, partially offset by $2.6 million in interest income. The non-cash interest expense in both years is related to accounting rules that requires a portion of convertible debt to be allocated to equity. The decrease of $1.5 million in cash interest expense from the prior year was primarily due to the repayment of $25.3 million of our convertible notes in the fourth quarter of 2008. Interest income decreased by $1.7 million due principally to the lower interest rate yields on cash balances invested during 2009 compared to the prior year.
35
Gain on Extinguishment of Debt
During the fourth quarter of 2008, we made two repurchases of $12.2 million in aggregate principal amount of our convertible subordinated notes for $7.2 million in cash, of which $7.1 million related to principal and $0.1 million related to accrued interest, reducing the amount outstanding from $117.8 million to $105.6 million. As a result of these repurchases, we recorded a net gain from the extinguishment of debt of approximately $3.8 million. There were no repurchases during 2009.
Income Taxes
The income tax provision attributable to continuing operations for the year ended December 31, 2009 was $2.6 million compared to $1.7 million in the prior year. The 2009 provision for income taxes included $1.6 million relating to our foreign operations and $1.0 million relating to our domestic operations. Due to significant domestic net operating loss carry forwards, which are fully reserved by a valuation allowance, our domestic operations are not expected to incur significant federal income taxes until such time as the net operating losses are utilized.
Discontinued Operations
Discontinued operations represent the results of the operations of our disposed Metrology segment, which was sold to Bruker on October 7, 2010.
Liquidity and Capital Resources
Historically, our principal capital requirements have included the funding of acquisitions, capital expenditures and the repayment of debt. We traditionally have generated cash from operations and debt and stock issuances. Our ability to generate sufficient cash flows from operations is dependent on the continued demand for our products and services.
Cash and cash equivalents as of December 31, 2010 was $245.1 million. This amount represents an increase of $96.6 million from December 31, 2009. We also had short-term investments and restricted cash of $394.2 million and $76.1 million, respectively, as of December 31, 2010. A summary of the current year cash flow activity is as follows (in thousands):
| |
Year ended December 31, |
||||||
|---|---|---|---|---|---|---|---|
| |
2010 | 2009 | |||||
Net income (loss) |
$ | 361,760 | $ | (15,632 | ) | ||
Net cash provided by operating activities |
$ | 194,214 | $ | 59,038 | |||
Net cash used in investing activities |
(121,621 | ) | (154,765 | ) | |||
Net cash provided by financing activities |
25,505 | 141,869 | |||||
Effect of exchange rates on cash and cash equivalents |
(1,466 | ) | (163 | ) | |||
Net increase in cash and cash equivalents |
96,632 | 45,979 | |||||
Cash and cash equivalents at beginning of year |
148,500 | 102,521 | |||||
Cash and cash equivalents at end of year |
$ | 245,132 | $ | 148,500 | |||
Cash provided by operations during the year ended December 31, 2010 was $194.2 million compared to $59.0 million during the year ended December 31, 2009. The $194.2 million cash provided by operations in 2010 included adjustments to the $361.8 million of net income for non-cash items, which reduced the cash provided by net income by $168.3 million. The adjustments consisted of $12.9 million of depreciation and amortization, $9.6 million of non-cash equity-based compensation expense, $3.1 million of amortization of debt discount, $(25.1) million of deferred income taxes, $(23.3) million of excess tax benefits from stock option exercises, $(156.3) million of gain on disposal of our
36
Metrology segment and $10.0 million of discontinued operations. Net cash provided by operations was favorably impacted by a net $0.7 million of changes in operating assets and liabilities, which included an $83.2 million increase in accounts receivable, a $49.5 million increase in inventories, due to the significant increase in orders in our LED & Solar segment compared to 2009, a $23.3 million increase in supplier deposits and a $5.5 million increase in discontinued operations, partially offset by an $85.5 million increase in accrued expenses, principally resulting from customer deposits associated primarily with the significant increase in orders in our LED & Solar segment and a $78.9 million increase in income taxes payable. Cash provided by operations during the year ended December 31, 2009 was $59.0 million and included adjustments to the $15.6 million net loss for non-cash items, which primarily consisted of $13.9 million of depreciation and amortization, $7.5 million of non-cash stock-based compensation expense, $2.8 million of amortization of debt discount, a $1.5 million non-cash inventory write-off and $8.8 million of discontinued operations. Net cash provided by operations in 2009 was favorably impacted by a net $40.1 million of changes in operating assets and liabilities.
Cash used in investing activities of $121.6 million during the year ended December 31, 2010, resulted primarily from $506.1 million of purchases of short-term investments, $10.7 million of capital expenditures, $76.1 million of transfers to restricted cash and $0.5 million of discontinued operations, partially offset by proceeds of $33.0 million from the sale of short-term investments, $225.2 million net proceeds from the disposal of our Metrology segment and $213.6 million from the maturity of CDAR's. Cash used in investing activities of $154.8 million for the year ended December 31, 2009, resulted primarily from $135.0 million of purchases of short-term investments, $7.5 million of capital expenditures, $0.9 million of discontinued operations, $9.8 million of earn-out payments to the former owners of businesses acquired and $2.4 million for certain acquisitions, partially offset by $0.8 million of proceeds from the sale of property, plant and equipment.
Cash provided by financing activities of $25.5 million during the year ended December 31, 2010, consisted primarily of $45.2 million of cash proceeds from stock option exercises and $23.3 million excess tax benefits from stock options exercises, partially offset by $4.6 million of restricted stock tax withholdings, $38.1 million of purchases of treasury stock and $0.2 million of repayments of long-term debt. Cash provided by financing activities of $141.9 million during the year ended December 31, 2009, consisted primarily of $130.1 million in cash proceeds from the issuance of common stock through a secondary public offering and $12.6 million from stock option exercises partially offset by $0.6 million of restricted stock tax withholdings and $0.2 million of repayments of long-term debt.
As of December 31, 2010 we had notes of $105.6 million principal amount outstanding. The notes accrue interest at 4.125% per annum and mature on April 15, 2012. The notes meet the criteria for determining the effect of the assumed conversion using the treasury stock method of accounting, since we have the ability and the intent to settle the principal amount of the notes in cash. Under the terms of the notes, we may pay the principal amount of converted notes in cash or in shares of common stock. We intend to pay such amounts in cash.
The notes are initially convertible into 36.7277 shares of common stock per $1,000 principal amount of notes (equivalent to a conversion price of $27.23 per share or a premium of 38% over the closing market price for our common stock on April 16, 2007). On or after April 20, 2011, we may redeem the notes, in whole or in part, for cash at 100% of the principal amount of the notes to be redeemed and the conversion premium in shares of our common stock plus accrued and unpaid interest to, but not including, the redemption date. Holders may convert the notes at any time during the period beginning on January 15, 2012 through the close of business on the second day prior to April 15, 2012 and earlier upon the occurrence of certain events including our common stock trading at prices equal to or above 130% of the conversion price for at least 20 trading days during the final 30 trading days of the immediately preceding fiscal quarter. At the end of the fourth quarter of 2010, our common stock was trading at prices equal to or above 130% of the conversion price for the specified period and, as a result, the convertible notes are convertible during the first quarter of 2011. If the
37
convertible notes are converted, we have the ability and intent to pay the principal balance of notes tendered for conversion in cash. We will re-perform this test each quarter up to and including the fourth quarter of 2011. Accordingly, the balance of the convertible notes at December 31, 2010 has been classified as current in our Consolidated Balance Sheet. On February 14, 2011, at the option of the holder, $7.5 million of notes were tendered for conversion at a price of $45.95 per share in a net share settlement. As a result, we paid the principal amount of $7.5 million in cash and issued 111,318 shares of our common stock. Accordingly, in the first quarter of 2011 we will take a charge for the related unamortized debt discount totaling $0.3 million. We pay interest on these notes on April 15 and October 15 of each year. The notes are unsecured and are effectively subordinated to all of our senior and secured indebtedness and to all indebtedness and other liabilities of our subsidiaries.
As of December 31, 2010, we had $76.1 million of restricted cash consisting of $22.9 million that relates to the proceeds received from the sale of our Metrology segment. This cash is held in escrow and is restricted from use for one year from the closing date of the transaction to secure any losses arising out of breaches of representations, warranties and covenants we made in the stock purchase agreement and related documents. Additionally, we also had restricted cash consisting of $53.2 million which serves as collateral for bank guarantees that provide financial assurance that the Company will fulfill certain customer obligations. This cash is held in custody by the issuing bank, and is restricted as to withdrawal or use while the related bank guarantees are outstanding.
As of December 31, 2010, our contractual cash obligations and commitments are as follows (in thousands):
| |
Payments due by period | |||||||||||||||
|---|---|---|---|---|---|---|---|---|---|---|---|---|---|---|---|---|
Contractual Cash Obligations and Commitments
|
Total | Less than 1 year |
1-3 years | 3-5 years | More than 5 years |
|||||||||||
Long-term debt(1) |
$ | 108,457 | $ | 105,803 | $ | 516 | $ | 604 | $ | 1,534 | ||||||
Interest on debt(1) |
6,976 | 4,575 | 1,833 | 298 | 270 | |||||||||||
Operating leases(2) |
9,464 | 3,915 | 4,083 | 1,236 | 230 | |||||||||||
Letters of credit and bank guarantees(3) |
136,315 | 136,315 | — | — | — | |||||||||||
Purchase commitments(4) |
200,296 | 200,296 | — | — | — | |||||||||||
|
$ | 461,508 | $ | 450,904 | $ | 6,432 | $ | 2,138 | $ | 2,034 | ||||||
- (1)
- Long-term
debt obligations consist of repayment of our convertible subordinated notes and related interest, as well as mortgage and interest
payments for our St. Paul, MN facility.
- (2)
- In
accordance with relevant accounting guidance, we account for our office leases as operating leases with expiration dates ranging from 2010 through 2017.
There are future minimum annual rental payments required under the leases. Leasehold improvements made at the beginning of or during a lease are amortized over the shorter of the remaining lease term
or the estimated useful lives of the assets.
- (3)
- Issued
by a bank on our behalf as needed. We had letters of credit outstanding of $0.2 million and bank guarantees outstanding of
$135.8 million, of which, $83.2 million can be drawn against lines of credit in our foreign subsidiaries and $52.6 million that is collateralized against cash that is restricted
from use.
- (4)
- Purchase commitments are primarily for inventory used in manufacturing our products. It has been our practice not to enter into purchase commitments extending beyond one year.
38
We believe that existing cash balances and short-term investments together with cash generated from operations will be sufficient to meet our projected working capital and other cash flow requirements for the next twelve months, as well as our contractual obligations, detailed in the above table. We believe we will be able to meet our obligation to repay the $105.6 million subordinated notes that mature on April 15, 2012 with available cash and short-term investments or, if necessary, through a combination of conversion of the notes outstanding, cash generated from operations and other means.
Off-Balance Sheet Arrangements
We do not have any off-balance sheet arrangements that have, or are reasonably likely to have, a current or future material effect on our financial condition, changes in financial condition, revenue or expenses, results of operations, liquidity, capital expenditures or capital resources other than operating leases, letters of credit and bank guarantees, and purchase commitments disclosed in the preceding "Contractual Cash Obligations and Commitments" table.
Application of Critical Accounting Policies
General: Our discussion and analysis of our financial condition and results of operations are based upon our Consolidated Financial Statements, which have been prepared in accordance with accounting principles generally accepted in the United States. The preparation of these financial statements requires us to make estimates and judgments that affect the reported amounts of assets, liabilities, revenues and expenses. Management continually monitors and evaluates its estimates and judgments, including those related to bad debts, inventories, intangible and other long-lived assets, income taxes, warranty obligations, restructuring costs, and contingent liabilities, including potential litigation. Management bases its estimates and judgments on historical experience and on various other factors that are believed to be reasonable under the circumstances, the results of which form the basis for making judgments about the carrying values of assets and liabilities that are not readily apparent from other sources. Actual results may differ from these estimates under different assumptions or conditions. We consider certain accounting policies related to revenue recognition, short-term investments, the valuation of inventories, the impairment of goodwill and indefinite-lived intangible assets, the impairment of long-lived assets, fair value measurements, warranty costs, income taxes and equity-based compensation to be critical policies due to the estimation processes involved in each.
Revenue Recognition: We recognize revenue based on current accounting guidance provided by the Securities and Exchange Commission ("SEC") and the Financial Accounting Standards Board ("FASB"). Our revenue transactions include sales of products under multiple-element arrangements. Revenue under these arrangements is allocated to each element based upon its estimated fair market value.
We consider a broad array of facts and circumstances when evaluating each of our sales arrangements in determining when to recognize revenue, including specific terms of the purchase order, contractual obligations to the customer, the complexity of the customer's post-delivery acceptance provisions, customer creditworthiness and the installation process. Management also considers the party responsible for installation, whether there are process specification requirements which need to be demonstrated before final sign off and payment, whether Veeco can replicate the field testing conditions and procedures in our factory and our past experience with demonstrating and installing a particular system. Sales arrangements are reviewed on a case-by-case basis; however, the Company's revenue recognition protocol for established systems is as described below.
System revenue is generally recognized upon shipment or delivery provided title and risk of loss has passed to the customer, evidence of an arrangement exists, prices are contractually fixed or determinable, collectability is reasonably assured and there are no material uncertainties regarding customer acceptance. Revenue from installation services is recognized at the time acceptance is
39
received from the customer. If the arrangement does not meet all the above criteria, the entire amount of the sales arrangement is deferred until the criteria have been met or all elements have been delivered to the customer or been completed.
For those transactions on which we recognize systems revenue, either at the time of shipment or delivery, our sales and contractual arrangements with customers do not contain provisions for right of return or forfeiture, refund or other purchase price concessions. In the rare instances where such provisions are included, the Company defers all revenue until customer acceptance is achieved. In cases where products are sold with a retention of 10% to 20%, which is typically payable by the customer when installation and field acceptance provisions are completed, the customer has the right to withhold this payment until such provisions have been achieved. We defer the greater of the retention amount or the fair value of the installation on systems that we recognize revenue at the time of shipment or delivery.
For new products, new applications of existing products or for products with substantive customer acceptance provisions where performance cannot be fully assessed prior to meeting agreed upon specifications at the customer site, revenue is deferred as deferred profit in the accompanying Consolidated Balance Sheets and fully recognized upon completion of installation and receipt of final customer acceptance.
Our systems are principally sold to manufacturers in the HB-LED, the data storage and solar industries. Sales arrangements for these systems generally include customer acceptance criteria based upon Veeco and/or customer specifications. Prior to shipment a customer source inspection of the system is performed in our facility or test data is sent to the customer documenting that the system is functioning within agreed upon specifications. Such source inspection or test data replicates the acceptance testing that will be performed at the customer's site prior to final acceptance of the system. Customer acceptance provisions include reassembly and installation of the system at the customer site, which includes performing functional or mechanical test procedures (i.e. hardware checks, leak testing, gas flow monitoring and quality control checks of the basic features of the product.) Additionally, a material demonstration process may be performed to validate the functionality of the product. Upon meeting the agreed upon specifications the customer approves final acceptance of the product.
Veeco generally is required to install these products and demonstrate compliance with acceptance tests at the customer's facility. Such installations typically are not considered complex and the installation process is not deemed essential to the functionality of the equipment because it does not involve significant changes to the features or capabilities of the equipment or involve building complex interfaces or connections. We have a demonstrated history of completing such installations in a timely, consistent manner and can reliably estimate the costs of such. In such cases, the test environment at our facilities prior to shipment replicates the customer's environment. While there are others in the industry with sufficient knowledge about the installation process for our systems as a practical matter, most customers engage the Company to perform the installation services.
In Japan, where our contractual terms with customers generally specify risk of loss and title transfers upon customer acceptance, revenue is recognized and the customer is billed upon receipt of written customer acceptance.
Revenue related to maintenance and service contracts is recognized ratably over the applicable contract term. Component and spare part revenue is recognized at the time of shipment or delivery in accordance with the terms of the applicable sales arrangement.
Short-Term Investments: We determine the appropriate balance sheet classification of our investments at the time of purchase and evaluate the classification at each balance sheet date. As part of our cash management program, we maintain a portfolio of marketable securities which are classified as available-for-sale. These securities include FDIC insured corporate bonds, treasury bills, commercial
40
paper and CDARS with maturities of greater than three months when purchased in principal amounts that, when aggregated with interest to accrue over the term, will not exceed FDIC limits. Securities classified as available-for-sale are carried at fair market value, with the unrealized gains and losses, net of tax, included in the determination of comprehensive income (loss) and reported in equity. Net realized gains and losses are included in net income (loss) attributable to Veeco.
Inventory Valuation: Inventories are stated at the lower of cost (principally first-in, first-out method) or market. Management evaluates the need to record adjustments for impairment of inventory on a quarterly basis. Our policy is to assess the valuation of all inventories, including raw materials, work-in-process, finished goods, and spare parts and other service inventory. Obsolete or slow-moving inventory, based upon historical usage, or inventory in excess of management's estimated usage for the next 12 month's requirements is written-down to its estimated market value, if less than its cost. Inherent in the estimates of market value are management's estimates related to our future manufacturing schedules, customer demand, technological and/or market obsolescence, possible alternative uses, and ultimate realization of excess inventory.
Goodwill and Indefinite-Lived Intangible Asset Impairment: The Company does not amortize goodwill or intangible assets with indefinite useful lives, but instead tests the balances in these asset accounts for impairment at least annually at the reporting unit level. Our policy is to perform this annual impairment test in the fourth quarter of each fiscal year or more frequently if impairment indicators arise. Impairment indicators include, among other conditions, cash flow deficits, a historical or anticipated decline in revenue or operating profit, adverse legal or regulatory developments, and a material decrease in the fair value of some or all of the assets.
Pursuant to relevant accounting pronouncements we are required to determine if it is appropriate to use the operating segment as defined under accounting guidance as the reporting unit or one level below the operating segment, depending on whether certain criteria are met. We have identified two reporting units that are required to be reviewed for impairment. The reporting units are LED & Solar and Data Storage. In identifying the reporting units management considered the economic characteristics of operating segments including the products and services provided, production processes, types or classes of customer and product distribution.
We perform this impairment test by first comparing the fair value of our reporting units to their respective carrying amount. When determining the estimated fair value of a reporting unit, we utilize a discounted future cash flow approach since reported quoted market prices are not available for our reporting units. Developing the estimate of the discounted future cash flow requires significant judgment and projections of future financial performance. The key assumptions used in developing the discounted future cash flows are the projection of future revenues and expenses, working capital requirements, residual growth rates and the weighted average cost of capital. In developing our financial projections, we consider historical data, current internal estimates and market growth trends. Changes to any of these assumptions could materially change the fair value of the reporting unit. We reconcile the aggregate fair value of our reporting units to the Company's adjusted market capitalization as a supporting calculation. The adjusted market capitalization is calculated by multiplying the average share price of our common stock for the last ten trading days prior to the measurement date by the number of outstanding common shares and adding a control premium.
If the carrying value of the reporting units exceed the fair value we would then compare the implied fair value of our goodwill to the carrying amount in order to determine the amount of the impairment, if any.
Definite-Lived Intangible and Long-Lived Assets: Intangible assets consist of purchased technology, customer-related intangible assets, patents, trademarks, covenants not-to-compete, software licenses and deferred financing costs. Purchased technology consists of the core proprietary manufacturing
41
technologies associated with the products and offerings obtained through acquisition and are initially recorded at fair value. Customer-related intangible assets, patents, trademarks and covenants not-to-compete are initially recorded at fair value and software licenses and deferred financing costs are initially recorded at cost. Intangible assets with definitive useful lives are amortized using the straight-line method over their estimated useful lives for periods ranging from 2 years to 17 years.
Property, plant and equipment are recorded at cost. Depreciation is provided over the estimated useful lives of the related assets using the straight-line method for financial statement purposes. Amortization of leasehold improvements is computed using the straight-line method over the shorter of the remaining lease term or the estimated useful lives of the improvements.
Long-lived assets, such as property, plant, and equipment and intangible assets with definite useful lives, are reviewed for impairment whenever events or changes in circumstances indicate that the carrying amount of an asset may not be recoverable. Impairment indicators include, among other conditions, cash flow deficits, a historical or anticipated decline in revenue or operating profit, adverse legal or regulatory developments and a material decrease in the fair value of some or all of the assets. Assets are grouped at the lowest level for which there are identifiable cash flows that are largely independent of the cash flows generated by other asset groups. Recoverability of assets to be held and used is measured by a comparison of the carrying amount of an asset to the estimated undiscounted future cash flow expected to be generated by the asset. If the carrying amount of an asset exceeds its estimated future cash flows, an impairment charge is recognized by the amount by which the carrying amount of the asset exceeds the fair value of the asset.
Fair Value Measurements: Accounting guidance for our non-financial assets and non-financial liabilities requires that we disclose the type of inputs we use to value our assets and liabilities, based on three categories of inputs as defined in such. Level 1 inputs are quoted, unadjusted prices in active markets for identical assets or liabilities that the company has the ability to access at the measurement date. Level 2 inputs are inputs other than quoted prices included within Level 1 that are observable for the asset or liability, either directly or indirectly, such as quoted prices for similar assets or liabilities. Level 3 inputs are unobservable inputs for the asset or liability. Unobservable inputs are used to measure fair value to the extent that observable inputs are not available, thereby allowing for situations in which there is little, if any, market activity for the asset or liability at the measurement date. These requirements apply to our long-lived assets, goodwill and intangible assets. We use Level 3 inputs to value all of such assets and the methodology we use to value such assets has not changed since December 31, 2009. The Company primarily applies the market approach for recurring fair value measurements.
Warranty Costs: We estimate the costs that may be incurred under the warranty we provide and record a liability in the amount of such costs at the time the related revenue is recognized. Estimated warranty costs are determined by analyzing specific product and historical configuration statistics and regional warranty support costs. Our warranty obligation is affected by product failure rates, material usage, and labor costs incurred in correcting product failures during the warranty period. Unforeseen component failures or exceptional component performance can also result in changes to warranty costs. If actual warranty costs differ substantially from our estimates, revisions to the estimated warranty liability would be required.
Income Taxes: As part of the process of preparing our Consolidated Financial Statements, we are required to estimate our income taxes in each of the jurisdictions in which we operate. This process involves estimating the actual current tax expense, together with assessing temporary differences resulting from differing treatment of items for tax and accounting purposes. These differences result in deferred tax assets and liabilities, which are included within our Consolidated Balance Sheets. The carrying value of our deferred tax assets is adjusted by a partial valuation allowance to recognize the extent to which the future tax benefits will be recognized on a more likely than not basis. Our net
42
deferred tax assets consist primarily of net operating loss and tax credit carry forwards, and timing differences between the book and tax treatment of inventory, acquired intangible assets and other asset valuations. Realization of these net deferred tax assets is dependent upon our ability to generate future taxable income.
We record valuation allowances in order to reduce our deferred tax assets to the amount expected to be realized. In assessing the adequacy of recorded valuation allowances, we consider a variety of factors, including the scheduled reversal of deferred tax liabilities, future taxable income, and prudent and feasible tax planning strategies. Under the relevant accounting guidance, factors such as current and previous operating losses are given significantly greater weight than the outlook for future profitability in determining the deferred tax asset carrying value.
Relevant accounting guidance addresses the determination of how tax benefits claimed or expected to be claimed on a tax return should be recorded in the financial statements. Under such guidance, we must recognize the tax benefit from an uncertain tax position only if it is more likely than not that the tax position will be sustained on examination by the taxing authorities, based on the technical merits of the position. The tax benefits recognized in the financial statements from such uncertain tax positions are measured based on the largest benefit that has a greater than fifty percent likelihood of being realized upon ultimate resolution.
Equity-based Compensation: Equity-based compensation cost is measured at the grant date, based on the fair value of the award and is recognized as expense over the employee requisite service period. In order to determine the fair value of stock options on the date of grant, we apply the Black-Scholes option-pricing model. Inherent in the model are assumptions related to risk-free interest rate, dividend yield, expected stock-price volatility and option life.
The risk-free rate assumed in valuing the options is based on the U.S. Treasury yield curve in effect at the time of grant for the expected term of the option. The dividend yield assumption is based on the Company's historical and future expectation of dividend payouts. While the risk-free interest rate and dividend yield are less subjective assumptions, typically based on factual data derived from public sources, the expected stock-price volatility and option life assumptions require a level of judgment which make them critical accounting estimates.
We use an expected stock-price volatility assumption that is a combination of both historical volatility, calculated based on the daily closing prices of our common stock over a period equal to the expected term of the option and implied volatility, utilizing market data of actively traded options on our common stock, which are obtained from public data sources. We believe that the historical volatility of the price of our common stock over the expected term of the option is a strong indicator of the expected future volatility and that implied volatility takes into consideration market expectations of how future volatility will differ from historical volatility. Accordingly, we believe a combination of both historical and implied volatility provides the best estimate of the future volatility of the market price of our common stock.
The expected term, representing the period of time that options granted are expected to be outstanding, is estimated using a lattice-based model incorporating historical post vest exercise and employee termination behavior.
We estimate forfeitures using our historical experience, which is adjusted over the requisite service period based on the extent to which actual forfeitures differ or are expected to differ, from such estimates. Because of the significant amount of judgment used in these calculations, it is reasonably likely that circumstances may cause the estimate to change.
With regard to the weighted-average option life assumption, we consider the exercise behavior of past grants and model the pattern of aggregate exercises.
43
Recent Accounting Pronouncements
Business Combinations: In December 2010, the FASB issued amended guidance related to Business Combinations. The amendments affect any public entity that enters into business combinations that are material on an individual or aggregate basis. The amendments specify that if a public entity presents comparative financial statements, the entity should disclose revenue and earnings of the combined entity as though the business combination(s) that occurred during the current year had occurred as of the beginning of the comparable prior annual reporting period only. The amendments also expand the supplemental pro forma disclosures to include a description of the nature and amount of material, nonrecurring pro forma adjustments directly attributable to the business combination included in the reported pro forma revenue and earnings. The amendments are effective prospectively for business combinations for which the acquisition date is on or after the beginning of the first annual reporting period beginning on or after December 15, 2010. Early adoption is permitted. The Company will assess the impact of these amendments on its consolidated financial statements if and when an acquisition occurs.
Intangibles—Goodwill and Other: In December 2010, the FASB issued amended guidance related to Intangibles—Goodwill and Other. The amendments modify Step 1 of the goodwill impairment test for reporting units with zero or negative carrying amounts. For those reporting units, an entity is required to perform Step 2 of the goodwill impairment test if it is more likely than not that a goodwill impairment exists. In determining whether it is more likely than not that goodwill impairment exists, an entity should consider whether there are any adverse qualitative factors indicating that impairment may exist. The qualitative factors are consistent with the existing guidance and examples, which require that goodwill of a reporting unit be tested for impairment between annual tests if an event occurs or circumstances change that would more likely than not reduce the fair value of a reporting unit below its carrying amount. For public entities, the amendments are effective for fiscal years, and interim periods within those years, beginning after December 15, 2010. Early adoption is not permitted. The Company does not believe that this guidance will have a material impact on its consolidated financial statements.
Subsequent Events: The FASB has issued amended guidance for subsequent events. The amendment removes the requirement for an SEC filer to disclose a date through which subsequent events have been evaluated in both issued and revised financial statements. Revised financial statements include financial statements revised as a result of either correction of an error or retrospective application of U.S. GAAP. The FASB also clarified that if the financial statements have been revised, then an entity that is not an SEC filer should disclose both the date that the financial statements were issued or available to be issued and the date the revised financial statements were issued or available to be issued. The FASB believes these amendments remove potential conflicts with the SEC's literature. All of the amendments were effective upon issuance (February 24, 2010). The adoption of this guidance did not have a material impact on the Company's consolidated financial statements.
Fair Value Measurements: In January 2010, the FASB issued amended guidance for Fair Value Measurements and Disclosures. This update requires some new disclosures and clarifies existing disclosure requirements about fair value measurement. The FASB's objective is to improve these disclosures and, thus, increase the transparency in financial reporting. Specifically, this update requires that a reporting entity disclose separately the amounts of significant transfers in and out of Level 1 and Level 2 fair value measurements and describe the reasons for the transfers; and in the reconciliation for fair value measurements using significant unobservable inputs, a reporting entity should present separately information about purchases, sales, issuances, and settlements. In addition, this update clarifies the requirements of existing disclosures. For purposes of reporting fair value measurement for each class of assets and liabilities, a reporting entity needs to use judgment in determining the appropriate classes of assets and liabilities; and a reporting entity should provide disclosures about the
44
valuation techniques and inputs used to measure fair value for both recurring and nonrecurring fair value measurements. This update was adopted on January 1, 2010, except for the disclosures about purchases, sales, issuances, and settlements in the roll forward of activity in Level 3 fair value measurements. The adoption of this guidance did not have a material impact on the Company's consolidated financial statements. Those disclosures are effective for fiscal years beginning after December 15, 2010, and for interim periods within those fiscal years. Early application is permitted. The Company does not believe that this guidance will have a material impact on its consolidated financial statements.
Revenue Recognition: In October 2009, the FASB issued amended guidance related to multiple-element arrangements which requires an entity to allocate arrangement consideration at the inception of an arrangement to all of its deliverables based on their relative selling prices. This update eliminates the use of the residual method of allocation and requires the relative-selling-price method in all circumstances. All entities must adopt the guidance no later than the beginning of their first fiscal year beginning on or after June 15, 2010. Entities may elect to adopt the guidance through either prospective application for revenue arrangements entered into or materially modified, after the effective date or through retrospective application to all revenue arrangements for all periods presented. The Company does not believe that this guidance will have a material impact on its consolidated financial statements.
In October 2009, the FASB issued amended guidance that is expected to significantly affect how entities account for revenue arrangements that contain both hardware and software elements. As a result, many tangible products that rely on software will be accounted for under the revised multiple-element arrangements revenue recognition guidance, rather than the software revenue recognition guidance. The revised guidance must be adopted by all entities no later than fiscal years beginning on or after June 15, 2010. An entity must select the same transition method and same period for the adoption of both this guidance and the revisions to the multiple-element arrangements guidance noted above. The Company does not believe that this guidance will have a material impact on its consolidated financial statements.
Item 7A. Quantitative and Qualitative Disclosures about Market Risk
Market Risk
The principal market risks (such as the risk of loss arising from adverse changes in market rates and prices) to which we are exposed are:
- •
- rates on debt,
- •
- rates on short-term and long-term investment portfolios, and
- •
- exchange rates, generating translation and transaction gains and losses.
Interest Rates
We centrally manage our debt and investment portfolios considering investment opportunities and risk, tax consequences and overall financing strategies. Our investment portfolio includes fixed-income securities with a fair value of approximately $394.2 million at December 31, 2010. These securities are subject to interest rate risk and will decline in value if interest rates increase. Based on our investment portfolio at December 31, 2010, an immediate 100 basis point increase in interest rates may result in a significant decrease in the fair value of the portfolio. While an increase in interest rates may reduce the fair value of the investment portfolio, we will not realize the losses in the consolidated statement of operations unless the individual fixed-income securities are sold prior to recovery or the loss is determined to be other-than-temporary. Our debt portfolio consists of fixed rate and fixed maturity instruments therefore any changes in interest rates will not have an impact on net interest expense.
45
Foreign Operations
Operating in international markets involves exposure to movements in currency exchange rates, which are volatile at times. The economic impact of currency exchange rate movements on Veeco is complex because such changes are often linked to variability in real growth, inflation, interest rates, governmental actions and other factors. These changes, if material, could cause us to adjust our financing and operating strategies. Consequently, isolating the effect of changes in currency does not incorporate these other important economic factors.
Our net sales to foreign customers represented approximately 90%, 79% and 59% of our total net sales in 2010, 2009 and 2008, respectively. We expect that net sales to foreign customers will continue to represent a large percentage of our total net sales. Our net sales denominated in foreign currencies represented approximately 2%, 6% and 5% of total net sales in 2010, 2009 and 2008, respectively. The aggregate foreign currency exchange gain (loss) included in determining consolidated results of operations was approximately $1.3 million, $(0.7) million and $(0.1) million in 2010, 2009 and 2008, respectively. Included in the aggregate foreign currency exchange gain (loss) were gains (losses) relating to forward contracts of $0.1 million, $0.2 million and ($0.4) million in 2010, 2009 and 2008, respectively. These amounts were recognized and included in other expense (income), net. As of December 31, 2010, approximately $0.3 million of gains related to forward contracts were included in prepaid expenses and other current assets and these amounts were subsequently received in January 2011. As of December 31, 2009, approximately $0.2 million of gains related to forward contracts were included in prepaid expenses and other current assets and these amounts were subsequently received in January 2010. Monthly forward contracts for a notional amount of $18.5 million for the month of January 2011 were entered into in December 2010. We are exposed to financial market risks, including changes in foreign currency exchange rates. To mitigate these risks, we use derivative financial instruments. We do not use derivative financial instruments for speculative or trading purposes. We enter into monthly forward contracts to reduce the effect of fluctuating foreign currencies on short-term foreign currency-denominated intercompany transactions and other known currency exposures. The average notional amount of such contracts outstanding was approximately $6.2 million for the year ended December 31, 2010. The changes in currency exchange rates that have the largest impact on translating our international operating profit (loss) are the Japanese Yen, the British Pound and the Euro. We believe that based upon our hedging program, a 10% change in foreign exchange rates would have an immaterial impact on the consolidated results of operations. We believe that this quantitative measure has inherent limitations because, as discussed in the first paragraph of this section, it does not take into account any governmental actions or changes in either customer purchasing patterns or our financing and operating strategies.
Item 8. Financial Statements and Supplementary Data
Our Consolidated Financial Statements are listed in the Index to Consolidated Financial Statements and Financial Statement Schedule filed as part of this Form 10-K.
Quarterly Results of Operations
The following table presents selected unaudited financial data for each quarter of fiscal 2010 and 2009. Consistent with prior years, we report interim quarters, other than fourth quarters which always end on December 31, on a 13-week basis ending on the last Sunday within such period. The interim quarter ends are determined at the beginning of each year based on the 13-week quarters. The 2010 interim quarter ends were March 28, June 27 and September 26. The 2009 interim quarter ends were March 29, June 28 and September 27. For ease of reference, we report these interim quarter ends as March 31, June 30 and September 30 in our interim condensed consolidated financial statements.
46
Although unaudited, this information has been prepared on a basis consistent with our audited Consolidated Financial Statements and, in the opinion of our management, reflects all adjustments (consisting only of normal recurring adjustments) that we consider necessary for a fair presentation of this information in accordance with accounting principles generally accepted in the United States. Such quarterly results are not necessarily indicative of future results of operations and should be read in conjunction with our audited Consolidated Financial Statements and the notes thereto.
| |
Fiscal 2010 | Fiscal 2009 | ||||||||||||||||||||||||||||||
|---|---|---|---|---|---|---|---|---|---|---|---|---|---|---|---|---|---|---|---|---|---|---|---|---|---|---|---|---|---|---|---|---|
| |
Q1 | Q2 | Q3 | Q4 | Year | Q1 | Q2 | Q3 | Q4 | Year | ||||||||||||||||||||||
| |
(in thousands, except per share data) |
|||||||||||||||||||||||||||||||
Net sales |
$ | 134,750 | $ | 221,389 | $ | 277,094 | $ | 299,998 | $ | 933,231 | $ | 39,107 | $ | 49,475 | $ | 74,688 | $ | 119,142 | $ | 282,412 | ||||||||||||
Gross profit |
56,740 | 98,801 | 135,482 | 152,802 | 443,825 | 10,909 | 16,248 | 30,547 | 53,531 | 111,235 | ||||||||||||||||||||||
Income (loss) from continuing operations, net of income taxes |
22,824 | 49,931 | 91,104 | 96,672 | 260,531 | (17,661 | ) | (12,577 | ) | 31 | 15,978 | (14,229 | ) | |||||||||||||||||||
Income (loss) from discontinued operations, net of income taxes |
3,220 | 2,462 | (4,941 | ) | 100,488 | 101,229 | (3,283 | ) | (2,126 | ) | 1,239 | 2,767 | (1,403 | ) | ||||||||||||||||||
Net loss attributable to noncontrolling interest |
— | — | — | — | — | (42 | ) | (23 | ) | — | — | (65 | ) | |||||||||||||||||||
Net income (loss) attributable to Veeco |
$ | 26,044 | $ | 52,393 | $ | 86,163 | $ | 197,160 | $ | 361,760 | $ | (20,902 | ) | $ | (14,680 | ) | $ | 1,270 | $ | 18,745 | $ | (15,567 | ) | |||||||||
Income (loss) per common share attributable to Veeco: |
||||||||||||||||||||||||||||||||
Basic: |
||||||||||||||||||||||||||||||||
Continuing operations |
$ | 0.59 | $ | 1.26 | $ | 2.28 | $ | 2.45 | $ | 6.60 | $ | (0.56 | ) | $ | (0.40 | ) | $ | — | $ | 0.45 | $ | (0.44 | ) | |||||||||
Discontinued operations |
0.08 | 0.06 | (0.12 | ) | 2.55 | 2.56 | (0.10 | ) | (0.07 | ) | 0.04 | 0.08 | (0.04 | ) | ||||||||||||||||||
Income (loss) |
$ | 0.67 | $ | 1.32 | $ | 2.16 | $ | 5.00 | $ | 9.16 | $ | (0.66 | ) | $ | (0.47 | ) | $ | 0.04 | $ | 0.53 | $ | (0.48 | ) | |||||||||
Diluted : |
||||||||||||||||||||||||||||||||
Continuing operations |
$ | 0.54 | $ | 1.15 | $ | 2.16 | $ | 2.30 | $ | 6.13 | $ | (0.56 | ) | $ | (0.40 | ) | $ | — | $ | 0.42 | $ | (0.44 | ) | |||||||||
Discontinued operations |
0.08 | 0.05 | (0.12 | ) | 2.40 | 2.38 | (0.10 | ) | (0.07 | ) | 0.04 | 0.08 | (0.04 | ) | ||||||||||||||||||
Income (loss) |
$ | 0.62 | $ | 1.20 | $ | 2.04 | $ | 4.70 | $ | 8.51 | $ | (0.66 | ) | $ | (0.47 | ) | $ | 0.04 | $ | 0.50 | $ | (0.48 | ) | |||||||||
Weighted average shares outstanding: |
||||||||||||||||||||||||||||||||
Basic |
38,784 | 39,761 | 39,946 | 39,453 | 39,499 | 31,515 | 31,497 | 31,608 | 35,623 | 32,628 | ||||||||||||||||||||||
Diluted |
42,269 | 43,506 | 42,258 | 41,972 | 42,514 | 31,515 | 31,497 | 32,375 | 37,742 | 32,628 | ||||||||||||||||||||||
On August 15, 2010, we signed a definitive agreement to sell our Metrology business to Bruker comprising our entire Metrology reporting segment for $229.4 million. Accordingly, Metrology's operating results are accounted for as discontinued operations in determining the consolidated results of operations. The sales transaction closed on October 7, 2010, except for assets located in China due to local restrictions. Total proceeds, which included a working capital adjustment of $1 million, totaled $230.4 million of which $7.2 million relates to the assets in China. As part of our agreement with Bruker, $22.9 million of proceeds is held in escrow and is restricted from use for one year from the closing date of the transaction to secure certain specified losses arising out of breaches of representations, warranties and covenants we made in the stock purchase agreement and related documents. As part of the sale we incurred transaction costs, which consisted of investment bank fees and legal fees, totaling $5.2 million. During the fourth quarter of 2010, we recognized a pre-tax gain on disposal of $156.3 million and a pre-tax deferred gain of $5.4 million related to the assets in China.
During the first quarter of 2010, we recognized a restructuring credit of $0.2 million associated with a change in estimate.
47
During the first quarter of 2009, we recognized a restructuring charge of $2.3 million, primarily for personnel severance. During the second quarter of 2009, we recognized an additional restructuring charge of approximately $1.7 million primarily for lease-related and personnel severance costs and an asset impairment charge of $0.3 million for property and equipment no longer being utilized in our Data Storage segment. During the third quarter of 2009, we recognized an additional restructuring charge of $0.8 million, primarily for personnel severance costs. During the fourth quarter of 2009, we recognized an additional restructuring charge of $0.1 million related to personnel severance costs.
A variety of factors influence the level of our net sales in a particular quarter including economic conditions in the HB LED, solar, data storage and semiconductor industries, the timing of significant orders, shipment delays, specific feature requests by customers, the introduction of new products by us and our competitors, production and quality problems, changes in material costs, disruption in sources of supply, seasonal patterns of capital spending by customers, and other factors, many of which are beyond our control. In addition, we derive a substantial portion of our revenues from the sale of products which have an average selling price in excess of $2,000,000. As a result, the timing of recognition of revenue from a single transaction could have a significant impact on our net sales and operating results in any given quarter.
Item 9. Changes in and Disagreements with Accountants on Accounting and Financial Disclosure
None.
Item 9A. Controls and Procedures
Evaluation of Disclosure Controls and Procedures
Our senior management is responsible for establishing and maintaining a system of disclosure controls and procedures (as defined in Rule 13a-14 and 15d-14 under the Securities Exchange Act of 1934 (the "Exchange Act")) designed to ensure that information required to be disclosed by us in the reports that we file or submit under the Exchange Act is recorded, processed, summarized, and reported, within the time periods specified in the Securities and Exchange Commission's rules and forms. Disclosure controls and procedures include, without limitation, controls, and procedures designed to ensure that information required to be disclosed by an issuer in the reports that it files or submits under the Exchange Act is accumulated and communicated to the issuer's management, including its principal executive officer or officers and principal financial officer or officers, or persons performing similar functions, as appropriate to allow timely decisions regarding required disclosure.
We have evaluated the effectiveness of the design and operation of our disclosure controls and procedures under the supervision of and with the participation of management, including the chief executive officer and chief financial officer, as of the end of the period covered by this report. Based on that evaluation, our chief executive officer and our chief financial officer concluded that our disclosure controls and procedures are effective to ensure that information required to be disclosed by us in reports that we file or submit under the Exchange Act is recorded, processed, summarized and reported within the time periods specified in Securities and Exchange Commission rules and forms and is accumulated and communicated to our management, including our principal executive officer and principal financial officer, or persons performing similar functions, as appropriate to allow timely decisions regarding required disclosure.
Subsequent to that evaluation there have been no significant changes in our disclosure controls or procedures or other factors that could significantly affect these controls or procedures after such evaluation.
48
Design and Evaluation of Internal Control Over Financial Reporting
Pursuant to Section 404 of the Sarbanes-Oxley Act of 2002, we have included a report of management's assessment of the design and effectiveness of its internal controls as part of this Annual Report on Form 10-K for the year ended December 31, 2010. Our independent registered public accounting firm also attested to, and reported on, the effectiveness of internal control over financial reporting. Management's report and the independent registered public accounting firm's attestation report are included in our Consolidated Financial Statements for the year ended December 31, 2010 under the caption entitled "Management's Report on Internal Control Over Financial Reporting" and "Report of Independent Registered Public Accounting Firm on Internal Control Over Financial Reporting."
Changes in Internal Control Over Financial Reporting
There have been no significant changes in our internal controls or other factors during the fiscal year ended December 31, 2010 that have materially affected, or are reasonably likely to materially affect, our internal control over financial reporting.
None.
49
Portions of the information required by Part III of Form 10-K are incorporated by reference from Veeco's Proxy Statement to be filed with the SEC in connection with Veeco's 2011 Annual Meeting of Stockholders (the "Proxy Statement").
Item 10. Directors, Executive Officers, and Corporate Governance
The information required by Item 10 of Form 10-K is incorporated by reference to our Proxy Statement under the headings "Corporate Governance," "Executive Officers" and "Section 16(a) Reporting Compliance."
We have adopted a Code of Ethics for Senior Officers (the "Code") which applies to our chief executive officer, principal financial officer, principal accounting officer, and persons performing similar functions. A copy of the Code can be found on our website (www.veeco.com). We intend to disclose on our website the nature of any future amendments to and waivers of the Code that apply to the chief executive officer, principal financial officer, principal accounting officer or persons performing similar functions. We have also adopted a Code of Business Conduct which applies to all of our employees, including those listed above, as well as to our directors. A copy of the Code of Business Conduct can be found on our website (www.veeco.com). The website address above is intended to be an inactive, textual reference only. None of the material on this website is part of this report.
Item 11. Executive Compensation
The information required by Item 11 of Form 10-K is incorporated by reference to our Proxy Statement under the heading "Executive Compensation."
Item 12. Security Ownership of Certain Beneficial Owners and Management and Related Stockholder Matters
The information required by Item 12 of Form 10-K is incorporated by reference to our Proxy Statement under the heading "Security Ownership of Certain Beneficial Owners and Management" and "Equity Compensation Plan Information."
The following table gives information about our common stock that may be issued under our equity compensation plans as of December 31, 2010. See Note 8 to the Consolidated Financial Statements included herein for information regarding the material features of these plans.
| |
Number of securities to be issued upon exercise of outstanding options, warrants, and rights (a) |
Weighted average exercise price of outstanding options, warrants, and rights (b) |
Number of securities remaining available for future issuance under equity compensation plans (excluding securities reflected in column (a)) (c) |
|||||||
|---|---|---|---|---|---|---|---|---|---|---|
Equity compensation plans approved by security holders |
2,560,354 | $ | 19.62 | 2,623,776 | ||||||
Equity compensation plans not approved by security holders |
9,272 | (1) | $ | 43.19 | — | |||||
Total |
2,569,626 | 2,623,776 | ||||||||
- (1)
- Stock options assumed in connection with the acquisition of Applied Epi, Inc. on September 17, 2001.
50
Item 13. Certain Relationships, Related Transactions and Director Independence
The information required by Item 13 of Form 10-K is incorporated by reference to our Proxy Statement under the headings "Independence of the Board of Directors" and "Certain Relationships and Related Transactions."
Item 14. Principal Accounting Fees and Services
The information required by Item 14 of Form 10-K is incorporated by reference to our Proxy Statement under the heading "Proposal 2—Ratification of the Appointment of Ernst & Young LLP."
51
Item 15. Exhibits and Financial Statement Schedules
- (a)
- The
Registrant's financial statements together with a separate table of contents are annexed hereto. The financial statement schedule is listed in the
separate table of contents annexed hereto.
- (b)
- Exhibits
Unless otherwise indicated, each of the following exhibits has been previously filed with the Securities and Exchange Commission by the Company under File No. 0-16244.
| Number | Exhibit | Incorporated by Reference to the Following Documents | ||
|---|---|---|---|---|
| 2.1 | Stock Purchase Agreement dated August 15, 2010 among Veeco Instruments Inc. (Veeco), Veeco Metrology Inc. and Bruker Corporation | Quarterly Report on Form 10-Q for the quarter ended September 30, 2010, Exhibit 2.1 | ||
3.1 |
Amended and Restated Certificate of Incorporation of Veeco dated December 1, 1994, as amended June 2, 1997 and July 25, 1997. |
Quarterly Report on Form 10-Q for the quarter ended June 30, 1997, Exhibit 3.1 |
||
3.2 |
Amendment to Certificate of Incorporation of Veeco dated May 29, 1998. |
Annual Report on Form 10-K for the year ended December 31, 2000, Exhibit 3.2 |
||
3.3 |
Amendment to Certificate of Incorporation of Veeco dated May 5, 2000. |
Quarterly Report on Form 10-Q for the quarter ended June 30, 2000, Exhibit 3.1 |
||
3.4 |
Certificate of Designation, Preferences, and Rights of Series A Junior Participating Preferred Stock of Veeco. |
Quarterly Report on Form 10-Q for the quarter ended March 31, 2001, Exhibit 3.1 |
||
3.5 |
Amendment to Certificate of Incorporation of Veeco dated May 16, 2002 |
Quarterly Report on Form 10-Q for the quarter ended September 30, 2009, Exhibit 3.1 |
||
3.6 |
Amendment to Certificate of Incorporation of Veeco dated May 14, 2010 |
Filed herewith |
||
3.7 |
Fourth Amended and Restated Bylaws of Veeco, effective October 23, 2008 |
Current Report on Form 8-K filed October 27, 2008, Exhibit 3.1 |
||
3.8 |
Amendment No. 1 to the Fourth Amended and Restated Bylaws of Veeco effective May 20, 2010 |
Current Report on Form 8-K, filed May 26, 2010, Exhibit 3.1 |
52
| Number | Exhibit | Incorporated by Reference to the Following Documents | ||
|---|---|---|---|---|
| 4.1 | Rights Agreement, dated as of March 13, 2001, between Veeco and American Stock Transfer and Trust Company, as Rights Agent, including the form of the Certificate of Designation, Preferences, and Rights setting forth the terms of the Series A Junior Participating Preferred Stock, par value $0.01 per share, as Exhibit A, the form of Rights Certificates as Exhibit B and the Summary of Rights to Purchase Preferred Stock as Exhibit C. | Registration Statement on Form 8-A dated March 15, 2001, Exhibit 1 | ||
4.2 |
Amendment to Rights Agreement, dated as of September 6, 2001, between Veeco and American Stock Transfer and Trust Company, as rights agent. |
Current Report on Form 8-K, filed September 21, 2001, Exhibit 4.1 |
||
4.3 |
Amendment No 2 to Rights Agreement, dated as of July 11, 2002, between Veeco and American Stock Transfer and Trust Company, as rights agent. |
Current Report on Form 8-K, filed July 12, 2002, Exhibit 4.1 |
||
4.4 |
Indenture, dated April 16, 2007, between Veeco and U.S. Bank National Trust |
Post-Effective Amendment No. 1 To Registration Statement on Form S-3 (File No. 333-128004) filed April 16, 2007, Exhibit 4.1 |
||
4.5 |
First Supplemental Indenture, dated April 20, 2007, by and between Veeco and U.S. Bank Trust National Association, as Trustee |
Current Report on Form 8-K, filed April 20, 2007, Exhibit 4.1 |
||
10.1 |
Loan Agreement dated as of December 15, 1999 between Applied Epi, Inc. and Jackson National Life Insurance Company. |
Quarterly Report on Form 10-Q for the quarter ended September 30, 2001, Exhibit 10.2 |
||
10.2 |
Amendment to Loan Documents effective as of September 17, 2001 between Applied Epi, Inc. and Jackson National Life Insurance Company (executed in June 2002). |
Quarterly Report on Form 10-Q for the quarter ended June 30, 2002, Exhibit 10.2 |
||
10.3 |
Promissory Note dated as of December 15, 1999 issued by Applied Epi, Inc. to Jackson National Life Insurance Company. |
Quarterly Report on Form 10-Q for the quarter ended September 30, 2001, Exhibit 10.3 |
||
10.4 |
* |
Form of Indemnification Agreement entered into between Veeco and each of its directors and executive officers. |
Current Report on Form 8-K filed on October 23, 2006, Exhibit 10.1 |
|
10.5 |
* |
Veeco Amended and Restated 1992 Employees' Stock Option Plan. |
Registration Statement on Form S-1 (File No. 33-93958), Exhibit 10.20 |
|
10.6 |
* |
Amendment dated May 15, 1997 to Veeco Amended and Restated 1992 Employees' Stock Option Plan. |
Registration Statement on Form S-8 (File No. 333-35009) filed September 5, 1997, Exhibit 10.1 |
53
| Number | Exhibit | Incorporated by Reference to the Following Documents | ||
|---|---|---|---|---|
| 10.7 | * | Amendment dated July 25, 1997 to Veeco Amended and Restated 1992 Employees' Stock Option Plan. | Registration Statement on Form S-8 (File No. 333-35009) filed September 5, 1997, Exhibit 10.2 | |
10.8 |
* |
Amendment dated May 29, 1998 to Veeco Amended and Restated 1992 Employees' Stock Option Plan. |
Registration Statement on Form S-8 (File No. 333-79469) filed May 27, 1999, Exhibit 10.1 |
|
10.9 |
* |
Amendment dated May 14, 1999 to Veeco Amended and Restated 1992 Employees' Stock Option Plan. |
Registration Statement on Form S-8 (File No. 333-79469) filed May 27, 1999, Exhibit 10.2 |
|
10.10 |
* |
Veeco Amended and Restated 2000 Stock Incentive Plan, effective July 20, 2006. |
Quarterly Report on Form 10-Q for the quarter ended June 30, 2006, Exhibit 10.4 |
|
10.11 |
* |
Amendment No. 1 effective April 18, 2007 (ratified by the Board August 7, 2007) to Veeco Amended and Restated 2000 Stock Incentive Plan. |
Quarterly Report on Form 10-Q for the quarter ended June 30, 2007, Exhibit 10.1 |
|
10.12 |
* |
Amendment No. 2 dated January 22, 2009 to Veeco Amended and Restated 2000 Stock Incentive Plan. |
Annual Report on Form 10-K for the year ended December 31, 2008, Exhibit 10.41 |
|
10.13 |
* |
Form of Restricted Stock Agreement pursuant to the Veeco 2000 Stock Incentive Plan, effective November 2005 |
Quarterly Report on Form 10-Q for the quarter ended September 30, 2005, Exhibit 10.3 |
|
10.14 |
* |
Form of Notice of Restricted Stock Award and related terms and conditions pursuant to the Veeco 2000 Stock Incentive Plan, effective June 2006 |
Quarterly Report on Form 10-Q for the quarter ended September 30, 2006, Exhibit 10.3 |
|
10.15 |
* |
Veeco 2010 Stock Incentive Plan, effective May 14, 2010 |
Registration Statement on Form S-8 (File Number 333-166852) filed May 14, 2010, Exhibit 10.1 |
|
10.16 |
* |
Form of 2010 Stock Incentive Plan Stock Option Agreement |
Registration Statement on Form S-8 (File Number 333-166852) filed May 14, 2010, Exhibit 10.2 |
|
10.17 |
* |
Form of 2010 Stock Incentive Plan Restricted Stock Agreement |
Registration Statement on Form S-8 (File Number 333-166852) filed May 14, 2010, Exhibit 10.3 |
|
10.18 |
* |
Veeco Performance-Based Restricted Stock 2010 |
Quarterly Report on Form 10-Q for the quarter ended June 30, 2010, Exhibit 10.2 |
|
10.19 |
* |
Veeco 2010 Management Bonus Plan dated January 22, 2010 |
Quarterly Report on Form 10-Q for the quarter ended March 31, 2010, Exhibit 10.2 |
|
10.20 |
* |
Veeco 2010 Special Profit Sharing Plan dated February 15, 2010 |
Quarterly Report on Form 10-Q for the quarter ended March 31, 2010, Exhibit 10.3 |
|
10.21 |
* |
Senior Executive Change in Control Policy effective as of September 12, 2008 |
Quarterly Report on Form 10-Q for the quarter ended September 30, 2008, Exhibit 10.3 |
54
| Number | Exhibit | Incorporated by Reference to the Following Documents | ||
|---|---|---|---|---|
| 10.22 | * | Amendment No. 1 dated December 23, 2008 (effective September 12, 2008) to Veeco Senior Executive Change in Control Policy | Annual Report on Form 10-K for the year ended December 31, 2008, Exhibit 10.37 | |
10.23 |
* |
Service Agreement effective July 24, 2008 between Veeco and Edward H. Braun |
Quarterly Report on Form 10-Q for the quarter ended June 30, 2008, Exhibit 10.1 |
|
10.24 |
* |
Employment Agreement effective as of July 1, 2007 between Veeco and John R. Peeler |
Quarterly Report on Form 10-Q for the quarter ended June 30, 2007, Exhibit 10.3 |
|
10.25 |
* |
Amendment effective December 31, 2008 to Employment Agreement between Veeco and John R. Peeler |
Annual Report on Form 10-K for the year ended December 31, 2008, Exhibit 10.38 |
|
10.26 |
* |
Second Amendment effective June 11, 2010 to Employment Agreement between Veeco and John R. Peeler |
Quarterly Report on Form 10-Q for the quarter ended June 30, 2010, Exhibit 10.1 |
|
10.27 |
* |
Employment Agreement dated December 17, 2009 (effective January 18, 2010) between Veeco and David D. Glass |
Quarterly Report on Form 10-Q for the quarter ended March 31, 2010, Exhibit 10.1 |
|
10.28 |
* |
Letter Agreement dated January 21, 2004 between Veeco and John P. Kiernan. |
Annual Report on Form 10-K for the year ended December 31, 2003, Exhibit 10.38 |
|
10.29 |
* |
Form of Amendment effective June 9, 2006 to Letter Agreements between Veeco and each of John P. Kiernan and Robert P. Oates |
Quarterly Report on Form 10-Q for the quarter ended June 30, 2006, Exhibit 10.3 |
|
10.30 |
* |
Form of Amendment effective December 31, 2008 to Letter Agreements between Veeco and each of John P. Kiernan, Mark R. Munch and Robert P. Oates |
Annual Report on Form 10-K for the year ended December 31, 2008, Exhibit 10.40 |
|
10.31 |
* |
Letter agreement effective as of June 19, 2009 between Veeco and John P. Kiernan |
Quarterly Report on Form 10-Q for the quarter ended June 30, 2009, Exhibit 10.2 |
|
10.32 |
* |
Letter Agreement dated October 31, 2005 between Veeco and Robert P. Oates |
Quarterly Report on Form 10-Q for the quarter ended September 30, 2005, Exhibit 10.1 |
|
10.33 |
* |
Amendment dated September 12, 2008 to Employment Agreement between Veeco and Robert P. Oates |
Quarterly Report on Form 10-Q for the quarter ended September 30, 2008, Exhibit 10.2 |
|
10.34 |
* |
Employment Agreement dated as of April 1, 2003 between Veeco and John F. Rein, Jr. |
Quarterly Report on Form 10-Q for the quarter ended June 30, 2003, Exhibit 10.5 |
|
10.35 |
* |
Amendment effective June 9, 2006 to Employment Agreement between Veeco and John F. Rein, Jr. |
Quarterly Report on Form 10-Q for the quarter ended June 30, 2006, Exhibit 10.2 |
|
10.36 |
* |
Amendment dated as of September 12, 2008 to Employment Agreement between Veeco and John F. Rein, Jr. |
Quarterly Report on Form 10-Q for the quarter ended September 30, 2008, Exhibit 10.1 |
55
| Number | Exhibit | Incorporated by Reference to the Following Documents | ||
|---|---|---|---|---|
| 10.37 | * | Amendment effective December 31, 2008 to Employment Agreement between Veeco and John F. Rein, Jr. | Annual Report on Form 10-K for the year ended December 31, 2008, Exhibit 10.39 | |
10.38 |
* |
Letter Agreement dated January 11, 2008 between Veeco and Mark R. Munch |
Annual Report on Form 10-K for the year ended December 31, 2007, Exhibit 10.33 |
|
10.39 |
* |
Letter Agreement dated September 23, 2010 between Veeco and Mark R. Munch |
Quarterly Report on Form 10-Q for the quarter ended September 30, 2010, Exhibit 10.1 |
|
21.1 |
Subsidiaries of the Registrant. |
Filed herewith |
||
23.1 |
Consent of Ernst & Young LLP. |
Filed herewith |
||
31.1 |
Certification of Chief Executive Officer pursuant to Rule 13a-14(a) or Rule 15d-14(a) of the Securities and Exchange Act of 1934. |
Filed herewith |
||
31.2 |
Certification of Chief Financial Officer pursuant to Rule 13a-14(a) or Rule 15d-14(a) of the Securities and Exchange Act of 1934. |
Filed herewith |
||
32.1 |
Certification of Chief Executive Officer pursuant to 18 U.S.C. Section 1350, as adopted pursuant to Section 906 of the Sarbanes-Oxley Act of 2002 |
Filed herewith |
||
32.2 |
Certification of Chief Financial Officer pursuant to 18 U.S.C. Section 1350, as adopted pursuant to Section 906 of the Sarbanes-Oxley Act of 2002 |
Filed herewith |
- *
- Indicates a management contract or compensatory plan or arrangement, as required by Item 15(a) (3) of Form 10-K.
56
Pursuant to the requirements of Section 13 or 15(d) of the Securities Exchange Act of 1934, as amended, the Registrant has duly caused this report to be signed on its behalf by the undersigned, thereunto duly authorized, on February 23, 2011.
| VEECO INSTRUMENTS INC. | ||||
By: |
/s/ JOHN R. PEELER John R. Peeler Chief Executive Officer |
|||
Pursuant to the requirements of the Securities Exchange Act of 1934, as amended, this report has been signed below by the following persons on behalf of the Registrant and in the capacities indicated, on February 23, 2011.
Signature
|
Title
|
|
|---|---|---|
| /s/ EDWARD H. BRAUN Edward H. Braun |
Director and Chairman | |
/s/ RICHARD A. D'AMORE Richard A. D'Amore |
Director |
|
/s/ JOEL A. ELFTMANN Joel A. Elftmann |
Director |
|
/s/ THOMAS GUTIERREZ Thomas Gutierrez |
Director |
|
/s/ GORDON HUNTER Gordon Hunter |
Director |
|
/s/ ROGER D. MCDANIEL Roger D. McDaniel |
Director |
|
/s/ JOHN R. PEELER John R. Peeler |
Director and Chief Executive Officer (principal executive officer) |
|
/s/ PETER J. SIMONE Peter J. Simone |
Director |
|
/s/ DAVID D. GLASS David D. Glass |
Executive Vice President and Chief Financial Officer (principal financial officer) |
|
/s/ JOHN P. KIERNAN John P. Kiernan |
Senior Vice President, Finance and Corporate Controller (principal accounting officer) |
57
Veeco Instruments Inc. and Subsidiaries
Index to Consolidated Financial Statements
and Financial Statement Schedule
F-1
Management's Report on Internal Control
Over Financial Reporting
Management of the Company is responsible for establishing and maintaining adequate internal control over financial reporting as defined in Rules 13a-15(f) and 15d-15(f) under the Securities Exchange Act of 1934. The Company's internal control over financial reporting is designed to provide reasonable assurance regarding the reliability of financial reporting and the preparation of financial statements for external purposes in accordance with accounting principles generally accepted in the United States of America ("GAAP"). The Company's internal control over financial reporting includes those policies and procedures that:
- •
- pertain to the maintenance of records that, in reasonable detail, accurately and fairly reflect the transactions and
dispositions of the assets of the Company;
- •
- provide reasonable assurance that transactions are recorded as necessary to permit preparation of financial statements in
accordance with GAAP, and that receipts and expenditures of the Company are being made only in accordance with authorizations of management and directors of the Company; and
- •
- provide reasonable assurance regarding prevention or timely detection of unauthorized acquisition, use or disposition of the Company's assets that could have a material effect on the financial statements.
Because of its inherent limitations, internal control over financial reporting may not prevent or detect misstatements. Also, projections of any evaluation of effectiveness to future periods are subject to the risk that controls may become inadequate because of changes in conditions, or that the degree of compliance with the policies or procedures may deteriorate.
As required by Section 404 of the Sarbanes-Oxley Act of 2002, management assessed the effectiveness of the Company's internal control over financial reporting as of December 31, 2010. In making this assessment, management used the criteria set forth by the Committee of Sponsoring Organizations of the Treadway Commission ("COSO") in Internal Control-Integrated Framework.
Based on our assessment and those criteria, management believes that the Company maintained effective internal control over financial reporting as of December 31, 2010.
The effectiveness of the Company's internal control over financial reporting as of December 31, 2010 has been audited by Ernst & Young LLP, an independent registered public accounting firm, as stated in their report which appears under the heading "Report of Independent Registered Public Accounting Firm on Internal Control Over Financial Reporting."
Veeco
Instruments Inc.
Plainview, NY
February 23, 2011
| /s/ JOHN R. PEELER John R. Peeler Chief Executive Officer Veeco Instruments Inc. February 23, 2011 |
||
/s/ DAVID D. GLASS David D. Glass Executive Vice President and Chief Financial Officer Veeco Instruments Inc. February 23, 2011 |
F-2
Report of Independent Registered Public Accounting Firm
on Internal Control Over Financial Reporting
The Board of Directors and Shareholders of Veeco Instruments Inc.
We have audited Veeco Instruments Inc. and Subsidiaries (the "Company") internal control over financial reporting as of December 31, 2010, based on criteria established in Internal Control—Integrated Framework issued by the Committee of Sponsoring Organizations of the Treadway Commission (the COSO criteria). The Company's management is responsible for maintaining effective internal control over financial reporting, and for its assessment of the effectiveness of internal control over financial reporting included in the accompanying Management's Report on Internal Control Over Financial Reporting. Our responsibility is to express an opinion on the Company's internal control over financial reporting based on our audit.
We conducted our audit in accordance with the standards of the Public Company Accounting Oversight Board (United States). Those standards require that we plan and perform the audit to obtain reasonable assurance about whether effective internal control over financial reporting was maintained in all material respects. Our audit included obtaining an understanding of internal control over financial reporting, assessing the risk that a material weakness exists, testing and evaluating the design and operating effectiveness of internal control based on the assessed risk, and performing such other procedures as we considered necessary in the circumstances. We believe that our audit provides a reasonable basis for our opinion.
A company's internal control over financial reporting is a process designed to provide reasonable assurance regarding the reliability of financial reporting and the preparation of financial statements for external purposes in accordance with generally accepted accounting principles. A company's internal control over financial reporting includes those policies and procedures that (1) pertain to the maintenance of records that, in reasonable detail, accurately and fairly reflect the transactions and dispositions of the assets of the company; (2) provide reasonable assurance that transactions are recorded as necessary to permit preparation of financial statements in accordance with generally accepted accounting principles, and that receipts and expenditures of the company are being made only in accordance with authorizations of management and directors of the company; and (3) provide reasonable assurance regarding prevention or timely detection of unauthorized acquisition, use, or disposition of the company's assets that could have a material effect on the financial statements.
Because of its inherent limitations, internal control over financial reporting may not prevent or detect misstatements. Also, projections of any evaluation of effectiveness to future periods are subject to the risk that controls may become inadequate because of changes in conditions, or that the degree of compliance with the policies or procedures may deteriorate.
In our opinion, the Company maintained, in all material respects, effective internal control over financial reporting as of December 31, 2010, based on the COSO criteria.
We also have audited, in accordance with the standards of the Public Company Accounting Oversight Board (United States), the 2010 consolidated financial statements of the Company and our report dated February 23, 2011 expressed an unqualified opinion thereon.
| /s/ ERNST & YOUNG LLP |
New
York, New York
February 23, 2011
F-3
Report of Independent Registered Public Accounting Firm on Financial Statements
To the Shareholders and Board of Directors of Veeco Instruments Inc.
We have audited the accompanying consolidated balance sheets of Veeco Instruments Inc. and Subsidiaries (the "Company") as of December 31, 2010 and 2009, and the related consolidated statements of operations, equity, comprehensive income (loss) and cash flows for each of the three years in the period ended December 31, 2010. Our audits also included the financial statement schedule in the accompanying Index. These financial statements are the responsibility of the Company's management. Our responsibility is to express an opinion on these financial statements and schedule based on our audits.
We conducted our audits in accordance with the standards of the Public Company Accounting Oversight Board (United States). Those standards require that we plan and perform the audit to obtain reasonable assurance about whether the financial statements are free of material misstatement. An audit includes examining, on a test basis, evidence supporting the amounts and disclosures in the financial statements. An audit also includes assessing the accounting principles used and significant estimates made by management, as well as evaluating the overall financial statement presentation. We believe that our audits provide a reasonable basis for our opinion.
In our opinion, the consolidated financial statements referred to above present fairly, in all material respects, the consolidated financial position of the Company at December 31, 2010 and 2009, and the consolidated results of their operations and their cash flows for each of the three years in the period ended December 31, 2010, in conformity with U.S. generally accepted accounting principles. Also, in our opinion, the related financial statement schedule, when considered in relation to the basic financial statements taken as a whole, presents fairly in all material respects the information set forth therein.
We also have audited, in accordance with the standards of the Public Company Accounting Oversight Board (United States), the Company's internal control over financial reporting as of December 31, 2010, based on criteria established in Internal Control-Integrated Framework issued by the Committee of Sponsoring Organizations of the Treadway Commission and our report dated February 23, 2011, expressed an unqualified opinion thereon.
| /s/ ERNST & YOUNG LLP |
New
York, New York
February 23, 2011
F-4
Veeco Instruments Inc. and Subsidiaries
Consolidated Balance Sheets
(Dollars in thousands)
| |
December 31, | |||||||
|---|---|---|---|---|---|---|---|---|
| |
2010 | 2009 | ||||||
Assets |
||||||||
Current assets: |
||||||||
Cash and cash equivalents |
$ | 245,132 | $ | 148,500 | ||||
Short-term investments |
394,180 | 135,000 | ||||||
Restricted cash |
76,115 | — | ||||||
Accounts receivable, less allowance for doubtful accounts of $512 in 2010 and $438 in 2009 |
150,528 | 67,546 | ||||||
Inventories |
108,487 | 55,807 | ||||||
Prepaid expenses and other current assets |
34,328 | 6,419 | ||||||
Assets of discontinued segment held for sale |
— | 40,058 | ||||||
Deferred income taxes |
13,803 | 3,105 | ||||||
Total current assets |
1,022,573 | 456,435 | ||||||
Property, plant and equipment at cost, net |
42,320 | 44,707 | ||||||
Goodwill |
52,003 | 52,003 | ||||||
Deferred income taxes |
9,403 | — | ||||||
Intangible assets, net |
16,893 | 21,770 | ||||||
Other assets |
4,842 | 429 | ||||||
Assets of discontinued segment held for sale |
— | 30,028 | ||||||
Total assets |
$ | 1,148,034 | $ | 605,372 | ||||
Liabilities and equity |
||||||||
Current liabilities: |
||||||||
Accounts payable |
$ | 32,220 | $ | 24,910 | ||||
Accrued expenses and other current liabilities |
183,010 | 99,823 | ||||||
Deferred profit |
4,109 | 2,520 | ||||||
Income taxes payable |
56,369 | 829 | ||||||
Liabilities of discontinued segment held for sale |
5,359 | 10,824 | ||||||
Current portion of long-term debt |
101,367 | 212 | ||||||
Total current liabilities |
382,434 | 139,118 | ||||||
Deferred income taxes |
— | 5,039 | ||||||
Long-term debt |
2,654 | 100,964 | ||||||
Other liabilities |
434 | 1,192 | ||||||
Equity: |
||||||||
Preferred stock, 500,000 shares authorized; no shares issued and outstanding |
— | — | ||||||
Common stock; $.01 par value; authorized 120,000,000 shares; 40,337,950 and 39,003,114 shares issued and outstanding in 2010 and 2009, respectively |
409 | 382 | ||||||
Additional paid-in-capital |
656,969 | 575,860 | ||||||
Retained earnings (accumulated deficit) |
137,436 | (224,324 | ) | |||||
Accumulated other comprehensive income |
5,796 | 7,141 | ||||||
Less: treasury stock, at cost; 1,118,600 shares in 2010 |
(38,098 | ) | — | |||||
Total equity |
762,512 | 359,059 | ||||||
Total liabilities and equity |
$ | 1,148,034 | $ | 605,372 | ||||
The accompanying notes are an integral part of these consolidated financial statements.
F-5
Veeco Instruments Inc. and Subsidiaries
Consolidated Statements of Operations
(In thousands, except per share data)
| |
Year ended December 31, | |||||||||||
|---|---|---|---|---|---|---|---|---|---|---|---|---|
| |
2010 | 2009 | 2008 | |||||||||
Net sales |
$ | 933,231 | $ | 282,412 | $ | 314,935 | ||||||
Cost of sales |
489,406 | 171,177 | 191,664 | |||||||||
Gross profit |
443,825 | 111,235 | 123,271 | |||||||||
Operating expenses (income): |
||||||||||||
Selling, general and administrative |
91,777 | 62,151 | 60,542 | |||||||||
Research and development |
71,390 | 43,483 | 39,608 | |||||||||
Amortization |
4,876 | 5,168 | 8,864 | |||||||||
Restructuring |
(179 | ) | 4,837 | 9,424 | ||||||||
Asset impairment |
— | 304 | 51,387 | |||||||||
Other, net |
(1,614 | ) | 24 | (414 | ) | |||||||
Total operating expenses |
166,250 | 115,967 | 169,411 | |||||||||
Operating income (loss) |
277,575 | (4,732 | ) | (46,140 | ) | |||||||
Interest expense |
8,201 | 7,732 | 9,317 | |||||||||
Interest income |
(1,629 | ) | (882 | ) | (2,588 | ) | ||||||
Gain on extinguishment of debt |
— | — | (3,758 | ) | ||||||||
Income (loss) from continuing operations before income taxes |
271,003 | (11,582 | ) | (49,111 | ) | |||||||
Income tax provision |
10,472 | 2,647 | 1,722 | |||||||||
Income (loss) from continuing operations |
260,531 | (14,229 | ) | (50,833 | ) | |||||||
Discontinued operations: |
||||||||||||
Income (loss) from discontinued operations, before income taxes (includes gain on disposal of $156,290 in 2010) |
155,455 | (2,703 | ) | (24,418 | ) | |||||||
Income tax provision (benefit) |
54,226 | (1,300 | ) | 170 | ||||||||
Income (loss) from discontinued operations |
101,229 | (1,403 | ) | (24,588 | ) | |||||||
Net income (loss) |
361,760 | (15,632 | ) | (75,421 | ) | |||||||
Net loss attributable to noncontrolling interest |
— | (65 | ) | (230 | ) | |||||||
Net income (loss) attributable to Veeco |
$ | 361,760 | $ | (15,567 | ) | $ | (75,191 | ) | ||||
Income (loss) per common share attributable to Veeco: |
||||||||||||
Basic: |
||||||||||||
Continuing operations |
$ | 6.60 | $ | (0.44 | ) | $ | (1.62 | ) | ||||
Discontinued operations |
2.56 | (0.04 | ) | (0.78 | ) | |||||||
Income (loss) |
$ | 9.16 | $ | (0.48 | ) | $ | (2.40 | ) | ||||
Diluted: |
||||||||||||
Continuing operations |
$ | 6.13 | $ | (0.44 | ) | $ | (1.62 | ) | ||||
Discontinued operations |
2.38 | (0.04 | ) | (0.78 | ) | |||||||
Income (loss) |
$ | 8.51 | $ | (0.48 | ) | $ | (2.40 | ) | ||||
Weighted average shares outstanding: |
||||||||||||
Basic |
39,499 | 32,628 | 31,347 | |||||||||
Diluted |
42,514 | 32,628 | 31,347 | |||||||||
The accompanying notes are an integral part of these consolidated financial statements.
F-6
Veeco Instruments Inc. and Subsidiaries
Consolidated Statements of Comprehensive Income (Loss)
(In thousands)
| |
Year ended December 31, | ||||||||||
|---|---|---|---|---|---|---|---|---|---|---|---|
| |
2010 | 2009 | 2008 | ||||||||
Net income (loss) |
$ | 361,760 | $ | (15,632 | ) | $ | (75,421 | ) | |||
Other comprehensive income (loss), net of tax |
|||||||||||
Foreign currency translation |
(1,322 | ) | (58 | ) | 1,845 | ||||||
Unrealized gain on available-for-sale securities |
97 | — | — | ||||||||
Minimum pension liability |
(120 | ) | 32 | 37 | |||||||
Comprehensive income (loss) |
360,415 | (15,658 | ) | (73,539 | ) | ||||||
Comprehensive loss attributable to noncontrolling interest |
— | (65 | ) | (230 | ) | ||||||
Comprehensive income (loss) attributable to Veeco |
$ | 360,415 | $ | (15,593 | ) | $ | (73,309 | ) | |||
The accompanying notes are an integral part of these consolidated financial statements.
F-7
Veeco Instruments Inc. and Subsidiaries
Consolidated Statements of Equity
(Dollars in thousands)
| |
|
|
|
|
|
|
Equity Attributable to | |||||||||||||||||||||
|---|---|---|---|---|---|---|---|---|---|---|---|---|---|---|---|---|---|---|---|---|---|---|---|---|---|---|---|---|
| |
Common Stock | |
|
Retained Earnings (Accumulated Deficit) |
|
|||||||||||||||||||||||
| |
Treasury Stock |
Additional Paid-in Capital |
Accumulated Other Comprehensive Income |
|
Noncontrolling Interest |
|
||||||||||||||||||||||
| |
Shares | Amount | Veeco | Total | ||||||||||||||||||||||||
Balance at January 1, 2008 |
31,823,890 | $ | 312 | $ | — | $ | 416,113 | $ | (133,566 | ) | $ | 5,285 | $ | 288,144 | $ | 1,014 | $ | 289,158 | ||||||||||
Exercise of stock options |
67,080 | 1 | — | 680 | — | — | 681 | — | 681 | |||||||||||||||||||
Equity-based compensation expense-continuing operations |
— | — | — | 9,668 | — | — | 9,668 | — | 9,668 | |||||||||||||||||||
Equity-based compensation expense-discontinued operations |
— | — | — | 858 | — | — | 858 | — | 858 | |||||||||||||||||||
Issuance, vesting and cancellation of restricted stock |
296,629 | 3 | — | (1,019 | ) | — | — | (1,016 | ) | — | (1,016 | ) | ||||||||||||||||
Translation adjustments |
— | — | — | — | — | 1,845 | 1,845 | — | 1,845 | |||||||||||||||||||
Defined benefit pension plan |
— | — | — | — | — | 37 | 37 | — | 37 | |||||||||||||||||||
Net loss |
— | — | — | — | (75,191 | ) | — | (75,191 | ) | (230 | ) | (75,421 | ) | |||||||||||||||
Balance at December 31, 2008 |
32,187,599 | 316 | — | 426,300 | (208,757 | ) | 7,167 | 225,026 | 784 | 225,810 | ||||||||||||||||||
Exercise of stock options |
755,229 | 8 | — | 12,578 | — | — | 12,586 | — | 12,586 | |||||||||||||||||||
Equity-based compensation expense-continuing operations |
— | — | — | 7,547 | — | — | 7,547 | — | 7,547 | |||||||||||||||||||
Equity-based compensation expense-discontinued operations |
— | — | — | 990 | — | — | 990 | — | 990 | |||||||||||||||||||
Issuance, vesting and cancellation of restricted stock |
310,286 | — | — | (607 | ) | — | — | (607 | ) | — | (607 | ) | ||||||||||||||||
Issuance of common stock |
5,750,000 | 58 | — | 130,028 | — | — | 130,086 | — | 130,086 | |||||||||||||||||||
Translation adjustments |
— | — | — | — | — | (58 | ) | (58 | ) | — | (58 | ) | ||||||||||||||||
Defined benefit pension plan |
— | — | — | — | — | 32 | 32 | — | 32 | |||||||||||||||||||
Purchase of remaining 80.1% of noncontrolling interest |
— | — | — | (976 | ) | — | — | (976 | ) | (719 | ) | (1,695 | ) | |||||||||||||||
Net loss |
— | — | — | — | (15,567 | ) | — | (15,567 | ) | (65 | ) | (15,632 | ) | |||||||||||||||
Balance at December 31, 2009 |
39,003,114 | 382 | — | 575,860 | (224,324 | ) | 7,141 | 359,059 | — | 359,059 | ||||||||||||||||||
Exercise of stock options |
2,499,591 | 25 | — | 45,139 | — | — | 45,164 | — | 45,164 | |||||||||||||||||||
Equity-based compensation expense-continuing operations |
— | — | — | 9,648 | — | — | 9,648 | — | 9,648 | |||||||||||||||||||
Equity-based compensation expense-discontinued operations |
— | — | — | 7,672 | — | — | 7,672 | — | 7,672 | |||||||||||||||||||
Issuance, vesting and cancellation of restricted stock |
(46,155 | ) | 2 | — | (4,621 | ) | — | — | (4,619 | ) | — | (4,619 | ) | |||||||||||||||
Treasury stock |
(1,118,600 | ) | — | (38,098 | ) | — | — | — | (38,098 | ) | — | (38,098 | ) | |||||||||||||||
Excess tax benefits from stock option exercises |
— | — | — | 23,271 | — | — | 23,271 | — | 23,271 | |||||||||||||||||||
Translation adjustments |
— | — | — | — | — | (1,322 | ) | (1,322 | ) | — | (1,322 | ) | ||||||||||||||||
Defined benefit pension plan |
— | — | — | — | — | (120 | ) | (120 | ) | — | (120 | ) | ||||||||||||||||
Unrealized gain on short-term investments |
— | — | — | — | — | 97 | 97 | — | 97 | |||||||||||||||||||
Net income |
— | — | — | — | 361,760 | — | 361,760 | — | 361,760 | |||||||||||||||||||
Balance at December 31, 2010 |
40,337,950 | $ | 409 | $ | (38,098 | ) | $ | 656,969 | $ | 137,436 | $ | 5,796 | $ | 762,512 | $ | — | $ | 762,512 | ||||||||||
The accompanying notes are an integral part of these consolidated financial statements.
F-8
Veeco Instruments Inc. and Subsidiaries
Consolidated Statements of Cash Flows
(In thousands)
| |
Year ended December 31, | |||||||||||
|---|---|---|---|---|---|---|---|---|---|---|---|---|
| |
2010 | 2009 | 2008 | |||||||||
Operating activities |
||||||||||||
Net income (loss) |
$ | 361,760 | $ | (15,632 | ) | $ | (75,421 | ) | ||||
Adjustments to reconcile net income (loss) to net cash provided by operating activities: |
||||||||||||
Depreciation and amortization |
12,854 | 13,865 | 17,685 | |||||||||
Amortization of debt discount |
3,058 | 2,846 | 2,917 | |||||||||
Non-cash equity-based compensation |
9,648 | 7,547 | 9,668 | |||||||||
Non-cash asset impairment |
— | 304 | 51,387 | |||||||||
Non-cash inventory write-off |
— | 1,526 | — | |||||||||
Non-cash restructuring |
(179 | ) | — | (105 | ) | |||||||
Net gain on early extinguishment of debt |
— | — | (3,758 | ) | ||||||||
Deferred income taxes |
(25,141 | ) | (414 | ) | 1,569 | |||||||
Gain on disposal of segment (see Note 3) |
(156,290 | ) | — | — | ||||||||
Excess tax benefits from stock option exercises |
(23,271 | ) | — | — | ||||||||
Other, net |
1,034 | 44 | (87 | ) | ||||||||
Non-cash items from discontinued operations |
10,025 | 8,805 | 33,070 | |||||||||
Changes in operating assets and liabilities: |
||||||||||||
Accounts receivable |
(83,160 | ) | (28,379 | ) | 12,727 | |||||||
Inventories |
(49,535 | ) | 10,322 | 3,683 | ||||||||
Supplier deposits |
(23,296 | ) | 117 | (122 | ) | |||||||
Accounts payable |
7,299 | 3,067 | (6,110 | ) | ||||||||
Accrued expenses, deferred profit and other current liabilities |
85,500 | 51,582 | (4,453 | ) | ||||||||
Income taxes payable |
78,894 | 1,482 | (2,931 | ) | ||||||||
Other, net |
(9,491 | ) | (2,904 | ) | 2,287 | |||||||
Discontinued operations |
(5,495 | ) | 4,860 | 1,188 | ||||||||
Net cash provided by operating activities |
194,214 | 59,038 | 43,194 | |||||||||
Investing activities |
||||||||||||
Capital expenditures |
(10,724 | ) | (7,460 | ) | (11,126 | ) | ||||||
Payments for net assets of businesses acquired |
— | (2,413 | ) | (10,981 | ) | |||||||
Payments of earn-outs for businesses acquired |
— | (9,839 | ) | — | ||||||||
Transfers to restricted cash |
(76,115 | ) | — | — | ||||||||
Proceeds from the maturity of CDARS |
213,641 | — | — | |||||||||
Proceeds from sales of short-term investments |
32,971 | — | — | |||||||||
Payments for purchases of short-term investments |
(506,103 | ) | (135,000 | ) | — | |||||||
Proceeds from the sale of property, plant and equipment |
13 | 834 | 103 | |||||||||
Proceeds from disposal of segment, net of transaction fees (see Note 3) |
225,188 | — | — | |||||||||
Discontinued operations |
(492 | ) | (887 | ) | (1,680 | ) | ||||||
Net cash used in investing activities |
(121,621 | ) | (154,765 | ) | (23,684 | ) | ||||||
Financing activities |
||||||||||||
Proceeds from stock option exercises |
45,164 | 12,586 | 681 | |||||||||
Proceeds from issuance of common stock |
— | 130,086 | — | |||||||||
Restricted stock tax withholdings |
(4,619 | ) | (607 | ) | (1,019 | ) | ||||||
Excess tax benefits from stock option exercises |
23,271 | — | — | |||||||||
Purchases of treasury stock |
(38,098 | ) | — | — | ||||||||
Repayments of long-term debt |
(213 | ) | (196 | ) | (32,659 | ) | ||||||
Net cash provided by (used in) financing activities |
25,505 | 141,869 | (32,997 | ) | ||||||||
Effect of exchange rate changes on cash and cash equivalents |
(1,466 | ) | (163 | ) | (867 | ) | ||||||
Net increase (decrease) in cash and cash equivalents |
96,632 | 45,979 | (14,354 | ) | ||||||||
Cash and cash equivalents at beginning of year |
148,500 | 102,521 | 116,875 | |||||||||
Cash and cash equivalents at end of year |
$ | 245,132 | $ | 148,500 | $ | 102,521 | ||||||
Supplemental disclosure of cash flow information |
||||||||||||
Interest paid |
$ | 4,727 | $ | 4,935 | $ | 6,530 | ||||||
Income taxes paid |
9,925 | 1,808 | 3,215 | |||||||||
Non-cash investing and financing activities |
||||||||||||
Accrual of payment for net assets of businesses acquired |
$ | — | $ | 1,000 | $ | — | ||||||
Accrual of contingent earn-out payment to former shareholders of acquired company |
— | — | 9,644 | |||||||||
Transfers from property, plant and equipment to inventory |
3,913 | 1,159 | 404 | |||||||||
Transfers from inventory to property, plant and equipment |
850 | 23 | 385 | |||||||||
The accompanying notes are an integral part of these consolidated financial statements.
F-9
Veeco Instruments Inc. and Subsidiaries
Notes to Consolidated Financial Statements
December 31, 2010
1. Description of Business and Significant Accounting Policies
Business
Veeco Instruments Inc. (together with its consolidated subsidiaries, "Veeco," the "Company" or "we") designs, manufactures and markets equipment to develop and manufacture light emitting diodes ("LEDs"), solar panels, hard-disk drives and other devices. We have leading technology positions in our two segments: Light Emitting Diode ("LED") & Solar and Data Storage.
In our LED & Solar segment, we design and manufacture metal organic chemical vapor deposition ("MOCVD") systems, molecular beam epitaxy ("MBE") systems, Copper, Indium, Gallium, Selenide ("CIGS") deposition systems and thermal deposition sources that we sell to manufacturers of high brightness LEDs ("HB LED") and solar panels, as well as to scientific research customers.
In our Data Storage segment, we design and manufacture ion beam etch, ion beam deposition, diamond-like carbon, physical vapor deposition, chemical vapor deposition, and dicing and slicing systems that we primarily used to create thin film magnetic heads ("TFMHs") that read and write data on hard disk drives.
We support our customers through product development, manufacturing, sales and service sites in the U.S., Korea, Taiwan, China, Singapore, Japan, Europe and other locations.
Basis of Presentation
We report interim quarters, other than fourth quarters which always end on December 31, on a 13-week basis ending on the last Sunday within such period. The interim quarter ends are determined at the beginning of each year based on the 13-week quarters. The 2010 interim quarter ends were March 28, June 27 and September 26. The 2009 interim quarter ends were March 29, June 28 and September 27. For ease of reference, we report these interim quarter ends as March 31, June 30 and September 30 in our interim condensed consolidated financial statements.
Estimates
The preparation of financial statements in conformity with accounting principles generally accepted in the United States requires management to make estimates and assumptions that affect the reported amounts of assets and liabilities and disclosure of contingent assets and liabilities at the date of the financial statements and the reported amounts of revenues and expenses during the reporting period. Significant estimates made by management include allowance for doubtful accounts, inventory obsolescence, purchase accounting allocations, recoverability and useful lives of property, plant and equipment and identifiable intangible assets, recoverability of goodwill, recoverability of deferred tax assets, liabilities for product warranty, accruals for contingencies and equity-based payments, including forfeitures and liabilities for tax uncertainties. Actual results could differ from those estimates.
Principles of Consolidation
The accompanying Consolidated Financial Statements include the accounts of Veeco and its subsidiaries. Intercompany items and transactions have been eliminated in consolidation.
F-10
Veeco Instruments Inc. and Subsidiaries
Notes to Consolidated Financial Statements (Continued)
December 31, 2010
Revenue Recognition
We recognize revenue based on current accounting guidance provided by the Securities and Exchange Commission ("SEC") and the Financial Accounting Standards Board ("FASB"). Our revenue transactions include sales of products under multiple-element arrangements. Revenue under these arrangements is allocated to each element based upon its estimated fair market value.
We consider a broad array of facts and circumstances when evaluating each of our sales arrangements in determining when to recognize revenue, including specific terms of the purchase order, contractual obligations to the customer, the complexity of the customer's post-delivery acceptance provisions, customer creditworthiness and the installation process. Management also considers the party responsible for installation, whether there are process specification requirements which need to be demonstrated before final sign off and payment, whether Veeco can replicate the field testing conditions and procedures in our factory and our past experience with demonstrating and installing a particular system. Sales arrangements are reviewed on a case-by-case basis; however, the Company's revenue recognition protocol for established systems is as described below.
System revenue is generally recognized upon shipment or delivery provided title and risk of loss has passed to the customer, evidence of an arrangement exists, prices are contractually fixed or determinable, collectability is reasonably assured and there are no material uncertainties regarding customer acceptance. Revenue from installation services is recognized at the time acceptance is received from the customer. If the arrangement does not meet all the above criteria, the entire amount of the sales arrangement is deferred until the criteria have been met or all elements have been delivered to the customer or been completed.
For those transactions on which we recognize systems revenue, either at the time of shipment or delivery, our sales and contractual arrangements with customers do not contain provisions for right of return or forfeiture, refund or other purchase price concessions. In the rare instances where such provisions are included, the Company defers all revenue until customer acceptance is achieved. In cases where products are sold with a retention of 10% to 20%, which is typically payable by the customer when installation and field acceptance provisions are completed, the customer has the right to withhold this payment until such provisions have been achieved. We defer the greater of the retention amount or the fair value of the installation on systems that we recognize revenue at the time of shipment or delivery.
For new products, new applications of existing products or for products with substantive customer acceptance provisions where performance cannot be fully assessed prior to meeting agreed upon specifications at the customer site, revenue is deferred as deferred profit in the accompanying Consolidated Balance Sheets and fully recognized upon completion of installation and receipt of final customer acceptance.
Our systems are principally sold to manufacturers in the HB-LED, the data storage and solar industries. Sales arrangements for these systems generally include customer acceptance criteria based upon Veeco and/or customer specifications. Prior to shipment a customer source inspection of the system is performed in our facility or test data is sent to the customer documenting that the system is functioning within agreed upon specifications. Such source inspection or test data replicates the acceptance testing that will be performed at the customer's site prior to final acceptance of the system. Customer acceptance provisions include reassembly and installation of the system at the customer site, which includes performing functional or mechanical test procedures (i.e. hardware checks, leak testing,
F-11
Veeco Instruments Inc. and Subsidiaries
Notes to Consolidated Financial Statements (Continued)
December 31, 2010
gas flow monitoring and quality control checks of the basic features of the product.) Additionally, a material demonstration process may be performed to validate the functionality of the product. Upon meeting the agreed upon specifications the customer approves final acceptance of the product.
Veeco generally is required to install these products and demonstrate compliance with acceptance tests at the customer's facility. Such installations typically are not considered complex and the installation process is not deemed essential to the functionality of the equipment because it does not involve significant changes to the features or capabilities of the equipment or involve building complex interfaces or connections. We have a demonstrated history of completing such installations in a timely, consistent manner and can reliably estimate the costs of such. In such cases, the test environment at our facilities prior to shipment replicates the customer's environment. While there are others in the industry with sufficient knowledge about the installation process for our systems as a practical matter, most customers engage the Company to perform the installation services.
In Japan, where our contractual terms with customers generally specify risk of loss and title transfers upon customer acceptance, revenue is recognized and the customer is billed upon receipt of written customer acceptance.
Revenue related to maintenance and service contracts is recognized ratably over the applicable contract term. Component and spare part revenue is recognized at the time of shipment or delivery in accordance with the terms of the applicable sales arrangement.
Cash and Cash Equivalents
Cash and cash equivalents include cash and highly liquid investments with maturities of three months or less when purchased. Such items may include cash in operating bank accounts, liquid money market accounts, treasury bills, commercial paper, Federal Deposit Insurance Corporation ("FDIC") insured corporate bonds and certificates of deposit placed through an account registry service ("CDARS") with maturities of three months or less when purchased. CDARS, commercial paper and treasury bills classified as cash equivalents are carried at cost, which approximates fair market value.
Short-Term Investments
We determine the appropriate balance sheet classification of our investments at the time of purchase and evaluate the classification at each balance sheet date. As part of our cash management program, we maintain a portfolio of marketable securities which are classified as available-for-sale. These securities include FDIC insured corporate bonds, treasury bills, commercial paper and CDARS with maturities of greater than three months when purchased in principal amounts that, when aggregated with interest to accrue over the term, will not exceed FDIC limits. Securities classified as available-for-sale are carried at fair market value, with the unrealized gains and losses, net of tax, included in the determination of comprehensive income (loss) and reported in equity. Net realized gains and losses are included in net income (loss) attributable to Veeco.
Concentration of Credit Risk
Financial instruments, which potentially subject us to concentrations of credit risk, consist primarily of accounts receivable, short-term investments and cash and cash equivalents. We perform ongoing credit evaluations of our customers and, where appropriate, require that letters of credit be provided on certain foreign sales arrangements. We maintain allowances for potential credit losses and make
F-12
Veeco Instruments Inc. and Subsidiaries
Notes to Consolidated Financial Statements (Continued)
December 31, 2010
investments with strong, higher credit quality issuers and continuously monitor the amount of credit exposure to any one issuer.
Inventories
Inventories are stated at the lower of cost (principally first-in, first-out method) or market. Management evaluates the need to record adjustments for impairment of inventory on a quarterly basis. Our policy is to assess the valuation of all inventories, including raw materials, work in process, finished goods, and spare parts and other service inventory. Obsolete or slow-moving inventory, based upon historical usage or inventory in excess of management's estimated usage for the next 12 months' requirements is written down to its estimated market value, if less than its cost. Inherent in the estimates of market value are management's estimates related to our future manufacturing schedules, customer demand, technological and/or market obsolescence, possible alternative uses and ultimate realization of excess inventory.
Goodwill and Indefinite-Lived Intangibles
We account for goodwill and intangible assets with indefinite useful lives in accordance with relevant accounting guidance related to goodwill and other intangible assets, which states that goodwill and intangible assets with indefinite useful lives should not be amortized, but instead tested for impairment at least annually at the reporting unit level. Our policy is to perform this annual impairment test in the fourth quarter of each fiscal year or more frequently if impairment indicators arise. Impairment indicators include, among other conditions, cash flow deficits, a historical or anticipated decline in revenue or operating profit, adverse legal or regulatory developments and a material decrease in the fair value of some or all of the assets.
Pursuant to the aforementioned guidance we are required to determine if it is appropriate to use the operating segment, as defined under guidance for segment reporting, as the reporting unit, or one level below the operating segment, depending on whether certain criteria are met. We have identified two reporting units that are required to be reviewed for impairment. The reporting units are Data Storage and LED & Solar. In identifying the reporting units management considered the economic characteristics of operating segments including the products and services provided, production processes, types or classes of customer and product distribution.
We perform this impairment test by first comparing the fair value of our reporting units to their respective carrying amount. When determining the estimated fair value of a reporting unit, we utilize a discounted future cash flow approach since reported quoted market prices are not available for our reporting units. Developing the estimate of the discounted future cash flow requires significant judgment and projections of future financial performance. The key assumptions used in developing the discounted future cash flows are the projection of future revenues and expenses, working capital requirements, residual growth rates and the weighted average cost of capital. In developing our financial projections, we consider historical data, current internal estimates and market growth trends. Changes to any of these assumptions could materially change the fair value of the reporting unit. We reconcile the aggregate fair value of our reporting units to our adjusted market capitalization as a supporting calculation. The adjusted market capitalization is calculated by multiplying the average share price of our common stock for the last ten trading days prior to the measurement date by the number of outstanding common shares and adding a control premium.
F-13
Veeco Instruments Inc. and Subsidiaries
Notes to Consolidated Financial Statements (Continued)
December 31, 2010
If the carrying value of the reporting units exceed the fair value we would then compare the implied fair value of our goodwill to the carrying amount in order to determine the amount of the impairment, if any.
Definite-Lived Intangible and Long-Lived Assets
Intangible assets consist of purchased technology, customer-related intangible assets, patents, trademarks, covenants not-to-compete, software licenses and deferred financing costs. Purchased technology consists of the core proprietary manufacturing technologies associated with the products and offerings obtained through acquisition and are initially recorded at fair value. Customer-related intangible assets, patents, trademarks and covenants not-to-compete are initially recorded at fair value and software licenses and deferred financing costs are initially recorded at cost. Intangible assets with definitive useful lives are amortized using the straight-line method over their estimated useful lives for periods ranging from 2 years to 17 years.
Property, plant and equipment are recorded at cost. Depreciation is provided over the estimated useful lives of the related assets using the straight-line method for financial statement purposes. Amortization of leasehold improvements is computed using the straight-line method over the shorter of the remaining lease term or the estimated useful lives of the improvements.
Long-lived assets, such as property, plant, and equipment and intangible assets with definite useful lives, are reviewed for impairment whenever events or changes in circumstances indicate that the carrying amount of an asset may not be recoverable. Impairment indicators include, among other conditions, cash flow deficits, a historical or anticipated decline in revenue or operating profit, adverse legal or regulatory developments and a material decrease in the fair value of some or all of the assets. Assets are grouped at the lowest level for which there are identifiable cash flows that are largely independent of the cash flows generated by other asset groups. Recoverability of assets to be held and used is measured by a comparison of the carrying amount of an asset to the estimated undiscounted future cash flow expected to be generated by the asset. If the carrying amount of an asset exceeds its estimated future cash flows, an impairment charge is recognized by the amount by which the carrying amount of the asset exceeds the fair value of the asset.
Cost Method of Accounting for Investments
Investee companies not accounted for under the consolidation or the equity method of accounting are accounted for under the cost method of accounting. Under this method, the Company's share of the earnings or losses of such investee companies is not included in the Consolidated Balance Sheet or Statement of Operations. However, impairment charges are recognized in the Consolidated Statement of Operations. If circumstances suggest that the value of the investee company has subsequently recovered, such recovery is not recorded.
Fair Value of Financial Instruments
We believe the carrying amounts of our financial instruments, including cash and cash equivalents, accounts receivable, accounts payable, accrued expenses, reflected in the consolidated financial statements approximate fair value due to their short-term maturities. The fair value of our debt, including current maturities, is estimated using a discounted cash flow analysis, based on the estimated current incremental borrowing rates for similar types of securities or based on market value for our publicly traded debt (see Note 7).
F-14
Veeco Instruments Inc. and Subsidiaries
Notes to Consolidated Financial Statements (Continued)
December 31, 2010
Derivative Financial Instruments
We use derivative financial instruments to minimize the impact of foreign exchange rate changes on earnings and cash flows. In the normal course of business, our operations are exposed to fluctuations in foreign exchange rates. In order to reduce the effect of fluctuating foreign currencies on short-term foreign currency-denominated intercompany transactions and other known foreign currency exposures, we enter into monthly forward contracts. We do not use derivative financial instruments for trading or speculative purposes. Our forward contracts are not expected to subject us to material risks due to exchange rate movements because gains and losses on these contracts are intended to offset exchange gains and losses on the underlying assets and liabilities. The forward contracts are marked-to-market through earnings. We conduct our derivative transactions with highly rated financial institutions in an effort to mitigate any material credit risk.
The aggregate foreign currency exchange gain (loss) included in determining consolidated results of operations was approximately $1.3 million, $(0.7) million and $(0.1) million in 2010, 2009 and 2008, respectively. Included in the aggregate foreign currency exchange gain (loss) were gains (losses) relating to forward contracts of $0.1 million, $0.2 million and ($0.4) million in 2010, 2009 and 2008, respectively. These amounts were recognized and are included in other, net in the accompanying Consolidated Statements of Operations.
As of December 31, 2010, approximately $0.3 million of gains related to forward contracts were included in prepaid expenses and other current assets and were subsequently received in January 2011. As of December 31, 2009, approximately $0.2 million of gains related to forward contracts were included in prepaid expenses and other current assets and were subsequently received in January 2010. Monthly forward contracts with a notional amount of $18.5 million, entered into in December 2010 for January 2011, will be settled in January 2011.
The weighted average notional amount of derivative contracts outstanding during the year ended December 31, 2010 was approximately $6.2 million.
Translation of Foreign Currencies
Certain of our international subsidiaries operate primarily using local functional currencies. Foreign currency denominated assets and liabilities are translated into U.S. dollars at exchange rates in effect at the balance sheet date, and income and expense accounts and cash flow items are translated at average monthly exchange rates during the respective periods. Net exchange gains or losses resulting from the translation of foreign financial statements and the effect of exchange rates on intercompany transactions of a long-term investment nature are recorded as a separate component of equity in accumulated other comprehensive income. Any foreign currency gains or losses related to transactions are included in operating results.
Environmental Compliance and Remediation
Environmental compliance costs include ongoing maintenance, monitoring and similar costs. Such costs are expensed as incurred. Environmental remediation costs are accrued when environmental assessments and/or remedial efforts are probable and the cost can be reasonably estimated.
F-15
Veeco Instruments Inc. and Subsidiaries
Notes to Consolidated Financial Statements (Continued)
December 31, 2010
Accumulated Other Comprehensive Income
Our accumulated other comprehensive income of $5.8 million and $7.1 million at December 31, 2010 and 2009, respectively, consists primarily of foreign currency translation adjustments.
Research and Development Costs
Research and development costs are charged to expense as incurred and include expenses for the development of new technology and the transition of technology into new products or services.
Warranty Costs
We estimate the costs that may be incurred under the warranty we provide for our products and record a liability in the amount of such costs at the time the related revenue is recognized. Estimated warranty costs are determined by analyzing specific product and historical configuration statistics and regional warranty support costs. Our warranty obligation is affected by product failure rates, material usage, and labor costs incurred in correcting product failures during the warranty period. Unforeseen component failures or exceptional component performance can also result in changes to warranty costs. If actual warranty costs differ substantially from our estimates, revisions to the estimated warranty liability would be required.
Income Taxes
As part of the process of preparing our Consolidated Financial Statements, we are required to estimate our income taxes in each of the jurisdictions in which we operate. This process involves estimating the actual current tax expense, together with assessing temporary differences resulting from differing treatment of items for tax and accounting purposes. These differences result in deferred tax assets and liabilities, which are included within our Consolidated Balance Sheets. The carrying value of our deferred tax assets is adjusted by a partial valuation allowance to recognize the extent to which the future tax benefits will be recognized on a more likely than not basis. Our net deferred tax assets consist primarily of net operating loss and tax credit carry forwards, and timing differences between the book and tax treatment of inventory, acquired intangible assets and other asset valuations. Realization of these net deferred tax assets is dependent upon our ability to generate future taxable income.
We record valuation allowances in order to reduce our deferred tax assets to the amount expected to be realized. In assessing the adequacy of recorded valuation allowances, we consider a variety of factors, including the scheduled reversal of deferred tax liabilities, future taxable income, and prudent and feasible tax planning strategies. Under the relevant accounting guidance, factors such as current and previous operating losses are given significantly greater weight than the outlook for future profitability in determining the deferred tax asset carrying value.
Relevant accounting guidance addresses the determination of how tax benefits claimed or expected to be claimed on a tax return should be recorded in the financial statements. Under such guidance, we must recognize the tax benefit from an uncertain tax position only if it is more likely than not that the tax position will be sustained on examination by the taxing authorities, based on the technical merits of the position. The tax benefits recognized in the financial statements from such uncertain tax positions are measured based on the largest benefit that has a greater than fifty percent likelihood of being realized upon ultimate resolution.
F-16
Veeco Instruments Inc. and Subsidiaries
Notes to Consolidated Financial Statements (Continued)
December 31, 2010
Advertising Expense
The cost of advertising is expensed as of the first showing of each advertisement. We incurred $1.5 million, $0.7 million and $1.3 million in advertising expenses during 2010, 2009 and 2008, respectively.
Shipping and Handling Costs
Shipping and handling costs are costs that are incurred to move, package and prepare our products for shipment and then to move the products to the customer's designated location. These costs are generally comprised of payments to third-party shippers. Shipping and handling costs are included in cost of sales in our Consolidated Statements of Operations.
Equity-Based Compensation
Equity-based compensation cost is measured at the grant date, based on the fair value of the award and is recognized as expense over the employee requisite service period. In order to determine the fair value of stock options on the date of grant, we apply the Black-Scholes option-pricing model. Inherent in the model are assumptions related to risk-free interest rate, dividend yield, expected stock-price volatility and expected option term.
The risk-free rate assumed in valuing the options is based on the U.S. Treasury yield curve in effect at the time of grant for the expected term of the option. The dividend yield assumption is based on our historical and future expectation of dividend payouts. While the risk-free interest rate and dividend yield are less subjective assumptions, typically based on factual data derived from public sources, the expected stock-price volatility and expected option term assumptions require a level of judgment which make them critical accounting estimates.
We use an expected stock-price volatility assumption that is a combination of both historical volatility, calculated based on the daily closing prices of our common stock over a period equal to the expected term of the option and implied volatility, utilizing market data of actively traded options on our common stock, which are obtained from public data sources. We believe that the historical volatility of the price of our common stock over the expected term of the option is a strong indicator of the expected future volatility and that implied volatility takes into consideration market expectations of how future volatility will differ from historical volatility. Accordingly, we believe a combination of both historical and implied volatility provides the best estimate of the future volatility of the market price of our common stock.
The expected option term, representing the period of time that options granted are expected to be outstanding, is estimated using a lattice-based model incorporating historical post vest exercise and employee termination behavior.
We estimate forfeitures using historical experience, which is adjusted over the requisite service period based on the extent to which actual forfeitures differ, or are expected to differ, from such estimates. Because of the significant amount of judgment used in these calculations, it is reasonably likely that circumstances may cause the estimate to change.
With regard to the expected option term assumption, we consider the exercise behavior of past grants and model the pattern of aggregate exercises.
F-17
Veeco Instruments Inc. and Subsidiaries
Notes to Consolidated Financial Statements (Continued)
December 31, 2010
Recent Accounting Pronouncements
Business Combinations: In December 2010, the FASB issued amended guidance related to Business Combinations. The amendments affect any public entity that enters into business combinations that are material on an individual or aggregate basis. The amendments specify that if a public entity presents comparative financial statements, the entity should disclose revenue and earnings of the combined entity as though the business combination(s) that occurred during the current year had occurred as of the beginning of the comparable prior annual reporting period only. The amendments also expand the supplemental pro forma disclosures to include a description of the nature and amount of material, nonrecurring pro forma adjustments directly attributable to the business combination included in the reported pro forma revenue and earnings. The amendments are effective prospectively for business combinations for which the acquisition date is on or after the beginning of the first annual reporting period beginning on or after December 15, 2010. Early adoption is permitted. The Company will assess the impact of these amendments on its consolidated financial statements if and when an acquisition occurs.
Intangibles—Goodwill and Other: In December 2010, the FASB issued amended guidance related to Intangibles—Goodwill and Other. The amendments modify Step 1 of the goodwill impairment test for reporting units with zero or negative carrying amounts. For those reporting units, an entity is required to perform Step 2 of the goodwill impairment test if it is more likely than not that a goodwill impairment exists. In determining whether it is more likely than not that a goodwill impairment exists, an entity should consider whether there are any adverse qualitative factors indicating that an impairment may exist. The qualitative factors are consistent with the existing guidance and examples, which require that goodwill of a reporting unit be tested for impairment between annual tests if an event occurs or circumstances change that would more likely than not reduce the fair value of a reporting unit below its carrying amount. For public entities, the amendments are effective for fiscal years, and interim periods within those years, beginning after December 15, 2010. Early adoption is not permitted. The Company does not believe that this guidance will have a material impact on its consolidated financial statements.
Subsequent Events: The FASB has issued amended guidance for subsequent events. The amendment removes the requirement for an SEC filer to disclose a date through which subsequent events have been evaluated in both issued and revised financial statements. Revised financial statements include financial statements revised as a result of either correction of an error or retrospective application of U.S. GAAP. The FASB also clarified that if the financial statements have been revised, then an entity that is not an SEC filer should disclose both the date that the financial statements were issued or available to be issued and the date the revised financial statements were issued or available to be issued. The FASB believes these amendments remove potential conflicts with the SEC's literature. All of the amendments were effective upon issuance (February 24, 2010). The adoption of this guidance did not have a material impact on the Company's consolidated financial statements.
Fair Value Measurements: In January 2010, the FASB issued amended guidance for Fair Value Measurements and Disclosures. This update requires some new disclosures and clarifies existing disclosure requirements about fair value measurement. The FASB's objective is to improve these disclosures and, thus, increase the transparency in financial reporting. Specifically, this update requires that a reporting entity disclose separately the amounts of significant transfers in and out of Level 1 and Level 2 fair value measurements and describe the reasons for the transfers; and in the reconciliation for fair value measurements using significant unobservable inputs, a reporting entity should present
F-18
Veeco Instruments Inc. and Subsidiaries
Notes to Consolidated Financial Statements (Continued)
December 31, 2010
separately information about purchases, sales, issuances, and settlements. In addition, this update clarifies the requirements of existing disclosures. For purposes of reporting fair value measurement for each class of assets and liabilities, a reporting entity needs to use judgment in determining the appropriate classes of assets and liabilities; and a reporting entity should provide disclosures about the valuation techniques and inputs used to measure fair value for both recurring and nonrecurring fair value measurements. This update was adopted on January 1, 2010, except for the disclosures about purchases, sales, issuances, and settlements in the roll forward of activity in Level 3 fair value measurements. The adoption of this guidance did not have a material impact on the Company's consolidated financial statements. Those disclosures are effective for fiscal years beginning after December 15, 2010, and for interim periods within those fiscal years. Early application is permitted. The Company does not believe that this guidance will have a material impact on its consolidated financial statements.
Revenue Recognition: In October 2009, the FASB issued amended guidance related to multiple-element arrangements which requires an entity to allocate arrangement consideration at the inception of an arrangement to all of its deliverables based on their relative selling prices. This update eliminates the use of the residual method of allocation and requires the relative-selling-price method in all circumstances. All entities must adopt the guidance no later than the beginning of their first fiscal year beginning on or after June 15, 2010. Entities may elect to adopt the guidance through either prospective application for revenue arrangements entered into or materially modified, after the effective date or through retrospective application to all revenue arrangements for all periods presented. The Company does not believe that this guidance will have a material impact on its consolidated financial statements.
In October 2009, the FASB issued amended guidance that is expected to significantly affect how entities account for revenue arrangements that contain both hardware and software elements. As a result, many tangible products that rely on software will be accounted for under the revised multiple-element arrangements revenue recognition guidance, rather than the software revenue recognition guidance. The revised guidance must be adopted by all entities no later than fiscal years beginning on or after June 15, 2010. An entity must select the same transition method and same period for the adoption of both this guidance and the revisions to the multiple-element arrangements guidance noted above. The Company does not believe that this guidance will have a material impact on its consolidated financial statements.
F-19
Veeco Instruments Inc. and Subsidiaries
Notes to Consolidated Financial Statements (Continued)
December 31, 2010
2. Income (Loss) Per Common Share Attributable to Veeco
The following table sets forth basic and diluted net income (loss) per common share and the weighted average shares outstanding and diluted weighted average shares outstanding (in thousands, except per share data):
| |
Year ended December 31, | |||||||||
|---|---|---|---|---|---|---|---|---|---|---|
| |
2010 | 2009 | 2008 | |||||||
Net income (loss) |
$ | 361,760 | $ | (15,632 | ) | $ | (75,421 | ) | ||
Net loss attributable to noncontrolling interest |
— | (65 | ) | (230 | ) | |||||
Net income (loss) attributable to Veeco |
$ | 361,760 | $ | (15,567 | ) | $ | (75,191 | ) | ||
Income (loss) per common share attributable to Veeco: |
||||||||||
Basic |
$ | 9.16 | $ | (0.48 | ) | $ | (2.40 | ) | ||
Diluted |
$ | 8.51 | $ | (0.48 | ) | $ | (2.40 | ) | ||
Basic weighted average shares outstanding |
39,499 | 32,628 | 31,347 | |||||||
Dilutive effect of stock options, restricted stock awards and units and convertible debt |
3,015 | — | — | |||||||
Diluted weighted average shares outstanding |
42,514 | 32,628 | 31,347 | |||||||
Basic income (loss) per common share is computed using the weighted average number of common shares outstanding during the period. Diluted income (loss) per common share is computed using the weighted average number of common shares and common equivalent shares outstanding during the period. The effect of approximately 761,000 and 170,000 common equivalent shares for the years ended December 31, 2009 and 2008, respectively, were excluded from the diluted weighted average shares outstanding due to the net losses sustained for these periods. No shares were excluded from the computation of diluted weighted average shares outstanding for the year ended December 31, 2010.
At January 1, 2008 we had unsecured convertible subordinated notes of $25.2 million having a conversion price of $38.51 per share (the "Old Notes") which was due and subsequently paid in December 2008. For the year ended December 31, 2008, the assumed conversion of the Old Notes was 0.5 million common equivalent shares. Due to the net loss reported for the period, the convertible shares are anti-dilutive and, therefore, are not included in the diluted weighted average shares outstanding for the year ended December 31, 2008.
At January 1, 2008 we had new unsecured convertible subordinated notes of $117.8 million having a conversion price of $27.23 per share (the "New Notes") of which $12.2 million was repurchased in the fourth quarter of 2008. The New Notes meet the criteria for determining the effect of the assumed conversion using the treasury stock method of accounting, as long as we have the ability and the intent to settle the principal amount of the New Notes in cash. Under the terms of the New Notes, we may pay the principal amount of converted New Notes in cash or in shares of common stock. We have indicated that we intend to pay such amounts in cash. Using the treasury stock method, the impact of the assumed conversion of the New Notes had a dilutive affect of 1.2 million shares for the year ended December 31, 2010 and was anti-dilutive for the years ended December 31, 2009 and 2008, as the
F-20
Veeco Instruments Inc. and Subsidiaries
Notes to Consolidated Financial Statements (Continued)
December 31, 2010
average stock price was below the conversion price of $27.23 for the period. The effect of the assumed converted shares is dependent on the stock price at the time of the conversion. The maximum number of shares that can be issued upon conversion of the New Notes were 5.4 million common equivalent shares for the years ended December 31, 2010, 2009 and 2008 (see Note 7).
3. Discontinued Operations
On August 15, 2010, we signed a definitive agreement to sell our Metrology business to Bruker Corporation ("Bruker") comprising our entire Metrology reporting segment for $229.4 million. Accordingly, Metrology's operating results are accounted for as discontinued operations in determining the consolidated results of operations and the related assets and liabilities are classified as held for sale on our Consolidated Balance Sheet for all periods presented. The sales transaction closed on October 7, 2010, except for assets located in China due to local restrictions. Total proceeds, which included a working capital adjustment of $1 million, totaled $230.4 million of which $7.2 million relates to the assets in China. As part of our agreement with Bruker, $22.9 million of proceeds is held in escrow and is restricted from use for one year from the closing date of the transaction to secure certain specified losses arising out of breaches of representations, warranties and covenants we made in the stock purchase agreement and related documents. As part of the sale we incurred transaction costs, which consisted of investment bank fees and legal fees, totaling $5.2 million. The Company recognized a pre-tax gain on disposal of $156.3 million and a pre-tax deferred gain of $5.4 million related to the assets in China.
The following is a summary of the net assets sold as of the closing date on October 7, 2010 (in thousands):
| |
October 7, 2010 | |||
|---|---|---|---|---|
Assets |
||||
Accounts receivable, net |
$ | 21,866 | ||
Inventories |
26,431 | |||
Property, plant and equipment at cost, net |
13,408 | |||
Goodwill |
7,419 | |||
Other assets |
5,485 | |||
Assets of discontinued segment held for sale |
$ | 74,609 | ||
Liabilities |
||||
Accounts payable |
$ | 7,616 | ||
Accrued expenses and other current liabilities |
5,284 | |||
Liabilities of discontinued segment held for sale |
$ | 12,900 | ||
F-21
Veeco Instruments Inc. and Subsidiaries
Notes to Consolidated Financial Statements (Continued)
December 31, 2010
Summary information related to discontinued operations is as follows (in thousands):
| |
Year ended December 31, | |||||||||
|---|---|---|---|---|---|---|---|---|---|---|
| |
2010 | 2009 | 2008 | |||||||
Net sales |
$ | 92,011 | $ | 97,737 | $ | 127,874 | ||||
Cost of sales |
47,822 | 57,410 | 74,551 | |||||||
Gross profit |
44,189 | 40,327 | 53,323 | |||||||
Total operating expenses |
45,024 | 43,030 | 77,741 | |||||||
Operating loss |
$ | (835 | ) | $ | (2,703 | ) | $ | (24,418 | ) | |
Net income (loss) from discontinued operations, net of tax |
$ | 101,229 | $ | (1,403 | ) | $ | 24,588 | |||
| |
December 31, | |
||||||||
|---|---|---|---|---|---|---|---|---|---|---|
| |
2010 | 2009 | |
|||||||
Assets |
||||||||||
Cash |
$ | — | $ | 89 | ||||||
Accounts receivable, net |
— | 16,812 | ||||||||
Inventories |
— | 21,757 | ||||||||
Property, plant and equipment at cost, net |
— | 14,682 | ||||||||
Goodwill |
— | 7,419 | ||||||||
Other assets |
— | 9,327 | ||||||||
Assets of discontinued segment held for sale |
$ | — | $ | 70,086 | ||||||
Liabilities |
||||||||||
Accounts payable |
$ | — | $ | 4,202 | ||||||
Accrued expenses and other current liabilities |
5,359 | 6,622 | ||||||||
Liabilities of discontinued segment held for sale |
$ | 5,359 | $ | 10,824 | ||||||
4. Fair Value Measurements
We have categorized our assets and liabilities recorded at fair value based upon the fair value hierarchy. The levels of fair value hierarchy are as follows:
- •
- Level 1 inputs utilize quoted prices (unadjusted) in active markets for identical assets or liabilities that we
have the ability to access.
- •
- Level 2 inputs utilize other-than-quoted prices that are observable, either directly or
indirectly. Level 2 inputs include quoted prices for similar assets and liabilities in active markets, and inputs such as interest rates and yield curves that are observable at commonly quoted
intervals.
- •
- Level 3 inputs are unobservable and are typically based on our own assumptions, including situations where there is little, if any, market activity.
In certain cases, the inputs used to measure fair value may fall into different levels of the fair value hierarchy. In such cases, we categorize such assets or liabilities based on the lowest level input that is significant to the fair value measurement in its entirety. Our assessment of the significance of a
F-22
Veeco Instruments Inc. and Subsidiaries
Notes to Consolidated Financial Statements (Continued)
December 31, 2010
particular input to the fair value measurement in its entirety requires judgment and considers factors specific to the asset.
Both observable and unobservable inputs may be used to determine the fair value of positions that are classified within the Level 3 category. As a result, the unrealized gains and losses for assets within the Level 3 category presented below may include changes in fair value that were attributable to both observable (e.g., changes in market interest rates) and unobservable (e.g., changes in historical company data) inputs.
The major categories of assets and liabilities measured on a recurring basis, at fair value, as of December 31, 2010 and 2009 are as follows (in millions):
| |
December 31, 2010 | |||||||||||||
|---|---|---|---|---|---|---|---|---|---|---|---|---|---|---|
| |
Level 1 | Level 2 | Level 3 | Total | ||||||||||
Treasury bills |
$ | 136.2 | $ | 79.5 | $ | — | $ | 215.7 | ||||||
FDIC insured corporate bonds |
129.4 | — | — | 129.4 | ||||||||||
Commercial paper |
128.6 | 62.8 | — | 191.4 | ||||||||||
Money market instruments |
— | 0.6 | — | 0.6 | ||||||||||
Derivative instrument |
— | 0.3 | — | 0.3 | ||||||||||
Total |
$ | 394.2 | $ | 143.2 | $ | — | $ | 537.4 | ||||||
| |
December 31, 2009 | |||||||||||||
|---|---|---|---|---|---|---|---|---|---|---|---|---|---|---|
| |
Level 1 | Level 2 | Level 3 | Total | ||||||||||
CDAR's |
$ | — | $ | 180.0 | $ | — | $ | 180.0 | ||||||
Derivative instrument |
— | 0.2 | — | 0.2 | ||||||||||
Total |
$ | — | $ | 180.2 | $ | — | $ | 180.2 | ||||||
CDARS, commercial paper and treasury bills that are classified as cash equivalents are carried at cost, which approximates market value. Accordingly, no gains or losses (realized/unrealized) have been incurred for cash equivalents. All investments classified as available-for-sale contain quoted prices in active markets.
Derivative instruments include foreign currency forward contracts to hedge certain foreign currency transactions. Derivative instruments are valued using standard calculations/models that are primarily based on observable inputs, including foreign currency exchange rates, volatilities and interest rates.
The major categories of assets and liabilities measured on a nonrecurring basis, at fair value, as of December 31, 2010 and 2009 are as follows (in millions):
| |
December 31, 2010 | |||||||||||||
|---|---|---|---|---|---|---|---|---|---|---|---|---|---|---|
| |
Level 1 | Level 2 | Level 3 | Total | ||||||||||
Property, plant and equipment, net |
$ | — | $ | — | $ | 42.3 | $ | 42.3 | ||||||
Goodwill |
— | — | 52.0 | 52.0 | ||||||||||
Intangible assets, net |
— | — | 16.9 | 16.9 | ||||||||||
Restructuring liability |
— | — | (1.0 | ) | (1.0 | ) | ||||||||
Total |
$ | — | $ | — | $ | 110.2 | $ | 110.2 | ||||||
F-23
Veeco Instruments Inc. and Subsidiaries
Notes to Consolidated Financial Statements (Continued)
December 31, 2010
| |
December 31, 2009 | |||||||||||||
|---|---|---|---|---|---|---|---|---|---|---|---|---|---|---|
| |
Level 1 | Level 2 | Level 3 | Total | ||||||||||
Property, plant and equipment, net |
$ | — | $ | — | $ | 44.7 | $ | 44.7 | ||||||
Goodwill |
— | — | 52.0 | 52.0 | ||||||||||
Intangible assets, net |
— | — | 21.8 | 21.8 | ||||||||||
Asset retirement obligation |
— | — | (0.2 | ) | (0.2 | ) | ||||||||
Restructuring liability |
— | — | (2.4 | ) | (2.4 | ) | ||||||||
Total |
$ | — | $ | — | $ | 115.9 | $ | 115.9 | ||||||
5. Business Combinations
Mill Lane Engineering Co., Inc.
On May 22, 2008, we acquired Mill Lane Engineering Co., Inc. ("Mill Lane"), a privately held manufacturer of web coating systems for flexible solar panels, for a purchase price of $11.0 million, net of cash acquired, plus potential future earn-out payments of up to $19.0 million (representing additional purchase price) contingent upon the future achievement of certain operating performance criteria. Fees related to the acquisition were $0.7 million. Mill Lane is based in Lowell, Massachusetts and at the time of acquisition had approximately 20 employees. The financial results of Mill Lane are included in our LED & Solar segment (see Note 11) as of the acquisition date. We have determined that this acquisition does not constitute a material business combination and therefore are not including pro forma financial statements in this report.
As of December 31, 2008, we had accrued $9.6 million for our earn-out obligation due to the former owners of Mill Lane resulting from the achievement of certain operating performance criteria earned through the end of the fourth quarter of 2008. Payment of this earn-out obligation was made in the first quarter of 2009. As of December 31, 2010, no earn-out obligations remain under this purchase arrangement.
6. Balance Sheet Information
Short-term Investments
Available-for-sale securities consist of the following (in thousands):
| |
December 31, 2010 | |||||||||||||
|---|---|---|---|---|---|---|---|---|---|---|---|---|---|---|
| |
Amortized Cost |
Gains in Accumulated Other Comprehensive Income |
Losses in Accumulated Other Comprehensive Income |
Estimated Fair Value |
||||||||||
Commercial paper |
$ | 128,527 | $ | 61 | $ | — | $ | 128,588 | ||||||
FDIC insured corporate bonds |
129,353 | 24 | — | 129,377 | ||||||||||
Treasury bills |
136,203 | 12 | — | 136,215 | ||||||||||
Total available-for-sale securities |
$ | 394,083 | $ | 97 | $ | — | $ | 394,180 | ||||||
During the year ended December 31, 2010, available-for-sale securities were sold for total proceeds of $246.6 million. The gross realized gains on these sales were minimal for the year ended December 31, 2010. For purpose of determining gross realized gains, the cost of securities sold is based on specific identification. The net unrealized holding gain on available-for-sale securities amounted to
F-24
Veeco Instruments Inc. and Subsidiaries
Notes to Consolidated Financial Statements (Continued)
December 31, 2010
$0.1 million for the year ended December 31, 2010, and has been included in accumulated other comprehensive income.
Contractual maturities of available-for-sale debt securities at December 31, 2010, are as follows (in thousands):
| |
Estimated Fair Value |
||||
|---|---|---|---|---|---|
Due in one year or less |
$ | 216,244 | |||
Due in 1-2 years |
177,936 | ||||
Total investments in debt securities |
$ | 394,180 | |||
Actual maturities may differ from contractual maturities because some borrowers have the right to call or prepay obligations with or without call or prepayment penalties.
Restricted Cash
As of December 31, 2010, restricted cash consists of $22.9 million that relates to the proceeds received from the sale of our Metrology segment. This cash is held in escrow and is restricted from use for one year from the closing date of the transaction (see Note 3). Additionally, restricted cash also consists of $53.2 million which serves as collateral for bank guarantees that provide financial assurance that the Company will fulfill certain customer obligations. This cash is held in custody by the issuing bank, and is restricted as to withdrawal or use while the related bank guarantees are outstanding.
Inventories
| |
December 31, | |
|||||||
|---|---|---|---|---|---|---|---|---|---|
| |
2010 | 2009 | |
||||||
Raw materials |
$ | 49,953 | $ | 34,214 | |||||
Work in process |
33,181 | 17,908 | |||||||
Finished goods |
25,353 | 3,685 | |||||||
|
$ | 108,487 | $ | 55,807 | |||||
Property, Plant and Equipment
| |
December 31, | |
|||||||
|---|---|---|---|---|---|---|---|---|---|
| |
Estimated Useful Lives |
||||||||
| |
2010 | 2009 | |||||||
Land |
$ | 7,274 | $ | 7,274 | |||||
Buildings and improvements |
30,731 | 30,707 | 10-40 years | ||||||
Machinery and equipment |
73,173 | 71,358 | 3-10 years | ||||||
Leasehold improvements |
2,276 | 3,548 | 3-7 years | ||||||
Gross property, plant, and equipment at cost |
113,454 | 112,887 | |||||||
Less accumulated depreciation and amortization |
71,134 | 68,180 | |||||||
Net property, plant, and equipment at cost |
$ | 42,320 | $ | 44,707 | |||||
F-25
Veeco Instruments Inc. and Subsidiaries
Notes to Consolidated Financial Statements (Continued)
December 31, 2010
For the years ended December 31, 2010, 2009 and 2008, depreciation expense was $8.0 million, $8.7 million and $8.8 million, respectively.
Goodwill and Indefinite-Lived Intangible Assets
In accordance with the relevant accounting guidance related to goodwill and other intangible assets, we conducted our annual impairment test of goodwill and indefinite-lived intangible assets during the fourth quarters of 2010 and 2009, using October 1st as our measurement date, and utilizing a discounted future cash flow approach as described in Note 1. This was consistent with the approach used in previous years. Based upon the results of such assessments, we determined that no goodwill and indefinite-lived intangible asset impairment existed in any of its reporting units, as of October 1, 2010 and 2009, respectively.
Changes in our goodwill are as follows (in thousands):
| |
Year ended December 31, | ||||||
|---|---|---|---|---|---|---|---|
| |
2010 | 2009 | |||||
Balance as of January 1 |
$ | 52,003 | $ | 51,741 | |||
Acquisition |
— | 262 | |||||
Balance as of December 31 |
$ | 52,003 | $ | 52,003 | |||
As of December 31, 2010 and 2009, we had $2.9 million of indefinite-lived intangible assets consisting of trademarks and tradenames, which are included in the accompanying Consolidated Balance Sheets in the caption intangible assets, net.
Intangible Assets
| |
December 31, 2010 | December 31, 2009 | |||||||||||||||||
|---|---|---|---|---|---|---|---|---|---|---|---|---|---|---|---|---|---|---|---|
| |
Purchased technology |
Other intangible assets |
Total intangible assets |
Purchased technology |
Other intangible assets |
Total intangible assets |
|||||||||||||
Gross intangible assets |
$ | 98,473 | $ | 22,734 | $ | 121,207 | $ | 98,473 | $ | 22,734 | $ | 121,207 | |||||||
Less accumulated amortization |
(86,376 | ) | (17,938 | ) | (104,314 | ) | (83,352 | ) | (16,085 | ) | (99,437 | ) | |||||||
Intangible assets, net |
$ | 12,097 | $ | 4,796 | $ | 16,893 | $ | 15,121 | $ | 6,649 | $ | 21,770 | |||||||
The estimated aggregate amortization expense for intangible assets with definite useful lives for each of the next five fiscal years is as follows (in thousands):
2011 |
$ | 4,054 | ||
2012 |
3,154 | |||
2013 |
1,796 | |||
2014 |
1,433 | |||
2015 |
1,334 |
In accordance with the relevant accounting guidance related to the impairment or disposal of long-lived assets, we performed an analysis as of December 31, 2010 and 2009 of our definite-lived intangible and long-lived assets. No impairment existed in any of our reporting units.
F-26
Veeco Instruments Inc. and Subsidiaries
Notes to Consolidated Financial Statements (Continued)
December 31, 2010
Accrued Expenses
| |
December 31, | ||||||
|---|---|---|---|---|---|---|---|
| |
2010 | 2009 | |||||
Payroll and related benefits |
$ | 27,374 | $ | 20,245 | |||
Sales, use, income and other taxes |
4,914 | 3,287 | |||||
Customer deposits and advanced billings |
129,225 | 59,758 | |||||
Warranty |
9,238 | 6,675 | |||||
Restructuring liability |
714 | 2,451 | |||||
Other |
11,545 | 7,407 | |||||
|
$ | 183,010 | $ | 99,823 | |||
Accrued Warranty
We estimate the costs that may be incurred under the warranty we provide for our products and recognize a liability in the amount of such costs at the time the related revenue is recognized. Factors that affect our warranty liability include product failure rates, material usage and labor costs incurred in correcting product failures during the warranty period. Changes in our warranty liability during the year are as follows:
| |
Year ended December 31, | ||||||
|---|---|---|---|---|---|---|---|
| |
2010 | 2009 | |||||
Balance as of the beginning of year |
$ | 6,675 | $ | 5,533 | |||
Warranties issued during the year |
9,695 | 4,777 | |||||
Settlements made during the year |
(7,132 | ) | (3,635 | ) | |||
Balance as of the end of year |
$ | 9,238 | $ | 6,675 | |||
F-27
Veeco Instruments Inc. and Subsidiaries
Notes to Consolidated Financial Statements (Continued)
December 31, 2010
7. Debt
Long-term Debt
Long-term debt is summarized as follows (in thousands):
| |
December 31, | ||||||
|---|---|---|---|---|---|---|---|
| |
2010 | 2009 | |||||
Convertible subordinated debt |
$ | 101,138 | $ | 98,081 | |||
Mortgage notes payable |
2,883 | 3,095 | |||||
|
104,021 | 101,176 | |||||
Less current portion |
101,367 | 212 | |||||
|
$ | 2,654 | $ | 100,964 | |||
Convertible Subordinated Debt
At January 1, 2008 we had new unsecured convertible subordinated notes of $117.8 million having a conversion price of $27.23 per share (the "Notes") of which $12.2 million was repurchased in the fourth quarter of 2008. The Notes meet the criteria for determining the effect of the assumed conversion using the treasury stock method of accounting, as long as we have the ability and the intent to settle the principal amount of the Notes in cash. Under the terms of the Notes, we may pay the principal amount of converted Notes in cash or in shares of common stock. We have indicated that we intend to pay such amounts in cash. Using the treasury stock method, the impact of the assumed conversion of the Notes had a dilutive affect of 1.2 million shares for the year ended December 31, 2010 and was anti-dilutive for the years ended December 31, 2009 and 2008, as the average stock price was below the conversion price of $27.23 for the period. The effect of the assumed converted shares is dependent on the stock price at the time of the conversion. The maximum number of shares that can be issued upon conversion of the Notes were 5.4 million common equivalent shares for the years ended December 31, 2010, 2009 and 2008.
The Notes are initially convertible into 36.7277 shares of common stock per $1,000 principal amount of Notes (equivalent to a conversion price of $27.23 per share or a premium of 38% over the closing market price for our common stock on April 16, 2007). On or after April 20, 2011, we may redeem the Notes, in whole or in part, for cash at 100% of the principal amount of the notes to be redeemed plus accrued and unpaid interest to, but not including, the redemption date. Holders may convert the Notes at any time during the period beginning on January 15, 2012 through the close of business on the second day prior to April 15, 2012 and earlier upon the occurrence of certain events including our common stock trading at prices equal to or above 130% of the conversion price for at least 20 trading days during the final 30 trading days of the immediately preceding fiscal quarter. At the end of the fourth quarter of 2010, our common stock was trading at prices equal to or above 130% of the conversion price for the specified period and, as a result, the Notes are convertible during the first quarter of 2011. If the Notes are converted, we have the ability and intent to pay the principal balance of notes tendered for conversion in cash. We will re-perform this test each quarter up to and including the fourth quarter of 2011. Accordingly, the balance of the convertible notes at December 31, 2010 has been classified as current in our Consolidated Balance Sheet. On February 14, 2011, at the option of the holder, $7.5 million of notes were tendered for conversion at a price of $45.95 per share
F-28
Veeco Instruments Inc. and Subsidiaries
Notes to Consolidated Financial Statements (Continued)
December 31, 2010
in a net share settlement. As a result, we paid the principal amount of $7.5 million in cash and issued 111,318 shares of our common stock. Accordingly, in the first quarter of 2011 we will take a charge for the related unamortized debt discount totaling $0.3 million. We pay interest on these notes on April 15 and October 15 of each year. The Notes are unsecured and are effectively subordinated to all of our senior and secured indebtedness and to all indebtedness and other liabilities of our subsidiaries.
During the fourth quarter of 2008, we repurchased $12.2 million aggregate of the Notes for $7.2 million in cash, of which $7.1 million related to principal and $0.1 million related to accrued interest, reducing the amount outstanding from $117.8 million to $105.6 million. A gross gain of approximately $5.1 million was recorded on these repurchases offset by the write-off of approximately $0.1 million of unamortized deferred financing costs associated with the Notes, for a net gain of approximately $5.0 million. Such net gain was reduced to $3.8 million upon the application of accounting guidance (see below), which required that the gain be calculated based on the fair value of the portion repurchased as of the repurchase date. The fair value approximated the carrying value net of the unamortized discount on the portion repurchased. The difference of approximately $1.2 million between the fair value and the amount paid was recorded as a reduction in the gain originally reported, which increased the accumulated deficit as of December 31, 2008 by that amount.
As of January 1, 2009, we implemented accounting guidance related to our convertible debt and have applied it retrospectively to all periods presented, as required. This guidance requires issuers of convertible debt that can be settled in cash to separately account for (i.e., bifurcate) a portion of the debt associated with the conversion feature and reclassify this portion to equity. The liability portion, which represents the fair value of the debt without the conversion feature, is accreted to its face value over the life of the debt using the effective interest method by amortizing the discount between the face amount and the fair value. The amortization is recorded as interest expense. The notes are subject to such accounting guidance since they may be settled in cash upon conversion. Thus, as a result of the adoption of this accounting guidance, we reclassified approximately $16.3 million from long-term debt to additional paid-in capital effective as of the date of issuance of the Notes. This reclassification created a $16.3 million discount on the debt that will be amortized over the remaining life of the Notes, which will be through April 15, 2012. The reclassification generated a $6.7 million deferred tax liability, which we offset with a corresponding decrease of the valuation allowance by the same amount. Prior periods are presented as if the new guidance was in effect as of the date of issuance. Thus, we have presented all financial data for prior periods in this report as if we had reclassified the $16.3 million and began amortizing the resultant debt discount in April 2007. The retrospective application of the new guidance described above to the results for the year ended December 31, 2008 increased the net loss attributable to Veeco from ($71.1) million to ($75.2) million and increased the loss per share attributable to Veeco from ($2.27) to ($2.40).
The total effect on equity as of the date of adoption on January 1, 2009 was a net increase of $10.3 million, comprised of an increase in additional paid-in capital of $16.3 million and an increase in the accumulated deficit of $6.0 million. The $6.0 million is comprised of $2.9 million and $1.9 million in amortization of the debt discount for 2008 and 2007, respectively, as well as the $1.2 million reduction in the gain that was recorded on the November 2008 repurchases.
For the years ended December 31, 2010, 2009 and 2008, we recorded approximately $3.1 million, $2.8 million and $2.9 million, respectively, additional interest expense in each period resulting from the amortization of the debt discount. This additional interest expense did not require the use of cash.
F-29
Veeco Instruments Inc. and Subsidiaries
Notes to Consolidated Financial Statements (Continued)
December 31, 2010
The components of interest expense recorded on the Notes for the years ended December 31, 2010, 2009 and 2008 were as follows (in thousands):
| |
Year ended December 31, | |||||||||
|---|---|---|---|---|---|---|---|---|---|---|
| |
2010 | 2009 | 2008 | |||||||
Contractual interest |
$ | 4,355 | $ | 4,356 | $ | 4,801 | ||||
Amortization of the discount on the Notes |
3,057 | 2,846 | 2,917 | |||||||
Total interest expense on the Notes |
$ | 7,412 | $ | 7,202 | $ | 7,718 | ||||
Effective interest rate |
7.0 | % | 6.8 | % | 6.7 | % | ||||
The carrying amounts of the liability and equity components of the Notes as of December 31, 2010 and 2009 were as follows (in thousands):
| |
Year ended December 31, | ||||||
|---|---|---|---|---|---|---|---|
| |
2010 | 2009 | |||||
Carrying amount of the equity component |
$ | 16,318 | $ | 16,318 | |||
Principal balance of the liability component |
$ | 105,574 | $ | 105,574 | |||
Less: unamortized discount |
4,436 | 7,493 | |||||
Net carrying value of the liability component |
$ | 101,138 | $ | 98,081 | |||
At December 31, 2010 and 2009, $105.6 million of the Notes were outstanding with fair values of approximately $164.1 million and $144.6 million, respectively.
Mortgage Notes Payable
Long-term debt as of December 31, 2010, also includes a mortgage note payable, which is secured by certain land and buildings with carrying amounts aggregating approximately $5.1 million and $5.2 million as of December 31, 2010 and December 31, 2009, respectively. The mortgage note payable ($2.9 million as of December 31, 2010 and $3.1 million as of December 31, 2009) bears interest at an annual rate of 7.91%, with the final payment due on January 1, 2020. The fair market value of this note as of December 31, 2010 and 2009 was approximately $3.1 million and $3.3 million, respectively.
F-30
Veeco Instruments Inc. and Subsidiaries
Notes to Consolidated Financial Statements (Continued)
December 31, 2010
Maturity of Long-term Debt
Long-term debt matures as follows (in thousands):
2011 |
$ | 105,803 | ||
2012 |
248 | |||
2013 |
268 | |||
2014 |
290 | |||
2015 |
314 | |||
Thereafter |
1,534 | |||
|
108,457 | |||
Less current portion |
105,803 | * | ||
|
$ | 2,654 | ||
- *
- Difference of $4,436 from $101,367 in the Consolidated Balance Sheet is due to the unamortized debt discount.
8. Equity Compensation Plans and Equity
Stock Option and Restricted Stock Plans
We have several stock option and restricted stock plans. On April 1, 2010, the Board of Directors of the Company, and on May 14, 2010, our shareholders, approved the 2010 Stock Incentive Plan (the "2010 Plan"). The 2010 Plan replaced the 2000 Stock Incentive Plan, as amended (the "2000 Plan"), as the Company's active stock plan. The Company's employees, directors and consultants are eligible to receive awards under the 2010 Plan. The 2010 Plan permits the granting of a variety of awards, including both non-qualified and incentive stock options, share appreciation rights, restricted shares, restricted share units and dividend equivalent rights. The Company is authorized to issue up to 3,500,000 shares under the 2010 Plan. Option awards are generally granted with an exercise price equal to the closing price of the Company's stock on the trading day prior to the date of grant; those option awards generally vest over a 3 year period and have a 7 or 10-year term. Restricted share awards generally vest over 4-5 years. Certain option and share awards provide for accelerated vesting if there is a change in control, as defined in the 2010 Plan. As of December 31, 2010, there are 625,531 options outstanding under this plan.
The 2000 Plan was approved by the Board of Directors and shareholders in May 2000. The 2000 Plan provides for the grant to officers and key employees of stock awards, either in the form of options to purchase shares of our common stock or restricted stock awards. Stock awards granted pursuant to the 2000 Plan expire after seven years and generally vest over a two-year to five-year period following the grant date. In addition, the 2000 Plan provides for automatic annual grants of restricted stock to each member of our Board of Directors who is not an employee. As of December 31, 2010, there are 1,933,623 options outstanding under this plan.
The Veeco Instruments Inc. Amended and Restated 1992 Employees' Stock Option Plan (the "1992 Plan") provided for the grant to officers and key employees of stock options to purchase shares of our common stock. Stock options granted pursuant to the 1992 Plan became exercisable over a three-year period following the grant date and expire after ten years. As of December 31, 2010, there are 1,200 stock options outstanding under this plan.
F-31
Veeco Instruments Inc. and Subsidiaries
Notes to Consolidated Financial Statements (Continued)
December 31, 2010
In addition to the plans described above, we assumed certain stock option plans and agreements relating to the merger in September 2001 with Applied Epi, Inc. ("Applied Epi"). These stock option plans do not have options available for future grants. Options granted under these plans expire after ten years from the date of grant. Options granted under two of these plans vested over three years and options granted under one of these plans vested immediately. As of December 31, 2010, there are 9,272 options outstanding under the various Applied Epi plans.
Equity-Based Compensation, Stock Option and Restricted Stock Activity
Equity-based compensation cost is measured at the grant date, based on the fair value of the award, and is recognized as expense over the employee requisite service period. The following compensation expense was included as part of continuing operations in the Consolidated Statements of Operations for the years ended December 31, 2010, 2009 and 2008 (in thousands):
| |
Year ended December 31, | |||||||||
|---|---|---|---|---|---|---|---|---|---|---|
| |
2010 | 2009 | 2008 | |||||||
Equity-based compensation expense |
$ | 9,648 | $ | 7,547 | $ | 9,668 | ||||
As a result of the sale of our Metrology segment to Bruker, equity-based compensation expense related to Metrology employees has been classified as discontinued operations in determining the consolidated results of operations for the years ended December 31, 2010, 2009 and 2008. For the year ended December 31, 2010, discontinued operations included compensation expense of $7.7 million that related to the acceleration of equity awards from employees that were terminated as a result of the sale of our Metrology segment to Bruker. For the year ended December 31, 2009, total equity-based compensation expense included a charge of $0.7 million for the acceleration of equity awards associated with the retirement of our former CFO. For the year ended December 31, 2008, total equity-based compensation expense included a charge of $3.0 million for the acceleration of equity awards associated with a mutually agreed-upon termination of the employment agreement with our former CEO (who currently remains as Chairman of the Board of Directors) following the successful completion of the CEO transition.
As of December 31, 2010, the total unrecognized compensation cost related to nonvested stock awards and option awards expected to vest is $9.0 million and $14.9 million, respectively, and the related weighted average period over which it is expected that such unrecognized compensation costs will be recognized is approximately 2.6 years and 2.1 years for the nonvested stock awards and for option awards, respectively.
The fair value of each option granted during the years ended December 31, 2010, 2009 and 2008, was estimated on the date of grant using the Black-Scholes option-pricing model with the following assumptions:
| |
Year ended December 31, | |||||
|---|---|---|---|---|---|---|
| |
2010 | 2009 | 2008 | |||
Weighted-average expected stock-price volatility |
62% | 65% | 49% | |||
Weighted-average expected option life |
5 years | 4 years | 3 years | |||
Average risk-free interest rate |
1.92% | 1.79% | 3.14% | |||
Average dividend yield |
0% | 0% | 0% | |||
F-32
Veeco Instruments Inc. and Subsidiaries
Notes to Consolidated Financial Statements (Continued)
December 31, 2010
A summary of our restricted stock awards including restricted stock units as of December 31, 2010, is presented below:
| |
Shares (000's) | Weighted- Average Grant-Date Fair Value |
|||||
|---|---|---|---|---|---|---|---|
Nonvested at December 31, 2009 |
892 | $ | 12.97 | ||||
Granted |
186 | 34.97 | |||||
Vested(1) |
(365 | ) | 12.78 | ||||
Forfeited (including cancelled awards)(2) |
(97 | ) | 17.15 | ||||
Nonvested at December 31, 2010 |
616 | $ | 19.06 | ||||
- (1)
- Includes
the effect of approximately 43,383 shares whose vesting was accelerated as a result of the sale of our Metrology business.
- (2)
- Includes the effect of approximately 73,282 shares forfeited as a result of the sale of our Metrology business.
During the year ended December 31, 2010, we granted 130,665 shares of restricted common stock and 40,200 restricted stock units to key employees, which vest over three or four year periods. Included in this grant were 14,518 shares of restricted common stock granted to the non-employee members of the Board of Directors throughout the year in May, June and December 2010, which vest over the lesser of one year or at the time of the next annual meeting. The vested shares include the impact of 121,230 shares of restricted stock which were cancelled in 2010 due to employees electing to receive fewer shares in lieu of paying withholding taxes. The total grant date fair value of shares that vested during 2010 was $13.6 million.
A summary of our stock option plans as of and for the year ended December 31, 2010, is presented below:
| |
Shares (000s) | Weighted- Average Exercise Price |
Aggregate Intrinsic Value (000s) |
Weighted- Average Remaining Contractual Life (in years) |
|||||||||
|---|---|---|---|---|---|---|---|---|---|---|---|---|---|
Outstanding at December 31, 2009 |
4,506 | $ | 16.35 | ||||||||||
Granted |
721 | 35.19 | |||||||||||
Exercised |
(2,500 | ) | 18.07 | ||||||||||
Forfeited (including cancelled options) |
(158 | ) | 20.47 | ||||||||||
Outstanding at December 31, 2010 |
2,569 | $ | 19.71 | $ | 59,807 | 5.9 | |||||||
Options exercisable at December 31, 2010 |
778 | $ | 16.36 | $ | 20,793 | 3.9 | |||||||
The weighted-average grant date fair value of stock options granted for the years ended December 31, 2010, 2009 and 2008 was $18.41, $5.35, and $5.26, respectively, per option. The total
F-33
Veeco Instruments Inc. and Subsidiaries
Notes to Consolidated Financial Statements (Continued)
December 31, 2010
intrinsic value of stock options exercised during the years ended December 31, 2010, 2009 and 2008 was $53.1 million, $7.3 million and $0.4 million, respectively.
The following table summarizes information about stock options outstanding at December 31, 2010:
| |
Options Outstanding | Options Exercisable | ||||||||||||||
|---|---|---|---|---|---|---|---|---|---|---|---|---|---|---|---|---|
Range of Exercise Prices
|
Number Outstanding at December 31, 2010 (000s) |
Weighted- Average Remaining Contractual Life (in years) |
Weighted- Average Exercise Price |
Number Exercisable at December 31, 2010 (000s) |
Weighted- Average Exercise Price |
|||||||||||
$0.27-8.82 |
491 | 5.4 | $ | 8.79 | 122 | $ | 8.69 | |||||||||
9.69-15.08 |
656 | 5.3 | 12.51 | 173 | 12.72 | |||||||||||
15.29-23.55 |
713 | 3.8 | 18.46 | 457 | 18.83 | |||||||||||
23.81-36.00 |
594 | 9.0 | 33.71 | 18 | 24.97 | |||||||||||
39.85-54.35 |
115 | 9.3 | 42.91 | 8 | 54.35 | |||||||||||
|
2,569 | 5.9 | $ | 19.71 | 778 | $ | 16.36 | |||||||||
Shares Reserved for Future Issuance
As of December 31, 2010, we have reserved the following shares for future issuance related to:
Issuance upon exercise of stock options and grants of restricted stock |
5,280,841 | ||||
Issuance upon conversion of subordinated debt |
5,350,934 | ||||
Total shares reserved |
10,631,775 | ||||
Issuance of Common Stock
On October 28, 2009 the Company entered into an Underwriting Agreement (the "Underwriting Agreement") with Citigroup Global Markets Inc. and J.P. Morgan Securities Inc. (the "Underwriters"), for the sale of 5,000,000 shares of our common stock. In addition, the Underwriters had an option, which they exercised in full, to purchase up to an additional 750,000 shares of our common stock on the same terms for 30 days from the date of the Underwriting Agreement, solely to cover over-allotments. On November 3, 2009, we completed this offering selling 5,750,000 shares for net proceeds totaling $130.1 million, net of transaction costs totaling $0.3 million.
Preferred Stock
Our Board of Directors has authority under our Certificate of Incorporation to issue shares of preferred stock with voting and economic rights to be determined by the Board of Directors.
F-34
Veeco Instruments Inc. and Subsidiaries
Notes to Consolidated Financial Statements (Continued)
December 31, 2010
Treasury Stock
On August 24, 2010, our Board of Directors authorized the repurchase of up to $200 million of our common stock until August 26, 2011. Repurchases are expected to be made from time to time on the open market in accordance with applicable federal securities laws. The timing of repurchases and the exact number of shares of common stock to be purchased will depend upon market conditions, SEC regulations, and other factors. The repurchases will be funded using the Company's available cash balances and cash generated from operations. The program does not obligate the Company to acquire any particular amount of common stock and may be modified or suspended at any time at the Company's discretion. During 2010, we purchased 1,118,600 shares for $38.1 million (including transaction costs) under the program at an average cost of $34.06 per share. This stock repurchase is included as treasury stock in the Consolidated Balance Sheet.
9. Income Taxes
Our income (loss) from continuing operations before income taxes in the accompanying Consolidated Statements of Operations consists of (in thousands):
| |
Year ended December 31, | |||||||||
|---|---|---|---|---|---|---|---|---|---|---|
| |
2010 | 2009 | 2008 | |||||||
Domestic |
$ | 242,305 | $ | (15,789 | ) | $ | (59,777 | ) | ||
Foreign |
28,698 | 4,207 | 10,666 | |||||||
|
$ | 271,003 | $ | (11,582 | ) | $ | (49,111 | ) | ||
Significant components of the provision for income taxes from continuing operations are presented below (in thousands):
| |
Year ended December 31, | |||||||||
|---|---|---|---|---|---|---|---|---|---|---|
| |
2010 | 2009 | 2008 | |||||||
Current: |
||||||||||
Federal |
$ | 34,097 | $ | (344 | ) | $ | (360 | ) | ||
Foreign |
7,720 | 1,879 | 1,019 | |||||||
State and local |
4,720 | 799 | 192 | |||||||
Total current provision for income taxes |
46,537 | 2,334 | 851 | |||||||
Deferred: |
||||||||||
Federal |
(32,033 | ) | 1,015 | 437 | ||||||
Foreign |
239 | (273 | ) | 359 | ||||||
State and local |
(4,271 | ) | (429 | ) | 75 | |||||
Total deferred (benefit) provision for income taxes |
(36,065 | ) | 313 | 871 | ||||||
Total provision for income taxes |
$ | 10,472 | $ | 2,647 | $ | 1,722 | ||||
F-35
Veeco Instruments Inc. and Subsidiaries
Notes to Consolidated Financial Statements (Continued)
December 31, 2010
The following is a reconciliation of the income tax provision (benefit) computed using the Federal statutory rate to our actual income tax provision (in thousands):
| |
Year ended December 31, | |||||||||
|---|---|---|---|---|---|---|---|---|---|---|
| |
2010 | 2009 | 2008 | |||||||
Income tax provision (benefit) at U.S. statutory rates |
$ | 94,851 | $ | (4,053 | ) | $ | (17,189 | ) | ||
State income tax expense (benefit) (net of federal impact) |
5,746 | 188 | (1,135 | ) | ||||||
Goodwill impairment |
— | — | 7,985 | |||||||
Nondeductible expenses |
333 | 145 | 158 | |||||||
Noncontrolling interest |
— | 28 | 495 | |||||||
Equity compensation |
— | 1,678 | 2,519 | |||||||
Domestic production activities deduction |
(5,779 | ) | — | — | ||||||
Nondeductible compensation |
2,840 | 826 | 1,473 | |||||||
Research and development tax credit |
(1,823 | ) | (1,855 | ) | (1,031 | ) | ||||
Net change in valuation allowance |
(83,079 | ) | 5,198 | 10,955 | ||||||
Change in accrual for unrecognized tax benefits |
(1,076 | ) | (4,114 | ) | — | |||||
Foreign tax rate differential |
(5,280 | ) | 5,450 | (1,419 | ) | |||||
Other |
3,739 | (844 | ) | (1,089 | ) | |||||
|
$ | 10,472 | $ | 2,647 | $ | 1,722 | ||||
Deferred income taxes reflect the net tax effects of temporary differences between the carrying amounts of assets and liabilities for financial reporting purposes and the amounts used for income tax purposes.
F-36
Veeco Instruments Inc. and Subsidiaries
Notes to Consolidated Financial Statements (Continued)
December 31, 2010
Significant components of our deferred tax assets and liabilities are as follows (in thousands):
| |
December 31, | |||||||
|---|---|---|---|---|---|---|---|---|
| |
2010 | 2009 | ||||||
Deferred tax assets: |
||||||||
Inventory valuation |
$ | 8,999 | $ | 13,261 | ||||
Domestic net operating loss carry forwards |
1,219 | 39,312 | ||||||
Tax credit carry forwards |
9,961 | 24,216 | ||||||
Foreign net operating loss carry forwards |
147 | 834 | ||||||
Purchased intangible assets |
— | 6,662 | ||||||
Warranty and installation accruals |
2,742 | 2,432 | ||||||
Equity compensation |
3,655 | 4,659 | ||||||
Other accruals |
2,063 | 1,654 | ||||||
Depreciation |
1,325 | 1,815 | ||||||
Other |
1,890 | 3,235 | ||||||
Total deferred tax assets |
32,001 | 98,080 | ||||||
Valuation allowance |
(1,644 | ) | (84,723 | ) | ||||
Net deferred tax assets |
30,357 | 13,357 | ||||||
Deferred tax liabilities: |
||||||||
Purchased intangible assets |
4,854 | 8,439 | ||||||
DISC termination |
— | 201 | ||||||
Convertible debt discount |
1,663 | 3,072 | ||||||
Undistributed earnings |
370 | 3,292 | ||||||
Other |
264 | 287 | ||||||
Total deferred tax liabilities |
7,151 | 15,291 | ||||||
Net deferred taxes |
$ | 23,206 | $ | (1,934 | ) | |||
A provision has not been made at December 31, 2010 for U.S. or additional foreign withholding taxes on approximately $39.0 million of undistributed earnings of our foreign subsidiaries because it is the present intention of management to permanently reinvest the undistributed earnings of our foreign subsidiaries in China, Korea, Japan, Malaysia, Singapore, and Taiwan. As it is our intention to reinvest those earnings permanently, it is not practicable to estimate the amount of tax that might be payable if they were remitted. We have provided deferred income taxes and future withholding taxes on the earnings that we anticipate will be remitted.
We have approximately $9.2 million of foreign tax credit carry forwards which expire at various times between 2016 and 2019.
Based on current operating results, we reversed approximately $83.1 million of the valuation allowance as our net deferred tax assets became realizable on a more-likely-than-not basis. Our remaining valuation allowance of approximately $1.6 million relates primarily to state and local tax attributes for which we could not conclude were realizable on a more-likely-than-not basis.
F-37
Veeco Instruments Inc. and Subsidiaries
Notes to Consolidated Financial Statements (Continued)
December 31, 2010
A reconciliation of the beginning and ending amount of unrecognized tax benefits is as follows (in thousands):
| |
December 31, | ||||||
|---|---|---|---|---|---|---|---|
| |
2010 | 2009 | |||||
Beginning balance as of December 31 |
$ | 1,357 | $ | 694 | |||
Additions for tax positions related to current year |
1,227 | 725 | |||||
Reductions for tax positions relating to current year |
— | — | |||||
Additions for tax positions relating to prior years |
1,736 | — | |||||
Reductions for tax positions relating to prior years |
(478 | ) | (62 | ) | |||
Reductions due to the lapse of the applicable statute of limitations |
(17 | ) | — | ||||
Settlements |
(165 | ) | — | ||||
Ending balance as of December 31 |
$ | 3,660 | $ | 1,357 | |||
Of the amounts reflected in the table above at December 31, 2010, the entire amount if recognized would reduce our effective tax rate. It is our policy to recognize interest and penalties related to income tax matters in income tax expense. The total accrual for interest and penalties related to unrecognized tax benefits was approximately $0.3 million and $0.5 million as of December 31, 2010 and 2009, respectively.
We or one of our subsidiaries file income tax returns in the U.S. federal jurisdiction and various state, local and foreign jurisdictions. All material federal income tax matters have been concluded for years through 2006 subject to subsequent utilization of net operating losses generated in such years. All material state and local income tax matters have been concluded for years through 2006. The majority of our foreign jurisdictions have been reviewed through 2008 with only a few jurisdictions having open tax years between 2005 and 2008. None of our federal tax returns are currently under examination.
10. Commitments and Contingencies and Other Matters
Restructuring and Other Charges
During 2008 and 2009, we continued our multi-quarter plan to improve profitability and reduce and contain spending. We made progress against the initiatives that management set in 2007, continued our restructuring plan and executed activities with a focus on creating a more cost effective organization, with a greater percentage of variable costs. These activities included downsizing and consolidating some locations, reducing our workforce, consultants and discretionary expenses and realigning our sales organization and engineering groups.
In conjunction with these activities, we recognized restructuring (credits) charges of approximately $(0.2) million, $4.8 million and $9.4 million during the years ended December 31, 2010, 2009 and 2008, respectively, and an inventory write-off of $1.5 million, included in cost of sales in the accompanying Consolidated Statement of Operations, related to discontinued data storage products during the year
F-38
Veeco Instruments Inc. and Subsidiaries
Notes to Consolidated Financial Statements (Continued)
December 31, 2010
ended December 31, 2009. Restructuring expense for the years ended December 31, 2010, 2009 and 2008 are as follows (in thousands):
| |
Year ended December 31, | |||||||||
|---|---|---|---|---|---|---|---|---|---|---|
| |
2010 | 2009 | 2008 | |||||||
Personnel severance and related costs |
$ | — | $ | 3,467 | $ | 2,614 | ||||
Lease-related and other (credits) costs |
(179 | ) | 1,370 | 3,873 | ||||||
Modification of stock awards |
— | — | 3,018 | |||||||
|
$ | (179 | ) | $ | 4,837 | $ | 9,505 | |||
Less adjustment of 2007 restructuring liability |
— | — | (81 | ) | ||||||
|
$ | (179 | ) | $ | 4,837 | $ | 9,424 | |||
Personnel Severance Costs
During 2009, we recorded $3.5 million in personnel severance and related costs resulting from a headcount reduction of 164 employees. This reduction in workforce included executives, management, administration, sales and service personnel and manufacturing employees' companywide.
During 2008, we recorded a $3.7 million restructuring charge related to a mutually agreed-upon termination of the employment agreement with our former CEO (who currently remains as Chairman of the Board of Directors) following the successful completion of the CEO transition, which included a charge of $3.0 million for the acceleration of stock-based compensation expense and $0.7 million related to salary and other related compensation, as specified in the employment agreement. The modification of the stock awards was recorded as an increase to additional paid-in capital. In addition, we eliminated approximately 49 employees during 2008 resulting in personnel severance costs of approximately $1.9 million, primarily in connection with increased outsourcing in our LED & Solar and Data Storage segments and realignment of the sales and service organization. This reduction in workforce included executives, management, administration and manufacturing employees' companywide.
Lease-related and Other Costs
During 2010, we had a change in estimate relating to one of our leased Data Storage facilities. As a result, we incurred a restructuring credit of $0.2 million, consisting primarily of the remaining lease payment obligations and estimated property taxes for a portion of the facility we will occupy, offset by a reduction in expected sublease income. We made certain assumptions in determining the credit, which included a reduction in estimated sublease income and terms of the sublease as well as the estimated discount rate to be used in determining the fair value of the remaining liability. We developed these assumptions based on our understanding of the current real estate market as well as current market interest rates. The assumptions are based on management's best estimates, and will be adjusted periodically if new information is obtained.
F-39
Veeco Instruments Inc. and Subsidiaries
Notes to Consolidated Financial Statements (Continued)
December 31, 2010
During 2009, we vacated our Data Storage facilities in Camarillo, CA. As a result, we incurred a $1.4 million restructuring charge, consisting primarily of the remaining lease payment obligations and estimated property taxes for the facility we vacated, offset by the estimated expected sublease income to be received. We made certain assumptions in determining the charge, which included estimated sublease income and terms of the sublease as well as the estimated discount rate to be used in determining the fair value of the liability. We developed these assumptions based on our understanding of the current real estate market as well as current market interest rates. The assumptions are based on management's best estimates, and will be adjusted periodically if new information is obtained.
During 2008, we recorded a $3.9 million restructuring charge for lease-related costs as part of the consolidation of our corporate headquarters into our Plainview, New York manufacturing facility during the first quarter of 2008. This charge primarily consisted of the liability for the remaining lease payments and property taxes relating to the facility we vacated, offset by expected sublease income. We made certain assumptions in determining the charge, which included estimated sublease income and terms of the sublease as well as the estimated discount rate to be used in determining the fair value of the net cash flows. We developed these assumptions, based on our understanding of the current real estate market as well as current market interest rates, which are adjusted periodically based upon new information, events and changes in the real estate market.
F-40
Veeco Instruments Inc. and Subsidiaries
Notes to Consolidated Financial Statements (Continued)
December 31, 2010
The following is a reconciliation of the liability for the 2010, 2009 and 2008 restructuring charge from inception through December 31, 2010 (in thousands):
| |
LED & Solar | Data Storage | Unallocated Corporate |
Total | |||||||||
|---|---|---|---|---|---|---|---|---|---|---|---|---|---|
Short-term liability |
|||||||||||||
Lease-related and other costs 2008 |
$ | — | $ | — | $ | 1,189 | $ | 1,189 | |||||
Personnel severance and related costs 2008 |
732 | 477 | 1,405 | 2,614 | |||||||||
Total charged to accrual 2008 |
732 | 477 | 2,594 | 3,803 | |||||||||
Lease-related and other costs 2009 |
190 | 803 | — | 993 | |||||||||
Personnel severance and related costs 2009 |
1,005 | 1,826 | 636 | 3,467 | |||||||||
Total charged to accrual 2009 |
1,195 | 2,629 | 636 | 4,460 | |||||||||
Lease-related and other (credits) costs 2010 |
— | (87 | ) | — | (87 | ) | |||||||
Total (credited) charged to accrual 2010 |
— | (87 | ) | — | (87 | ) | |||||||
Short-term/long-term reclassification 2008 |
— | — | 892 | 892 | |||||||||
Short-term/long-term reclassification 2009 |
— | 148 | 1,084 | 1,232 | |||||||||
Short-term/long-term reclassification 2010 |
— | 123 | 536 | 659 | |||||||||
Cash payments 2008 |
(72 | ) | (207 | ) | (1,627 | ) | (1,906 | ) | |||||
Cash payments 2009 |
(1,502 | ) | (2,561 | ) | (1,982 | ) | (6,045 | ) | |||||
Cash payments 2010 |
(353 | ) | (344 | ) | (1,597 | ) | (2,294 | ) | |||||
Balance as of December 31, 2010 |
$ | — | $ | 178 | $ | 536 | $ | 714 | |||||
Long-term liability |
|||||||||||||
Lease-related and other costs 2008 |
$ | — | $ | — | $ | 2,684 | $ | 2,684 | |||||
Lease-related and other costs 2009 |
— | 377 | — | 377 | |||||||||
Lease-related and other (credits) costs 2010 |
— | (48 | ) | — | (48 | ) | |||||||
Short-term/long-term reclassification 2008 |
— | — | (892 | ) | (892 | ) | |||||||
Short-term/long-term reclassification 2009 |
— | (148 | ) | (1,084 | ) | (1,232 | ) | ||||||
Short-term/long-term reclassification 2010 |
— | (123 | ) | (536 | ) | (659 | ) | ||||||
Other adjustments |
— | — | (172 | ) | (172 | ) | |||||||
Balance as of December 31, 2010 |
$ | — | $ | 58 | $ | — | $ | 58 | |||||
The long-term liability will be paid over the remaining life of the leases for the former corporate headquarters and a former Data Storage facility, which expire in June 2011 and May 2012, respectively. We currently do not anticipate or expect to incur additional restructuring charges during 2011.
F-41
Veeco Instruments Inc. and Subsidiaries
Notes to Consolidated Financial Statements (Continued)
December 31, 2010
The following is a reconciliation of the liability for the 2007 restructuring charge from inception through December 31, 2010 (in thousands):
| |
LED & Solar | Data Storage | Unallocated Corporate |
Total | |||||||||
|---|---|---|---|---|---|---|---|---|---|---|---|---|---|
Beginning balance at January 1, 2008 |
$ | 17 | $ | 2,063 | $ | 1,492 | $ | 3,572 | |||||
Reversal of accrual during 2008 |
— | (81 | ) | — | (81 | ) | |||||||
Cash payments during 2008 |
(17 | ) | (1,982 | ) | (1,247 | ) | (3,246 | ) | |||||
Cash payments during 2009 |
— | — | (245 | ) | (245 | ) | |||||||
Balance as of December 31, 2010 |
$ | — | $ | — | $ | — | $ | — | |||||
Asset Impairment Charges
During 2009, we recorded a $0.3 million asset impairment charge in the second quarter for property, plant and equipment no longer being utilized in our Data Storage reporting unit.
During 2008, we recorded a $51.4 million asset impairment charge, of which $51.1 million was recorded during the fourth quarter and $0.3 million was recorded during the first quarter. The fourth quarter charge consisted of $30.4 million related to goodwill, $19.6 million related to intangible assets ($5.0 million of indefinite-lived trademarks and $14.6 of other definite-lived intangibles) and $1.1 million in property, plant and equipment in Data Storage. The first quarter charge consisted of $0.3 million associated with property and equipment abandoned as part of the consolidation of our corporate headquarters into our Plainview facility.
Minimum Lease Commitments
Minimum lease commitments as of December 31, 2010 for property and equipment under operating lease agreements (exclusive of renewal options) are payable as follows (in thousands):
2011 |
$ | 3,915 | ||
2012 |
2,360 | |||
2013 |
1,723 | |||
2014 |
835 | |||
2015 |
401 | |||
Thereafter |
230 | |||
|
$ | 9,464 | ||
Rent charged to operations amounted to $2.3 million, $2.0 million and $2.5 million in 2010, 2009 and 2008, respectively. In addition, we are obligated under such leases for certain other expenses, including real estate taxes and insurance.
Environmental Remediation
We may, under certain circumstances, be obligated to pay up to $250,000 in connection with the implementation of a comprehensive plan of environmental remediation at our Plainview, New York facility. We have been indemnified by the former owner for any liabilities we may incur in excess of
F-42
Veeco Instruments Inc. and Subsidiaries
Notes to Consolidated Financial Statements (Continued)
December 31, 2010
$250,000 with respect to any such remediation and have a liability recorded for this amount as of December 31, 2009. No comprehensive plan has been required to date. Even without consideration of such indemnification, we do not believe that any material loss or expense is probable in connection with any remediation plan that may be proposed.
We are aware that petroleum hydrocarbon contamination has been detected in the soil at the site of a facility formerly leased by us in Santa Barbara, California. We have been indemnified for any liabilities we may incur which arise from environmental contamination at the site. Even without consideration of such indemnification, we do not believe that any material loss or expense is probable in connection with any such liabilities.
The former owner of the land and building in Santa Barbara, California in which our former Metrology operations were located, which business (sold to Bruker on October 7, 2010), has disclosed that there are hazardous substances present in the ground under the building. Management believes that the comprehensive indemnification clause that was part of the purchase contract relating to the purchase of such land provides adequate protection against any environmental issues that may arise. We have provided Bruker indemnification as part of the sale.
Litigation
We are involved in various legal proceedings arising in the normal course of our business. We do not believe that the ultimate resolution of these matters will have a material adverse effect on our consolidated financial position, results of operations or cash flows.
Concentrations of Credit Risk
Our business depends in large part upon the capital expenditures of our top ten customers, which accounted for 80% and 88% of total accounts receivable at December 31, 2010 and 2009, respectively. Of such, HB LED and data storage customers accounted for approximately 62% and 18%, and 65% and 23%, respectively, of total accounts receivable at December 31, 2010 and 2009.
Customers who accounted for more than 10% of our aggregate accounts receivable or net sales are as follows:
| |
Accounts Receivable December 31, |
Net Sales For the Year Ended December 31, |
||||||||||||||
|---|---|---|---|---|---|---|---|---|---|---|---|---|---|---|---|---|
| |
2010 | 2009 | 2010 | 2009 | 2008 | |||||||||||
Customer A |
20 | % | 43 | % | 17 | % | 27 | % | * | |||||||
Customer B |
26 | % | * | * | * | * | ||||||||||
Customer C |
* | * | 12 | % | * | * | ||||||||||
Customer D |
* | 14 | % | * | 10 | % | 21 | % | ||||||||
- *
- Less than 10% of aggregate accounts receivable or net sales.
Both of our operating segments sell to these major customers.
We manufacture and sell our products to companies in different geographic locations. In certain instances, we require deposits for a portion of the sales price in advance of shipment. We perform periodic credit evaluations of our customers' financial condition and, where appropriate, require that
F-43
Veeco Instruments Inc. and Subsidiaries
Notes to Consolidated Financial Statements (Continued)
December 31, 2010
letters of credit be provided on certain foreign sales arrangements. Receivables generally are due within 30-60 days, other than receivables generated from customers in Japan where payment terms generally range from 60-90 days. Our net accounts receivable balance is concentrated in the following geographic locations (in thousands):
| |
December 31, | ||||||
|---|---|---|---|---|---|---|---|
| |
2010 | 2009 | |||||
Americas |
$ | 13,600 | $ | 15,696 | |||
Europe, Middle East and Africa ("EMEA") |
17,321 | 10,367 | |||||
Asia Pacific(1) |
119,607 | 41,483 | |||||
|
$ | 150,528 | $ | 67,546 | |||
- (1)
- As of December 31, 2010, accounts receivable in China and Singapore amounted to $66.5 million and $48.3 million, respectively. As of December 31, 2009, accounts receivable in Singapore amounted to $34.0 million. No other country accounted for more than 10% of our accounts receivable as of December 31 for the years presented.
Suppliers
We currently outsource, and plan to continue the outsourcing of, certain functions to third parties, including the manufacture of all or substantially all of our new MOCVD systems, data storage systems, solar deposition systems and ion sources. We primarily rely on several suppliers for the manufacturing of these systems. We plan to maintain internal manufacturing capability for these systems at least until such time as we have qualified one or more alternate suppliers to perform this manufacturing. The failure of our present suppliers to meet their contractual obligations under our supply arrangements and our inability to make alternative arrangements or resume the manufacture of these systems ourselves could have a material adverse effect on our revenues, profitability, cash flows and relationships with our customers.
In addition, certain of the components and sub-assemblies included in our products are obtained from a single source or a limited group of suppliers. Our inability to develop alternative sources, if necessary, could result in a prolonged interruption in supply or a significant increase in the price of one or more components, which could adversely affect our operating results.
F-44
Veeco Instruments Inc. and Subsidiaries
Notes to Consolidated Financial Statements (Continued)
December 31, 2010
11. Foreign Operations, Geographic Area, and Product Segment Information
Net sales which are attributed to the geographic location in which the customer facility is located and long-lived assets related to operations in the United States and other foreign countries as of and for the years ended December 31, 2010, 2009 and 2008 are as follows (in thousands):
| |
Net Sales to Unaffiliated Customers | Long-Lived Assets | ||||||||||||||||||
|---|---|---|---|---|---|---|---|---|---|---|---|---|---|---|---|---|---|---|---|---|
| |
2010 | 2009 | 2008 | 2010 | 2009 | 2008 | ||||||||||||||
United States |
$ | 94,753 | $ | 60,553 | $ | 130,088 | $ | 123,543 | $ | 117,350 | $ | 124,480 | ||||||||
Other |
232 | 177 | 485 | — | — | — | ||||||||||||||
Total Americas |
94,985 | 60,730 | 130,573 | 123,543 | 117,350 | 124,480 | ||||||||||||||
EMEA(1) |
92,112 |
50,088 |
57,567 |
274 |
315 |
413 |
||||||||||||||
Asia Pacific(1) |
746,134 | 171,594 | 126,795 | 974 | 815 | 706 | ||||||||||||||
Total Other Foreign Countries |
838,246 | 221,682 | 184,362 | 1,248 | 1,130 | 1,119 | ||||||||||||||
|
$ | 933,231 | $ | 282,412 | $ | 314,935 | $ | 124,791 | $ | 118,480 | $ | 125,599 | ||||||||
- (1)
- For the year ended December 31, 2010, net sales to customers in South Korea, China and Taiwan were 32.3%, 28.6% and 10.8% of total net sales, respectively. For the year ended December 31, 2009, net sales to customers in South Korea and China were 35.1% and 11.0% of total net sales, respectively. For the year ended December 31, 2008, net sales to customers in Germany and Taiwan were 10.3% and 12.4% of total net sales, respectively. No other country in EMEA and Asia Pacific accounted for more than 10% of our net sales for the years presented.
We manage the business, review operating results and assess performance, as well as allocate resources, based upon two separate reporting segments that reflect the market focus of each business. The Light Emitting Diode ("LED") & Solar segment consists of metal organic chemical vapor deposition ("MOCVD") systems, molecular beam epitaxy ("MBE") systems, thermal deposition sources, and other types of deposition systems used to deposit materials on flexible and glass substrates. These systems are primarily sold to customers in the high-brightness light emitting diode ("HB LED") and solar industries, as well as to scientific research customers. This segment has product development and marketing sites in Somerset, New Jersey, St. Paul, Minnesota, Lowell, Massachusetts and Clifton Park, New York. The Data Storage segment consists of the ion beam etch, ion beam deposition, diamond-like carbon, physical vapor deposition, and dicing and slicing products sold primarily to customers in the data storage industry. This segment has product development and marketing sites in Plainview, New York, Ft. Collins, Colorado and Camarillo, California.
We evaluate the performance of our reportable segments based on income (loss) from operations before interest, income taxes, amortization and certain items ("segment profit (loss)"), which is the primary indicator used to plan and forecast future periods. The presentation of this financial measure facilitates meaningful comparison with prior periods, as management believes segment profit (loss) reports baseline performance and thus provides useful information. Certain items include restructuring expenses, asset impairment charges, inventory write-offs, equity-based compensation expense and other non-recurring items. The accounting policies of the reportable segments are the same as those described in the summary of critical accounting policies.
F-45
Veeco Instruments Inc. and Subsidiaries
Notes to Consolidated Financial Statements (Continued)
December 31, 2010
The following tables present certain data pertaining to our reportable product segments and a reconciliation of segment profit (loss) to income (loss) from continuing operations, before income taxes for the years ended December 31, 2010, 2009 and 2008, and goodwill and total assets as of December 31, 2010 and 2009 (in thousands):
| |
LED & Solar | Data Storage | Unallocated Corporate |
Total | |||||||||
|---|---|---|---|---|---|---|---|---|---|---|---|---|---|
Year ended December 31, 2010 |
|||||||||||||
Net sales |
$ | 797,904 | $ | 135,327 | $ | — | $ | 933,231 | |||||
Segment profit (loss) |
$ | 276,060 | $ | 34,534 | $ | (18,674 | ) | $ | 291,920 | ||||
Interest expense, net |
— | — | 6,572 | 6,572 | |||||||||
Amortization expense |
3,121 | 1,522 | 233 | 4,876 | |||||||||
Equity-based compensation expense |
2,643 | 1,140 | 5,865 | 9,648 | |||||||||
Restructuring credit |
— | (179 | ) | — | (179 | ) | |||||||
Income (loss) from continuing operations, before income taxes |
$ | 270,296 | $ | 32,051 | $ | (31,344 | ) | $ | 271,003 | ||||
Year ended December 31, 2009 |
|||||||||||||
Net sales |
$ | 205,153 | $ | 77,259 | $ | — | $ | 282,412 | |||||
Segment profit (loss) |
$ | 27,826 | $ | (2,578 | ) | $ | (10,598 | ) | $ | 14,650 | |||
Interest expense, net |
— | — | 6,850 | 6,850 | |||||||||
Amortization expense |
3,137 | 1,599 | 432 | 5,168 | |||||||||
Equity-based compensation expense |
1,358 | 1,020 | 5,169 | 7,547 | |||||||||
Restructuring expense |
1,196 | 3,006 | 635 | 4,837 | |||||||||
Asset impairment charge |
— | 304 | — | 304 | |||||||||
Inventory write-offs |
— | 1,526 | — | 1,526 | |||||||||
Income (loss) from continuing operations, before income taxes |
$ | 22,135 | $ | (10,033 | ) | $ | (23,684 | ) | $ | (11,582 | ) | ||
Year ended December 31, 2008 |
|||||||||||||
Net sales |
$ | 165,812 | $ | 149,123 | $ | — | $ | 314,935 | |||||
Segment profit (loss) |
$ | 23,913 | $ | 16,986 | $ | (9,221 | ) | $ | 31,678 | ||||
Interest expense, net |
— | — | 6,729 | 6,729 | |||||||||
Amortization expense |
4,627 | 3,790 | 448 | 8,865 | |||||||||
Equity-based compensation expense |
495 | 990 | 5,165 | 6,650 | |||||||||
Restructuring expense |
732 | 396 | 8,296 | 9,424 | |||||||||
Asset impairment charges |
— | 51,102 | 285 | 51,387 | |||||||||
Purchase accounting adjustment |
1,492 | — | — | 1,492 | |||||||||
Gain on extinguishment of debt |
— | — | (3,758 | ) | (3,758 | ) | |||||||
Income (loss) from continuing operations, before income taxes |
$ | 16,567 | $ | (39,292 | ) | $ | (26,386 | ) | $ | (49,111 | ) | ||
F-46
Veeco Instruments Inc. and Subsidiaries
Notes to Consolidated Financial Statements (Continued)
December 31, 2010
| |
LED & Solar | Data Storage | Unallocated Corporate |
Total | |||||||||
|---|---|---|---|---|---|---|---|---|---|---|---|---|---|
As of December 31, 2010 |
|||||||||||||
Goodwill |
$ | 52,003 | $ | — | $ | — | $ | 52,003 | |||||
Total assets |
$ | 323,096 | $ | 61,691 | $ | 763,247 | $ | 1,148,034 | |||||
As of December 31, 2009 |
|||||||||||||
Goodwill |
$ | 52,003 | $ | — | $ | — | $ | 52,003 | |||||
Total assets |
$ | 178,420 | $ | 54,106 | $ | 372,846 | $ | 605,372 | |||||
Corporate total assets are comprised principally of cash and cash equivalents, short-term investments and restricted cash as of December 31, 2010 and 2009.
Other Segment Data (in thousands):
| |
Year ended December 31, | ||||||||||
|---|---|---|---|---|---|---|---|---|---|---|---|
| |
2010 | 2009 | 2008 | ||||||||
Depreciation and amortization expense: |
|||||||||||
LED & Solar |
$ | 7,573 | $ | 7,392 | $ | 7,850 | |||||
Data Storage |
3,582 | 4,448 | 7,690 | ||||||||
Unallocated Corporate |
1,699 | 2,025 | 2,145 | ||||||||
Total depreciation and amortization expense |
$ | 12,854 | $ | 13,865 | $ | 17,685 | |||||
Expenditures for long-lived assets: |
|||||||||||
LED & Solar |
$ | 8,086 | $ | 6,656 | $ | 5,605 | |||||
Data Storage |
572 | 192 | 4,256 | ||||||||
Unallocated Corporate |
2,066 | 612 | 1,265 | ||||||||
Total expenditures for long-lived assets |
$ | 10,724 | $ | 7,460 | $ | 11,126 | |||||
12. Defined Contribution Benefit Plan
We maintain a defined contribution benefit plan under Section 401(k) of the Internal Revenue Code. Almost all of our domestic full-time employees are eligible to participate in this plan. Under the plan, we provide matching contributions of fifty cents for every dollar employees contribute up to a maximum of $3,000. Generally, the plan calls for vesting of Company contributions over the initial five years of a participant's employment. Beginning in 2007, we maintained a similar type of contribution plan at one of our foreign subsidiaries. Our contributions to these plans in 2010, 2009 and 2008 were $1.8 million, $1.0 million and $1.4 million, respectively.
13. Cost Method Investment
On September 28, 2010, Veeco completed an investment in a rapidly developing organic light emitting diode (OLED) equipment company. Veeco has invested in this company's Round B funding extension totaling $3 million, resulting in 7.8% ownership of the preferred shares, and 5.6% ownership of the company. Since we do not exhibit significant influence on such company, this investment is treated under the cost method in accordance with applicable accounting guidance. The fair value of this investment is not estimated because there are no identified events or changes in circumstances that may have a significant adverse effect on the fair value of the investment, and we are exempt from estimating interim fair values because the investment does not meet the definition of a publicly traded company. This investment is recorded in other assets in our Consolidated Balance Sheet as of December 31, 2010.
F-47
Schedule II—Valuation and Qualifying Accounts (in thousands)
| COL. A | COL. B | COL. C | COL. D | COL. E | ||||||||||||||
|---|---|---|---|---|---|---|---|---|---|---|---|---|---|---|---|---|---|---|
| |
|
Additions | |
|
||||||||||||||
| Description | Balance at Beginning of Period |
Charged to Costs and Expenses |
Charged to Other Accounts |
Deductions | Balance at End of Period |
|||||||||||||
Deducted from asset accounts: |
||||||||||||||||||
Year ended December 31, 2010: |
||||||||||||||||||
Allowance for doubtful accounts |
$ | 438 | $ | 40 | $ | 34 | $ | — | $ | 512 | ||||||||
Valuation allowance on net deferred tax assets |
84,723 | — | (2,663 | ) | (80,416 | ) | 1,644 | |||||||||||
|
$ | 85,161 | $ | 40 | $ | (2,629 | ) | $ | (80,416 | ) | $ | 2,156 | ||||||
Deducted from asset accounts: |
||||||||||||||||||
Year ended December 31, 2009: |
||||||||||||||||||
Allowance for doubtful accounts |
$ | 583 | $ | (52 | ) | $ | — | $ | (93 | ) | $ | 438 | ||||||
Valuation allowance on net deferred tax assets |
78,706 | 6,017 | — | — | 84,723 | |||||||||||||
|
$ | 79,289 | $ | 5,965 | $ | — | $ | (93 | ) | $ | 85,161 | |||||||
Deducted from asset accounts: |
||||||||||||||||||
Year ended December 31, 2008: |
||||||||||||||||||
Allowance for doubtful accounts |
$ | 641 | $ | (67 | ) | $ | 9 | $ | — | $ | 583 | |||||||
Valuation allowance on net deferred tax assets |
67,360 | 14,150 | 317 | (3,121 | ) | 78,706 | ||||||||||||
|
$ | 68,001 | $ | 14,083 | $ | 326 | $ | (3,121 | ) | $ | 79,289 | |||||||
S-1
Unless otherwise indicated, each of the following exhibits has been previously filed with the Securities and Exchange Commission by the Company under File No. 0-16244.
| Number | Exhibit | Incorporated by Reference to the Following Documents | |||
|---|---|---|---|---|---|
| 2.1 | Stock Purchase Agreement dated August 15, 2010 among Veeco Instruments Inc. (Veeco), Veeco Metrology Inc. and Bruker Corporation | Quarterly Report on Form 10-Q for the quarter ended September 30, 2010, Exhibit 2.1 | |||
| 3.1 | Amended and Restated Certificate of Incorporation of Veeco dated December 1, 1994, as amended June 2, 1997 and July 25, 1997. | Quarterly Report on Form 10-Q for the quarter ended June 30, 1997, Exhibit 3.1 | |||
| 3.2 | Amendment to Certificate of Incorporation of Veeco dated May 29, 1998. | Annual Report on Form 10-K for the year ended December 31, 2000, Exhibit 3.2 | |||
| 3.3 | Amendment to Certificate of Incorporation of Veeco dated May 5, 2000. | Quarterly Report on Form 10-Q for the quarter ended June 30, 2000, Exhibit 3.1 | |||
| 3.4 | Certificate of Designation, Preferences, and Rights of Series A Junior Participating Preferred Stock of Veeco. | Quarterly Report on Form 10-Q for the quarter ended March 31, 2001, Exhibit 3.1 | |||
| 3.5 | Amendment to Certificate of Incorporation of Veeco dated May 16, 2002 | Quarterly Report on Form 10-Q for the quarter ended September 30, 2009, Exhibit 3.1 | |||
| 3.6 | Amendment to Certificate of Incorporation of Veeco dated May 14, 2010 | Filed herewith | |||
| 3.7 | Fourth Amended and Restated Bylaws of Veeco, effective October 23, 2008 | Current Report on Form 8-K filed October 27, 2008, Exhibit 3.1 | |||
| 3.8 | Amendment No. 1 to the Fourth Amended and Restated Bylaws of Veeco effective May 20, 2010 | Current Report on Form 8-K, filed May 26, 2010, Exhibit 3.1 | |||
| 4.1 | Rights Agreement, dated as of March 13, 2001, between Veeco and American Stock Transfer and Trust Company, as Rights Agent, including the form of the Certificate of Designation, Preferences, and Rights setting forth the terms of the Series A Junior Participating Preferred Stock, par value $0.01 per share, as Exhibit A, the form of Rights Certificates as Exhibit B and the Summary of Rights to Purchase Preferred Stock as Exhibit C. | Registration Statement on Form 8-A dated March 15, 2001, Exhibit 1 | |||
| 4.2 | Amendment to Rights Agreement, dated as of September 6, 2001, between Veeco and American Stock Transfer and Trust Company, as rights agent. | Current Report on Form 8-K, filed September 21, 2001, Exhibit 4.1 | |||
| 4.3 | Amendment No 2 to Rights Agreement, dated as of July 11, 2002, between Veeco and American Stock Transfer and Trust Company, as rights agent. | Current Report on Form 8-K, filed July 12, 2002, Exhibit 4.1 | |||
| Number | Exhibit | Incorporated by Reference to the Following Documents | |||
|---|---|---|---|---|---|
| 4.4 | Indenture, dated April 16, 2007, between Veeco and U.S. Bank National Trust | Post-Effective Amendment No. 1 To Registration Statement on Form S-3 (File No. 333-128004) filed April 16, 2007, Exhibit 4.1 | |||
| 4.5 | First Supplemental Indenture, dated April 20, 2007, by and between Veeco and U.S. Bank Trust National Association, as Trustee | Current Report on Form 8-K, filed April 20, 2007, Exhibit 4.1 | |||
| 10.1 | Loan Agreement dated as of December 15, 1999 between Applied Epi, Inc. and Jackson National Life Insurance Company. | Quarterly Report on Form 10-Q for the quarter ended September 30, 2001, Exhibit 10.2 | |||
| 10.2 | Amendment to Loan Documents effective as of September 17, 2001 between Applied Epi, Inc. and Jackson National Life Insurance Company (executed in June 2002). | Quarterly Report on Form 10-Q for the quarter ended June 30, 2002, Exhibit 10.2 | |||
| 10.3 | Promissory Note dated as of December 15, 1999 issued by Applied Epi, Inc. to Jackson National Life Insurance Company. | Quarterly Report on Form 10-Q for the quarter ended September 30, 2001, Exhibit 10.3 | |||
| 10.4 | * | Form of Indemnification Agreement entered into between Veeco and each of its directors and executive officers. | Current Report on Form 8-K filed on October 23, 2006, Exhibit 10.1 | ||
| 10.5 | * | Veeco Amended and Restated 1992 Employees' Stock Option Plan. | Registration Statement on Form S-1 (File No. 33-93958), Exhibit 10.20 | ||
| 10.6 | * | Amendment dated May 15, 1997 to Veeco Amended and Restated 1992 Employees' Stock Option Plan. | Registration Statement on Form S-8 (File No. 333-35009) filed September 5, 1997, Exhibit 10.1 | ||
| 10.7 | * | Amendment dated July 25, 1997 to Veeco Amended and Restated 1992 Employees' Stock Option Plan. | Registration Statement on Form S-8 (File No. 333-35009) filed September 5, 1997, Exhibit 10.2 | ||
| 10.8 | * | Amendment dated May 29, 1998 to Veeco Amended and Restated 1992 Employees' Stock Option Plan. | Registration Statement on Form S-8 (File No. 333-79469) filed May 27, 1999, Exhibit 10.1 | ||
| 10.9 | * | Amendment dated May 14, 1999 to Veeco Amended and Restated 1992 Employees' Stock Option Plan. | Registration Statement on Form S-8 (File No. 333-79469) filed May 27, 1999, Exhibit 10.2 | ||
| 10.10 | * | Veeco Amended and Restated 2000 Stock Incentive Plan, effective July 20, 2006. | Quarterly Report on Form 10-Q for the quarter ended June 30, 2006, Exhibit 10.4 | ||
| 10.11 | * | Amendment No. 1 effective April 18, 2007 (ratified by the Board August 7, 2007) to Veeco Amended and Restated 2000 Stock Incentive Plan. | Quarterly Report on Form 10-Q for the quarter ended June 30, 2007, Exhibit 10.1 | ||
| 10.12 | * | Amendment No. 2 dated January 22, 2009 to Veeco Amended and Restated 2000 Stock Incentive Plan. | Annual Report on Form 10-K for the year ended December 31, 2008, Exhibit 10.41 | ||
| 10.13 | * | Form of Restricted Stock Agreement pursuant to the Veeco 2000 Stock Incentive Plan, effective November 2005 | Quarterly Report on Form 10-Q for the quarter ended September 30, 2005, Exhibit 10.3 | ||
| Number | Exhibit | Incorporated by Reference to the Following Documents | |||
|---|---|---|---|---|---|
| 10.14 | * | Form of Notice of Restricted Stock Award and related terms and conditions pursuant to the Veeco 2000 Stock Incentive Plan, effective June 2006 | Quarterly Report on Form 10-Q for the quarter ended September 30, 2006, Exhibit 10.3 | ||
| 10.15 | * | Veeco 2010 Stock Incentive Plan, effective May 14, 2010 | Registration Statement on Form S-8 (File Number 333-166852) filed May 14, 2010, Exhibit 10.1 | ||
| 10.16 | * | Form of 2010 Stock Incentive Plan Stock Option Agreement | Registration Statement on Form S-8 (File Number 333-166852) filed May 14, 2010, Exhibit 10.2 | ||
| 10.17 | * | Form of 2010 Stock Incentive Plan Restricted Stock Agreement | Registration Statement on Form S-8 (File Number 333-166852) filed May 14, 2010, Exhibit 10.3 | ||
| 10.18 | * | Veeco Performance-Based Restricted Stock 2010 | Quarterly Report on Form 10-Q for the quarter ended June 30, 2010, Exhibit 10.2 | ||
| 10.19 | * | Veeco 2010 Management Bonus Plan dated January 22, 2010 | Quarterly Report on Form 10-Q for the quarter ended March 31, 2010, Exhibit 10.2 | ||
| 10.20 | * | Veeco 2010 Special Profit Sharing Plan dated February 15, 2010 | Quarterly Report on Form 10-Q for the quarter ended March 31, 2010, Exhibit 10.3 | ||
| 10.21 | * | Senior Executive Change in Control Policy effective as of September 12, 2008 | Quarterly Report on Form 10-Q for the quarter ended September 30, 2008, Exhibit 10.3 | ||
| 10.22 | * | Amendment No. 1 dated December 23, 2008 (effective September 12, 2008) to Veeco Senior Executive Change in Control Policy | Annual Report on Form 10-K for the year ended December 31, 2008, Exhibit 10.37 | ||
| 10.23 | * | Service Agreement effective July 24, 2008 between Veeco and Edward H. Braun | Quarterly Report on Form 10-Q for the quarter ended June 30, 2008, Exhibit 10.1 | ||
| 10.24 | * | Employment Agreement effective as of July 1, 2007 between Veeco and John R. Peeler | Quarterly Report on Form 10-Q for the quarter ended June 30, 2007, Exhibit 10.3 | ||
| 10.25 | * | Amendment effective December 31, 2008 to Employment Agreement between Veeco and John R. Peeler | Annual Report on Form 10-K for the year ended December 31, 2008, Exhibit 10.38 | ||
| 10.26 | * | Second Amendment effective June 11, 2010 to Employment Agreement between Veeco and John R. Peeler | Quarterly Report on Form 10-Q for the quarter ended June 30, 2010, Exhibit 10.1 | ||
| 10.27 | * | Employment Agreement dated December 17, 2009 (effective January 18, 2010) between Veeco and David D. Glass | Quarterly Report on Form 10-Q for the quarter ended March 31, 2010, Exhibit 10.1 | ||
| 10.28 | * | Letter Agreement dated January 21, 2004 between Veeco and John P. Kiernan. | Annual Report on Form 10-K for the year ended December 31, 2003, Exhibit 10.38 | ||
| 10.29 | * | Form of Amendment effective June 9, 2006 to Letter Agreements between Veeco and each of John P. Kiernan and Robert P. Oates | Quarterly Report on Form 10-Q for the quarter ended June 30, 2006, Exhibit 10.3 | ||
| Number | Exhibit | Incorporated by Reference to the Following Documents | |||
|---|---|---|---|---|---|
| 10.30 | * | Form of Amendment effective December 31, 2008 to Letter Agreements between Veeco and each of John P. Kiernan, Mark R. Munch and Robert P. Oates | Annual Report on Form 10-K for the year ended December 31, 2008, Exhibit 10.40 | ||
| 10.31 | * | Letter agreement effective as of June 19, 2009 between Veeco and John P. Kiernan | Quarterly Report on Form 10-Q for the quarter ended June 30, 2009, Exhibit 10.2 | ||
| 10.32 | * | Letter Agreement dated October 31, 2005 between Veeco and Robert P. Oates | Quarterly Report on Form 10-Q for the quarter ended September 30, 2005, Exhibit 10.1 | ||
| 10.33 | * | Amendment dated September 12, 2008 to Employment Agreement between Veeco and Robert P. Oates | Quarterly Report on Form 10-Q for the quarter ended September 30, 2008, Exhibit 10.2 | ||
| 10.34 | * | Employment Agreement dated as of April 1, 2003 between Veeco and John F. Rein, Jr. | Quarterly Report on Form 10-Q for the quarter ended June 30, 2003, Exhibit 10.5 | ||
| 10.35 | * | Amendment effective June 9, 2006 to Employment Agreement between Veeco and John F. Rein, Jr. | Quarterly Report on Form 10-Q for the quarter ended June 30, 2006, Exhibit 10.2 | ||
| 10.36 | * | Amendment dated as of September 12, 2008 to Employment Agreement between Veeco and John F. Rein, Jr. | Quarterly Report on Form 10-Q for the quarter ended September 30, 2008, Exhibit 10.1 | ||
| 10.37 | * | Amendment effective December 31, 2008 to Employment Agreement between Veeco and John F. Rein, Jr. | Annual Report on Form 10-K for the year ended December 31, 2008, Exhibit 10.39 | ||
| 10.38 | * | Letter Agreement dated January 11, 2008 between Veeco and Mark R. Munch | Annual Report on Form 10-K for the year ended December 31, 2007, Exhibit 10.33 | ||
| 10.39 | * | Letter Agreement dated September 23, 2010 between Veeco and Mark R. Munch | Quarterly Report on Form 10-Q for the quarter ended September 30, 2010, Exhibit 10.1 | ||
| 21.1 | Subsidiaries of the Registrant. | Filed herewith | |||
| 23.1 | Consent of Ernst & Young LLP. | Filed herewith | |||
| 31.1 | Certification of Chief Executive Officer pursuant to Rule 13a-14(a) or Rule 15d-14(a) of the Securities and Exchange Act of 1934. | Filed herewith | |||
| 31.2 | Certification of Chief Financial Officer pursuant to Rule 13a-14(a) or Rule 15d-14(a) of the Securities and Exchange Act of 1934. | Filed herewith | |||
| 32.1 | Certification of Chief Executive Officer pursuant to 18 U.S.C. Section 1350, as adopted pursuant to Section 906 of the Sarbanes-Oxley Act of 2002 | Filed herewith | |||
| 32.2 | Certification of Chief Financial Officer pursuant to 18 U.S.C. Section 1350, as adopted pursuant to Section 906 of the Sarbanes-Oxley Act of 2002 | Filed herewith | |||
- *
- Indicates a management contract or compensatory plan or arrangement, as required by Item 15(a) (3) of Form 10-K.