Attached files
| file | filename |
|---|---|
| 8-K - FORM 8-K - US BANCORP \DE\ | c60786e8vk.htm |
| EX-99.1 - EX-99.1 - US BANCORP \DE\ | c60786exv99w1.htm |
Exhibit
99.2

| U.S. Bancorp 3Q10 Earnings Conference Call October 20, 2010 Richard K. Davis Chairman, President and CEO Andy Cecere Vice Chairman and CFO |
| 2 Forward-looking Statements and Additional Information The following information appears in accordance with the Private Securities Litigation Reform Act of 1995: This presentation contains forward-looking statements about U.S. Bancorp. Statements that are not historical or current facts, including statements about beliefs and expectations, are forward-looking statements and are based on the information available to, and assumptions and estimates made by, management as of the date made. These forward-looking statements cover, among other things, anticipated future revenue and expenses and the future plans and prospects of U.S. Bancorp. Forward-looking statements involve inherent risks and uncertainties, and important factors could cause actual results to differ materially from those anticipated. Global and domestic economies could fail to recover from the recent economic downturn or could experience another severe contraction, which could adversely affect U.S. Bancorp's revenues and the values of its assets and liabilities. Global financial markets could experience a recurrence of significant turbulence, which could reduce the availability of funding to certain financial institutions and lead to a tightening of credit, a reduction of business activity, and increased market volatility. Stress in the commercial real estate markets, as well as a delay or failure of recovery in the residential real estate markets, could cause additional credit losses and deterioration in asset values. In addition, U.S. Bancorp's business and financial performance is likely to be impacted by effects of recently enacted and future legislation and regulation. U.S. Bancorp's results could also be adversely affected by continued deterioration in general business and economic conditions; changes in interest rates; deterioration in the credit quality of its loan portfolios or in the value of the collateral securing those loans; deterioration in the value of securities held in its investment securities portfolio; legal and regulatory developments; increased competition from both banks and non-banks; changes in customer behavior and preferences; effects of mergers and acquisitions and related integration; effects of critical accounting policies and judgments; and management's ability to effectively manage credit risk, residual value risk, market risk, operational risk, interest rate risk and liquidity risk. For discussion of these and other risks that may cause actual results to differ from expectations, refer to U.S. Bancorp's Annual Report on Form 10-K for the year ended December 31, 2009, on file with the Securities and Exchange Commission, including the sections entitled "Risk Factors" and "Corporate Risk Profile" contained in Exhibit 13, and all subsequent filings with the Securities and Exchange Commission under Sections 13(a), 13(c), 14 or 15(d) of the Securities Exchange Act of 1934. Forward-looking statements speak only as of the date they are made, and U.S. Bancorp undertakes no obligation to update them in light of new information or future events. This presentation includes non-GAAP financial measures to describe U.S. Bancorp's performance. The reconciliations of those measures to GAAP measures are provided within or in the appendix of the presentation. These disclosures should not be viewed as a substitute for operating results determined in accordance with GAAP, nor are they necessarily comparable to non-GAAP performance measures that may be presented by other companies. |
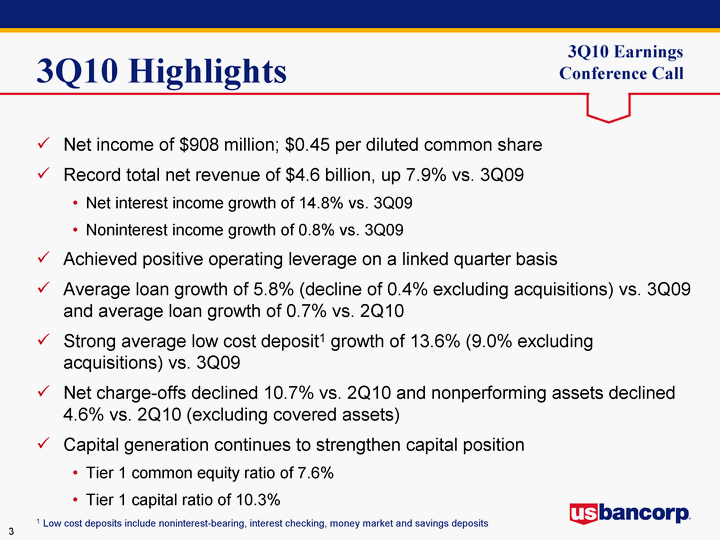
| 3Q10 Highlights Net income of $908 million; $0.45 per diluted common share Record total net revenue of $4.6 billion, up 7.9% vs. 3Q09 Net interest income growth of 14.8% vs. 3Q09 Noninterest income growth of 0.8% vs. 3Q09 Achieved positive operating leverage on a linked quarter basis Average loan growth of 5.8% (decline of 0.4% excluding acquisitions) vs. 3Q09 and average loan growth of 0.7% vs. 2Q10 Strong average low cost deposit1 growth of 13.6% (9.0% excluding acquisitions) vs. 3Q09 Net charge-offs declined 10.7% vs. 2Q10 and nonperforming assets declined 4.6% vs. 2Q10 (excluding covered assets) Capital generation continues to strengthen capital position Tier 1 common equity ratio of 7.6% Tier 1 capital ratio of 10.3% 1 Low cost deposits include noninterest-bearing, interest checking, money market and savings deposits |
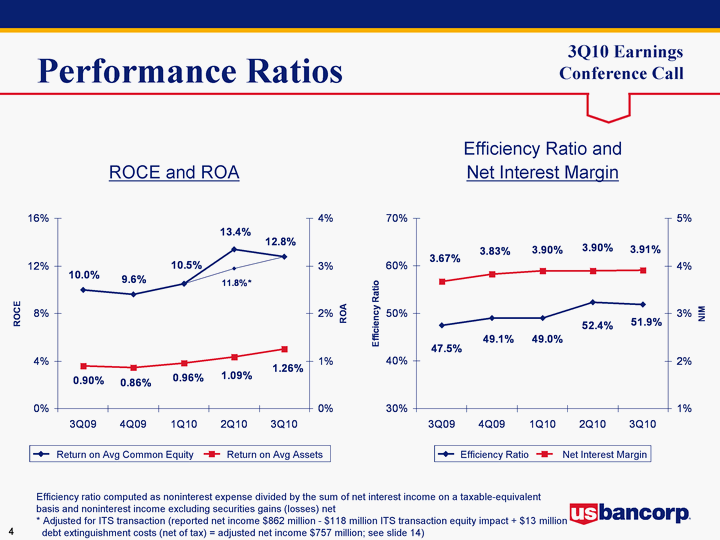
| Performance Ratios 3Q09 4Q09 1Q10 2Q10 3Q10 Return on Avg Common Equity 0.1 0.096 0.105 0.134 0.128 Return on Avg Common Equity 0.1 0.096 0.105 0.118 0.128 Return on Avg Assets 0.009 0.0086 0.0096 0.0109 0.0126 3Q09 4Q09 1Q10 2Q10 3Q10 Efficiency Ratio 0.475 0.491 0.49 0.524 0.519 Net Interest Margin 0.0367 0.0383 0.039 0.039 0.0391 ROCE and ROA Efficiency Ratio and Net Interest Margin Return on Avg Common Equity Return on Avg Assets Efficiency Ratio Net Interest Margin Efficiency ratio computed as noninterest expense divided by the sum of net interest income on a taxable-equivalent basis and noninterest income excluding securities gains (losses) net * Adjusted for ITS transaction (reported net income $862 million - $118 million ITS transaction equity impact + $13 million debt extinguishment costs (net of tax) = adjusted net income $757 million; see slide 14) |
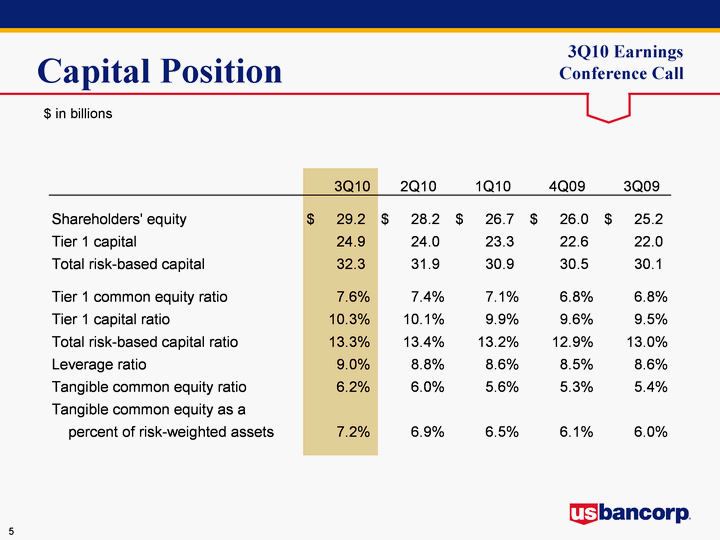
| Capital Position $ in billions |
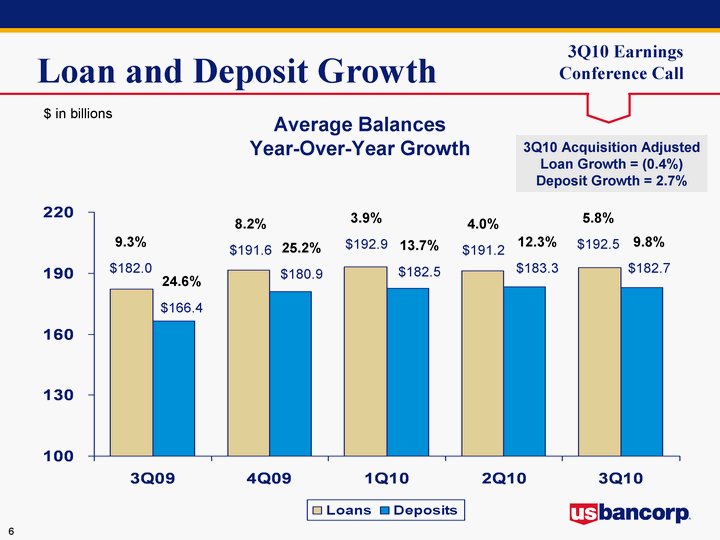
| 3Q09 4Q09 1Q10 2Q10 3Q10 Loans 182 191.6 192.9 191.2 192.5 Deposits 166.4 180.9 182.5 183.3 182.7 Loan and Deposit Growth Average Balances Year-Over-Year Growth 3Q10 Acquisition Adjusted Loan Growth = (0.4%) Deposit Growth = 2.7% 8.2% $191.6 3.9% $192.9 4.0% $191.2 5.8% $192.5 9.3% $182.0 25.2% $180.9 13.7% $182.5 12.3% $183.3 9.8% $182.7 24.6% $166.4 $ in billions |
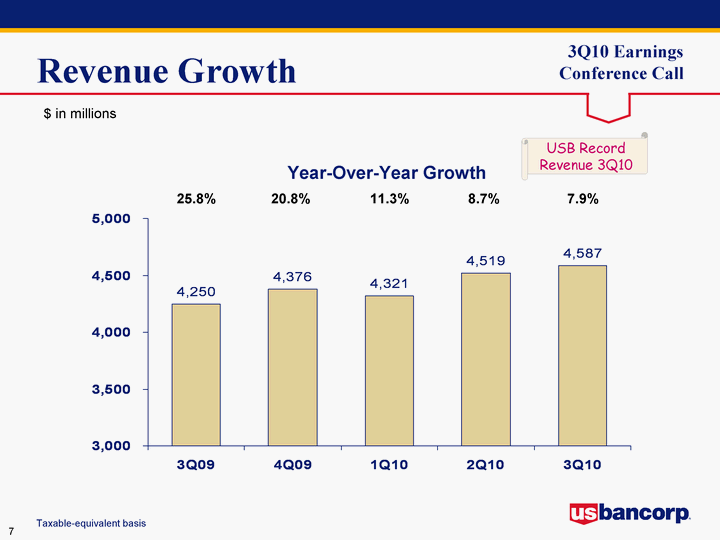
| Taxable-equivalent basis Revenue Growth Year-Over-Year Growth 25.8% 20.8% 11.3% 8.7% 7.9% $ in millions 3Q09 4Q09 1Q10 2Q10 3Q10 Reported 4250 4376 4321 4519 4587 USB Record Revenue 3Q10 |
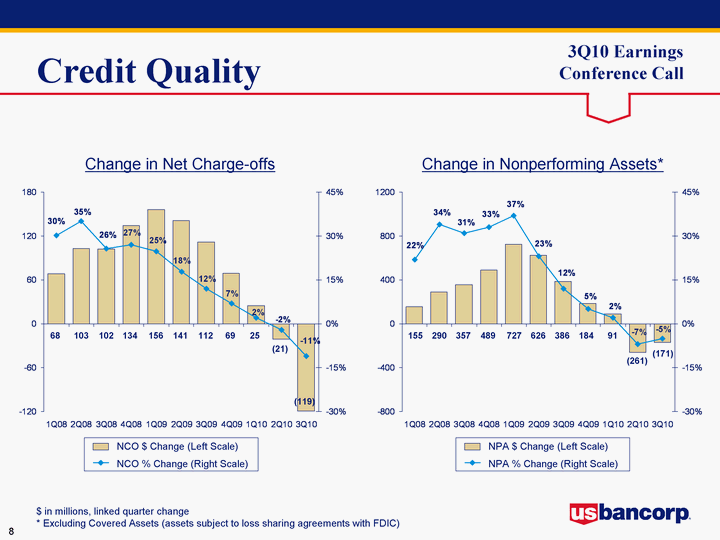
| 3Q07 4Q07 1Q08 2Q08 3Q08 4Q08 1Q09 2Q09 3Q09 4Q09 1Q10 2Q10 3Q10 NPA $ Change 76 49 155 290 357 489 727 626 386 184 91 -261 -171 NPA % Change 0.13 0.08 0.22 0.34 0.31 0.33 0.37 0.23 0.12 0.05 0.02 -0.07 -0.05 3Q07 4Q07 1Q08 2Q08 3Q08 4Q08 1Q09 2Q09 3Q09 4Q09 1Q10 2Q10 3Q10 NCO $ Change 8 26 68 103 102 134 156 141 112 69 25 -21 -119 NCO % Change 0.041884817 0.130653266 0.302222222 0.351535836 0.257575758 0.269076305 0.246835443 0.17893401 0.12056 0.07 0.02 -0.02 -0.11 Credit Quality $ in millions, linked quarter change * Excluding Covered Assets (assets subject to loss sharing agreements with FDIC) Change in Net Charge-offs Change in Nonperforming Assets* NCO $ Change (Left Scale) NCO % Change (Right Scale) NPA $ Change (Left Scale) NPA % Change (Right Scale) 103 68 (21) 25 69 112 141 156 134 102 155 290 91 184 386 626 727 489 357 (261) (119) (171) |
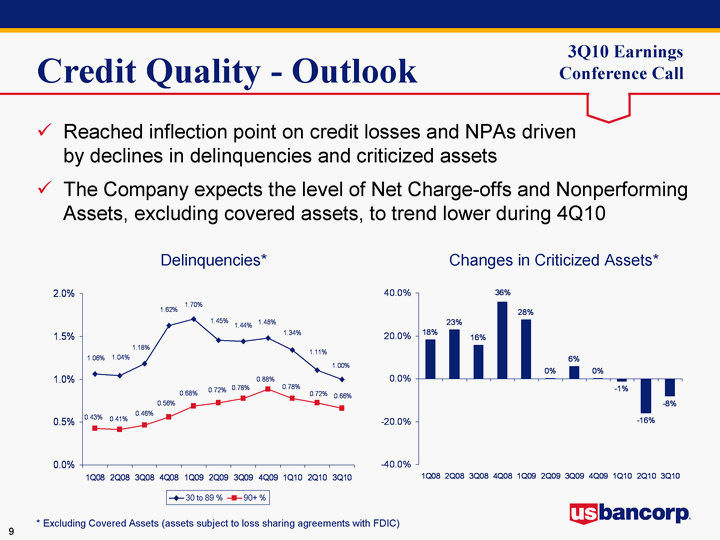
| Credit Quality - Outlook Reached inflection point on credit losses and NPAs driven by declines in delinquencies and criticized assets The Company expects the level of Net Charge-offs and Nonperforming Assets, excluding covered assets, to trend lower during 4Q10 1Q08 2Q08 3Q08 4Q08 1Q09 2Q09 3Q09 4Q09 1Q10 2Q10 3Q10 30 to 89 % 0.010601156 0.0103876 0.011833483 0.016222915 0.017008547 0.014526577 0.014428656 0.014800805 0.013381895 0.011072197 0.01 90+ % 0.004270373 0.004141298 0.004633146 0.005564539 0.006834344 0.007245829 0.00775995 0.008820331 0.007760089 0.007220238 0.0066 1Q08 2Q08 3Q08 4Q08 1Q09 2Q09 3Q09 4Q09 1Q10 2Q10 3Q10 Chg Criticized Assets 0.181945238 0.228090362 0.156114108 0.359501198 0.275796154 0.002013557 0.057701718 0.001878723 -0.012658584 -0.159651986 -0.08 Delinquencies* Changes in Criticized Assets* * Excluding Covered Assets (assets subject to loss sharing agreements with FDIC) |
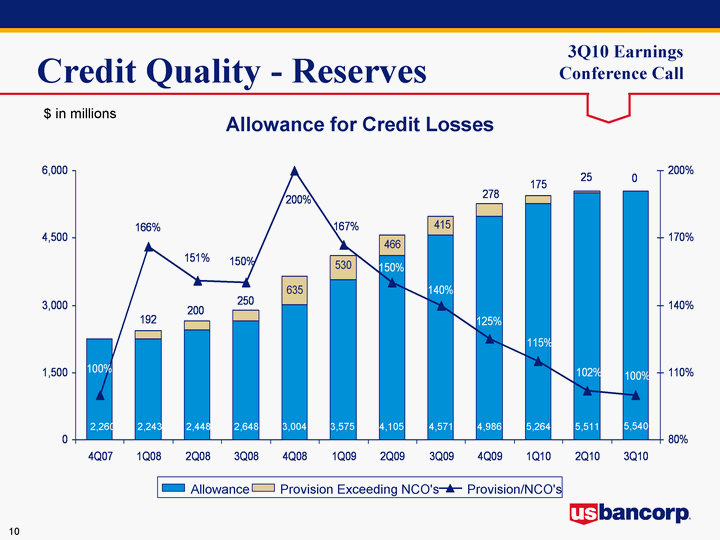
| Credit Quality - Reserves 4Q07 1Q08 2Q08 3Q08 4Q08 1Q09 2Q09 3Q09 4Q09 1Q10 2Q10 3Q10 Allowance 2260 2243 2448 2648 3004 3575 4105 4571 4986 5264 5511 5540 Provision Exceeding NCO's 0 192 200 250 635 530 466 415 278 175 25 0 Provision/NCO's 1 1.66 1.51 1.5 2 1.67 1.5 1.4 1.25 1.15 1.02 1 Allowance for Credit Losses Allowance Provision Exceeding NCO's Provision/NCO's $ in millions 5,511 5,264 4,986 4,571 4,105 3,575 3,004 2,648 2,448 2,243 2,260 5,540 |
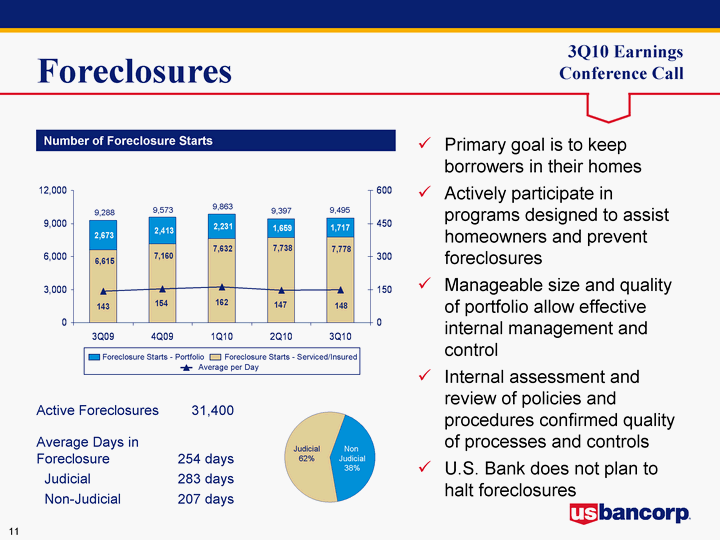
| 3Q09 4Q09 1Q10 2Q10 3Q10 Foreclosure Starts - Insured/Serviced 6615 7160 7632 7738 7778 Foreclosure Starts - Portfolio 2673 2413 2231 1659 1717 Average per Day 143 154 162 147 148 Foreclosures Number of Foreclosure Starts Investor Owner Mix 15185 10823 Judicial 62% Non Judicial 38% Primary goal is to keep borrowers in their homes Actively participate in programs designed to assist homeowners and prevent foreclosures Manageable size and quality of portfolio allow effective internal management and control Internal assessment and review of policies and procedures confirmed quality of processes and controls U.S. Bank does not plan to halt foreclosures Foreclosure Starts - Portfolio Foreclosure Starts - Serviced/Insured Average per Day Active Foreclosures 31,400 Average Days in Foreclosure 254 days Judicial 283 days Non-Judicial 207 days 9,288 9,573 9,863 9,397 9,495 |
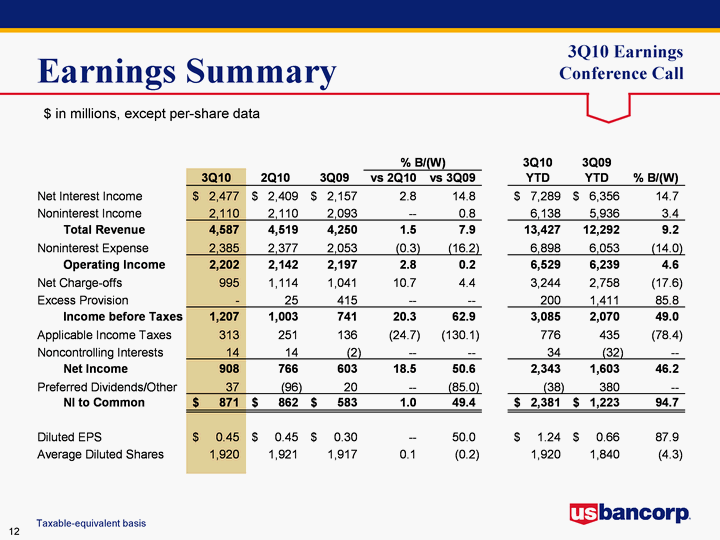
| Earnings Summary $ in millions, except per-share data Taxable-equivalent basis |
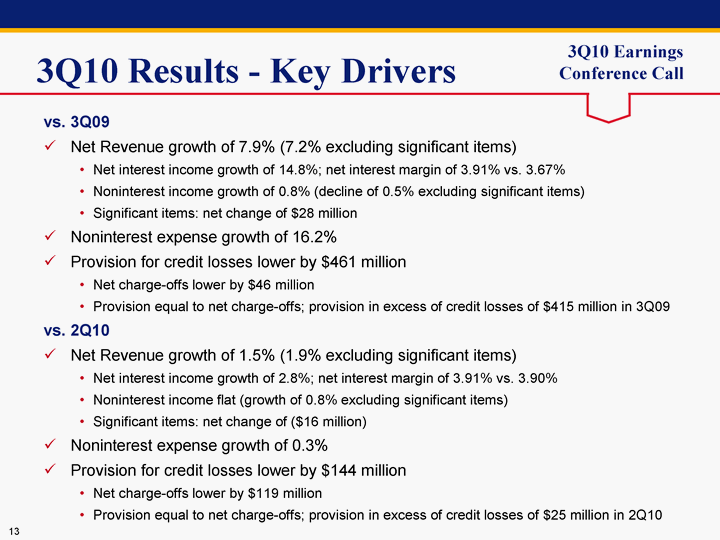
| 3Q10 Results - Key Drivers vs. 3Q09 Net Revenue growth of 7.9% (7.2% excluding significant items) Net interest income growth of 14.8%; net interest margin of 3.91% vs. 3.67% Noninterest income growth of 0.8% (decline of 0.5% excluding significant items) Significant items: net change of $28 million Noninterest expense growth of 16.2% Provision for credit losses lower by $461 million Net charge-offs lower by $46 million Provision equal to net charge-offs; provision in excess of credit losses of $415 million in 3Q09 vs. 2Q10 Net Revenue growth of 1.5% (1.9% excluding significant items) Net interest income growth of 2.8%; net interest margin of 3.91% vs. 3.90% Noninterest income flat (growth of 0.8% excluding significant items) Significant items: net change of ($16 million) Noninterest expense growth of 0.3% Provision for credit losses lower by $144 million Net charge-offs lower by $119 million Provision equal to net charge-offs; provision in excess of credit losses of $25 million in 2Q10 |
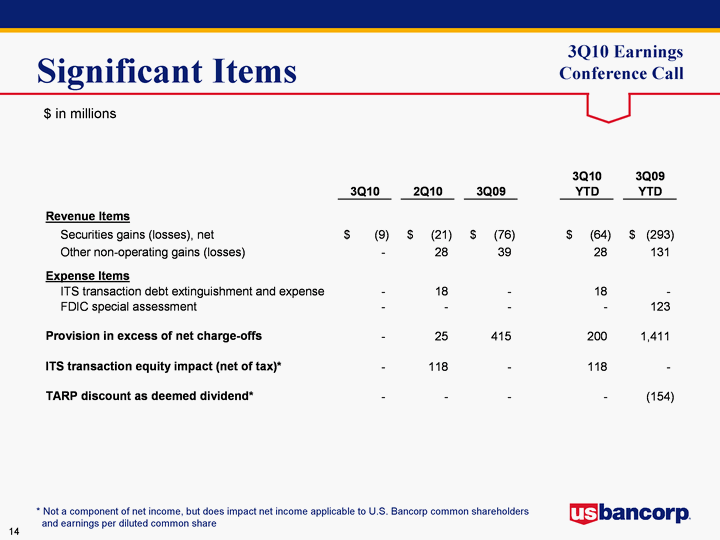
| Significant Items $ in millions * Not a component of net income, but does impact net income applicable to U.S. Bancorp common shareholders and earnings per diluted common share |
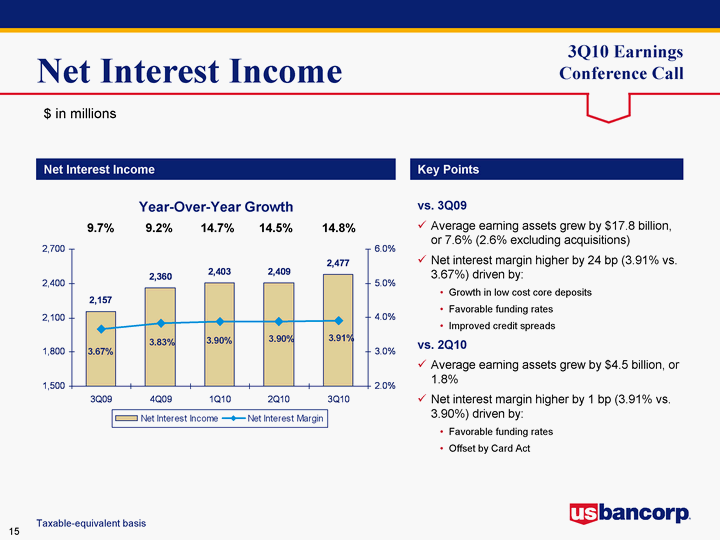
| Net Interest Income 3Q09 4Q09 1Q10 2Q10 3Q10 Net Interest Income 2157 2360 2403 2409 2477 Net Interest Margin 0.0367 0.0383 0.039 0.039 0.0391 Net Interest Income Key Points $ in millions Taxable-equivalent basis vs. 3Q09 Average earning assets grew by $17.8 billion, or 7.6% (2.6% excluding acquisitions) Net interest margin higher by 24 bp (3.91% vs. 3.67%) driven by: Growth in low cost core deposits Favorable funding rates Improved credit spreads vs. 2Q10 Average earning assets grew by $4.5 billion, or 1.8% Net interest margin higher by 1 bp (3.91% vs. 3.90%) driven by: Favorable funding rates Offset by Card Act Year-Over-Year Growth 9.7% 9.2% 14.7% 14.5% 14.8% |
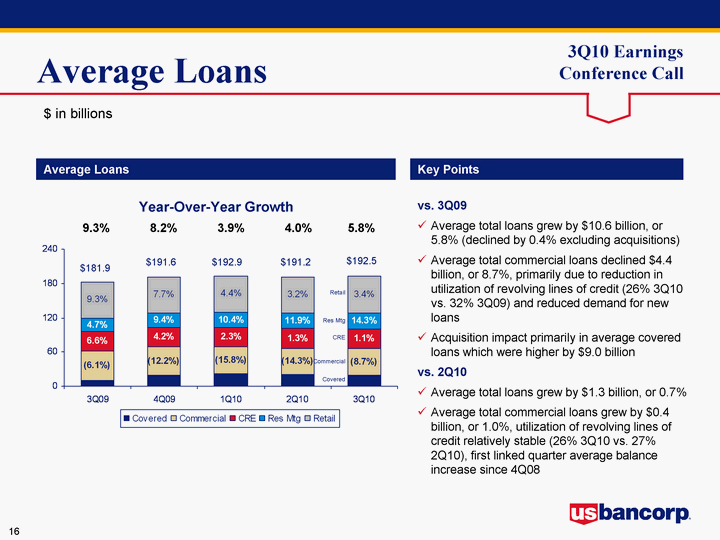
| Average Loans 3Q09 4Q09 1Q10 2Q10 3Q10 Covered 10.288 18.504 21.415 20.454 19.308 Commercial 51.222 49.979 47.282 46.34 46.784 CRE 33.829 34.044 34.151 34.164 34.19 Res Mtg 24.405 25.621 26.408 26.821 27.89 Retail 62.224 63.5 63.622 63.382 64.369 Average Loans Key Points $ in billions Year-Over-Year Growth 9.3% 8.2% 3.9% 4.0% 5.8% $191.2 $192.5 $181.9 $191.6 $192.9 Retail Res Mtg Covered CRE Commercial vs. 3Q09 Average total loans grew by $10.6 billion, or 5.8% (declined by 0.4% excluding acquisitions) Average total commercial loans declined $4.4 billion, or 8.7%, primarily due to reduction in utilization of revolving lines of credit (26% 3Q10 vs. 32% 3Q09) and reduced demand for new loans Acquisition impact primarily in average covered loans which were higher by $9.0 billion vs. 2Q10 Average total loans grew by $1.3 billion, or 0.7% Average total commercial loans grew by $0.4 billion, or 1.0%, utilization of revolving lines of credit relatively stable (26% 3Q10 vs. 27% 2Q10), first linked quarter average balance increase since 4Q08 |
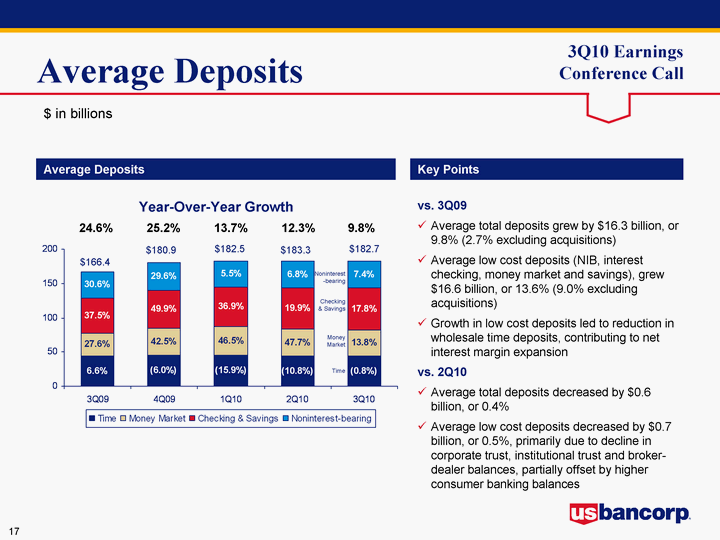
| Average Deposits 3Q09 4Q09 1Q10 2Q10 3Q10 Time 43.951 45.774 45.606 43.607 43.607 Money Market 33.387 38.485 40.902 40.256 38.256 Checking & Savings 52.042 55.64 58.023 59.538 61.316 Noninterest-bearing 36.982 40.99 38 39.917 39.732 Average Deposits Key Points $ in billions Year-Over-Year Growth 24.6% 25.2% 13.7% 12.3% 9.8% $183.3 $182.7 $166.4 $180.9 $182.5 Noninterest -bearing Checking & Savings Time Money Market vs. 3Q09 Average total deposits grew by $16.3 billion, or 9.8% (2.7% excluding acquisitions) Average low cost deposits (NIB, interest checking, money market and savings), grew $16.6 billion, or 13.6% (9.0% excluding acquisitions) Growth in low cost deposits led to reduction in wholesale time deposits, contributing to net interest margin expansion vs. 2Q10 Average total deposits decreased by $0.6 billion, or 0.4% Average low cost deposits decreased by $0.7 billion, or 0.5%, primarily due to decline in corporate trust, institutional trust and broker- dealer balances, partially offset by higher consumer banking balances |
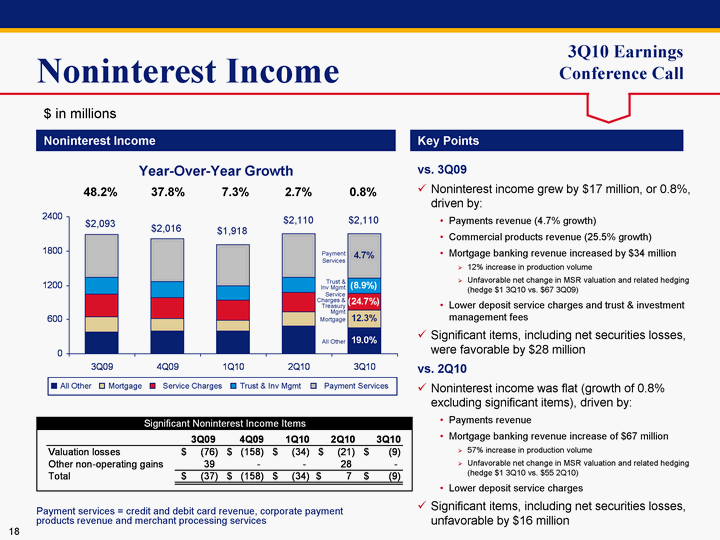
| Noninterest Income 3Q09 4Q09 1Q10 2Q10 3Q10 All Other 379 400 392 492 451 Mortgage 276 218 200 243 310 Service Charges 397 370 344 344 299 Trust & Inv Mgmt 293 277 264 267 267 Payment Services 748 751 718 764 783 Noninterest Income Key Points $ in millions Year-Over-Year Growth 48.2% 37.8% 7.3% 2.7% 0.8% $1,918 $2,110 $2,110 $2,093 $2,016 Trust & Inv Mgmt Service Charges & Treasury Mgmt All Other Mortgage Payment Services Payment services = credit and debit card revenue, corporate payment products revenue and merchant processing services All Other Mortgage Service Charges Trust & Inv Mgmt Payment Services vs. 3Q09 Noninterest income grew by $17 million, or 0.8%, driven by: Payments revenue (4.7% growth) Commercial products revenue (25.5% growth) Mortgage banking revenue increased by $34 million 12% increase in production volume Unfavorable net change in MSR valuation and related hedging (hedge $1 3Q10 vs. $67 3Q09) Lower deposit service charges and trust & investment management fees Significant items, including net securities losses, were favorable by $28 million vs. 2Q10 Noninterest income was flat (growth of 0.8% excluding significant items), driven by: Payments revenue Mortgage banking revenue increase of $67 million 57% increase in production volume Unfavorable net change in MSR valuation and related hedging (hedge $1 3Q10 vs. $55 2Q10) Lower deposit service charges Significant items, including net securities losses, unfavorable by $16 million |
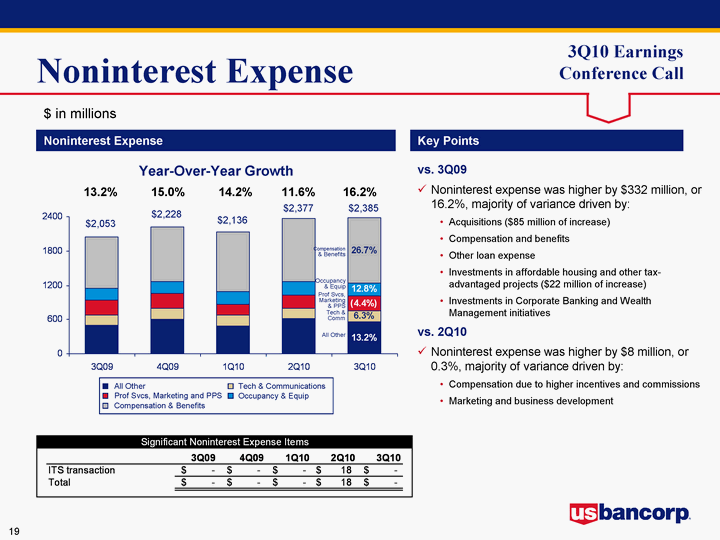
| Noninterest Expense 3Q09 4Q09 1Q10 2Q10 3Q10 All Other 500 611 491 613 566 Tech & Communications 175 186 185 186 186 Prof Svcs, Marketing and PPS 272 256 192 234 260 Occupancy & Equip 203 214 227 226 229 Compensation & Benefits 903 961 1041 1118 1144 Noninterest Expense Key Points $ in millions Year-Over-Year Growth 13.2% 15.0% 14.2% 11.6% 16.2% $2,136 $2,377 $2,385 $2,053 $2,228 Occupancy & Equip Prof Svcs, Marketing & PPS All Other Tech & Comm Compensation & Benefits Occupancy & Equip All Other Tech & Communications Prof Svcs, Marketing and PPS Compensation & Benefits vs. 3Q09 Noninterest expense was higher by $332 million, or 16.2%, majority of variance driven by: Acquisitions ($85 million of increase) Compensation and benefits Other loan expense Investments in affordable housing and other tax- advantaged projects ($22 million of increase) Investments in Corporate Banking and Wealth Management initiatives vs. 2Q10 Noninterest expense was higher by $8 million, or 0.3%, majority of variance driven by: Compensation due to higher incentives and commissions Marketing and business development |
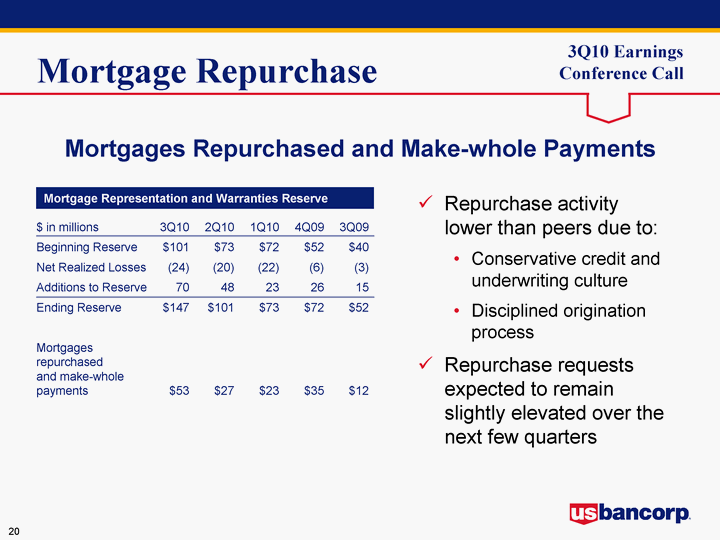
| Mortgage Repurchase Mortgages Repurchased and Make-whole Payments Mortgage Representation and Warranties Reserve $ in millions 3Q10 2Q10 1Q10 4Q09 3Q09 Beginning Reserve $101 $73 $72 $52 $40 Net Realized Losses (24) (20) (22) (6) (3) Additions to Reserve 70 48 23 26 15 Ending Reserve $147 $101 $73 $72 $52 Mortgages repurchased and make-whole payments $53 $27 $23 $35 $12 Repurchase activity lower than peers due to: Conservative credit and underwriting culture Disciplined origination process Repurchase requests expected to remain slightly elevated over the next few quarters |
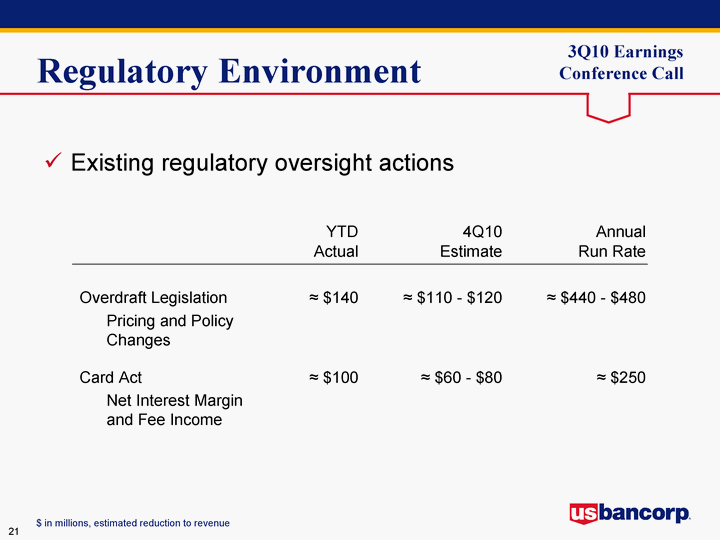
| Regulatory Environment Existing regulatory oversight actions YTD 4Q10 Annual Actual Estimate Run Rate Overdraft Legislation ^ $140 ^ $110 - $120 ^ $440 - $480 Pricing and Policy Changes Card Act ^ $100 ^ $60 - $80 ^ $250 Net Interest Margin and Fee Income $ in millions, estimated reduction to revenue |
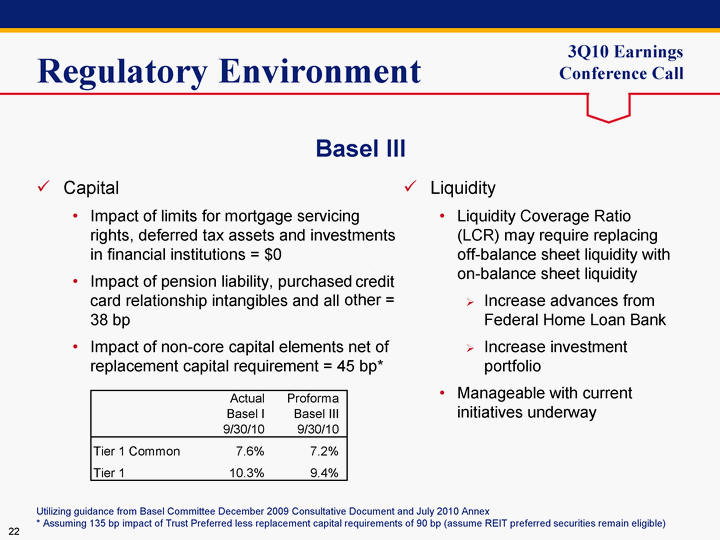
| Regulatory Environment Capital Impact of limits for mortgage servicing rights, deferred tax assets and investments in financial institutions = $0 Impact of pension liability, purchased credit card relationship intangibles and all other = 38 bp Impact of non-core capital elements net of replacement capital requirement = 45 bp* Liquidity Liquidity Coverage Ratio (LCR) may require replacing off-balance sheet liquidity with on-balance sheet liquidity Increase advances from Federal Home Loan Bank Increase investment portfolio Manageable with current initiatives underway Utilizing guidance from Basel Committee December 2009 Consultative Document and July 2010 Annex * Assuming 135 bp impact of Trust Preferred less replacement capital requirements of 90 bp (assume REIT preferred securities remain eligible) Basel III |

| Positioned to Win USB is well-positioned to produce industry-leading performance with... a strong foundation, including excellent credit and risk management, a diversified business mix and prudent capital management a proven track record initiatives to build relevant, profitable scale in each of our business lines investments in new technology to increase revenue, improve efficiency and enhance service strategies to provide the highest quality customer experience and maintain a highly engaged employee base ...creating superior shareholder value |
| Appendix |
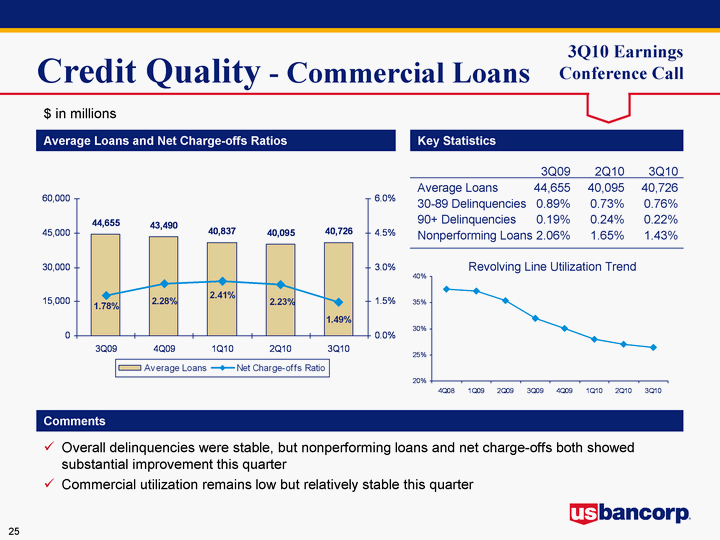
| Credit Quality - Commercial Loans 3Q09 4Q09 1Q10 2Q10 3Q10 Average Loans 44655 43490 40837 40095 40726 Net Charge-offs Ratio 0.0178 0.0228 0.0241 0.0223 0.0149 Average Loans and Net Charge-offs Ratios Key Statistics Comments Overall delinquencies were stable, but nonperforming loans and net charge-offs both showed substantial improvement this quarter Commercial utilization remains low but relatively stable this quarter 3Q09 2Q10 3Q10 Average Loans 44,655 40,095 40,726 30-89 Delinquencies 0.89% 0.73% 0.76% 90+ Delinquencies 0.19% 0.24% 0.22% Nonperforming Loans 2.06% 1.65% 1.43% 4Q08 1Q09 2Q09 3Q09 4Q09 1Q10 2Q10 3Q10 Utilization 0.3762 0.3716 0.3538 0.3197 0.3007 0.2798 0.27 0.2646 Revolving Line Utilization Trend $ in millions |
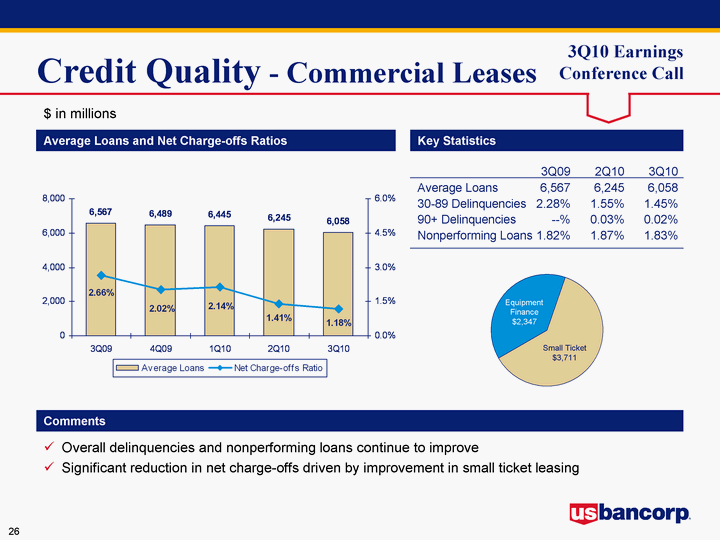
| EF ST Balance 2347 3711 Credit Quality - Commercial Leases 3Q09 4Q09 1Q10 2Q10 3Q10 Average Loans 6567 6489 6445 6245 6058 Net Charge-offs Ratio 0.0266 0.0202 0.0214 0.0141 0.0118 Average Loans and Net Charge-offs Ratios Key Statistics Comments Overall delinquencies and nonperforming loans continue to improve Significant reduction in net charge-offs driven by improvement in small ticket leasing 3Q09 2Q10 3Q10 Average Loans 6,567 6,245 6,058 30-89 Delinquencies 2.28% 1.55% 1.45% 90+ Delinquencies --% 0.03% 0.02% Nonperforming Loans 1.82% 1.87% 1.83% $ in millions Equipment Finance $2,347 Small Ticket $3,711 |
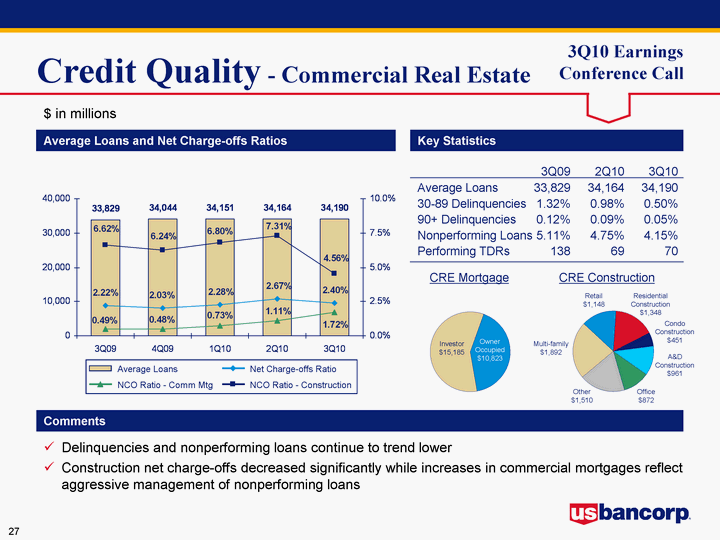
| Multi-Family Retail Res Construction Condo Construction A&D Commercial Office Other balance 1892 1148 1348 451 961 872 1510 Inv Owner balance 15185 10823 Credit Quality - Commercial Real Estate 3Q09 4Q09 1Q10 2Q10 3Q10 Avg Loans 33829 34044 34151 34164 34190 NCO Ratio 0.0222 0.0203 0.0228 0.0267 0.024 NCO Ratio - Mtg 0.0049 0.0048 0.0073 0.0111 0.0172 NCO Ratio - Construction 0.0662 0.0624 0.068 0.0731 0.0456 Average Loans and Net Charge-offs Ratios Key Statistics Comments Delinquencies and nonperforming loans continue to trend lower Construction net charge-offs decreased significantly while increases in commercial mortgages reflect aggressive management of nonperforming loans 3Q09 2Q10 3Q10 Average Loans 33,829 34,164 34,190 30-89 Delinquencies 1.32% 0.98% 0.50% 90+ Delinquencies 0.12% 0.09% 0.05% Nonperforming Loans 5.11% 4.75% 4.15% Performing TDRs 138 69 70 $ in millions Multi-family $1,892 Other $1,510 Office $872 A&D Construction $961 Retail $1,148 Condo Construction $451 Residential Construction $1,348 Investor $15,185 Owner Occupied $10,823 CRE Mortgage CRE Construction Average Loans Net Charge-offs Ratio NCO Ratio - Comm Mtg NCO Ratio - Construction |
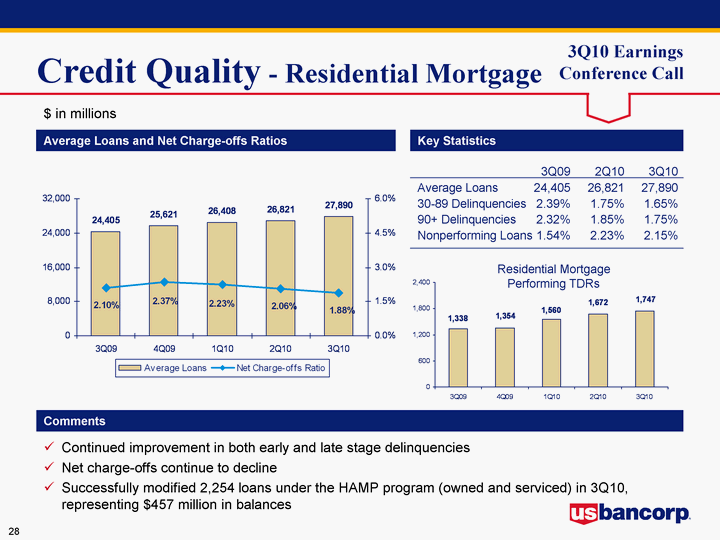
| 3Q09 4Q09 1Q10 2Q10 3Q10 Restructured 1338 1354 1560 1672 1747 Credit Quality - Residential Mortgage 3Q09 4Q09 1Q10 2Q10 3Q10 Average Loans 24405 25621 26408 26821 27890 Net Charge-offs Ratio 0.021 0.0237 0.0223 0.0206 0.0188 Average Loans and Net Charge-offs Ratios Key Statistics Comments Continued improvement in both early and late stage delinquencies Net charge-offs continue to decline Successfully modified 2,254 loans under the HAMP program (owned and serviced) in 3Q10, representing $457 million in balances 3Q09 2Q10 3Q10 Average Loans 24,405 26,821 27,890 30-89 Delinquencies 2.39% 1.75% 1.65% 90+ Delinquencies 2.32% 1.85% 1.75% Nonperforming Loans 1.54% 2.23% 2.15% Residential Mortgage Performing TDRs $ in millions |
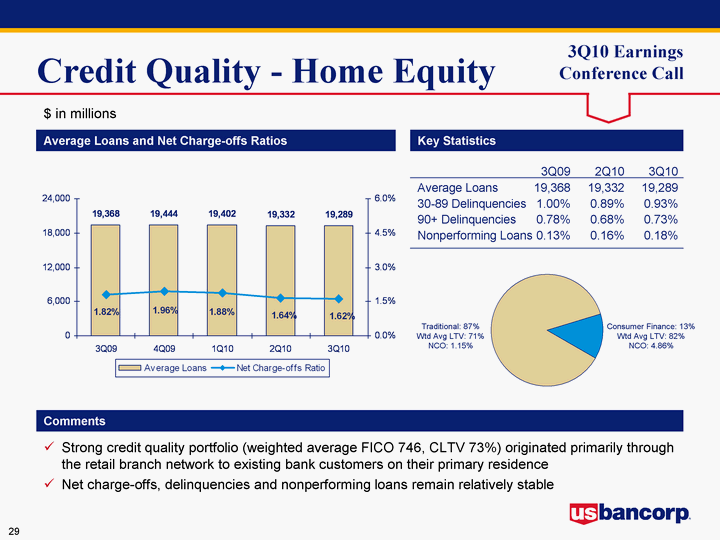
| Credit Quality - Home Equity 3Q09 4Q09 1Q10 2Q10 3Q10 Average Loans 19368 19444 19402 19332 19289 Net Charge-offs Ratio 0.0182 0.0196 0.0188 0.0164 0.0162 Average Loans and Net Charge-offs Ratios Key Statistics Comments Strong credit quality portfolio (weighted average FICO 746, CLTV 73%) originated primarily through the retail branch network to existing bank customers on their primary residence Net charge-offs, delinquencies and nonperforming loans remain relatively stable 3Q09 2Q10 3Q10 Average Loans 19,368 19,332 19,289 30-89 Delinquencies 1.00% 0.89% 0.93% 90+ Delinquencies 0.78% 0.68% 0.73% Nonperforming Loans 0.13% 0.16% 0.18% Traditional: 87% Wtd Avg LTV: 71% NCO: 1.15% Consumer Finance: 13% Wtd Avg LTV: 82% NCO: 4.86% $ in millions Traditional Consumer Finance Balance 87 13 |
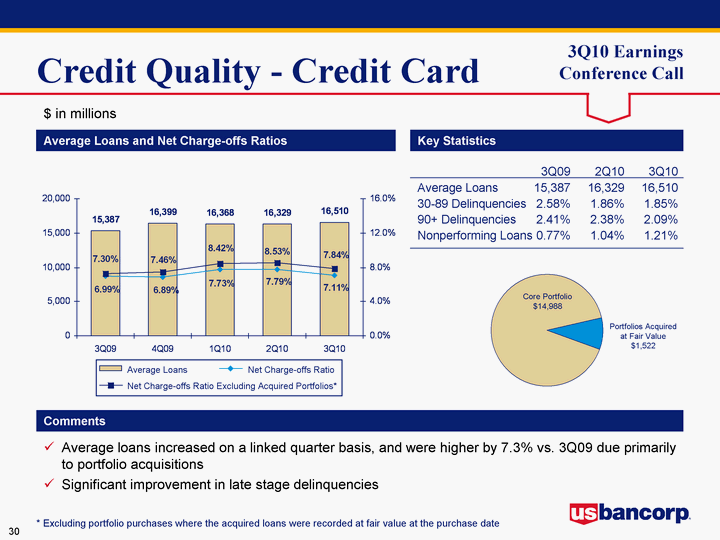
| Traditional Consumer Finance Balance 14988 1522 3Q09 2Q10 3Q10 Average Loans 15,387 16,329 16,510 30-89 Delinquencies 2.58% 1.86% 1.85% 90+ Delinquencies 2.41% 2.38% 2.09% Nonperforming Loans 0.77% 1.04% 1.21% Credit Quality - Credit Card 3Q09 4Q09 1Q10 2Q10 3Q10 Average Loans 15387 16399 16368 16329 16510 Net Charge-offs Ratio 0.0699 0.0689 0.0773 0.0779 0.0711 Net Charge-offs Ratio Excluding Acquired Portfolios* 0.073 0.0746 0.0842 0.0853 0.0784 Average Loans and Net Charge-offs Ratios Key Statistics Comments Average loans increased on a linked quarter basis, and were higher by 7.3% vs. 3Q09 due primarily to portfolio acquisitions Significant improvement in late stage delinquencies $ in millions * Excluding portfolio purchases where the acquired loans were recorded at fair value at the purchase date 2Q09 Average Loans Net Charge-offs Ratio Net Charge-offs Ratio Excluding Acquired Portfolios* Core Portfolio $14,988 Portfolios Acquired at Fair Value $1,522 |
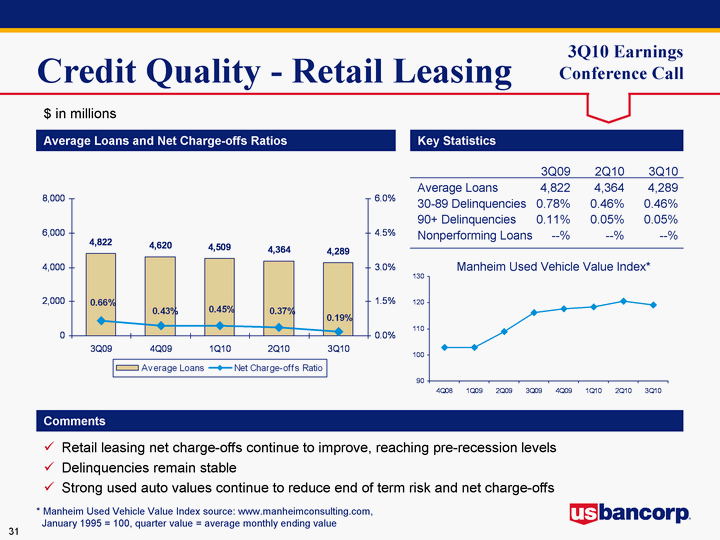
| Credit Quality - Retail Leasing 3Q09 4Q09 1Q10 2Q10 3Q10 Average Loans 4822 4620 4509 4364 4289 Net Charge-offs Ratio 0.0066 0.0043 0.0045 0.0037 0.0019 Average Loans and Net Charge-offs Ratios Key Statistics Comments Retail leasing net charge-offs continue to improve, reaching pre-recession levels Delinquencies remain stable Strong used auto values continue to reduce end of term risk and net charge-offs 3Q09 2Q10 3Q10 Average Loans 4,822 4,364 4,289 30-89 Delinquencies 0.78% 0.46% 0.46% 90+ Delinquencies 0.11% 0.05% 0.05% Nonperforming Loans --% --% --% $ in millions 4Q08 1Q09 2Q09 3Q09 4Q09 1Q10 2Q10 3Q10 Index 102.8 102.8 109 116.1 117.7 118.3 120.5 119.2 Manheim Used Vehicle Value Index* * Manheim Used Vehicle Value Index source: www.manheimconsulting.com, January 1995 = 100, quarter value = average monthly ending value |
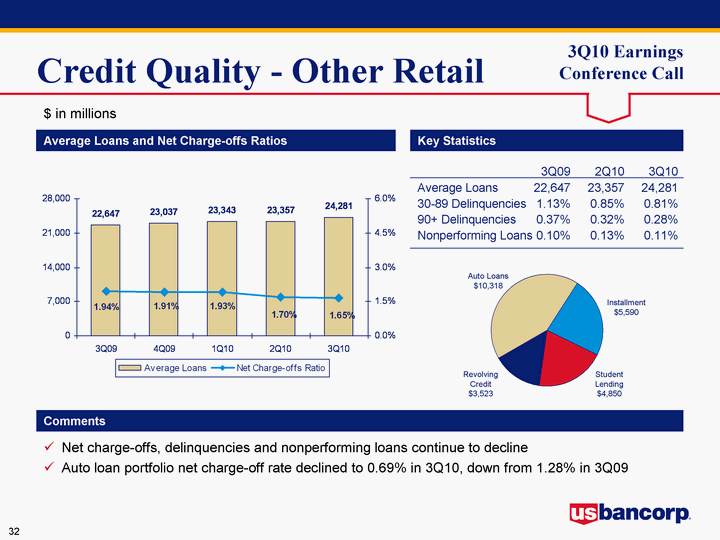
| Auto Install Studend Revolving Balance 10318 5590 4850 3523 Credit Quality - Other Retail 3Q09 4Q09 1Q10 2Q10 3Q10 Average Loans 22647 23037 23343 23357 24281 Net Charge-offs Ratio 0.0194 0.0191 0.0193 0.017 0.0165 Average Loans and Net Charge-offs Ratios Key Statistics Comments Net charge-offs, delinquencies and nonperforming loans continue to decline Auto loan portfolio net charge-off rate declined to 0.69% in 3Q10, down from 1.28% in 3Q09 3Q09 2Q10 3Q10 Average Loans 22,647 23,357 24,281 30-89 Delinquencies 1.13% 0.85% 0.81% 90+ Delinquencies 0.37% 0.32% 0.28% Nonperforming Loans 0.10% 0.13% 0.11% Installment $5,590 Auto Loans $10,318 Revolving Credit $3,523 Student Lending $4,850 $ in millions |
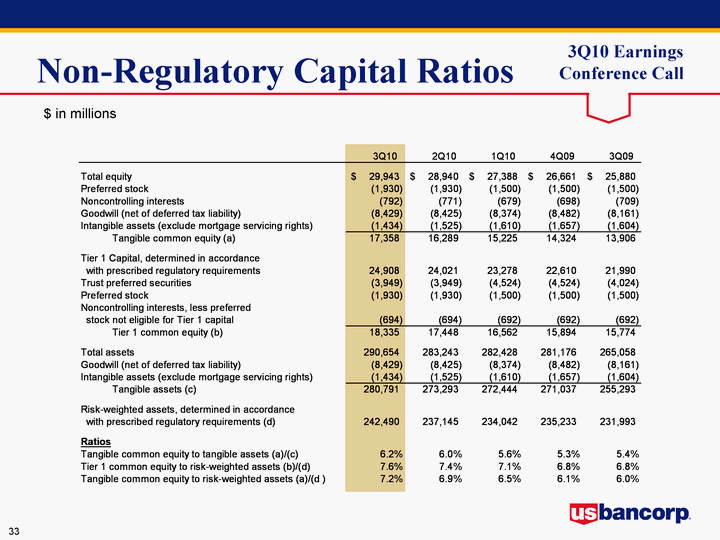
| Non-Regulatory Capital Ratios $ in millions |

| U.S. Bancorp 3Q10 Earnings Conference Call October 20, 2010 |
