Attached files
| file | filename |
|---|---|
| 8-K - FORM 8-K 8/25/10 - KITE REALTY GROUP TRUST | form8k_82510.htm |

Kite Realty Group Trust
Investor Presentation
Information as of June 30, 2010
Investor Presentation
Information as of June 30, 2010

2
|
§ Stable Operating Portfolio
|
§ 55 Operating Properties in 9 states
§ Retail Operating Portfolio 91% leased - 100 basis point increase from Q1
§ Diverse tenant base: Largest tenant represents only 3.3% of annualized base rent
§ 5 mile demographics: Population 120,000; Average HHI $83,000
|
|
§ Increased Leasing
Productivity
|
§ 562,000 square feet of leasing production during 1H 2010
§ 325,000 square feet of new and renewal leases in various stages of negotiation
§ On pace for approximately 1 million square feet in 2010 - highest level in company history
§ 21 new and renewal anchor leases for 770,000 square feet completed since Q1 2009
|
|
§ Proven Debt Management
|
§ No remaining 2010 debt maturities
§ $170 million of property refinancings and extensions since early 2009
§ Of the 2011 maturities, only 2 are CMBS loans totaling $20 million
§ 82% of maturities through 2012 held by relationship lenders
|
|
§ NOI Upside
|
§ Two in-process developments - Eddy Street Commons & Cobblestone Plaza
- Percent leased increased 6.6% quarter over quarter to 81% leased
- Currently only 43% occupied
§ Additional $3.5 million of annualized rent from executed anchor tenant leases at operating
and redevelopment properties anticipated to commence over the next 12-18 months
|
Information as of June 30, 2010
COMPANY OVERVIEW

3
§ Rent commencement on executed Jr anchor leases
§ $3.5 million in annualized rent anticipated to commence over the next 12-18 months
§ Jr anchor leases in negotiation
§ Increase small shop occupancy
§ From current 76% to historical 80-85%
§ Execute on redevelopments
§ Leasing nearly complete at 3 of 5 redevelopments
§ Complete current developments
§ 81% leased but only 43% occupied
§ Future development potential
GROWTH SOURCES
4
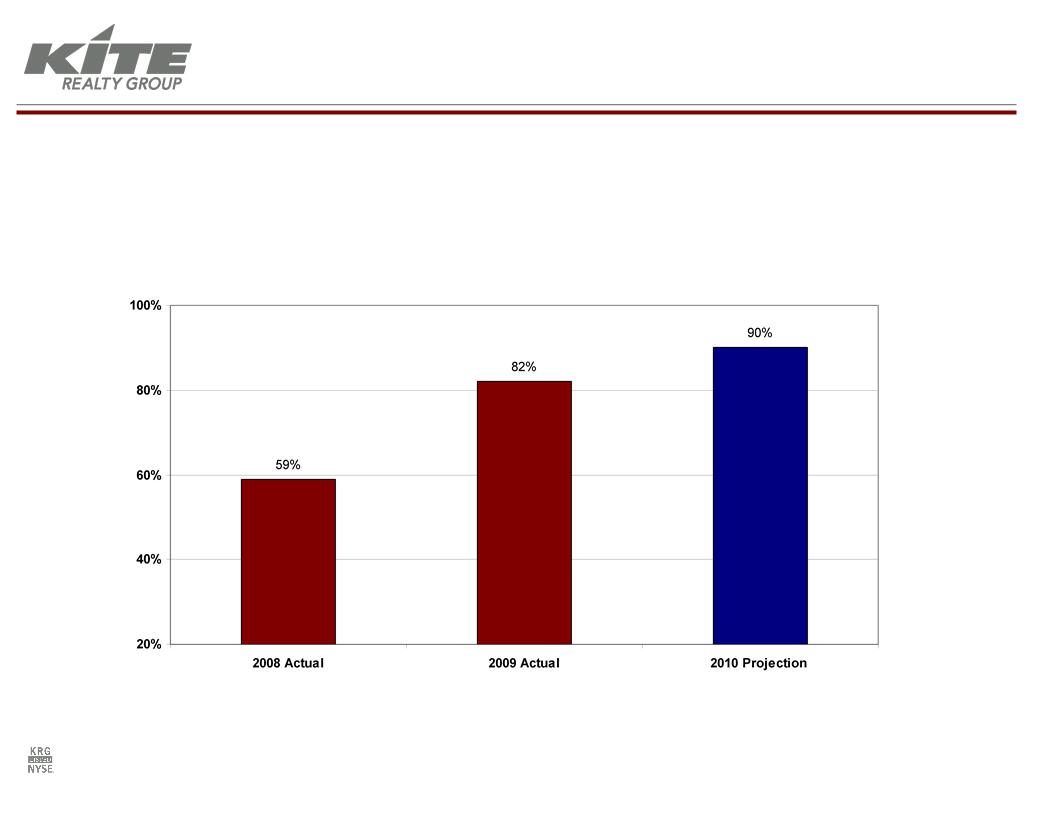
§ We have been successful in improving the quality and predictability of our
FFO stream.
FFO stream.
Real Estate Rental Operations as a Percent of FFO
(1) 2010 projection is based on the Company’s previously released earnings guidance.
(1)
IMPROVING FFO QUALITY
5
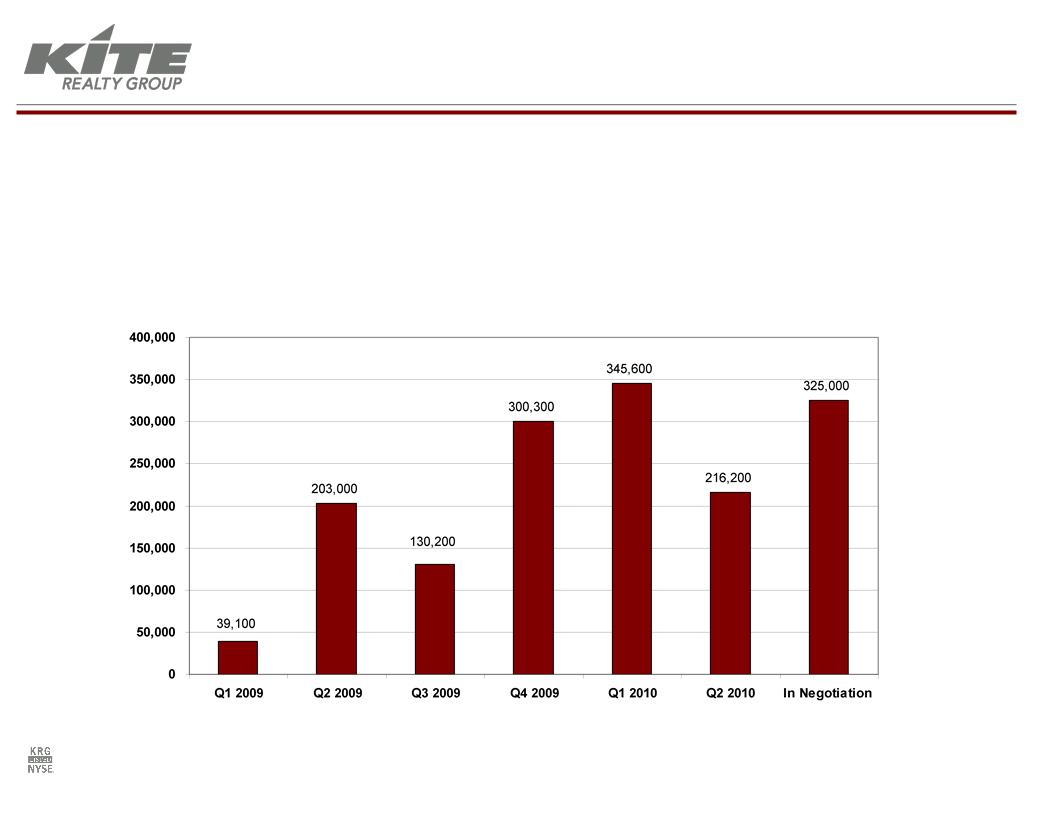
§ Improved leasing production has become a company-wide focus
§ We are on pace to achieve approximately 1 million square feet of production for 2010, the
highest level in company history
highest level in company history
§ 21 new and renewal anchor leases for 770,000 square feet completed over the last 5 quarters
Total Leasing Production - New and Renewal Leases
(1) Currently negotiating 325,000 square feet of new and renewal leases as stated in the Company’s Q2 2010 earnings press release.
(1)
LEASING PRODUCTION
6
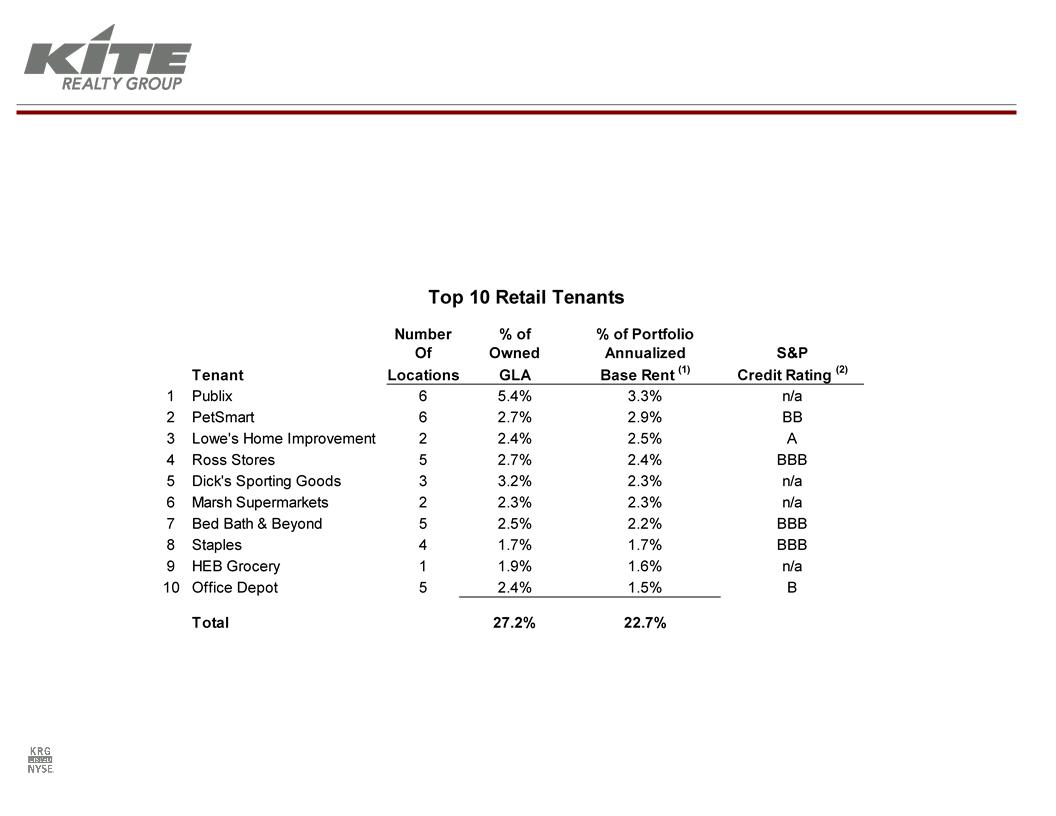
(1) Annualized base rent represents the monthly contractual rent for June 2010 for each applicable tenant multiplied by 12.
(2) S&P credit ratings for parent company as of 8/16/10.
§ Largest single retail tenant comprises only 3.3% of total annualized base rent
§ Top 10 retail tenants account for only 22.7% of total annualized base rent
Information as of June 30, 2010
(unless otherwise noted)
DIVERSE TENANT BASE
7
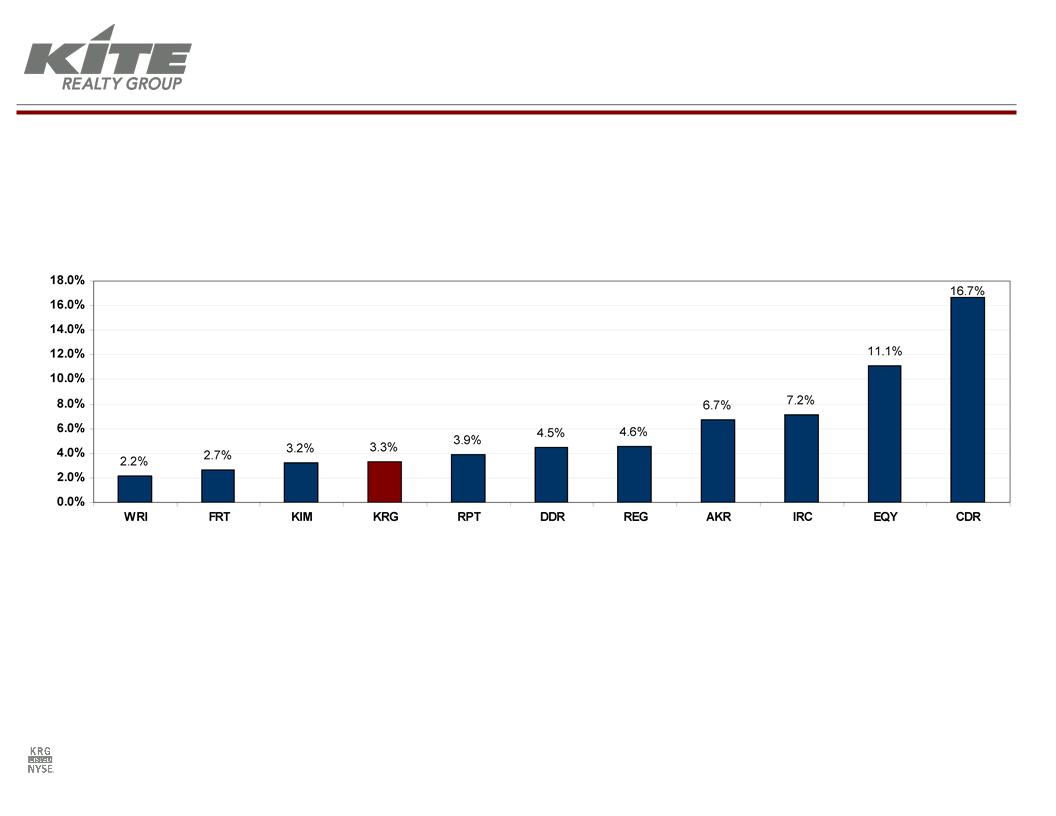
Peer Group Assessment:
Top Tenant as a Percent of Annualized Base Rent
|
Kroger
|
Bed Bath
Beyond |
Home
Depot |
Publix
|
TJ Maxx
|
Wal-Mart/
Sam’s |
Kroger
|
A&P
|
Supervalu
|
Publix
|
Giant
Foods |
Source: Company SEC filings.
Information as of June 30, 2010
DIVERSE TENANT BASE
8
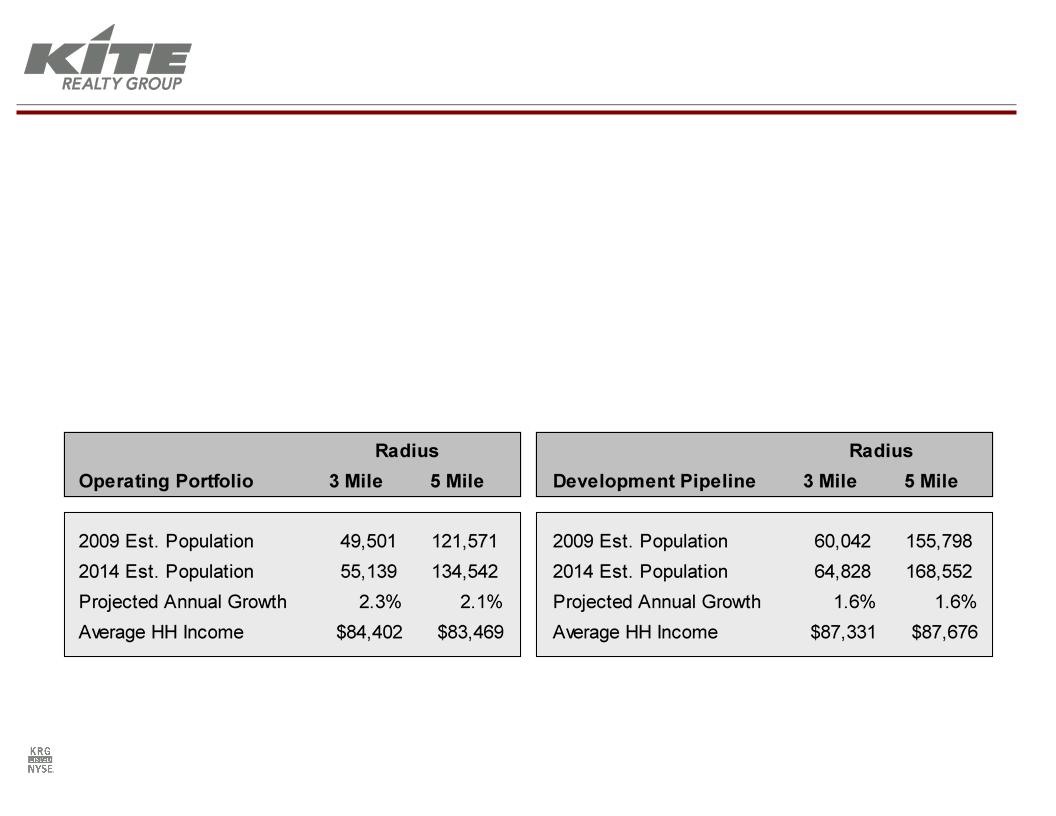
Source: Applied Geographic Solutions.
§ High quality assets with an average age of only eight years
§ Approximately half of the current portfolio was developed by KRG
§ Portfolio benefits from 100% non-owned anchor occupancy
§ Strong household incomes surrounding operating portfolio and development pipelines
Portfolio Demographics Comparison
Operating Portfolio vs. Development Pipelines
STRONG DEMOGRAPHICS
9
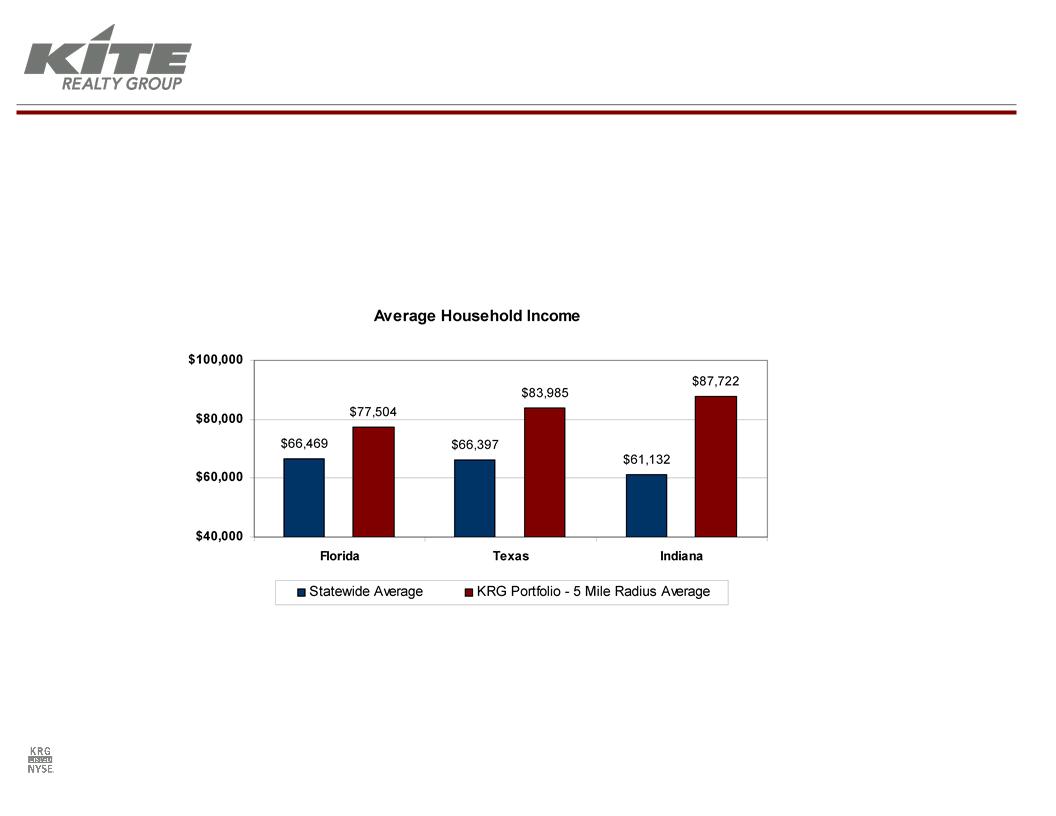
Source: Applied Geographic Solutions.
§ We have a history of selecting strong submarkets for investment
§ Our Florida, Texas and Indiana portfolio incomes are significantly higher than
statewide levels
statewide levels
STRONG DEMOGRAPHICS
10
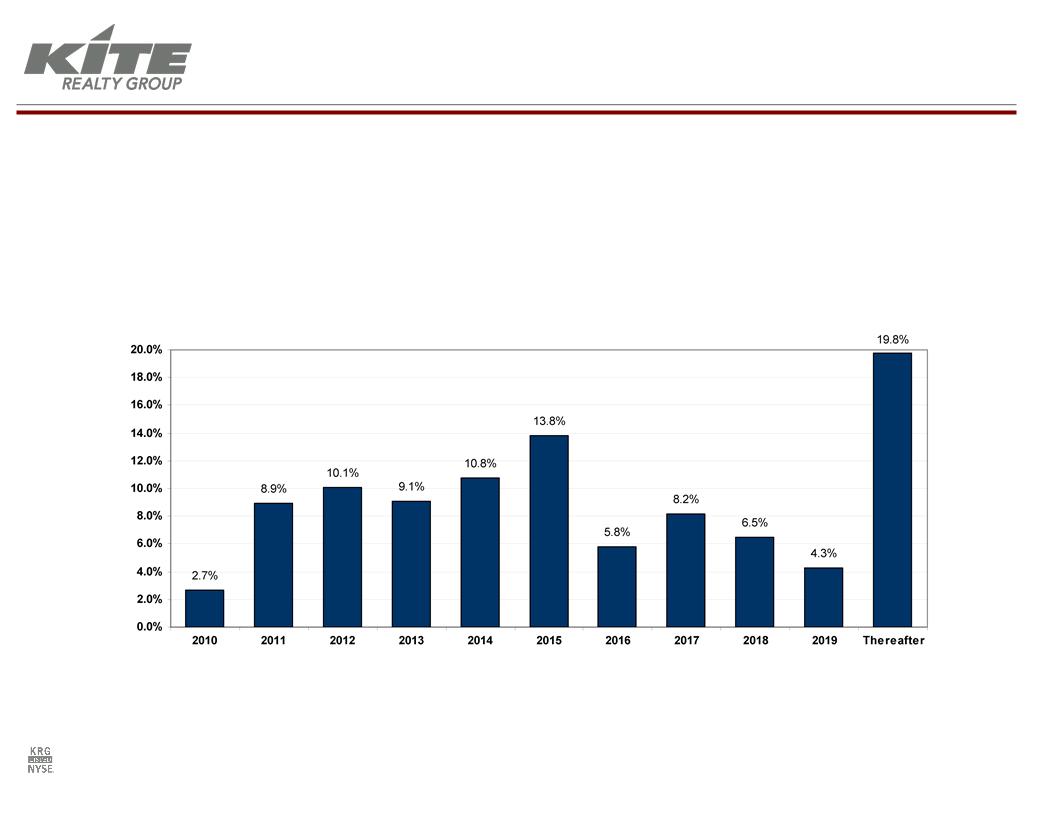
(1) Lease expirations of operating portfolio and excludes option periods and ground leases. Annualized base rent represents the monthly contractual rent
for June 2010 for each applicable property multiplied by 12.
for June 2010 for each applicable property multiplied by 12.
§ Average 8.6% of total annualized rent is expected to roll each year from 2011
through 2019
through 2019
§ Higher 2012-2015 rollover defers renewal negotiations to a potentially stronger
leasing environment
leasing environment
Percentage of Lease Expiration by Total Annualized Base Rent (1)
Information as of June 30, 2010
WELL-STAGGERED LEASE EXPIRATIONS

11
§ Eddy Street Commons at Notre Dame
§ 85% pre-leased or committed
§ 97% of projected costs incurred
In-Process Developments
§ Capital Summary (Dollars in thousands)
§ Eddy Street Estimated Project Costs: $35,000
§ Cobblestone Plaza Estimated Project Costs: $52,000
§ Total Cost Incurred as of 6/30/10: ($80,794)
§ Remaining Cost to be Spent: $ 6,206
§ Cobblestone Plaza, Ft. Lauderdale, FL
§ 77% pre-leased or committed with Whole Foods executed lease
§ 90% of projected costs incurred
Information as of June 30, 2010
DEVELOPMENT STATUS
12
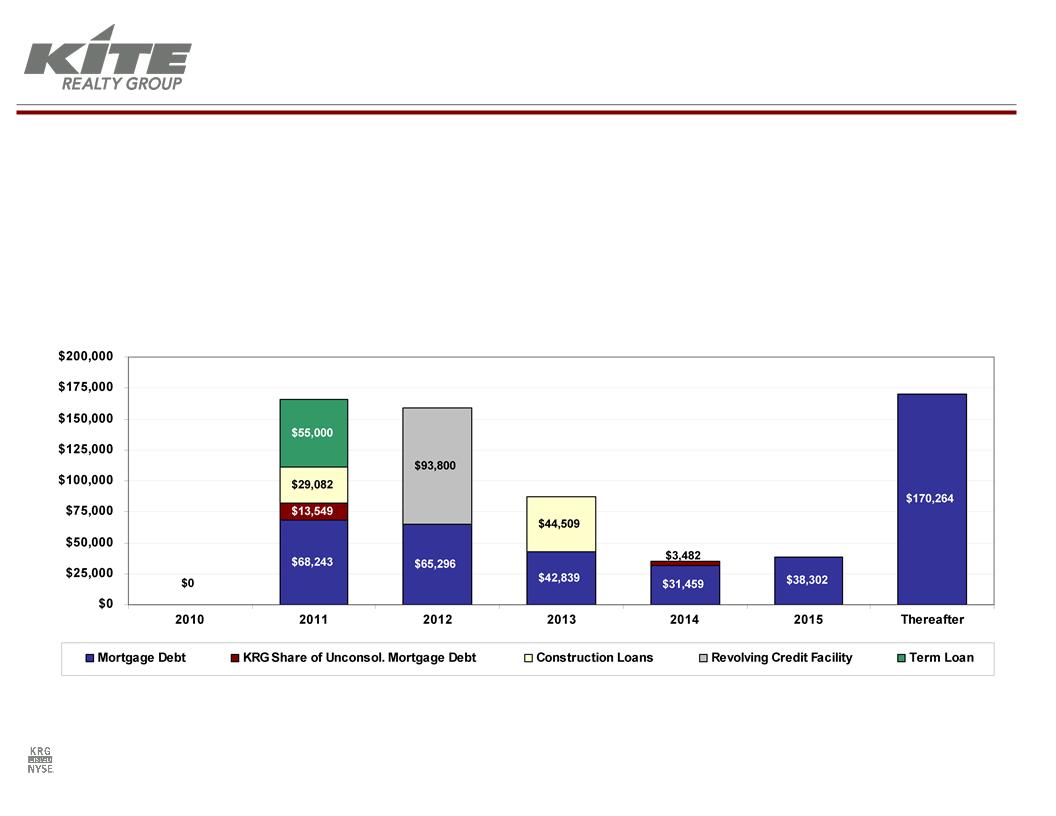
Scheduled Debt Maturities (1)(2)(3)
(1) Dollars in thousands..
(2) Maturities exclude annual principal amortization.
(3) Amount due in 2012 includes the outstanding balance on our unsecured revolving credit facility, and assumes exercise of available extension option.
§ Extended or refinanced all 2010 debt maturities by February 2010
§ 2011 maturities are in process:
§ Only 2 CMBS loans totaling $20 million
§ 5 of 7 property loans held on balance sheet were underwritten with more stringent 2008-09 standards
§ Approximately 83% of debt maturities through 2012 are held on balance sheet by relationship banks including
unsecured term loan
unsecured term loan
MANAGING LEVERAGE
13
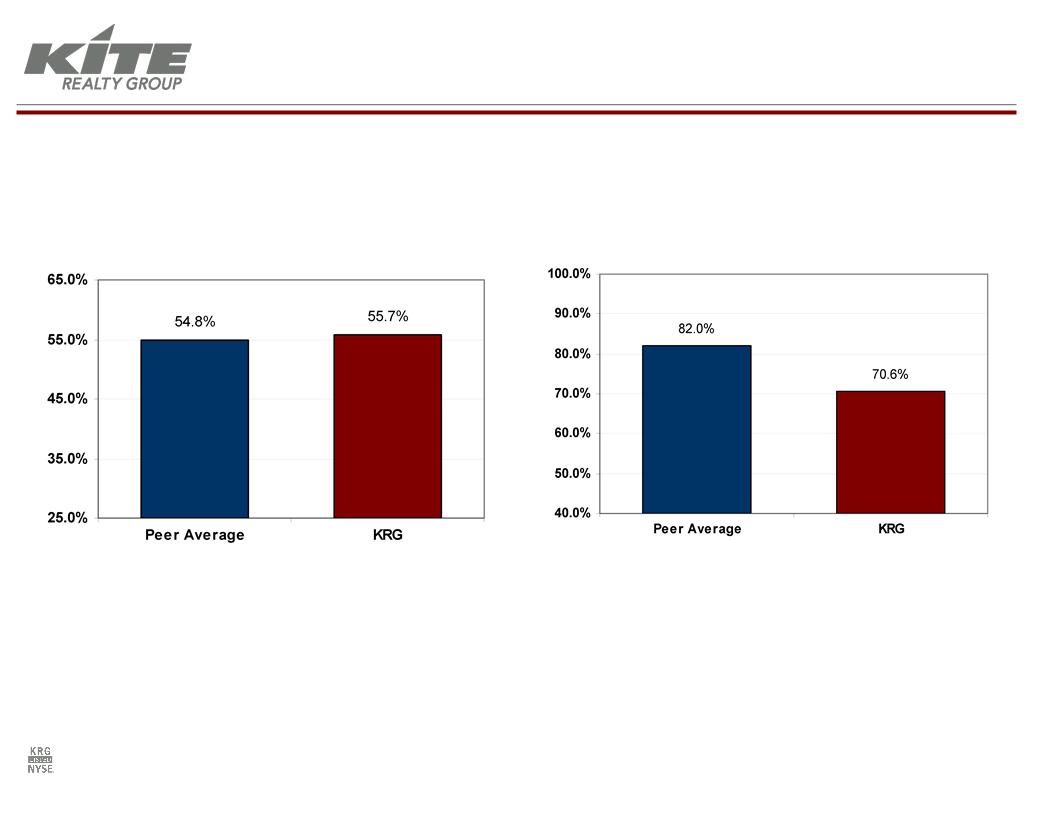
Debt Plus Preferred as a Percent of Gross Assets(1)(2)
2010 Estimated AFFO Payout Ratio (2)(3)
(1) Source: Company filings. Calculation: (Consolidated Debt + Preferreds) / Gross Real Estate Assets
(2) Peer Group: AKR, CDR, DDR, EQY, FRT, IRC, KIM, REG, RPT, WRI
(3) Source: SNL Financial. Based on most recently announced quarterly dividend annualized
PEER GROUP ANALYSIS

14
DISCLAIMER
This presentation contains certain statements that are not historical fact and may constitute forward-looking
statements within the meaning of the Private Securities Litigation Reform Act of 1995. Such forward-
looking statements involve known and unknown risks, uncertainties and other factors which may cause the
actual results of the Company to differ materially from historical results or from any results expressed or
implied by such forward-looking statements, including, without limitation: national and local economic,
business, real estate and other market conditions, particularly in light of the current challenging economic
conditions; financing risks, including the availability of and costs associated with sources of liquidity; the
Company’s ability to refinance, or extend the maturity dates of, its indebtedness; the level and volatility of
interest rates; the financial stability of tenants, including their ability to pay rent and the risk of tenant
bankruptcies; the competitive environment in which the Company operates; acquisition, disposition,
development and joint venture risks; property ownership and management risks; the Company’s ability to
maintain its status as a real estate investment trust (“REIT”) for federal income tax purposes; potential
environmental and other liabilities; impairment in the value of real estate property the Company owns; risks
related to the geographical concentration of our properties in Indiana, Florida and Texas; assumptions
underlying our anticipated growth sources; and other factors affecting the real estate industry generally.
The Company refers you the documents filed by the Company from time to time with the Securities and
Exchange Commission, specifically the section titled “Business Risk Factors” in the Company’s Annual
Report on Form 10-K for the year ended December 31, 2009, which discuss these and other factors that
could adversely affect the Company’s results. The Company undertakes no obligation to publicly update
or revise these forward-looking statements (including the FFO and net income estimates), whether as a
result of new information, future events or otherwise.