Attached files
| file | filename |
|---|---|
| 8-K - 8-K - W R GRACE & CO | a10-15051_18k.htm |
Exhibit 99.1
|
|
Slide3_M.jpgSlide5.jpg4x6_Grace_Lock-up_RGB.jpg Slide38Slide25g.jpgSlideExtra7.jpgW. R. Grace & Co. Investment Highlights August 3, 2010 |
|
|
2 © 2010 W. R. Grace & Co.Disclaimer Safe Harbor Statement under the Private Securities Litigation Reform Act of 1995 This presentation contains forward-looking statements, that is, statements related to future, not past, events. Such statements generally include the words “believes,” “plans,” “intends,” “targets,” “will,” “expects,” “anticipates,” “continues” or similar expressions. Forward-looking statements include, without limitation, all statements regarding Grace’s Chapter 11 case; expected financial positions; results of operations; cash flows; financing plans; business strategy; budgets; capital and other expenditures; competitive positions; growth opportunities for existing products; benefits from new technology and cost reduction initiatives and plans and objectives. For these statements, Grace claims the protection of the safe harbor for forward-looking statements contained in the Private Securities Litigation Reform Act of 1995. Like other businesses, Grace is subject to risks and uncertainties that could cause its actual results to differ materially from its projections or that could cause other forward-looking information to prove incorrect. Factors that could cause actual results to materially differ from those contained in the forward-looking statements include, without limitation: developments affecting Grace’s bankruptcy, proposed plan of reorganization and settlements with certain creditors, the cost and availability of raw materials and energy, developments affecting Grace’s unfunded pension obligations, risks related to foreign operations, especially in emerging regions, the effectiveness of research and development and growth investments, Grace’s legal and environmental proceedings, costs of compliance with environmental regulation and those factors set forth in Grace’s most recent Annual Report on Form 10-K, quarterly report on Form 10-Q and current reports on Form 8-K, which have been filed with the Securities and Exchange Commission and are readily available on the Internet at www.sec.gov. Reported results should not be considered as an indication of future performance. Readers are cautioned not to place undue reliance on projections and forward-looking statements, which speak only as of the date thereof. Grace undertakes no obligation to publicly release any revisions to the forward-looking statements contained in this presentation, or to update them to reflect events or circumstances occurring after the date of this presentation. Non-GAAP Financial Terms These slides contain certain “non-GAAP financial terms” which are defined in the Appendix. Reconciliations of non-GAAP terms to the closest GAAP term (i.e., net income) are provided in the Appendix. |
|
|
3 © 2010 W. R. Grace & Co. LOGO_VERTICAL_Grace_Lock-up_RGB.jpgCorpProfile_01.jpgCorpProfile_01.jpgGrace Corporate Profile Grace Fast Facts (NYSE: GRA) .2009 sales of $2,825 million .True specialty chemicals business .High value, high margin product portfolio .Four very strong franchises in large global markets .Global leadership position .#1 in FCC catalysts .#1 in resid hydroprocessing catalysts .#1 in independent polyethylene catalysts .#1 in micronized silica gel and can sealants .#1 in cement additives .#2 in concrete admixtures .Operations in over 40 countries 2009 Grace Sales 2009 Grace Sales by Region Construction Products 32% RefiningTechnologies 35% MaterialsTechnologies 21% SpecialtyTechnologies 12% Latin America 9% North America 34% Europe, Middle East & Africa 39% Asia Pacific 18% |
|
|
4 © 2010 W. R. Grace & Co. LOGO_VERTICAL_Grace_Lock-up_RGB.jpgPerfromance_06.jpgGrace Adjusted EBIT* Financial Performance RecordGrace Adjusted EBIT Return On Invested Capital* Grace Sales Adjusted Operating Cash Flow* *Definitions of non-GAAP financial terms and reconciliations to the closest GAAP term are provided in the Appendix. CAGR 2005-08 = 8.9% 2009-10 = 1-3% ex ART CAGR 2005-08 = 14.8% 2009-10 = 31-38% CAGR 2005-09 = 23.2% |
|
|
5 © 2010 W. R. Grace & Co. LOGO_VERTICAL_Grace_Lock-up_RGB.jpg20% Adjusted EBITDA Margin Target .Sustainable gross profit margins .Operating leverage and productivity .Adjusted EBITDA margins up 300-340 bps since 2007 High ROIC / Strong Cash Flow .Lean working capital investment .Operating flexibility and efficiency .ROIC a priority 8-10% Sales Growth CAGR Target .Strong global secular growth trends .Global footprint with emerging regions focus .Manufacturing .Technology .Commercial .Acquisitions and alliances Strong Core Competencies Drive Long-Term Performance Materials Science ExpertiseIntegrated across businesses and geographies Customer Focus Deeply integrated into customers’ products and processes Innovation Long history of innovation and industry leadership |
|
|
6 © 2010 W. R. Grace & Co. LOGO_VERTICAL_Grace_Lock-up_RGB.jpg Sales Growth Driven by Long-Term Global Trends Sources: IMF, Euromonitor, IHS Global Insight, Global Construction Outlook, Goldman Sachs Global Economics Paper No. 170, Grace internal estimates.Middle class growing more than 70 million people per year.Per capita disposable income in Asia growing 4x the rate in advanced economies.Plastics use in emerging regions less than 20% of that in advanced economies.Packaging demand in emerging regions expected to grow 2-4x faster than in advanced economies.Urban population increased 800 million in the last 10 years.More sophisticated building techniques used to build safer, more durable properties.Growing more than 2.5x advanced economies.Shift in manufacturing and refining capacity.100% of new refineries planned through 2015.More than 90% of new polyolefin capacity through 2014.Heavier refining feedstocks growing 4.9% per year.Increasing from 37% to 45% of global construction spending by 2020 Rapid development in emerging regions Improving living standards Urbanization |
|
|
7 © 2010 W. R. Grace & Co. LOGO_VERTICAL_Grace_Lock-up_RGB.jpgWorldSales_02.jpg Global Footprint With Emerging Regions Focus Emerging Regions Footprint .33 manufacturing plants .5 technology centers .Sales and technical support Current Investments .Polypropylene catalyst capacity for the Middle East .Construction Products joint venture in Kingdom of Saudi Arabia .Construction Products investment in Brazil .Eleven new construction chemicals plants planned through 2011Global Sourcing of Raw Materials Q2 2010 Grace Sales Investing to grow in emerging regions United States 29% Other Advanced Economies 38% Emerging Regions 33% CAGR2005-2010 = 12% Emerging Regions Contribution to Grace Sales_04.jpg |

|
|
8 © 2010 W. R. Grace & Co. LOGO_VERTICAL_Grace_Lock-up_RGB.jpgv 2007 -20082009 -20102011 -2013 Fast response to market changes Margin expansion through downturn Positioned for long-term margin growth Adjusted EBITDA Margin: 20% Target by 2013Adjusted EBITDA Margin13% 2007 Adjusted EBITDA Margin20% 2013 Adjusted EBITDA Margin Target •Aggressive cost containment actions •Six Sigma approach enabled focus and speed •Cyclical resiliency •More high value products and technologies •Lean manufacturing focused on higher margin products •Ongoing productivity initiatives •Highly valued products; better pricing •Improved operating leverage •Global sourcing capabilities 16.0-16.4% 2010 Adjusted EBITDA Margin Outlook
|
|
|
9 © 2010 W. R. Grace & Co. LOGO_VERTICAL_Grace_Lock-up_RGB.jpgPerfromance_05.jpgROIC Performance .Grace has invested over $500 million in its businesses since 2005 .ROIC increased from 16% to 25% .Over $350 million in net working capital reductions since June 2008 High Return on Invested Capital High ROIC an operating and investment priority Grace Adjusted EBIT Return On Invested Capital* *Definitions of non-GAAP financial terms and reconciliations to the closest GAAP term are provided in the Appendix. Net Working Capital Days ROIC Drivers .Higher Adjusted EBIT. Net working capital reduction .Davison manufacturing scale and flexibility .Construction Products capital-light business model .ROIC key in investment decisions |
|
|
10 © 2010 W. R. Grace & Co. LOGO_VERTICAL_Grace_Lock-up_RGB.jpgUses of Capital Investment in high margin, high growth businesses and regions. Typical capital expenditures 4-5% of sales .Bolt-on acquisitions Acquisitions track record .21 bolt-on acquisitions since 2001 .$235 million total investment .Portfolio accretive to earnings and return on invested capital Business development priorities .Strategic capital investments, business acquisitions, and alliances .Catalyst investments and alliances .Product and geographic extensions in Materials Technologies and Grace Construction Products .Strong preference for bolt-ons with clear cost synergies Financial flexibility to invest in growth .Exit financing requirement less than 2x Adjusted EBITDA After emergence, we will consider using capital in excess of strategic opportunities to: .Reduce debt and underfunded pension balances .Repurchase shares to offset dilution |
|
|
11 © 2010 W. R. Grace & Co.GCP Performance Through US Market Cycles Resilient performance through construction cycles Positioned for upside leverage as customer demand returns Trough to peak CAGR in last up cycle(s): GCP US sales up 7% 1992-2006 Commercial up 4% 2003-2007 (9% 1992-2000) Housing up 5% 1991-2005 Peak to trough CAGR in current down cycle: GCP US sales down 12% 2006-2009 Commercial down 33% 2007-2009 Housing down 28% 2005-2009 US Construction Cycles UNITS (12 month moving total)$ MILLIONS Grace US sales ($ millions) Commercial construction starts (millions sq. ft.) Housing starts (000 units) |
|
|
12© 2010 W. R. Grace & Co.2013 Growth Targets*Definitions of non-GAAP financial terms and reconciliations to the closest GAAP term are provided in the Appendix. Grace Sales Growth 8-10% CAGR target 8.9% CAGR 2005–2008 Grace Adjusted EBIT 15-20% CAGR target 14.8% CAGR 2005–2008 Growth Factors Emerging regions growth Acquisitions and alliances Construction Products performance in North America and Europe Key assumptions / macro outlook Improved global economic conditions and recovery in construction spending Constructive pricing, raw materials, and currency environment |
|
|
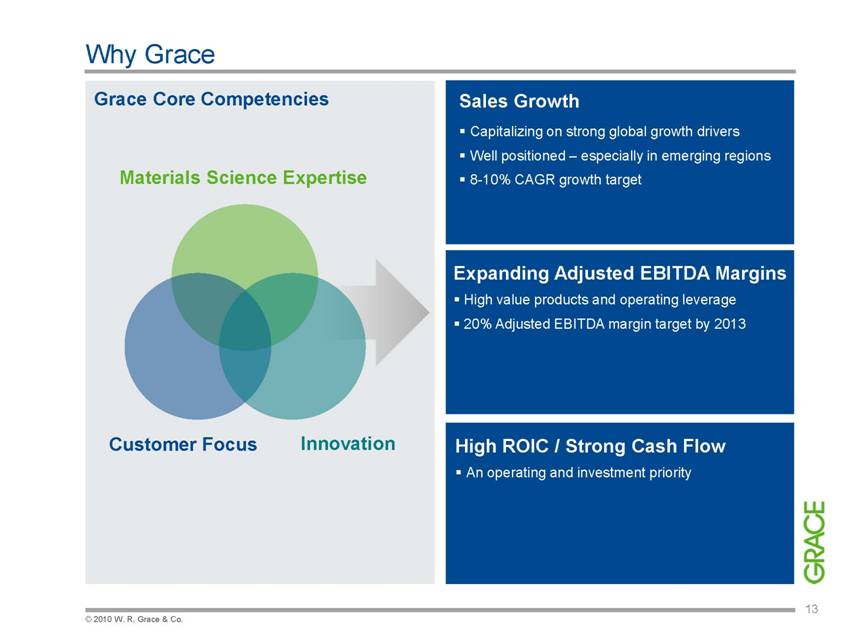
13 © 2010 W. R. Grace & Co. Expanding Adjusted EBITDA Margins High value products and operating leverage 20% Adjusted EBITDA margin target by 2013 High ROIC / Strong Cash Flow An operating and investment priority Sales Growth Capitalizing on strong global growth drivers Well positioned – especially in emerging regions 8-10% CAGR growth target Why Grace Grace Core Competencies Materials Science Expertise Customer Focus Innovation |
|
|
14 © 2010 W. R. Grace & Co. Non-GAAP Financial Terms Adjusted EBIT (Earnings Before Interest and Taxes) is net income adjusted for interest income and expense, income taxes, Chapter 11-and asbestos-related costs, net, restructuring expenses and related asset impairments and gains and losses on sales of product lines and other investments. Adjusted EBITDA (Earnings Before Interest, Taxes, Depreciation and Amortization) is Adjusted EBIT plus depreciation and amortization expenses. Segment Operating Income is Adjusted EBIT adjusted for defined benefit pension expense and corporate costs. Adjusted Operating Cash Flow is Adjusted EBITDA plus pension expense plus or minus the change in net working capital and specified other assets and liabilities minus capital expenditures. Adjusted Operating Cash Flow excludes the cash flow effects of income taxes, defined benefit pension arrangements, Chapter 11- and asbestos-related costs and any restructuring or divestment activities. Adjusted EBIT Return on Invested Capital is Adjusted EBIT divided by the sum of net working capital, properties and equipment and certain other assets and liabilities. Appendix |
|
|
15 © 2010 W. R. Grace & Co. Adjusted EBIT, Adjusted EBITDA, Segment Operating Income, Adjusted Operating Cash Flow and Adjusted EBIT Return on Invested Capital do not purport to represent income or cash flow measures as defined under U.S. generally accepted accounting principles (GAAP), and should not be used as alternatives to such measures as an indicator of Grace’s performance. These measures are provided to investors and others to improve the period-to-period comparability and peer-to-peer comparability of Grace’s financial results. Adjusted EBIT has material limitations as an operating performance measure because it excludes Chapter 11- and asbestos-related costs and may exclude income and expenses from restructuring and divestment activities, which historically have been material components of Grace’s net income. Adjusted EBITDA also has material limitations as an operating performance measure since it excludes the impact of depreciation and amortization expense. Grace’s business is substantially dependent on the successful deployment of capital, and depreciation and amortization expense is a necessary element of Grace’s costs. Adjusted Operating Cash Flow also has material limitations as an operating performance measure because it excludes the cash flow effects of income taxes, defined benefit pension arrangements, Chapter 11- and asbestos-related costs and any restructuring or divestment activities, which historically have been material components of Grace’s cash flow. Grace compensates for the limitations of these measurements by using these indicators together with net income as measured under GAAP to present a complete analysis of its results of operations. Adjusted EBIT, Adjusted EBITDA and Adjusted Operating Cash Flow should be evaluated together with net income measured under GAAP for a complete understanding of Grace’s results of operations. Investors should evaluate these measures in conjunction with Grace’s Consolidated Financial Statements as presented in Grace’s annual reports on Form 10-K for a more complete analysis of it’s financial results. Appendix |
|
|
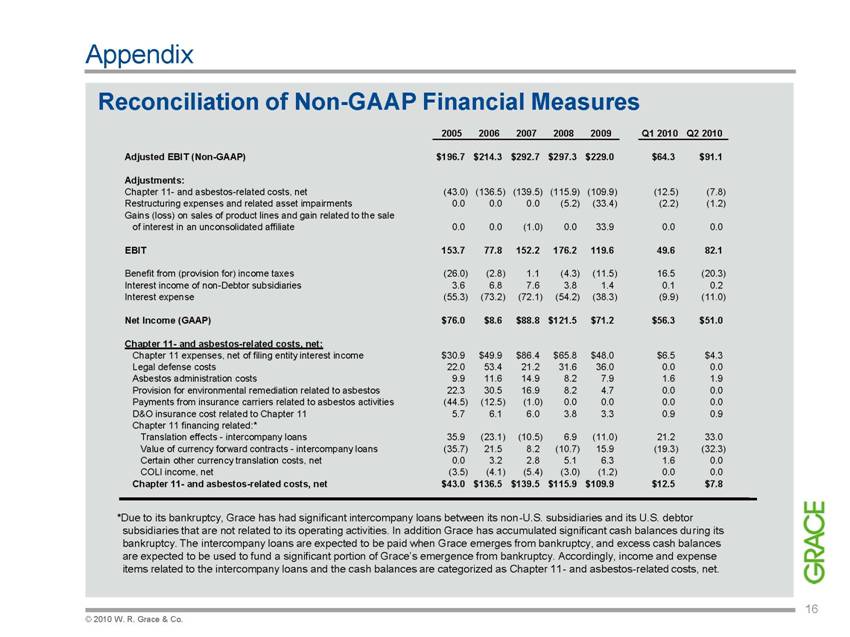
16 © 2010 W. R. Grace & Co. Reconciliation of Non-GAAP Financial Measures Appendix *Due to its bankruptcy, Grace has had significant intercompany loans between its non-U.S. subsidiaries and its U.S. debtor subsidiaries that are not related to its operating activities. In addition Grace has accumulated significant cash balances during its bankruptcy. The intercompany loans are expected to be paid when Grace emerges from bankruptcy, and excess cash balances are expected to be used to fund a significant portion of Grace’s emergence from bankruptcy. Accordingly, income and expense items related to the intercompany loans and the cash balances are categorized as Chapter 11- and asbestos-related costs, net. 2005 2006 2007 2008 2009 Q1 2010 Q2 2010 Adjusted EBIT (Non-GAAP) $196.7 $214.3 $292.7 $297.3 $229.0 $64.3 $91.1 Adjustments: Chapter 11- and asbestos-related costs, net (43.0) (136.5) (139.5) (115.9) (109.9) (12.5) (7.8) Restructuring expenses and related asset impairments 0.0 0.0 0.0 (5.2) (33.4) (2.2) (1.2) Gains (loss) on sales of product lines and gain related to the sale of interest in an unconsolidated affiliate 0.0 0.0 (1.0) 0.03 3.9 0.0 0.0 EBIT 153.7 77.8 152.2 176.2 119.6 49.6 82.1 Benefit from (provision for) income taxes (26.0) (2.8) 1.1 (4.3) (11.5) 16.5 (20.3) Interest income of non-Debtor subsidiaries3.66.87.63.81.40.10.2Interest expense (55.3) (73.2) (72.1) (54.2) (38.3) (9.9) (11.0) Net Income (GAAP) $76.0 $8.6 $88.8 $121.5 $71.2 $56.3 $51.0 Chapter 11- and asbestos-related costs, net:Chapter 11 expenses, net of filing entity interest income $30.9 $49.9 $86.4 $65.8 $48.0 $6.5 $4.3 Legal defense costs 22.0 53.4 21.2 31.6 36.0 0.0 0.0 Asbestos administration costs 9.9 11.6 14.9 8.2 7.9 1.6 1.9 Provision for environmental remediation related to asbestos 22.3 30.5 16.9 8.2 4.7 0.0 0.0 Payments from insurance carriers related to asbestos activities (44.5) (12.5) (1.0) 0.0 0.0 0.0 0.0 D&O insurance cost related to Chapter 11 5.7 6.1 6.0 3.8 3.3 0.9 0.9 Chapter 11 financing related:* Translation effects - intercompany loans 35.9 (23.1) (10.5) 6.9 (11.0) 21.2 33.0 Value of currency forward contracts - intercompany loans (35.7) 21.5 8.2 (10.7) 15.9 (19.3) (32.3) Certain other currency translation costs, net 0.0 3.2 2.8 5.1 6.3 1.6 0.0 COLI income, net (3.5) (4.1) (5.4) (3.0) (1.2) 0.0 0.0 Chapter 11- and asbestos-related costs, net $43.0 $136.5 $139.5 $115.9 $109.9 $12.5 $7.8 |
|
|
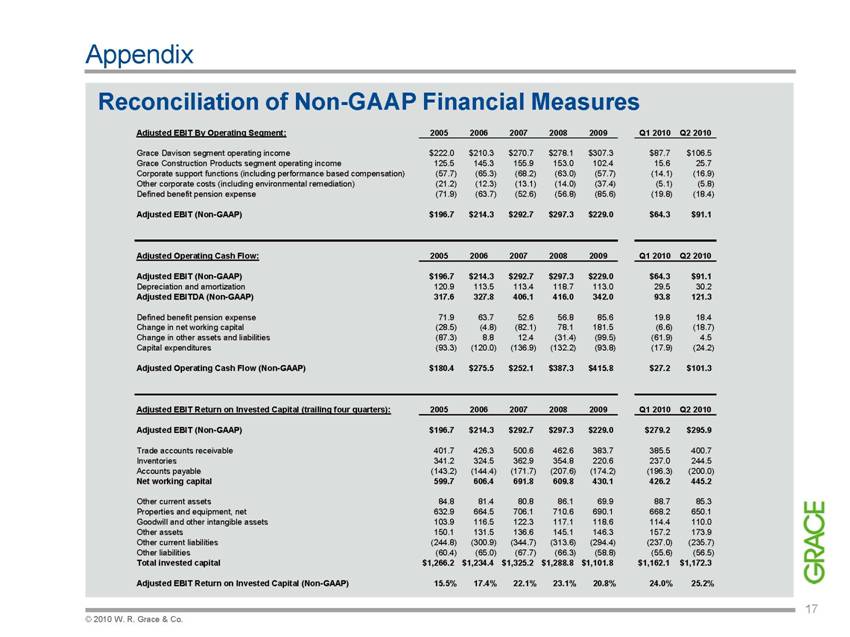
17 © 2010 W. R. Grace & Co. Reconciliation of Non-GAAP Financial Measures Appendix Adjusted EBIT By Operating Segment: 2005 2006 2007 2008 2009 Q1 2010 Q2 2010Grace Davison segment operating income $222.0 $210.3 $270.7 $278.1 $307.3 $87.7 $106.5 Grace Construction Products segment operating income 125.5 145.3 155.9 153.0 102.4 15.6 25.7 Corporate support functions (including performance based compensation) (57.7) (65.3) (68.2) (63.0) (57.7) (14.1) (16.9) Other corporate costs (including environmental remediation)(21.2) (12.3) (13.1) (14.0) (37.4) (5.1) (5.8) Defined benefit pension expense (71.9) (63.7) (52.6) (56.8) (85.6) (19.8) (18.4) Adjusted EBIT (Non-GAAP) $196.7 $214.3 $292.7 $297.3 $229.0 $64.3 $91.1 Adjusted Operating Cash Flow: 2005 2006 2007 2008 2009 Q1 2010 Q2 2010 Adjusted EBIT (Non-GAAP) $196.7 $214.3 $292.7 $297.3 $229.0 $64.3 $91.1 Depreciation and amortization 120.9 113.5 113.4 118.7 113.0 29.5 30.2 Adjusted EBITDA (Non-GAAP)317.6 327.8 406.1 416.0 342.0 93.8 121.3 Defined benefit pension expense 71.9 63.7 52.6 56.8 85.6 19.8 18.4 Change in net working capital(28.5) (4.8) (82.1) 78.1 181.5 (6.6) (18.7) Change in other assets and liabilities(87.3) 8.8 12.4 (31.4) (99.5) (61.9) 4.5 Capital expenditures(93.3) (120.0) (136.9) (132.2) (93.8) (17.9) (24.2) Adjusted Operating Cash Flow (Non-GAAP) $180.4 $275.5 $252.1 $387.3 $415.8 $27.2 $101.3 Adjusted EBIT Return on Invested Capital (trailing four quarters): 2005 2006 2007 2008 2009 Q1 2010 Q2 2010Adjusted EBIT (Non-GAAP) $196.7 $214.3 $292.7 $297.3 $229.0 $279.2 $295.9 Trade accounts receivable 401.7 426.3 500.6 462.6 383.7 385.5 400.7 Inventories 341.2 324.5 362.9 354.8 220.6 237.0 244.5 Accounts payable (143.2) (144.4) (171.7) (207.6) (174.2) (196.3) (200.0) Net working capital599.7 606.4 691.8 609.8 430.1 426.2 445.2 Other current assets 84.8 81.4 80.8 86.1 69.9 88.7 85.3 Properties and equipment, net632.9 664.5 706.1 710.6 690.1 668.2 650.1 Goodwill and other intangible assets 103.9 116.5 122.3 117.1 118.6 114.4 110.0 Other assets 150.1 131.5 136.6 145.1 146.3 157.2 173.9 Other current liabilities(244.8) (300.9) (344.7) (313.6) (294.4) (237.0) (235.7) Other liabilities(60.4) (65.0) (67.7) (66.3) (58.8) (55.6) (56.5) Total invested capital $1,266.2 $1,234.4 $1,325.2 $1,288.8 $1,101.8 $1,162.1 $1,172.3 Adjusted EBIT Return on Invested Capital (Non-GAAP) 15.5% 17.4% 22.1% 23.1% 20.8% 24.0% 25.2% |
|
|
GRACE Enriching Lives, Everywhere.® |