Attached files
| file | filename |
|---|---|
| EX-99.2 - EX-99.2 - PHH CORP | y85934exv99w2.htm |
| EX-99.1 - EX-99.1 - PHH CORP | y85934exv99w1.htm |
| 8-K - FORM 8-K - PHH CORP | y85934e8vk.htm |
Exhibit 99.3

| PHH Corporation Investor Supplement Second Quarter 2010 August 3, 2010 |
| Important Disclosures Forward-Looking Statements Statements in this presentation that are not historical facts are forward-looking statements within the meaning of Section 27A of the Securities Act of 1933, as amended, and Section 21E of the Securities Exchange Act of 1934, as amended. Such forward-looking statements are subject to known and unknown risks, uncertainties and other factors that may cause our actual results, performance or achievements to be materially different from any future results, performance or achievements expressed or implied by such forward-looking statements. Statements preceded by, followed by or that otherwise include the words "believes," "expects," "anticipates," "intends," "projects," "estimates," "plans," "potential," "may increase," "may result," "will result," "may fluctuate," "run rate," "outlook," and similar expressions or future or conditional verbs such as "will," "should," "would," "may" and "could" are generally forward-looking in nature and not historical facts. Certain factors that could cause actual results, performance or achievements to differ materially from those expressed in such forward-looking statements are described under the headings "Cautionary Note Regarding Forward- Looking Statements" and "Risk Factors" in the Company's most recent Annual Report on Form 10-K and Quarterly Reports on Form 10-Q. Investors are cautioned not to place undue reliance on any forward-looking statements. Except for our ongoing obligations to disclose material information under the federal securities laws and applicable stock exchange listing standards and unless otherwise required by applicable law, we undertake no obligation to release publicly any updates or revisions to any forward-looking statements or to report the occurrence or non-occurrence of anticipated or unanticipated events. Basis of Presentation of Financial Data Unless noted otherwise in this presentation, all reported financial data is being presented as of the period ended June 30, 2010 (unaudited). |
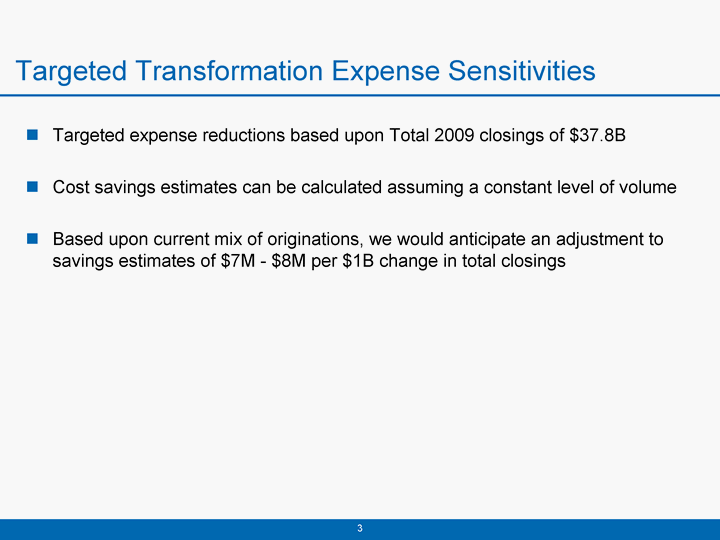
| Targeted Transformation Expense Sensitivities Targeted expense reductions based upon Total 2009 closings of $37.8B Cost savings estimates can be calculated assuming a constant level of volume Based upon current mix of originations, we would anticipate an adjustment to savings estimates of $7M - $8M per $1B change in total closings |
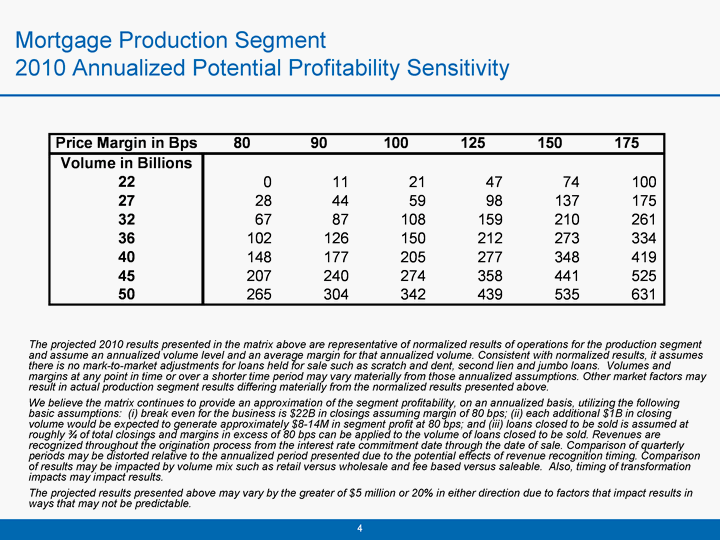
| Mortgage Production Segment 2010 Annualized Potential Profitability Sensitivity The projected 2010 results presented in the matrix above are representative of normalized results of operations for the production segment and assume an annualized volume level and an average margin for that annualized volume. Consistent with normalized results, it assumes there is no mark-to-market adjustments for loans held for sale such as scratch and dent, second lien and jumbo loans. Volumes and margins at any point in time or over a shorter time period may vary materially from those annualized assumptions. Other market factors may result in actual production segment results differing materially from the normalized results presented above. We believe the matrix continues to provide an approximation of the segment profitability, on an annualized basis, utilizing the following basic assumptions: (i) break even for the business is $22B in closings assuming margin of 80 bps; (ii) each additional $1B in closing volume would be expected to generate approximately $8-14M in segment profit at 80 bps; and (iii) loans closed to be sold is assumed at roughly 3/4 of total closings and margins in excess of 80 bps can be applied to the volume of loans closed to be sold. Revenues are recognized throughout the origination process from the interest rate commitment date through the date of sale. Comparison of quarterly periods may be distorted relative to the annualized period presented due to the potential effects of revenue recognition timing. Comparison of results may be impacted by volume mix such as retail versus wholesale and fee based versus saleable. Also, timing of transformation impacts may impact results. The projected results presented above may vary by the greater of $5 million or 20% in either direction due to factors that impact results in ways that may not be predictable. |
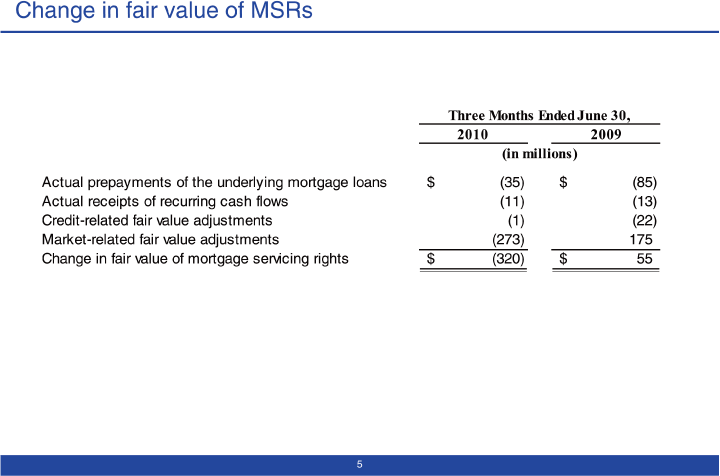
| Change in fair value of MSRs |
| Limited Credit Risk As a reminder, we carry limited credit risk v. industry Do not portfolio loans Minimal exposure from subprime lending, Option ARMs or other higher risk products Strong high quality underwriting culture mitigates the potential for loss Credit risk arises in three primary ways: Impact of delinquencies on servicing cash flows Involuntary prepayments reduce future servicing cash flows similar to other early prepayments Changes in fair value of MSR asset based on estimates of the loss of future cash flows from rising delinquencies in the portfolio Increase in foreclosure-related charges from recourse Arise due to our rep and warranties to investors for loans we originate Quality underwriting limits these exposures Increase in reinsurance-related charges for our Atrium subsidiary |
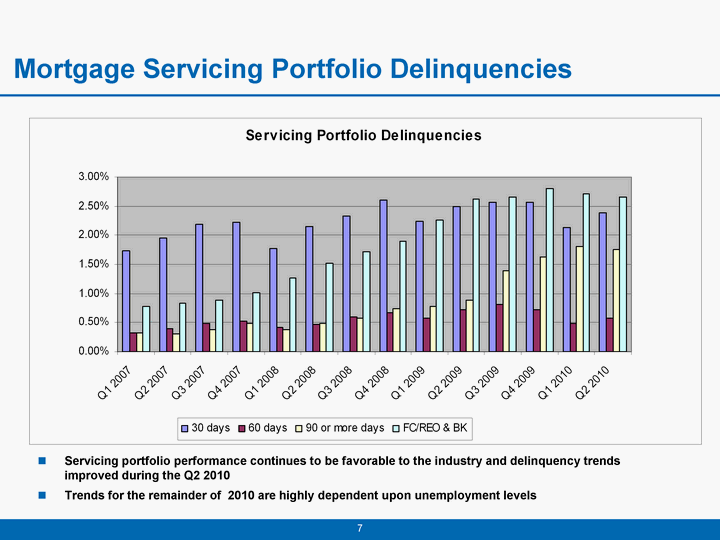
| Mortgage Servicing Portfolio Delinquencies Servicing portfolio performance continues to be favorable to the industry and delinquency trends improved during the Q2 2010 Trends for the remainder of 2010 are highly dependent upon unemployment levels |
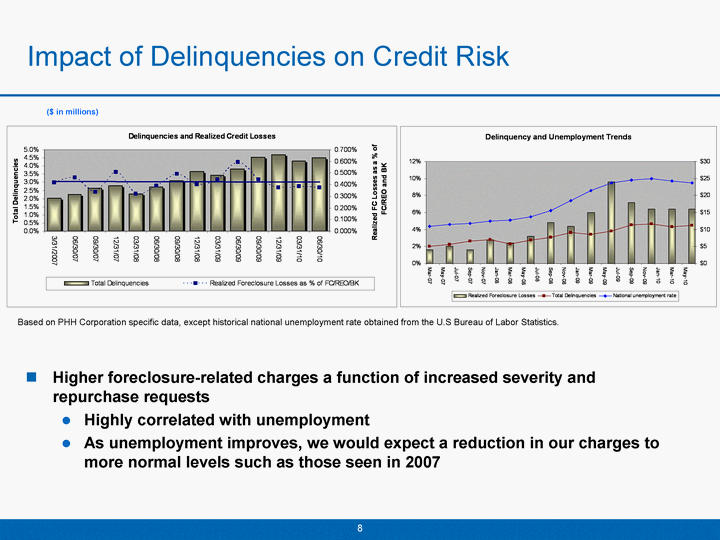
| Impact of Delinquencies on Credit Risk Higher foreclosure-related charges a function of increased severity and repurchase requests Highly correlated with unemployment As unemployment improves, we would expect a reduction in our charges to more normal levels such as those seen in 2007 Based on PHH Corporation specific data, except historical national unemployment rate obtained from the U.S Bureau of Labor Statistics. ($ in millions) |
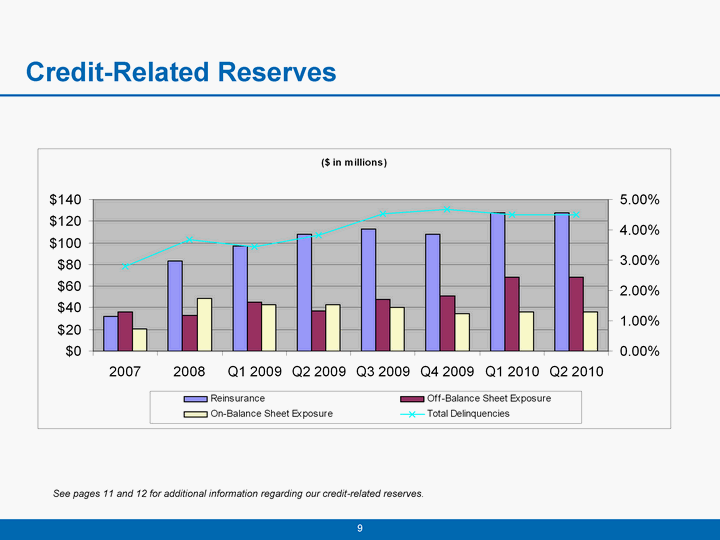
| Credit-Related Reserves See pages 11 and 12 for additional information regarding our credit-related reserves. |
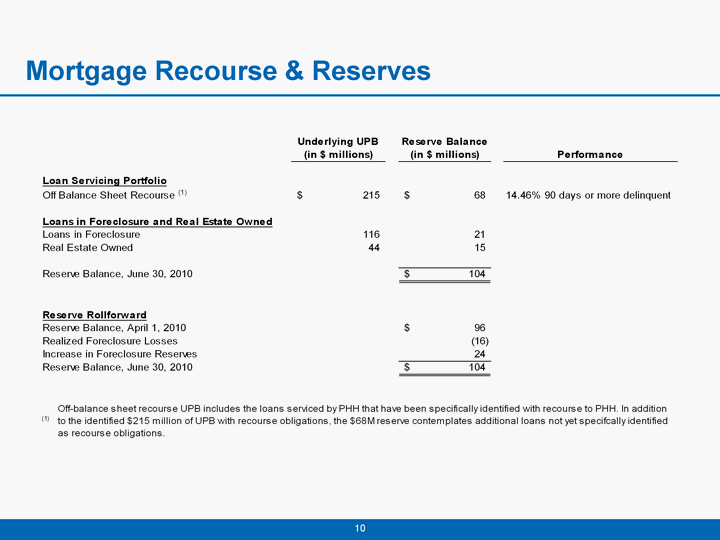
| Mortgage Recourse & Reserves |
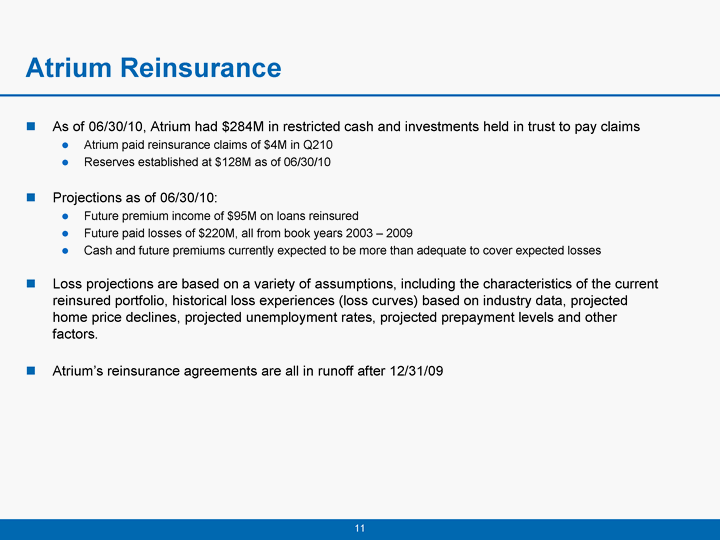
| As of 06/30/10, Atrium had $284M in restricted cash and investments held in trust to pay claims Atrium paid reinsurance claims of $4M in Q210 Reserves established at $128M as of 06/30/10 Projections as of 06/30/10: Future premium income of $95M on loans reinsured Future paid losses of $220M, all from book years 2003 - 2009 Cash and future premiums currently expected to be more than adequate to cover expected losses Loss projections are based on a variety of assumptions, including the characteristics of the current reinsured portfolio, historical loss experiences (loss curves) based on industry data, projected home price declines, projected unemployment rates, projected prepayment levels and other factors. Atrium's reinsurance agreements are all in runoff after 12/31/09 Atrium Reinsurance |
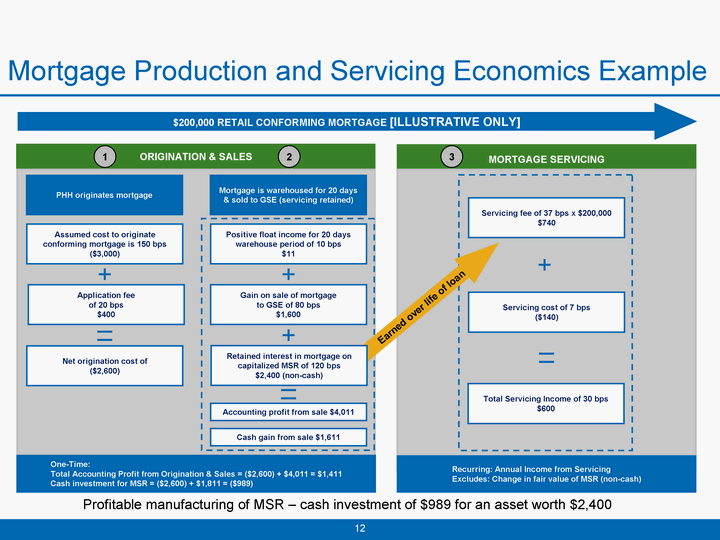
| Mortgage Production and Servicing Economics Example MORTGAGE SERVICING ORIGINATION & SALES $200,000 RETAIL CONFORMING MORTGAGE [ILLUSTRATIVE ONLY] Recurring: Annual Income from Servicing Excludes: Change in fair value of MSR (non-cash) Total Servicing Income of 30 bps $600 Servicing cost of 7 bps ($140) Servicing fee of 37 bps x $200,000 $740 One-Time: Total Accounting Profit from Origination & Sales = ($2,600) + $4,011 = $1,411 Cash investment for MSR = ($2,600) + $1,811 = ($989) Net origination cost of ($2,600) Assumed cost to originate conforming mortgage is 150 bps ($3,000) Accounting profit from sale $4,011 Gain on sale of mortgage to GSE of 80 bps $1,600 Positive float income for 20 days warehouse period of 10 bps $11 PHH originates mortgage Mortgage is warehoused for 20 days & sold to GSE (servicing retained) Earned over life of loan 1 2 3 Retained interest in mortgage on capitalized MSR of 120 bps $2,400 (non-cash) Cash gain from sale $1,611 Application fee of 20 bps $400 Profitable manufacturing of MSR - cash investment of $989 for an asset worth $2,400 |
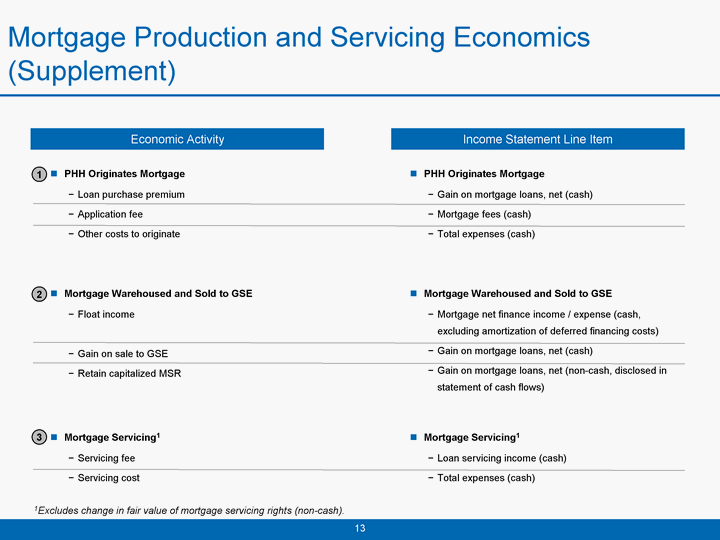
| Mortgage Production and Servicing Economics (Supplement) 1Excludes change in fair value of mortgage servicing rights (non-cash). Economic Activity Income Statement Line Item PHH Originates Mortgage Loan purchase premium Application fee Other costs to originate PHH Originates Mortgage Gain on mortgage loans, net (cash) Mortgage fees (cash) Total expenses (cash) Mortgage Warehoused and Sold to GSE Float income Gain on sale to GSE Retain capitalized MSR Mortgage Warehoused and Sold to GSE Mortgage net finance income / expense (cash, excluding amortization of deferred financing costs) Gain on mortgage loans, net (cash) Gain on mortgage loans, net (non-cash, disclosed in statement of cash flows) Mortgage Servicing1 Servicing fee Servicing cost Mortgage Servicing1 Loan servicing income (cash) Total expenses (cash) 2 1 3 |
