Attached files
| file | filename |
|---|---|
| EX-99.3 - EX-99.3 - PHH CORP | y85934exv99w3.htm |
| EX-99.1 - EX-99.1 - PHH CORP | y85934exv99w1.htm |
| 8-K - FORM 8-K - PHH CORP | y85934e8vk.htm |
Exhibit 99.2

| August 2, 2010 Exhibit 99.2 |
| Forward-Looking Statements Statements in this presentation that are not historical facts are forward-looking statements within the meaning of Section 27A of the Securities Act of 1933, as amended, and Section 21E of the Securities Exchange Act of 1934, as amended. Such forward-looking statements are subject to known and unknown risks, uncertainties and other factors that may cause our actual results, performance or achievements to be materially different from any future results, performance or achievements expressed or implied by such forward-looking statements. Statements preceded by, followed by or that otherwise include the words "believes," "expects," "anticipates," "intends," "projects," "estimates," "plans," "potential," "may increase," "may result," "will result," "may fluctuate," "run rate," "outlook," and similar expressions or future or conditional verbs such as "will," "should," "would," "may" and "could" are generally forward-looking in nature and not historical facts. Certain factors that could cause actual results, performance or achievements to differ materially from those expressed in such forward-looking statements are described under the headings "Cautionary Note Regarding Forward-Looking Statements" and "Risk Factors" in the Company's most recent Annual Report on Form 10-K and Quarterly Reports on Form 10-Q. Investors are cautioned not to place undue reliance on any forward-looking statements. Except for our ongoing obligations to disclose material information under the federal securities laws and applicable stock exchange listing standards and unless otherwise required by applicable law, we undertake no obligation to release publicly any updates or revisions to any forward-looking statements or to report the occurrence or non- occurrence of anticipated or unanticipated events. Basis of Presentation of Financial Data Unless noted otherwise in this presentation, all reported financial data is being presented as of the period ended June 30th, 2010 (unaudited). Non-GAAP Financial Measures Core earnings, as used throughout this presentation, is a financial measure that is not in accordance with generally accepted accounting principles in the United States ("GAAP"). Core earnings measures our financial performance excluding certain unrealized changes in value of our MSRs and therefore may not properly reflect the rate of value lost on subsequent payments or prepayments. As a result, core earnings may not reflect the underlying performance of the business over time. Core earnings involves differences from segment (loss) profit, (Loss) income before income taxes, Net (loss) income attributable to PHH Corporation and Basic (loss) earnings per share attributable to PHH Corporation computed in accordance with GAAP, core earnings should be considered as supplementary to, and not as a substitute for, segment (loss) profit, (Loss) income before income taxes, Net (loss) income attributable to PHH Corporation or Basic (loss) earnings per share attributable to PHH Corporation computed in accordance with GAAP as a measure of the Company's financial performance. The Company believes that core earnings is useful to investors because it provides a means by which investors can evaluate the Company's underlying core operating performance, exclusive of certain adjustments that investors may consider to be unrelated to the operations and key drivers of the business. The Company also believes that any meaningful analysis of the Company's financial performance by investors requires an understanding of the factors that drive the Company's underlying core operating performance as distinguished from the factors that are included in computing segment (loss) profit, (Loss) income before income taxes, Net (loss) income attributable to PHH Corporation and Basic (loss) earnings per share attributable to PHH Corporation in accordance with GAAP and that may obscure such core operating performance for a given period or periods. Important Disclosures |
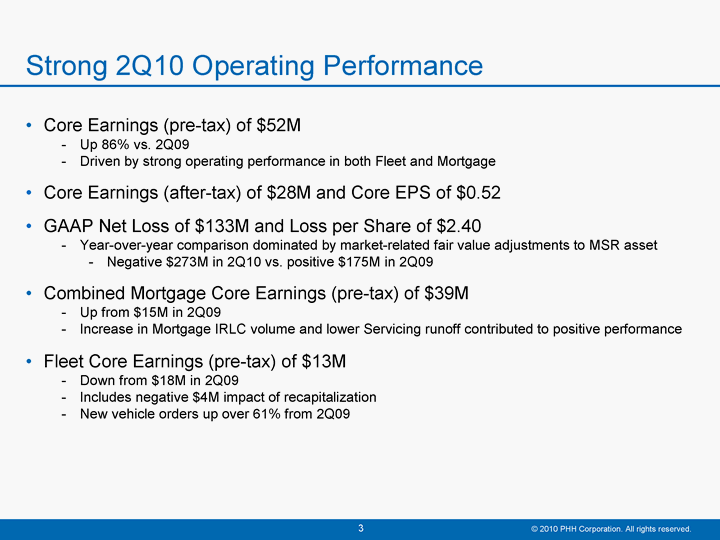
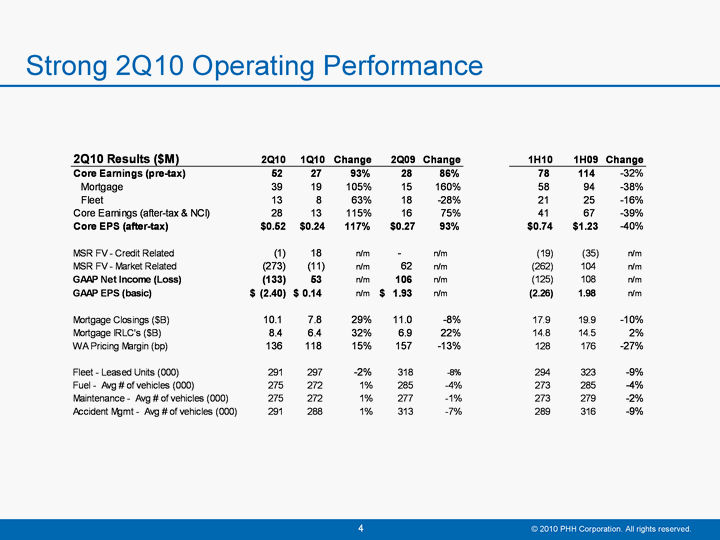
| Core Earnings (pre-tax) of $52M Up 86% vs. 2Q09 Driven by strong operating performance in both Fleet and Mortgage Core Earnings (after-tax) of $28M and Core EPS of $0.52 GAAP Net Loss of $133M and Loss per Share of $2.40 Year-over-year comparison dominated by market-related fair value adjustments to MSR asset Negative $273M in 2Q10 vs. positive $175M in 2Q09 Combined Mortgage Core Earnings (pre-tax) of $39M Up from $15M in 2Q09 Increase in Mortgage IRLC volume and lower Servicing runoff contributed to positive performance Fleet Core Earnings (pre-tax) of $13M Down from $18M in 2Q09 Includes negative $4M impact of recapitalization New vehicle orders up over 61% from 2Q09 Strong 2Q10 Operating Performance |
| Strong 2Q10 Operating Performance |
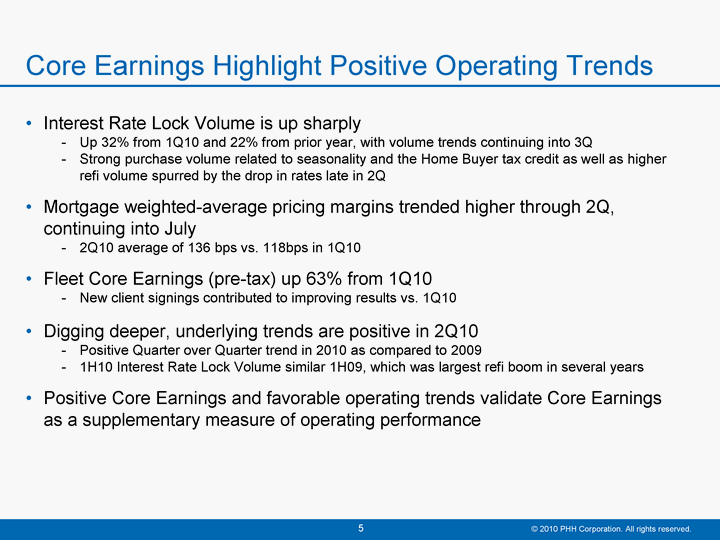
| Interest Rate Lock Volume is up sharply Up 32% from 1Q10 and 22% from prior year, with volume trends continuing into 3Q Strong purchase volume related to seasonality and the Home Buyer tax credit as well as higher refi volume spurred by the drop in rates late in 2Q Mortgage weighted-average pricing margins trended higher through 2Q, continuing into July 2Q10 average of 136 bps vs. 118bps in 1Q10 Fleet Core Earnings (pre-tax) up 63% from 1Q10 New client signings contributed to improving results vs. 1Q10 Digging deeper, underlying trends are positive in 2Q10 Positive Quarter over Quarter trend in 2010 as compared to 2009 1H10 Interest Rate Lock Volume similar 1H09, which was largest refi boom in several years Positive Core Earnings and favorable operating trends validate Core Earnings as a supplementary measure of operating performance Core Earnings Highlight Positive Operating Trends |
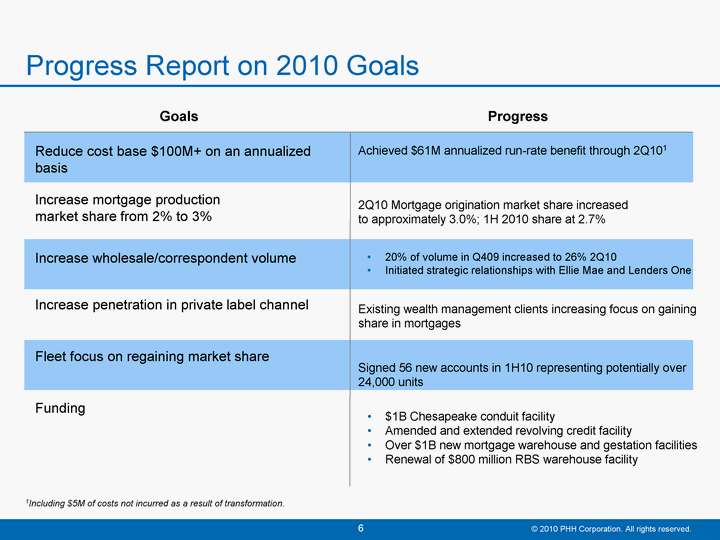
| Reduce cost base $100M+ on an annualized basis Increase mortgage production market share from 2% to 3% Increase wholesale/correspondent volume Increase penetration in private label channel Fleet focus on regaining market share Funding Achieved $61M annualized run-rate benefit through 2Q101 2Q10 Mortgage origination market share increased to approximately 3.0%; 1H 2010 share at 2.7% 20% of volume in Q409 increased to 26% 2Q10 Initiated strategic relationships with Ellie Mae and Lenders One Existing wealth management clients increasing focus on gaining share in mortgages Signed 56 new accounts in 1H10 representing potentially over 24,000 units $1B Chesapeake conduit facility Amended and extended revolving credit facility Over $1B new mortgage warehouse and gestation facilities Renewal of $800 million RBS warehouse facility 1Including $5M of costs not incurred as a result of transformation. Goals Progress Progress Report on 2010 Goals |
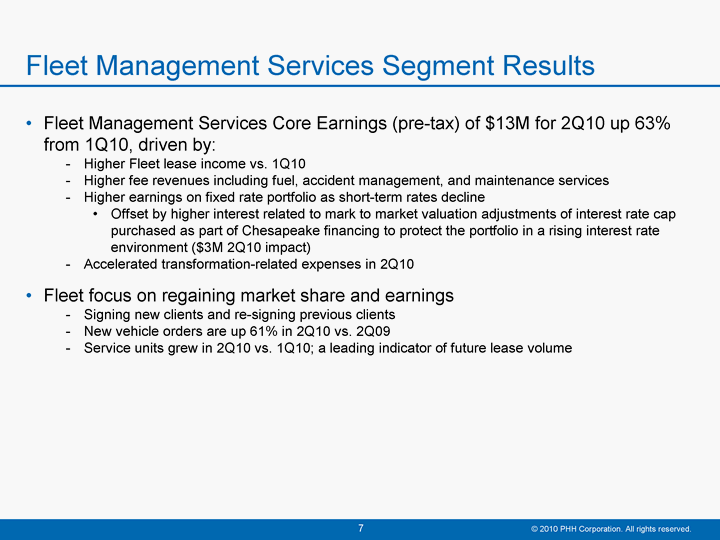
| Fleet Management Services Core Earnings (pre-tax) of $13M for 2Q10 up 63% from 1Q10, driven by: Higher Fleet lease income vs. 1Q10 Higher fee revenues including fuel, accident management, and maintenance services Higher earnings on fixed rate portfolio as short-term rates decline Offset by higher interest related to mark to market valuation adjustments of interest rate cap purchased as part of Chesapeake financing to protect the portfolio in a rising interest rate environment ($3M 2Q10 impact) Accelerated transformation-related expenses in 2Q10 Fleet focus on regaining market share and earnings Signing new clients and re-signing previous clients New vehicle orders are up 61% in 2Q10 vs. 2Q09 Service units grew in 2Q10 vs. 1Q10; a leading indicator of future lease volume Fleet Management Services Segment Results |
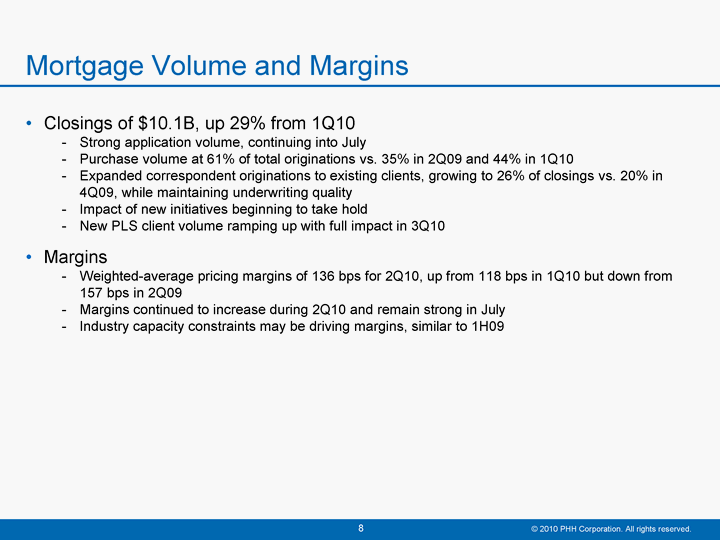
| Closings of $10.1B, up 29% from 1Q10 Strong application volume, continuing into July Purchase volume at 61% of total originations vs. 35% in 2Q09 and 44% in 1Q10 Expanded correspondent originations to existing clients, growing to 26% of closings vs. 20% in 4Q09, while maintaining underwriting quality Impact of new initiatives beginning to take hold New PLS client volume ramping up with full impact in 3Q10 Margins Weighted-average pricing margins of 136 bps for 2Q10, up from 118 bps in 1Q10 but down from 157 bps in 2Q09 Margins continued to increase during 2Q10 and remain strong in July Industry capacity constraints may be driving margins, similar to 1H09 Mortgage Volume and Margins |
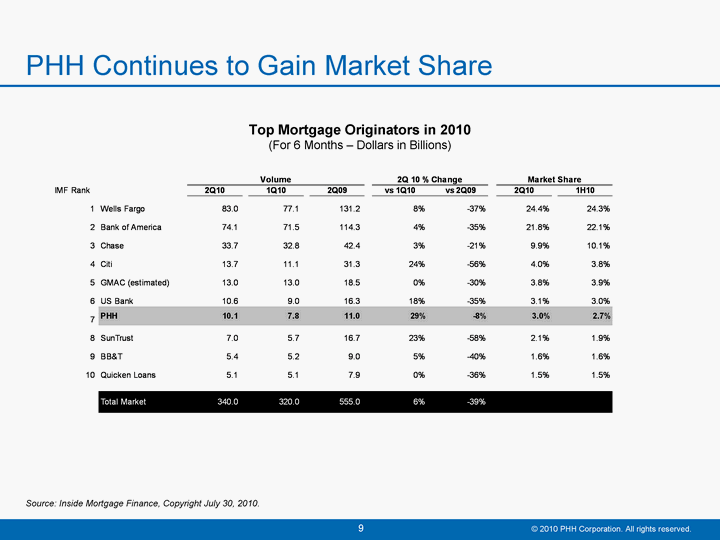
| PHH Continues to Gain Market Share Source: Inside Mortgage Finance, Copyright July 30, 2010. Top Mortgage Originators in 2010 (For 6 Months - Dollars in Billions) |
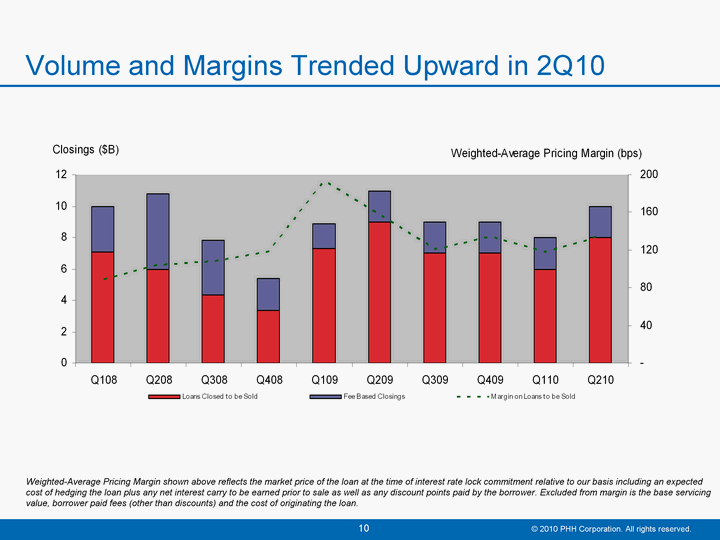
| Weighted-Average Pricing Margin shown above reflects the market price of the loan at the time of interest rate lock commitment relative to our basis including an expected cost of hedging the loan plus any net interest carry to be earned prior to sale as well as any discount points paid by the borrower. Excluded from margin is the base servicing value, borrower paid fees (other than discounts) and the cost of originating the loan. Volume and Margins Trended Upward in 2Q10 |
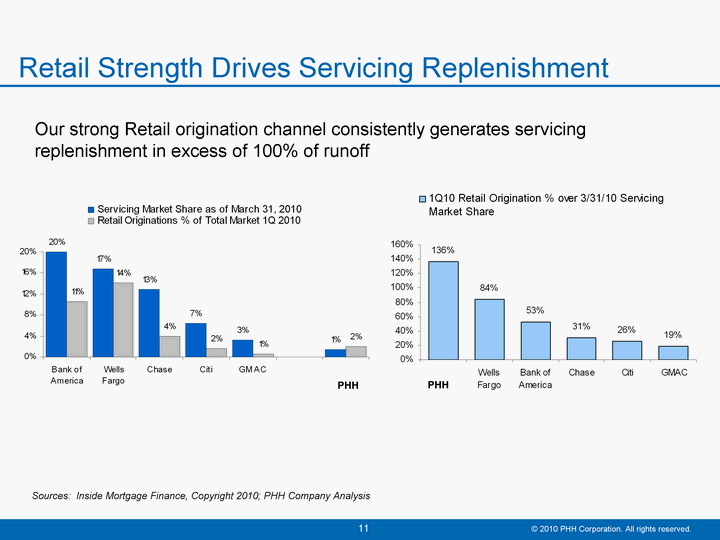
| M Retail Strength Drives Servicing Replenishment Sources: Inside Mortgage Finance, Copyright 2010; PHH Company Analysis Our strong Retail origination channel consistently generates servicing replenishment in excess of 100% of runoff PHH PHH |
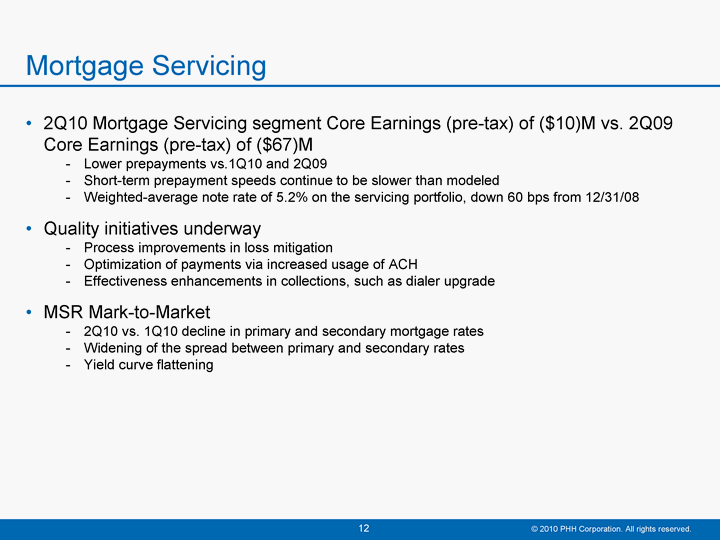
| 2Q10 Mortgage Servicing segment Core Earnings (pre-tax) of ($10)M vs. 2Q09 Core Earnings (pre-tax) of ($67)M Lower prepayments vs.1Q10 and 2Q09 Short-term prepayment speeds continue to be slower than modeled Weighted-average note rate of 5.2% on the servicing portfolio, down 60 bps from 12/31/08 Quality initiatives underway Process improvements in loss mitigation Optimization of payments via increased usage of ACH Effectiveness enhancements in collections, such as dialer upgrade MSR Mark-to-Market 2Q10 vs. 1Q10 decline in primary and secondary mortgage rates Widening of the spread between primary and secondary rates Yield curve flattening Mortgage Servicing |
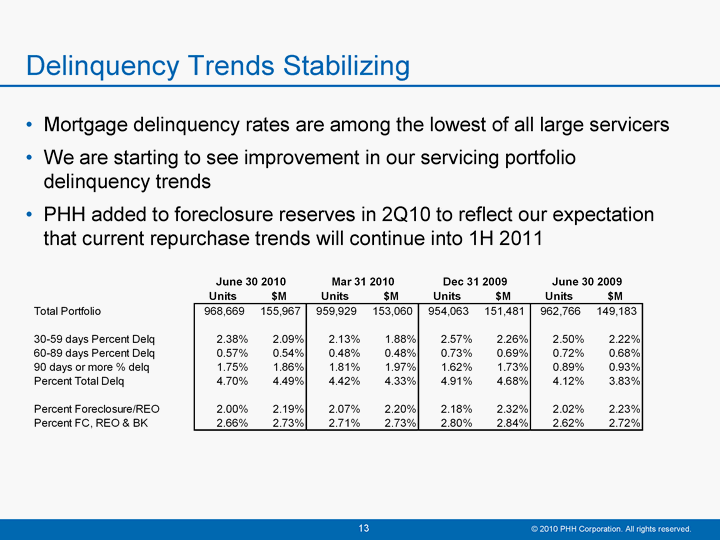
| Mortgage delinquency rates are among the lowest of all large servicers We are starting to see improvement in our servicing portfolio delinquency trends PHH added to foreclosure reserves in 2Q10 to reflect our expectation that current repurchase trends will continue into 1H 2011 Delinquency Trends Stabilizing |
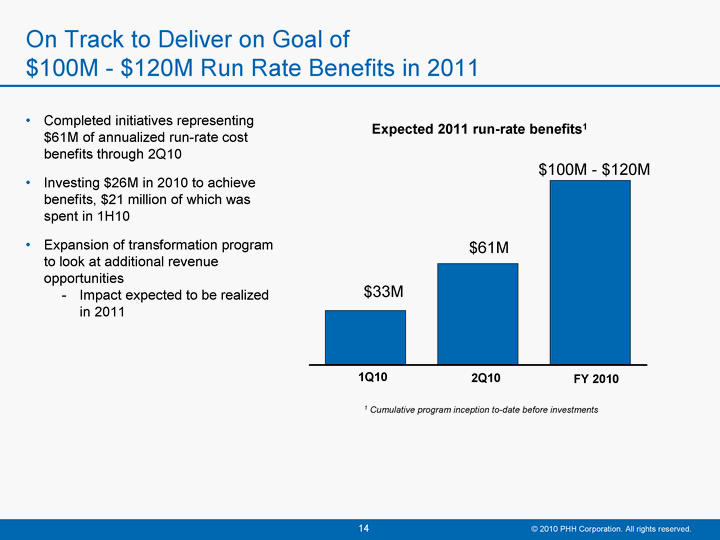
| 0 1 Cumulative program inception to-date before investments 2Q10 1Q10 FY 2010 Expected 2011 run-rate benefits1 $100M - $120M $33M $61M Completed initiatives representing $61M of annualized run-rate cost benefits through 2Q10 Investing $26M in 2010 to achieve benefits, $21 million of which was spent in 1H10 Expansion of transformation program to look at additional revenue opportunities Impact expected to be realized in 2011 On Track to Deliver on Goal of $100M - $120M Run Rate Benefits in 2011 |
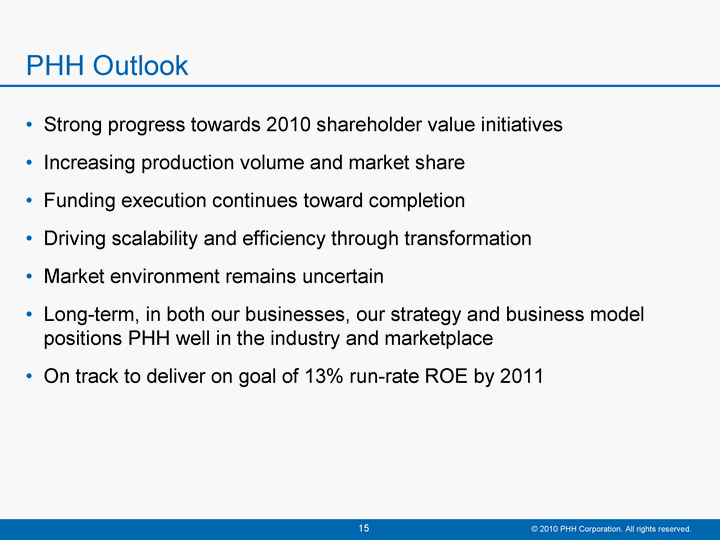
| PHH Outlook Strong progress towards 2010 shareholder value initiatives Increasing production volume and market share Funding execution continues toward completion Driving scalability and efficiency through transformation Market environment remains uncertain Long-term, in both our businesses, our strategy and business model positions PHH well in the industry and marketplace On track to deliver on goal of 13% run-rate ROE by 2011 |
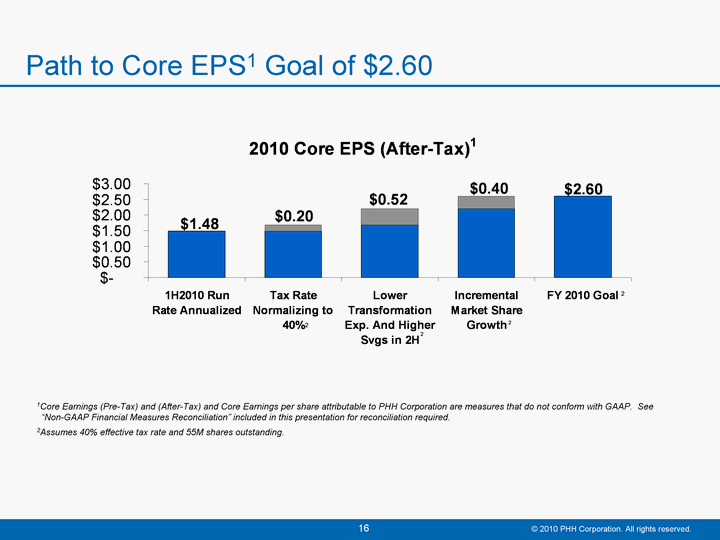
| 1Core Earnings (Pre-Tax) and (After-Tax) and Core Earnings per share attributable to PHH Corporation are measures that do not conform with GAAP. See "Non-GAAP Financial Measures Reconciliation" included in this presentation for reconciliation required. 2Assumes 40% effective tax rate and 55M shares outstanding. Path to Core EPS1 Goal of $2.60 |
| Appendix |
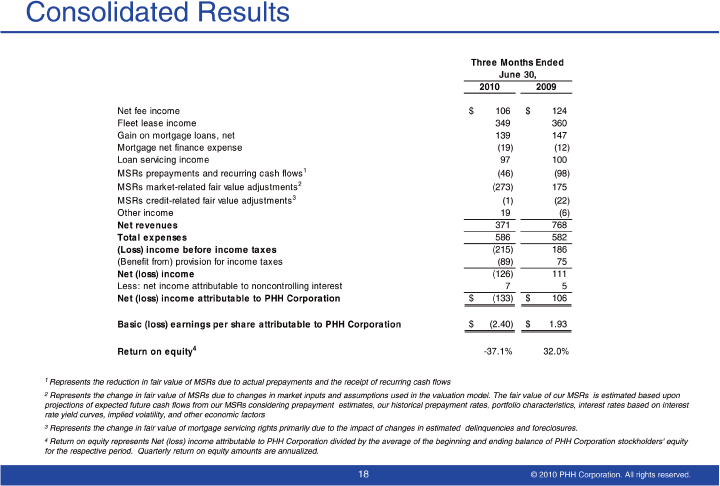
| Consolidated Results 1 Represents the reduction in fair value of MSRs due to actual prepayments and the receipt of recurring cash flows 2 Represents the change in fair value of MSRs due to changes in market inputs and assumptions used in the valuation model. The fair value of our MSRs is estimated based upon projections of expected future cash flows from our MSRs considering prepayment estimates, our historical prepayment rates, portfolio characteristics, interest rates based on interest rate yield curves, implied volatility, and other economic factors 3 Represents the change in fair value of mortgage servicing rights primarily due to the impact of changes in estimated delinquencies and foreclosures. 4 Return on equity represents Net (loss) income attributable to PHH Corporation divided by the average of the beginning and ending balance of PHH Corporation stockholders' equity for the respective period. Quarterly return on equity amounts are annualized. |
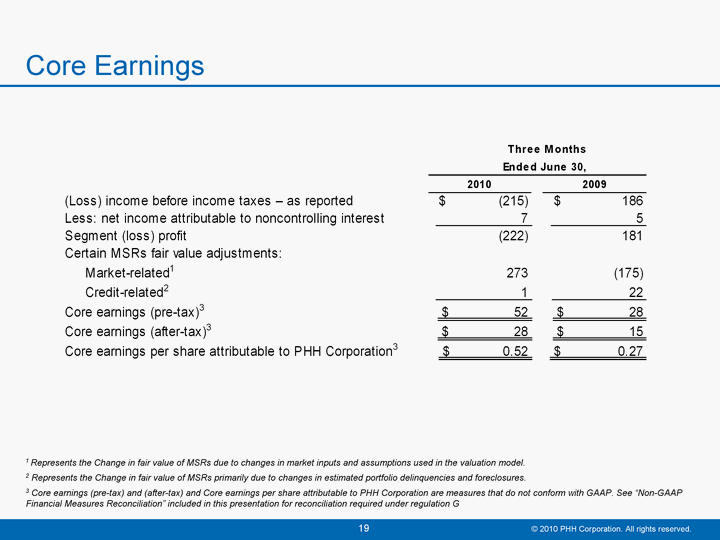
| Core Earnings 1 Represents the Change in fair value of MSRs due to changes in market inputs and assumptions used in the valuation model. 2 Represents the Change in fair value of MSRs primarily due to changes in estimated portfolio delinquencies and foreclosures. 3 Core earnings (pre-tax) and (after-tax) and Core earnings per share attributable to PHH Corporation are measures that do not conform with GAAP. See "Non-GAAP Financial Measures Reconciliation" included in this presentation for reconciliation required under regulation G |
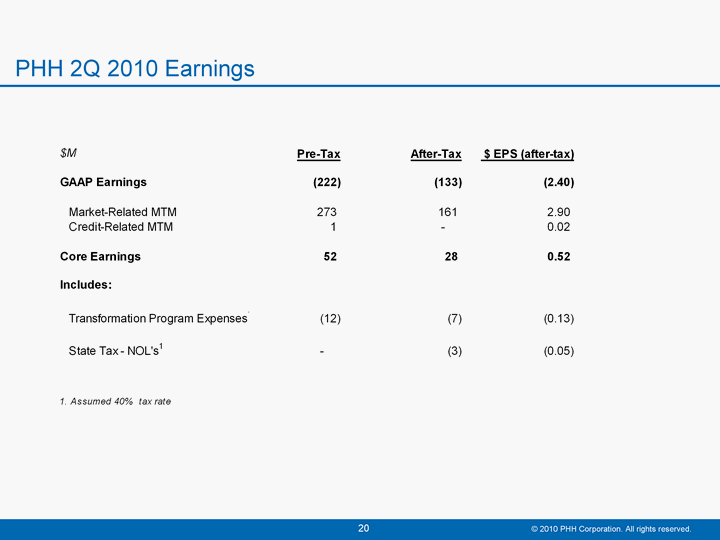
| PHH 2Q 2010 Earnings |
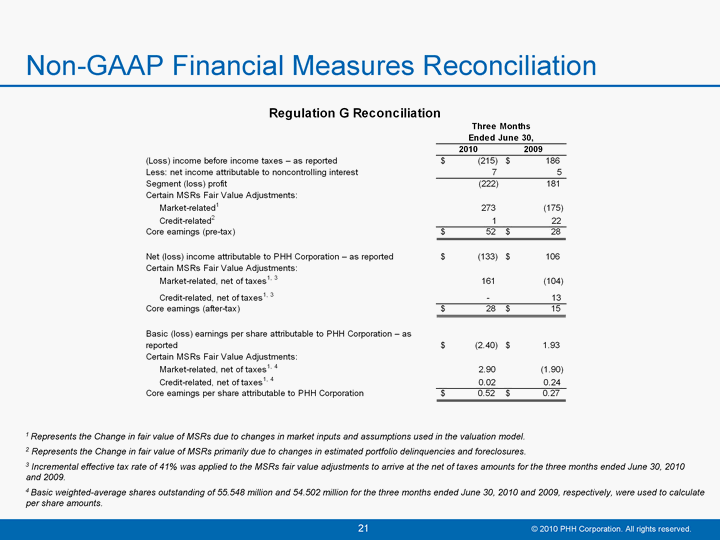
| Non-GAAP Financial Measures Reconciliation 1 Represents the Change in fair value of MSRs due to changes in market inputs and assumptions used in the valuation model. 2 Represents the Change in fair value of MSRs primarily due to changes in estimated portfolio delinquencies and foreclosures. 3 Incremental effective tax rate of 41% was applied to the MSRs fair value adjustments to arrive at the net of taxes amounts for the three months ended June 30, 2010 and 2009. 4 Basic weighted-average shares outstanding of 55.548 million and 54.502 million for the three months ended June 30, 2010 and 2009, respectively, were used to calculate per share amounts. |
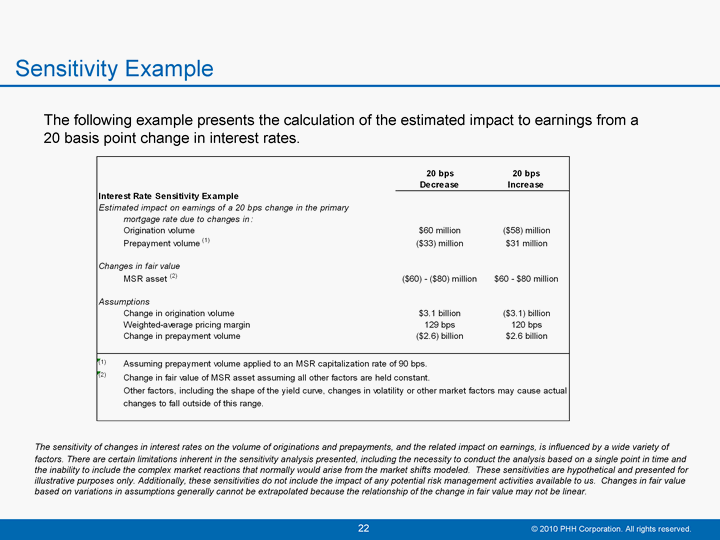
| Sensitivity Example The following example presents the calculation of the estimated impact to earnings from a 20 basis point change in interest rates. The sensitivity of changes in interest rates on the volume of originations and prepayments, and the related impact on earnings, is influenced by a wide variety of factors. There are certain limitations inherent in the sensitivity analysis presented, including the necessity to conduct the analysis based on a single point in time and the inability to include the complex market reactions that normally would arise from the market shifts modeled. These sensitivities are hypothetical and presented for illustrative purposes only. Additionally, these sensitivities do not include the impact of any potential risk management activities available to us. Changes in fair value based on variations in assumptions generally cannot be extrapolated because the relationship of the change in fair value may not be linear. |
