Attached files
UNITED STATES SECURITIES AND EXCHANGE COMMISSION
Washington, D.C. 20549
Form 10-K
þ | ANNUAL REPORT PURSUANT TO SECTION 13 OR 15(d) OF THE SECURITIES EXCHANGE ACT OF 1934 |
For the fiscal year ended December 31, 2017 | |
OR | |
o | TRANSITION REPORT PURSUANT TO SECTION 13 OR 15(d) OF THE SECURITIES EXCHANGE ACT OF 1934 |
For the transition period from _______to_______ | |
Commission File No. 1-7797
PHH CORPORATION
(Exact name of registrant as specified in its charter)
MARYLAND (State or other jurisdiction of incorporation or organization) | 52-0551284 (I.R.S. Employer Identification Number) | |
3000 LEADENHALL ROAD MT. LAUREL, NEW JERSEY (Address of principal executive offices) | 08054 (Zip Code) | |
856-917-1744
(Registrant’s telephone number, including area code)
SECURITIES REGISTERED PURSUANT TO SECTION 12(b) OF THE ACT:
TITLE OF EACH CLASS | NAME OF EACH EXCHANGE ON WHICH REGISTERED | |||
Common Stock, par value $0.01 per share | The New York Stock Exchange | |||
SECURITIES REGISTERED PURSUANT TO SECTION 12(g) OF THE ACT: None
Indicate by check mark if the registrant is a well-known seasoned issuer, as defined in Rule 405 of the Securities Act. Yes o No þ
Indicate by check mark if the registrant is not required to file reports pursuant to Section 13 or Section 15(d) of the Securities Act. Yes o No þ
Indicate by check mark whether the registrant (1) has filed all reports required to be filed by Section 13 or 15(d) of the Securities Exchange Act of 1934 during the preceding 12 months (or for such shorter period that the registrant was required to file such reports), and (2) has been subject to such filing requirements for the past 90 days. Yes þ No o
Indicate by check mark whether the registrant has submitted electronically and posted on its corporate Web site, if any, every Interactive Data File required to be submitted and posted pursuant to Rule 405 of Regulation S-T (§232.405 of this chapter) during the preceding 12 months (or for such shorter period that the registrant was required to submit and post such files). Yes þ No o
Indicate by check mark if disclosure of delinquent filers pursuant to Item 405 of Regulation S-K (§229.405 of this chapter) is not contained herein, and will not be contained, to the best of registrant’s knowledge, in definitive proxy or information statements incorporated by reference in Part III of this Form 10-K or any amendment to this Form 10-K. o
Indicate by check mark whether the registrant is a large accelerated filer, an accelerated filer, a non-accelerated filer, a smaller reporting company, or emerging growth company. See definitions of “large accelerated filer,” “accelerated filer,” “smaller reporting company,” and "emerging growth company" in Rule 12b-2 of the Exchange Act.
(Check one): Large accelerated filer þ Accelerated filer o Non-accelerated filer o (Do not check if a smaller reporting company) Smaller reporting company o Emerging growth company o
If an emerging growth company, indicate by check mark if the registrant has elected not to use the extended transition period for complying with any new or revised financial accounting standards provided pursuant to Section 13(a) of the Exchange Act. o
Indicate by check mark whether the registrant is a shell company (as defined in Rule 12b-2 of the Exchange Act). Yes o No þ
The aggregate market value of our Common stock held by non-affiliates of the registrant as of June 30, 2017 was $639 million.
As of February 22, 2018, 32,551,759 shares of PHH Common stock were outstanding.
Documents Incorporated by Reference: Portions of the registrant’s definitive Proxy Statement for the 2018 Annual Meeting of Stockholders, which will be filed by the registrant on or prior to 120 days following the end of the registrant’s fiscal year ended December 31, 2017 are incorporated by reference in Part III of this Report.
TABLE OF CONTENTS
Page | |||
Except as expressly indicated or unless the context otherwise requires, the “Company,” “PHH,” “we,” “our” or “us” means PHH Corporation, a Maryland corporation, and its subsidiaries.
CAUTIONARY NOTE REGARDING FORWARD-LOOKING STATEMENTS
Certain statements in this Annual Report on Form 10-K are forward-looking statements within the meaning of the Private Securities Litigation Reform Act of 1995. Forward-looking statements may also be made in other documents filed or furnished with the SEC or may be made orally to analysts, investors, representatives of the media and others.
Generally, forward-looking statements are not based on historical facts but instead represent only our current beliefs regarding future events. All forward-looking statements are, by their nature, subject to risks, uncertainties and other factors. Investors are cautioned not to place undue reliance on these forward-looking statements. Such statements may be identified by words such as “expects,” “anticipates,” “intends,” “projects,” “estimates,” “plans,” “may increase,” “may fluctuate” and similar expressions or future or conditional verbs such as “will,” “should,” “would,” “may” and “could”. Forward-looking statements contained in this Form 10-K include, but are not limited to, statements concerning the following:
• | our expectations related to our strategic actions, their outcomes or the timing of any such actions, including our proposed Merger with Ocwen Financial Corporation ("Ocwen"), our estimates of transaction proceeds, operating losses and exit costs, the amount, timing and our expected use of any proceeds, and any other anticipated impacts on our results, client and counterparty relationships, debt arrangements, employee relations or expected value to shareholders; |
▪ | our projected financial results and expected capital structure for the remaining business after executing our strategic actions based on our assessment of the market for subservicing and portfolio retention services, our business strategy, our competitive position and our ability to execute; |
• | our expectations related to any future strategic actions; |
▪ | the method, amounts and timing of any capital returns to shareholders; |
▪ | the potential results of our subservicing business development efforts and actions to improve portfolio retention results; |
▪ | anticipated future origination volumes and loan margins in the mortgage industry; |
▪ | our expectations of the impacts of regulatory changes on our business; |
▪ | our assessment of legal and regulatory proceedings, other contingencies and reserves, and the associated impact on our financial statements and liquidity position; and |
▪ | the impact of the adoption of recently issued accounting pronouncements on our financial statements. |
Actual results, performance or achievements may differ materially from those expressed or implied in forward-looking statements due to a variety of factors, including but not limited to the factors listed and discussed in “Part I—Item 1A. Risk Factors” in this Form 10-K and those factors described below:
▪ | the effects of our strategic actions, and any associated transactions, on our business, management resources, customer, counterparty and employee relationships, capital structure and financial position; |
▪ | our ability to execute and complete our remaining strategic actions and implement changes to meet our operational and financial objectives, including (i) completing the wind-down and transitions of our PLS business and Real Estate channel; (ii) restructuring our shared services platform; (iii) achieving our growth objectives and assumptions and (iv) completing our proposed Merger with Ocwen; |
▪ | any failure to execute any portion of the sales of private MSRs under our existing agreements, or realize estimated proceeds from the transactions, which may be driven by the following reasons, among other factors: (i) not receiving required private loan investor, trustees and/or client (originations source) approvals; (ii) changes in the composition of the portfolio and related servicing advances outstanding on each sale date; and (iii) not meeting any other conditions precedent to closing, as defined in the respective agreements; |
▪ | available excess cash from our strategic actions is dependent upon a variety of factors, including the execution of the sale of our private MSRs, the monetization of the remaining assets and liabilities of PHH Home Loans, LLC, the successful completion of our PLS exit activities within our total expense estimates for such activities, the resolution of our outstanding legal and regulatory matters and the successful completion of other restructuring and capital management activities, including any unsecured debt repayments, in accordance with our assumptions; |
1
▪ | the effects of any significant reduction in subservicing units, whether by termination of our subservicing agreements or by transfers of units out of our portfolio, by any of our largest subservicing clients on a material portion of our subservicing portfolio; |
▪ | the ability to maintain our relationships with our existing clients, including our ability to comply with the terms of our private label and subservicing client agreements and any related service level agreements; |
▪ | the inability or unwillingness of any of the counterparties to our significant customer contracts, hedging agreements, or financing arrangements to perform their respective obligations under such contracts, or to renew on terms favorable to us, if at all; |
▪ | the effects of market volatility or macroeconomic changes and financial market regulations on the availability and cost of our financing arrangements, the value of our assets and the housing market; |
▪ | the effects of changes in current interest rates on our business, the value of our mortgage servicing rights and our financing costs; |
▪ | the impact of changes in U.S. financial conditions and fiscal and monetary policies, or any actions taken or to be taken by the U.S. Department of the Treasury and the Board of Governors of the Federal Reserve System on the credit markets and the U.S. economy; |
▪ | the effects of any significant adverse changes in the underwriting criteria or the existence or programs of government-sponsored entities, such as Fannie Mae and Freddie Mac, including any changes caused by the Dodd-Frank Wall Street Reform and Consumer Protection Act or other actions of the federal government; |
▪ | the ability to maintain our status as a government sponsored entity-approved seller and servicer, including the ability to continue to comply with the respective selling and servicing guides, our ability to operationalize changes necessary to comply with updates to such guides and programs and our ability to maintain the required minimum capital; |
▪ | the effects of changes in, or our failure to comply with, laws and regulations, including mortgage- and real estate-related laws and regulations and those that we are exposed to through our private label relationships until the complete exit from this business channel; |
▪ | the effects of the outcome or resolutions of any inquiries, investigations or appeals related to our mortgage origination or servicing activities, any litigation related to our mortgage origination or servicing activities, or any related fines, penalties and increased costs, and the associated impact on our liquidity; |
▪ | the ability to obtain or renew financing on acceptable terms, if at all, to finance our mortgage loans held for sale and servicing advances; |
▪ | the ability to operate within the limitations imposed by our financing arrangements and to maintain or generate the amount of cash required to service our indebtedness and operate our business; |
▪ | any failure to comply with covenants or asset eligibility requirements under our financing arrangements; and |
▪ | the effects of any failure in or breach of our technology infrastructure, or those of our outsource providers, or any failure to implement changes to our information systems in a manner sufficient to comply with applicable laws, regulations and our contractual obligations. |
Forward-looking statements speak only as of the date on which they are made. Factors and assumptions discussed above, and other factors not identified above, may have an impact on the continued accuracy of any forward-looking statements that we make. Except for our ongoing obligations to disclose material information under the federal securities laws, we undertake no obligation to release publicly any revisions to any forward-looking statements. For any forward-looking statements contained in any document, we claim the protection of the safe harbor for forward-looking statements contained in the Private Securities Litigation Reform Act of 1995.
2
PART I
Item 1. Business |
Overview |
Background
We were incorporated in 1953 as a Maryland corporation. For periods between April 30, 1997 and February 1, 2005, we were a wholly owned subsidiary of Cendant Corporation (now known as Avis Budget Group, Inc.) and its predecessors and provided mortgage banking services, facilitated employee relocations and provided vehicle fleet management and fuel card services. On February 1, 2005, we began operating as an independent, publicly traded company pursuant to our spin-off from Cendant. On July 1, 2014, we sold our Fleet Management Services business and began operating as a stand-alone mortgage business.
Our mortgage business has provided outsourced mortgage banking services to a variety of clients, including financial institutions and real estate brokers throughout the U.S. and focused on originating, selling, servicing and subservicing residential mortgage loans through our wholly-owned subsidiary, PHH Mortgage Corporation and its subsidiaries (collectively, “PHH Mortgage”). In March 2016, we announced that Management and our Board of Directors were undertaking a comprehensive review of all strategic options for our company. The strategic actions resulting from that review process include transitioning our operations into a capital-light business model comprised of subservicing and portfolio retention services and are described below.
Proposed Merger with Ocwen Financial Corporation
On February 27, 2018, we entered into a definitive Agreement and Plan of Merger with Ocwen Financial Corporation (“Ocwen”), and POMS Corp (“MergerSub”) pursuant to which all of PHH’s outstanding common stock will be acquired by Ocwen in a merger of PHH with and into MergerSub with PHH surviving (the “Merger”) in an all cash transaction valued at approximately $360 million, or $11.00 per share on a fully-diluted basis. Our Board of Directors has unanimously approved the Merger. The Merger is subject to, in addition to various other customary closing conditions; approval by our stockholders; antitrust, state licensing, and other governmental and regulatory approvals; and PHH maintaining cash and adjusted net worth above certain thresholds.
See “Part I—Item 1A. Risk Factors—Risks Related to Our Strategies—"We may fail to consummate the proposed Merger, and uncertainties related to the consummation of the Merger may have a material adverse effect on our business, financial position, results of operations and cash flows, and negatively impact the price of our Common stock." in this Form 10-K.
2017 Strategic Actions
We made significant progress on executing our strategic actions throughout 2017 as outlined in more detail below:
• | In November 2016, we announced our intentions to exit our Private Label Services origination business ("PLS") and we incurred operating losses related to PLS of $93 million during the year ended December 31, 2017. We estimate that we will incur additional operating losses in the Mortgage Production segment related to PLS in 2018, including maintaining the support and compliance infrastructure needed to comply with both regulatory and contractual requirements during the exit from the PLS business. We accepted our last application from our PLS clients during the fourth quarter of 2017, and we expect to be substantially complete with the wind-down of the PLS business by the end of the first quarter of 2018, subject to certain transition support requirements. |
• | During 2017, we completed the delivery of $661 million of Mortgage servicing rights ("MSRs") and advances under our sale agreements with New Residential Mortgage, LLC ("New Residential") and Lakeview Loan Servicing LLC ("Lakeview"), and pursuant to ordinary course sales to other third parties. As part of these sales, we increased our subservicing and portfolio retention units through agreements with New Residential. As of December 31, 2017, we have $149 million of MSRs and advances committed for sale with New Residential and other third parties, and the completion of these sales are subject to a number of approvals and other closing requirements. |
• | Between August 2017 and December 2017, we completed the sale of certain assets of PHH Home Loans, LLC (“PHH Home Loans”) to Guaranteed Rate Affinity, LLC (“GRA”), a new joint venture established by Guaranteed Rate, Inc. and Realogy Holdings Corp. (“Realogy”). In total, we received $70 million of cash for the asset sales during 2017, and we recognized a pre-tax gain on sale of $35 million in our financial statements for our 50.1% share. Under the terms of the agreement, the cash received from these asset sales is shared pro-rata with the minority interest holder. We expect to |
3
liquidate the residual assets of PHH Home Loans, and we have agreed to purchase Realogy's membership interests at book value on or before March 19, 2018. At the completion of these actions, we expect to discontinue the operations of our Real Estate channel.
• | From the actions described above, and our efforts to reduce our shared service infrastructure to our targeted staffing levels, we have reduced our headcount from approximately 3,500 at the end of 2016 to approximately 1,365 at the end of 2017. |
We continue our transition to a capital-light business comprised of our subservicing and portfolio retention businesses. A successful transition is contingent upon completing our exit from the PLS business and Real Estate channel, restructuring our remaining business and shared services platform to our targeted cost structure and achieving certain growth objectives and assumptions. Additional information regarding these actions, risks specific to our ability to achieve these actions and risks related to the potential outcomes of these actions and our future business model is provided in “Part II—Item 7. Management’s Discussion and Analysis of Financial Condition and Results of Operations—Executive Summary.”
Also, refer to “Part I—Item 1A. Risk Factors—Risks Related to Our Strategies—We are exposed to risks related to our continued efforts towards executing our remaining strategic actions, and any failures to execute anticipated actions, in whole or in part, any variances from our estimate of proceeds or costs, or any losses realized from related contractual contingencies, could materially and adversely affect our business, financial position, results of operations and cash flows, and there can be no assurance that such actions will be beneficial to our shareholders." and "Our operations have not been profitable in recent years, and we have changed the focus of our business to subservicing and portfolio retention activities to improve our financial results. The industry in which we operate in is highly competitive, and our success depends on our ability to attract and retain clients to achieve scale and meet competitive challenges, which may be negatively impacted by client perceptions of a lack of history operating as a focused player in this market, as well as from our actions, including any past or future efforts towards executing our strategic actions. We may not be able to fully or successfully execute or implement our business strategies or achieve our objectives, and our actions taken may not have the intended result." in this Form 10-K.
Segments |
Our business activities are organized and presented in two operating segments: Mortgage Production and Mortgage Servicing. A description of each operating segment is presented below with further details and discussions of each segment’s results of operations presented in “Part II—Item 7. Management’s Discussion and Analysis of Financial Condition and Results of Operations—Results of Operations”. Also refer to Note 18, 'Segment Information' in the accompanying Notes to Consolidated Financial Statements for a discussion of our Net revenues, Segment profit or loss and Total assets attributable to each segment.
Mortgage Production
Throughout 2017, our Mortgage Production segment provided private label mortgage services to financial institutions and real estate brokers, and portfolio retention services to subservicing clients. As we are exiting our PLS business and Real Estate channel, our future mortgage originations will be sourced solely through portfolio retention services. We believe we will be in a position to substantially exit the PLS business and Real Estate channel by the end of the first quarter of 2018, subject to certain transition support requirements associated with our PLS clients.
We generate revenue through fee-based mortgage loan origination services and the origination and sale of mortgage loans into the secondary market, which are referred to as saleable loans. PHH Mortgage generally sells all saleable mortgage loans that it originates to secondary market investors within 30 days of origination. During 2017, 44% of our mortgage loans were sold to, or were sold pursuant to, programs sponsored by Fannie Mae, Freddie Mac or Ginnie Mae and the remaining were sold to private investors. While purchase activity is subject to seasonal trends that reflect the pattern in the national housing market of home sales typically rising during the spring and summer seasons and declining during the fall and winter seasons, refinance activity is less impacted by seasonality since it is primarily driven by prevailing mortgage rates relative to borrowers’ current interest rate, home prices and levels of home equity.
During the year ended December 31, 2017, our mortgage loan originations were derived from the following significant client relationships, all of which are part of the PLS business and Real Estate channel:
• | 30% through a PLS relationship with Morgan Stanley Private Bank, N.A.; |
• | 15% through a PLS relationship with HSBC Bank USA ("HSBC"); and |
4
• | 28% through the Company's relationship with Realogy and its affiliates, substantially all of which was originated by PHH Home Loans. |
A summary of our platforms and channels follow, with the percentage of our loan closing dollars that each represent:
• | Retail - Portfolio Retention (6% in 2017 compared to 3% in 2016) |
We record portfolio retention results in our PLS channel. Portfolio retention services are a product offered to our subservicing clients in an effort to mitigate potential MSR runoff with the replenishment of new MSRs for our clients, which allows us to subservice the new loan. Originations under our portfolio retention services are sold into the secondary market as saleable loans, and include both purchase and refinance closings.
We provide portfolio retention services to New Residential and another key client associated with our significant subservicing client relationships, which represented a combined 77% concentration of our total subservicing portfolio as of December 31, 2017. Our portfolio defense agreements cease upon the termination of the related client subservicing relationship, or as units transfer out of our servicing portfolio to a new servicer. In addition, for a majority of our solicitable portfolio, we are authorized to seek refinance of mortgage loans on a non-exclusive basis, which may further limit our future mortgage loan originations since we must compete with other originators.
We compete to refinance or provide new mortgages to borrowers whose mortgages are in our existing servicing portfolio. We face intense competition in most areas, including product offerings, rates, fees and customer service. The reputation of our origination and servicing businesses and the quality of experience a borrower may have had within our servicing platform have become increasingly important factors. In addition, over the past several years, there have been many new market participants who are trying to reinvent certain aspects of the financial industry and mortgage experience. As a result, the origination industry could become even more competitive if new market participants are successful in capturing market share. We believe our competitive strengths arise from our role as a mortgage servicer, which provides us with an existing customer relationship to capture refinance or purchase volume from our servicing portfolio, and from the quality of our servicing platform and customer service experience.
For more information, see "—Risk Management—Counterparty and Concentration Risk" and “Part I—Item 1A. Risk Factors—Risks Related to Our Strategies—Our remaining business will be focused on subservicing and portfolio retention activities, and we have significant client concentration risk related to the percentage of subservicing and portfolio retention activities from agreements with New Residential Mortgage, LLC and Pingora Loan Servicing, LLC. Further, the terms of a significant portion of our subservicing agreements allow the owners of the servicing to terminate the subservicing agreement without cause which would also terminate any related portfolio defense agreements."
• | Retail - Private Label (66% in 2017 compared to 76% in 2016) |
Our PLS business includes offering mortgage outsource solutions to wealth management firms, regional banks and community banks. All loans originated in this channel are originated and funded in the private label clients' names. We principally generate revenue from the PLS business through the receipt of origination assistance fees from our private label clients, earned as a stated amount per loan for all fee-based and saleable loans, as well as the gain on loans sold into the secondary market for saleable loans, earned as a percentage of the unpaid principal balance sold. Once the exit of this channel is complete, the PLS business will not be part of our future operations.
To facilitate our PLS exit, in March 2017, we closed our transaction with LenderLive Network, LLC ("LenderLive") to transfer our lease interests in Jacksonville, Florida along with the sale of information technology and other equipment and fixtures. We entered into a master services agreement to outsource certain processing, underwriting and closing services that we are contractually obligated to provide to certain of our PLS clients to LenderLive. In December 2017, we provided notice to LenderLive to terminate this agreement effective on March 31, 2018.
• | Retail - Real Estate (28% in 2017 compared to 20% in 2016) |
Within our Real Estate channel, substantially all of the saleable loans were originated through PHH Home Loans. PHH Home Loans sells its loan originations to third parties on a servicing-released basis or to PHH Mortgage. PHH Mortgage sells loans to, or pursuant to programs sponsored by, Fannie Mae, Freddie Mac and Ginnie Mae, or to private investors. The Real Estate channel principally generates revenue from the receipt of origination and application fees, earned on a per loan basis, as well as the gain on sale of loans sold into the secondary market, earned as a percentage of the unpaid principal balance of loans sold.
5
We provided mortgage origination services for brokers associated with brokerages owned or franchised by Realogy and other third-party brokers, through our joint venture with Realogy, PHH Home Loans. Through our affiliations with real estate brokers, we have access to home buyers at the time of purchase. Substantially all of the originations through the real estate channel are originated from Realogy and brokers associated with Realogy's franchised brokerages. See Note 17, 'Variable Interest Entities' in the accompanying Notes to Consolidated Financial Statements.
Sale of PHH Home Loans assets. On February 15, 2017, we entered into agreements with GRA to sell certain assets of PHH Home Loans and its subsidiaries, including its mortgage origination and processing centers and the majority of its employees. We have executed on the transaction through five asset sale closings, and we intend to exit the existing joint venture relationship with Realogy through our purchase of their interests in the entity in the first quarter of 2018. Once the wind-down of the remaining mortgage pipeline at December 31, 2017 is complete, the Real Estate channel will not be part of our future operations.
• | Wholesale/Correspondent (0% in 2017 compared to 1% in 2016) |
There was no activity in this channel during 2017. We exited the Wholesale/Correspondent channel in the second quarter of 2016 due to its subpar profitability and our intentions to reduce our investment in MSRs.
Mortgage Servicing
Our Mortgage Servicing segment services mortgage loans originated by PHH Mortgage where we retained the MSRs and where we act as a subservicer for clients that own the underlying servicing rights. During 2017, through the completion of MSR sales, we shifted the composition of our servicing portfolio to primarily subserviced loans. According to Inside Mortgage Finance, PHH Mortgage was the 5th largest mortgage loan subservicer at September 30, 2017.
We service loans on behalf of the investors or owners of the underlying mortgage or MSRs, and because we do not hold loans for investment purposes, we only have exposure to credit risk to the extent we are required to make servicing advances. Our subservicing agreements generally contain provisions that require the subservicing client to pre-fund advances on the subserviced loans or to reimburse us for those advances on a periodic basis. Servicing consists of collecting loan payments, remitting principal and interest payments to investors, managing escrow funds for the payment of mortgage-related expenses such as taxes and insurance, performing loss mitigation activities on behalf of investors and otherwise administering our mortgage loan servicing portfolio. Our Mortgage Servicing segment is generally not subject to seasonal trends.
For a discussion of the geographic concentrations of properties in our total servicing portfolio, see “Part II—Item 7. Management’s Discussion and Analysis of Financial Condition and Results of Operations—Risk Management—Counterparty and Concentration Risk—Servicing.”
The following description provides a summary of our servicing activities for our expanding subservicing portfolio and activities related to our capitalized servicing portfolio. The Servicing portfolio statistics below are shown as either portfolio unpaid principal balance (UPB) or based on units, depending on the revenue driver of each respective activity:
• | Subservicing (approximately 629,000 units for 2017, compared to 265,000 from 2016) |
We service loans on behalf of our clients who own the underlying servicing rights. Since we do not own the right to service the loan, we do not recognize an asset in our Consolidated Financial Statements, except where we sold MSRs that did not qualify for sale accounting treatment and are accounted for as a secured borrowing. We principally generate revenue based upon a stated fee per loan that varies based on the delinquency status. Subservicing fee revenue is generally less than the servicing fee received by the owner of the MSR; however, subservicers generally do not retain interest rate exposure and related revenue volatility from MSR fair value changes, or the obligation to fund curtailment interest expense and payoff-related costs. Additionally, our exposure to foreclosure-related costs and losses is generally limited in our subservicing relationships as those risks are retained by the owner of the MSR.
We have significant client concentration risk related to the percentage of our subservicing portfolio that is under agreements with a small group of key clients. As of December 31, 2017, we had significant subservicing concentrations with New Residential and Pingora Loan Servicing, LLC which represented 58% and 19%, respectively, of our subservicing portfolio units. The terms of a substantial portion of our subservicing agreements allow the owners of the servicing to terminate the subservicing agreement without cause, or to otherwise significantly decrease the number of loans we subservice on their behalf, at any time, without cause, and with limited notice and negligible compensation. We expect the transfer of
6
approximately 115,000 subservicing units off of our platform between May 2018 and April 2019, based upon receipt in February 2018 of formal notices and verbal indications from two of our largest subservicing clients. Approximately 65,000 of these units are subject to a portfolio defense agreement and will no longer be solicitable units upon transfer to a new servicer. There can be no assurances that our subservicing agreements or relationships will not be subject to further change.
For more information, see "—Risk Management—Counterparty and Concentration Risk" and “Part I—Item 1A. Risk Factors—Risks Related to Our Strategies—Our remaining business will be focused on subservicing and portfolio retention activities, and we have significant client concentration risk related to the percentage of subservicing and portfolio retention activities from agreements with New Residential Mortgage, LLC and Pingora Loan Servicing, LLC. Further, the terms of a significant portion of our subservicing agreements allow the owners of the servicing to terminate the subservicing agreement without cause which would also terminate any related portfolio defense agreements."
The subservicing target market is comprised of independent mortgage bankers, community banks, credit unions and other mortgage investors. The size of the subservicing market is dependent on the following: (i) the rate of prepayment speeds and the size of the home purchase market; (ii) lack of operational scale for smaller MSR owners who may need a subservicing partner to keep pace with consumer, regulatory and investor requirements; and (iii) MSR ownership by financial investors who do not have in-house servicing capability. We believe that we are well positioned to grow commensurate with the overall market due to the quality of our subservicing platform, established compliance management system and portfolio retention services offering.
The subservicing market in which we operate is highly competitive. We compete with non-bank servicers, such as Cenlar FSB, Dovenmuehle Mortgage, Inc., LoanCare and Nationstar Mortgage Holdings, Inc., and we face competition related to pricing and service delivery. Competition in the industry is also driven by compliance with local, state, federal and investor regulations or requirements, technology and the maintenance of appropriate scale. While subservicers generally are not exposed to interest rate risk, they are exposed to portfolio runoff that needs to be managed through client growth, flow arrangements for new loans or additions through portfolio retention services. We continue to believe there will be growing demand for subservicing and that we are well positioned in this market based upon the quality of our subservicing platform, established compliance management system and portfolio retention services offering. We also believe that our portfolio retention offering can differentiate us from our competition.
• | Owned Capitalized Servicing ($8.6 billion of UPB for 2017, a 90% decline from 2016) |
We own the right to service loans owned by investors, which typically result from the sale and securitization of loans we originate. We recognize an MSR asset in our Consolidated Financial Statements and have elected to mark this portfolio to fair value each quarter. We principally generate revenue through contractual fees earned from our MSRs, which are a stated percentage of the unpaid principal balance of current performing loans. As the MSR owner, there are several instances where we are obligated to make servicing advances to fund scheduled principal, interest, tax and insurance payments that the mortgage loan borrower has failed to make and to cover foreclosure costs and various other items that are required to preserve the assets being serviced. These servicer advance obligations require significant capital and liquidity in order to fund the advances until we are contractually authorized to be reimbursed from the loan investor. As described above, the decline in owned capitalized servicing during 2017 was due to the completion of a significant portion of our MSR sales, which shifted the composition of our servicing portfolio to primarily subserviced loans.
We do not anticipate retaining a significant amount of capitalized MSRs in the future. As of December 31, 2017, we have commitments to sell MSRs and related advances, representing $6.5 billion of unpaid principal balance, for $39 million in MSR fair value and $110 million of related servicing advances. The final net proceeds we may receive from the remaining MSR sales is dependent on the amount of investor and origination source consents received, the portfolio composition and servicing advances outstanding at each transfer date and transaction costs.
Our sales of MSRs and sale or collection of advances generated $727 million of total cash inflows during the year ended December 31, 2017. Significant sales of MSRs during 2017 included the following:
Lakeview Sale. In November 2016, the Company entered into an agreement to sell substantially all of its Ginnie Mae ("GNMA") MSRs and related advances to Lakeview. In a series of three transactions, we sold a total of $107 million GNMA MSRs and related advances to Lakeview, representing $13.2 billion of UPB. The subservicing responsibilities with respect to these MSRs were transferred to a third party and we have no continuing involvement with these loans.
7
New Residential Sale. On December 28, 2016, the Company entered into an agreement to sell substantially all of its portfolio of MSRs and related advances, excluding the GNMA MSRs sold to Lakeview, to New Residential. The agreement provided that we will perform the subservicing for these loans for an initial period of three years, subject to certain transfer and termination provisions. Between June 2017 and December 2017, we sold a total of $501 million MSRs and related advances to New Residential, representing $54.0 billion of UPB. All of the sales with New Residential were accounted for as a secured borrowing arrangement due to the long-term nature of the subservicing agreement.
Legal and Regulatory Environment |
Our business is subject to extensive federal, state and local regulation. Our loan origination and servicing activities are primarily regulated at the state level by state licensing authorities and administrative agencies, with additional oversight from the Bureau of Consumer Financial Protection (the “CFPB”). The CFPB has rule-making, supervision and examination authority and is responsible for enforcing federal consumer protection laws. In addition to state licensing requirements, we are required to comply with various federal consumer protection and other laws, including but not limited to:
• | the Gramm-Leach-Bliley Act, which requires us to maintain privacy regarding certain consumer data in our possession and to periodically communicate with consumers on privacy matters; |
• | the Fair Debt Collection Practices Act, which regulates the timing and content of debt collection communications; |
• | the Truth in Lending Act, or TILA, and Regulation Z, which requires certain disclosures be made to mortgagors regarding the terms of their mortgage loans; |
• | the Real Estate Settlement Procedures Act, or RESPA, and Regulation X, which require, among other things, certain disclosures to mortgagors regarding the costs of mortgage loans, the administration of escrow accounts, the transferring of mortgage loans, lender-placed insurance and other customer communications; |
• | the TILA-RESPA Integrated Mortgage Disclosure Rule, or TRID, which mandates specific origination and settlement documents and processes; |
• | the Fair Credit Reporting Act, which regulates the use and reporting of information related to the credit history of consumers; |
• | the Equal Credit Opportunity Act and Regulation B, which prohibit discrimination on the basis of age, race and certain other characteristics in the extension of credit; |
• | the Homeowners Protection Act, which requires, among other things, the cancellation of private mortgage insurance once certain equity levels are reached; |
• | the Servicemember’s Civil Relief Act of 2003, which provides military members with certain protections; |
• | the Telephone Consumer Protection Act of 1991, which protects consumers from unwanted auto-dialed or pre-recorded telemarketing calls; |
• | the Home Mortgage Disclosure Act and Regulation C, which require reporting of certain public loan data; and |
• | the Fair Housing Act, which prohibits discrimination in housing on the basis of race, sex, national origin, and certain other characteristics. |
We are also subject to periodic reviews and audits from the Federal Housing Finance Authority (FHFA), Fannie Mae, Freddie Mac, Ginnie Mae, the U.S. Department of Housing and Urban Development, other federal, state and local agencies, various investors and regulators of our clients. Because we are not a depository institution, we do not benefit from a federal exemption to state mortgage banking or loan servicing licensing and regulatory requirements. We must comply with state licensing requirements and varying compliance requirements in all states that we operate in, and we are sensitive to regulatory changes that may increase our costs through stricter licensing laws, disclosure laws or increased fees or that may impose conditions to licensing that we may be unable to meet. In addition, we are subject to periodic examinations by state regulators, which can result in refunds to borrowers of certain fees earned by us, and we may be required to pay substantial penalties imposed by state regulators due to compliance errors.
By agreement with our PLS and certain of our subservicing clients, we are required to comply with additional laws and regulations to which our clients are subject. While we are not a bank, our business subjects us to both direct and indirect banking supervision and each client may require a unique compliance model, which creates complexities and potential inefficiencies in our operations. Laws and regulations we are exposed to through our client relationships include, but are not limited to, the Bank Service Company Act, which permits the regulators of federal financial institutions to examine vendors that provide outsourced services to such regulated financial institutions.
8
In the ordinary course of business, we manage through various regulatory investigations, examinations and inquiries related to our mortgage origination and servicing practices. Our experience is consistent with other companies in the mortgage industry. We defend our positions and/or appeal matters as appropriate when we believe we have meritorious defenses. Alternately, we may engage in settlement discussions on certain matters in order to avoid the additional monetary costs and other business impact of engaging in litigation. For more information, see Note 13, 'Commitments and Contingencies' in the accompanying Notes to Consolidated Financial Statements.
In recent years, there has been heightened regulatory and public scrutiny with regard to origination and servicing practices and there has been a number of developments in laws and regulations and other financial reform legislation that have impacted, or are expected to impact, our business. We continue to work diligently to assess and understand the implications of the recent developments in the regulatory environment. We have devoted substantial resources towards implementing all of the new rules to ensure we continue to maintain regulatory compliance, while, at the same time, working towards meeting the needs and expectations of our clients and the borrowers whose loans we service.
We expect that the continued legislative and regulatory focus on mortgage origination and servicing practices will result in elevated legal, compliance and servicing related costs as well as heightened potential regulatory fines and penalties. For more information, see “Part I—Item 1A. Risk Factors—Legal and Regulatory Risks—Our business is complex and heavily regulated, and there have been continual developments in regulations that impact our businesses. In addition, we are subject to litigation and regulatory investigations, inquiries and proceedings, and we may incur fines, penalties, increased costs, and other consequences that could negatively impact our business, results of operations, liquidity and cash flows or damage our reputation. Any failure of ours to comply with applicable laws, rules, regulations or the terms of agreements with regulators could have a material adverse effect on our business, financial position, results of operations or cash flows.” in this Form 10-K.
The cybersecurity regulatory environment is also evolving, and there have been developments in laws and regulations that have impacted, or are expected to impact, our business. Specifically, the New York Department of Financial Services ("NYDFS") issued final Cybersecurity Requirements for Financial Services Companies that requires financial services and other institutions regulated by the NYDFS, including us, to establish and maintain a cybersecurity program designed to protect consumers and ensure the safety and soundness of New York State’s financial services industry.
See “Part I—Item 1A. Risk Factors—Other Risks—A failure in or breach of our technology infrastructure or information protection programs, or those of our outsource providers, could result in the inadvertent disclosure of the confidential personal information of our customers, as well as the confidential personal information of the customers of our clients. Any such failure or breach, including as a result of cyber-attacks against us or our outsource partners, could have a material and adverse effect on our business, reputation, financial position, results of operations or cash flows." for more information.
Employees |
As of December 31, 2017, we employed approximately 1,365 persons in total. We expect to further reduce our employee headcount during 2018 to our expected future staffing levels of approximately 1,250 employees in 2018. Management considers our employee relations to be satisfactory. None of our employees were covered under collective bargaining agreements during the year ended December 31, 2017.
Available Information |
Our corporate website is www.phh.com. We make our Annual Reports on Form 10-K, Quarterly Reports on Form 10-Q, Current Reports on Form 8-K and amendments to those reports filed or furnished pursuant to Section 13(a) or 15(d) of the Securities Exchange Act of 1934 available free of charge on our website under the tabs “Investors-SEC Reports” as soon as reasonably practicable after they are electronically filed with or furnished to the Securities and Exchange Commission. The public may read and copy our filings with the SEC at the SEC’s Public Reference Room at 100 F Street, NE, Washington, DC 20549. The public may obtain information on the operation of Public Reference Room by calling the SEC at 1-800-SEC-0330. The SEC also maintains a website at www.sec.gov that contains our reports, proxy and information statements, and other information that we electronically file with the SEC.
Our Corporate Governance Guidelines, Code of Business Ethics & Conduct, Code of Ethics for Chief Executive Officer and Senior Financial Officers, and the charters of the committees of our Board of Directors are also available on our corporate website and printed copies are available upon request. We intend to disclose any amendments or waivers to our Code of Business Ethics and Conduct and our Code of Ethics for Chief Executive Officer and Senior Financial Officers on our website at www.phh.com within four business days of the date of such amendment or waiver in lieu of filing a Form 8-K pursuant to Item 5.05 thereof. The information contained on our corporate website is not part of this Form 10-K.
9
Item 1A. Risk Factors |
We are subject to a number of risks potentially impacting our business, financial condition, results of operations and cash flows, many of which are beyond our control. You should carefully consider each of the following risks described below and all of the other information contained in this Annual Report on Form 10-K when evaluating us. You should also consider the information set forth above under “Cautionary Note Regarding Forward-Looking Statements.” The risks and uncertainties described below could materially and adversely affect our business, financial condition and results of operations and cash flows in future periods and are not the only risks facing our Company. Additional risks not currently known to us, or that we currently deem to be immaterial, also may materially adversely affect our business, financial condition or results of operations and cash flows in future periods.
Risks Related to Our Strategies |
We may fail to consummate the proposed Merger, and uncertainties related to the consummation of the Merger may have a material adverse effect on our business, financial position, results of operations and cash flows, and negatively impact the price of our Common stock.
As previously discussed, on February 27, 2018, we announced that we entered into a definitive Agreement and Plan of Merger with Ocwen Financial Corporation (“Ocwen”), and POMS Corp (“MergerSub”) pursuant to which all of PHH’s outstanding common stock will be acquired by Ocwen in a merger of PHH with and into MergerSub with PHH surviving (the “Merger”) in an all cash transaction valued at approximately $360 million, or $11.00 per share on a fully-diluted basis.
The Merger is subject to, in addition to various other customary closing conditions: approval by our stockholders; antitrust, state licensing, and other governmental and regulatory approvals; PHH maintaining a minimum adjusted net worth of a prescribed amount ranging from $393 million to $489 million and a minimum amount of available cash on hand ranging from $293 million to $367 million, in each case depending upon when such condition is tested; the completion of our previously announced purchase of Realogy Corporation’s ownership interests in PHH Home Loans, LLC; and the substantial completion of our previously announced exit from our private label originations business. The measurement date for establishing whether the conditions regarding minimum adjusted net worth and minimum unrestricted cash have been satisfied will be determined following approval of our stockholders and receipt of the regulatory approvals necessary for us to consummate the Merger.
The Merger Agreement contains representations, warranties and covenants of the parties customary for a transaction of this type. Under the terms of the Merger Agreement, we have also agreed to certain covenants, including customary “no shop” restrictions that prohibit us from soliciting, or providing information or entering into discussions concerning proposals relating to alternative business combination transactions, except in response to a bona fide unsolicited written acquisition proposal that our Board of Directors has determined constitute, or is reasonably likely to result in, a Superior Company Proposal (as defined in the Merger Agreement). The Merger Agreement contains certain termination rights by PHH and Ocwen. If the Merger Agreement is terminated under specified circumstances, including due to our acceptance of a Superior Company Proposal prior to approval of the Merger by PHH’s stockholders, we will pay Ocwen a termination fee of approximately $13 million.
There is no assurance that the Merger will occur on the terms and timeline currently contemplated or at all. Potential risks and uncertainties related to the Merger include, but are not limited to, the following:
• | The Merger Agreement generally requires that we operate our business in the ordinary course pending consummation of the proposed Merger and restricts us, without Ocwen’s consent, from taking certain specified actions until the Merger is completed. These restrictions may affect our ability to execute our business strategies and attain our financial and other goals which could negatively impact our business and results of operations. As a result, we may have foregone opportunities that we might have otherwise pursued absent the proposed Merger Agreement. |
• | The efforts to satisfy the closing conditions of the proposed Merger, including the stockholder and regulatory approval processes, may place a significant burden on management and internal resources, and the Merger whether or not consummated, may result in a diversion of management’s attention from our day-to-day operations and result in a disruption of our operations. Any significant diversion of management attention away from our ongoing business and any difficulties encountered in the Merger process could negatively impact our business and results of operations. |
• | The proposed Merger could cause disruptions to our business relationships. Parties with which we have business relationships may experience uncertainty as to the future of such relationships and may delay or defer certain business decisions, seek alternative relationships with third parties or seek to alter their present business relationships us. In |
10
addition, competitors may target our existing customers by highlighting potential uncertainties and difficulties that may result from the Merger.
• | Current and prospective employees may experience uncertainty about their future roles with the combined company following the Merger, which may materially adversely affect our ability to attract, retain and motivate key personnel while the Merger is pending. Key employees may depart because of issues relating to the uncertainty and difficulty of integration or a desire not to remain with the combined company following the Merger. Accordingly, no assurance can be given that we will be able to attract and retain key employees to the same extent that we have been able to in the past. |
• | We could be subject to litigation related to the proposed Merger, which could result in significant costs and expenses. Litigation is very common in connection with the sale of public companies, regardless of whether the claims have any merit. In addition to potential litigation-related expenses, we have incurred and will continue to incur other costs, expenses and fees for professional services and other transaction costs in connection with the proposed Merger, and many of these fees and costs are payable regardless of whether or not the proposed Merger is consummated. |
• | The Merger Agreement contains certain termination rights as described above. If the proposed Merger is not completed or the Merger Agreement is terminated, the price of our Common stock may decline, including to the extent that the current market price of our common stock reflects an assumption that the Merger will be consummated without unexpected delays. |
All of the foregoing could materially and adversely affect our business, financial position, results of operations and cash flows.
We are exposed to risks related to our continued efforts towards executing our remaining strategic actions, and any failures to execute anticipated actions, in whole or in part, any variances from our estimate of proceeds or costs, or any losses realized from related contractual contingencies, could materially and adversely affect our business, financial position, results of operations and cash flows, and there can be no assurance that such actions will be beneficial to our shareholders.
In February 2017, we announced certain strategic actions, including our intentions to transition our business model to operate as a smaller, less capital-intensive business that is focused on subservicing and portfolio retention services. As of December 31, 2017, we have not completed all of our strategic actions necessary to transition to our new business model, and we may be unable to fully or successfully execute or implement our remaining actions, in whole or in part, or within the projected time frame. Remaining actions include, but are not limited to: (i) executing the remaining sales of Mortgage servicing rights, (ii) closing and selling the remaining PLS and Real Estate mortgage pipelines and completing PLS client contractual transition and support requirements; (iii) monetizing our remaining residual assets, including those of our PHH Home Loans joint venture; and (iv) completing our reduction of our overhead cost structure. See further discussion actions completed in 2017, and the remaining actions in "Part II—Item 7. Management’s Discussion and Analysis of Financial Condition and Results of Operations—Executive Summary" of this Form 10-K.
We are exposed to risks specific to the execution of remaining actions and business transitions, including but not limited to:
• | the MSRs and advances committed under our agreement with New Residential Mortgage, LLC ("New Residential") consist of private investor MSRs and related advances and the sale thereof is subject to the approval of multiple counterparties, including private loan investor, trustees and/or client (originations source) approvals, as well as other customary closing requirements; |
• | our need to maintain the appropriate level of overhead through the transition period to support execution of transactions and business transitions, sustain our ongoing client relationships and to maintain compliance with all applicable legal, regulatory, and contractual requirements of our business; |
• | our need to maintain our internal and operational control structures during the business transition period, including managing the transition of control processes to third-party outsource providers; |
• | efforts towards executing our remaining strategic actions could cause management distractions and disruptions in our continuing businesses; and |
• | any disruptions in or uncertainty around our business could affect our relationships with customers and/or other counterparties, may have negative impacts on our ability to obtain or renew financing or wind down the operations of the PLS business and Real Estate channel, among other impacts. |
Additionally, there can be no assurances that these actions will have the impact that we intend on our financial position, results of operations and cash flows. While we have assessed the potential benefits that could be realized, as well as the potential costs and operating losses that could be incurred, as a result of these actions, our assessments and estimates may differ materially from actual costs and the benefits realized. Factors that drive this uncertainty include, among other factors, employee attrition, the expected
11
timing of related actions, and contractual complexities. Any such deviations could materially and adversely affect our business, results of operations, and cash flows, and may not be beneficial to our shareholders.
We have provided certain representations and warranties in our MSR sale agreements. To the extent that we have made inaccurate representations or warranties or fail to perform, we could incur liability to the purchasers of these MSRs pursuant to the contractual provisions of our sale agreements. In addition, transfers of servicing are subject to regulation under federal consumer finance laws, including CFPB rules implementing RESPA that require servicers to, among other things, maintain policies and procedures that are reasonably designed to facilitate the transfer of accurate information and documents during mortgage servicing transfers. While we believe we have complied with these requirements, the CFPB has advised mortgage servicers that its examiners will be carefully reviewing servicers’ compliance with these and other regulations applicable to servicing transfers. Accordingly, we devoted significant time and resources to our compliance efforts in connection with our transfers of mortgage servicing. If we fail to comply with regulations relating to servicing transfers in connection with dispositions of MSRs, we could be subject to adverse regulatory actions, which could materially and adversely affect our business.
In addition, we have provided certain representations and warranties, and assumed other unique risks, in connection with our other transactions and exit activities resulting from our strategic actions, including but not limited to, those associated with certain lease assignments to LenderLive Network, LLC ("LenderLive") and Guaranteed Rate Affinity, LLC ("GRA"). Under the terms of the lease assignments and original facility leases, we remain jointly and severally obligated with LenderLive and GRA and we are subject to risk associated with the nonperformance of these counterparties under the lease agreements.
Our operations have not been profitable in recent years, and we have changed the focus of our business to subservicing and portfolio retention activities to improve our financial results. The industry in which we operate in is highly competitive, and our success depends on our ability to attract and retain clients to achieve scale and meet competitive challenges, which may be negatively impacted by client perceptions of a lack of history operating as a focused player in this market, as well as from our actions, including any past or future efforts towards executing our strategic actions. We may not be able to fully or successfully execute or implement our business strategies or achieve our objectives, and our actions taken may not have the intended result.
We expect to incur continued operating losses in 2018, as we complete the exit of our PLS business and execute our remaining reorganization actions and business transitions. Based on our current assessment of the December 2017 Tax Cuts and Jobs Act ("Tax Act"), which contains provisions that eliminate the net operating loss carryback, we recognized a full valuation allowance against our net deferred tax asset as of December 31, 2017. With respect to our expectations for continued operating losses, we expect to reflect a full valuation allowance and loss of substantially all income tax benefits against such future operating losses. Our assessment of the impact of the Tax Act on our future results is based upon our current interpretation thereof and remains subject to further clarifications.
Our strategic actions to date have allowed us to make progress towards achieving our new business model of operating as a smaller, less capital intensive business that is focused on subservicing and portfolio retention services. We expect to take further actions to achieve long-term sustained profitability for our remaining subservicing and portfolio retention business, including re-engineering our overhead and cost structure to allow our business to be properly supported, and to seek growth in our subservicing and portfolio retention businesses. Our ability to generate revenue from our subservicing and portfolio retention activities and complete the transition to our new business model is highly dependent on the success of our business relationships with our significant clients and our ability to attract new clients, both of which are impacted by our capability to adequately address the competitive challenges we may face.
Competition to service mortgage loans and for mortgage loan originations comes primarily from commercial banks and savings institutions, and non-bank mortgage originators and servicers. Many of our competitors are substantially larger than us and have considerably greater financial, technical and marketing resources, and typically have access to greater financial resources. The competitive nature of the subservicing business creates certain challenges that we will need to manage, including natural runoff of servicing units, our existing significant client concentrations, and short-term contractual arrangements with certain clients which provide them with termination rights at any time without cause. Also, market factors such as higher interest rates, evolving regulations, and potentially volatile capital market conditions may adversely impact demand for MSRs by non-bank investors and create a more challenging environment for subservicing. Our performance is also subject to risks associated with the loss of client or customer confidence and demand, including those associated with any reputational damage from our legal and regulatory settlements and the intense scrutiny of our business. In addition, our success in attracting and retaining clients may be impacted by our continued efforts towards executing our remaining strategic actions, and our ability to demonstrate the viability of our remaining business and stability as a subservicing partner.
12
To achieve our financial objectives for our new business model, we need to realize our cost re-engineering reductions, subservicing growth, and portfolio retention recapture rate assumptions. There can be no assurances that we will execute these actions, or that the execution of these actions will achieve the intended results. The achievement of our goals is subject to both the risks affecting our business generally (including market, credit, operational, and legal and compliance risks) and the inherent difficulty associated with implementing these business objectives. Furthermore, our success is dependent on the skills, experience and efforts of our management team and our ability to negotiate with third parties.
The amount of additional capital returned to shareholders, if any, as a result of our strategic actions may be less than our expectations. Furthermore, there can be no assurances about the method, timing or amounts of any such distributions.
There can be no assurances that we will return additional capital to shareholders, or that any amounts returned will be distributed in any prescribed time frame. Pursuant to the Agreement and Plan of Merger dated as of February 27, 2018 among Ocwen, POMS Corp and PHH, any distributions require the prior consent of Ocwen. The amount of capital available for distribution and the method and timing of such distributions, if any, will depend on several factors, including but not limited to:
• | the execution of the sales of our private MSRs with New Residential, including the receipt of required approvals, the time required to obtain approvals, and the total proceeds realized based on the portfolio composition as of each future transfer date; |
• | our ability to monetize the remaining assets and liabilities of the PHH Home Loans entity and other residual assets; |
• | the completion of our PLS exit, including the amounts of realized exit costs and operating losses, and our ability to substantially complete the exit of that business in our anticipated time frame; |
• | actual amounts of future cash outflows, including anticipated operating losses in the near term related to the transition to our new business model, costs incurred for transactions and restructuring, required payments for our unsecured term debt and any impacts from the Tax Act; |
• | the outcomes of contingencies, including but not limited to MSR sale indemnifications and other contingencies, and the resolution of our outstanding legal and regulatory matters; and |
• | working capital and contingent cash requirements of the remaining business. |
Our remaining business will be focused on subservicing and portfolio retention activities, and we have significant client concentration risk related to the percentage of subservicing and portfolio retention activities from agreements with New Residential Mortgage, LLC and Pingora Loan Servicing, LLC. Further, the terms of a significant portion of our subservicing agreements allow the owners of the servicing to terminate the subservicing agreement without cause which would also terminate any related portfolio defense agreements.
Our subservicing portfolio is subject to runoff, meaning that the loans serviced by us under subservicing agreements may be repaid in full prior to maturity. Additionally, the owners of the servicing rights may elect to sell their MSRs related to some or all of the loans we subservice on their behalf, which could lead to a termination of our subservicing agreements with respect to such loans, resulting in a decrease in our revenues from subservicing. As a result, our subservicing portfolio will continue to shrink as our current additions through flow sales and portfolio retention are insufficient to offset the current level of runoff. Our ability to maintain the size of our subservicing portfolio depends on our ability to enter into agreements for additional subserviced populations with new or existing clients, and increase our portfolio retention recapture rates. Our portfolio retention business is exposed to the same client concentration and termination risks as subservicing described below, as our portfolio retention agreements cease upon the termination of the related client subservicing relationship, or as units transfer out of our subservicing portfolio to a new servicer. In addition, for the majority of our solicitable portfolio, we are authorized to seek refinance of mortgage loans on a non-exclusive basis, which may further limit our future mortgage loan originations since we must compete with other originators.
We have significant client concentration risk related to the percentage of our subservicing portfolio that are under agreements with a small group of key clients, and our portfolio retention agreements are limited to two significant subservicing clients. As of December 31, 2017, 58% and 19% of our subservicing portfolio (by units) related to significant client relationships with New Residential and Pingora Loan Servicing, LLC, respectively. Our subservicing agreement with New Residential became effective in June 2017 upon the initial transfer of MSRs under the sale agreement, and the subservicing agreement contains a three-year initial subservicing term. However, in addition to having the right to terminate the subservicing contract with respect to any MSRs sold by New Residential, New Residential has the right to transfer to another servicer, without cause, 25% of the subservicing units in the second year of the subservicing contract, and an additional 25% of the subservicing units in the third year of the contract. The terms of a substantial portion of our other subservicing agreements allow the owners of the servicing to terminate
13
the subservicing agreement without cause, or to otherwise significantly decrease the number of loans we subservice on their behalf, at any time, without cause, and with limited notice and negligible compensation. Additionally, from time to time, clients for whom we conduct subservicing activities could sell the mortgage servicing rights relating to some or all of the loans we subservice for such client, which could lead to a termination of our subservicing engagement with respect to such mortgage servicing rights and a decrease in our subservicing revenue. In recent periods, we have experienced client-driven reductions in our subservicing portfolio, and we expect the transfer of approximately 115,000 subservicing units off of our platform between May 2018 and April 2019, based upon receipt in February 2018 of formal notices and verbal indications from two of our largest subservicing clients. Approximately 65,000 of these units are subject to a portfolio retention agreement and will no longer be solicitable units upon transfer to a new servicer.
Any terminations or material reductions in our subservicing portfolio would adversely affect our business, financial condition, results of operations and cash flows.
Legal and Regulatory Risks |
Our business is complex and heavily regulated, and there have been continual developments in regulations that impact our businesses. In addition, we are subject to litigation and regulatory investigations, inquiries and proceedings, and we may incur fines, penalties, increased costs, and other consequences that could negatively impact our business, results of operations, liquidity and cash flows or damage our reputation. Any failure of ours to comply with applicable laws, rules, regulations or the terms of agreements with regulators could have a material adverse effect on our business, financial position, results of operations or cash flows.
Our business is subject to extensive regulation by federal, state and local government authorities and may be subject to various judicial and administrative decisions imposing various requirements and restrictions on how we conduct our business. These laws, regulations and judicial and administrative decisions include those pertaining to: real estate settlement procedures; fair lending; fair credit reporting; truth in lending; compliance with federal and state disclosure and licensing requirements; the establishment of maximum interest rates, finance charges and other charges; secured transactions; collection, foreclosure, repossession and claims-handling procedures; other trade practices; and privacy regulations providing for the use and safeguarding of non-public personal financial information of borrowers and guidance on non-traditional mortgage loans issued by the federal financial regulatory agencies. In addition, as an outcome of agreements or orders reached with government regulators, we have been, and may be further subject to, enhanced compliance monitoring, reporting requirements, changes to our business processes and procedures, and other agreements or obligations related to our origination and servicing activities. Further, by agreement with certain of our clients, we are required to comply with additional laws and regulations to which our clients may be subject. While we are not a bank, our business is subjected to both direct and indirect banking supervision (including examinations by certain of our clients' regulators).
In recent years, we have faced intense regulation and vigorous oversight and enforcement on the part of numerous regulatory bodies. Legislatures and regulators have pursued a broad array of initiatives intended to promote the safety and soundness of financial institutions, financial market stability, the transparency and liquidity of financial markets, and consumer and investor protection, many of which have impacted us. Although the new presidential administration has indicated an intent to pursue the regulation of the financial services industry differently than was the case under the previous administration, there is significant uncertainty regarding the direction this presidential administration will take and its ability to implement its policies and objectives, as well as the ultimate impact on potential new regulatory initiatives and the enforcement of existing laws and regulations. In addition, there is uncertainty surrounding the impact changes in federal regulation may have on state and local authorities and administrative agencies and their oversight and enforcement, if any.
Consistent with other mortgage originators and servicers, we are subject to litigation and regulatory investigations, examinations, inquiries and proceedings from regulators and attorneys general of certain states as well as various governmental agencies, with respect to our mortgage lending and/or mortgage servicing practices. In addition, we are defendants in various legal proceedings, including private and civil litigation. Our legal and regulatory matters are at varying procedural stages and the ultimate resolution of any of these matters may result in: (i) adverse judgments, settlements, fines, penalties, injunctions and other relief against us, including, without limitation, payments made in settlement arrangements, monetary payments; (ii) enhanced compliance requirements; (iii) changes in our business processes, procedures or agreements; (iv) limitations on our ability to pursue business strategies; or (v) other agreements and obligations, any of which could have a material adverse effect on our business, financial position, results of operations, liquidity or cash flows. For more information regarding our existing matters, see Note 13, 'Commitments and Contingencies' in the accompanying Notes to Consolidated Financial Statements.
14
We expect the continued legislative and regulatory focus on mortgage origination and servicing practices will result in elevated legal, compliance and servicing-related costs, heightened risk for potential regulatory fines, penalties, and actions required for injunctive relief. There are currently pending numerous additional regulatory proposals, and other new initiatives are likely to be pursued in the future. The implementation of new regulatory requirements and/or limitations could further increase our compliance costs and risks associated with non-compliance, and any such developments may result in limitations on our ability to pursue business strategies or otherwise adversely affect the manner in which we conduct our business. Regulatory investigations, inquiries and proceedings all require a significant amount of our time and resources to manage. The magnitude and complexity of our responses required to meet these demands requires the time and attention of our management, which poses a risk to achieving our business goals and priorities. Further, in our mortgage origination and servicing activities, we are exposed to operational risk and events of non-compliance resulting from inadequate or failed internal processes or systems, human factors, or external events. While we maintain and update our systems and procedures to comply with applicable laws and regulations and devote resources towards managing, assessing and reacting to developments, there can be no assurances that these measures will be effective or that changes will be implemented by the required deadlines.
A failure to comply with applicable laws, rules, regulations or the terms of agreements with regulators could result in:
• | loss of our approvals to engage in our origination and servicing businesses and/or other limitations on our ability to originate or service loans; |
• | damage to our reputation; |
• | government investigations, enforcement actions and litigation; |
• | an inability to execute on our business strategy or otherwise limit the activities we are permitted to engage in; |
• | required payments of fines, penalties, settlements or judgments; and/or |
• | inability to fund our business, or otherwise operate our business. |
Any of these outcomes could have a material adverse effect on our business, financial position, results of operations or cash flows.
Risks Related to Our Business |
We are highly dependent upon programs administered by Fannie Mae, Freddie Mac and Ginnie Mae, including our ability to sell mortgage loans. Changes in the servicing or origination guidelines required by the Agencies, or changes in these entities or their current roles, could have a material adverse effect on our business, financial position, results of operations or cash flows.
Our ability to generate revenues in our Mortgage Production and Servicing segments is highly dependent on programs administered by Fannie Mae, Freddie Mac and Ginnie Mae that facilitate the issuance of mortgage-backed securities in the secondary market. These entities play a powerful role in the residential mortgage industry, and we have significant business relationships with them, including:
Production. During 2017, 44% of our mortgage loan sales were sold to, or were sold pursuant to programs sponsored by, Fannie Mae, Freddie Mac or Ginnie Mae. We also derive other material financial benefits from our relationships with Fannie Mae, Freddie Mac and Ginnie Mae, which include the assumption of credit risk by these entities on loans included in mortgage-backed securities in exchange for our payment of guarantee fees, the ability to avoid certain loan inventory finance costs through streamlined loan funding and sale procedures and the use of mortgage warehouse facilities with Fannie Mae.
Fannie Mae and Freddie Mac have remained in conservatorship and a path forward to emerge from conservatorship is unclear. These roles could be reduced, modified or eliminated and the nature of their guarantees could be limited or eliminated relative to historical measurements. Furthermore, any discontinuation of, or significant reduction in, the operation of these Agencies, any significant adverse change in the level of activity in the primary or secondary mortgage markets or in the underwriting criteria of these Agencies could materially and adversely affect our business, financial condition and results of operations.
Servicing. We service loans on behalf of Fannie Mae and Freddie Mac, as well as loans that have been securitized pursuant to securitization programs sponsored by Fannie Mae, Freddie Mac and Ginnie Mae. As of December 31, 2017, 57% of our mortgage servicing rights and loans serviced through subservicing agreements pertain to these programs, and we are subject to the servicing guidelines set by these Agencies.
Our status as a Fannie Mae, Freddie Mac and Ginnie Mae approved seller/servicer is subject to compliance with each entity’s respective selling and servicing guidelines and failure to meet such guidelines could result in the unilateral termination of our status as an approved seller/servicer. We cannot negotiate these terms with the Agencies and they are subject to change at any
15
time. A significant change in these guidelines that has the effect of decreasing the fees we charge or requires us to expend additional resources in providing mortgage servicing could decrease our revenues or increase our costs, which would adversely affect our business, financial position, results of operations or cash flows. In addition, changes in the nature or extent of the guarantees provided by Fannie Mae and Freddie Mac or the insurance provided by the FHA could have broad adverse market implications. The fees that we are required to pay to the Agencies for these guarantees have changed significantly over time and any future increases in these fees would adversely affect our business, financial condition and results of operations. Failure to maintain our relationship with each of Fannie Mae, Freddie Mac and Ginnie Mae would result in the termination of many of our agreements with our private label and subservicing clients and otherwise would materially and adversely affect our business, financial position, results of operations and cash flows.
Our mortgage asset-backed debt arrangements, a significant portion of which are short-term agreements, are an important source of our liquidity. If any of our funding arrangements are terminated, not renewed or otherwise become unavailable to us, we may be unable to find replacement financing on economically viable terms, if at all. If a substantial portion of such arrangements are terminated, not renewed, and cannot be replaced, it would adversely affect our ability to fund our operations.
Our mortgage asset-backed debt arrangements are an important source of liquidity for our origination and servicing activities.
Our mortgage warehouse facilities support the origination of mortgage loans, which provide creditors a collateralized interest in specific mortgage loans that meet the eligibility requirements under the terms of the facility. Our mortgage warehouse facilities have historically had up to a 364-day term; however, throughout 2017, we entered into shorter term facilities with certain lenders to allow us and the lender to evaluate facility needs and agreement terms that would be appropriate for our new business model after the completion of our strategic actions. In addition, certain facilities require us to maintain a specified amount of available funding from other facilities. As such, our liquidity profile and compliance with debt covenants depends on our ability to renew multiple facilities within a short time frame.
During 2017, we have experienced significant changes to our business profile, liquidity and capital structure and funding requirements driven by our strategic actions and transitions to our new business model, including changes in our mortgage origination volumes driven by the sales of or exit from certain businesses. As such, our ability to renew our mortgage warehouse facilities may be more limited than our historical experience as lenders continually assess PHH and its subsidiaries as counterparties as a smaller company, or we may be unable to obtain such financing on terms acceptable to us, if at all.
Further, our access to and our ability to renew our existing mortgage warehouse facilities is subject to prevailing market conditions, and could suffer in the event of: (i) the deterioration in the performance of the mortgage loans underlying the warehouse facilities; (ii) our failure to maintain sufficient levels of eligible assets or credit enhancements or comply with other terms of the facilities; (iii) our inability to access the secondary market for mortgage loans; and (iv) termination of our role as servicer of the underlying mortgage assets.
Our servicing advance facility, PHH Servicer Advance Receivables Trust (“PSART”), is a special purpose bankruptcy remote trust formed for purposes of issuing non-recourse asset-backed notes secured by servicing advance receivables. Our ability to maintain liquidity through issuing asset-backed notes secured by servicing advance receivables is dependent on many factors, including but not limited to: (i) market demand for ABS, specifically ABS collateralized by mortgage servicing-related receivables; (ii) our ability to service in accordance with applicable guidelines and the quality of our servicing, both of which will impact noteholders’ willingness to commit to financing for an additional term; and (iii) our ability to negotiate terms acceptable to us.
If a substantial portion of the committed capacity of our facilities are terminated or are not renewed, we may be unable to find replacement financing on commercially favorable terms, if at all, which could adversely impact our operations and prevent us from executing our business plan, originating new mortgage loans or fulfilling commitments made in the ordinary course of business. These factors could reduce revenues attributable to our business activities or require us to sell assets at below market prices, either of which would have a material adverse effect on our overall business and consolidated financial position, results of operations and cash flows. In addition, our transition to a new business model with a different capital structure than historical levels, may result in us being more reliant on asset-backed debt arrangements to fund our operations.
Certain of our debt arrangements require us to comply with specific financial covenants and other affirmative and restrictive covenants, termination events, conditions precedent to borrowing, and other restrictions, including, but not limited to, those relating to material adverse changes, our consolidated net worth, liquidity, and leverage. An uncured default of one or more of these covenants could result in a cross-default between and amongst our asset-backed debt arrangements. Consequently, an uncured default that is not waived by our lenders and that results in an acceleration of amounts payable to our lenders or the termination
16
of credit facilities would materially and adversely impact our liquidity, could force us to sell assets at below market prices to repay our indebtedness, and could force us to seek relief under the U.S. Bankruptcy Code.
Our hedging strategies may not be successful in mitigating our exposure to interest rate risk.
In our Mortgage Production segment, we currently use derivative financial instruments, primarily forward delivery commitments, to manage exposure to interest rate risk and related price risk of our origination pipeline and related assets, including interest rate lock commitments and mortgage loans held for sale. However, no hedging strategy can protect us completely. Poorly designed strategies, improperly executed and documented transactions or inaccurate assumptions could actually increase our risks and losses. In addition, hedging strategies involve transaction and other costs. Our hedging strategies and the derivatives that we use may not be able to adequately offset the risks of interest rate volatility, and our hedging transactions may result in or magnify losses. Furthermore, interest rate derivatives may not be available on favorable terms or at all, particularly during economic downturns.
Due to the significant changes to our business profile, liquidity and capital structure driven by our strategic actions and transition to our new business model that occurred during 2017, our liquidity and ability to trade may be more limited than our historical experience, as hedging participants may be unwilling to trade or execute loan sales with us on substantially similar terms to our historical experience. Any of the foregoing risks could adversely affect our business, financial position, results of operations or cash flows.
Risks Related to Our Common Stock |
Our decision to return cash to shareholders through stock repurchases has reduced our market capitalization and may not prove to be the best use of our capital.
During 2017, we repurchased 21,213,428 shares of Common stock for an aggregate $301 million through an open market repurchase program and modified "Dutch" auction tender offer. These repurchases reduced our market capitalization and public float, which is the number of shares of our Common stock that are owned by non-affiliated stockholders and available for trading in the securities markets, which may reduce the volume of trading in our shares and result in reduced liquidity and volatility in our stock price. The market price of our Common stock has been and may continue to be volatile which may affect your ability to sell our Common stock at an advantageous price. For example, the closing market price of our Common stock on the New York Stock Exchange fluctuated between $10.09 per share and $15.53 per share during 2017 and may continue to fluctuate. Market price fluctuations in our Common stock may be due to factors both within and outside of our control, including our strategic actions, industry and regulatory matters or other material public announcements, as well as a variety of additional factors including, without limitation, those set forth under these “Risk Factors” and "Cautionary Note Regarding Forward-Looking Statements."
In November 2017, our Board of Directors provided a new authorization for up to $100 million of share repurchases. We have no obligation to repurchase shares under this authorization, and any share repurchase program may be extended, modified, suspended or discontinued at any time. Pursuant to the Agreement and Plan of Merger dated as of February 27, 2018 among Ocwen, POMS Corp and PHH, any share repurchases require the prior consent of Ocwen.
Any repurchases would utilize cash that we will not be able to use in other ways, or to meet other potential demands, and may not prove to be the best use of our capital. There can be no assurance that we will repurchase any, or the full amount authorized under any share repurchase program, or that any past or future repurchases will have a positive impact on our stock price.
A change in control transaction may result in a number of significant cash outflows that could reduce the value of our business. Further, the provisions of certain of our agreements could discourage third parties from seeking to acquire us, or could prevent or delay a transaction resulting in a change of control.
The net proceeds realized by our shareholders as the result of any change in control transaction or a fundamental change to our businesses, may be negatively impacted as a result of required payments under our debt arrangements or the potential termination of certain client relationships (if consents or waivers are not obtained), among other consequences. Further, a change of control may constitute an event of default under certain of our debt agreements, including our mortgage warehouse facilities.
We may need to obtain consents or waivers from the GSEs, state licensing agencies and certain clients or counterparties, in connection with certain change in control transactions. Additionally, the value of our business could be reduced from any lost relationships and/or loss of our approved status as a Fannie Mae, Freddie Mac and Ginnie Mae approved seller/servicer in connection with certain change in control transactions. Our agreements with Fannie Mae and Freddie Mac require us to provide notice or
17
obtain approvals or consents related to any change in control transaction. The need to obtain waivers or consents from our clients in connection with a change in control transaction may discourage certain third parties from seeking to acquire us or could reduce or delay our receipt of the amount of consideration they would be willing to pay to our stockholders in an acquisition transaction, or could otherwise reduce the value of the business when separated.
Provisions in our charter documents, the Maryland General Corporation Law, and New York insurance law may delay or prevent our acquisition by a third party.
Our charter and by-laws contain several provisions that may make it more difficult for a third party to acquire control of us without the approval of our Board of Directors. These provisions include, among other things, advance notice for raising business or making nominations at meetings and “blank check” preferred stock. Blank check preferred stock enables our Board of Directors, without stockholder approval, to designate and issue additional series of preferred stock with such dividend, liquidation, conversion, voting or other rights, including the right to issue convertible securities with no limitations on conversion, as our Board of Directors may determine, including rights to dividends and proceeds in a liquidation that are senior to the Common stock.
We are also subject to certain provisions of the Maryland General Corporation Law which could delay, prevent or deter a merger, acquisition, tender offer, proxy contest or other transaction that might otherwise result in our stockholders receiving a premium over the market price for their Common stock or may otherwise be in the best interest of our stockholders. These include, among other provisions:
• | the “business combinations” statute which prohibits transactions between a Maryland corporation and an interested stockholder or an affiliate of an interested stockholder for five years after the most recent date on which the interested stockholder becomes an interested stockholder; and |
• | the “control share” acquisition statute which provides that control shares of a Maryland corporation acquired in a control share acquisition have no voting rights except to the extent approved by a vote of two-thirds of the votes entitled to be cast on the matter. |
Our by-laws contain a provision exempting any share of our capital stock from the control share acquisition statute to the fullest extent permitted by the Maryland General Corporation Law. However, our Board of Directors has the exclusive right to amend our by-laws and, subject to their fiduciary duties, could at any time in the future amend the by-laws to remove this exemption provision.
In addition, we are registered as an insurance holding company in the state of New York as a result of our wholly owned subsidiary, Atrium Insurance Corporation. New York insurance law requires regulatory approval of a change in control of an insurer or an insurer’s holding company. Accordingly, there can be no effective change in control of us unless the person seeking to acquire control has filed a statement containing specified information with the New York state insurance regulators and has obtained prior approval. The measure for a presumptive change of control pursuant to New York law is the acquisition of 10% or more of the voting stock or other ownership interest of an insurance company or its parent. These laws may discourage potential acquisition proposals and may delay, deter or prevent a change in control of us, including through transactions, and in particular unsolicited transactions, that some or all of our stockholders might consider to be desirable.
Other Risks |
Our financial statements are based in part on assumptions and estimates made by our management, including those used in determining the fair values of a substantial portion of our assets. If the assumptions or estimates are subsequently proven incorrect or inaccurate, there could be a material adverse effect on our business, financial position, results of operations or cash flows.
Pursuant to accounting principles generally accepted in the United States, we utilize certain assumptions and estimates in preparing our financial statements, including but not limited to, when determining the fair values of certain assets and liabilities, accruals related to litigation, regulatory investigations and proceedings, and reserves related to mortgage representations and warranty claims. If the assumptions or estimates underlying our financial statements are incorrect, we may experience significant losses as the ultimate realization of value may be materially different than the amounts reflected in our consolidated statement of financial position as of any particular date.
For additional information on the key areas for which assumptions and estimates are used in preparing our financial statements, see “Part II—Item 7. Management’s Discussion and Analysis of Financial Condition and Results of Operations—Critical Accounting Policies and Estimates” in this Form 10-K.
18
Fair Value. A substantial portion of our assets are recorded at fair value based upon significant estimates and assumptions with changes in fair value included in our consolidated results of operations. We use models that utilize, wherever possible, market data to value certain of our assets, including but not limited to our MSRs, newly originated loans held for sale and MSR secured liability. Further, we utilize fair value measurements in our review of the carrying value of long-lived assets for impairment.
The determination of the fair value of our assets involves numerous estimates and assumptions made by our management, many of which are beyond our control. Such estimates and assumptions include, without limitation, estimates of future cash flows associated with our Mortgage servicing rights based upon model inputs involving interest rates as well as the prepayment rates and delinquencies and foreclosure rates of the underlying serviced mortgage loans. The use of different estimates or assumptions in connection with the valuation of these assets could produce materially different fair values, or our fair value estimates may not be realized in an actual sale or settlement, either of which could have a material adverse effect on our consolidated financial position, results of operations or cash flows.
Legal and Regulatory Contingencies. Accruals are established for pending or threatened litigation, claims or assessments when it is probable that a loss has been incurred and the amount of such loss can be reasonably estimated. In light of the inherent uncertainties involved in litigation and other legal proceedings, it is not always possible to determine a reasonable estimate of the amount of a probable loss, and we may estimate a range of possible loss for consideration in these estimates. The estimates are based upon currently available information and involve significant judgment taking into account the varying stages and inherent uncertainties of such matters. Accordingly, our estimates may change from time to time and such changes may be material to our consolidated results of operations. There can be no assurance that the ultimate resolution of such matters will not result in losses in excess of our recorded accruals, or in excess of our estimate of reasonably possible losses, and the ultimate settlement of such matters may have a material adverse effect on our consolidated financial position, results of operations or cash flows.
Representations and Warranties. In connection with the sale of mortgage loans, we make various representations and warranties that, if breached, require us to repurchase the loans or indemnify the purchaser for actual losses incurred in respect of such loans. The estimation of our loan repurchase and indemnification liability requires subjective and complex judgments, and incorporates key assumptions that are impacted by both internal and external factors. Internal factors include, but are not limited to, the level of loan sales and origination volumes, and the quality of our underwriting procedures. External factors include, but are not limited to: (i) the political environment and oversight of the Agencies, and related changes in Agency programs and guidelines; (ii) borrower delinquency levels and default patterns; (iii) home price values and (iv) the overall economic condition of borrowers and the U.S. economy. There can be no assurance that we will not realize losses in excess of our recorded reserves, or in excess of our estimate of reasonably possible losses, and that such losses may have a material adverse effect on our consolidated financial position, results of operations or cash flows.
Our reliance on outsourcing arrangements for information technology and other services subjects us to significant business process and control risks due to the complexity of our information systems or if our outsourcing counterparties do not meet their obligations to us.
We outsource certain information technology (“IT”) and other services to third parties which subjects us to significant business process and control risks. If our outsource partners fail to perform their obligations under the terms of the agreements, or if our management of these vendors is not successful, we are subject to operational risk from our IT environment. We are heavily dependent on the strength and capability of our technology systems which we use to interface with our customers, to maintain compliance with applicable regulations and to manage our internal financial and other systems. Our business model and our reputation as a service provider to our clients, as well as our internal controls over financial reporting, are highly dependent upon these systems and processes. In addition, our ability to run our business in compliance with applicable laws and regulations is dependent on our technology infrastructure.
Although we have service-level arrangements with our counterparties, we do not ultimately control their performance, which may make our operations vulnerable to their performance failures. Any failures in our technology systems, processes or the related internal and operational controls, or the failure of our outsourcing providers to perform as expected or as contractually required could result in the loss of client relationships, damage to our reputation, failures to comply with regulations, failure to prepare our financial statements in a timely and accurate manner, and increased costs, the result of any of which could have a material and adverse effect on our business, reputation, results of operations, financial position or cash flows.
During 2016, we elected to terminate certain IT outsourcing agreements with our existing third party, and we intend to transition such services to our own systems and processes, or certain functions to a new third party by the first quarter of 2018. We face risks related to our ability to successfully transition the performance of these processes and the related internal and operational controls, and in enhancing our internal processes to support the functions that may have been previously outsourced. We may
19
incur costs in connection with this transition that we may not have incurred, other than for our decision to end this outsourcing relationship.
A failure in or breach of our technology infrastructure or information protection programs, or those of our outsource providers, could result in the inadvertent disclosure of the confidential personal information of our customers, as well as the confidential personal information of the customers of our clients. Any such failure or breach, including as a result of cyber-attacks against us or our outsource partners, could have a material and adverse effect on our business, reputation, financial position, results of operations or cash flows.
Our business model and our reputation as a service provider to our clients are dependent upon our ability to safeguard the confidential personal information of our customers, as well as the confidential personal information of the customers of our clients. Although we have put in place, and require our outsource providers to follow, a comprehensive information security program that we monitor and update as needed, security breaches could occur through intentional or unintentional acts by individuals having authorized or unauthorized access to confidential information of our customers or the employees or customers of our clients which could potentially compromise confidential information processed and stored in or transmitted through our technology infrastructure. In addition, we have highly complex information systems, certain portions of which we are dependent upon third party outsource providers and other portions of which are self-developed and for which third party support is not generally available.
The cybersecurity regulatory environment is evolving, and it is possible that the costs to us and the resources required for complying with new or developing regulatory requirements will increase. Specifically, the New York Department of Financial Services ("NYDFS") issued final Cybersecurity Requirements for Financial Services Companies that requires financial services and other institutions regulated by the NYDFS, including us, to establish and maintain a cybersecurity program designed to protect consumers and ensure the safety and soundness of New York State’s financial services industry. It is possible that similar laws and regulations may be enacted in the future in other jurisdictions and failure to comply with these obligations can give rise to monetary fines and other penalties, which could have a material and adverse effect on our business, reputation, financial position, results of operations or cash flows.
In addition, a failure in or breach of the security of our information systems, or those of our outsource providers, or a cyber-attack against us or our outsource partners, could result in significant damage to our reputation or the reputation of our clients, could negatively impact our ability to attract or retain clients and could result in increased costs attributable to related litigation or regulatory actions, claims for indemnification, higher insurance premiums and remediation activities, the result of any of which could have a material and adverse effect on our business, reputation, financial position, results of operations or cash flows.
20
Item 1B. Unresolved Staff Comments |
None.
Item 2. Properties |
Our principal executive offices are located at 3000 Leadenhall Road, Mt. Laurel, New Jersey 08054.
Our business has centralized operations in 410,000 square feet of occupied office space in the Mt. Laurel, New Jersey area.
In February 2017, we signed an agreement to assign our interests of our Jacksonville, Florida office lease and to sell information technology and other equipment and fixtures to LenderLive. However, we remain jointly and severally liable with LenderLive to the landlord for the lease obligations over the remaining term of the Jacksonville lease.
In December 2017, we vacated both our Bannockburn, Illinois and Westampton, New Jersey offices. However, as of December 31, 2017, we remain primarily liable to the landlord for the lease obligations over the remaining terms of these leases.
All of our locations are leased, and the square footage disclosed above is approximate.
Item 3. Legal Proceedings |
We are party to various claims and legal proceedings from time to time related to contract disputes and other commercial, employment and tax matters. For more information regarding legal proceedings, see Note 13, 'Commitments and Contingencies' in the accompanying Notes to Consolidated Financial Statements.
Item 4. Mine Safety Disclosures |
Not applicable.
21
PART II
Item 5. Market for Registrant’s Common Equity, Related Stockholder Matters and Issuer Purchases of Equity Securities |
Market Price of Common Stock |
Shares of our Common stock are listed on the NYSE under the symbol “PHH”. The following table sets forth the high and low sales prices for our Common stock for the periods indicated as reported by the NYSE:
Stock Price | |||||||
For the 2017 Quarters Ended: | High | Low | |||||
March 31, 2017 | $ | 15.53 | $ | 11.76 | |||
June 30, 2017 | 14.37 | 12.19 | |||||
September 30, 2017 | 15.00 | 12.85 | |||||
December 31, 2017 | 14.32 | 10.09 | |||||
For the 2016 Quarters Ended: | |||||||
March 31, 2016 | $ | 16.50 | $ | 8.26 | |||
June 30, 2016 | 14.87 | 9.73 | |||||
September 30, 2016 | 16.80 | 12.61 | |||||
December 31, 2016 | 15.70 | 13.25 | |||||
As of February 22, 2018, there were 5,167 holders of record of our Common stock.
Dividends |
As of December 31, 2017, we are not prohibited from declaring and paying dividends on account of our Common stock. However, pursuant to the Agreement and Plan of Merger dated as of February 27, 2018 we entered into with Ocwen and POMS Corp, we are not permitted to declare or pay dividends without the prior consent of Ocwen. We have not declared or paid cash dividends on our Common stock since we began operating as an independent, publicly traded company in 2005.
The provisions of our debt arrangements, capital requirements of our operating subsidiaries and other legal requirements and regulatory constraints may restrict us from making such share-related payments in the future. Limitations and restrictions on our ability to make share-related payments include but are not limited to maintaining compliance with the financial covenants contained in certain subsidiaries’ committed mortgage warehouse funding agreements, including but not limited to: (i) the maintenance of net worth of at least $150 million on the last day of each fiscal month beginning after December 31, 2017; and (ii) a ratio of unsecured indebtedness to tangible net worth of no greater than 1.25 to 1.
In addition, we are limited in the amount of share-related payments that can be distributed due to capital that is required to be maintained at our subsidiaries. The amount of intercompany dividends, share-related payments and other fund transfers that certain of our subsidiaries can declare or distribute to us or to other consolidated subsidiaries (and ultimately to us) is limited due to provisions of our subsidiaries’ debt arrangements, capital requirements, and other legal requirements and regulatory constraints. The aggregate restricted net assets that are required to be maintained at our subsidiaries totaled $102 million as of December 31, 2017.
22
Total Stockholder Return |
The following performance graph and related information shall not be deemed “soliciting material” or “filed” with the SEC, nor shall such information be incorporated by reference into any future filing under the Securities Act of 1933, as amended, or the Exchange Act, except to the extent that it is specifically incorporated by reference into such filing.
The following graph and table compare the cumulative total stockholder return of PHH Common Stock with the Russell 2000® Financial Services Index and the Russell 2000® Total Return Index. The graph and table assume that $100 was invested in PHH Common Stock, the Russell 2000 Financial Services Index and the Russell 2000 Total Return Index on December 31, 2012. Total stockholder performance returns assume reinvestment of dividends. The stock price performance depicted in the graph and table above may not be indicative of future stock price performance.
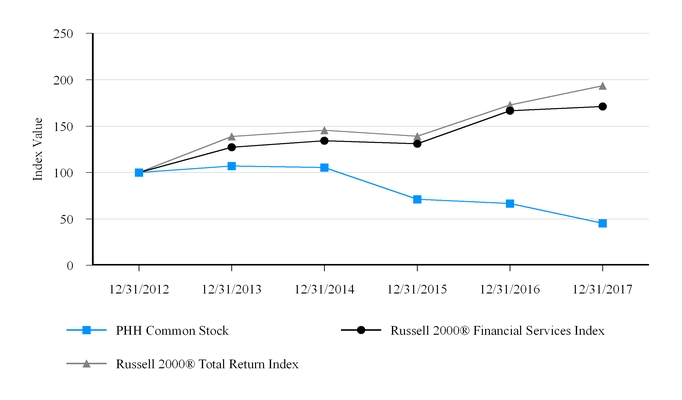
Period Ending | ||||||||||||||||||||||||
Index | 12/31/2012 | 12/31/2013 | 12/31/2014 | 12/31/2015 | 12/31/2016 | 12/31/2017 | ||||||||||||||||||
PHH Common Stock | $ | 100.00 | $ | 107.03 | $ | 105.32 | $ | 71.21 | $ | 66.64 | $ | 45.27 | ||||||||||||
Russell 2000® Financial Services Index | 100.00 | 127.14 | 134.20 | 131.09 | 166.53 | 171.28 | ||||||||||||||||||
Russell 2000® Total Return Index | 100.00 | 138.82 | 145.62 | 139.19 | 172.87 | 193.58 | ||||||||||||||||||
Purchases of Equity Securities by the Issuer and Affiliated Purchasers |
On November 5, 2017, the Company's Board of Directors provided an authorization for up to $100 million of share repurchases. There was no share repurchase activity during the quarter ended December 31, 2017. Pursuant to the Agreement and Plan of Merger dated as of February 27, 2018 among Ocwen, POMS Corp and PHH, any share repurchases require the prior consent of Ocwen.
See Note 14, 'Stock-Related Matters' in the accompanying Notes to Consolidated Financial Statements for more information on our share repurchase programs and share repurchase activity for the years ended December 31, 2017, 2016 and 2015.
Sales of Unregistered Securities |
None.
23
Item 6. Selected Financial Data |
The selected financial data set forth below is derived from our audited Consolidated Financial Statements for the periods indicated. Our historical consolidated financial results presented herein should be read in conjunction with "—Item 7. Management’s Discussion and Analysis of Financial Condition and Results of Operations” and "—Item 8. Financial Statements and Supplementary Data." Because of the inherent uncertainties of our transition to a capital-light business consisting of subservicing and portfolio retention services, our exits of the PLS business and Real Estate channel, the sale of substantially all of our MSR portfolio and other strategic or capital actions, the historical financial information for such periods may not be indicative of our future results of operations or financial position.
The results of operations below include the activity related to the PLS business and Real Estate channel for all periods. We expect to reflect the historical results of operations of our PLS business and Real Estate channel as discontinued operations beginning on the date the operations of the channel cease and run-off activity is substantially complete, which is expected to occur in the first half of 2018. In 2014, we sold our Fleet business and all Fleet operations were recorded in held for sale or discontinued operations during 2014 and presented comparatively for all historical periods below.
Our Consolidated Balance Sheets as of December 31, 2017, compared to prior periods, reflects the reduction in our Mortgage loans held for sale and warehouse facilities, as a result of our PLS business and Real Estate channel exits discussed above. In addition, we have made certain returns of capital to our shareholders, beginning in 2014 and continuing through 2017, which is reflected in both our reductions in our Cash and cash equivalents balance and Stockholders' Equity. We have also had a significant reduction in our Unsecured debt, driven by both proceeds from the 2014 sale of the Fleet business, and from our 2017 asset sales. Refer to "—Item 7. Management’s Discussion and Analysis of Financial Condition and Results of Operations—Liquidity and Capital Resources” for additional information.
Year Ended and As of December 31, | |||||||||||||||||||
2017 | 2016 | 2015 | 2014 | 2013 | |||||||||||||||
(In millions, except per share data) | |||||||||||||||||||
Consolidated Statements of Operations | |||||||||||||||||||
REVENUES | |||||||||||||||||||
Origination and other loan fees | $ | 136 | $ | 280 | $ | 284 | $ | 231 | $ | 307 | |||||||||
Gain on loans held for sale, net | 144 | 262 | 298 | 264 | 575 | ||||||||||||||
Loan servicing income, net | 137 | 125 | 236 | 210 | 430 | ||||||||||||||
Net interest expense | (36 | ) | (32 | ) | (46 | ) | (88 | ) | (115 | ) | |||||||||
Other income (loss) | 75 | (13 | ) | 18 | 22 | 3 | |||||||||||||
Net revenues | 456 | 622 | 790 | 639 | 1,200 | ||||||||||||||
Total expenses | 729 | 926 | 1,003 | 923 | 1,060 | ||||||||||||||
Net (loss) income attributable to PHH Corporation | $ | (217 | ) | $ | (202 | ) | $ | (145 | ) | $ | 81 | $ | 135 | ||||||
Basic (loss) earnings per share attributable to PHH Corporation | $ | (4.62 | ) | $ | (3.77 | ) | $ | (2.62 | ) | $ | 1.47 | $ | 2.36 | ||||||
Diluted (loss) earnings per share attributable to PHH Corporation | $ | (4.62 | ) | $ | (3.77 | ) | $ | (2.62 | ) | $ | 1.47 | $ | 2.06 | ||||||
Consolidated Balance Sheets | |||||||||||||||||||
ASSETS | |||||||||||||||||||
Cash and cash equivalents | $ | 542 | $ | 906 | $ | 906 | $ | 1,259 | $ | 1,126 | |||||||||
Mortgage loans held for sale | 270 | 683 | 743 | 915 | 834 | ||||||||||||||
Mortgage servicing rights | 476 | 690 | 880 | 1,005 | 1,279 | ||||||||||||||
Total assets | $ | 1,811 | $ | 3,175 | $ | 3,642 | $ | 4,284 | $ | 8,836 | |||||||||
LIABILITIES | |||||||||||||||||||
Unsecured debt, net | $ | 118 | $ | 607 | $ | 605 | $ | 819 | $ | 1,232 | |||||||||
Mortgage warehouse and advance facilities | 252 | 655 | 743 | 908 | 775 | ||||||||||||||
Mortgage servicing rights secured liability | 419 | — | — | — | — | ||||||||||||||
Total liabilities | 1,258 | 2,052 | 2,294 | 2,713 | 7,146 | ||||||||||||||
PHH Corporation stockholders’ equity | $ | 553 | $ | 1,090 | $ | 1,316 | $ | 1,545 | $ | 1,666 | |||||||||
24
Item 7. Management’s Discussion and Analysis of Financial Condition and Results of Operations |
The following discussion should be read in conjunction with “Part I—Item 1. Business” and our Consolidated Financial Statements and the notes thereto included in this Form 10-K. The following discussion should also be read in conjunction with the “Cautionary Note Regarding Forward-Looking Statements” and the risks and uncertainties described in “Part I—Item 1A. Risk Factors”.
We are a leading provider of end to end mortgage services. We conduct our business through two reportable segments: Mortgage Production, which provides mortgage loan origination services and sells mortgage loans, and Mortgage Servicing, which performs activities for originated and purchased loans, and acts as a subservicer.
Our Management’s Discussion and Analysis of Financial Condition and Results of Operations is presented in sections as follows:
▪ | Executive Summary |
▪ | Asset Sales and Exit Programs |
▪ | Results of Operations |
▪ | Risk Management |
▪ | Liquidity and Capital Resources |
▪ | Contractual Obligations |
▪ | Off-Balance Sheet Arrangements and Guarantees |
▪ | Critical Accounting Policies and Estimates |
▪ | Recently Issued Accounting Pronouncements |
25
EXECUTIVE SUMMARY |
Proposed Merger with Ocwen Financial Corporation
On February 27, 2018, we entered into a definitive Agreement and Plan of Merger with Ocwen Financial Corporation (“Ocwen”), and POMS Corp (“MergerSub”) pursuant to which all of PHH’s outstanding common stock will be acquired by Ocwen in a merger of PHH with and into MergerSub with PHH surviving (the “Merger”) in an all cash transaction valued at approximately $360 million, or $11.00 per share on a fully-diluted basis. Our Board of Directors has unanimously approved the Merger. The Merger is subject to, in addition to various other customary closing conditions; approval by our stockholders; antitrust, state licensing, and other governmental and regulatory approvals; and PHH maintaining cash and adjusted net worth above certain thresholds.
See “Part I—Item 1A. Risk Factors—Risks Related to Our Strategies—"We may fail to consummate the proposed Merger, and uncertainties related to the consummation of the Merger may have a material adverse effect on our business, financial position, results of operations and cash flows, and negatively impact the price of our Common stock." in this Form 10-K.
Business Overview
In February 2017, we announced certain strategic actions, including exiting our Private Label services business platform, selling our capitalized MSR portfolio and monetizing our interests in our PHH Home Loans joint venture. At that time, we announced that after completing these strategic actions, we will fully transition to a capital-light business model comprised of subservicing and portfolio retention services. Throughout 2017, we have focused on executing the necessary actions to achieve our strategic objectives as we transition and restructure the business. These actions included closing our asset sale transactions, re-engineering the cost structure of the business and transitioning to the new business model while maintaining strategic flexibility. We expect to incur operating losses during 2018 as we complete the exits of our PLS business and restructuring activities. Achieving profitability is highly dependent upon growing our subservicing portfolio to achieve appropriate scale.
We continue to believe there will be growing demand for subservicing and that the quality of our subservicing platform, established compliance management system and portfolio retention services offering can differentiate us from our competition. However, our long-term plans are dependent on growth, and adding new subservicing units is critical for us to eventually achieve the desired scale and a profitable business model. Establishing subservicing relationships involves a long sell cycle and new business growth is materializing slower than expected. Further, we are facing headwinds in portfolio retention from the interest rate environment driving a shift to a purchase-driven market.
Other headwinds to achieving scale in our business include the expected transfer of approximately 115,000 subservicing units off of our platform between May 2018 and April 2019, based upon receipt in February 2018 of formal notices and verbal indications from two of our largest subservicing clients. Approximately 65,000 of these units are subject to a portfolio defense agreement and will no longer be solicitable units upon transfer to a new servicer. There can be no assurances that our subservicing agreements or relationships will not be subject to further change, or that we will be successful in our business development efforts to grow our subservicing portfolio units and portfolio retention volumes.
For a discussion of risks related to our business, see “Part I—Item 1A. Risk Factors—Risks Related to Our Strategies—Our operations have not been profitable in recent years, and we have changed the focus of our business to subservicing and portfolio retention activities to improve our financial results. The industry in which we operate in is highly competitive, and our success depends on our ability to attract and retain clients to achieve scale and meet competitive challenges, which may be negatively impacted by client perceptions of a lack of history operating as a focused player in this market, as well as from our actions, including any past or future efforts towards executing our strategic actions. We may not be able to fully or successfully execute or implement our business strategies or achieve our objectives, and our actions taken may not have the intended result."
For a discussion of risks related to our client concentrations, see “Part I—Item 1A. Risk Factors—Risks Related to Our Strategies—Our remaining business will be focused on subservicing and portfolio retention activities, and we have significant client concentration risk related to the percentage of subservicing and portfolio retention activities from agreements with New Residential Mortgage, LLC and Pingora Loan Servicing, LLC. Further, the terms of a significant portion of our subservicing agreements allow the owners of the servicing to terminate the subservicing agreement without cause which would also terminate any related portfolio defense agreements." in this Form 10-K.
26
2017 Strategic Actions
During 2017, we made significant progress on executing our strategic transactions as outlined in more detail below:
• | MSR Sales. During 2017, we completed the delivery of $661 million of MSRs and advances under our sale agreements with New Residential Mortgage, LLC ("New Residential") and Lakeview Loan Servicing LLC ("Lakeview"), and pursuant to ordinary course sales to other third parties. The net cash received during 2017 from our sales of MSRs plus sale or collection of advances was $727 million, which is adjusted for purchase price and indemnification holdbacks and other costs. As of December 31, 2017, we have recognized a gross receivable for holdbacks from the 2017 MSR transfers of $42 million, and we are entitled to receipt of the MSR sale holdback either upon the complete delivery of the underlying mortgage loan documents, or to the extent not used to satisfy any indemnification claims of New Residential, as applicable. |
The remaining $144 million of MSRs and advances committed under the New Residential agreement consist of private investor MSRs and related advances. While all parties continue to work diligently to close on the sale, the extended time frame for executing the remaining transactions is due to the complexity of the consent process, the number of parties involved, and the depth of investor and trustee due diligence.
• | Home Loans Asset Sales. During 2017, we completed the asset sales to Guaranteed Rate Affinity, LLC ("GRA") in a series of five closings, which occurred between August 2017 and December 2017. In total, we received $70 million of cash for the asset sales during 2017, and we recognized a pre-tax gain on sale of $35 million in our financial statements for our 50.1% share. The cash received from these asset sales is shared pro-rata with the minority interest holder. We expect to liquidate the residual assets of the entity, and we have agreed to purchase Realogy Corporation's ("Realogy") membership interests at book value on or before March 19, 2018. |
• | PLS & Exit Activities. We continue to make progress in executing the exit of our PLS business and re-engineering our shared services platform. During 2017, we have incurred $64 million of cash exit costs associated with our exit programs. We currently expect $207 million in total PLS exit-related costs comprised of $128 million of operating losses and $79 million of cash exit expenses, of which a total of $150 million has been recognized as of December 31, 2017. Further, we expect $35 million in total Reorganization program cash costs, of which $33 million has been recognized as of December 31, 2017. We have committed exit dates, or an agreement as to the last date new applications will be accepted, with all of our clients that comprise our PLS channel. At this time, we continue to believe we will be in a position to substantially exit the PLS business by the first quarter of 2018, subject to certain transition support requirements. |
See further details of executed and pending transactions below under "—Asset Sales and Exit Programs".
Capital Actions
During 2017, our capital actions included the following:
• | Reduction in Debt. In June 2017, we launched a tender offer for any and all of our unsecured senior notes. Through the completion of the tender, in July 2017, we extinguished $496 million of outstanding principal for total cash consideration of $524 million, plus accrued interest. We recognized a pre-tax loss during 2017 of $34 million in connection with the debt repayment. After the tender, $119 million of note principal remains outstanding. We continue to assess what amount, if any, of the remaining unsecured debt would be appropriate as part of our permanent capital structure. |
• | Share Repurchases. In September 2017, we completed $267 million in repurchases through our modified “Dutch auction” tender offer and retired 18,762,962 shares. In addition, prior to the Dutch auction tender offer, we executed $34 million in open market repurchases, retiring 2,450,466 shares. |
In November 2017, our Board of Directors has provided a new authorization for up to $100 million of share repurchases and we did not repurchase any shares under this authorization in the fourth quarter of 2017. We have no obligation to repurchase shares under this authorization, and any share repurchase program may be extended, modified, suspended or discontinued at any time. Pursuant to the Agreement and Plan of Merger dated as of February 27, 2018 among Ocwen, POMS Corp and PHH, any share repurchases require the prior consent of Ocwen.
See further discussion of risks specific to the repurchase program at “Part I—Item 1A. Risk Factors—Risk Related to our Common Stock—Our decision to return cash to shareholders through stock repurchases has reduced our market capitalization and may not prove to be the best use of our capital." in this Form 10-K.
27
Legal and Regulatory Matters
During 2017, we entered into settlement agreements related to several legacy matters, and we recorded $22 million of total provisions for legal and regulatory matters. As of December 31, 2017, our remaining legacy legal and regulatory matter is the Consumer Financial Protection Bureau’s ("CFPB") enforcement action with respect to our legacy reinsurance activities. In January 2018, the en banc court of the United States Court of Appeals for the District of Columbia Circuit reinstated the October 2016 panel decision as it related to the RESPA issues, which included vacating the CFPB’s order imposing $109 million in disgorgement penalties. In February 2018, the en banc court remanded the matter back to the CFPB for further proceedings in compliance with the reinstated panel opinion. We continue to believe that we complied with RESPA and other laws applicable to our former mortgage reinsurance activities in all respects, and with respect to the remand, we will continue to present, if necessary, the facts and evidence to support our position that mortgage insurers did not pay more than reasonable market value to PHH affiliated reinsurers.
During the fourth quarter of 2017, we entered into a settlement agreement with a multistate coalition of certain mortgage banking regulators (the “MMC”) and consent orders with certain state attorneys general to resolve and close out findings from the MMC examination, without any admission of liability. The settlements cover mortgage loan servicing practices, including foreclosure activities, occurring between January 1, 2009 and December 31, 2012. In addition, under the terms of the settlements, we agreed to comply with certain servicing standards, to conduct testing of compliance with such servicing standards for a period of three years, and to report to the MMC regarding the same. Under the terms of the settlement, we will pay approximately $45 million in aggregate, of which $38 million was paid during the fourth quarter of 2017. The remaining settlement amount not yet paid is included in our recorded liability as of December 31, 2017.
During the third quarter of 2017, we entered into settlement agreements, without any admission of liability, with the U.S. Department of Justice ("DOJ") on behalf of the Department of Housing and Urban Development and separately with the DOJ on behalf of the U.S. Department of Veteran Affairs (“VA”) and the Federal Housing Finance Agency to resolve certain matters regarding legacy mortgage origination and underwriting activities. The settlement agreements cover certain mortgage loans insured by the Federal Housing Administration during the period between January 1, 2006 and December 31, 2011, certain mortgage loans insured by the VA, and certain mortgage loans sold to Fannie Mae and Freddie Mac. Under the terms of the agreements, we agreed to pay approximately $75 million in aggregate to the U.S. Department of Justice, which was paid during 2017.
See Note 13, 'Commitments and Contingencies' in the accompanying Notes to Consolidated Financial Statements for further discussion of the settlements and our other outstanding matters.
28
ASSET SALES AND EXIT PROGRAMS |
Sale of MSRs
During 2017, we completed the delivery of $661 million of MSRs and advances under our sale agreements with New Residential, Lakeview, and other third parties.
The following table summarizes our MSRs committed under sale agreements and estimated committed Servicing advance receivables:
December 31, 2017 | December 31, 2016 | ||||||||||||||||||||||
MSR Fair Value | UPB | Servicing Advances | MSR Fair Value | UPB | Servicing Advances | ||||||||||||||||||
(In millions) | |||||||||||||||||||||||
MSR Commitments: | |||||||||||||||||||||||
New Residential | $ | 34 | $ | 5,940 | $ | 110 | $ | 579 | $ | 69,937 | $ | 286 | |||||||||||
Lakeview | — | — | — | 97 | 13,369 | 14 | |||||||||||||||||
Other counterparties | 5 | 565 | — | 2 | 158 | — | |||||||||||||||||
Total | $ | 39 | $ | 6,505 | $ | 110 | $ | 678 | $ | 83,464 | $ | 300 | |||||||||||
See Note 4, 'Servicing Activities' in the accompanying Notes to Consolidated Financial Statements for further information about our MSR sales executed in 2017 and "Executive Summary" above for discussion of the remaining MSR sale commitments with New Residential and related risks.
Further information about our agreements with New Residential, and our continuing involvement with the portfolio transferred, follows:
• | Subservicing Agreement. We entered into a subservicing agreement with New Residential in connection with our MSR Sale Agreement, which covers all units sold for an initial period of three years, subject to certain early transfer and termination provisions. This subservicing relationship became effective upon the initial delivery of MSRs to New Residential on June 16, 2017. As of December 31, 2017, our total units subserviced is approximately 629,000, and New Residential represents 58% of our subserviced units, which is a significant client concentration in our portfolio. |
• | Portfolio Defense Agreement. In connection with the initial delivery of MSRs to New Residential on June 16, 2017, we entered into the MSR Portfolio Defense Agreement with New Residential, pursuant to which we will be entitled, subject to compliance with the terms of the agreement, to seek to refinance loans subserviced on behalf of New Residential as part of our Portfolio Retention services. Under this agreement, we have agreed to sell the MSR with respect to loans originated under this program to New Residential. |
• | Secured Borrowing Accounting. Our accounting evaluation of the New Residential MSR Sale agreement and related agreements concluded that New Residential has not acquired all ownership rewards since the terms of the subservicing contract limit New Residential's ability to terminate the contract within the first three years. Therefore, our transfer of MSRs to New Residential did not qualify for sale accounting under GAAP, and we record the transactions as a secured borrowing. Upon the receipt of cash for MSRs transferred to New Residential, we recognized a Mortgage servicing rights secured liability on our balance sheet, and we continued to recognize the MSR asset. Future changes in the Mortgage servicing rights secured liability are expected to fully offset future changes in the related MSR asset, including changes in fair value. See further information about the presentation in the 'Selected Income Statement Data' tables within "Results of Operations—Mortgage Servicing Segment". |
PHH Home Loans Asset Sales
We announced in February 2017 that we entered into agreements to sell certain assets of PHH Home Loans and its subsidiaries, including its mortgage origination and processing centers and the majority of its employees, to GRA. The asset sales with GRA were completed in a series of five closings, which occurred between August 2017 and December 2017 ("Asset Sale Transactions"). In total, we received $70 million of cash for the asset sales during 2017, and we recognized a pre-tax gain on sale of $35 million in our financial statements for our 50.1% share. Under the terms of the agreement, the cash received from these asset sales is shared pro-rata with the minority interest holder. As a result of these transactions, we also transferred approximately 860 employees to GRA, which represented 25% of our total employees at December 31, 2016.
29
In connection with the asset purchase agreement with GRA, we entered into an agreement to purchase Realogy's 49.9% ownership interests in the PHH Home Loans joint venture ("JV Interests Purchase"), for an amount equal to its interest in the residual equity of PHH Home Loans after the final closing of the Asset Sale Transactions. As of the date of this filing, we have not completed the purchase of Realogy's ownership interest in PHH Home Loans, but are contractually obligated to do so on or before March 19, 2018, subject to certain closing conditions. We do not expect to recognize any gain or loss specific to the JV Interests Purchase in our financial statements. After and assuming the completion of the JV Interests Purchase, PHH Home Loans will be our wholly-owned subsidiary and its residual net assets will be included in our Consolidated Financial Statements. We will continue to monetize the remaining residual assets and resolve the residual liabilities of the entity and once completed, we will no longer operate through our Real Estate channel. During 2017, we have received $35 million of cash related to our net proceeds from the sale agreement and $34 million from monetizing the residual assets of PHH Home Loans. Once the remaining actions are completed, we estimate that we will receive additional proceeds of $27 million. See Note 17, 'Variable Interest Entities' in the accompanying Notes to Consolidated Financial Statements for more information.
Exit Programs
We are currently executing our programs to exit our PLS business and to reorganize to a smaller business that is focused on subservicing and portfolio retention services. As a result of these exit programs and the transfer of employees as part of our transactions with LenderLive Network, LLC and GRA, we have reduced our employee headcount from 3,500 at the end of 2016, to approximately 1,365 at the end of 2017.
The table below summarizes the total costs of these exit programs, the amount recognized to date and the expected cash flows related to the programs (all amounts are pre-tax):
Exit Program Costs | Cash Outflows | ||||||||||||||||||
PLS Exit | Reorganization | Total | Payments To Date (1) | Future Outflows | |||||||||||||||
(In millions) | |||||||||||||||||||
Cash Exit Costs by Segment - 2017: | |||||||||||||||||||
Mortgage Production segment | $ | 24 | $ | 16 | $ | 40 | |||||||||||||
Mortgage Servicing segment | — | 2 | 2 | ||||||||||||||||
Other | 7 | 15 | 22 | ||||||||||||||||
Total Recognized in 2017 | $ | 31 | $ | 33 | $ | 64 | |||||||||||||
Recognized in prior periods | 26 | — | 26 | ||||||||||||||||
Estimate of remaining costs | 22 | 2 | 24 | ||||||||||||||||
Cash exit program expenditures | $ | 79 | $ | 35 | $ | 114 | $ | (38 | ) | $ | 76 | ||||||||
Non-cash charges and impairments | 11 | 2 | |||||||||||||||||
Exit costs attributed to Noncontrolling interest | — | (7 | ) | ||||||||||||||||
Total | $ | 90 | $ | 30 | |||||||||||||||
______________
(1) | Cash outflows as presented above exclude the transfer of $5 million to Restricted cash related to a letter of credit posted in connection with the March 31, 2017 transaction with LenderLive. |
We expect to incur substantially all of the remaining exit costs for PLS during the first half of 2018, a significant portion of which relate to facility costs that are dependent upon the timing of when we vacate certain facilities. Substantially all of the remaining exit costs for Reorganization are expected to be incurred during the first quarter of 2018. We expect the timing of cash outflows related to our exit costs to extend through the end of 2018, as certain payments related to our severance arrangements are paid in bi-weekly installments, not lump sum payments.
See further details in Note 2, 'Exit Costs' in the accompanying Notes to Consolidated Financial Statements, including the total program cost estimate by segment.
Exit from Private Label Services Business. In addition to the exit costs outlined above, during 2017, we incurred $93 million of pre-tax operating losses for PLS. As we complete the exit from this channel, we expect to incur further pre-tax operating losses of $35 million for PLS, including maintaining the support and compliance infrastructure needed to comply with both regulatory and contractual requirements.
Reorganization. To execute our Reorganization to change the focus of our operations to subservicing and portfolio retention services, we are restructuring our remaining business and shared services platform. We intend to re-engineer and reduce operating
30
and overhead costs, which may take into the third quarter of 2018 to complete. During 2017, Reorganization-related exit costs were primarily related to employee retention agreements and employee-related costs as part of the PHH Home Loans asset sales.
RESULTS OF OPERATIONS |
The following table presents our consolidated results of operations:
Year Ended December 31, | |||||||||||
2017 | 2016 | 2015 | |||||||||
(In millions, except per share data) | |||||||||||
Net revenues | $ | 456 | $ | 622 | $ | 790 | |||||
Total expenses | 729 | 926 | 1,003 | ||||||||
Loss before income taxes | (273 | ) | (304 | ) | (213 | ) | |||||
Income tax benefit | (79 | ) | (111 | ) | (82 | ) | |||||
Net loss | (194 | ) | (193 | ) | (131 | ) | |||||
Less: net income attributable to noncontrolling interest | 23 | 9 | 14 | ||||||||
Net loss attributable to PHH Corporation | $ | (217 | ) | $ | (202 | ) | $ | (145 | ) | ||
Basic and Diluted loss per share attributable to PHH Corporation | $ | (4.62 | ) | $ | (3.77 | ) | $ | (2.62 | ) | ||
Our financial results for 2017 reflect our continued progress to move to a smaller capital-light business comprised of subservicing and portfolio retention services. Our results before income taxes for 2017 include:
• | $93 million in operating losses related to the exit of our PLS channel; |
• | $62 million in Exit and disposal costs related to all of our exit and restructuring activities, including severance and retention, facility exit costs and contract termination costs; |
• | $35 million gain related to the asset sales of PHH Home Loans, exclusive of the noncontrolling interests portion; |
• | $34 million loss related to the extinguishment of a majority of our unsecured debt; |
• | $30 million in transaction and related expenses from the MSRs sold primarily to New Residential and Lakeview. |
• | $30 million in strategic review expenses; and |
• | $22 million of provisions for legal and regulatory matters. |
Income Taxes
Tax Reform Act. On December 22, 2017, the Tax Cuts and Jobs Act ("Tax Act") was signed into law, which made significant changes to U.S. federal income tax law by, among other things, reducing the corporate income tax rate from 35% to 21% and eliminating the ability to carryback Federal net operating losses generated in taxable years beginning after December 31, 2017. We determined that the Tax Act required a revaluation of our net deferred tax asset that resulted in a one-time charge to income tax expense during the fourth quarter of 2017 of approximately $30 million.
Going into 2018, based on our current expectations for continued operating losses and our assessment of the impact of the Tax Act, we expect to reflect a full valuation allowance and loss of substantially all income tax benefits against such future operating losses.
Income Tax Benefit. Our effective income tax rate for the years ended December 31, 2017, 2016 and 2015 was (28.9)%, (36.7)% and (38.4)%, respectively. Our effective tax rates differ from our federal statutory rate of 35%, primarily due to: (i) the impact of Federal tax reform; (ii) different state and local income tax rates from various jurisdictions; (iii) changes in state apportionment factors; (iv) changes in valuation allowances; (v) nondeductible expenses; and (vi) amounts of net income attributable to noncontrolling interest (for which no taxes are recorded at PHH Corporation).
For 2017, we generated taxable income which was primarily driven by the recognition of $214 million of our deferred tax liabilities as a result of the completed MSR sales. For 2016, we generated a net operating loss, and our effective tax rate and resulting income tax benefit were impacted by nondeductible expenses for legal and regulatory matters and other adjustments. We elected to carry back our 2016 taxable loss to offset our 2014 taxable income, and received a refund of $23 million from the IRS during 2017.
See Note 12, 'Income Taxes' in the accompanying Notes to Consolidated Financial Statements for further information.
31
Revenues
Year Ended December 31, | |||||||||||
2017 | 2016 | 2015 | |||||||||
(In millions) | |||||||||||
Origination and other loan fees | $ | 136 | $ | 280 | $ | 284 | |||||
Gain on loans held for sale, net | 144 | 262 | 298 | ||||||||
Loan servicing income, net | 137 | 125 | 236 | ||||||||
Net interest expense | (36 | ) | (32 | ) | (46 | ) | |||||
Other income (loss) | 75 | (13 | ) | 18 | |||||||
Net revenues | $ | 456 | $ | 622 | $ | 790 | |||||
Revenues from our Mortgage Production segment for 2017, including Origination and other loan fees and Gain on Loans held for sale, net, reflect a 47% decline in total closings. Origination and other loan fees decreased by $144 million, or 51%, compared to the prior year resulting from a 46% decrease in total retail closing units caused by reduced client volume from the exit of the PLS channel and the sale of certain assets of PHH Home Loans, including their mortgage origination and processing centers, that occurred during 2017.
Gain on loans held for sale, net decreased by $118 million, or 45% compared to the prior year primarily related to a 38% decrease in salable applications that was associated with the decline in retail applications as we exit the PLS business and Real Estate channel.
Loan servicing income, net increased by $12 million, or 10% resulting from the change in mix of our total loan servicing portfolio to primarily subserviced loans which reduces the interest rate exposure and related revenue volatility from MSR fair value changes and lowers our contractual servicing fees since we receive a smaller fee per loan from our subservicing clients as compared to the servicing fee received for our capitalized servicing rights. As a result, the $12 million increase reflects a favorable change of $157 million associated fair value adjustments of our MSRs that was partially offset by a $145 million decline in loan servicing income.
The favorable change in Other income (loss) was primarily due to a $70 million gain from the proceeds of the PHH Home Loans asset sales in 2017. Our net proceeds from the asset sales is reduced by the $35 million noncontrolling interest holder's pro-rata share, which is recorded within Net income attributable to noncontrolling interest. In 2016, we also recognized a $23 million impairment on our equity investment in Speedy Title and Appraisal Review Services, LLC ("STARS"), as the exit of our PLS channel significantly reduced STARS appraisal volume and its projected cash flows.
Expenses
Year Ended December 31, | |||||||||||
2017 | 2016 | 2015 | |||||||||
(In millions) | |||||||||||
Salaries and related expenses | $ | 263 | $ | 345 | $ | 323 | |||||
Commissions | 44 | 64 | 79 | ||||||||
Loan origination expenses | 31 | 64 | 91 | ||||||||
Foreclosure and repossession expenses | 19 | 35 | 51 | ||||||||
Professional and third-party service fees | 120 | 156 | 171 | ||||||||
Technology equipment and software expenses | 35 | 42 | 37 | ||||||||
Occupancy and other office expenses | 33 | 47 | 50 | ||||||||
Depreciation and amortization | 14 | 16 | 18 | ||||||||
Exit and disposal costs | 62 | 41 | — | ||||||||
Other operating expenses: | |||||||||||
Loss on early debt retirement | 34 | — | 30 | ||||||||
Legal and regulatory reserves | 22 | 38 | 78 | ||||||||
Other | 52 | 78 | 75 | ||||||||
Total expenses | $ | 729 | $ | 926 | $ | 1,003 | |||||
32
Salaries and related expenses for 2017 decreased by $82 million compared to the prior year, primarily due to a decline in our average employee headcount during 2017 resulting from our exit plans, as well as higher expenses in 2016 related to incentive compensation, severance costs and contract labor to assist with information technology needs and short-term customer service projects.
Commissions decreased by $20 million, or 31%, compared to 2016 primarily driven by a 26% decrease in closing volume from our real estate channel.
Loan origination expenses for 2017 declined by $33 million compared to 2016 primarily due to a 50% decrease in the total number of retail application units.
Foreclosure and repossession expenses decreased by $16 million or 46% from the prior year primarily driven by lower foreclosure activity and improved portfolio delinquencies that were partially the result of the Lakeview GNMA MSR sales and other recent MSR sales of delinquent government loans.
Professional and third-party service fees decreased by $36 million, or 23%, compared to the prior year primarily from increased costs in 2016 for information technology expenses that were associated with the modernization and security of our information technology systems, implementing new compliance requirements in our origination business and strategic actions.
Occupancy and other office expenses decreased to $33 million, down $14 million or 30% compared to 2016 primarily due to lower rent and related occupancy expenses as a result of vacating Jacksonville and other smaller facilities during 2017, driven by our exit and reorganization actions.
Exit and disposal costs were $62 million in 2017, related to the announced exit of the PLS business and Reorganization of the business, compared to $41 million in the prior year primarily driven by the nature and timing of when the exit plans were announced. During 2017, these costs primarily consisted of $42 million in severance and retention expenses, $8 million in facility exit costs, and $14 million in contract termination costs that were partially offset by a $2 million benefit from other activity.
Within Other operating expenses, our results include: (i) a loss for early repayment of unsecured debt of $34 million in 2017 related to the extinguishment of a portion of the Term notes due in 2019 and 2021; (ii) a provision for legal and regulatory contingencies of $22 million in 2017 and $38 million in 2016, primarily driven by adjustments for negotiated settlements related to our legacy mortgage servicing practices and provisions for other matters; (iii)a decrease of $26 million or 33% in Other expenses primarily from a decrease in repurchase and foreclosure-related charges of $16 million due to lower expenses that will not be reimbursed pursuant to mortgage insurance programs and exposure for legacy repurchase claims from certain private investors that was incurred during 2016; and (iv) lower service level agreement penalties related to our PLS clients and declines in certain loan fees from less production during 2017.
33
Mortgage Production Segment |
Segment Overview
Our Mortgage Production segment generates revenue through fee-based mortgage loan origination services and the origination and sale of mortgage loans into the secondary market. We generally sell all saleable mortgage loans that we originate to secondary market investors, which include a variety of institutional investors, and initially retain the servicing rights on mortgage loans sold. The composition of our Mortgage Production segment will change significantly as we complete our strategic actions. Once these exits are completed, our Mortgage Production segment will consist entirely of portfolio retention services.
Portfolio Retention. Portfolio retention services are a product offered to our subservicing clients in an effort to mitigate potential MSR runoff with the replenishment of new MSRs for our clients, which allows us to subservice the new loan. Originations under our portfolio retention services are sold into the secondary market as saleable loans and include both purchase and refinance closings, and for the year ended December 31, 2017, represented 6% of our total closing volume (based on dollars). We will principally generate revenue from the receipt of origination and application fees, earned on a per loan basis, as well as the gain on sale of loans sold into the secondary market, earned as a percentage of the unpaid principal balance of loans sold. Any MSRs that are originated under our portfolio defense agreements are transferred to the respective counterparty pursuant to the contractual terms. Depending on our agreements, the MSRs will be issued on a co-issue basis or sold through flow sale agreements. As of December 31, 2017, we have approximately 482,000 total subservicing units that are solicitable under portfolio defense agreements.
Future portfolio retention volumes are dependent on the size and breadth of our servicing portfolio, on the willingness of our subservicing clients to permit us to perform such services and on a declining or lower interest rate environment as compared to individual mortgagor's current rates. We provide portfolio retention services to two key clients associated with our significant subservicing client relationships, which represented a combined 77% concentration of our total subservicing portfolio as of December 31, 2017. Our portfolio defense agreements cease upon the termination of the related client subservicing relationship, or as units transfer out of our subservicing portfolio to a new servicer. In addition, for the majority of the solicitable portfolio, we are authorized to seek refinance of mortgage loans on a non-exclusive basis, which may further limit our future mortgage loan originations since we must compete with other originators. We expect the transfer of approximately 115,000 subservicing units off of our platform between May 2018 and April 2019, based upon receipt in February 2018 of formal notices and verbal indications from two of our largest subservicing clients. Approximately 65,000 of these units are subject to a portfolio defense agreement and will no longer be solicitable units upon transfer to a new servicer. There can be no assurances that our subservicing agreements, and related units covered by portfolio defense agreements, will not be subject to further change.
Private Label Services. The PLS channel includes providing outsourced mortgage origination services for wealth management firms, regional banks and community banks throughout the U.S. For the year ended December 31, 2017, the PLS channel represented 66% of our total closing volume (based on dollars).
In November 2016, we announced our intentions to exit our PLS business and we incurred operating losses related to PLS of $93 million during the year ended December 31, 2017. We estimate that we will incur additional operating losses in the Mortgage Production segment related to PLS of $35 million through the second quarter of 2018, including maintaining the support and compliance infrastructure needed to comply with both regulatory and contractual requirements.
Our costs to exit PLS include severance and retention programs, facility-related exit costs, contract termination and other expected payments and non-cash asset impairment charges. For the year ended December 31, 2017, we incurred PLS-related exit costs of $27 million, including $20 million in the Mortgage Production segment and $7 million in "—Other" related to shared services supporting PLS. We estimate that we will incur $22 million of additional exit costs (pre-tax), of which an estimated $17 million will be incurred in the Mortgage Production segment.
We accepted our last application from our PLS clients during the fourth quarter of 2017, and we expect to be substantially complete with the wind-down of the PLS business by the end of the first quarter of 2018, subject to certain transition support requirements. In addition, we expect to reflect the historical results of operations of our PLS channel as discontinued operations beginning on the date the operations of the channel cease and run-off activity is substantially complete, which is expected to occur in the first half of 2018.
Real Estate. The Real Estate channel includes providing mortgage origination services for brokers associated with brokerages owned or franchised by Realogy Corporation and other third-party brokers, through PHH Home Loans, our joint venture with Realogy. For the year ended December 31, 2017, Real Estate represented 28% of our total closing volume (based on dollars).
34
For the year ended December 31, 2017, we incurred exit costs of $13 million related to the joint venture exit which is reduced by the noncontrolling interest holder's pro-rata share.
We announced in February 2017 that we entered into agreements to sell certain assets of PHH Home Loans, including its mortgage origination and processing centers and the majority of its employees, to GRA. We have executed on this transaction through five asset sale closings, and received $70 million of cash during 2017. Under the terms of the agreement, the cash received from these asset sales is shared pro-rata with the minority interest holder. We intend to exit the existing joint venture relationship with Realogy through our purchase of their interests in the entity in the first quarter of 2018. Once the wind-down of the remaining mortgage pipeline at December 31, 2017 is complete, the Real Estate channel will not be part of our future operations. We expect to reflect the historical results of operations of the Real Estate channel, including the results of PHH Home Loans, as discontinued operations beginning on the date the operations of the channel cease and run-off activity is substantially complete, which is expected to occur in the first half of 2018. Refer to "—Asset Sales and Exit Programs" for more information about the agreements related to the PHH Home Loans asset sales.
Business Summary
The following table summarizes the closing statistics and the allocation of revenue of our exiting and remaining Mortgage Production businesses:
Year ended December 31, 2017 | |||||||||||||||
Exiting | Remaining | ||||||||||||||
PLS (1) | Real Estate | Portfolio Retention | Total | ||||||||||||
(In millions) | |||||||||||||||
Origination and other loan fees | $ | 105 | $ | 27 | $ | 4 | $ | 136 | |||||||
Gain on loans held for sale, net | (8 | ) | 115 | 37 | 144 | ||||||||||
Net interest income | 1 | 2 | 2 | 5 | |||||||||||
Other income | 2 | 71 | — | 73 | |||||||||||
Net revenues | $ | 100 | $ | 215 | $ | 43 | $ | 358 | |||||||
Total Closings | $ | 13,157 | $ | 5,470 | $ | 1,130 | $ | 19,757 | |||||||
Year ended December 31, 2016 | |||||||||||||||
Exiting | Remaining | ||||||||||||||
PLS & Wholesale (1) | Real Estate | Portfolio Retention | Total | ||||||||||||
(In millions) | |||||||||||||||
Origination and other loan fees | $ | 242 | $ | 35 | $ | 3 | $ | 280 | |||||||
Gain on loans held for sale, net | 11 | 187 | 64 | 262 | |||||||||||
Net interest income | 4 | 4 | 2 | 10 | |||||||||||
Other (loss) income | (13 | ) | (1 | ) | 1 | (13 | ) | ||||||||
Net revenues | $ | 244 | $ | 225 | $ | 70 | $ | 539 | |||||||
Total Closings | $ | 28,644 | $ | 7,383 | $ | 1,202 | $ | 37,229 | |||||||
_______________
(1) | Portfolio Retention has historically been included in our disclosed PLS channel data; however, Portfolio Retention is displayed separately. Wholesale was also included in 2016; however, we completed the exit of the platform during the second quarter of 2016. |
35
Segment Metrics:
Year Ended December 31, | |||||||||||
2017 | 2016 | 2015 | |||||||||
($ In millions) | |||||||||||
Closings: | |||||||||||
Saleable to investors | $ | 6,757 | $ | 10,146 | $ | 13,218 | |||||
Fee-based | 13,000 | 27,083 | 27,386 | ||||||||
Total | $ | 19,757 | $ | 37,229 | $ | 40,604 | |||||
Purchase | $ | 10,999 | $ | 16,140 | $ | 20,169 | |||||
Refinance | 8,758 | 21,089 | 20,435 | ||||||||
Total | $ | 19,757 | $ | 37,229 | $ | 40,604 | |||||
Retail - PLS and Portfolio Retention | $ | 14,287 | $ | 29,261 | $ | 30,436 | |||||
Retail - Real Estate | 5,470 | 7,383 | 8,752 | ||||||||
Total retail | 19,757 | 36,644 | 39,188 | ||||||||
Wholesale/correspondent | — | 585 | 1,416 | ||||||||
Total | $ | 19,757 | $ | 37,229 | $ | 40,604 | |||||
Retail - PLS and Portfolio Retention (units) | 23,588 | 51,089 | 58,587 | ||||||||
Retail - Real Estate (units) | 18,239 | 26,075 | 32,428 | ||||||||
Total retail (units) | 41,827 | 77,164 | 91,015 | ||||||||
Wholesale/correspondent (units) | — | 2,298 | 6,199 | ||||||||
Total (units) | 41,827 | 79,462 | 97,214 | ||||||||
Applications: | |||||||||||
Saleable to investors | $ | 8,829 | $ | 14,275 | $ | 18,047 | |||||
Fee-based | 13,047 | 31,134 | 33,593 | ||||||||
Total | $ | 21,876 | $ | 45,409 | $ | 51,640 | |||||
Other: | |||||||||||
IRLCs expected to close | $ | 2,473 | $ | 4,373 | $ | 7,199 | |||||
Total loan margin on IRLCs (in basis points) | 305 | 352 | 310 | ||||||||
Loans sold | $ | 7,233 | $ | 10,548 | $ | 13,630 | |||||
The following are descriptions of the business and certain metrics of the Mortgage Production segment:
Saleable closings. Our saleable closings represent loans that are originated or purchased through the real estate and PLS channels of our retail platform which also includes the activities of the portfolio retention business. Saleable closings are originated or acquired with the intent that we will sell the loan after closing to secondary market investors, and we may retain the servicing rights upon sale of the loan. For all saleable closings, we recognize gain on sale revenue from investors and related origination fees from borrowers.
Fee-based closings. Our fee-based closings represent loans that are originated through outsourcing relationships with our PLS clients, where we receive a stated fee per loan in exchange for performing loan origination services. These origination services are performed in the name of the PLS client and the ownership rights to the loans are retained by each respective client upon closing. While saleable closings are originated in all platforms, fee-based closings are only originated in our PLS channel. In our PLS channel, fee-based closings are retained by the client subsequent to closing; whereas, saleable closings are purchased by us for sale to secondary market investors subsequent to closing.
36
Segment Results:
Year Ended December 31, | |||||||||||
2017 | 2016 | 2015 | |||||||||
(In millions) | |||||||||||
Origination and other loan fees | $ | 136 | $ | 280 | $ | 284 | |||||
Gain on loans held for sale, net | 144 | 262 | 298 | ||||||||
Net interest income (expense) | 5 | 10 | (5 | ) | |||||||
Other income (loss) | 73 | (13 | ) | 9 | |||||||
Net revenues | 358 | 539 | 586 | ||||||||
Salaries and related expenses | 150 | 216 | 213 | ||||||||
Commissions | 44 | 64 | 79 | ||||||||
Loan origination expenses | 31 | 64 | 91 | ||||||||
Professional and third-party service fees | 26 | 22 | 34 | ||||||||
Technology equipment and software expenses | 3 | 4 | 3 | ||||||||
Occupancy and other office expenses | 20 | 27 | 31 | ||||||||
Depreciation and amortization | 6 | 8 | 11 | ||||||||
Exit and disposal costs | 38 | 33 | — | ||||||||
Other operating expenses | 109 | 145 | 157 | ||||||||
Total expenses | 427 | 583 | 619 | ||||||||
Loss before income taxes | (69 | ) | (44 | ) | (33 | ) | |||||
Less: net income attributable to noncontrolling interest | 23 | 9 | 14 | ||||||||
Segment loss | $ | (92 | ) | $ | (53 | ) | $ | (47 | ) | ||
2017 Compared With 2016: Mortgage Production segment loss was $92 million during 2017, compared to a loss of $53 million during 2016. Our results in the segment reflect the reduced volumes associated with our exit of the PLS business and reductions in our Real Estate channel from the asset sales of PHH Home Loans to GRA that began in August 2017. The 2017 segment loss includes $93 million of PLS operating losses and $38 million of Exit and disposal costs, which was partially offset by $35 million in net proceeds from the completion of the PHH Home Loans asset sales.
Net revenues. Origination and other loan fees decreased to $136 million, down $144 million or 51%, compared to the prior year. Origination assistance fees decreased by $109 million, which was primarily driven by a 57% decrease in private label closing units compared to the prior year. The decrease in Origination and other loan fees also included a $33 million decline in appraisal income and application and other closing fees primarily driven by a 50% decrease in total retail closing units.
Gain on loans held for sale, net decreased to $144 million, down $118 million or 45%, compared to the prior year. This decrease related to a 38% decrease in saleable applications that was primarily due to the decline in retail applications as we execute the exit of the PLS channel, and from the PHH Home Loans asset sales to GRA in our Real Estate channel.
Net interest income decreased to $5 million, down $5 million or 50%, compared to the prior year, primarily due to a decline in average mortgage loans held for sale that was partially offset by a decline in the average mortgage warehouse debt from reduced borrowing needs, both of which were impacted by a decline in saleable volume.
The favorable change in Other income (loss) was primarily due to a $70 million gain from the proceeds of the PHH Home Loans asset sales to GRA. Our net proceeds from the asset sales is reduced by the $35 million noncontrolling interest holder's pro-rata share, which is recorded within Net income attributable to noncontrolling interest. In 2016, Other income included a $23 million impairment on our equity investment in STARS.
Total expenses. Salaries and related expenses were $150 million, down $66 million or 31%, compared to the prior year, primarily due to a $51 million decline in Salaries, benefits and incentives as a result of declines in average employee headcount as we execute on our planned exit activities, and the transfer of a significant number of employees to LenderLive on March 31, 2017 as part of our transaction to outsource certain PLS mortgage origination fulfillment functions. Salaries and related expenses also included a $15 million decrease in Contract labor and overtime as a result of declining application volumes.
Commissions decreased by $20 million, or 31%, compared to 2016 primarily driven by a 26% decrease in closing volume from our Real Estate channel.
37
Loan origination expenses decreased by $33 million, or 52%, compared to 2016 primarily due to a 50% decrease in the total number of retail application units.
Professional and third-party service fees increased to $26 million, up $4 million or 18%, primarily due to $7 million of fees paid in 2017 to LenderLive for outsourced PLS mortgage origination services that were partially offset by lower expenses for compliance activities.
Occupancy and other office expenses decreased to $20 million, down $7 million or 26%, compared to 2016 primarily due to lower rent and related occupancy expenses as a result of assigning our Jacksonville lease to LenderLive, and other smaller facilities that were vacated during 2017.
Exit and disposal costs were $38 million, up $5 million during 2017, as a result of our exit of the PLS business and Reorganization. These costs included $21 million of severance and retention expenses for impacted employees, $8 million for facility-related costs including our transfer of the Jacksonville facility to LenderLive and other smaller facility closures and $10 million in contract-related termination costs primarily related to PLS.
Within Other operating expenses, Corporate overhead allocation decreased to $92 million, down $26 million or 22%, compared to the prior year primarily due to reduced professional fees for information technology shared services. See “—Other” for a more detailed discussion of the expenses included in the Corporate overhead allocation.
Within Other operating expenses, Other expenses decreased to $17 million, down $10 million or 37%, compared to the prior year primarily due to lower service level agreement penalties related to our PLS clients and a decline in certain loan fees from less production during 2017.
2016 Compared With 2015: Mortgage Production segment loss was $53 million during 2016, compared to a loss of $47 million during 2015. Net revenues decreased to $539 million, down $47 million, or 8%, compared to the prior year driven by lower purchase closing volume and impairment on our equity investment in STARS, partially offset by the lack of allocated unsecured interest expense as compared with 2015. Total expenses decreased to $583 million, down $36 million, or 6%, compared to the prior year primarily driven by decreases in Commissions and Loan origination expenses from lower purchase closing volume and decreases in Professional and third-party service fees and Corporate overhead allocation, that were partially offset by Exit and disposal costs incurred in the fourth quarter of 2016 related to our exit from the PLS channel.
Net revenues. Origination and other loan fees decreased to $280 million, down $4 million or 1%, as compared to the prior year. Appraisal income, application and other loan fees decreased by $17 million, primarily driven by a 15% decrease in total retail closing units. This was partially offset by a $13 million increase in Origination assistance fees, which was driven by operating benefits from amendments to our private label agreements, partially offset by a 13% decrease in total PLS closing units compared to the prior year.
Gain on loans held for sale, net decreased to $262 million, down $36 million or 12% as compared to the prior year. The $28 million decrease in gain on loans compared to the prior year was primarily related to a 39% decrease in IRLCs expected to close, reflecting the increased mix of fee-based closings (where we do not enter into an IRLC), that was partially offset by a 42 basis point increase in average total loan margins. Additionally, there was a $5 million unfavorable change in fair value of Scratch and Dent and certain non-conforming loans compared with the prior year, which was primarily driven by price adjustments.
Interest income decreased to $32 million, down $8 million or 20% as compared to the prior year, primarily due to the decline in average mortgage loans held for sale from the decline in saleable volume. Secured interest expense decreased to $22 million, down $2 million or 8%, compared to the prior year, primarily due to the decline in average mortgage warehouse debt from reduced borrowing needs as well as our funding strategy for mortgage loans held for sale.
Allocated unsecured interest expenses was zero for 2016, compared to $21 million for 2015, driven by updates to our interest allocation methodology. We evaluate the capital structure of each segment on an annual basis and have not allocated unsecured interest expense to Mortgage Production during 2016 as the segment's capital structure was fully supported by existing cash and the secured warehouse debt facilities for 2016.
The unfavorable change in Other (loss) income was primarily due to a $23 million impairment on our equity investment in STARS, as the exit of our PLS business will significantly reduce STARS appraisal volume and its projected cash flows.
38
Total expenses. Commissions decreased by $15 million, or 19%, compared to 2015 primarily driven by a 16% decrease in closing volume from our Real Estate channel.
Loan origination expenses decreased by $27 million, or 30%, compared to 2015 due to a 17% decrease in the total number of retail application units, as well as the termination of our trademark and licensing agreements with Realogy in 2015.
Professional and third-party service fees decreased to $22 million, down $12 million or 35%, primarily due to reduced consulting expenses on compliance activities and our efforts to re-engineer the business in 2016 as compared to 2015.
Occupancy and other office expenses decreased to $27 million, down $4 million or 13%, compared to 2015 due to one-time expenses and lower rent from consolidating Mt. Laurel facilities in 2015.
Exit and disposal costs were $33 million for 2016, as a result of our exit of the PLS business and Reorganization activities. These costs included $18 million of severance and retention expenses for impacted employees, $14 million of impairment of technology-related and other long-lived assets used in the PLS business and $1 million in contract-related costs.
Corporate overhead allocation decreased to $118 million, down $13 million or 10%, compared to the prior year primarily due to a reduced allocation of expenses to the Mortgage Production segment in 2016. See “—Other” for a more detailed discussion of the expenses included in the Corporate overhead allocation.
Selected Income Statement Data:
Year Ended December 31, | |||||||||||
2017 | 2016 | 2015 | |||||||||
(In millions) | |||||||||||
Gain on loans held for sale, net: | |||||||||||
Gain on loans | $ | 129 | $ | 228 | $ | 256 | |||||
Change in fair value of Scratch and Dent and certain non-conforming mortgage loans | (7 | ) | (6 | ) | (1 | ) | |||||
Economic hedge results | 22 | 40 | 43 | ||||||||
Total change in fair value of mortgage loans and related derivatives | 15 | 34 | 42 | ||||||||
Total | $ | 144 | $ | 262 | $ | 298 | |||||
Net interest income: | |||||||||||
Interest income | $ | 22 | $ | 32 | $ | 40 | |||||
Secured interest expense | (17 | ) | (22 | ) | (24 | ) | |||||
Unsecured interest expense | — | — | (21 | ) | |||||||
Total | $ | 5 | $ | 10 | $ | (5 | ) | ||||
Salaries and related expenses: | |||||||||||
Salaries, benefits and incentives | $ | 145 | $ | 196 | $ | 196 | |||||
Contract labor and overtime | 5 | 20 | 17 | ||||||||
Total | $ | 150 | $ | 216 | $ | 213 | |||||
Other operating expenses: | |||||||||||
Corporate overhead allocation | $ | 92 | $ | 118 | $ | 131 | |||||
Other expenses | 17 | 27 | 26 | ||||||||
Total | $ | 109 | $ | 145 | $ | 157 | |||||
39
The following are descriptions of the contents and drivers of the financial results of the Mortgage Production segment:
Origination and other loan fees consist of fee income earned on all loan originations, including loans that are saleable to investors and fee-based closings in our PLS channel. Retail closings and fee-based closings are key drivers of Origination and other loan fees, and the fee income earned on those loans consists of application and underwriting fees, fees on canceled loans and amounts earned from financial institutions related to brokered loan fees and origination assistance fees resulting from our private label mortgage outsourcing activities.
Gain on loans held for sale, net includes realized and unrealized gains and losses on our mortgage loans, as well as the changes in fair value of our interest rate lock commitments ("IRLCs") and loan-related derivatives. The fair value of our IRLCs is based upon the estimated fair value of the underlying mortgage loan, adjusted for: (i) the estimated costs to complete and originate the loan and (ii) the estimated percentage of IRLCs that will result in a closed mortgage loan.
Gain on loans is primarily driven by the volume of IRLCs expected to close, total loan margins and the mix of wholesale/correspondent closing volume. For certain retail closings from our private label clients and wholesale/correspondent closings, the cost to acquire the loan reduces the gain from selling the loan into the secondary market. Change in fair value of Scratch and Dent and certain non-conforming mortgage loans is primarily driven by additions, sales and changes in value of Scratch and Dent loans, which represent loans with origination flaws or performance issues. Economic hedge results represent the change in value of mortgage loans, IRLCs and related derivatives, including the impact of changes in actual pullthrough as compared to our initial assumptions.
Salaries and related expenses consist of salaries, payroll taxes, benefits and incentives paid to employees in our mortgage production operations. These expenses are primarily driven by the average number of permanent employees.
Commissions for employees involved in the loan origination process are primarily driven by the volume of retail closings. Closings from our real estate channel have higher commission rates than private label closings.
Loan origination expenses represent variable costs directly related to the volume of loan originations and consist of appraisal, underwriting and other direct loan origination expenses. These expenses are primarily driven by the volume of applications.
Exit and disposal costs consist of costs related to our announced exit of the PLS channel. These costs include employee severance and retention costs, facility-related exit costs, contract termination fees and asset impairment of technology-related and other long-lived assets.
Other operating expenses consist of corporate overhead allocation and other production related expenses.
40
Mortgage Servicing Segment |
Segment Overview
Our Mortgage Servicing segment services mortgage loans originated by us where we retain the Mortgage servicing rights ("MSRs"), or act as subservicer for certain clients that own the underlying servicing rights. The segment principally generates revenue through fees earned from our MSRs or from our subservicing agreements as described below. During 2017, we completed the sale of a significant portion of our capitalized MSRs and shifted our business focus to subservicing. We do not anticipate retaining a significant amount of capitalized MSRs on our Consolidated Balance Sheet in the future.
Beginning in the fourth quarter of 2016 and throughout 2017, we experienced significant changes in the mix of loans within our total loan servicing portfolio from the execution of our MSR sale agreements and client-driven actions. Specifically, between June 2017 and December 2017, we sold a significant portion of our owned MSRs to New Residential, and began functioning as subservicer for those approximately 392,000 units transferred. In addition, between February 2017 and August 2017, we sold approximately 87,000 units, representing our owned GNMA MSR portfolio, to Lakeview, and we did not retain any continuing involvement as servicer for that population. In the fourth quarter of 2016, our subservicing portfolio declined by approximately 211,000 units driven by Merrill Lynch's insourcing of their subservicing activities, and HSBC's sale of a population of MSRs related to loans that we subserviced.
At the end of 2017, our servicing platform consisted primarily of subserviced loans, and we expect our contractual servicing fees in future periods to decline since we receive a smaller fee per loan from our subservicing clients as compared to the servicing fee received for our capitalized servicing rights. However, subservicing relationships reduce the interest rate exposure and related revenue volatility from MSR fair value changes and eliminates curtailment interest expense and payoff-related costs, as well as eliminates the need for capital to fund servicing advance obligations. Additionally, our exposure to foreclosure-related costs and losses is generally limited in our subservicing relationships as those risks are retained by the owner of the MSR. Our servicing operations and expense base remain relatively consistent despite this shift in our business, other than as previously described. We are continuing to restructure our shared services and overhead cost scale for our future business, as discussed further in "—Asset Sales and Exit Programs—Exit Programs".
Business Summary
The following tables summarize our revenues between our owned and subservicing portfolios, and the portfolio statistics:
Year ended December 31, 2017 | |||||||||||
Owned Servicing | Subservicing | Total | |||||||||
(In millions) | |||||||||||
Servicing fees | $ | 116 | $ | 56 | $ | 172 | |||||
MSR prepayments and receipts of recurring cash flows | (59 | ) | — | (59 | ) | ||||||
MSR market-related adjustments, net | (12 | ) | — | (12 | ) | ||||||
Other | (26 | ) | 23 | (3 | ) | ||||||
Net revenues | $ | 19 | $ | 79 | $ | 98 | |||||
Average number of loans serviced (units) | 288,513 | 446,662 | 735,175 | ||||||||
Year ended December 31, 2016 | |||||||||||
Owned Servicing | Subservicing | Total | |||||||||
(In millions) | |||||||||||
Servicing fees | $ | 266 | $ | 67 | $ | 333 | |||||
MSR prepayments and receipts of recurring cash flows | (138 | ) | — | (138 | ) | ||||||
MSR market-related adjustments, net | (90 | ) | — | (90 | ) | ||||||
Other | (34 | ) | 12 | (22 | ) | ||||||
Net revenues | $ | 4 | $ | 79 | $ | 83 | |||||
Average number of loans serviced (units) | 608,085 | 435,094 | 1,043,179 | ||||||||
41
Owned Servicing
Our owned servicing consists of revenues earned from our MSRs, which are capitalized on our Balance sheet. MSRs are the rights to receive a portion of the interest coupon and fees collected from the mortgagors for performing specified mortgage servicing activities, which consist of collecting loan payments, remitting principal and interest payments to investors, managing escrow funds for the payment of mortgage-related expenses such as taxes and insurance, performing loss mitigation activities on behalf of investors and otherwise administering our mortgage loan servicing portfolio. Our owned portfolio also requires capital and liquidity to fund servicing advance obligations, as we are required to fund scheduled principal, interest, tax and insurance payments when the mortgage loan borrower has failed to make the scheduled payments and to cover foreclosure costs and various other items that are required to preserve the assets being serviced.
As previously described, we completed the sale of a significant portion of our capitalized MSRs during 2017 and shifted our business focus to subservicing. During the fourth quarter of 2016, we entered into two separate agreements to sell substantially all of our MSRs, and during 2017, we completed sales of $54.0 billion in unpaid principal balance of MSRs to New Residential and sales of $13.2 billion in unpaid principal balance of GNMA MSRs to Lakeview. As of December 31, 2017, we have commitments to sell an additional 27,000 units (approximately) of our owned MSRs to New Residential, where we would continue functioning as subservicer. Substantially all of the remaining sale commitments of the MSRs and servicing advances currently require consents from third parties other than GSEs.
Our sales of MSRs to New Residential were accounted for as a secured borrowing, and accordingly, the MSRs remained on the balance sheet with the proceeds from sale recognized as MSRs secured liability. We elected to record the MSRs secured liability at fair value consistent with the related MSR asset. Future changes in the MSRs secured liability will fully offset future changes in the related MSR asset.
Owned servicing has historically experienced high degrees of earnings volatility due to significant exposure to changes in interest rates, and the related impact on our modeled MSR cash flows, high delinquent GNMA servicing costs and other market risks. These factors were impacted by, among other factors, conditions in the housing market, general economic factors, including higher unemployment rates, and policies of the Federal Reserve. Prior to the sale of substantially all of our owned MSRs, the results of servicing our owned portfolio have been negatively impacted by the persistent low interest rate environment and increasing costs to comply with regulations, while the compensation for servicers remained constant. Historically, we have used a combination of derivative instruments to protect against potential adverse changes in the fair value of our MSRs resulting from a decline in interest rates; however, in December 2016, we terminated substantially all of our MSR-related derivatives in connection with the MSR sale agreements, as our agreement with New Residential fixed the value we expect to realize on our MSRs as of the transaction date. The remaining MSR-related derivatives were primarily settled during the first quarter of 2017 with no significant impact to our results of operations.
Subservicing
Subservicing consists of revenues earned from performing servicing functions under subservicing agreements, whereby we service loans on behalf of the owner of the MSRs. The market for subservicing clients is comprised of independent mortgage bankers, community banks, credit unions and other mortgage investors. The size of the subservicing market is dependent on the following: (i) the rate of prepayment speeds and the size of the home purchase market; (ii) lack of operational scale for smaller MSR owners who may need a subservicing partner to keep pace with consumer, regulatory and investor requirements; and (iii) MSR ownership by financial investors who do not have in-house servicing capability.
We anticipate growth in the subservicing market as mid-size and smaller servicers may sell MSRs to financial investors who are likely to contract with subservicers. We also are monitoring the political environment for possible regulatory reform and changes to the Dodd-Frank Wall Street Reform and Consumer Protection Act, which could potentially lower costs to subservicers. However, market factors such as higher interest rates, evolving regulations, and potentially volatile capital market conditions may adversely impact demand for MSRs by non-bank investors and create a more challenging environment for subservicing.
We are actively engaged in business development efforts in order to grow our subservicing units to achieve an adequate level of scale and a profitable business model. Our subservicing portfolio is subject to runoff and will continue to decline as our current additions through flow sales and portfolio retention are insufficient to offset runoff. There can be no assurances that we will be successful in growing our subservicing portfolio. We expect the transfer of approximately 115,000 subservicing units off of our platform between May 2018 and April 2019, based upon receipt in February 2018 of formal notices and verbal indications from two of our largest subservicing clients. Approximately 65,000 of these units are subject to a portfolio defense agreement and will no longer be solicitable units upon transfer to a new servicer. There can be no assurances that our subservicing agreements or relationships will not be subject to further change.
42
Although the underlying business activities are substantially similar, the key economic distinctions between owned MSRs and subservicing are outlined below, as well as some of the risks specific to our subservicing business:
• | Revenue/Expense Recognition. Contractual subservicing fees are generally based on a stated amount per loan and vary depending on the delinquency status of each loan and the terms of each subservicing agreement. We receive a smaller fee per loan from our subservicing clients as compared to the servicing fee received for our capitalized servicing rights. However, we have less risks of elevated costs as a subservicer, as our exposure to foreclosure-related costs and losses is generally limited in our subservicing relationships as those risks are retained by the owner of the servicing rights. |
• | Interest Rate Risk Management. Our subservicing business has less exposure to interest rate volatility because we do not capitalize an MSR on our balance sheet, which eliminates earnings volatility from market-related changes in fair value, costs from executing MSR derivatives, as well as MSR amortization, curtailment interest expense and payoff-related costs. However, as a subservicer, we continue to be exposed to the risk of portfolio runoff driven by a low interest rate environment. We need to continually source new subservicing relationships or portfolio additions in order to maintain our portfolio size. |
• | Capital Requirements. Our subservicing business eliminates the need for capital to fund MSRs and execute related derivatives and limits our need to fund servicing advances. Our subservicing agreements generally contain provisions that require the subservicing client to pre-fund advances on the subserviced loans or to reimburse us for those advances on a periodic basis. Additionally, our exposure to foreclosure-related costs and losses is generally limited in our subservicing relationships as those risks are retained by the owner of the MSR. |
• | Client Retention & Agreement Termination Rights. The terms of a substantial portion of our subservicing agreements allow the owners of the servicing to terminate the subservicing agreement without cause with respect to some or all of the subserviced loans and, in some cases, without payment of any termination fee. This risk is further magnified by our client concentration exposure. As of December 31, 2017, 58% and 19% of our subservicing portfolio (by units) related to significant client relationships with New Residential and Pingora Loan Servicing, LLC, respectively. Our subservicing agreement with New Residential engages us to subservice the loans sold to New Residential for an initial period of three years, beginning in June 2017 upon the completion of the initial sale, subject to certain transfer and termination provisions (including New Residential's right to transfer, without cause, 25% of the subservicing units beginning in June 2018, and an additional 25% of the subservicing units beginning in June 2019). |
For more information, see "—Risk Management—Counterparty and Concentration Risk" and “Part I—Item 1A. Risk Factors—Risks Related to Our Strategies—Our remaining business will be focused on subservicing and portfolio retention activities, and we have significant client concentration risk related to the percentage of subservicing and portfolio retention activities from agreements with New Residential Mortgage, LLC and Pingora Loan Servicing, LLC. Further, the terms of a significant portion of our subservicing agreements allow the owners of the servicing to terminate the subservicing agreement without cause which would also terminate any related portfolio defense agreements."
43
Segment Metrics:
December 31, | |||||||||||
2017 | 2016 | 2015 | |||||||||
($ In millions) | |||||||||||
Total Loan Servicing Portfolio: | |||||||||||
Conventional loans | $ | 137,029 | $ | 151,004 | $ | 197,971 | |||||
Government loans | 9,715 | 21,801 | 24,087 | ||||||||
Home equity lines of credit | 1,411 | 1,837 | 4,201 | ||||||||
Total Unpaid Principal Balance | $ | 148,155 | $ | 174,642 | $ | 226,259 | |||||
Number of loans in owned portfolio (units) | 42,616 | 567,647 | 642,379 | ||||||||
Number of subserviced loans (units) (1) | 629,174 | 264,718 | 450,295 | ||||||||
Total number of loans serviced (units) | 671,790 | 832,365 | 1,092,674 | ||||||||
Weighted-average interest rate | 3.9 | % | 3.8 | % | 3.8 | % | |||||
Total Portfolio Delinquency: | |||||||||||
% of UPB - 30 days or more past due | 2.49 | % | 2.56 | % | 2.47 | % | |||||
% of UPB - Foreclosure, REO and Bankruptcy | 1.49 | % | 1.96 | % | 1.93 | % | |||||
Units - 30 days or more past due | 3.54 | % | 3.59 | % | 3.49 | % | |||||
Units - Foreclosure, REO and Bankruptcy | 2.02 | % | 2.37 | % | 2.32 | % | |||||
Total Capitalized Servicing Portfolio: | |||||||||||
UPB of capitalized MSRs owned | $ | 8,592 | $ | 84,657 | $ | 98,990 | |||||
UPB of capitalized MSRs in secured borrowing arrangement (2) | 49,193 | — | — | ||||||||
Total Unpaid Principal Balance of capitalized servicing portfolio | $ | 57,785 | $ | 84,657 | $ | 98,990 | |||||
Capitalized servicing rate | 0.82 | % | 0.82 | % | 0.89 | % | |||||
Capitalized servicing multiple | 3.0 | 2.9 | 3.1 | ||||||||
Weighted-average servicing fee (in basis points) | 27 | 28 | 29 | ||||||||
______________
(1) | For December 31, 2017, includes 363,062 units of New Residential subserviced loans that are accounted for as a secured borrowing arrangement based on our evaluation of the New Residential MSR sale agreement. Refer to "Asset Sales and Exit Programs" for additional information. |
(2) | Represents MSRs sold to New Residential during 2017 that are accounted for as a secured borrowing arrangement. Refer to "—Asset Sales and Exit Programs" for additional information. |
Year Ended December 31, | |||||||||||
2017 | 2016 | 2015 | |||||||||
(In millions) | |||||||||||
Total Loan Servicing Portfolio: | |||||||||||
Average Portfolio UPB | $ | 159,671 | $ | 220,458 | $ | 225,787 | |||||
Owned Capitalized Servicing Portfolio (1) : | |||||||||||
Average Portfolio UPB | 43,547 | 92,303 | 105,343 | ||||||||
Payoffs and principal curtailments | 7,667 | 19,211 | 19,092 | ||||||||
Sales | 17,628 | 996 | 3,445 | ||||||||
_____________
(1) | For 2017, balances exclude MSRs sold to New Residential that are accounted for as a secured borrowing arrangement. Refer to "—Asset Sales and Exit Programs" for additional information. |
44
Segment Results:
Year Ended December 31, | |||||||||||
2017 | 2016 | 2015 | |||||||||
(In millions) | |||||||||||
Loan servicing income, net | $ | 137 | $ | 125 | $ | 236 | |||||
Net interest expense | (41 | ) | (42 | ) | (41 | ) | |||||
Other income | 2 | — | 3 | ||||||||
Net revenues | 98 | 83 | 198 | ||||||||
Salaries and related expenses | 58 | 68 | 56 | ||||||||
Foreclosure and repossession expenses | 19 | 35 | 51 | ||||||||
Professional and third-party service fees | 32 | 35 | 28 | ||||||||
Technology equipment and software expenses | 14 | 17 | 16 | ||||||||
Occupancy and other office expenses | 11 | 17 | 16 | ||||||||
Depreciation and amortization | 2 | 3 | 2 | ||||||||
Exit and disposal costs | 2 | — | — | ||||||||
Other operating expenses | 81 | 131 | 160 | ||||||||
Total expenses | 219 | 306 | 329 | ||||||||
Segment loss | $ | (121 | ) | $ | (223 | ) | $ | (131 | ) | ||
2017 Compared With 2016: Mortgage Servicing segment loss was $121 million during 2017 compared to a loss of $223 million during the prior year. Net revenues increased to $98 million, up $15 million or 18%, compared to 2016 primarily driven by an increase in Loan servicing income, net resulting from the change in mix of our total loan servicing portfolio related to our MSR sales during 2017. This change in mix of our portfolio resulted in lower unfavorable fair value adjustments related to our MSRs that was partially offset by lower contractual servicing fees from our subservicing of those loans compared to the servicing fee we receive for capitalized servicing rights. Our servicing platform now consists primarily of subserviced loans, with the shift of our portfolio occurring beginning in the third quarter of 2017. Total expenses decreased to $219 million, down $87 million or 28%, compared to the prior year primarily driven by a lower Corporate overhead allocation, lower provisions for Legal and regulatory reserves and Repurchase and foreclosure-related charges and declines in Foreclosure and repossession expenses and Salaries and related expenses.
Net revenues. Servicing fees from our capitalized portfolio decreased to $116 million, down $150 million or 56%, compared to the prior year driven by a 53% decrease in the average owned capitalized loan servicing portfolio. The decline in our owned capitalized loan servicing portfolio was primarily due to sales of substantially all of Freddie Mac and Fannie Mae owned servicing to New Residential, and sales of GNMA owned servicing to Lakeview, each of which occurred in multiple transactions during 2017.
Subservicing fees decreased to $56 million, down $11 million or 16%, compared to the prior year primarily driven by declines in the average number of loans in our subserviced portfolio from the insourcing and MSR sale actions of certain clients during the fourth quarter of 2016 that was partially offset by new subservicing units from the sale of servicing rights to New Residential, the most significant of sales which occurred in June 2017 and July 2017. While our average total subservicing units increased during 2017 compared to the prior year, we have not realized the full benefit during 2017 from the 392,000 subservicing unit additions from the MSR sales to New Residential due to the timing of when those sales occurred.
During 2017, the MSR yield on secured borrowing asset contributed $29 million to Loan servicing income, net, as a result of the sales of MSRs to New Residential, which were accounted for as a secured borrowing arrangement due to the long-term nature of the subservicing contract. This was entirely offset by $29 million in Net interest expense, which represents the implied interest cost recognized on the MSRs secured liability.
Late fees and other ancillary servicing revenue decreased to $29 million, down $10 million or 26%, primarily due to declining late fees and other servicing fees from a lower overall average portfolio. Loss on sale of MSRs was $16 million during 2017 compared to $3 million in the prior year, primarily due to transaction-related expenses from the GNMA MSRs sold to Lakeview in 2017. Curtailment interest paid to investors decreased by $10 million due to the significant reduction of the owned capitalized portfolio from the New Residential sale, resulting in reduced payments to investors.
45
MSR valuation changes from actual prepayments of the underlying mortgage loans decreased by $70 million, or 63%, primarily due to a 62% decrease in payoffs in our owned capitalized servicing portfolio compared to the prior year. MSR changes in value from actual receipts of recurring cash flows decreased by $9 million, or 35%, primarily due to a smaller average owned capitalized portfolio size compared to the prior year.
We were not exposed to significant market exposure for the majority of our owned MSR asset during 2017 since our committed sale agreements established the pricing for a significant portion of our asset, and our valuation model included the calibration to those sales prices. In total, Market-related fair value adjustments decreased the value of our MSRs by $12 million during 2017, and we did not recognize any significant gains or losses associated with MSR derivatives since we terminated substantially all of our MSR-related derivatives in the prior year.
Market-related fair value adjustments decreased the value of our MSRs by $100 million during 2016 which was partially offset by net gains on MSR derivatives of $10 million from changes in interest rates. The $100 million negative Market-related fair value adjustments during 2016 included: (i) $61 million of negative market adjustments related to changes in interest rates, a flattening of the yield curve and a calibration of our valuation model considering the pricing associated with the MSR sale agreements executed in the fourth quarter of 2016 and (ii) $39 million of negative model adjustments primarily related to $46 million of increased servicing costs and foreclosure losses that was partially offset by $5 million in favorable adjustments for updates to our prepayment model to align modeled and actual prepayments.
Net interest expense was $41 million during 2017, down $1 million, compared to the prior year. This was primarily due to a $22 million decrease in Unsecured interest expense resulting from the July 2017 retirement of $496 million of Term notes, a $4 million increase in Interest income from cash management activities and an increase in interest rates related to our escrow accounts for our total servicing portfolio, and a $4 million decrease in Secured interest expense from lower utilization of our Servicing advance facility due to our MSR and servicing advance sales that occurred throughout 2017. This was partially offset by $29 million of implied interest costs recognized on the MSRs secured liability within MSRs secured interest expense in 2017, which fully offsets the implied yield as previously discussed.
Other income was $2 million during 2017, compared to zero in the prior year, as 2017 included fees earned from a client for assistance in complying with regulatory changes.
Total expenses. Salaries and related expenses decreased to $58 million, down $10 million or 15%, compared to the prior year primarily due to declines in average employee headcount and $2 million of severance costs incurred during 2016.
Foreclosure and repossession expense decreased by $16 million or 46% compared to the prior year primarily driven by lower foreclosure activity and improved portfolio delinquencies that were partially the result of the Lakeview GNMA MSR sales and other recent MSR sales of delinquent government loans.
Professional and third-party service fees decreased to $32 million, down $3 million or 9%, compared to the prior year primarily driven by expenses incurred during 2016 related to compliance enhancements.
Occupancy and other office expenses decreased by $6 million from the prior year primarily due to reductions in printing and mailing expenses from declines in our total loan servicing portfolio, as well as reductions in our rent and related occupancy expenses with respect to certain facilities that were vacated in 2016.
Exit and disposal costs were $2 million during 2017 for severance and retention expenses related to our reorganization activities.
Within Other operating expenses, Corporate overhead allocation decreased by $17 million compared to the prior year primarily due to reduced professional fees for information technology shared services. See “—Other” for a more detailed discussion of the expenses included in the Corporate overhead allocation.
Within Other operating expenses, we recorded a $22 million provision for legal and regulatory matters during 2017, compared to a $38 million provision during the prior year, driven by adjustments for negotiated settlements related to our legacy mortgage servicing practices and provisions for other matters. During 2017, we finalized the settlement of a number of our legacy legal and regulatory matters as discussed in Note 13, 'Commitments and Contingencies' in the accompanying Notes to Consolidated Financial Statements.
Within Other operating expenses, Repurchase and foreclosure-related charges decreased to $3 million, down $16 million or 84%, compared to the prior year primarily due to lower expenses that will not be reimbursed pursuant to mortgage insurance programs and exposure for legacy repurchase claims from certain private investors that was incurred during 2016.
46
2016 Compared With 2015: Mortgage Servicing segment loss was $223 million during 2016 compared to a loss of $131 million in 2015. Net revenues decreased to $83 million, down $115 million or 58%, compared with 2015 primarily driven by a decline in Loan servicing income and unfavorable results from our MSR market-related fair value adjustments. Total expenses decreased to $306 million, down $23 million or 7%, compared to the prior year primarily driven by lower Foreclosure and repossession expenses, lower provisions for Legal and regulatory reserves and a decrease in Other expenses. These decreases were partially offset by an increase in Repurchase and foreclosure-related charges, higher Corporate overhead allocation, an increase in Salaries and related expenses and an increase in Professional and third-party service fees.
Net revenues. Servicing fees from our capitalized portfolio decreased by $38 million, or 13%, compared to the prior year driven by a 12% decrease in the average capitalized loan servicing portfolio. Subservicing fees decreased by $3 million, or 4%, compared to the prior year, primarily driven by declines in the average number of loans in our subserviced portfolio from the insourcing and MSR sale actions of Merrill Lynch and HSBC, respectively, during the fourth quarter of 2016. Late fees and other ancillary servicing revenue increased by $1 million, or 3%, due to deboarding fees received from these client terminations that was partially offset by a loss on the sale of delinquent FNMA servicing in 2016 and higher repurchase activity related to Ginnie Mae buyout eligible loans as compared to the prior year.
MSR valuation changes from actual prepayments of the underlying mortgage loans decreased by $17 million, or 13%, due to a 14 basis point decrease in the value of actual prepayments compared to the prior year. MSR changes in value from actual receipts of recurring cash flows decreased by $14 million, or 35%, due to a lower average capitalized servicing rate in 2016 compared to the prior year, as well as a favorable impact from the MSR value changes of Ginnie Mae buyout eligible loan transactions.
Market-related fair value adjustments decreased the value of our MSRs by $100 million during 2016 which was partially offset by net gains on MSR derivatives of $10 million from changes in interest rates. The $100 million negative Market-related fair value adjustments during 2016 included: (i) $61 million of negative market adjustments related to changes in interest rates, a flattening of the yield curve and a calibration of our valuation model considering the pricing associated with the MSR sale agreements executed in the fourth quarter of 2016 and (ii) $39 million of negative model adjustments primarily related to $46 million of increased servicing costs and foreclosure losses that was partially offset by $5 million in favorable adjustments for updates to our prepayment model to align modeled and actual prepayments.
During 2015, Market-related fair value adjustments decreased the value of our MSRs by $18 million and net gains on MSR derivatives were $29 million from changes in interest rates. The $18 million negative Market-related fair value adjustments during 2015 include a $30 million decrease primarily from model updates to reflect increased servicing costs and foreclosure losses that was partially offset by an $8 million increase from an 18 basis point increase in the modeled primary mortgage rate and $4 million in favorable adjustments associated with updates to our prepayment model to align modeled and actual prepayments.
Total expenses. Salaries and related expenses increased to $68 million, up $12 million or 21%, compared to the prior year and included $2 million of severance costs incurred during 2016. The remaining increase was attributable to $5 million associated with an increased allocation of mortgage shared service employees to the Mortgage Servicing segment, $3 million from higher incentive compensation, and $2 million from higher contract labor to assist with short-term customer service projects.
Foreclosure and repossession expense decreased by $16 million or 31% compared to the prior year primarily driven by lower foreclosure activity and improved portfolio delinquencies that were partially the result of sales of MSRs with respect to delinquent government loans.
Professional and third-party service fees increased to $35 million, up $7 million or 25%, compared to the prior year primarily driven by expenses incurred during 2016 related to compliance activities.
Repurchase and foreclosure-related charges increased to $19 million, up $13 million which was primarily driven by increased expenses that will not be reimbursed pursuant to mortgage insurance programs and exposure for legacy repurchase claims from certain private investors.
We were subject to various regulatory investigations, examinations and inquiries related to our legacy mortgage servicing practices, and in both 2015 and 2016, we received further clarity about our expected cost of settling these matters. As a result, we recorded $38 million of provisions for Legal and regulatory reserves during 2016, as compared to $78 million in the prior year.
47
Other expenses decreased by $9 million compared to prior year primarily due to a $9 million provision incurred during 2015 for certain non-recoverable fees associated with foreclosure activities in which the reimbursement of fees to borrowers was completed in 2016.
Corporate overhead allocation increased by $7 million compared to the prior year primarily due to an increased allocation of expenses to the Mortgage Servicing segment in 2016. See “—Other” for a more detailed discussion of the expenses included in the Corporate overhead allocation.
Selected Income Statement Data:
Year Ended December 31, | |||||||||||
2017 | 2016 | 2015 | |||||||||
(In millions) | |||||||||||
Loan servicing income, net: | |||||||||||
Loan servicing income: | |||||||||||
Servicing fees from capitalized portfolio | $ | 116 | $ | 266 | $ | 304 | |||||
Subservicing fees | 56 | 67 | 70 | ||||||||
MSR yield on secured asset (1) | 29 | — | — | ||||||||
Late fees and other ancillary servicing revenue | 29 | 39 | 40 | ||||||||
Loss on sale of MSRs and related costs | (16 | ) | (3 | ) | (5 | ) | |||||
Curtailment interest paid to investors | (6 | ) | (16 | ) | (15 | ) | |||||
Total | $ | 208 | $ | 353 | $ | 394 | |||||
Changes in fair value of mortgage servicing rights: | |||||||||||
Actual prepayments of the underlying mortgage loans | $ | (42 | ) | $ | (112 | ) | $ | (129 | ) | ||
Actual receipts of recurring cash flows | (17 | ) | (26 | ) | (40 | ) | |||||
Market-related fair value adjustments | (12 | ) | (100 | ) | (18 | ) | |||||
Changes in fair value of owned MSR asset | $ | (71 | ) | $ | (238 | ) | $ | (187 | ) | ||
Change in fair value of MSRs secured asset (2) | (48 | ) | — | — | |||||||
Change in fair value of MSRs secured liability (2) | 48 | — | — | ||||||||
Net derivative gain related to MSRs | — | 10 | 29 | ||||||||
Total | $ | 137 | $ | 125 | $ | 236 | |||||
Other operating expenses: | |||||||||||
Corporate overhead allocation | $ | 34 | $ | 51 | $ | 44 | |||||
Legal and regulatory reserves | 22 | 38 | 78 | ||||||||
Repurchase and foreclosure-related charges | 3 | 19 | 6 | ||||||||
Other expenses | 22 | 23 | 32 | ||||||||
Total | $ | 81 | $ | 131 | $ | 160 | |||||
____________________
(1) | Amount is related to the secured borrowing treatment of the 2017 sales of MSRs to New Residential. The income from the MSR yield on secured asset is fully offset by the implied interest cost recognized on the MSRs secured liability within Net interest expense. |
(2) | Amounts are related to the secured borrowing treatment of the 2017 sales of MSRs to New Residential. The decrease to Change in fair value for MSRs secured asset is fully offset by an increase to Change in fair value of MSRs secured liability. For 2017, the Changes in fair value of the secured asset and liability include offsetting amounts of $29 million in Actual prepayments of the underlying mortgage loans, $12 million in Actual receipts of recurring cash flows and $7 million in Market-related fair value adjustments. |
48
The following are descriptions of the contents and drivers of the financial results of the Mortgage Servicing segment:
Loan servicing income is primarily driven by the average capitalized loan servicing portfolio, the number of loans in our subservicing portfolio and the average servicing and subservicing fee. Servicing fees from the owned capitalized portfolio is driven by recurring servicing fees that are recognized upon receipt of the coupon payment from the borrower and recorded net of guarantee fees due to the investor. For loans that are subserviced, we receive a stated amount per loan which is less than our average servicing fee related to the capitalized portfolio. The MSR yield on secured asset is driven by the average yield on the capitalized MSRs associated with the secured borrowing arrangement, which is fully offset by the implied interest cost recognized on the MSRs secured liability within Net interest expense.
Curtailment interest paid to investors represents uncollected interest from the borrower that is required to be passed onto investors and is primarily driven by the number of loan payoffs. In addition to late fees received from borrowers, Late fees and other ancillary servicing revenue includes tax service fees, the net gain or loss from the sale of MSRs and other servicing revenue, including loss mitigation revenue.
Changes in fair value of mortgage servicing rights include actual prepayments of the underlying mortgage loans, actual receipts of recurring cash flows and market-related fair value adjustments associated with our owned capitalized MSRs, as well as the capitalized MSRs and the related secured liability that have been accounted for as a secured borrowing arrangement. The fair value of our MSRs is estimated based upon projections of expected future cash flows considering prepayment estimates, our historical prepayment rates, portfolio characteristics, interest rates based on interest rate yield curves, implied volatility, servicing costs and other economic factors. In addition, our owned capitalized MSRs include consideration of pricing associated with committed MSR sale agreements.
Market-related fair value adjustments represent the change in fair value of MSRs due to changes in market inputs and assumptions used in the valuation model. Actual prepayments are driven by two factors: (i) the number of loans that prepaid during the period and (ii) the current value of the mortgage servicing right asset at the time of prepayment.
Foreclosure and repossession expenses are associated with servicing loans in foreclosure and real estate owned and are primarily driven by the size, composition and delinquency status of our loan servicing portfolio. These expenses also include unreimbursed servicing and interest costs of government insured loans.
Other operating expenses consist of Repurchase and foreclosure-related charges, Corporate overhead allocation, Legal and regulatory reserves and other servicing related expenses.
Repurchase and foreclosure-related charges are primarily driven by the actual and projected volumes of repurchase and indemnification requests, our success rate in appealing repurchase requests, expected loss severities and expenses that may not be reimbursed pursuant to government mortgage insurance programs or in the event we do not file insurance claims. Expected loss severities are impacted by various economic factors including delinquency rates and home price values while our success rate in appealing repurchase requests can fluctuate based on the validity and composition of repurchase demands and the underlying quality of the loan files.
Legal and regulatory reserves are estimated losses from litigation and various regulatory investigations, examinations and inquiries related to our legacy mortgage servicing practices.
49
Other |
We leverage a centralized corporate platform to provide shared services for general and administrative functions to our reportable segments. These shared services include support associated with, among other functions, information technology, enterprise risk management, internal audit, human resources, accounting and finance and communications. The costs associated with these shared general and administrative functions, in addition to the cost of managing the overall corporate function, are recorded within Other and allocated to our reportable segments through a corporate overhead allocation. The Corporate overhead allocation to each segment is determined based upon the actual and estimated usage by function or expense category. Any net results of Other represents amounts that are not allocated back to our reportable segments, which may include Loss on early debt retirement, certain Exit and disposal costs and Professional and third-party service fees incurred related to our strategic actions.
Results:
Year Ended December 31, | |||||||||||
2017 | 2016 | 2015 | |||||||||
(In millions) | |||||||||||
Net revenues | $ | — | $ | — | $ | 6 | |||||
Salaries and related expenses | 55 | 61 | 54 | ||||||||
Professional and third-party service fees | 62 | 99 | 109 | ||||||||
Technology equipment and software expenses | 18 | 21 | 18 | ||||||||
Occupancy and other office expenses | 2 | 3 | 3 | ||||||||
Depreciation and amortization | 6 | 5 | 5 | ||||||||
Exit and disposal costs | 22 | 8 | — | ||||||||
Other operating expenses: | |||||||||||
Loss on early debt retirement | 34 | — | 30 | ||||||||
Other | 10 | 9 | 11 | ||||||||
Total expenses before allocation | 209 | 206 | 230 | ||||||||
Corporate overhead allocation: | |||||||||||
Mortgage Production segment | (92 | ) | (118 | ) | (131 | ) | |||||
Mortgage Servicing segment | (34 | ) | (51 | ) | (44 | ) | |||||
Total expenses | 83 | 37 | 55 | ||||||||
Net loss before income taxes | $ | (83 | ) | $ | (37 | ) | $ | (49 | ) | ||
2017 Compared With 2016: Net loss before income taxes was $83 million, compared to a loss of $37 million in 2016 and primarily represents amounts that are not allocated back to our reportable segments. For 2017, the net loss primarily represents costs associated with our early debt retirement, strategic actions and reorganization of our operations to subservicing and portfolio retention services, while for 2016, the net loss primarily represents costs associated with our strategic review and exit of the PLS business. Total allocated overhead expenses declined from $169 million to $126 million, driven primarily by our efforts to lower our cost structure through our reorganization project.
Total expenses. Salaries and related expenses decreased by $6 million or 10%, compared to the prior year primarily from a decline in our average employee headcount as a result of our reorganization activities.
Professional and third-party service fees declined by $37 million in 2017, a decrease of 37% compared to the prior year. This decrease was primarily due to a $29 million decrease in information technology expenses that were associated with the modernization and security of our information technology systems and implementing new compliance requirements in our origination business in 2016. During 2017, there were also lower expenses associated with our strategic actions.
Exit and disposal costs were $22 million in 2017, compared to $8 million in the prior year. The increased costs include $18 million of severance and retention expenses for impacted Other shared services employees primarily related to the reorganization which was announced in February 2017, and $4 million in contract termination costs for system decommissioning projects used in the PLS channel.
Loss on early debt retirement was $34 million in 2017 as a result of the July 2017 extinguishment of $496 million of Term notes due in 2019 and 2021.
50
2016 Compared With 2015: Net loss before income taxes was $37 million, compared to a loss of $49 million in 2015 and primarily represents expenses that are not allocated back to our reportable segments. For 2016, the net loss primarily represents costs associated with our strategic review and Exit and disposal costs related to our exit of the PLS business, while for 2015, the net loss primarily represents losses related to the early retirement of unsecured debt and costs associated with re-engineering our business. Net revenues for 2015 were $6 million and related to the sale of the Fleet business through income from a transition services agreement. Total expenses before allocation decreased to $206 million, down $24 million, or 10%, primarily resulting from the absence of a loss on early debt retirement in 2016. The decrease in expenses was also driven from lower Professional and third-party service fees, that was partially offset with higher Salaries and related expenses.
Total expenses. Salaries and related expenses increased by $7 million in 2016, or 13%, compared to the prior year primarily from increased incentive compensation of $5 million. The remaining $2 million of expenses related to an increase in the use of contract labor for information technology resources and modest employee salary increases during 2016.
Professional and third-party service fees declined by $10 million in 2016, a decrease of 9% compared to the prior year. This decrease was primarily from the higher costs in 2015 associated with the modernization and security of our information technology systems including costs to separate our information technology systems from the Fleet business, implementing new compliance requirements in our origination business, providing services under the transition services agreement and other investments from our re-engineering efforts. This was partially offset by $32 million of expenses associated with our strategic review in 2016.
Exit and disposal costs were $8 million in 2016, as a result of our exit of the PLS channel within our Mortgage Production segment. These costs included $4 million of severance and retention expenses for impacted Other shared services employees, $3 million in contract termination costs for information technology support used in the PLS channel, and $1 million in impairment of technology-related assets.
Other operating expenses decreased by $32 million, or 78%, compared to the prior year primarily due to the 2015 Loss on early debt retirement for the exchange of the Convertible notes due in 2017.
The following are descriptions of the contents and drivers of our financial results:
Net revenues for 2015 includes income associated with a transition services agreement in which we provided to Element Financial Corporation certain transition services after the closing of the 2014 sale of the Fleet business related to, among others, information technology, human resources and financial services. A majority of the costs incurred by us to provide such transition services are included in Professional and third-party service fees. The transition services agreement were complete in 2015.
Salaries and related expenses represent costs associated with operating corporate functions and our centralized management platform and consist of salaries, payroll taxes, benefits and incentives paid to shared service support employees. These expenses are primarily driven by the average number of permanent employees.
Professional and third-party service fees represent costs associated with outsourcing specific functions of our shared services to deliver additional support. These expenses are primarily driven by information technology related expenses.
Exit and disposal costs consist of costs related to our announced exit of the PLS channel and reorganization of the business. These costs include employee severance and retention costs of impacted shared service support employees, contract termination costs of information technology support, facility exit costs and asset impairment and other non-cash related charges.
Other operating expenses includes losses associated with the early retirement or conversion of debt, and other costs associated with our corporate shared services platform.
Net loss before income taxes includes expenses that are not allocated to our reportable segments that include losses related to the early retirement of debt, costs associated with our strategic actions and re-engineering our business, and Exit and disposal costs.
51
RISK MANAGEMENT |
We are exposed to various business risks which may significantly impact our financial results including, but not limited to: (i) strategic risk (ii) interest rate risk; (iii) consumer credit risk; (iv) counterparty and concentration risk; (v) liquidity risk; and (vi) operational risk. Our risk management framework and governance structure is intended to provide oversight and ongoing management of the risks inherent in our business activities and create a culture of risk awareness. Our Chief Executive Officer and Chief Risk and Compliance Officer are responsible for the design, implementation and maintenance of our enterprise risk management program. The Audit Committee of the Board of Directors provides oversight with respect to our risk management function and the policies, procedures and practices used in identifying and managing our material risks.
Our Compliance and Risk Management organization oversees governance processes and monitoring of these risks including the establishment of risk strategy and documentation of risk policies and controls. The Compliance and Risk Management organization operates independently of the business, but works in partnership to provide oversight of enterprise risk management and controls. This includes establishing enterprise-level risk management policies, appropriate governance activities and creating risk transparency through risk reporting.
Risks unique to our business are governed through various committees including, but not limited to: (i) interest rate risk, including development of hedge strategy and policies, monitoring hedge positions and counterparty risk; (ii) quality control, including audits related to the processing, underwriting and closing of loans, findings of any fraud-related reviews and reviews of post-closing functions, such as FHA insurance and monitoring of overall portfolio delinquency trends and recourse activity; (iii) credit risk, including establishing credit policy, product development and changes to underwriting guidelines; and (iv) operational risk, including the development of policies and governance activities, monitoring risks related to cyber security and business continuity plans and ensuring compliance with applicable laws and regulations.
Strategic Risk |
We are exposed to risk with respect to our strategic actions, including completing the proposed Merger with Ocwen Financial Corporation, and the transition of our operations to a business model focused solely on subservicing and portfolio retention services. Strategic risk represents the risk to shareholder or enterprise value, current or future earnings, capital and liquidity from adverse business decisions and/or improper implementation of business strategies. Management is responsible for developing and implementing business strategies that leverage our core competencies and are appropriately structured, resourced and executed. Oversight for our strategic actions is provided by the Board of Directors. Our performance, relative to our annual business plan and our longer term strategic plan, is reviewed by management and the Board of Directors.
To achieve our financial objectives for our new business model, we need to realize our cost re-engineering reductions, subservicing growth, and portfolio retention recapture rate assumptions. Our ability to complete the transition to our new business model is highly dependent on the success of our business relationships with our significant clients and our ability to attract new clients, both of which are impacted by our capability to adequately address the competitive challenges we may face. The achievement of our goals is subject to both the risks affecting our business generally (including market, reputation, credit, operational, and legal and compliance risks) and the inherent difficulty associated with implementing these business objectives. Furthermore, our success is dependent on the skills, experience and efforts of our management team and our ability to negotiate with third parties.
For a discussion of risks related to the proposed Merger, see “Part I—Item 1A. Risk Factors—Risks Related to Our Strategies—"We may fail to consummate the proposed Merger, and uncertainties related to the consummation of the Merger may have a material adverse effect on our business, financial position, results of operations and cash flows, and negatively impact the price of our Common stock." in this Form 10-K.
For a discussion of risks related to our business, see “Part I—Item 1A. Risk Factors—Risks Related to Our Strategies—Our operations have not been profitable in recent years, and we have changed the focus of our business to subservicing and portfolio retention activities to improve our financial results. The industry in which we operate in is highly competitive, and our success depends on our ability to attract and retain clients to achieve scale and meet competitive challenges, which may be negatively impacted by client perceptions of a lack of history operating as a focused player in this market, as well as from our actions, including any past or future efforts towards executing our strategic actions. We may not be able to fully or successfully execute or implement our business strategies or achieve our objectives, and our actions taken may not have the intended result." in this Form 10-K.
52
Interest Rate Risk |
Our principal market exposure is to interest rate risk, specifically long-term Treasury and mortgage interest rates due to their impact on mortgage-related assets and commitments. We are also exposed to changes in short-term interest rates on certain variable rate borrowings related to mortgage warehouse debt. We anticipate that such interest rates will remain our primary benchmark for market risk for the foreseeable future.
We are subject to variability in our results of operations due to fluctuations in interest rates. In a declining interest rate environment, we would expect the results of our origination business within the Mortgage Production segment to be positively impacted by higher loan origination volumes and improved loan margins. However, in a rising interest rate environment, we would expect a negative impact to the results of our origination business. With respect to a declining interest rate environment, we expect the results of our servicing business to decline due to higher actual and projected loan prepayments related to our capitalized loan servicing portfolio; while in a rising interest rate environment, we expect a positive effect.
Refer to “—Item 7A. Quantitative and Qualitative Disclosures About Market Risk” for an analysis of the impact of changes in interest rates on the valuation of assets and liabilities that are sensitive to interest rates.
Mortgage Loans and Interest Rate Lock Commitments
Interest rate lock commitments represent an agreement to extend credit to a mortgage loan applicant, or an agreement to purchase a loan from a third-party originator, whereby the interest rate on the loan is set prior to funding. The fair values of our Mortgage loans held for sale, which are held in inventory awaiting sale into the secondary market, and our Interest rate lock commitments, are subject to changes in mortgage interest rates from the date of the commitment through the sale of the loan into the secondary market. As a result, we are exposed to interest rate risk and related price risk during the period from the date of the lock commitment through (i) the lock commitment cancellation or expiration date; or (ii) the date of sale into the secondary mortgage market. Loan commitments generally range between 30 and 90 days, and we typically sell mortgage loans within 30 days of origination.
A combination of options and forward delivery commitments on mortgage-backed securities or whole loans are used to hedge our commitments to fund mortgages and our loans held for sale. These forward delivery commitments fix the forward sales price that will be realized in the secondary market and thereby reduce the interest rate and price risk to us. Our expectation of the amount of our interest rate lock commitments that will ultimately close is a key factor in determining the notional amount of derivatives used in hedging the position.
For more information, see “Part I—Item 1A. Risk Factors—Risks Related to Our Business—Our hedging strategies may not be successful in mitigating our exposure to interest rate risk." in this Form 10-K.
Mortgage Servicing Rights
Mortgage servicing rights (“MSRs”) are inherently subject to substantial interest rate risk as the mortgage notes underlying the MSRs permit the borrowers to prepay the loans. Therefore, the value of MSRs generally tends to diminish in periods of declining interest rates (as prepayments increase) and increase in periods of rising interest rates (as prepayments decrease). During 2017, we completed the sale of a significant portion of our MSRs, which shifted the composition of our servicing portfolio to primarily subserviced loans. We do not anticipate retaining a significant amount of capitalized MSRs in the future. As of December 31, 2017, $34 million of our owned capitalized MSRs are committed for sale to New Residential. These committed MSRs are not subject to significant interest rate risk since our determination of fair value considers the pricing associated with the sale agreement; however, these MSRs are subject to credit risk of New Residential.
Consumer Credit Risk |
We are not subject to the majority of the credit-related risks inherent in maintaining a mortgage loan portfolio because loans are not held for investment purposes. We sell nearly all of the mortgage loans that we originate in the secondary mortgage market on a non-recourse basis within 30 days of origination. Conforming loan sales are primarily in the form of mortgage-backed securities guaranteed by Fannie Mae, Freddie Mac or Ginnie Mae (collectively, the "Agencies").
Our exposure to consumer credit risk primarily relates to loan repurchase and indemnification obligations from breaches of representation and warranty provisions of our loan sale or servicing agreements, which result in indemnification payments or exposure to loan defaults and foreclosures. The representation and warranties made by us are set forth in our loan sale agreements
53
and relate to, among other things, the ownership of the loan, the validity of the lien securing the loan, the underwriting standards required by the investor, the loan’s compliance with applicable local, state and federal laws and, for loans with a loan-to-value ratios greater than 80%, the existence of primary mortgage insurance. Investors routinely request loan files to review for potential breaches of representation and warranties. In the event a breach of these representation and warranties is identified by an investor, the investor will issue a repurchase demand, and we may be required to repurchase the mortgage loan or indemnify the investor against loss. We subject the population of repurchase and indemnification requests to a comprehensive review and appeals process to establish the validity of the claim and determine our corresponding obligation.
We have established a loan repurchase and indemnification liability for our estimate of exposure to losses related to our obligation to repurchase or indemnify investors for loans sold. This liability represents management’s estimate of probable losses based on the best information available and requires the application of a significant level of judgment and the use of a number of assumptions. As loans are repurchased, we reduce our estimated losses related to repurchase and indemnification obligations and record reserves for on-balance sheet loans in foreclosure and real estate owned which will likely not be recoverable from guarantors, insurers or investors.
The table below presents our repurchase and foreclosure-related reserves activity and the number of repurchase and indemnification requests received:
Year Ended December 31, | |||||||||||
2017 | 2016 | 2015 | |||||||||
($ In millions) | |||||||||||
Balance, beginning of period | $ | 73 | $ | 89 | $ | 93 | |||||
Realized losses | (34 | ) | (42 | ) | (19 | ) | |||||
Transfer of reserves(1) | (5 | ) | — | — | |||||||
Increase in reserves due to: | |||||||||||
Change in assumptions | 3 | 19 | 6 | ||||||||
New loan sales | 3 | 7 | 9 | ||||||||
Balance, end of period | $ | 40 | $ | 73 | $ | 89 | |||||
Repurchase and indemnification requests received (number of loans) | 271 | 384 | 460 | ||||||||
______________
(1) | Represents reserves associated with certain Mortgage loans in foreclosure that were transferred to Mortgage loans held for sale and subsequently sold during the year ended December 31, 2017 in connection with our marketing those assets for sale. |
In December 2016, we entered into resolution agreements with Fannie Mae and Freddie Mac to resolve substantially all representation and warranty exposure related to the sale of mortgage loans that were originated and delivered prior to September 30, 2016 and November 30, 2016, respectively. As of December 31, 2017, our Loan repurchase and indemnification liability primarily consisted of (i) losses for private loans and newly originated mortgage loans, where a repurchase or indemnification obligation could exist from breaches of representation and warranties, (ii) losses for specific non-performing loans where we believe we will be required to indemnify the investor and (iii) losses for government loans that may not be reimbursed pursuant to mortgage insurance programs. Our liability from loan repurchases and indemnification requests does not reflect losses from litigation or governmental examinations, investigations or inquiries. As of December 31, 2017, the estimated amount of reasonably possible losses in excess of the recorded liability was not significant.
See Note 13, 'Commitments and Contingencies', in the accompanying Notes to Consolidated Financial Statements and “—Critical Accounting Policies and Estimates” for additional information regarding our repurchase and foreclosure-related reserves.
Counterparty and Concentration Risk |
We are exposed to risk in the event of non-performance by counterparties to various agreements, derivative contracts, and sales transactions. In general, we manage such risk by evaluating the financial position and creditworthiness of counterparties, monitoring the amount for which we are at risk, requiring collateral, typically cash, in instances in which financing is provided and/or dispersing the risk among multiple counterparties. We also manage our exposure to risk from derivative counterparties through entering into bilateral collateral agreements and legally enforceable master netting agreements with many counterparties. As of December 31, 2017, there were no significant concentrations of credit risk related to our net exposure with any individual counterparty with respect to our derivative transactions.
54
During 2017, we entered into assignments with LenderLive and GRA related to certain facility leases that were transferred in connection with transactions associated with our PLS business and Real Estate channel exits. Under the terms of the original facility leases, we remain jointly and severally obligated with LenderLive and GRA for performance under the lease agreements. As of December 31, 2017, the total amount of potential future lease payments under these guarantees was approximately $15 million; however, we do not believe any amount of losses under these guarantees is probable.
See “Part I—Item 1A. Risk Factors—Risks Related to Our Strategies—Our remaining business will be focused on subservicing and portfolio retention activities, and we have significant client concentration risk related to the percentage of subservicing and portfolio retention activities from agreements with New Residential Mortgage, LLC and Pingora Loan Servicing, LLC. Further, the terms of a significant portion of our subservicing agreements allow the owners of the servicing to terminate the subservicing agreement without cause which would also terminate any related portfolio defense agreements.” in this Form 10-K.
Production
After the completion of our exit activities, our future mortgage loan originations will be sourced solely through portfolio retention services, which we provide to two key clients associated with our significant subservicing client relationships that represented a combined 77% concentration of our total subservicing portfolio as of December 31, 2017. Our portfolio defense agreements cease upon the termination of the related client subservicing relationship, or as units transfer out of our subservicing portfolio to a new servicer. In addition, for the majority of the solicitable portfolio, we are authorized to seek refinance of mortgage loans on a non-exclusive basis, which may further limit our future mortgage loan originations since we must compete with other originators. During the year ended December 31, 2017, total originations from portfolio retention represented 6% of our total origination volume.
In November 2016, we announced our intentions to exit the PLS business, and during February 2017, we announced that we entered into agreements to sell certain assets of PHH Home Loans and its subsidiaries, including its mortgage origination and processing centers. During the year ended December 31, 2017, the PLS business and Real Estate channel represented 66% and 28% of our mortgage loan originations, respectively.
Servicing
Our Mortgage Servicing segment has exposure to concentration risk and client retention risk with respect to our subservicing agreements. As of December 31, 2017, our subservicing portfolio (by units) included significant client relationships with New Residential and Pingora Loan Servicing, LLC, which represented 58% and 19% of our subservicing portfolio, respectively. The terms of a substantial portion of our subservicing agreements allow the owners of the servicing to terminate the subservicing agreement without cause with respect to some or all of the subserviced loans and, in some cases, without payment of any termination fee. The term of our subservicing agreement with New Residential extends through June 2020; however, New Residential has the right to transfer, without cause, 25% of the subservicing units beginning in June 2018, and an additional 25% of the subservicing units beginning in June 2019. The termination of subservicing agreements, or other significant reductions to our subservicing units, could adversely affect our business, financial condition and results of operations. We expect the transfer of approximately 115,000 subservicing units off of our platform between May 2018 and April 2019, based upon receipt in February 2018 of formal notices and verbal indications from two of our largest subservicing clients. Approximately 65,000 of these units are subject to a portfolio defense agreement and will no longer be solicitable units upon transfer to a new servicer. There can be no assurances that our subservicing agreements or relationships will not be subject to further change.
Market conditions, including interest rates and future economic projections, could impact investor demand to hold MSRs, which may result in our loss of additional subservicing relationships, or significantly decrease the number of loans under such relationships.
Our Mortgage Servicing segment also has exposure to concentration risk associated with the amount of our servicing portfolio for which we must maintain compliance with the requirements of the GSE servicing guides. As of December 31, 2017, 57% of our servicing portfolio requires compliance with these servicing guides.
We utilize several risk mitigation strategies in an effort to minimize losses from delinquencies, foreclosures and real estate owned including: collections, loan modifications, and foreclosure and property disposition. Since the majority of the risk resides with the investor and not with us, these techniques may vary based on individual investor and insurer requirements.
55
The greatest concentrations of properties securing the mortgage loans in our total servicing portfolio are located in the following states:
December 31, | |||||
2017 | 2016 | ||||
Major Geographical Concentrations: | |||||
California | 22.6 | % | 20.2 | % | |
New York | 11.8 | % | 11.4 | % | |
Florida | 6.5 | % | 6.3 | % | |
New Jersey | 5.8 | % | 5.7 | % | |
Other | 53.3 | % | 56.4 | % | |
The following table summarizes the percentage of loans that are greater than 90 days delinquent, in foreclosure and real estate owned based on the unpaid principal balance for significant geographical concentrations:
December 31, 2017 | ||
New York | 26.0 | % |
New Jersey | 12.5 | % |
Florida | 10.2 | % |
California | 6.1 | % |
Liquidity Risk |
We are exposed to liquidity risk through our ongoing needs to originate and finance mortgage loans, sell mortgage loans into secondary markets, retain mortgage servicing rights, repay maturing debt, meet our contractual obligations and otherwise fund our operations. Liquidity is an essential component of our ability to operate and grow our business; therefore, it is crucial that we maintain adequate levels of excess liquidity to fund our businesses during normal economic cycles and events of market stress. We rely on internal cash flow generation and external financing sources to fund a portion of our operations. To achieve our liquidity objectives, we consider current cash position, business conditions, expected cash flow generation, upcoming debt maturities, potential risks, potential refinancing strategies and capital market conditions that dictate the availability of liquidity.
As we execute on our strategic actions, we are currently expecting significant changes to our business profile, liquidity and capital structure and funding requirements, including expected changes in our mortgage origination volumes driven by the sales or exit of certain businesses. As such, our ability to renew our mortgage warehouse facilities may be more limited than our historical experience. For further discussion of our risks related to our warehouse agreements, see “Part I—Item 1A. Risk Factors—Risks Related to Our Business—Our mortgage asset-backed debt arrangements, a significant portion of which are short-term agreements, are an important source of our liquidity. If any of our funding arrangements are terminated, not renewed or otherwise become unavailable to us, we may be unable to find replacement financing on economically viable terms, if at all. If a substantial portion of such arrangements are terminated, not renewed, and cannot be replaced, it would adversely affect our ability to fund our operations.” in this Form 10-K.
We periodically evaluate our liquidity sources and uses. Senior management regularly reviews our current liquidity position and projected liquidity needs including any potential and/or pending events that could impact liquidity positively or negatively. Additionally, management has established internal processes to monitor the availability under our existing debt arrangements. We address liquidity risk by maintaining committed borrowing capacity under mortgage funding facilities and cash on hand in excess of our expected operating needs. The Audit Committee reviews the liquidity and financing plan to assess whether management has appropriately planned and provided for liquidity risks and subsequently recommends the plan for approval by the Board of Directors on an annual basis.
Operational Risk |
Operational risk is inherent in our business practices and related support functions. Operational risk is the risk of loss resulting from inadequate or failed internal processes or systems, human factors or external events. Operational risk may occur in any of our business activities and can manifest itself in various ways including, but not limited to, errors resulting from business process failures, material disruption in business activities, system breaches and misuse of sensitive information and failures of outsourced
56
business processes. These events could result in non-compliance with laws or regulations, regulatory fines and penalties, litigation or other financial losses, including potential losses resulting from lost client relationships.
Our business is subject to extensive regulation by federal, state and local government authorities, which require us to operate in accordance with various laws, regulations, and judicial and administrative decisions. While we are not a bank, our business subjects us to both direct and indirect banking supervision (including examinations by our clients' regulators), and each client may require a unique compliance model. In recent years, there have been a number of developments in laws and regulations that have required, and will likely continue to require, widespread changes to our business. The frequent introduction of new rules, changes to the interpretation or application of existing rules, increased focus of regulators, and near-zero defect performance expectations have increased our operational risk related to compliance with laws and regulations.
To monitor and control this risk, we have established policies, procedures and a controls framework that are designed to provide sound and consistent risk management processes and transparent operational risk reporting. The Compliance and Risk Management organization receives reports and information regarding risk issues directly from our business process owners. We have established risk management tools that include:
• | Risk and control self-assessments to evaluate key control design and operating effectiveness, and determine if control enhancements are necessary; |
• | Operational event reporting and tracking which provides information about operational breakdowns and the root cause, as well as the status of efforts to remediate; |
• | Third party risk oversight which provides a framework to assess and monitor the level of risk and complexity of third party relationships; and |
• | An independent assessment by Internal Audit of the design and effectiveness of our key controls, regulatory compliance and reporting. |
Our operational risk includes managing risks relating to information systems and information security. As a service provider, we actively utilize technology and information systems to operate our business and support business development. We also must safeguard the confidential personal information of our customers, as well as the confidential personal information of the employees and customers of our clients. We consider industry best practices to manage our technology risk, and we continually develop and enhance the controls, processes and systems to protect our information systems and data from unauthorized access.
See “Part I—Item 1A. Risk Factors—Other Risks—A failure in or breach of our technology infrastructure or information protection programs, or those of our outsource providers, could result in the inadvertent disclosure of the confidential personal information of our customers, as well as the confidential personal information of the customers of our clients. Any such failure or breach, including as a result of cyber-attacks against us or our outsource partners, could have a material and adverse effect on our business, reputation, financial position, results of operations or cash flows." for more information.
LIQUIDITY AND CAPITAL RESOURCES |
Our sources of liquidity include: unrestricted Cash and cash equivalents; proceeds from the sale or securitization of mortgage loans; secured borrowings, including mortgage warehouse and servicing advance facilities; cash flows from operations; the unsecured debt markets; asset sales; and equity markets. Our primary operating funding needs arise from the origination and financing of mortgage loans and the retention of mortgage servicing rights. Our liquidity needs can also be significantly influenced by changes in interest rates due to collateral posting requirements from derivative agreements as well as the levels of repurchase and indemnification requests. Given our expectation for business volumes, we believe that our sources of liquidity are adequate to fund our operations for at least the next 12 months. We expect aggregate capital expenditures to not be significant for 2018, in comparison to $1 million for 2017.
We manage our liquidity and capital structure to achieve our strategic objectives, to fund business operations and to meet contractual obligations, including maturities of our indebtedness. In developing our liquidity plan, we consider how our needs may be impacted by various factors, including operating requirements during the period, risks and contingencies, upcoming debt maturities and working capital needs. We also assess market conditions and capacity for debt issuance in various markets that may provide funding alternatives for our business needs.
57
Throughout 2017, we were focused on completing asset sales, exiting certain business platforms, reducing our unsecured debt and completing returns of capital to our shareholders in order to transition to a capital-light business model. We have been continually assessing our available excess cash based on the total proceeds realized from our MSR sales, the value realized from our PHH Home Loans joint venture, the progress towards executing our PLS exit, transaction, restructuring and PLS exit costs, and the working capital and contingency needs for the remaining business. Based on such assessments, throughout 2017, we have made significant distributions to our shareholders and repaid unsecured debt to evolve our capital structure towards our targeted levels for our future business.
We started the year with $906 million of cash as of December 31, 2016, which included $67 million of cash in variable interest entities. During 2017, our significant cash activities included:
• | $810 million of cash inflows realized from our asset sales, which includes $727 million from our sales of MSRs plus sale or collection of advances, $35 million of net inflows from our PHH Home Loans asset sales and $48 million from monetizing residual assets, including, among others, the sales of certain loans in foreclosure, second liens and real estate owned. |
• | $303 million of cash outflows incurred related to our business exits, transactions and legacy legal matters, including $133 million related to our PLS operating losses, re-engineering and exit programs, $53 million of costs associated with MSR transactions and our strategic actions, and $117 million in payments for legal and regulatory settlements; |
• | $301 million returned to our shareholders through share repurchases (see detail below); and |
• | $524 million paid to complete a debt tender offer for $496 million principal of our term notes. After the tender, note principal of $119 million remains outstanding. |
Through those actions, and the net changes in funding our operations, our total unrestricted cash position as of December 31, 2017 was $542 million, which includes $33 million of cash in variable interest entities.
We have started to monetize our residual assets; however, the time frame for executing the remaining MSR sale transactions has been extended due to the complexity of the consent process for private MSRs, the number of parties involved, and the depth of investor and trustee due diligence, as discussed further in "—Executive Summary".
We have identified further estimated potential uses of our cash over the next 12 months which, include $102 million related to PLS operating losses, re-engineering and exit programs, and $5 million for payment of MSR transaction costs and advisory, legal and professional fees associated with our strategic actions. We intend to maintain excess cash to cover contingencies, which include $20 million related to our legal and regulatory reserves, and $20 million related to other contingencies for mortgage loan repurchases, MSR sale agreement indemnifications, and other contingencies. In addition, our excess cash requirements include payment of our unsecured debt obligations which may limit our ability to use our cash to fund our operations and future business opportunities. If we are able to complete our sales of private MSRs and related advances, we would utilize a portion of the proceeds to repay borrowings under our servicing advance facility.
In November 2017, our Board of Directors provided an authorization for up to $100 million of share repurchases. We have no obligation to repurchase shares under this authorization, and any share repurchase program may be extended, modified, suspended or discontinued at any time. Pursuant to the Agreement and Plan of Merger dated as of February 27, 2018 among Ocwen, POMS Corp and PHH, any share repurchases require the prior consent of Ocwen.
For more information, see “Part II—Item 1A. Risk Factors—Risks Related to our Common Stock—Our decision to return cash to shareholders through stock repurchases has reduced our market capitalization and may not prove to be the best use of our capital." and “Part I—Item 1A. Risk Factors—Risks Related to Our Strategies—The amount of additional capital returned to shareholders, if any, as a result of our strategic actions may be less than our expectations. Furthermore, there can be no assurances about the method, timing or amounts of any such distributions." in this Form 10-K.
Completed Share Repurchases: Between May 2017 and July 2017, our Board of Directors authorized share repurchases up to an aggregate $300 million. From May through early August 2017, we completed the repurchase of 2,450,466 shares for $34 million under an open market program. In August 2017, we announced the commencement of a modified “Dutch auction” tender offer to purchase shares of our common stock for an aggregate amount of up to $266 million in cash, with the right to increase the offer for an additional 2% of its outstanding shares. In September 2017, we completed the tender offer and repurchased 18,762,962 shares for $267 million.
58
Unencumbered Assets: As of December 31, 2017, a significant portion of our assets are under financing arrangements or are subject to sale commitments. The following table identifies the Total assets on our Consolidated Balance Sheet that are unencumbered:
Total Assets | Collateral for Asset-backed Borrowing Arrangements | Sale Commitments | Other | Unencumbered Assets | |||||||||||||||
(In millions) | |||||||||||||||||||
Cash and cash equivalents | $ | 542 | $ | — | $ | — | $ | — | $ | 542 | |||||||||
Restricted cash | 41 | 13 | — | 28 | — | ||||||||||||||
Mortgage loans held for sale | 270 | 233 | — | — | 37 | ||||||||||||||
Accounts receivable, net | 78 | — | — | — | 78 | ||||||||||||||
Servicing advances, net | 356 | 56 | 54 | 232 | 14 | ||||||||||||||
Mortgage servicing rights | 476 | — | 39 | 419 | 18 | ||||||||||||||
Property and equipment, net | 22 | — | — | — | 22 | ||||||||||||||
Other assets | 26 | — | — | 1 | 25 | ||||||||||||||
Total assets | $ | 1,811 | $ | 302 | $ | 93 | $ | 680 | $ | 736 | |||||||||
Total Servicing advances committed to be transferred under our MSR sale agreements of $110 million as of December 31, 2017 includes both advances that are presently collateral for asset-backed borrowing arrangements and amounts that are self-funded. Therefore, the Servicing advances committed under MSR sale agreements appears in both columns of the table above.
Other restrictions and encumbrances include the following:
• | Restricted cash represents letters of credit, funds received for pending mortgage closings, and other contractual arrangements. |
• | Servicing advances represent the balance of Servicing advance liabilities for advances funded by our subservicing clients, as discussed below under "—Debt—Servicing Advance Funding Arrangements". |
• | MSRs represent amounts under secured borrowing arrangements where we have recognized a liability for MSRs transferred to a third party that does not meet the criteria for sale accounting. See further discussion in Note 1, 'Summary of Significant Accounting Policies' in the accompanying Notes to Consolidated Financial Statements. |
Cash Flows |
The following table summarizes the changes in Cash and cash equivalents:
Year Ended December 31, | |||||||||||
2017 | 2016 | Change | |||||||||
(In millions) | |||||||||||
Cash provided by (used in): | |||||||||||
Operating activities | $ | 303 | $ | 74 | $ | 229 | |||||
Investing activities | 197 | 50 | 147 | ||||||||
Financing activities | (864 | ) | (124 | ) | (740 | ) | |||||
Net decrease in Cash and cash equivalents | $ | (364 | ) | $ | — | $ | (364 | ) | |||
Operating Activities
Our cash flows from operating activities reflect the net cash generated or used in our business operations and can be significantly impacted by the timing of mortgage loan originations and sales. The operating results of our businesses are impacted by significant non-cash activities which include: (i) the capitalization of mortgage servicing rights in our Mortgage Production segment and (ii) the change in fair value of mortgage servicing rights in our Mortgage Servicing segment.
During the year ended December 31, 2017, cash provided by our operating activities was $303 million, primarily driven by a $413 million decrease in Mortgage loans held for sale between December 31, 2017 and 2016, which was primarily the result of our declining loan origination pipeline at the end of 2017 driven by our exits of the PLS business and Real Estate channel,
59
and also impacted by net collections of Servicing advances of $272 million driven by advances collected through our MSR sales and improved management of those receivable cash flows. This was partially offset by operating losses primarily in our PLS business of $93 million, cash used for our strategic actions, payments for exit and disposal costs and payments associated with settlements of legal and regulatory matters.
During the year ended December 31, 2016, cash provided by our operating activities was $74 million, primarily driven by a $60 million decrease in Mortgage loans held for sale between December 31, 2016 and 2015, which was the result of timing differences between origination and sale as of the end of each period. The increase in cash was also driven by operating benefits from amendments to our private label and subservicing agreements. This was partially offset by cash used for re-engineering efforts, our strategic actions and legal settlements.
Investing Activities
Our cash flows from investing activities include cash flows related to collateral postings or settlements of our MSR derivatives which were settled in the first half of 2017, proceeds on the sale of mortgage servicing rights, purchases of property and equipment and changes in the funding requirements of restricted cash.
During the year ended December 31, 2017, cash provided by our investing activities was $197 million, which was primarily driven by $158 million of net cash received from MSR and related servicing advances and $70 million of cash received from the PHH Home Loans asset sales, that was partially offset by $45 million of net cash paid to settle MSR-related derivatives which were terminated in December 2016 in connection with the MSR sale agreements.
During the year ended December 31, 2016, cash provided by our investing activities was $50 million. The balance was mainly driven by $60 million of net cash received from MSR derivatives for settlements and driven by relative changes in interest rates. During 2016, we announced the sale of substantially all of our MSR portfolio, which resulted in the settlement of the majority of our MSR derivatives. In addition, there was $12 million of cash received from the proceeds on the sale of MSRs under our MSR flow sale arrangements. These balances were partially offset with $17 million in purchases of property and equipment and an increase in our restricted cash balance.
Financing Activities
Our cash flows from financing activities include proceeds from and payments on borrowings under our mortgage warehouse facilities, our servicing advance facility and MSRs secured borrowing arrangement. The fluctuations in the amount of borrowings within each period are due to working capital needs and the funding requirements for assets, including Mortgage loans held for sale and Mortgage servicing rights. The outstanding balances under our warehouse and servicing advance debt facilities vary daily based on our current funding needs for eligible collateral and our decisions regarding the use of excess available cash to fund assets. As of the end of each quarter, our financing activities and Consolidated Balance Sheets reflect our efforts to maximize secured borrowings against the available asset base, increasing the ending cash balance. Within each quarter, excess available cash is utilized to fund assets rather than using the asset-backed borrowing arrangements, given the relative borrowing costs and returns on invested cash.
During the year ended December 31, 2017, cash used in our financing activities was $864 million which primarily related to $524 million of cash paid to complete the tender offer of our Term Notes due in 2019 and 2021 including the early tender premium, $301 million used to retire shares in our open market share repurchase program, $402 million of net payments on our secured borrowings primarily resulting from the decreased funding requirements for Mortgage loans held for sale and Servicing advances that were partially offset by $426 million of proceeds from the sales of our MSRs to New Residential that were treated as a secured borrowing arrangement. We also distributed $60 million of cash to the noncontrolling interest holder of PHH Home Loans, which reflects their pro-rata share of the proceeds from the asset sales to GRA, and other distributions pursuant to the Operating Agreement.
During the year ended December 31, 2016, cash used in our financing activities was $124 million which primarily related to $88 million of net payments on our secured borrowings resulting from decreased funding requirements for Mortgage loans held for sale and Servicing advances. Additionally, $23 million was used to retire shares in our open market share repurchase program.
60
Debt |
The following table summarizes our Debt as of December 31, 2017:
Balance | Collateral(1) | ||||||
(In millions) | |||||||
Warehouse facilities | $ | 220 | $ | 236 | |||
Servicing advance facility | 32 | 66 | |||||
Unsecured debt, net | 118 | — | |||||
Total | $ | 370 | $ | 302 | |||
______________
(1) | Assets held as collateral are not available to pay our general obligations. |
See Note 10, 'Debt and Borrowing Arrangements' in the accompanying Notes to Consolidated Financial Statements for additional information regarding the components of our debt and for additional discussion of risks related to our asset-backed debt, see “Part I—Item 1A. Risk Factors—Risks Related to Our Business—Our mortgage asset-backed debt arrangements, a significant portion of which are short-term agreements, are an important source of our liquidity. If any of our funding arrangements are terminated, not renewed or otherwise become unavailable to us, we may be unable to find replacement financing on economically viable terms, if at all. If a substantial portion of such arrangements are terminated, not renewed, and cannot be replaced, it would adversely affect our ability to fund our operations.”
Warehouse facilities
Warehouse facilities primarily represent variable-rate mortgage repurchase facilities to support the origination of mortgage loans. Mortgage repurchase facilities, also called warehouse lines of credit, are one component of our funding strategy, and they provide creditors a collateralized interest in specific mortgage loans that meet the eligibility requirements under the terms of the facility during the warehouse period. The source of repayment of the facilities is typically from the sale or securitization of the underlying loans into the secondary mortgage market.
We utilize both committed and uncommitted warehouse facilities, and we evaluate our capacity needs under these facilities based on forecasted volume of mortgage loan closings and sales. Throughout the year ended December 31, 2017, at our election, we reduced the capacity for certain facilities as well as entered into shorter terms for certain facilities to allow both us and our lenders to evaluate facility needs and agreement terms that would be appropriate for our new business model after the completion of our strategic actions. There can be no assurances that our lenders will agree to continued facility extensions on terms acceptable to us.
Our ability to maintain liquidity through mortgage warehouse facilities is dependent on:
• | lenders' satisfactory assessment of us as a borrower and/or guarantor, including how these assessments are affected by our ongoing strategic actions; |
• | the quality and eligibility of assets underlying the arrangements; |
• | our ability to negotiate terms acceptable to us; |
• | our ability to access the secondary market for mortgage loans; and |
• | our ability to comply with certain financial covenants. |
61
Mortgage warehouse facilities consisted of the following as of December 31, 2017:
Total Capacity | Outstanding Balance | Available Capacity (1) | Maturity Date | ||||||||||
(In millions) | |||||||||||||
Debt: | |||||||||||||
Committed facilities: | |||||||||||||
Wells Fargo Bank, N.A. (2) | $ | 200 | $ | 40 | $ | 160 | 4/2/2018 | ||||||
Bank of America, N.A. | 75 | 59 | 16 | 3/31/2018 | |||||||||
Barclays Bank PLC (3) | 100 | 70 | 30 | 1/31/2018 | |||||||||
Committed warehouse facilities | 375 | 169 | 206 | ||||||||||
Uncommitted facilities: | |||||||||||||
Fannie Mae | 200 | 51 | 149 | n/a | |||||||||
Barclays Bank PLC (3) | 100 | — | 100 | n/a | |||||||||
Total | $ | 675 | $ | 220 | $ | 455 | |||||||
Off-Balance Sheet Gestation Facilities: | |||||||||||||
Uncommitted facilities: | |||||||||||||
JP Morgan Chase Bank, N.A. | $ | 100 | $ | — | $ | 100 | n/a | ||||||
______________
(1) | Capacity is dependent upon maintaining compliance with the terms, conditions, and covenants of the respective agreements and may be further limited by asset eligibility requirements. |
(2) | On February 20, 2018, the committed capacity was reduced to $100 million at our request. |
(3) | On January 30, 2018, we extended the committed Barclay's warehouse facility through April 30, 2018, with committed capacity of $100 million and uncommitted capacity of $25 million. |
Our funding strategies for mortgage originations may also include the use of committed and uncommitted mortgage gestation facilities. Gestation facilities effectively finance mortgage loans that are eligible for sale to an agency prior to the issuance of the related mortgage-backed security.
Servicing Advance Funding Arrangements
Under most of our mortgage servicing agreements where we own the MSRs, we are required to advance our own funds for scheduled principal, interest, tax and insurance payments when the mortgage loan borrower has failed to make the scheduled payments; and to cover foreclosure costs and various other items that are required to preserve the assets being serviced. Generally, we collect on these servicing advance receivables through future payments from the respective borrower, from liquidation proceeds, or from investor or insurance claims following foreclosure or liquidation. We are generally exposed to losses from these receivables only to the extent that the respective servicing guidelines are not followed or if we have a breach of the representations and warranty provisions of our loan sale agreements. Also, in many cases, we can cease making advances when the advances are no longer deemed to be recoverable from liquidation proceeds. As discussed below, our strategies to fund these servicing advance receivables include the issuance of asset-backed notes.
In addition, under certain of our subservicing agreements, we are required to advance our own funds to preserve the assets being serviced. Our subservicing agreements generally contain provisions that require the subservicing client to pre-fund advances on the subserviced loans or to reimburse us for those advances on a monthly or other periodic basis. We are exposed to risk with respect to this process, because if the client fails to make such reimbursement, we may be required to fund unreimbursed advances for an extended period.
62
As of December 31, 2017, there are $356 million of Servicing advance receivables on our Consolidated Balance Sheet, including $92 million from our own funds, and the remainder funded as outlined below:
Total Capacity(1) | Outstanding Balance | Available Capacity(2) | Maturity Date | ||||||||||
(In millions) | |||||||||||||
Debt: | |||||||||||||
PSART Servicing Advance facility | $ | 65 | $ | 32 | $ | 33 | 3/15/2018 | ||||||
Subservicing advance liabilities: | |||||||||||||
Client-funded amounts | n/a | 232 | n/a | n/a | |||||||||
Total | $ | 264 | |||||||||||
______________
(1) | On January 1, 2018 the total capacity for the PSART Servicing Advance facility was reduced to $50 million. |
(2) | Capacity is dependent upon maintaining compliance with the terms, conditions, and covenants of the respective agreements and may be further limited by asset eligibility requirements. |
PSART Servicing Advance Facility. PHH Servicer Advance Receivables Trust (“PSART”), a special purpose bankruptcy remote trust, was formed for the purpose of issuing non-recourse asset-backed notes, up to a maximum principal amount of $65 million, secured by servicing advance receivables. PSART was consolidated as a result of the determination that we are the primary beneficiary of the variable interest entity, as discussed in Note 17, 'Variable Interest Entities' in the accompanying Notes to Consolidated Financial Statements.
PSART issues variable funding notes that have a revolving period, during which time the monthly collection of advances are applied to pay down the notes and create additional availability to fund advances. The expiration of the revolving funding period and the final maturity date of the notes is March 15, 2018, and we are required to repay the outstanding balance through advance collections or additional payments on or before final maturity. In all cases, including upon an increased pace of amortization or an event of default as described below, all amortization and repayment of the notes is serviced from the ongoing recovery on the servicing advances that secure the notes. On or before the final maturity date in March 2018, we expect to negotiate a short-term extension of the servicing advance facility to meet future capacity needs as we work towards executing our private MSR sales to New Residential; however, there can be no assurances that the noteholder will agree to such an extension. We are required to use the cash generated from the sale of Servicing advances financed through PSART to repay the related outstanding debt.
Our ability to maintain liquidity through PSART is dependent upon:
• | the eligibility of servicing advance receivables underlying the arrangement and our ability to recover advances in a timely and efficient manner; |
• | maintaining our role as servicer of the underlying mortgage assets; and |
• | our ability to comply with certain financial and other covenants, the breach of which could result in the ability of the noteholder to terminate their commitment to fund new advances through the purchase of additional notes, an increased pace of amortization for the notes and/or an event of default. |
Subservicing Advance Liabilities. When our subservicing client pre-funds advances or reimburses us for such advances, as described above, a subservicing advance liability is recorded for cash received from the subservicing client, and is repaid to the client upon the collection of the mortgage servicing advance receivables. As we transition to a subservicing focused, capital-light business model, we plan to increase our use of client-funded arrangements and minimize our funding needs for servicing advance receivables.
Our ability to maintain liquidity through such client-funded arrangements is dependent on the creditworthiness of our subservicing clients and their ability to fund and/or reimburse the servicing advances and our adherence to the applicable servicing guidelines when making the advances.
63
Unsecured Debt
On June 19, 2017, we commenced tender offers to purchase for cash any and all of the Term Notes due in 2019 and 2021. On July 3, 2017, we repaid $178 million of the 2019 Notes and $318 million of the 2021 Notes for an aggregate $524 million in cash, plus accrued interest. On July 17, 2017, upon expiration of the tender offer, the amount of notes repaid was not significant. We recognized a loss of $34 million in Other operating expenses in the Consolidated Statements of Operations related to this debt retirement during the year ended December 31, 2017.
Beginning on August 15, 2017, we have the option to redeem the Term notes due in 2021, in whole or in part, at certain defined redemption prices, plus any accrued and unpaid interest. If we exercise our option during the year ended December 31, 2018, the redemption price is 101.594% (expressed as a percentage of the principal amount), and if we exercise our option on or after January 1, 2019, the redemption price is 100.000%.
Unsecured borrowing arrangements consisted of the following as of December 31, 2017:
Outstanding Balance | Balance at Maturity | Maturity Date | |||||||
(In millions) | |||||||||
7.375% Term notes due in 2019 | $ | 97 | $ | 97 | 9/1/2019 | ||||
6.375% Term notes due in 2021 | 21 | 22 | 8/15/2021 | ||||||
Total | $ | 118 | $ | 119 | |||||
CONTRACTUAL OBLIGATIONS |
The following table summarizes our future contractual obligations as of December 31, 2017:
Less than 1 year | 1-3 years | 3-5 years | More than 5 years | Total | |||||||||||||||
(In millions) | |||||||||||||||||||
Warehouse facilities (1) | $ | 220 | $ | — | $ | — | $ | — | $ | 220 | |||||||||
Servicing advance facility (1) (2) | 32 | — | — | — | 32 | ||||||||||||||
Unsecured debt | — | 97 | 22 | — | 119 | ||||||||||||||
Interest expense on Unsecured debt | 9 | 10 | 1 | — | 20 | ||||||||||||||
Operating leases (3) | 13 | 19 | 16 | — | 48 | ||||||||||||||
Purchase commitments | 6 | 5 | — | — | 11 | ||||||||||||||
Mandatorily redeemable noncontrolling interest | 20 | — | — | — | 20 | ||||||||||||||
Loan repurchase obligations | 3 | — | — | — | 3 | ||||||||||||||
$ | 303 | $ | 131 | $ | 39 | $ | — | $ | 473 | ||||||||||
________________
(1) | The table above excludes future cash payments related to interest expense on our warehouse facilities and servicing advance facility which totaled $19 million for 2017. Interest is calculated on most of our debt obligations based on variable rates referenced to LIBOR. |
(2) | Maturities of the Servicing advance facility represent the contractual final repayment date which is March 15, 2018. |
(3) | Excludes $6 million of minimum sublease income due in the future under noncancelable subleases. |
For further information about our Mortgage warehouse and advance facilities and Unsecured debt, see “—Liquidity and Capital Resources—Debt” and Note 10, 'Debt and Borrowing Arrangements' in the accompanying Notes to Consolidated Financial Statements.
Purchase commitments include various commitments to purchase services from specific suppliers made by us in the ordinary course of our business, and the majority of our commitments relate to tax service expenses associated with managing our servicing portfolio and software expenses. For further information about our Operating lease and Purchase commitments, see Note 13, 'Commitments and Contingencies' in the accompanying Notes to Consolidated Financial Statements. We had no capital lease obligations as of December 31, 2017.
64
Mandatorily redeemable noncontrolling interest represents our unconditional obligation to purchase Realogy's membership interest in PHH Home Loans on or before March 19, 2018, subject to certain closing conditions. See "—Asset Sales and Exit Programs" for further information.
Loan repurchase obligations represent the unpaid principal amount of loans that have completed the repurchase request review process and the claims are pending final execution or payment. See Note 13, 'Commitments and Contingencies' in the accompanying Notes to Consolidated Financial Statements and “—Risk Management” for further information regarding our loan repurchase exposure and related reserves.
Other Obligations
Loan Origination Pipeline. As of December 31, 2017, we had commitments with agreed-upon rates or rate protection that we expect to result in closed mortgage loans of $192 million.
Commitments to sell loans generally have fixed expiration dates or other termination clauses and may require the payment of a fee. We may settle the forward delivery commitments on MBS or whole loans on a net basis including the posting of collateral; therefore, the commitments outstanding do not necessarily represent future cash obligations. Our $614 million (gross notional) of forward delivery commitments on MBS or whole loans as of December 31, 2017 generally will be settled within 90 days of the individual commitment date.
For further information about our commitments to fund or sell mortgage loans, see Note 5, 'Derivatives' in the accompanying Notes to Consolidated Financial Statements.
MSR Sales. As of December 31, 2017, we had commitments to sell capitalized MSRs with $6.5 billion of unpaid principal balance and fair value of $39 million, and there are $110 million servicing advance receivables that will be delivered under those commitments. These commitments are primarily related to the MSR sale agreement with New Residential.
In addition, as of December 31, 2017, we had commitments to sell MSRs through third-party flow sales related to $28 million of the unpaid principal balance of Mortgage loans held for sale and Interest rate lock commitments that are expected to result in closed loans. We also are contractually obligated to transfer $2 million of servicing value associated with certain originations, pursuant to the terms of our portfolio defense agreements.
For further information about our commitments to sell Mortgage servicing rights, see Note 4, 'Servicing Activities' and Note 16, 'Fair Value Measurements' in the accompanying Notes to Consolidated Financial Statements.
Unrecognized Income Tax Benefits. The future contractual obligations outlined above exclude an $11 million liability for income tax contingencies as of December 31, 2017 since we cannot predict with reasonable certainty the timing of the resolution of such contingencies and potential cash settlements to the respective taxing authorities, if any. For more information regarding our liability for income tax contingencies, see Note 12, 'Income Taxes' in the accompanying Notes to Consolidated Financial Statements.
Compensation Agreements. We have granted retention and other awards that obligate us to make future cash payments to the related employees, if they remain employed through specified vesting dates. If any employees are involuntarily terminated without cause prior to those dates, we owe the lump sum as soon as practicable.
The total amount of our compensation-related obligations not associated with our Exit cost liability is $6 million to be earned through the related service period, of which $4 million is accrued within Accounts payable and accrued expenses as of December 31, 2017.
Exit Liability Obligations. Total compensation-related obligations associated with our exit activities is $44 million which relate to severance, retention and cash-based incentive awards. As of December 31, 2017, $43 million is accrued in Exit cost liability in Accounts payable and accrued expenses for these obligations. In addition, we have $8 million of contract termination and other costs related to the PLS and Reorganization exit programs which is included in the Exit cost liability as of December 31, 2017.
65
OFF-BALANCE SHEET ARRANGEMENTS AND GUARANTEES |
In the ordinary course of business, we enter into numerous agreements that contain guarantees and indemnities whereby we indemnify another party for breaches of representations and warranties. Such guarantees or indemnifications are granted under various agreements, including those governing leases of real estate, access to credit facilities, use of derivatives and issuances of debt or equity securities. In addition, we utilize an uncommitted off-balance sheet mortgage gestation facility as a component of our financing strategy.
During 2017, we entered into assignments with LenderLive Network, LLC and Guaranteed Rate Affinity, LLC related to certain facility leases that were transferred in connection with transactions associated with our PLS business and Real Estate channel exits. Under the terms of the original facility leases, we remain jointly and severally obligated with LenderLive and GRA for performance under the lease agreements. As of December 31, 2017, the total amount of potential future lease payments under these guarantees was approximately $15 million; however, we do not believe any amount of losses under these guarantees is probable.
See “—Liquidity and Capital Resources—Debt—Warehouse facilities” above, and Note 13, 'Commitments and Contingencies' in the accompanying Notes to the Consolidated Financial Statements for additional information.
CRITICAL ACCOUNTING POLICIES AND ESTIMATES | ||||
Our significant accounting policies are described in Note 1, 'Summary of Significant Accounting Policies' and Note 13, 'Commitments and Contingencies' in the accompanying Notes to Consolidated Financial Statements. These accounting policies are integral in understanding our financial position and results of operations because we are required to make estimates and assumptions that may affect the value of our assets and liabilities and financial results. The accounting policies that we believe are critical due to the highly difficult, subjective and complex judgments and estimates relating to matters that are inherently uncertain include: (i) Fair value measurements; (ii) Mortgage servicing rights and related secured liability; (iii) Income taxes; (iv) Loan repurchase and indemnification liability; and (v) Litigation and regulatory accruals.
Additionally, events that are outside of our control cannot be predicted and, as such, they cannot be contemplated in evaluating such estimates and assumptions. If actual results differ from our judgments and estimates, it could have a material adverse effect on our business, financial position, results of operations and cash flows. We believe that the estimates and assumptions we used when preparing our financial statements were the most appropriate at that time, and we discuss our critical accounting policies and estimates with our Audit Committee of our Board of Directors on an ongoing basis.
Fair Value Measurements
We record certain assets and liabilities at fair value, and we have an established and documented a process for determining fair value measurements. In addition, we utilize fair value measurements in our review of the carrying value of long-lived assets and equity method investments for impairment, whenever events or changes in circumstances indicate that such carrying value may not be recoverable. We determine fair value based on quoted market prices, if available. If quoted prices are not available, fair value is estimated based upon other observable inputs and may include valuation techniques such as present value cash flow models, option-pricing models or other conventional valuation methods.
We use unobservable inputs when observable inputs are not available. These inputs are based upon our judgments and assumptions, which represent our assessment of the assumptions market participants would use in pricing the asset or liability, which may include: (i) information about current pricing for similar products; (ii) modeled assumptions based on internally-sourced data and characteristics of the specific instrument; and (iii) counterparty risk, credit quality and liquidity.
The use of different assumptions may have a material effect on the estimated fair value amounts recorded in our financial statements, and the actual amounts realized in the sale or settlement of these instruments may vary materially from the recorded amounts. See Note 16, 'Fair Value Measurements' in the accompanying Notes to Consolidated Financial Statements for further discussions of our measurements at fair value.
66
Assets. As of December 31, 2017, 41% of our Total assets were measured at fair value on a recurring basis and 35% of those assets were valued using primarily observable inputs and are comprised of the majority of our Mortgage loans held for sale. As of December 31, 2017, 65% of our assets measured at fair value on a recurring basis were valued using significant unobservable inputs and include:
• | Mortgage servicing rights. See "—Mortgage Servicing Rights" below. |
• | Certain non-conforming Mortgage loans held for sale, including Scratch and Dent (loans with origination flaws or performance issues) and second lien loans. We value these loans based upon a collateral-based valuation model, with consideration of market bid pricing. As the market for these loans is not liquid, we utilize assumptions in the valuation that reflect our best estimate of the current market, which may include spreads from collateral values in recent transactions. |
• | Interest rate lock commitments ("IRLCs"). As there is a lack of an observable market for trading IRLCs, fair value is based upon the estimated fair value of the underlying mortgage loan, adjusted for: (i) estimated costs to complete and originate the loan and (ii) an adjustment to reflect the estimated percentage of commitments that will result in a closed mortgage loan, which can vary based on the age of the underlying commitment and changes in mortgage interest rates. |
Liabilities. As of December 31, 2017, 33% of our Total liabilities were measured at fair value on a recurring basis, all of which were valued using significant unobservable inputs and primarily related to the Mortgage servicing rights secured liability. The fair value of MSRs secured liability is estimated based upon projections of expected future cash flows of the underlying MSR asset. The cash flow assumptions and prepayment assumptions used in the model are based on various factors, including portfolio characteristics, interest rates based on interest rate yield curves, implied volatility and other economic factors. See "—Mortgage Servicing Rights" below.
Mortgage Servicing Rights
The fair value of our mortgage servicing rights ("MSRs") is estimated based upon projections of expected future cash flows, including service fee income and costs to service the loans, actual and expected prepayment rates, portfolio characteristics, interest rates based on interest rate yield curves, implied volatility, servicing costs and other economic factors which are determined based on current market conditions. As of December 31, 2017, the fair value of the portion of MSRs that remain committed under bulk sale agreements includes calibration of the valuation model, considering the pricing associated with those agreements.
We use a third-party model as a basis to forecast prepayment rates at each monthly point for each interest rate path based around the implied forward interest rate, calculated using a probability weighted option adjusted spread ("OAS") model. The OAS model is used to generate and discount the expected future cash flows to value the MSR. Prepayment rates are based on historical observations of prepayment behavior in similar periods, comparing current mortgage rates to the mortgage interest rate in our servicing portfolio and incorporates loan characteristics (e.g., loan type and note rate) and factors such as recent prepayment experience, the relative sensitivity of our capitalized servicing portfolio to refinance if interest rates decline and estimated levels of home equity.
The evaluation of our MSRs is governed by a committee, which consists of key members of management, to approve our MSR valuation policies and ensure that the fair value of our MSRs is appropriate considering all available internal and external data. We validate assumptions used in estimating the fair value of our MSRs against a number of third-party sources, which may include peer surveys, MSR broker surveys, third-party valuations and other market-based sources. While our current valuation reflects our best estimate of servicing costs, future regulatory changes in servicing standards, as well as changes in individual state foreclosure legislation, may have an impact on our servicing cost assumption and our MSR valuation in future periods.
The key assumptions used in the valuations of MSRs include prepayment rates, discount rate and delinquency rates. If we experience a 10% adverse change in prepayment speeds, OAS and delinquency rates, the fair value of our owned MSRs would be reduced by $3 million, $2 million and $4 million, respectively. Changes in fair value based on a 10% variation in assumptions generally cannot be extrapolated because the relationship of the change in fair value may not be linear. Also, the effect of a variation in a particular assumption is calculated without changing any other assumption; in reality, changes in one assumption may result in changes in another, which may magnify or counteract the sensitivities. Further, this analysis does not assume any impact resulting from our intervention to mitigate these variations. These sensitivities are hypothetical and for illustrative purposes only and do not include the MSRs accounted for as a secured borrowing arrangement, in which any changes in fair value would be fully offset by the change in fair value of the MSR secured liability.
67
Income Taxes
We are subject to the income tax laws of the various jurisdictions in which we operate, including U.S. federal, state and local jurisdictions. These tax laws are complex and are subject to different interpretations by the taxpayer and the relevant government taxing authorities. When determining our current income tax expense, we must make judgments about the application of these inherently complex tax laws.
Deferred income taxes are determined using the balance sheet method. Recognition of deferred taxes is based upon estimates of future results and management's judgment; however, deferred tax assets are reduced by valuation allowances if it is more likely than not that some portion of the deferred tax asset will not be realized. We evaluate our deferred tax assets quarterly to determine if adjustments to our valuation allowance are required based on the consideration of all available evidence, using a "more likely than not" standard with respect to whether deferred tax assets will be realized. This evaluation considers, among other factors, our historical operating results, our expectations of future profitability, the duration of the applicable statutory carryforward periods and available tax planning strategies. The ultimate realization of our deferred tax assets depends primarily on our ability to generate future taxable income during the periods in which the related temporary differences in the financial basis and the tax basis of the assets become deductible. As of December 31, 2017, we recognized a full valuation allowance against our net deferred tax assets, driven by the impact of Federal tax reform, including the provisions that eliminate the net operating loss carryback.
Should a change in circumstances, including differences between our future operating results and estimates, lead to a change in our judgments about the realization of deferred tax assets in future years, we would adjust the valuation allowances in the period that the change in circumstances occurs, along with a charge or credit to income tax expense. Significant changes to our estimates and assumptions may result in an increase or decrease to our tax expense in a subsequent period.
Our interpretations of the complex tax laws in the jurisdictions in which we operate are subject to review and examination by the various governmental taxing authorities and disputes may arise over the respective tax positions. We record liabilities for income tax contingencies using a two-step process. We must first presume the tax position will be examined by the relevant taxing authority and determine whether it is "more likely than not" that the position will be sustained upon examination, based on its technical merits. Once an income tax position meets the "more likely than not" recognition threshold, it is then measured to determine the amount of the benefit to recognize in the financial statements.
Liabilities for income tax contingencies are reviewed periodically and are adjusted as events occur that affect our estimates, such as the availability of new information, subsequent transactions or events, the lapsing of applicable statutes of limitations, the conclusion of tax audits, the measurement of additional estimated liabilities based on current calculations (including interest and/or penalties), the identification of new income tax contingencies, the release of administrative tax guidance affecting our estimates of income tax liabilities or the rendering of relevant court decisions. The ultimate resolution of income tax contingency liabilities could have a significant impact on our effective income tax rate in a given financial statement period. Liabilities for income tax contingencies, including accrued interest and penalties, was $11 million as December 31, 2017.
Loan Repurchase and Indemnification Liability
Representations and warranties are provided to investors and insurers on a significant portion of loans sold and are also assumed on purchased mortgage servicing rights for loans that are owned by the Agencies or included in Agency-guaranteed securities. As a result, we may be required to repurchase the mortgage loan or indemnify the investor against loss in the event of a breach of representations and warranties. We have established a loan repurchase and indemnification liability for our estimate of exposure to losses related to our obligation to repurchase or indemnify investors for loans sold. The liability for probable losses includes estimates associated with: (i) losses for loans where a repurchase or indemnification obligation could exist from breaches of representation and warranties, (ii) losses for specific non-performing loans where we believe we will be required to indemnify the investor and (iii) losses for government loans that may not be reimbursed pursuant to mortgage insurance programs.
The key assumptions used in our estimate are impacted by a variety of factors, including actual defaults, estimated future defaults, the estimated probability we will receive a repurchase request, historical loss experience, our success rates in appealing repurchase requests and other economic conditions, including the political environment and oversight of the Agencies and related changes in Agency programs and guidelines, and the overall economic condition of borrowers and the U.S. economy. Changes to any one of these factors could significantly impact the estimate of our liability. We continue to evaluate our reserve based on the level and type of repurchase requests received, the defects identified and other relevant facts and circumstances. In order to monitor repurchase demand practices, we also maintain regular contact with the Agencies and with the private label clients for which we originate fee-based loans, and incorporate any new information into our reserve estimates as it becomes available.
68
Legal and Regulatory Contingencies
We are currently subject to various regulatory investigations, examinations and inquiries related to our mortgage origination and servicing practices. In addition, we are defendants in various legal proceedings, which include private and civil litigation. The measurement of our accruals for legal and regulatory contingencies is a critical accounting estimate because of the significant judgment involved in estimating the likelihood and range of potential liability involved, uncertainty related to the potential outcome of certain matters, coupled with the material impact on our results of operations, cash flows and financial position that could result from changes in our estimates or the ultimate resolution of these matters.
An accrual is established for pending or threatened litigation, claims or assessments when it is probable that a loss has been incurred, and the amount of such loss can be reasonably estimated. We recognize legal costs associated with loss contingencies as they are incurred. In light of the inherent uncertainties involved in litigation and other legal proceedings, it is not always possible to determine a reasonable estimate of the amount of a probable loss, and we may estimate a range of possible loss for consideration in these estimates. The estimates are based upon currently available information and involve significant judgment taking into account the varying stages and inherent uncertainties of such matters. Accordingly, our estimates may change from time to time, and such changes may be material to our consolidated results of operations. There can be no assurance that the ultimate resolution of such matters will not result in losses in excess of our recorded accruals, or in excess of our estimate of reasonably possible losses, and the ultimate resolution of any particular matter, or matters, may have a material adverse effect on our consolidated financial position, results of operations or cash flows.
RECENTLY ISSUED ACCOUNTING PRONOUNCEMENTS |
For information regarding recently issued accounting pronouncements and the expected impact on our financial statements, see Note 1, 'Summary of Significant Accounting Policies' in the accompanying Notes to Consolidated Financial Statements.
Item 7A. Quantitative and Qualitative Disclosures About Market Risk |
Interest Rate Risk |
Our principal market exposure is to interest rate risk, specifically long-term Treasury and mortgage interest rates due to their impact on mortgage-related assets and commitments. Additionally, our escrow earnings on our mortgage servicing rights are sensitive to changes in short-term interest rates such as LIBOR. We also are exposed to changes in short-term interest rates on certain variable rate borrowings including our mortgage warehouse debt. The valuation of our Mortgage servicing rights is based, in part, on the realization of the forward yield curve due to the impact that expected future interest rates have on our expected cash flows. We anticipate that such interest rates will remain our primary benchmark for market risk for the foreseeable future.
Sensitivity Analysis
We assess our market risk based on changes in interest rates utilizing a sensitivity analysis. The sensitivity analysis measures the potential impact on fair values based on hypothetical changes (increases and decreases) in interest rates. These sensitivities are hypothetical and presented for illustrative purposes only. Changes in fair value based on variations in assumptions generally cannot be extrapolated because the relationship of the change in fair value may not be linear.
We use a duration-based model in determining the impact of interest rate shifts on our debt portfolio, certain other interest-bearing liabilities and interest rate derivatives portfolios. The primary assumption used in these models is that an increase or decrease in the benchmark interest rate produces a parallel shift in the yield curve across all maturities.
We utilize a probability weighted option-adjusted spread model to determine the fair value of mortgage servicing rights and the impact of parallel interest rate shifts on mortgage servicing rights. The primary assumptions in this model are prepayment speeds, option-adjusted spread (discount rate) and weighted-average delinquency rates. However, this analysis ignores the impact of interest rate changes on certain material variables, such as the benefit or detriment on the value of future loan originations, non-parallel shifts in the spread relationships between mortgage-backed securities, swaps and Treasury rates and changes in primary and secondary mortgage market spreads. We rely on market sources in determining the impact of interest rate shifts for mortgage
69
loans, interest rate lock commitments, forward delivery commitments on mortgage-backed securities or whole loans and option contracts. In addition, for interest rate lock commitments, the borrower’s propensity to close their mortgage loans under the commitment is used as a primary assumption.
Our total market risk is influenced by a wide variety of factors including market volatility and the liquidity of the markets. There are certain limitations inherent in the sensitivity analysis presented, including the necessity to conduct the analysis based on a single point in time and the inability to include the complex market reactions that normally would arise from the market shifts modeled.
The following table summarizes the estimated change in the fair value of our Mortgage pipeline, Mortgage servicing rights and related derivatives and unsecured debt that are sensitive to interest rates as of December 31, 2017 given hypothetical instantaneous parallel shifts in the yield curve:
Change in Fair Value | |||||||||||||||||||||||
Down 100 bps | Down 50 bps | Down 25 bps | Up 25 bps | Up 50 bps | Up 100 bps | ||||||||||||||||||
(In millions) | |||||||||||||||||||||||
Mortgage pipeline | |||||||||||||||||||||||
Mortgage loans held for sale | $ | 7 | $ | 4 | $ | 2 | $ | (2 | ) | $ | (5 | ) | $ | (11 | ) | ||||||||
Interest rate lock commitments (1) | 3 | 2 | 1 | (2 | ) | (4 | ) | (9 | ) | ||||||||||||||
Forward delivery commitments (1) | (10 | ) | (6 | ) | (3 | ) | 4 | 9 | 20 | ||||||||||||||
Total Mortgage pipeline | — | — | — | — | — | — | |||||||||||||||||
MSRs and related secured liability | |||||||||||||||||||||||
Mortgage servicing rights owned (2) | (17 | ) | (8 | ) | (4 | ) | 3 | 7 | 12 | ||||||||||||||
Mortgage servicing rights secured asset (3) | (131 | ) | (63 | ) | (30 | ) | 28 | 53 | 94 | ||||||||||||||
MSRs secured liability (3) | 131 | 63 | 30 | (28 | ) | (53 | ) | (94 | ) | ||||||||||||||
Total MSRs and related secured liability | (17 | ) | (8 | ) | (4 | ) | 3 | 7 | 12 | ||||||||||||||
Unsecured term debt | (2 | ) | (1 | ) | (1 | ) | 1 | 1 | 2 | ||||||||||||||
Total, net | $ | (19 | ) | $ | (9 | ) | $ | (5 | ) | $ | 4 | $ | 8 | $ | 14 | ||||||||
________________
(1) | Included in Other assets or Other liabilities in the Consolidated Balance Sheets. |
(2) | We do not expect changes in interest rates to substantially impact the fair value of owned MSRs since the fair value of the portion of MSRs that remain committed under bulk sale agreements at December 31, 2017 includes calibration of the valuation model, considering the pricing associated with those agreements. |
(3) | During 2017, we sold MSRs to New Residential, which have been accounted for as a secured borrowing. Any changes in fair value are expected to fully offset between the MSRs secured asset and MSRs secured liability. |
70
Item 8. Financial Statements and Supplementary Data |
Index to the Consolidated Financial Statements
Page | ||||
Schedules: | ||||
71
REPORT OF INDEPENDENT REGISTERED PUBLIC ACCOUNTING FIRM
To the Board of Directors and Stockholders of PHH Corporation:
Opinion on the Financial Statements
We have audited the accompanying consolidated balance sheets of PHH Corporation and subsidiaries (the "Company") as of December 31, 2017 and 2016, the related consolidated statements of operations, comprehensive income, changes in equity, and cash flows, for each of the three years in the period ended December 31, 2017, and the related notes and the schedules listed in the Index at Item 8 (collectively referred to as the "financial statements"). In our opinion, the financial statements present fairly, in all material respects, the financial position of the Company as of December 31, 2017 and 2016, and the results of its operations and its cash flows for each of the three years in the period ended December 31, 2017, in conformity with accounting principles generally accepted in the United States of America.
We have also audited, in accordance with the standards of the Public Company Accounting Oversight Board (United States) (PCAOB), the Company's internal control over financial reporting as of December 31, 2017, based on criteria established in Internal Control - Integrated Framework (2013) issued by the Committee of Sponsoring Organizations of the Treadway Commission and our report dated March 1, 2018 expressed an unqualified opinion on the Company's internal control over financial reporting.
Basis for Opinion
These financial statements are the responsibility of the Company's management. Our responsibility is to express an opinion on the Company's financial statements based on our audits. We are a public accounting firm registered with the PCAOB and are required to be independent with respect to the Company in accordance with the U.S. federal securities laws and the applicable rules and regulations of the Securities and Exchange Commission and the PCAOB.
We conducted our audits in accordance with the standards of the PCAOB. Those standards require that we plan and perform the audit to obtain reasonable assurance about whether the financial statements are free of material misstatement, whether due to error or fraud. Our audits included performing procedures to assess the risks of material misstatement of the financial statements, whether due to error or fraud, and performing procedures that respond to those risks. Such procedures included examining, on a test basis, evidence regarding the amounts and disclosures in the financial statements. Our audits also included evaluating the accounting principles used and significant estimates made by management, as well as evaluating the overall presentation of the financial statements. We believe that our audits provide a reasonable basis for our opinion.
/s/ Deloitte & Touche LLP
Philadelphia, Pennsylvania
March 1, 2018
We have served as the Company's auditor since 1997.
72
PHH CORPORATION AND SUBSIDIARIES
CONSOLIDATED BALANCE SHEETS
(In millions, except share data)
December 31, | |||||||
2017 | 2016 | ||||||
ASSETS | |||||||
Cash and cash equivalents | $ | 542 | $ | 906 | |||
Restricted cash | 41 | 57 | |||||
Mortgage loans held for sale | 270 | 683 | |||||
Accounts receivable, net | 78 | 66 | |||||
Servicing advances, net | 356 | 628 | |||||
Mortgage servicing rights | 476 | 690 | |||||
Property and equipment, net | 22 | 36 | |||||
Other assets | 26 | 109 | |||||
Total assets (1) | $ | 1,811 | $ | 3,175 | |||
LIABILITIES | |||||||
Accounts payable and accrued expenses | $ | 141 | $ | 193 | |||
Subservicing advance liabilities | 232 | 290 | |||||
Mortgage servicing rights secured liability | 419 | — | |||||
Mortgage warehouse and advance facilities | 252 | 655 | |||||
Unsecured debt, net | 118 | 607 | |||||
Loan repurchase and indemnification liability | 29 | 49 | |||||
Mandatorily redeemable noncontrolling interest (Note 17) | 20 | — | |||||
Deferred taxes, net | — | 101 | |||||
Other liabilities | 47 | 157 | |||||
Total liabilities (1) | 1,258 | 2,052 | |||||
Commitments and contingencies (Note 13) | |||||||
Redeemable noncontrolling interest (Note 1 and Note 17) | — | 33 | |||||
EQUITY | |||||||
Preferred stock, $0.01 par value; 1,090,000 shares authorized; none issued or outstanding | — | — | |||||
Common stock, $0.01 par value; 273,910,000 shares authorized; 32,547,258 shares issued and outstanding at December 31, 2017; 53,599,433 shares issued and outstanding at December 31, 2016 | — | 1 | |||||
Additional paid-in capital | 565 | 885 | |||||
Retained earnings | (3 | ) | 214 | ||||
Accumulated other comprehensive loss (2) | (9 | ) | (10 | ) | |||
Total PHH Corporation stockholders’ equity | 553 | 1,090 | |||||
Total liabilities and equity | $ | 1,811 | $ | 3,175 | |||
See accompanying Notes to Consolidated Financial Statements.
Continued.
73
CONSOLIDATED BALANCE SHEETS-(Continued)
(In millions)
______________
(1) | The Consolidated Balance Sheets include assets of variable interest entities which can be used only to settle the obligations and liabilities of variable interest entities which creditors or beneficial interest holders do not have recourse to PHH Corporation and subsidiaries as follows: |
December 31, | |||||||
2017 | 2016 | ||||||
ASSETS | |||||||
Cash and cash equivalents | $ | 33 | $ | 67 | |||
Restricted cash | 13 | 24 | |||||
Mortgage loans held for sale | 60 | 350 | |||||
Accounts receivable, net | 1 | 9 | |||||
Servicing advances, net | 56 | 150 | |||||
Property and equipment, net | — | 1 | |||||
Other assets | 1 | 12 | |||||
Total assets | $ | 164 | $ | 613 | |||
LIABILITIES | |||||||
Accounts payable and accrued expenses | $ | 6 | $ | 11 | |||
Mortgage warehouse and advance facilities | 72 | 399 | |||||
Other liabilities | 5 | 5 | |||||
Total liabilities | $ | 83 | $ | 415 | |||
(2) | Includes amounts recorded related to the Company's defined benefit pension plan, net of income tax benefits of $6 million as of both December 31, 2017 and 2016. During the years ended December 31, 2017 and 2016, there were no amounts reclassified out of Accumulated other comprehensive loss. |
See accompanying Notes to Consolidated Financial Statements.
74
CONSOLIDATED STATEMENTS OF OPERATIONS
(In millions, except per share data)
Year Ended December 31, | |||||||||||
2017 | 2016 | 2015 | |||||||||
REVENUES | |||||||||||
Origination and other loan fees | $ | 136 | $ | 280 | $ | 284 | |||||
Gain on loans held for sale, net | 144 | 262 | 298 | ||||||||
Loan servicing income, net | 137 | 125 | 236 | ||||||||
Net interest expense | (36 | ) | (32 | ) | (46 | ) | |||||
Other income (loss) | 75 | (13 | ) | 18 | |||||||
Net revenues | 456 | 622 | 790 | ||||||||
EXPENSES | |||||||||||
Salaries and related expenses | 263 | 345 | 323 | ||||||||
Commissions | 44 | 64 | 79 | ||||||||
Loan origination expenses | 31 | 64 | 91 | ||||||||
Foreclosure and repossession expenses | 19 | 35 | 51 | ||||||||
Professional and third-party service fees | 120 | 156 | 171 | ||||||||
Technology equipment and software expenses | 35 | 42 | 37 | ||||||||
Occupancy and other office expenses | 33 | 47 | 50 | ||||||||
Depreciation and amortization | 14 | 16 | 18 | ||||||||
Exit and disposal costs | 62 | 41 | — | ||||||||
Other operating expenses | 108 | 116 | 183 | ||||||||
Total expenses | 729 | 926 | 1,003 | ||||||||
Loss before income taxes | (273 | ) | (304 | ) | (213 | ) | |||||
Income tax benefit | (79 | ) | (111 | ) | (82 | ) | |||||
Net loss | (194 | ) | (193 | ) | (131 | ) | |||||
Less: net income attributable to noncontrolling interest | 23 | 9 | 14 | ||||||||
Net loss attributable to PHH Corporation | $ | (217 | ) | $ | (202 | ) | $ | (145 | ) | ||
Basic and Diluted loss per share attributable to PHH Corporation | $ | (4.62 | ) | $ | (3.77 | ) | $ | (2.62 | ) | ||
See accompanying Notes to Consolidated Financial Statements.
75
CONSOLIDATED STATEMENTS OF COMPREHENSIVE INCOME
(In millions)
Year Ended December 31, | |||||||||||
2017 | 2016 | 2015 | |||||||||
Net loss | $ | (194 | ) | $ | (193 | ) | $ | (131 | ) | ||
Other comprehensive income, net of tax: | |||||||||||
Change in unfunded pension liability, net | 1 | — | 1 | ||||||||
Total other comprehensive income, net of tax | 1 | — | 1 | ||||||||
Total comprehensive loss | (193 | ) | (193 | ) | (130 | ) | |||||
Less: comprehensive income attributable to noncontrolling interest | 23 | 9 | 14 | ||||||||
Comprehensive loss attributable to PHH Corporation | $ | (216 | ) | $ | (202 | ) | $ | (144 | ) | ||
See accompanying Notes to Consolidated Financial Statements.
76
CONSOLIDATED STATEMENTS OF CHANGES IN EQUITY
(In millions, except share data)
PHH Corporation Stockholders’ Equity | ||||||||||||||||||||||||||||||||
Total Equity | Common Stock | Additional Paid-In Capital | Retained Earnings | Accumulated Other Comprehensive Income (Loss) | Noncontrolling Interest | Redeemable Noncontrolling Interest | ||||||||||||||||||||||||||
Shares | Amount | |||||||||||||||||||||||||||||||
Beginning Balance | $ | 1,571 | 51,143,723 | $ | 1 | $ | 989 | $ | 566 | $ | (11 | ) | $ | 26 | $ | — | ||||||||||||||||
Total comprehensive (loss) income | (144 | ) | — | — | — | (145 | ) | 1 | — | 14 | ||||||||||||||||||||||
Distributions to noncontrolling interest | — | — | — | — | — | — | — | (10 | ) | |||||||||||||||||||||||
Reclassification to Redeemable noncontrolling interest | (26 | ) | — | — | — | — | — | (26 | ) | 26 | ||||||||||||||||||||||
Adjustment to redemption value of noncontrolling interest (Note 17) | (2 | ) | — | — | (2 | ) | — | — | — | 2 | ||||||||||||||||||||||
Stock compensation expense | 9 | — | — | 9 | — | — | — | — | ||||||||||||||||||||||||
Stock issued under share-based payment plans | 2 | 204,126 | — | 2 | — | — | — | — | ||||||||||||||||||||||||
Repurchase and retirement of Common stock | (78 | ) | (6,415,519 | ) | (1 | ) | (72 | ) | (5 | ) | — | — | — | |||||||||||||||||||
Conversion of Convertible notes | (18 | ) | 10,075,653 | 1 | (19 | ) | — | — | — | — | ||||||||||||||||||||||
Recognition of deferred taxes related to Convertible notes | 2 | — | — | 2 | — | — | — | — | ||||||||||||||||||||||||
Balance at December 31, 2015 | $ | 1,316 | 55,007,983 | $ | 1 | $ | 909 | $ | 416 | $ | (10 | ) | $ | — | $ | 32 | ||||||||||||||||
Total comprehensive (loss) income | (202 | ) | — | — | — | (202 | ) | — | — | 9 | ||||||||||||||||||||||
Distributions to noncontrolling interest | — | — | — | — | — | — | — | (8 | ) | |||||||||||||||||||||||
Stock compensation expense | 8 | — | — | 8 | — | — | — | — | ||||||||||||||||||||||||
Stock issued under share-based payment plans (includes $9 benefit from excess tax shortfall) | (9 | ) | 100,222 | — | (9 | ) | — | — | — | — | ||||||||||||||||||||||
Repurchase and retirement of Common stock | (23 | ) | (1,508,772 | ) | — | (23 | ) | — | — | — | — | |||||||||||||||||||||
Balance at December 31, 2016 | $ | 1,090 | 53,599,433 | $ | 1 | $ | 885 | $ | 214 | $ | (10 | ) | $ | — | $ | 33 | ||||||||||||||||
Total comprehensive (loss) income | (216 | ) | — | — | — | (217 | ) | 1 | — | 23 | ||||||||||||||||||||||
Distributions to noncontrolling interest | — | — | — | — | — | — | — | (60 | ) | |||||||||||||||||||||||
Adjustment to redemption value of noncontrolling interest (Note 17) | (24 | ) | — | — | (24 | ) | — | — | — | — | 24 | |||||||||||||||||||||
Reclassification to Mandatorily redeemable noncontrolling interest | — | — | — | — | — | — | — | (20 | ) | |||||||||||||||||||||||
Stock compensation expense | 9 | — | — | 9 | — | — | — | — | ||||||||||||||||||||||||
Reclassification of stock awards | (4 | ) | — | — | (4 | ) | — | — | — | — | ||||||||||||||||||||||
Stock issued under share-based payment plans | (1 | ) | 161,253 | — | (1 | ) | — | — | — | — | ||||||||||||||||||||||
Repurchase and retirement of Common stock | (301 | ) | (21,213,428 | ) | (1 | ) | (300 | ) | — | — | — | — | ||||||||||||||||||||
Balance at December 31, 2017 | $ | 553 | 32,547,258 | $ | — | $ | 565 | $ | (3 | ) | $ | (9 | ) | $ | — | $ | — | |||||||||||||||
See accompanying Notes to Consolidated Financial Statements.
77
CONSOLIDATED STATEMENTS OF CASH FLOWS
(In millions)
Year Ended December 31, | |||||||||||
2017 | 2016 | 2015 | |||||||||
Cash flows from operating activities: | |||||||||||
Net loss | $ | (194 | ) | $ | (193 | ) | $ | (131 | ) | ||
Adjustments to reconcile Net loss to net cash provided by operating activities: | |||||||||||
Capitalization of originated mortgage servicing rights | (36 | ) | (60 | ) | (101 | ) | |||||
Change in fair value of mortgage servicing rights and related derivatives | 119 | 228 | 158 | ||||||||
Change in fair value of mortgage servicing rights secured liability | (48 | ) | — | — | |||||||
Loss on early extinguishment of debt | 34 | — | 30 | ||||||||
Gain on PHH Home Loans asset sales | (70 | ) | — | — | |||||||
Origination of mortgage loans held for sale | (6,806 | ) | (10,513 | ) | (13,512 | ) | |||||
Proceeds on sale of and payments from mortgage loans held for sale | 7,478 | 10,838 | 13,965 | ||||||||
Net gain on interest rate lock commitments, mortgage loans held for sale and related derivatives | (226 | ) | (266 | ) | (297 | ) | |||||
Depreciation and amortization | 14 | 16 | 18 | ||||||||
Deferred income tax benefit | (101 | ) | (91 | ) | (70 | ) | |||||
Asset impairments | 3 | 38 | — | ||||||||
Other adjustments and changes in other assets and liabilities, net | 136 | 77 | 62 | ||||||||
Net cash provided by operating activities | 303 | 74 | 122 | ||||||||
Cash flows from investing activities: | |||||||||||
Net cash (paid) received on derivatives related to mortgage servicing rights | (45 | ) | 60 | 35 | |||||||
Proceeds on sale of mortgage servicing rights | 127 | 12 | 47 | ||||||||
Proceeds on sale of servicing advances | 31 | — | — | ||||||||
Proceeds from PHH Home Loans asset sales | 70 | — | — | ||||||||
Purchases of property and equipment | (1 | ) | (17 | ) | (31 | ) | |||||
Decrease (increase) in restricted cash | 16 | (10 | ) | 9 | |||||||
Other, net | (1 | ) | 5 | 2 | |||||||
Net cash provided by investing activities | 197 | 50 | 62 | ||||||||
Cash flows from financing activities: | |||||||||||
Proceeds from secured borrowings | 9,456 | 12,306 | 17,213 | ||||||||
Principal payments on secured borrowings | (9,858 | ) | (12,394 | ) | (17,378 | ) | |||||
Proceeds from mortgage servicing rights secured liability | 426 | — | — | ||||||||
Principal payments on unsecured borrowings | (496 | ) | — | (245 | ) | ||||||
Cash tender premiums for debt extinguishment | (28 | ) | — | (30 | ) | ||||||
Issuances of Common stock | — | — | 2 | ||||||||
Repurchase of Common stock | (301 | ) | (23 | ) | (77 | ) | |||||
Cash paid for debt issuance costs | (2 | ) | (4 | ) | (7 | ) | |||||
Distributions to noncontrolling interest | (60 | ) | (8 | ) | (10 | ) | |||||
Other, net | (1 | ) | (1 | ) | (5 | ) | |||||
Net cash used in financing activities | (864 | ) | (124 | ) | (537 | ) | |||||
Net decrease in Cash and cash equivalents | $ | (364 | ) | $ | — | $ | (353 | ) | |||
Cash and cash equivalents at beginning of period | 906 | 906 | 1,259 | ||||||||
Cash and cash equivalents at end of period | $ | 542 | $ | 906 | $ | 906 | |||||
Supplemental Disclosure of Cash Flows Information: | |||||||||||
Cash interest payments | $ | 45 | $ | 66 | $ | 72 | |||||
Income tax payments (refunds), net | 3 | (29 | ) | 9 | |||||||
See accompanying Notes to Consolidated Financial Statements.
78
NOTES TO CONSOLIDATED FINANCIAL STATEMENTS
1. Summary of Significant Accounting Policies |
Nature of Operations
PHH Corporation and subsidiaries (collectively, “PHH” or the “Company”) operates in two business segments: Mortgage Production, which provides mortgage loan origination services and sells mortgage loans, and Mortgage Servicing, which performs servicing activities for originated and purchased loans, and acts as a subservicer for certain clients that own the underlying mortgage servicing rights. In February 2018, the Company announced a proposed Merger with Ocwen Financial Corporation. Refer to Note 20, 'Subsequent Events' for additional information.
In February 2017, the Company announced its intention to operate as a smaller business that is focused solely on subservicing and portfolio retention services. Refer to Note 2, 'Exit Costs' for additional information.
To enact that strategic shift for the Mortgage Servicing segment, during 2017, the Company completed the sale of a substantial portion of its capitalized Mortgage servicing rights ("MSRs") as discussed in Note 4, 'Servicing Activities'. The Company's Mortgage Servicing segment is now focused on subservicing activities, and has exposure to concentration risk and client retention risk with respect to its subservicing agreements. As of December 31, 2017, 58% and 19% of the subservicing portfolio (by units) related to significant client relationships with New Residential Mortgage, LLC ("New Residential") and Pingora Loan Servicing, LLC, respectively. A substantial portion of the Company's subservicing agreements allow the owners of the servicing to terminate the subservicing agreement without cause with respect to some or all of the subserviced loans and, in some cases, without payment of any termination fee. The Company expects to transfer approximately 115,000, or 18%, subservicing units off of our platform between May 2018 and April 2019, based upon receipt in February 2018 of formal notices and verbal indications from two of our largest subservicing clients. Approximately 65,000 of these units are subject to a portfolio defense agreement and will no longer be solicitable upon transfer to a new servicer.
The Company's future mortgage loan originations of the Company's Mortgage Production segment will be sourced solely through portfolio retention services, which is limited to a small group of key clients primarily associated with our significant subservicing client relationships, and the portfolio defense agreements cease upon the termination of the related client subservicing relationship, or as units transfer out of our subservicing portfolio to a new servicer. During the year ended December 31, 2017, total originations from portfolio retention represented 6% of the Company's total mortgage loan originations. In November 2016, the Company announced its intentions to exit the private label services ("PLS") business, and during February 2017, announced it entered into agreements to sell certain assets of PHH Home Loans and its subsidiaries, including its mortgage origination and processing centers. During the year ended December 31, 2017, the PLS business and Real Estate channel represented 66% and 28% of the Company's total mortgage loan originations, respectively. During 2017, the Company executed on its strategy towards exiting the PLS origination business, including negotiating the contractual exits of its client agreements. In addition, the Company took steps that will result in the exit of its Real Estate channel through the sale of certain assets of PHH Home Loans and its subsidiaries that was completed in December 2017. Refer to Note 17, 'Variable Interest Entities' for additional information. As of December 31, 2017, both the PLS business and Real Estate channel are winding down their operations, and will be reported as discontinued operations during 2018 when run-off activity is substantially complete.
Basis of Presentation
The Consolidated Financial Statements include the accounts and transactions of PHH and its subsidiaries, as well as entities in which the Company directly or indirectly has a controlling interest and variable interest entities of which the Company is the primary beneficiary. PHH Home Loans, LLC and its subsidiaries ("PHH Home Loans") are consolidated within the Consolidated Financial Statements and the ownership interest of Realogy Services Venture Partner LLC, a subsidiary of Realogy Holdings Corp. ("Realogy") is presented as a noncontrolling interest. As of December 31, 2017, Realogy's ownership interests are classified as a liability and presented within Mandatorily redeemable noncontrolling interest in the Consolidated Balance Sheets, and, as of December 31, 2016, classified as Mezzanine equity and presented within Redeemable noncontrolling interest. Refer to Note 17, 'Variable Interest Entities' for additional information on the classification differences of Realogy's ownership interest in PHH Home Loans between periods. Intercompany balances and transactions have been eliminated from the Consolidated Financial Statements. Unless otherwise noted, and except for share and per share data, dollar amounts presented within these Notes to Consolidated Financial Statements are in millions.
During the third quarter of 2017, the Company identified an error in the balance sheet presentation and measurement of Redeemable noncontrolling interests. Realogy’s ownership interests in PHH Home Loans have previously been reported as a Noncontrolling interest and presented as a component of Total equity; however, the Company has determined the balance should have been
79
presented as a Redeemable noncontrolling interest within Mezzanine equity for periods between February 1, 2015 and September 30, 2017. This presentation reflects Realogy’s right, beginning on February 1, 2015, to require that the Company purchase all of Realogy’s interest in PHH Home Loans upon two years notice at fair value, as outlined in the PHH Home Loans Operating Agreement. In addition, since the redemption value of the Redeemable noncontrolling interest exceeded the historical carrying amount, the correction also includes an adjustment to Additional paid-in capital to re-measure the Redeemable noncontrolling interest at its redemption value. While the Redeemable noncontrolling interest is adjusted to the redemption value at the end of each reporting period, the Company continued to allocate Realogy its portion of income or loss and distributions for each period.
The Company has evaluated the materiality of this error on its prior period financial statements from a quantitative and qualitative perspective. Management has concluded that the error was not material to any prior annual or interim period or the trend of financial results; therefore, amendments to previously filed reports are not required. The Company has corrected the error for all prior periods presented by revising the Consolidated Financial Statements appearing herein. Periods not presented herein will be revised, as applicable, in future filings. The impact of this revision to the Consolidated Balance Sheets and Consolidated Statements of Changes in Equity appearing herein was a reduction to Total equity of $32 million and $33 million as of December 31, 2015 and December 31, 2016, respectively, with an offsetting increase to amounts presented as a Redeemable noncontrolling interest within Mezzanine equity. The reduction to Total equity included a decrease to amounts reported as Additional paid-in capital of $2 million and $2 million as of December 31, 2015 and December 31, 2016, respectively. There was no effect to reported totals for assets, liabilities, cash flows or net loss. Refer to Note 17, 'Variable Interest Entities' for further information.
Use of Estimates
The Consolidated Financial Statements have been prepared in conformity with accounting principles generally accepted in the United States (GAAP) and pursuant to the rules and regulations of the Securities and Exchange Commission. The preparation of financial statements in conformity with GAAP requires management to make estimates and assumptions that affect the reported amounts of assets and liabilities, the disclosure of contingent liabilities at the date of the financial statements and the reported amounts of revenues and expenses during the reporting period. These estimates and assumptions include, but are not limited to, those related to the valuation of mortgage servicing rights, mortgage loans held for sale and other financial instruments, the estimation of liabilities for commitments and contingencies, mortgage loan repurchases and indemnifications and the determination of certain income tax assets and liabilities and associated valuation allowances. Actual results could differ from those estimates.
Acquisition
Speedy Title & Appraisal Review Services, LLC. On December 31, 2017, the Company acquired an additional 50.1% interest in Speedy Title & Appraisal Review Services, LLC (“STARS”), increasing its ownership interest from 49.9% to 100%. This acquisition was performed pursuant to the terms of the Limited Liability Agreement, as amended, between the Company and CoreLogic Holdings II, Inc, in order to effect the wind-down of STARS in connection with the exit of the private label services business, and for the Company to absorb the remaining operations of STARS in support of its servicing platform. This transaction is accounted for as a business combination achieved in stages. Prior to the acquisition, STARS was operated as a joint venture and accounted for as an equity method investment within Other assets in our Consolidated Balance Sheets.
As of December 31, 2017, the provisional estimate of fair value of our equity interest in STARS immediately before the acquisition was $6 million. The fair value of our previously held equity interest was measured using the assumed liquidation value of their balance sheets, and there was no adjustment for the remeasurement of the investment immediately prior to the acquisition. Upon acquisition at December 31, 2017, the Company recorded identifiable assets and liabilities consisting of $14 million of cash and $7 million of Accounts payable and accrued liabilities within the Consolidated Balance Sheets, and a $1 million pre-tax gain was recognized within Other income in the Consolidated Statements of Operations. The fair value estimates related to this acquisition represent the Company's best estimate of fair value and are expected to be finalized over a period of up to six months from the acquisition date.
The following table presents the revenue and earnings of the combined entity for the year ended December 31, 2017, as though the acquisition had occurred as of January 1, 2017:
Year Ended December 31, 2017 | |||||||||||
As Reported | Adjustment | Pro-forma results | |||||||||
(In millions) | |||||||||||
Net Revenues | $ | 456 | 1 | $ | 457 | ||||||
Loss before income taxes | (273 | ) | — | (273 | ) | ||||||
80
Accounting Pronouncements Adopted During the Period
Derivatives and Hedging. In March 2016, the FASB issued ASU 2016-06, “Contingent Put and Call Options in Debt Instruments.” This update clarified that in assessing whether an embedded contingent put or call option is clearly and closely related to the debt host, an entity is only required to perform a specific four-step decision sequence and is no longer required to assess whether the contingency for exercising the option is indexed to interest rate or credit risk. The Company adopted this update on January 1, 2017 using a modified retrospective approach, and there was no impact to the financial statements or disclosures.
Share-based Payments. In March 2016, the FASB issued ASU 2016-09, “Improvements to Employee Share-Based Payment Accounting." This update simplified several aspects of the accounting for share-based payment transactions, including accounting for income taxes, the classification of awards as either equity or liabilities and the classification of excess tax benefits and payments for tax withholdings on the statement of cash flows. The Company adopted this update on January 1, 2017 using either a prospective, modified retrospective or retrospective approach, depending on the area of change with the more significant provisions described below:
• | Accounting for income taxes. The Company recognized all excess tax benefits and tax deficiencies as income tax expense or benefit in the statement of income and applied this provision prospectively. The tax effects were treated as discrete items to calculate the effective tax rate and resulted in $3 million of income tax expense during the year ended December 31, 2017. |
• | Forfeiture rates. The Company elected to account for forfeitures as they occur and applied this provision using a modified retrospective approach. The impact to opening retained earnings was not significant. |
• | Statement of Cash Flows. On a retrospective basis, the Company classified cash paid by an employer when directly withholding shares for tax withholding purposes as a financing activity which totaled $1 million during the year ended December 31, 2017. The amount of tax withholding for both the years ended December 31, 2016 and 2015 was $1 million. In addition, on a prospective basis, the Company will classify excess tax benefits as an operating activity which did not have an impact to the statement of cash flows. |
Consolidation. In October 2016, the FASB issued ASU 2016-17, "Interests Held through Related Parties That Are under Common Control." This update required an entity to include indirect interest held through related parties that are under common control on a proportionate basis when evaluating if a reporting entity is the primary beneficiary of a variable interest entity. The Company adopted this update on January 1, 2017 using a retrospective approach. This adoption did not change any of the Company's consolidation conclusions, and there was no impact to the financial statements or disclosures.
Recently Issued Accounting Pronouncements Not Yet Adopted
Effective for the First Quarter of 2018
Revenue Recognition. In May 2014, the FASB issued ASU 2014-9, “Revenue from Contracts with Customers.” The core principle requires a company to recognize revenue when it transfers promised goods or services to customers in an amount that reflects consideration to which the company expects to be entitled in exchange for those goods or services. The FASB has issued several amendments to provide additional clarification and implementation instructions relating to (i) principal versus agent considerations, (ii) identifying performance obligations and licensing, (iii) narrow-scope improvements and practical expedients and (iv) technical corrections and improvements. In addition, these updates enhance the disclosure requirements around revenue recognition and related cash flows. These updates are to be applied retrospectively to all prior periods presented or through a cumulative adjustment in the year of adoption, and are effective for interim and annual periods beginning after December 15, 2017 with early adoption permitted.
The Company has reviewed the scope of the guidance and determined that a majority of the Company's revenue streams associated with origination and servicing activities are not within the scope of the standard because the standard does not apply to revenue on contracts accounted for under ASC 860, "Transfers and Servicing of Financial Assets" or ASC 825, "Financial Instruments". The Company has identified select revenue streams that are within scope of the revenue standard, including origination assistance fees associated with fee-based closings in our private label channel, and certain ancillary fees associated with subservicing contracts such as boarding and deboarding fees. For the year end December 31, 2017, the total revenue associated with in-scope revenue streams was approximately $75 million, significantly all of which relates to revenue associated with the private label channel that will not be a recurring revenue stream after we complete the exit of this business in the first quarter of 2018. In addition, the in-
81
scope revenue streams include amounts associated with certain contracts that are substantially complete as of December 31, 2017, and therefore will not have an impact on the adoption.
While there may be some impact on revenue recognition, at this time, the Company currently does not expect the adoption of this guidance to have a material impact on the consolidated financial statements or result in a significant transition adjustment upon adoption; however, the Company continues to evaluate other potential effects this guidance may have including, changes in footnote requirements and the impact to internal controls. The Company will adopt this standard using a modified retrospective approach in the first quarter of 2018 with a cumulative effect adjustment to retained earnings.
Share-based payments. In May 2017, the FASB issued ASU 2017-09, "Scope of Modification Accounting." This update clarifies when to account for a change to the terms or conditions of a share-based payment award as a modification. Under the new guidance, modification accounting is required only if the fair value, the vesting conditions, or the classification of the award (as equity or liability) changes as a result of the change in terms or conditions. This update is effective for the first interim and annual periods beginning after December 15, 2017, with early adoption permitted. At adoption, this update will be applied prospectively. The Company does not expect the adoption of this update to have a significant impact on its financial statements.
Retirement Benefits. In March 2017, the FASB issued ASU 2017-07, "Improving the Presentation of Net Periodic Pension Cost and Net Periodic Postretirement Benefit Cost." This update changes the income statement presentation of defined benefit plan expense by requiring the service cost component to be presented in the same line item as other compensation costs and all other components (including interest cost, amortization of prior service cost, settlements, etc.) to be presented separately from the service cost component. This update is effective for the first interim and annual periods beginning after December 15, 2017, with early adoption permitted. At adoption, this update will be applied retrospectively. The Company's defined benefit pension plan and the other post-employment benefits plan are frozen, wherein the plans only accrue additional benefits for a very limited number of employees. As a result, the Company does not expect the adoption of this update to have a significant impact on its financial statements.
Other Income. In February 2017, the FASB issued ASU 2017-05, "Clarifying the Scope of Asset Derecognition Guidance and Accounting for Partial Sales of Nonfinancial Assets." This update defines what constitutes an “in substance nonfinancial asset”, requires that all entities account for the derecognition of a business in accordance with ASC 810 and clarifies that an entity should allocate consideration to each distinct asset by applying the guidance in ASC 606 on allocating the transaction price to performance obligations. This update may be applied retrospectively to all prior periods presented or through a cumulative adjustment in the year of adoption, and is effective for interim and annual periods beginning after December 15, 2017. The Company has determined the scope of this update includes the sale of real estate owned, and the Company is continuing to evaluate the impact of adopting this guidance.
Business Combinations. In January 2017, the FASB issued ASU 2017-01, "Clarifying the Definition of a Business." This update clarifies the definition of a business with the objective of adding guidance to assist entities with evaluating whether transactions should be accounted for as acquisitions (or disposals) of assets or businesses. The definition of a business affects many areas of accounting including acquisitions, disposals, goodwill and consolidation. This update is effective for the first interim and annual periods beginning after December 15, 2017, with early adoption permitted. At adoption, this update will be applied prospectively. The Company does not expect the adoption of this update to have a significant impact on its financial statements since it only impacts future transactions and whether or not they meet the definition of a business.
Statement of Cash Flows. In August 2016, the FASB issued ASU 2016-15, “Classification of Certain Cash Receipts and Cash Payments." This update addresses a number of specific cash flow issues and is intended to reduce diversity in practice in how entities present and classify certain cash receipts and cash payments in the statement of cash flows. This update is effective for the first interim and annual periods beginning after December 15, 2017, with early adoption permitted. At adoption, this update will be applied retrospectively. For issues that are impracticable to apply retrospectively, the amendments may be applied prospectively from the earliest date practicable. The Company does not expect the adoption of this update to have a significant impact on its financial statements.
In November 2016, the FASB issued ASU 2016-18, "Restricted Cash." This update requires restricted cash to be included in the beginning and end-of-period total amounts shown on the statement of cash flows, and also requires certain disclosures for significant balances of restricted cash. This update is effective for the first interim and annual periods beginning after December 15, 2017, with early adoption permitted. At adoption, this update will be applied retrospectively. The adoption of this update will require changes to prior period amounts; however, the Company does not expect the adoption to have a significant impact on its financial statements or disclosures.
82
Financial Instruments. In January 2016, the FASB issued ASU 2016-01, “Recognition and Measurement of Financial Assets and Financial Liabilities.” This update revises an entity's accounting related to the classification and measurement of investments in equity securities (except those accounted for under the equity method of accounting or those that result in consolidation of the investee), changes the presentation of certain fair value changes relating to instrument specific credit risk for financial liabilities and amends certain disclosure requirements associated with the fair value of financial instruments. This update is effective for the first interim and annual periods beginning after December 15, 2017 with early adoption permitted for certain provisions of the update. The Company does not expect the adoption of this update to have a significant impact on its financial statements or disclosures.
Effective for the First Quarter of 2019
Leases. In February 2016, the FASB issued ASU 2016-02, “Leases (Topic 842).” This update revises an entity’s accounting for operating leases by a lessee, among other changes, and requires a lessee to recognize a liability to make lease payments and an asset representing its right to use the underlying asset for the lease term in the statement of financial position. The distinction between finance and operating leases has not changed, and the update does not significantly change the effect of finance and operating leases on the statement of comprehensive income and the statement of cash flows. Additionally, this update requires both qualitative and specific quantitative disclosures. This update is effective for the first interim and annual periods beginning after December 15, 2018, with early adoption permitted. At adoption, this update will be applied using a modified retrospective approach.
While the Company is currently evaluating the effect that this guidance will have on its financial statements, it will result in the recognition of certain operating leases as right-of-use assets and lease liabilities in the Consolidated Balance Sheets. The Company’s current minimum commitments under noncancelable operating leases are described in Note 13, 'Commitments and Contingencies'.
Comprehensive Income. In February 2018, the FASB issued ASU 2018-02, "Reclassification of Certain Tax Effects from Accumulated Other Comprehensive Income." This update allows a reclassification from accumulated other comprehensive income to retained earnings for stranded tax effects resulting from the Tax Cuts and Jobs Act ("Tax Act"). This update is effective for the first interim and annual periods beginning after December 15, 2018, with early adoption permitted. At adoption, this update will be applied in the period of adoption or retrospectively to each period in which the effect of the change in the U.S. federate corporate income tax rate in the Tax Act is recognized. The Company is currently evaluating the impact of adopting this new standard.
Effective for the First Quarter of 2020
Financial Instruments. In June 2016, the FASB issued ASU 2016-13, "Measurement of Credit Losses on Financial Instruments." The amendments in this update replace the incurred loss impairment methodology in current GAAP with a methodology that reflects expected credit losses and requires consideration of a broader range of reasonable and supportable information to inform credit loss estimates. This standard is applicable to financial instruments not accounted for at fair value, including but not limited to, trade receivables and off-balance sheet credit exposures. This update is effective for the first interim and annual periods beginning after December 15, 2019, with early adoption permitted for fiscal years beginning after December 15, 2018. At adoption, this update will be applied using a modified retrospective approach. The Company is currently evaluating the impact of adopting this new standard.
Revenue Recognition
Mortgage Production. Mortgage Production includes the origination and sale of residential mortgage loans, which are originated through various channels, including relationships with financial institutions, real estate brokerage firms, and corporate clients. Revenues from Mortgage Production include:
• | Origination and other loan fees. Origination and other loan fees consist of fee income earned on all loan originations, including loans closed to be sold and fee-based closings. Fee income consists of amounts earned related to application and underwriting fees, fees on canceled loans and amounts earned from financial institutions related to brokered loan fees and related to origination assistance fees resulting from private label mortgage outsourcing activities. Fees associated with the origination and acquisition of mortgage loans are recognized as earned. |
83
• | Gain on loans held for sale. Gain on loans held for sale, net includes the realized and unrealized gains and losses on sales of mortgage loans, as well as the changes in fair value of all loan-related derivatives, including interest rate lock commitments and freestanding loan-related derivatives. |
• | Interest income. Interest income is recognized on loans held for sale for the period from loan funding to sale, which is typically within 30 days. Loans are placed on non-accrual status when any portion of the principal or interest is 90 days past due or earlier if factors indicate that the ultimate collectability of the principal or interest is not probable. Interest received from loans on non-accrual status is recorded as income when collected. Loans return to accrual status when the principal and interest become current and it is probable that the amounts are fully collectible. |
Mortgage Servicing. Mortgage Servicing involves the servicing of residential mortgage loans on behalf of an investor. Revenues from Mortgage Servicing include:
• | Loan servicing income—Owned Capitalized servicing portfolio. Loan servicing income from the capitalized servicing portfolio represents recurring servicing and other ancillary fees earned for servicing mortgage loans owned by investors. Servicing fees received for servicing mortgage loans owned by investors are based on a stipulated percentage of the outstanding monthly principal balance on such loans, or the difference between the weighted-average yield received on the mortgage loans and the amount paid to the investor, less guaranty fees and interest on curtailments. Loan servicing income is receivable only out of interest collected from mortgagors and is recorded as income when collected. Late charges and other miscellaneous fees collected from mortgagors are also recorded as income when collected. |
• | Loan servicing income—Subserviced portfolio. Loan servicing income related to the subserviced portfolio includes fee income related to loans that are subserviced for clients that own the underlying servicing rights. Contractual subservicing fees are generally based on a stated amount per loan and vary depending on the delinquency status of the loan and the terms of each subservicing agreement. Fees related to the subserviced portfolio are accrued in the period the services are performed. In addition, certain contracts allow for the Company to receive Late charges and other miscellaneous fees collected from mortgagors which are recorded as income when collected. |
• | Interest income. The Company has a fiduciary responsibility for servicing accounts related to customer escrow funds and custodial funds due to investors aggregating $2.3 billion and $3.4 billion as of December 31, 2017 and 2016, respectively. These funds are maintained in segregated bank accounts, and these amounts are not included in the assets and liabilities presented in the Consolidated Balance Sheets. The Company receives certain benefits from these deposits, as allowable under federal and state laws and regulations, or as agreed to under certain subservicing agreements. Interest income is recorded as earned and included in the Consolidated Statements of Operations within Net interest expense. |
Sales of Financial Assets
Originated mortgage loans are principally sold directly to, or pursuant to programs sponsored by, government-sponsored entities and other investors. Additionally, the Company may enter into certain transactions to sell certain MSRs.
Each type of loan sale agreement is evaluated for sales treatment through a review that includes both an accounting and a legal analysis to determine whether or not the transferred assets have been isolated from the transferor, the extent of the continuing involvement and the existence of any protection provisions. Each MSR sale agreement is evaluated for sales treatment through a review that includes an analysis of the approvals required by the investor and the purchaser, as well as a review of any seller financing or interim servicing provisions. MSR sales are further evaluated to determine that both title to the MSRs and substantially all risks and rewards have been transferred to the purchaser prior to recognizing a transfer of MSRs as a sale. During 2017, the Company completed multiple sales of MSRs to New Residential and determined that New Residential did not acquire all ownership rewards since the terms of the subservicing contract limit New Residential’s ability to terminate the contract within the first three years. As a result, while there was a legal true sale of the MSRs from the Company to New Residential, the Company accounted for such sale of servicing rights as a secured borrowing.
To the extent the transfer of loan or MSR assets qualifies as a sale, the asset is derecognized and the gain or loss is recorded on the sale date. In the event the transfer of assets does not qualify as a sale, the transfer would be treated as a secured borrowing. For MSR sale agreements where the Company has continuing involvement through an ongoing subservicing arrangement, to the extent the transfer of MSRs qualifies as a sale, any loss is recorded on the sale date and any gain amount is recognized over the life of the subservicing agreement.
84
Income Taxes
Current tax expense represents the amount of taxes currently payable to or receivable from a taxing authority plus amounts accrued for income tax contingencies (including tax, penalty and interest). Deferred tax expense generally represents the net change in the deferred tax asset or liability balance during the year plus any change in the valuation allowance, excluding any changes in amounts recorded in Additional paid-in capital or Accumulated other comprehensive income (loss) in the Consolidated Balance Sheets.
Deferred income taxes are determined using the balance sheet method. This method requires that income taxes reflect the expected future tax consequences of temporary differences between the carrying amounts of assets or liabilities for book and tax purposes using the current enacted tax rates. Deferred tax assets and liabilities are regularly reviewed to assess their potential realization and to establish a valuation allowance when it is “more likely than not” that some portion will not be realized.
The Company is subject to the income tax laws of the various jurisdictions in which it operates, including U.S. federal, state and local jurisdictions. A consolidated federal income tax return is filed. Depending upon the jurisdiction, the Company files consolidated or separate legal entity state income tax returns.
Cash and Cash Equivalents
Cash and cash equivalents include marketable securities with original maturities of three months or less.
Restricted Cash
Restricted cash includes amounts specifically designated to repay debt, provide additional collateral to support certain obligations with Fannie Mae, to provide over-collateralization within warehouse facilities and the servicing advance facility, to support letters of credit, and to collect and hold for use in pending mortgage closings.
Mortgage Loans Held for Sale
Mortgage loans held for sale represent loans originated or purchased and held until sold to secondary market investors. Mortgage loans are typically warehoused for a period after origination or purchase before sale into the secondary market. Servicing rights may be retained upon sale of mortgage loans in the secondary market. Mortgage loans held for sale are measured at fair value on a recurring basis and are recognized in Gain on loans held for sale, net in the Consolidated Statements of Operations.
Accounts Receivable, net
Accounts receivable includes amounts related to document and liability holdbacks of Mortgage servicing right sales, government insured foreclosure and real estate owned that is expected to be recovered from the guarantor and other general corporate receivables. As of December 31, 2017, the recorded allowance for uncollectible accounts receivable was $7 million, and as of December 31, 2016, the amount was not significant.
Servicing Advances, net
The Company is required under most of its mortgage servicing agreements to advance funds to meet contractual principal and interest payments to investors and to pay tax, insurance, foreclosure costs and various other items that are required to preserve the assets being serviced. Advances are recovered either from the borrower in subsequent payments, from liquidation proceeds or from insurance claims following foreclosure or liquidation. Under certain of the Company's subservicing agreements, the subservicing client must pre-fund advances on the loans, or reimburse the Company for those advances on a monthly or other periodic basis. The Company is exposed to losses only to the extent that the respective servicing guidelines are not followed and records a reserve against the advances when it is probable that the servicing advance will be uncollectable. As of December 31, 2017 and 2016, the recorded reserve for uncollectible servicing advances was $8 million and $5 million, respectively. In certain circumstances, the Company may be required to remit funds on a non-recoverable basis, which are expensed as incurred.
Mortgage Servicing Rights
A mortgage servicing right is the right to receive a portion of the interest coupon and fees collected from the mortgagor for performing specified mortgage servicing activities. Mortgage servicing activities consist of collecting loan payments, remitting principal and interest payments to investors, managing escrow funds for the payment of mortgage-related expenses such as taxes and insurance and otherwise administering the mortgage loan servicing portfolio. Mortgage servicing rights are created through either the direct purchase of servicing from a third party or through the sale of an originated mortgage loan with servicing retained. The Company’s MSRs consist of mortgage servicing rights sold that have been accounted for as a secured borrowing, and mortgage
85
servicing rights owned where the Company owns the right to a receive a portion of the interest and fees. The servicing rights relate to a single class of residential mortgage loans, which are measured at fair value on a recurring basis.
The initial value of capitalized mortgage servicing rights is recorded as an addition to Mortgage servicing rights owned in the Consolidated Balance Sheets and within Gain on loans held for sale, net in the Consolidated Statements of Operations. Subsequent measurements including the market-related fair value adjustments and actual prepayments of the underlying mortgage loan and receipts of recurring cash flows are recorded in Loan servicing income, net in the Consolidated Statements of Operations.
Property and Equipment
Property and equipment (including leasehold improvements) are recorded at cost, net of accumulated depreciation and amortization. Depreciation and amortization expense are computed utilizing the straight-line method over the following estimated useful lives:
Capitalized software | 3 to 5 years |
Furniture, fixtures and equipment | 3 to 7 years |
Capital leases | Lesser of the remaining lease term or 5 years |
Leasehold improvements | Lesser of the remaining lease term or 20 years |
Internal software development costs are capitalized during the application development stage. The costs capitalized relate to external direct costs of materials and services and employee costs related to the time spent on the project during the capitalization period. Capitalized software is evaluated for impairment annually or when changing circumstances indicate that amounts capitalized may be impaired. Impaired items are written down to their estimated fair values at the date of evaluation.
Mortgage Loans in Foreclosure and Real Estate Owned
Mortgage loans in foreclosure and Real estate owned include loans that have been repurchased for breaches in representation and warranty obligations. As loans are repurchased, the Company reduces the estimated losses related to repurchase and indemnification obligations and records reserves for on-balance sheet loans in foreclosure and adjustments to value for real estate owned based on the expected amount which will likely not be recoverable from guarantors, insurers or investors.
Mortgage loans in foreclosure represent the unpaid principal balance of mortgage loans for which foreclosure proceedings have been initiated, plus recoverable advances made on those loans. These amounts are recorded net of an allowance for probable losses on such mortgage loans and related advances.
Real estate owned, which are acquired from mortgagors in default, plus recoverable advances made on those loans, are recorded at the lower of: (i) the adjusted carrying amount at the time the property is acquired; or (ii) fair value based upon the estimated net realizable value of the underlying collateral less the estimated costs to sell.
Derivative Instruments
Derivative instruments are used as part of the overall strategy to manage exposure to market risks primarily associated with fluctuations in interest rates. As a matter of policy, derivatives are not used for speculative purposes. Derivative instruments are measured at fair value on a recurring basis and are included in Other assets or Other liabilities in the Consolidated Balance Sheets. The Company does not have any derivative instruments designated as hedging instruments.
Subservicing Advance Liabilities
Under the terms of certain subservicing arrangements, the subservicing counterparty is required to fund servicing advances for their respective portfolios of subserviced loans. A subservicing advance liability is recorded for cash received from the counterparty to fund advances, and is repaid to the counterparty upon the collection of the mortgage servicing advance receivables.
Mortgage Servicing Rights Secured Liability
The Company has accounted for certain MSR sales as a secured borrowing. Under this accounting treatment, the MSRs transferred to New Residential remain on the Consolidated Balance Sheets and the proceeds from the sale are recognized as a Mortgage servicing rights secured liability. The Company elected to record the MSRs secured liability at fair value consistent with the related MSR asset, and the changes in fair value offset each other.
86
Changes in fair value of Mortgage servicing rights secured liability are recorded in Loan servicing income, net in the Consolidated Statements of Operations, including the market-related fair value adjustments and actual prepayments of the underlying mortgage loan and receipts of recurring cash flows, and the estimated yield on the related MSR asset. The implied interest cost on the MSRs secured liability is recorded in Net interest expense in the Consolidated Statements of Operations which offsets the estimated yield on the MSR asset, both of which represent non-cash amounts. The Company records interest expense using the effective interest method based on the expected cash flows from the MSRs through the expected life of the underlying loans, which offsets the estimated yield on the MSR asset. Proceeds from the sale of these MSRs are included in financing activities in the Consolidated Statements of Cash Flows. Refer to Note 4, 'Servicing Activities' and Note 16, 'Fair Value Measurements' for additional information.
Loan Repurchase and Indemnification Liability
The Company has established a Loan repurchase and indemnification liability for various representation and warranties that are provided in connection with its capacity as a loan originator and servicer. The liability for probable losses includes estimates associated with: (i) losses for loans where a repurchase or indemnification obligation could exist from breaches of representation and warranties, (ii) losses for specific non-performing loans where the Company believes it will be required to indemnify the investor and (iii) losses for government loans that may not be reimbursed pursuant to mortgage insurance programs.
The Company estimates its obligation for representations and warranties using a model that incorporates historical repurchase and indemnification experience and servicing portfolio performance. The model considers borrower performance, estimated future repurchase and indemnification requests, success rates in appealing repurchase requests (or the ability to cure the origination defects) and projected loss severity rates based upon current loss rates for similar loans. The liability related to specific non-performing loans is based on a loan-level analysis which considers the delinquency status of the loan and projected loss severity rates. To estimate the liability related to losses for loans that may not be reimbursed pursuant to mortgage insurance programs, the Company considers government loans currently in foreclosure, historical origination defect rates and projected loss severity rates.
The Company establishes an initial reserve at fair value for expected losses relating to loan sales at the date the loans are de-recognized from the Balance Sheet which is recorded as a reduction of the transaction gain or loss within Gain on loans held for sale, net in the Consolidated Statement of Operations. Subsequent updates to the recorded liability from changes in assumptions are recorded through Other operating expenses in the Consolidated Statement of Operations.
Subsequent Events
Subsequent events are evaluated through the date of filing with the Securities and Exchange Commission.
87
2. Exit Costs |
PLS Exit
In November 2016, the Company announced its plan to exit the PLS business within the Mortgage Production segment. This business channel provides end-to-end origination services to financial institution clients, and represented 66% of the Company's total mortgage production volume (based on dollars) for the year ended December 31, 2017. Due to elevated operating losses, increasing regulatory and client customization costs and a shrinking market for financial institution origination services, the Company determined the exit of the business was necessary. The Company expects that it will be in a position to substantially exit this channel by the first quarter of 2018, subject to transition support requirements.
The following is a summary of expenses incurred to date for the PLS exit program within Exit and disposal costs in the Consolidated Statement of Operations, including our estimate of remaining and total program costs:
Year Ended December 31, 2017 | |||||||||||||||||||
Severance and Termination Benefits | Facility Exit Costs | Contract Termination & Other Costs | Non-Cash Charges & Asset Impairment (1) | Total | |||||||||||||||
(In millions) | |||||||||||||||||||
Costs incurred in current year | $ | 12 | $ | 6 | $ | 13 | $ | (4 | ) | $ | 27 | ||||||||
Cumulative costs recognized in prior years | 22 | — | 4 | 15 | 41 | ||||||||||||||
Estimate of remaining costs | 2 | 16 | 4 | — | 22 | ||||||||||||||
Total | $ | 36 | $ | 22 | $ | 21 | $ | 11 | $ | 90 | |||||||||
______________
(1) | During the year ended December 31, 2017, the Company recorded $4 million to reverse previously accrued liabilities associated with the Jacksonville facility. |
The following is a summary of the PLS program costs by segment for the year ended December 31, 2017:
Mortgage Production Segment | Other | Total | ||||||||||
(In millions) | ||||||||||||
Costs incurred in current year | $ | 20 | $ | 7 | $ | 27 | ||||||
Cumulative costs recognized in prior years | 33 | 8 | 41 | |||||||||
Estimate of remaining costs | 17 | 5 | 22 | |||||||||
Total | $ | 70 | $ | 20 | $ | 90 | ||||||
Reorganization
In February 2017, the Company announced its intention to operate as a smaller business that is focused on subservicing and portfolio retention services. Costs estimated for this Reorganization exit program, which are presented separately from the PLS exit program, include severance, acceleration of existing retention and incentive awards and other costs to execute the reorganization and change the focus of the Company's operations. The Company expects it will incur the remaining exit costs through the first quarter of 2018.
88
The following is a summary of expenses incurred to date for the Reorganization exit program within Exit and disposal costs in the Consolidated Statements of Operations, including an estimate of remaining and total program costs:
Year Ended December 31, 2017 | |||||||||||||||||||
Severance and Termination Benefits | Facility Exit Costs | Contract Termination & Other Costs | Non-Cash Charges & Asset Impairment (1) | Total (2) | |||||||||||||||
(In millions) | |||||||||||||||||||
Costs incurred in current year | $ | 30 | $ | 2 | $ | 1 | $ | 2 | $ | 35 | |||||||||
Cumulative costs recognized in prior years | — | — | — | — | — | ||||||||||||||
Estimate of remaining costs | 1 | 1 | — | — | 2 | ||||||||||||||
Total | $ | 31 | $ | 3 | $ | 1 | $ | 2 | 37 | ||||||||||
(1) | During the year ended December 31, 2017, the Company recorded a $2 million impairment for an equity method investment. |
(2) | Exit costs related to Reorganization include amounts attributable to noncontrolling interest, representing $7 million of costs incurred during the year ended December 31, 2017, and $7 million of total program costs. Refer to Note 17, 'Variable Interest Entities' for further information regarding agreements to sell certain assets of PHH Home Loans and its subsidiaries and exit the Real Estate channel. |
The following is a summary of the Reorganization program costs by segment for the year ended December 31, 2017:
Mortgage Production Segment | Mortgage Servicing Segment | Other | Total | |||||||||||||
(In millions) | ||||||||||||||||
Costs incurred in current year | $ | 18 | $ | 2 | $ | 15 | $ | 35 | ||||||||
Cumulative costs recognized in prior years | — | — | — | — | ||||||||||||
Estimate of remaining costs | 1 | 1 | — | 2 | ||||||||||||
Total | $ | 19 | $ | 3 | $ | 15 | $ | 37 | ||||||||
Exit Cost Liability
The Company's Exit cost liability is included in Accounts payable and accrued expenses within the Consolidated Balance Sheets. A summary of the aggregate activity for both the PLS exit program and the Reorganization exit program is as follows:
Severance and Termination Benefits | Facility Exit Costs | Contract Termination & Other Costs | Total | ||||||||||||
(In millions) | |||||||||||||||
Balance, beginning of period | $ | — | $ | — | $ | — | $ | — | |||||||
Charges | 22 | — | 4 | 26 | |||||||||||
Paid | — | — | (1 | ) | (1 | ) | |||||||||
Balance, December 31, 2016 | 22 | — | 3 | 25 | |||||||||||
Charges | 42 | 8 | 14 | 64 | |||||||||||
Paid | (22 | ) | (6 | ) | (9 | ) | (37 | ) | |||||||
Adjustments (1) | 1 | — | — | 1 | |||||||||||
Balance, December 31, 2017 | $ | 43 | $ | 2 | $ | 8 | $ | 53 | |||||||
(1) | This adjustment represents previously accrued amounts of existing retention and incentive awards for exiting employees that will be paid out upon termination and other non-cash charges. |
89
3. Earnings Per Share |
Basic earnings or loss per share attributable to PHH Corporation was computed by dividing Net income or loss attributable to PHH Corporation by the weighted-average number of shares outstanding during the period. Diluted earnings or loss per share attributable to PHH Corporation was computed by dividing Net income or loss attributable to PHH Corporation by the weighted-average number of shares outstanding during the period, assuming all potentially dilutive common shares were issued. Share repurchases or issuances are included in the outstanding shares as of each settlement date. See further discussions of share activity and Board of Directors authorizations described in Note 14, 'Stock-Related Matters'.
Weighted-average common shares outstanding includes the following activity:
Year ended December 31, 2017
• | the repurchase of 2,450,466 common shares between May 2017 and August 2017 under an open market repurchase program; and |
• | the repurchase of 18,762,962 common shares under a modified "Dutch auction" self-tender offer during September 2017. |
Year ended December 31, 2016
• | the repurchase of 1,508,772 common shares during January 2016 under an open market repurchase program. |
Year ended December 31, 2015
• | the repurchase of 4,841,267 common shares during November 2015 and December 2015 under an open market repurchase program; |
• | the issuance of 10,075,653 common shares during June 2015 which represented the amount by which the conversion value exceeded the note principal under an exchange offer of certain convertible debt; and |
• | the receipt and retirement of 1,574,252 common shares during March 2015 which represented the final delivery of shares under accelerated repurchase agreements. |
The weighted-average computation of the dilutive effect of potentially issuable shares of Common stock under the treasury stock method excludes the effect of any contingently issuable securities where the contingency has not been met and excludes the effect of securities that would be anti-dilutive. Anti-dilutive securities may include: (i) outstanding stock-based compensation awards representing shares from restricted stock units and stock options and (ii) stock assumed to be issued related to convertible notes.
The following table summarizes the calculations of basic and diluted earnings or loss per share attributable to PHH Corporation for the periods indicated:
Year Ended December 31, | |||||||||||
2017 | 2016 | 2015 | |||||||||
(In millions, except share and per share data) | |||||||||||
Net loss attributable to PHH Corporation | $ | (217 | ) | $ | (202 | ) | $ | (145 | ) | ||
Weighted-average common shares outstanding — basic and diluted | 46,912,204 | 53,627,170 | 55,201,713 | ||||||||
Basic and Diluted loss per share attributable to PHH Corporation | $ | (4.62 | ) | $ | (3.77 | ) | $ | (2.62 | ) | ||
Anti-dilutive securities excluded from the computation of diluted shares: | |||||||||||
Outstanding stock-based compensation awards(1) | 988,486 | 1,980,240 | 1,386,775 | ||||||||
Assumed conversion of debt securities | — | — | 4,341,369 | ||||||||
(1) | For the year ended December 31, 2017, excludes 70,425 shares that are contingently issuable for which the contingency has not been met. |
90
4. Servicing Activities |
Total Servicing Portfolio
The following table summarizes the total servicing portfolio, which consists of loans associated with capitalized MSRs owned and secured, loans held for sale, and the portfolio associated with loans subserviced for others:
December 31, | |||||||||||||||
2017 | 2016 | ||||||||||||||
Fair Value | UPB | Fair Value | UPB | ||||||||||||
(In millions) | |||||||||||||||
Capitalized MSRs owned | $ | 57 | $ | 8,592 | $ | 690 | $ | 84,657 | |||||||
Capitalized MSRs under secured borrowing arrangements and subserviced (1) | 419 | 49,193 | — | — | |||||||||||
Total capitalized MSRs | $ | 476 | $ | 57,785 | $ | 690 | $ | 84,657 | |||||||
Subserviced | 89,844 | 89,170 | |||||||||||||
Other servicing | 526 | 815 | |||||||||||||
Total | $ | 148,155 | $ | 174,642 | |||||||||||
———————
(1) | Accounted for as a secured borrowing arrangement. Refer to Note 1, 'Summary of Significant Accounting Policies' for additional information. |
Loan Servicing Income, Net
The following table summarizes the components of Loan servicing income, net:
Year Ended December 31, | |||||||||||
2017 | 2016 | 2015 | |||||||||
(In millions) | |||||||||||
Servicing fees from capitalized portfolio (1) | $ | 145 | $ | 266 | $ | 304 | |||||
Subservicing fees | 56 | 67 | 70 | ||||||||
Late fees and other ancillary revenue | 29 | 39 | 40 | ||||||||
Loss on sale of MSRs and related costs | (16 | ) | (3 | ) | (5 | ) | |||||
Curtailment interest paid to investors | (6 | ) | (16 | ) | (15 | ) | |||||
Loan servicing income | 208 | 353 | 394 | ||||||||
Change in fair value of MSRs, net of related derivatives (2) | (119 | ) | (228 | ) | (158 | ) | |||||
Change in fair value of MSRs secured liability | 48 | — | — | ||||||||
Loan servicing income, net | $ | 137 | $ | 125 | $ | 236 | |||||
________________
(1) | Servicing fees from capitalized portfolio for the year ended December 31, 2017 include $29 million related to the estimated yield on capitalized MSRs treated as a secured borrowing arrangement. This is fully offset by the MSRs secured interest expense included within Net interest expense. |
(2) | Derivative gains for the year ended December 31, 2017 were not significant. Amounts are net of derivative gains of $10 million and $29 million for the years ended December 31, 2016 and 2015, respectively. |
Sales of MSRs
While the Company has historically retained MSRs on its balance sheet from the majority of its loan sales, the Company entered into contracts to sell substantially all of its existing MSR assets in a series of transactions, a significant portion of which were completed during 2017. If the remaining sales of these MSRs are completed, the Company does not anticipate retaining a significant amount of capitalized MSRs owned in the future. The final proceeds the Company may receive from the private MSR sales are dependent on the portfolio composition at each transfer date and are subject to a number of approvals and closing requirements.
91
The following table summarizes the Company's MSRs and its commitments under sale agreements, based on the portfolio as of December 31, 2017:
UPB | Fair Value | ||||||
(In millions) | |||||||
MSR commitments: | |||||||
New Residential | $ | 5,940 | $ | 34 | |||
Other counterparties | 565 | 5 | |||||
MSRs capitalized under secured borrowing arrangements and subserviced | 49,193 | 419 | |||||
Non-committed | 2,087 | 18 | |||||
Total MSRs | $ | 57,785 | $ | 476 | |||
In addition, the Company has commitments to transfer approximately $110 million of Servicing advances to the counterparties of these agreements (based on the December 31, 2017 portfolio).
For the year ended December 31, 2017, the Company received $127 million in cash from sales of MSRs that have been derecognized and removed from the Consolidated Balance Sheets. For the year ended December 31, 2017, the Company received an additional $426 million in cash from sales of MSRs that have been accounted for as a secured borrowing arrangement. As of December 31, 2017, the Company has a $42 million gross accounts receivable related to holdback from executed MSR sales and transfers to address indemnification claims and mortgage loan document deficiencies, which is included in Accounts receivable, net in the Consolidated Balance Sheets.
Lakeview/GNMA Portfolio. In November 2016, the Company entered into an agreement to sell substantially all of its Ginnie Mae ("GNMA") MSRs and related advances to Lakeview Loan Servicing, LLC ("Lakeview"). During 2017, the following sales were completed:
• | On February 2, 2017, the initial sale of MSRs under this agreement was completed, representing $10.2 billion of unpaid principal balance, $74 million of MSR fair value and $11 million of Servicing advances, with total expected proceeds of $85 million from the initial transfer. |
• | On May 2, 2017, an additional sale of MSRs was completed, representing $1.0 billion of unpaid principal balance, $7 million of MSR fair value and $1 million of Servicing advances, with total expected proceeds of $8 million from this transfer. |
• | On August 2, 2017, the final transfer under this agreement was completed, representing $2.0 billion of unpaid principal balance, $12 million of MSR fair value and $2 million of Servicing advances, with total expected proceeds of $14 million. |
New Residential. On December 28, 2016, the Company entered into an agreement to sell substantially all of its portfolio of MSRs and related advances, excluding the GNMA MSRs pending sale to Lakeview, to New Residential. All of the sales with New Residential have been accounted for as a secured borrowing arrangement, which is further described in Note 16, 'Fair Value Measurements'. During 2017, the following sales were completed:
• | On June 16, 2017, the sale of substantially all of the committed Freddie Mac MSRs under this agreement was completed, representing $13.2 billion of unpaid principal balance, $113 million of MSR fair value and $8 million of Servicing advances, with total expected proceeds of $121 million. |
• | On July 3, 2017, the sale of substantially all of the committed Fannie Mae MSRs under this agreement was completed, representing $39.5 billion of unpaid principal balance, $342 million of MSR fair value and $24 million of Servicing advances, with total expected proceeds of $366 million. |
• | During September 2017, additional sales of Fannie Mae and Freddie Mac MSRs under this agreement were completed, representing $1.3 billion of unpaid principal balance, $12 million of MSR fair value and $1 million of Servicing advances, with total expected proceeds of $13 million. |
• | During the fourth quarter of 2017, additional sales of Fannie Mae and Freddie Mac MSRs were completed, representing $81 million of unpaid principal balance, $1 million of MSR fair value and an insignificant amount of Servicing advances, with total expected proceeds of $1 million. |
In connection with the agreement, the Company entered into a subservicing agreement with New Residential, pursuant to which the Company will subservice the loans sold in this transaction for an initial period of three years, subject to certain transfer and
92
termination provisions, which includes approximately 363,000 units as of December 31, 2017. Additionally, there are 27,000 units in the owned portfolio that are committed to sell to New Residential as of December 31, 2017 that would also be subserviced, if such sales are executed. The consummation of all of the remaining MSRs and related advances contemplated by this sale agreement is subject to the approvals of multiple counterparties, including origination sources, investors and trustees, as well as other customary closing requirements.
Other counterparties. Commitments to sell MSRs to other counterparties may include: (i) agreements to sell a portion of the Company's newly-created MSRs to third parties through flow-sale agreements, where the Company will have continuing involvement as a subservicer; (ii) agreements to sell a portion of MSRs to clients that were the origination source of the MSRs that were previously part of the New Residential commitments; and (iii) agreements for small portfolio sales of existing MSRs, consistent with its intention to not retain a significant amount of MSRs in the future. For the year ended December 31, 2017, $35 million of MSR fair value was sold to other counterparties.
In addition to the commitments presented, as of December 31, 2017, the Company had commitments to sell MSRs through third-party flow sales related to $28 million of the unpaid principal balance of Mortgage loans held for sale and Interest rate lock commitments that are expected to result in closed loans.
Mortgage Servicing Rights
Capitalized MSRs owned recorded in the Consolidated Balance Sheets are created primarily through sales of originated loans on a servicing-retained basis or through the direct purchase of servicing from a third party. The activity in the total loan servicing portfolio unpaid principal balance associated with capitalized mortgage servicing rights consisted of:
Year Ended December 31, | |||||||||||||||
2017 | 2016 | 2015 | 2017 | ||||||||||||
MSRs Owned | MSRs Secured Asset | ||||||||||||||
(In millions) | |||||||||||||||
Balance, beginning of period | $ | 84,657 | $ | 98,990 | $ | 112,686 | $ | — | |||||||
Additions from loans sold with servicing retained | 3,270 | 5,874 | 8,841 | — | |||||||||||
Payoffs and curtailments | (7,667 | ) | (19,211 | ) | (19,092 | ) | (4,847 | ) | |||||||
Sales that have been derecognized | (17,628 | ) | (996 | ) | (3,445 | ) | — | ||||||||
Sales accounted for as secured borrowing | (54,040 | ) | — | — | 54,040 | ||||||||||
Balance, end of period | $ | 8,592 | $ | 84,657 | $ | 98,990 | $ | 49,193 | |||||||
The activity in capitalized MSRs consisted of:
Year Ended December 31, | |||||||||||||||
2017 | 2016 | 2015 | 2017 | ||||||||||||
MSRs Owned | MSRs Secured Asset | ||||||||||||||
(In millions) | |||||||||||||||
Balance, beginning of period | $ | 690 | $ | 880 | $ | 1,005 | $ | — | |||||||
Additions from loans sold with servicing retained | 36 | 60 | 101 | — | |||||||||||
Sales that have been derecognized | (131 | ) | (12 | ) | (39 | ) | — | ||||||||
Sales accounted for as secured borrowing | (467 | ) | — | — | 467 | ||||||||||
Changes in fair value due to: | |||||||||||||||
Realization of expected cash flows | (59 | ) | (138 | ) | (169 | ) | (41 | ) | |||||||
Changes in market inputs or assumptions used in the valuation model | (12 | ) | (100 | ) | (18 | ) | (7 | ) | |||||||
Balance, end of period | $ | 57 | $ | 690 | $ | 880 | $ | 419 | |||||||
93
Sales of Mortgage Loans
Residential mortgage loans are sold through one of the following methods: (i) sales to or pursuant to programs sponsored by Fannie Mae, Freddie Mac and GNMA (collectively, the "Agencies" or "GSEs") or (ii) sales to private investors. During the year ended December 31, 2017, 44% of mortgage loan sales were to, or pursuant to programs sponsored by, the GSEs and the remaining 56% were sold to private investors. The Company may have continuing involvement in mortgage loans sold by retaining MSRs and/or recourse obligations, as discussed further in Note 13, 'Commitments and Contingencies'.
During the year ended December 31, 2017, MSRs were initially retained on 45% of mortgage loans sold. Conforming conventional loans serviced are sold or securitized through Fannie Mae or Freddie Mac programs. Government loans serviced are generally sold or securitized through GNMA programs and are either insured against loss by the Federal Housing Administration or partially guaranteed against loss by the Department of Veterans Affairs. Additionally, non-conforming mortgage loans are serviced for various private investors on a non-recourse basis.
A majority of mortgage loans are sold on a non-recourse basis; however, in connection with the sales of these assets, representations and warranties have been made that are customary for loan sale transactions, including eligibility characteristics of the mortgage loans and underwriting responsibilities. See Note 13, 'Commitments and Contingencies' for a further description of representation and warranty obligations.
The following table sets forth information regarding cash flows relating to loan sales in which the Company has continuing involvement:
Year Ended December 31, | |||||||||||
2017 | 2016 | 2015 | |||||||||
(In millions) | |||||||||||
Proceeds from new loan sales or securitizations | $ | 3,711 | $ | 6,071 | $ | 9,075 | |||||
Servicing fees from capitalized portfolio (1) | 145 | 305 | 344 | ||||||||
Purchases of previously sold loans (2) | (21 | ) | (295 | ) | (128 | ) | |||||
Servicing advances (3) | (998 | ) | (1,584 | ) | (2,083 | ) | |||||
Repayment of servicing advances (3) | 1,270 | 1,647 | 2,086 | ||||||||
______________
(1) | Includes servicing fees, late fees and other ancillary servicing revenue in which the Company has continuing involvement. |
(2) | Includes purchases of repurchase eligible loans and excludes indemnification payments to investors and insurers of the related mortgage loans. |
(3) | Outstanding servicing advance receivables are presented in Servicing advances, net in the Consolidated Balance Sheets, except for advances related to loans in foreclosure or real estate owned, which are included in Other assets. Repayment of servicing advances includes the $66 million received for advances from sales of MSRs executed in the year ended December 31, 2017. |
During the years ended December 31, 2017, 2016 and 2015, pre-tax gains of $158 million, $266 million and $300 million, respectively, related to the sale or securitization of residential mortgage loans were recognized in Gain on loans held for sale, net in the Consolidated Statements of Operations.
94
5. Derivatives |
The Company’s principal market exposure is to interest rate risk, specifically long-term U.S. Treasury and mortgage interest rates, due to their impact on mortgage-related assets and commitments. From time to time, various financial instruments are used to manage and reduce this risk, including swap contracts, forward delivery commitments on mortgage-backed securities or whole loans, futures and options contracts. Derivative instruments are recorded in Other assets and Other liabilities in the Consolidated Balance Sheets. The Company does not have any derivative instruments designated as hedging instruments. See Note 16, 'Fair Value Measurements' for further discussion regarding the measurements of derivative instruments.
Interest Rate Lock Commitments. Interest rate lock commitments (“IRLCs”) represent an agreement to extend credit to a mortgage loan applicant, or an agreement to purchase a loan from a third-party originator, whereby the interest rate on the loan is set prior to funding. The loan commitment binds the Company (subject to the loan approval process) to fund the loan at the specified rate, regardless of whether interest rates have changed between the commitment date and the loan funding date. As such, outstanding IRLCs are subject to interest rate risk and related price risk during the period from the date of the commitment through the loan funding date or expiration date. The loan commitments generally range between 30 and 90 days; however, the borrower is not obligated to obtain the loan. The Company is subject to fallout risk related to IRLCs, which is realized if approved borrowers choose not to close on the loans within the terms of the IRLCs. Forward delivery commitments on mortgage-backed securities or whole loans and options on forward contracts are used to manage the interest rate and price risk. Historical commitment-to-closing ratios are considered to estimate the quantity of mortgage loans that will fund within the terms of the IRLCs.
Mortgage Loans Held for Sale. The Company is subject to interest rate and price risk on Mortgage loans held for sale from the loan funding date until the date the loan is sold into the secondary market. Forward delivery commitments on mortgage-backed securities or whole loans are primarily used to fix the forward sales price that will be realized upon the sale of mortgage loans into the secondary market. Forward delivery commitments may not be available for all products that the Company originates; therefore, a combination of derivative instruments, including forward delivery commitments for similar products, may be used to minimize the interest rate and price risk.
Mortgage Servicing Rights. Mortgage servicing rights (“MSRs”) are subject to substantial interest rate risk as the mortgage notes underlying the servicing rights permit the borrowers to prepay the loans. Therefore, the value of MSRs generally tend to diminish in periods of declining interest rates (as prepayments increase) and increase in periods of rising interest rates (as prepayments decrease). Although the level of interest rates is a key driver of prepayment activity, there are other factors that influence prepayments, including home prices, underwriting standards and product characteristics. In the fourth quarter of 2016, the Company significantly reduced its MSR-related derivative hedge coverage as a result of the MSR sale agreements that fixed the price the Company expects to realize at future transfer dates. The remaining MSR-related derivatives were settled during the first half of 2017. For further discussion of the MSR sale agreements, see Note 4, 'Servicing Activities'.
The following table summarizes the gross notional amount of derivatives:
December 31, | |||||||
2017 | 2016 | ||||||
(In millions) | |||||||
Notional amounts: | |||||||
Interest rate lock commitments expected to close | $ | 192 | $ | 862 | |||
Forward delivery commitments | 614 | 2,104 | |||||
MSR-related agreements | — | 260 | |||||
Option contracts | — | 120 | |||||
The Company is exposed to risk in the event of non-performance by counterparties in its derivative contracts. In general, the Company manages such risk by evaluating the financial position and creditworthiness of counterparties, monitoring the amount of exposure and/or dispersing the risk among multiple counterparties. The Company’s derivatives may also be governed by an ISDA or an MSFTA, and bilateral collateral agreements are in place with certain counterparties. When the Company has more than one outstanding derivative transaction with a single counterparty and a legally enforceable master netting agreement is in effect with that counterparty, the Company considers its exposure to be the net fair value of all positions with that counterparty including the value of any cash collateral amounts posted or received.
95
In addition, the Company has global netting arrangements with certain counterparties whereby the Company’s outstanding derivative and cash collateral positions may be settled net against amounts outstanding under borrowing arrangements and other obligations when an event of default has occurred. These amounts are not presented net in the Consolidated Balance Sheets as the netting provisions are contingent upon an event of default.
As of December 31, 2017, there were no significant assets or liabilities subject to master netting arrangements, and there were $5 million of interest rate lock commitment assets not subject to master netting arrangements.
The following tables present the balances of outstanding derivative instruments on a gross basis and the application of counterparty and collateral netting as of December 31, 2016:
December 31, 2016 | |||||||||||||||
Gross Assets | Offsetting Payables | Cash Collateral Paid | Net Amount | ||||||||||||
(In millions) | |||||||||||||||
ASSETS | |||||||||||||||
Subject to master netting arrangements: | |||||||||||||||
Forward delivery commitments | $ | 13 | $ | (43 | ) | $ | 31 | $ | 1 | ||||||
MSR-related agreements | 19 | (22 | ) | 4 | 1 | ||||||||||
Option contracts | 1 | (1 | ) | — | — | ||||||||||
Derivative assets subject to netting | 33 | (66 | ) | 35 | 2 | ||||||||||
Not subject to master netting arrangements: | |||||||||||||||
Interest rate lock commitments | 18 | — | — | 18 | |||||||||||
Forward delivery commitments | 1 | — | — | 1 | |||||||||||
Derivative assets not subject to netting | 19 | — | — | 19 | |||||||||||
Total derivative assets | $ | 52 | $ | (66 | ) | $ | 35 | $ | 21 | ||||||
Gross Liabilities | Offsetting Receivables | Cash Collateral Received | Net Amount | ||||||||||||
(In millions) | |||||||||||||||
LIABILITIES | |||||||||||||||
Subject to master netting arrangements: | |||||||||||||||
Forward delivery commitments | $ | 4 | $ | (10 | ) | $ | 11 | $ | 5 | ||||||
MSR-related agreements | 65 | (55 | ) | 2 | 12 | ||||||||||
Option contracts | — | (1 | ) | 2 | 1 | ||||||||||
Derivative liabilities subject to netting | 69 | (66 | ) | 15 | 18 | ||||||||||
Total derivative liabilities | $ | 69 | $ | (66 | ) | $ | 15 | $ | 18 | ||||||
The following table summarizes the gains (losses) recorded in the Consolidated Statements of Operations for derivative instruments:
Year Ended December 31, | |||||||||||
2017 | 2016 | 2015 | |||||||||
(In millions) | |||||||||||
Gain on loans held for sale, net: | |||||||||||
Interest rate lock commitments | $ | 200 | $ | 315 | $ | 261 | |||||
Forward delivery commitments | (8 | ) | (1 | ) | (7 | ) | |||||
Option contracts | (1 | ) | — | (2 | ) | ||||||
Net derivative gain related to mortgage servicing rights: | |||||||||||
MSR-related agreements | — | 10 | 29 | ||||||||
96
6. Property and Equipment, Net |
Property and equipment, net consisted of:
December 31, | |||||||
2017 | 2016 | ||||||
(In millions) | |||||||
Capitalized software | $ | 120 | $ | 130 | |||
Furniture, fixtures and equipment | 10 | 33 | |||||
Capital leases | — | 9 | |||||
Leasehold improvements | 19 | 25 | |||||
149 | 197 | ||||||
Less: Accumulated depreciation and amortization | (127 | ) | (161 | ) | |||
Total | $ | 22 | $ | 36 | |||
7. Other Assets |
Other assets consisted of:
December 31, | |||||||
2017 | 2016 | ||||||
(In millions) | |||||||
Prepaid expenses | $ | 8 | $ | 11 | |||
Real estate owned, net (1) | 7 | 16 | |||||
Derivatives (Note 5) | 5 | 21 | |||||
Mortgage loans in foreclosure, net (2) | 3 | 21 | |||||
Repurchase eligible loans (3) | 1 | 13 | |||||
Income taxes receivable | — | 14 | |||||
Equity method investments (4) | — | 10 | |||||
Deferred financing costs | — | 1 | |||||
Other | 2 | 2 | |||||
Total | $ | 26 | $ | 109 | |||
(1) | As of December 31, 2017 and 2016, Real estate owned is net of Adjustment to value for real estate owned of $9 million and $14 million, respectively. |
(2) | As of December 31, 2017 and 2016, Mortgage loans in foreclosure is net of Allowance for probable foreclosure losses of $2 million and $10 million, respectively. |
(3) | Repurchase eligible loans represent certain mortgage loans sold pursuant to Government National Mortgage Association programs where the Company, as servicer, has the unilateral option to repurchase the loan if certain criteria are met, including if a loan is greater than 90 days delinquent and where it has been determined that there is more than a trivial benefit from exercising the repurchase option. Regardless of whether the repurchase option has been exercised, the Company must recognize eligible loans within Other assets and a corresponding repurchase liability within Accounts payable and accrued expenses in the Consolidated Balance Sheets. |
(4) | See Note 16, 'Fair Value Measurements' for a discussion of the impairment recorded during the year ended December 31, 2016, and Note 1, 'Summary of Significant Accounting Policies' for a discussion of the acquisition of STARS. |
97
8. Accounts Payable and Accrued Expenses |
Accounts payable and accrued expenses consisted of:
December 31, | |||||||
2017 | 2016 | ||||||
(In millions) | |||||||
Exit cost liability (Note 2) | $ | 53 | $ | 25 | |||
Accounts payable | 39 | 77 | |||||
Accrued payroll and benefits | 33 | 50 | |||||
Accrued servicing related expenses | 10 | 12 | |||||
Accrued interest | 3 | 16 | |||||
Income taxes payable | 2 | — | |||||
Repurchase eligible loans (Note 7) | 1 | 13 | |||||
Total | $ | 141 | $ | 193 | |||
9. Other Liabilities |
Other liabilities consisted of:
December 31, | |||||||
2017 | 2016 | ||||||
(In millions) | |||||||
Legal and regulatory matters (Note 13) | $ | 20 | $ | 114 | |||
Pension and other post-employment benefits (Note 11) | 11 | 11 | |||||
Income tax contingencies (Note 12) | 11 | 8 | |||||
Liability to deliver MSRs (Note 16) | 2 | — | |||||
Derivatives (Note 5) | — | 18 | |||||
Other | 3 | 6 | |||||
Total | $ | 47 | $ | 157 | |||
98
10. Debt and Borrowing Arrangements |
The following table summarizes the components of Debt:
December 31, 2017 | December 31, 2016 | |||||||||||||
Balance | Interest Rate(1) | Available Capacity(2) | Balance | |||||||||||
(In millions) | ||||||||||||||
Committed warehouse facilities | $ | 169 | 3.7 | % | $ | 206 | $ | 556 | ||||||
Uncommitted warehouse facilities | 51 | 3.3 | % | 249 | — | |||||||||
Servicing advance facility | 32 | 3.4 | % | 33 | 99 | |||||||||
Mortgage warehouse and advance facilities | 252 | 655 | ||||||||||||
Term notes due in 2019 | 97 | 7.375 | % | n/a | 275 | |||||||||
Term notes due in 2021 | 22 | 6.375 | % | n/a | 340 | |||||||||
Unsecured credit facilities | — | — | 3 | — | ||||||||||
Unsecured debt, face value | 119 | 615 | ||||||||||||
Debt issuance costs | (1 | ) | (8 | ) | ||||||||||
Unsecured debt, net | 118 | 607 | ||||||||||||
Total | $ | 370 | $ | 1,262 | ||||||||||
______________
(1) | Interest rate shown represents the stated interest rate of outstanding borrowings, which may differ from the effective rate due to the amortization of premiums, discounts and issuance costs. Warehouse facilities and the Servicing advance facility are variable-rate. Rate shown for Warehouse facilities represents the weighted-average rate of current outstanding borrowings. |
(2) | Capacity is dependent upon maintaining compliance with, or obtaining waivers of, the terms, conditions and covenants of the respective agreements, including asset-eligibility requirements. |
Assets held as collateral that are not available to pay the Company’s general obligations as of December 31, 2017 consisted of:
Warehouse Facilities | Servicing Advance Facility | Subservicing Advance Liabilities (1) | MSRs Secured Liability (2) | ||||||||||||
(In millions) | |||||||||||||||
Restricted cash | $ | 3 | $ | 10 | $ | — | $ | — | |||||||
Servicing advances | — | 56 | 232 | — | |||||||||||
Mortgage loans held for sale (unpaid principal balance) | 233 | — | — | — | |||||||||||
Mortgage serving rights | — | — | — | 419 | |||||||||||
Total | $ | 236 | $ | 66 | $ | 232 | $ | 419 | |||||||
______________
(1) | Under the terms of certain subservicing arrangements, the subservicing counterparty is required to fund servicing advances for their respective portfolios of subserviced loans. A subservicing advance liability is recorded for cash received from the counterparty to fund advances and is repaid to the counterparty upon the collection of the mortgage servicing advance receivables. |
(2) | Represents MSRs that are accounted for as a secured borrowing arrangement. Refer to Note 1, 'Summary of Significant Accounting Policies' for additional information. |
99
The following table provides the contractual debt maturities as of December 31, 2017:
Warehouse Facilities | Servicing Advance Facility | Unsecured Debt | Total | ||||||||||||
(In millions) | |||||||||||||||
Within one year | $ | 220 | $ | 32 | $ | — | $ | 252 | |||||||
Between one and two years | — | — | 97 | 97 | |||||||||||
Between two and three years | — | — | — | — | |||||||||||
Between three and four years | — | — | 22 | 22 | |||||||||||
Between four and five years | — | — | — | — | |||||||||||
Thereafter | — | — | — | — | |||||||||||
$ | 220 | $ | 32 | $ | 119 | $ | 371 | ||||||||
See Note 16, 'Fair Value Measurements' for the measurement of the fair value of Debt.
Net Interest Expense
The following table summarizes the components of Net interest expense:
December 31, | |||||||||||
2017 | 2016 | 2015 | |||||||||
(In millions) | |||||||||||
Interest income | $ | 37 | $ | 43 | $ | 44 | |||||
Secured interest expense | (24 | ) | (33 | ) | (35 | ) | |||||
MSRs secured interest expense (1) | (29 | ) | — | — | |||||||
Unsecured interest expense | (20 | ) | (42 | ) | (55 | ) | |||||
Net interest expense | $ | (36 | ) | $ | (32 | ) | $ | (46 | ) | ||
_____________
(1) | MSRs secured interest expense is the implied interest cost on the MSRs secured liability. MSRs secured interest expense fully offsets the estimated yield on capitalized MSRs treated as a secured borrowing arrangement, which is included within Loan servicing income, net. |
Mortgage Warehouse Facilities |
Mortgage warehouse facilities primarily represents variable-rate asset-backed facilities to support the origination of mortgage loans, which provide creditors a collateralized interest in specific mortgage loans that meet the eligibility requirements under the terms of the facility. The source of repayment of the facilities is typically from the sale or securitization of the underlying loans into the secondary mortgage market. The Company evaluates its capacity needs for warehouse facilities, and adjusts the amount of available capacity under these facilities in response to the current mortgage environment and origination needs.
Committed repurchase facilities typically have up to a 364-day term. However, beginning in 2016 and throughout 2017, the Company entered into shorter term facilities with certain of its lenders to allow both the Company and the lender to evaluate facility needs and agreement terms that would be appropriate for the Company's new business model after the completion of its strategic actions. As of December 31, 2017, the Company has outstanding mortgage repurchase facilities with Barclays Bank PLC, Bank of America, N.A., and Wells Fargo Bank, N.A., with a range of maturity dates from January 31, 2018 to April 2, 2018. Upon expiration of these existing agreements, the Company expects to negotiate terms for repurchase facility commitments to meet its forecasted capacity needs.
On July 31, 2017, the committed mortgage repurchase facility of $100 million and the uncommitted mortgage repurchase facility of $100 million with Barclays Bank PLC were extended to January 31, 2018. On January 30, 2018, the Company extended the committed Barclay's warehouse facility through April 30, 2018 at the same committed capacity, and the uncommitted capacity was reduced to $25 million.
100
On December 1, 2017, the committed mortgage repurchase facilities of $200 million with Wells Fargo Bank were extended to April 2, 2018. On February 20, 2018, the committed capacity was reduced to $100 million at the Company's request.
On March 31, 2017, the committed mortgage repurchase facility of $150 million with Fannie Mae expired and was not renewed by mutual agreement. On April 30, 2017, the uncommitted mortgage repurchase facility was reduced to $200 million to better align capacity with anticipated needs.
On December 21, 2017, the committed repurchase facility with Bank of America was reduced to $75 million at the Company's request, and the facility was extended to March 31, 2018.
Servicing Advance Facility |
PHH Servicer Advance Receivables Trust 2013-1 (“PSART”), a special purpose bankruptcy remote trust was formed for the purpose of issuing non-recourse asset-backed notes, secured by servicing advance receivables. PSART was consolidated as a result of the determination that the Company is the primary beneficiary, as discussed in Note 17, 'Variable Interest Entities'.
On June 15, 2017, PSART extended the revolving period and revised the final maturity date of the note purchase agreement with Wells Fargo Bank for the Series 2015-1 variable funding notes to March 15, 2018 and reduced the aggregate maximum principal amount. On September 8, 2017, at the Company's request, the aggregate maximum principal amount was reduced to $65 million. PSART issues variable funding notes that have a revolving period, during which time the monthly collection of advances are applied to pay down the notes and create additional availability to fund advances. The notes bear interest, payable monthly, based on LIBOR plus an agreed-upon margin.
Unsecured Debt |
As of December 31, 2017, the Company’s unsecured debt obligations include series of Term notes which are senior unsecured and unsubordinated obligations that rank equally with all existing and future senior unsecured debt.
On June 19, 2017, the Company commenced a tender offer and consent solicitation to purchase for cash any and all of its outstanding Term Notes due in 2019 and due in 2021. The early tender offer included cash consideration of $1,100.00 for the 2019 Notes and $1,031.88 for the 2021 Notes for each $1,000 in principal amount (in dollars), plus accrued and unpaid interest. On July 3, 2017, $178 million of the 2019 Notes and $318 million of the 2021 Notes were tendered, and the Company repaid these notes for an aggregate $524 million in cash, plus accrued interest. On July 17, 2017, the tender offer expired with an insignificant amount of additional Term Notes being tendered. In connection with the tender offer, the Company recognized a loss of $34 million in Other Operating Expenses in the Consolidated Statements of Operations.
As of December 31, 2017, the Company's outstanding unsecured obligations were comprised of the following:
• | Term notes due 2019. The 7.375% 2019 Senior note series has $97 million of principal due September 1, 2019. Senior notes due 2019 are governed by an existing indenture dated January 17, 2012 with The Bank of New York Mellon Trust Company, N.A. as trustee. The notes are redeemable by the Company upon payment of a make-whole premium, in accordance with the optional redemption clause in the indenture. |
• | Term notes due 2021. The 6.375% 2021 Senior note series has $22 million of principal due August 15, 2021. Senior notes due 2021 are governed by an existing indenture dated January 17, 2012 with The Bank of New York Mellon Trust Company, N.A. as trustee. The notes are redeemable by the Company at any time after August 15, 2017 and in accordance with the optional redemption clause in the indenture. |
101
Debt Covenants |
Certain debt arrangements require the maintenance of certain financial ratios and contain other affirmative and negative covenants, termination events, conditions precedent to borrowing, and other restrictions, including, but not limited to, covenants relating to material adverse changes, consolidated net worth, leverage, liquidity, profitability, available committed mortgage warehouse borrowing capacity maintenance, restrictions on indebtedness of the Company and its material subsidiaries, mergers, liens, liquidations, and restrictions on certain types of payments, including dividends and stock repurchases. Certain other debt arrangements contain provisions that permit the Company or the counterparty to terminate the arrangement upon the occurrence of certain events including those described below.
Among other covenants, certain committed mortgage repurchase facilities require that the Company maintain: (i) net worth of at least $250 million as of December 31, 2017, and $150 million on the last day of each fiscal month thereafter; (ii) a ratio of indebtedness to tangible net worth no greater than 4.50 to 1; (iii) a ratio of unsecured indebtedness to tangible net worth of not more than 1.25 to 1; and (iv) maintenance of $100 million of cash and cash equivalents in excess of its liability for legal and regulatory matters as of December 31, 2017, and $70 million at all times thereafter. These covenants represent the most restrictive net worth, liquidity, and debt to equity covenants; however, certain other outstanding debt agreements contain liquidity and debt to equity covenants that are less restrictive.
Under certain of the Company’s financing, servicing, hedging and related agreements and instruments, the lenders or trustees have the right to notify the Company if they believe it has breached a covenant under the operative documents and may declare an event of default. If one or more notices of default were to be given, the Company believes it would have various periods in which to cure certain of such events of default. If the Company does not cure the events of default or obtain necessary waivers within the required time periods, the maturity of certain debt agreements could be accelerated and the ability to incur additional indebtedness could be restricted. In addition, an event of default or acceleration under certain agreements and instruments would trigger cross-default provisions under certain of the Company’s other agreements and instruments.
As of December 31, 2017, the Company was in compliance with all financial covenants related to its debt arrangements.
See Note 14, 'Stock-Related Matters' for information regarding restrictions on the Company’s ability to pay dividends pursuant to certain debt arrangements.
102
11. Pension and Other Post-Employment Benefits |
Defined Contribution Savings Plans. The Company and PHH Home Loans sponsor separate defined contribution savings plans that provide certain eligible employees an opportunity to accumulate funds for retirement and contributions of participating employees are matched on the basis specified by these plans. The costs for the matching contributions are included in Salaries and related expenses in the Consolidated Statements of Operations. Salaries and related expenses included contributions of $5 million, $7 million and $8 million for the years ended December 31, 2017, 2016 and 2015, respectively.
Defined Benefit Pension Plan and Other Post-Employment Benefits Plan. The Company sponsors a domestic non-contributory defined benefit pension plan, which covers certain current and former eligible employees. Benefits are based on an employee’s years of credited service and a percentage of final average compensation, or as otherwise described by the plan. In addition, a post-employment benefits plan is maintained for retiree health and welfare costs of certain eligible employees. Both the defined benefit pension plan and the other post-employment benefits plan are frozen, wherein the plans only accrue additional benefits for a very limited number of employees.
The following table shows the change in the benefit obligation, plan assets and funded status for the defined benefit pension plans:
Pension Benefits | Other Post-Employment Benefits | ||||||||||||||
2017 | 2016 | 2017 | 2016 | ||||||||||||
(In millions) | |||||||||||||||
Benefit obligation | $ | 50 | $ | 48 | $ | 1 | $ | 1 | |||||||
Fair value of plan assets | 40 | 38 | — | — | |||||||||||
Unfunded status recognized in Other liabilities | $ | (10 | ) | $ | (10 | ) | $ | (1 | ) | $ | (1 | ) | |||
Amounts recognized in Accumulated other comprehensive income | $ | 15 | $ | 16 | $ | — | $ | — | |||||||
The net periodic benefit cost related to the defined benefit pension plan was $1 million for each of the years ended December 31, 2017 and December 31, 2016, respectively and was included in Salaries and related expenses. The amount was not significant for the year ended December 31, 2015. The net periodic benefit costs related to the other post-employment benefit plan were not significant for each of the years ended December 31, 2017, 2016, and 2015.
As of December 31, 2017, future expected benefit payments to be made from the defined benefit pension plan’s assets, which reflect expected future service, are $2 million in each of the years ending December 31, 2018 and 2019, $3 million for each of the years ending December 31, 2020 through 2022, and $14 million for the subsequent five years ending December 31, 2027.
The Company’s policy is to contribute amounts to the defined benefit pension plan sufficient to meet minimum funding requirements as set forth in employee benefit and tax laws and additional amounts at the discretion of the Company. There were no contributions made to the plan for the years ended December 31, 2017 and 2016, and contributions are not expected to be significant for the year ended December 31, 2018.
103
12. Income Taxes |
Income Tax Provision
The following table summarizes Income tax benefit:
Year Ended December 31, | |||||||||||
2017 | 2016 | 2015 | |||||||||
(In millions) | |||||||||||
Current: | |||||||||||
Federal | $ | 42 | $ | — | $ | — | |||||
State | 1 | — | (1 | ) | |||||||
Change in income tax contingencies | (1 | ) | (2 | ) | — | ||||||
Total current income tax expense (benefit) | 42 | (2 | ) | (1 | ) | ||||||
Deferred: | |||||||||||
Federal | (102 | ) | (100 | ) | (79 | ) | |||||
State | (19 | ) | (9 | ) | (2 | ) | |||||
Total deferred income tax benefit | (121 | ) | (109 | ) | (81 | ) | |||||
Income tax benefit | $ | (79 | ) | $ | (111 | ) | $ | (82 | ) | ||
Deferred Taxes
Deferred tax assets and liabilities represent the basis differences between assets and liabilities measured for financial reporting versus for income tax returns' purposes. The following table summarizes the significant components of deferred tax assets and liabilities:
December 31, | |||||||
2017 | 2016 | ||||||
(In millions) | |||||||
Deferred tax assets: | |||||||
Federal loss carryforwards | $ | — | $ | 23 | |||
State loss carryforwards and credits | 48 | 39 | |||||
Reserves and allowances | 17 | 36 | |||||
Exit cost liability | 10 | 10 | |||||
Accrued legal and regulatory matters | 6 | 46 | |||||
Other accrued liabilities | 17 | 24 | |||||
Other | 4 | — | |||||
Gross deferred tax assets | 102 | 178 | |||||
Valuation allowance | (78 | ) | (44 | ) | |||
Deferred tax assets, net of valuation allowance | 24 | 134 | |||||
Deferred tax liabilities: | |||||||
Mortgage servicing rights(1) | 20 | 234 | |||||
Other | 4 | 1 | |||||
Deferred tax liabilities | 24 | 235 | |||||
Net deferred tax liability | $ | — | $ | 101 | |||
(1) | For the year ended December 31, 2017, the decrease in the MSR deferred tax liability is primarily a result of the Company's execution of the MSRs secured borrowing arrangement with New Residential that resulted in the sale of a substantial portion of the Company's MSR portfolio for tax purposes. |
104
The deferred tax balance represent the future tax asset or liability generated upon reversal of the differences between the tax basis and book basis of certain of the Company's assets and liabilities. The Company's net deferred tax assets are reduced by valuation allowances if it is more likely than not that some portion of the deferred tax asset will not be realized. This assessment includes the consideration of all available evidence, both positive and negative, using a "more likely than not" standard with respect to whether deferred tax assets will be realized. The Company's evaluation of the realizability of its net deferred tax asset as of December 31, 2017 resulted in a valuation allowance of $78 million to reduce the net deferred basis to zero, driven primarily by provisions in the Tax Cuts and Jobs Act (the “Tax Act”) that reduce the current federal income tax rate from 35% to 21%, and provisions that eliminate the Company's ability to carry back Federal net operating losses generated in taxable years beginning after December 31, 2017.
The deferred tax assets' valuation allowance also relates to state loss carryforwards and net non-loss deferred tax assets. The valuation allowance will be reduced when and if it is determined that it is more likely than not that all or a portion of the deferred tax assets will be realized. The Company's net deferred tax asset includes state loss carryforwards will expire from 2017 to 2038, if not utilized.
Effective Tax Rate
Total income taxes differ from the amount that would be computed by applying the U.S. federal statutory rate as follows:
Year Ended December 31, | |||||||||||
2017 | 2016 | 2015 | |||||||||
(In millions) | |||||||||||
Loss before income taxes | $ | (273 | ) | $ | (304 | ) | $ | (213 | ) | ||
Statutory federal income tax rate | 35 | % | 35 | % | 35 | % | |||||
Income taxes computed at statutory federal rate | $ | (96 | ) | $ | (106 | ) | $ | (75 | ) | ||
Impact of federal tax reform | 30 | — | — | ||||||||
Changes in rate and apportionment factors | 13 | 1 | 3 | ||||||||
Noncontrolling interest | (8 | ) | (3 | ) | (5 | ) | |||||
Changes in valuation allowance | (13 | ) | 5 | 10 | |||||||
State and local income taxes, net of federal tax benefits | (18 | ) | (15 | ) | (14 | ) | |||||
Liabilities for income tax contingencies | 3 | (2 | ) | — | |||||||
Nondeductible expenses | 7 | 6 | 6 | ||||||||
Other | 3 | 3 | (7 | ) | |||||||
Income tax benefit | $ | (79 | ) | $ | (111 | ) | $ | (82 | ) | ||
Effective tax rate | (28.9 | )% | (36.7 | )% | (38.4 | )% | |||||
Impact of federal tax reform. Represents the impact of the Tax Act that was enacted on December 22, 2017. Under ASC 740, the effects of changes in tax rates and laws are recognized in the period in which the new legislation is enacted. For the year ended December 31, 2017, the impact of the tax reform is $30 million consisting of revaluation of its net deferred tax asset and an increase to the valuation allowance, as discussed further above, driven by provisions in the act that reduce the current federal income tax rate and eliminate the net operating loss carryback.
Changes in rate and apportionment factors. Represents the impact to the effective tax rate from deferred tax items for changes in apportionment factors and state tax rate and reflect the impact of applying statutory changes to apportionment weight, apportionment sourcing and corporate income tax rates that were enacted by various states. For the year ended December 31, 2017, the impact includes the shift in state apportionment of deferred tax items driven in part by the Company's executed MSR sales and other business changes.
Noncontrolling interest. Represents the impact to the effective tax rate from Realogy Corporation’s portion of income taxes related to the income or loss attributable to PHH Home Loans. The impact is driven by PHH Home Loans’ election to report as a partnership for federal and state income tax purposes, whereby, the tax expense is reported by the individual LLC members. Accordingly, the Company’s Income tax expense or benefit includes only its proportionate share of the income tax related to the income or loss generated by PHH Home Loans.
105
Changes in valuation allowance. Excludes changes in valuation allowance as a result of the Impact of federal tax reform, discussed above. Represents other impacts to the effective tax rate from state net operating loss ("NOL") carryforwards utilized or generated during the year and certain cumulative non NOL deferred tax assets for which the Company believes it is more likely than not that the amounts will not be realized. For the year ended December 31, 2017, state tax losses utilized were $6 million and the remaining changes were from non NOL deferred tax assets for which a valuation allowance is not warranted. For the year ended December 31, 2016, state tax losses generated were $4 million and the remaining changes were from non NOL deferred tax assets for which a valuation allowance is warranted.
State and local income taxes, net of federal tax benefits. Represents the impact to the effective tax rate from the pre-tax income or loss as well as the mix of income or loss from the operations by entity and state income tax jurisdiction. For the year ended December 31, 2017 as compared to 2016, the effective state tax rate is higher due to the Company’s losses from its operations in multiple jurisdictions that are taxed at a higher apportionments.
Liabilities for income tax contingencies. Represents the impact to the effective tax rate from changes in the liabilities for income tax contingencies associated with new uncertain tax positions taken during the period or the resolution and settlement of prior uncertain tax positions with various taxing authorities. For the year ended December 31, 2017, the change was due to provisions in the Tax Act that resulted in changes to the federal tax rate applied to positions taken in prior periods. For the year ended December 31, 2016, the change was driven by the expiration of statute of limitations related to tax positions taken in prior years.
Nondeductible expenses. For the years ended December 31, 2017 and 2016, the amount represents the impact to the effective tax rate from nondeductible expenses primarily related to legal and regulatory matters of $3 million and $6 million, respectively. Additionally for 2017, $4 million tax deficiencies relates to stock buyback expenses, and non-deductible meals and entertainment expenses.
Other. For the years ended December 31, 2017 and 2016, the amount was driven from adjustments resulting from the comparison of items included in the prior year provision to the final income tax returns.
Unrecognized Income Tax Benefits
Unrecognized income tax benefits are recognized related to tax positions included in: (i) previously filed income tax returns and (ii) financial results expected to be included in income tax returns to be filed for periods through the date of the Consolidated Financial Statements. The Company recognizes tax benefits from uncertain income tax positions only if it is more likely than not that the tax position will be sustained on examination by the taxing authority based on the technical merits of the position. An uncertain income tax position that meets the “more likely than not” recognition threshold is then measured to determine the amount of the benefit to recognize.
An unrecognized tax benefit, or a portion of an unrecognized tax benefit, is presented in the Consolidated Balance Sheets within Other liabilities to the extent a NOL carryforward is not available at the reporting date to settle any additional income taxes resulting from the tax position. In other instances where a NOL carryforward is available, the amounts are recorded as a reduction to the Company’s deferred tax liabilities in the Consolidated Balance Sheets.
Activity related to the Company's unrecognized income tax benefits (including the liability for potential payment of interest and penalties) consisted of:
Year Ended December 31, | |||||||||||
2017 | 2016 | 2015 | |||||||||
(In millions) | |||||||||||
Balance, beginning of period | $ | 8 | $ | 11 | $ | 11 | |||||
Activity related to tax positions taken during the current year | — | — | — | ||||||||
Activity related to tax positions taken during prior years | 3 | (3 | ) | — | |||||||
Balance, end of period | $ | 11 | $ | 8 | $ | 11 | |||||
The estimated liability for the potential payment of interest and penalties included in the liability for unrecognized income tax benefits was $2 million and $2 million as of both December 31, 2017 and 2016, respectively.
106
The amount of unrecognized income tax benefits may change by $11 million in the next twelve months primarily due to the expiration of the audit period for income tax positions taken during prior years. The effective income tax rate would be positively impacted by $11 million as of both December 31, 2017 and 2015 in the event of a favorable resolution of income tax contingencies or reductions in valuation allowances and $8 million as of December 31, 2016.
The Company and its subsidiaries are currently under examination by the IRS for the tax years ended December 31, 2016, 2015 and 2014 and remain subject to examination for the year ended December 2017. As of December 31, 2017, foreign and state income tax filings were subject to examination for periods including and subsequent to 2009, dependent upon jurisdiction.
13. Commitments and Contingencies |
Legal Contingencies
The Company and its subsidiaries are routinely, and currently, defendants in various legal proceedings that arise in the ordinary course of PHH's business, including class actions and other private and civil litigation. These proceedings are generally based on alleged violations of consumer protection laws (including the Real Estate Settlement Procedures Act ("RESPA")), employment laws and contractual obligations. Similar to other mortgage loan originators and servicers, the Company and its subsidiaries are also routinely, and currently, subject to government and regulatory examinations, investigations and inquiries or other requests for information. The resolution of these various legal and regulatory matters may result in adverse judgments, fines, penalties, injunctions and other relief against the Company as well as monetary payments or other agreements and obligations. In particular, legal proceedings brought under RESPA and other federal or state consumer protection laws that are ongoing, or may arise from time to time, may include the award of treble and other damages substantially in excess of actual losses, attorneys' fees, costs and disbursements, and other consumer and injunctive relief. These proceedings and matters are at varying procedural stages and the Company may engage in settlement discussions on certain matters in order to avoid the additional costs of engaging in litigation.
The outcome of legal and regulatory matters is difficult to predict or estimate and the ultimate time to resolve these matters may be protracted. In addition, the outcome of any legal proceeding or governmental and regulatory matter may affect the outcome of other pending legal proceedings or governmental and regulatory matters.
A liability is established for legal and regulatory contingencies when it is probable that a loss has been incurred and the amount of such loss can be reasonably estimated. The Company recognizes legal costs associated with loss contingencies as they are incurred. In light of the inherent uncertainties involved in litigation, legal proceedings and other governmental and regulatory matters, it is not always possible to determine a reasonable estimate of the amount of a probable loss, and the Company may estimate a range of possible loss for consideration in its estimates. The estimates are based upon currently available information and involve significant judgment taking into account the varying stages and inherent uncertainties of such matters. Accordingly, the Company’s estimates may change from time to time and such changes may be material to the consolidated financial results.
As of December 31, 2017, the Company’s recorded liability associated with legal and regulatory contingencies was $20 million and is presented in Other liabilities in the Consolidated Balance Sheets. Given the inherent uncertainties and status of the Company’s outstanding legal proceedings, the range of reasonably possible losses cannot be estimated for all matters. For matters where the Company can estimate the range, the Company believes reasonably possible losses in excess of recorded liability are not significant as of December 31, 2017. The Company is currently in discussions with its insurance carriers about an insurance claim related to certain previously disclosed legal and regulatory settlements. Any insurance proceeds represent a gain contingency and will be recognized if, and when, realized or realizable and earned.
There can be no assurance that the ultimate resolution of these matters will not result in losses in excess of the Company’s recorded liability, or in excess of the estimate of reasonably possible losses. As a result, the ultimate resolution of any particular legal matter, or matters, could be material to the Company’s results of operations or cash flows for the period in which such matter is resolved.
The following are descriptions of the Company’s significant legal and regulatory matters that are pending or were substantially resolved through settlement agreements entered into during the year ended December 31, 2017:
CFPB Enforcement Action. In January 2014, the Bureau of Consumer Financial Protection (the "CFPB") initiated an administrative proceeding alleging that the Company’s reinsurance activities, including its mortgage insurance premium ceding
107
practices, have violated certain provisions of RESPA and other laws enforced by the CFPB. Through its reinsurance subsidiaries, the Company assumed risk in exchange for premiums ceded from primary mortgage insurance companies.
In June 2015, the Director of the CFPB issued a final order requiring the Company to pay $109 million, based upon the gross reinsurance premiums the Company received on or after July 21, 2008. Subsequently, the Company filed an appeal to the United States Court of Appeals for the District of Columbia Circuit (the "Court of Appeals").
In October 2016, the Court of Appeals issued its decision, vacating the decision of the Director of the CFPB, and finding in favor of the Company’s arguments, among others, around the correct interpretations of Section 8 of RESPA, the applicability of prior HUD interpretations around captive re-insurance and the applicability of statute of limitations to administrative enforcement proceedings at the CFPB.
In February 2017, the Court of Appeals granted the CFPB's request to rehear the case en banc and oral arguments took place in May 2017. In January 2018, the en banc court of the United States Court of Appeals for the District of Columbia Circuit reinstated the October 2016 panel decision as it related to the RESPA issues, which included vacating the CFPB’s order imposing $109 million in disgorgement penalties. In February 2018, the en banc court remanded the matter back to the CFPB for further proceedings in compliance with the reinstated panel opinion. The Company continues to believe that it complied with RESPA and other laws applicable to our former mortgage reinsurance activities in all respects, and with respect to the remand, the Company will continue to present, if necessary, the facts and evidence to support its position that mortgage insurers did not pay more than reasonable market value to PHH affiliated reinsurers.
Given the nature of this matter and the current status, the Company cannot estimate the amount of loss, or a range of possible losses, if any, in connection with this matter.
MMC Examination. The Company underwent a regulatory examination by a multistate coalition of certain mortgage banking regulators (the “MMC”) and such regulators have alleged various violations of federal and state consumer protection and other laws related to the Company’s legacy mortgage servicing practices. In July 2015, the Company received a settlement proposal from the MMC, proposing payments to certain borrowers nationwide where foreclosure proceedings were either referred to a foreclosure attorney or completed during 2009 through 2012, as well as other consumer relief and administrative penalties. In addition, the proposal would require that the Company comply with national servicing standards, submit its servicing activities to monitoring for compliance, and other injunctive relief.
In the fourth quarter of 2017, the Company entered into a settlement agreement with a multistate coalition of certain mortgage banking regulators ("MMC") and consent orders with certain state attorneys general to resolve and close out findings from the MMC examination, without any admission of liability. The settlements cover mortgage loan servicing practices, including foreclosure activities, occurring between January 1, 2009 and December 31, 2012. Under the terms of the settlement, the Company will pay approximately $45 million in aggregate, of which $38 million was paid during the fourth quarter of 2017. The remaining settlement amount not yet paid is included in the Company's recorded liability as of December 31, 2017. In addition, under the terms of the settlements, the Company agreed to comply with certain servicing standards, to conduct testing of compliance with such servicing standards for a period of three years, and to report to the MMC regarding the same.
HUD Subpoenas. The Company has previously disclosed that it had received document subpoenas from the Office of Inspector General of the U.S. Department of Housing and Urban Development (“HUD”) requesting production of certain documents related to, among other things, the Company’s origination and underwriting process for loans insured by the Federal Housing Administration (“FHA”) during the period between January 1, 2006 and December 31, 2011. As part of the investigation, HUD also requested documents related to a small sample of loans originated during this period. The Company also previously disclosed that this investigation could lead to a demand or claim under the False Claims Act, which allows for civil penalties and treble damages substantially in excess of actual losses, that the Company was cooperating in the investigation, and that the Company had engaged in substantive settlement discussions with the government towards resolving this matter.
On August 8, 2017 the Company announced it reached a settlement of this matter with the U.S. Department of Justice for $65 million without any admission of liability, which amount was paid during the third quarter of 2017.
108
Other Subpoenas and Investigations. The Company previously disclosed that it had received document subpoenas from the U.S. Attorney’s Offices for the Southern and Eastern Districts of New York. The subpoenas requested production of certain documents related to, among other things: (i) foreclosure expenses that the Company incurred in connection with the foreclosure of loans insured or guaranteed by FHA, Fannie Mae or Freddie Mac and (ii) the origination and underwriting of loans sold pursuant to programs sponsored by Fannie Mae, Freddie Mac or Ginnie Mae.
In addition, in October 2014, the Company received a document subpoena from the Office of the Inspector General of the Federal Housing Financing Agency (the “FHFA”) requesting production of certain documents related to, among other things, its origination, underwriting and quality control processes for loans sold to Fannie Mae and Freddie Mac.
On August 8, 2017, the Company announced that, with respect to the investigations involving the U.S. Attorney’s Office for the Eastern District of New York and the Office of Inspector General of the FHFA, it reached a settlement of these matters with the U.S. Department of Justice, without any admission of liability, for $9.5 million, which was paid during the third quarter of 2017.
There can be no assurance that claims or litigation will not arise from the inquiry of the U.S. Attorney’s Office for the Southern District of New York, or that damages and penalties, will not be incurred in connection with that matter.
Lender-Placed Insurance. The Company previously disclosed it was subject to litigation alleging that its servicing practices around lender-placed insurance were not in compliance with applicable laws. Through its mortgage subsidiary, the Company did have certain outsourcing arrangements for the purchase of lender-placed hazard insurance for borrowers whose coverage had lapsed. The Company believes that it has meritorious defenses to these allegations; however, in January 2017, the Company entered into an agreement to settle outstanding litigation relating to this matter and the court approved the settlement in July 2017. The Company paid a majority of the settlement costs during the third quarter of 2017, while the remaining costs yet to be paid are included in the recorded liability as of December 31, 2017.
Repurchase and Foreclosure-Related Reserves
Representations and warranties are provided to investors and insurers on a significant portion of loans sold, and are also assumed on purchased mortgage servicing rights for loans that are owned by the Agencies or included in Agency-guaranteed securities. In the event of a breach of these representations and warranties, the Company may be required to repurchase the mortgage loan or indemnify the investor against loss. For conventional loans, if there is no breach of a representation and warranty provision, there is no obligation to repurchase the loan or indemnify the investor against loss. The Company has limited exposure related to VA and FHA insured loans. In limited circumstances, the full risk of loss on loans sold is retained to the extent the liquidation of the underlying collateral is insufficient. In some instances where the Company has purchased loans from third parties, it may have the ability to recover the loss from the third party originator. Repurchase and foreclosure-related reserves are maintained for probable losses related to repurchase and indemnification obligations and for on-balance sheet loans in foreclosure and real estate owned.
A summary of the activity in repurchase and foreclosure-related reserves is as follows:
Year Ended December 31, | |||||||
2017 | 2016 | ||||||
(In millions) | |||||||
Balance, beginning of period | $ | 73 | $ | 89 | |||
Realized losses | (34 | ) | (42 | ) | |||
Transfer of reserves (1) | (5 | ) | — | ||||
Increase in reserves due to: | |||||||
Changes in assumptions | 3 | 19 | |||||
New loan sales | 3 | 7 | |||||
Balance, end of period | $ | 40 | $ | 73 | |||
(1) | Represents reserves associated with certain Mortgage loans in foreclosure that were transferred to Mortgage loans held for sale and subsequently sold during the year ended December 31, 2017 in connection with the Company's marketing those assets for sale. |
109
Repurchase and foreclosure-related reserves consist of the following:
December 31, | |||||||
2017 | 2016 | ||||||
(In millions) | |||||||
Loan repurchase and indemnification liability | $ | 29 | $ | 49 | |||
Adjustment to value for real estate owned | 9 | 14 | |||||
Allowance for probable foreclosure losses | 2 | 10 | |||||
Total | $ | 40 | $ | 73 | |||
Loan Repurchases and Indemnifications
As of December 31, 2017 and 2016, liabilities for probable losses related to repurchase and indemnification obligations of $29 million and $49 million, respectively, are presented in the Consolidated Balance Sheets. The liability for loan repurchases and indemnifications represents management’s estimate of probable losses based on the best information available and requires the application of a significant level of judgment and the use of a number of assumptions including borrower performance, investor demand patterns, expected relief from the expiration of repurchase obligations, the expected success rate in defending against requests and estimated loss severities.
In December 2016, the Company entered into resolution agreements with Fannie Mae and Freddie Mac to resolve substantially all representation and warranty exposure related to the sale of mortgage loans that were originated and delivered prior to September 30, 2016 and November 30, 2016, respectively. The resolution agreements do not cover loans with certain defects, which include but are not limited to, loans with certain title issues or with violations of law. After executing the resolution agreements, the Company's remaining exposure to repurchase and indemnification claims consists primarily of estimates for claims from private investors and newly originated mortgage loans, losses for specific non-performing loans where the Company believes it will be required to indemnify the investor and losses from government mortgage insurance programs. As of December 31, 2017, the estimated amount of reasonably possible losses in excess of the recorded liability was not significant.
The maximum amount of losses cannot be estimated because the Company does not service all of the loans for which it has provided representations or warranties. As of December 31, 2017, $46 million of loans have been identified in which the Company has full risk of loss or has identified a breach of representation and warranty provisions; 23% of which were at least 90 days delinquent (calculated based upon the unpaid principal balance of the loans).
Net Worth Requirements
In addition to the capital requirements of the Company as outlined in Note 10, 'Debt and Borrowing Arrangements', certain subsidiaries of the Company are subject to various regulatory capital requirements as a result of their mortgage origination and servicing activities. The Company’s wholly owned subsidiary, PHH Mortgage Corporation (“PHH Mortgage”), is subject to various regulatory capital requirements administered by the Department of Housing and Urban Development (“HUD”), which governs non-supervised, direct endorsement mortgagees, and Ginnie Mae, Fannie Mae and Freddie Mac, which sponsor programs that govern a significant portion of PHH Mortgage's mortgage loans sold and servicing activities. Additionally, PHH Mortgage is required to maintain minimum net worth requirements for many of the states in which it sells and services loans. Each state has its own minimum net worth requirement; however, none of the state requirements are material to its financial statements.
Failure to meet minimum capital requirements can result in certain mandatory and possibly additional discretionary remedial actions by regulators that, if undertaken, could: (i) remove the PHH Mortgage’s ability to sell and service loans to or on behalf of the Agencies; and (ii) have a direct material effect on the Company’s financial statements, results of operations and cash flows.
In accordance with the regulatory capital guidelines, PHH Mortgage must meet specific quantitative measures of cash, assets, liabilities, profitability and certain off-balance sheet items calculated under regulatory accounting practices. Further, changes in regulatory and accounting standards, as well as the impact of future events on PHH Mortgage’s results, may significantly affect the Company’s net worth adequacy.
Among PHH Mortgage’s various capital requirements related to its outstanding mortgage origination and servicing agreements and other third-party agreements, including debt covenants, the most restrictive of these requires PHH Mortgage to maintain a
110
minimum net worth balance of $100 million as of December 31, 2017. As of December 31, 2017, PHH Mortgage’s actual net worth was $381 million and the Company was in compliance with the requirements.
Lease and Purchase Commitments
The Company is committed to making rental payments under noncancelable operating related to various facilities and equipment. In addition, during the normal course of business, various commitments are made to purchase goods or services from specific suppliers, including those related to capital expenditures.
During the years ended December 31, 2017, 2016, and 2015, rental expense of $19 million, $22 million, and $22 million, respectively, was recorded in Occupancy and other office expenses in the Consolidated Statements of Operations.
The following table summarizes the Company’s commitments as of December 31, 2017:
Future Minimum Operating Lease Payments(1) | Purchase Commitments | ||||||
(In millions) | |||||||
2018 | $ | 13 | $ | 6 | |||
2019 | 10 | 5 | |||||
2020 | 9 | — | |||||
2021 | 8 | — | |||||
2022 | 8 | — | |||||
Thereafter | — | — | |||||
Total | $ | 48 | $ | 11 | |||
________________
(1) | Excludes $6 million of minimum sublease income due in the future under noncancelable subleases. |
Off-Balance Sheet Arrangements and Guarantees
In the ordinary course of business, numerous agreements are entered into that contain guarantees and indemnities where a third-party is indemnified for breaches of representations and warranties. Such guarantees or indemnifications are granted under various agreements, including those governing leases of real estate, access to credit facilities, use of derivatives and issuances of debt or equity securities. The guarantees or indemnifications issued are for the benefit of the buyers in sale agreements and sellers in purchase agreements, landlords in lease contracts, financial institutions in credit facility arrangements and derivative contracts and underwriters in debt or equity security issuances.
While some guarantees extend only for the duration of the underlying agreement, many survive the expiration of the term of the agreement or extend into perpetuity (unless subject to a legal statute of limitations). There are no specific limitations on the maximum potential amount of future payments that the Company could be required to make under these guarantees, and the maximum potential amount of future payments cannot be estimated. With respect to certain guarantees, such as indemnifications of landlords against third-party claims, insurance coverage is maintained that mitigates any potential payments.
Guarantees related to Mortgage Warehouse Debt. In connection with certain Mortgage warehouse borrowing arrangements, the Company has entered into agreements to unconditionally and irrevocably guarantee payment on the obligations of its subsidiaries.
Lease Arrangements. On February 8, 2017, the Company entered into an assignment with LenderLive Network, LLC ("LenderLive") of its Jacksonville, Florida facility lease. Under the terms of the original facility lease, PHH remains jointly and severally obligated with LenderLive for performance under the lease agreement. As of December 31, 2017, the total amount of potential future lease payments under this guarantee was $13 million; however, the Company does not believe any amount of loss under this guarantee is probable.
During 2017, the Company entered into assignments with Guaranteed Rate Affinity, LLC ("GRA") for certain of PHH Home Loans' facility leases that were associated with the location transfers under the asset sale agreement. Refer to Note 17, 'Variable Interest Entities' for further information on the sale transactions. Under the terms of these original facility leases, PHH remains jointly and severally obligated with GRA for performance under certain lease agreements. As of December 31, 2017, the total
111
amount of potential future lease payments under these guarantees was approximately $2 million, and the Company does not believe any amount of loss under this guarantee is probable.
14. Stock-Related Matters |
Convertible Note Conversion
In June 2015, the Company completed an offer to exchange its Convertible notes due in 2017, and the amount by which the conversion value exceeded the principal of the converted notes was settled in shares. A total of 10,075,653 shares were issued under the exchange offer for the convertible debt.
Share Repurchase Programs
Accelerated Share Repurchase ("ASR") Programs. In 2014, the Company entered into ASR agreements to repurchase PHH's Common stock pursuant to a Collared ASR agreement and an Uncollared ASR agreement. The Company completed the ASR programs after the Company received the final 1,574,252 shares in March 2015.
Open Market Purchases. During 2015, the Company paid $77 million to retire 4,841,267 shares and, in January 2016, the Company paid an additional $23 million to retire 1,508,772 shares, in each case pursuant to a previously announced open market share repurchase program.
On May 3, 2017, the Company was authorized to purchase up to $100 million in open market purchases. During 2017, the Company paid $34 million to retire 2,450,466 shares. In August 2017, the Company’s Board of Directors authorized an increase in Common stock share repurchases up to $300 million, and in September 2017, the Company completed $267 million in repurchases from our modified "Dutch auction" tender offer retiring 18,762,962 shares.
On November 5, 2017, the Company's Board of Directors provided an authorization for up to $100 million of share repurchases, and there has been no share repurchase activity under this authorization for the year ended December 31, 2017.
Restrictions on Share-Related Payments
As of December 31, 2017, the Company is not prohibited in its ability to declare or pay dividends on account of its Common stock. The Company has not declared or paid cash dividends on its Common stock since it began operating as an independent, publicly traded company in 2005. However, pursuant to the Agreement and Plan of Merger dated as of February 27, 2018 the Company entered into with Ocwen and POMS Corp, we are not permitted to declare or pay dividends, or repurchase our shares, without the prior consent of Ocwen. Refer to Note 20, 'Subsequent Events' for information regarding a proposed Merger with Ocwen Financial Corporation.
The provisions of the Company's debt arrangements, capital requirements of the Company's operating subsidiaries and other legal requirements and regulatory constraints may restrict the Company from making such share-related payments. Limitations and restrictions on the Company’s ability to make share-related payments include but are not limited to maintaining compliance with the financial covenants contained in certain subsidiaries’ mortgage warehouse funding agreements, including but not limited to: (i) the maintenance of net worth of at least $250 million as of December 31, 2017, and $150 million on the last day of each fiscal month thereafter; and (ii) a ratio of unsecured indebtedness to tangible net worth of no greater than 1.25 to 1.
In addition, the Company is limited in the amount of share-related payments that can be distributed due to capital that is required to be maintained at its subsidiaries. The amount of intercompany dividends, share-related payments and other fund transfers that certain of the Company’s subsidiaries can declare or distribute to the Company or to other consolidated subsidiaries (and ultimately to the Company) is limited due to provisions of their debt arrangements, capital requirements, and other legal requirements and regulatory constraints. The aggregate restricted net assets of these subsidiaries totaled $102 million as of December 31, 2017.
112
15. Stock-Based Compensation |
The PHH Corporation 2014 Equity and Incentive Plan (the “Plan”) governs awards of share based compensation. The plan allows awards in the form of stock options, stock appreciation rights, restricted stock units and other stock- or cash-based awards. The aggregate number of shares of PHH Common stock available to be issued under the Plan is 8,406,180, of which 7,183,901 were still available for grant as of December 31, 2017. The Company's outstanding awards consist of the following:
• | Stock Options are granted with exercise prices at the fair market value of the Company’s shares of Common stock, which is considered equal to the closing share price on the date of grant. Stock option awards have a maximum contractual term of ten years from the grant date; however, the awards generally contain provisions that limit the exercise date, to the extent vested on the date of termination, for a period of one year from the date of termination or until the expiration date, if earlier. |
• | Restricted stock units (“RSUs”) are classified as equity awards and include service-based and market-based restricted stock units to purchase shares of Common stock. RSUs entitle employees to receive one share of the Company's Common stock upon the vesting of each RSU. |
• | Restricted cash units (“RCUs”) are classified as liability awards and include service-based and market-based restricted cash units to be settled in cash under the Plan. RCUs entitle employees to receive a cash payout equal to the closing share price (on the vesting date) of one share of common stock for each unit granted. |
The following table summarizes expenses related to stock-based compensation arrangements recorded in the Consolidated Statements of Operations:
Year Ended December 31, | |||||||||||
2017 | 2016 | 2015 | |||||||||
(In millions) | |||||||||||
Salaries and related expenses | |||||||||||
Stock-based compensation expense for equity awards | $ | 5 | $ | 9 | $ | 9 | |||||
Stock-based compensation expense for liability awards | 1 | 1 | 2 | ||||||||
Exit and disposal costs | |||||||||||
Stock-based compensation expense for liability awards (1) | 7 | — | — | ||||||||
Income tax benefit | |||||||||||
Benefit related to stock-based compensation expense | (5 | ) | (4 | ) | (4 | ) | |||||
Stock-based compensation expense, net of income taxes | $ | 8 | $ | 6 | $ | 7 | |||||
______________
(1) | Includes $4 million of expense associated with the modification of awards such that the compensation cost to be recorded for the liability classified award is at least equal to the amount that would be recognized if the award had retained its equity classification. |
Equity Awards
Awards granted by the Company under the Plan that are expected to be settled in shares of its Common stock include Stock Options and RSUs. All outstanding and unvested RSUs have vesting conditions pursuant to a change in control. In addition, RSUs are granted to non-employee Directors as part of their compensation for services rendered as members of the Company’s Board of Directors. New shares of Common stock are issued to employees and Directors to satisfy the stock option exercise and RSU conversion obligations.
Stock Options
There were no options granted during the years ended December 31, 2017, 2016 or 2015. There were no options exercised during the years ended December 31, 2017 or 2016, respectively. The intrinsic value of options exercised during the year ended December 31, 2015 was $1 million.
113
The following table summarizes information about stock options for the year ended December 31, 2017:
Number of Options | Weighted- Average Exercise Price | Weighted- Average Remaining Contractual Term (In years) | Aggregate Intrinsic Value (In millions) | |||||||||
Outstanding and exercisable at January 1, 2017 | 901,310 | $ | 17.85 | |||||||||
Outstanding and exercisable at December 31, 2017 (1) | 901,310 | $ | 17.85 | 0.9 | $ | — | ||||||
_____________________
(1) | There is no amount of unrecognized compensation cost related to outstanding stock options as of December 31, 2017. |
Restricted Stock Units
RSUs are granted with vesting conditions based on fulfillment of a service condition (generally up to three years from the grant date) and may also require achievement of certain market-based targets associated with the Company's stock price. Expense for equity-based awards with market or service conditions is recognized over the service period based on the grant-date fair value of the award. As of December 31, 2017, there was $1 million of unrecognized compensation cost related to outstanding and unvested equity-based RSUs expected to be recognized over a weighted-average period of 1.4 years.
The following tables summarize restricted stock unit activity for the year ended December 31, 2017:
Number of RSUs | Weighted- Average Grant-Date Fair Value | |||||
Market-based RSUs | ||||||
Outstanding at January 1, 2017 | 625,308 | $ | 13.65 | |||
Canceled due to modification of award | (501,129 | ) | 13.11 | |||
Canceled due to non-achievement of market condition | (53,754 | ) | 18.67 | |||
Outstanding at December 31, 2017 | 70,425 | $ | 13.67 | |||
RSUs expected to be converted into shares of Common stock (1) | — | $ | 13.67 | |||
Service-based RSUs | ||||||
Outstanding at January 1, 2017 | 885,117 | $ | 15.48 | |||
Granted (2) | 56,958 | 14.07 | ||||
Canceled due to modification of award | (489,561 | ) | 14.24 | |||
Converted | (268,282 | ) | 17.95 | |||
Outstanding at December 31, 2017 | 184,232 | $ | 16.02 | |||
RSUs expected to be converted into shares of Common stock | 184,232 | $ | 16.02 | |||
_____________________
(1) | The performance criteria impact the number of awards that may vest. The number of RSUs related to these market-based awards represents the expected number to be earned based upon if the contingency was met as of December 31, 2017. |
(2) | Represents RSUs earned by non-employee Directors for services rendered as members of the Board of Directors. |
Granted. During 2017, there were no RSUs awarded to executives with market-based vesting conditions. During 2016 and 2015, certain executives were awarded RSUs with market-based vesting conditions with a weighted-average grant-date fair value of $13.01 and $18.67, respectively. The weighted-average grant-date fair value of these market-based RSUs was estimated using a Monte Carlo simulation valuation model with the following assumptions:
December 31, | |||||||
2016 | 2015 | ||||||
Grant date stock price | $ | 13.00 | $ | 24.24 | |||
Risk-free interest rate | 1.09 | % | 0.94 | % | |||
Expected volatility | 45.7 | % | 30.2 | % | |||
Dividend yield | — | — | |||||
114
The risk-free interest rate reflected the yield on zero-coupon Treasury securities with a term that approximated the expected life of the RSUs. The expected volatility was based on historical volatility of the Company’s Common stock.
Modified. During the first quarter of 2017, the Company announced several leadership changes that would occur throughout 2017. The outstanding equity awards of these 8 executives had provisions in which the vested award would be settled in cash due to a separation from service. The Company determined the cash settlement of the award became probable upon the announced leadership transition dates. As a result, the Company determined these awards should be classified as a liability, and the change in classification was accounted for as a modification. During the year ended December 31, 2017, there was no incremental compensation cost recognized from the modified awards.
Converted. The total fair value of RSUs converted into shares of Common stock was $3 million for the year ended December 31, 2017, and $2 million for each of the years ended December 31, 2016 and 2015.
Liability Awards
Modified. As previously described, the Company determined certain outstanding equity awards associated with the leadership changes during 2017 should be classified as a liability, and the change in classification was accounted for as a modification. As of December 31, 2017, the amount accrued related to the expected payout of modified awards was $6 million which was recorded within the Exit cost liability in the Consolidated Balance Sheets. As of December 31, 2017, there was no unrecognized compensation cost related to the modified awards.
During the year ended December 31, 2017, the total amount of cash paid for modified share-based liability awards was $1 million.
Existing. RCU awards granted by the Company under the Plan that are expected to be settled in cash are recorded as liabilities within Accounts payable and accrued expenses in the Consolidated Balance Sheets. RCUs are settled with a cash payment for each unit vested based on the closing share price on the vesting date and generally vest over three years beginning on the first anniversary of the date of grant. As of December 31, 2017, the amount accrued related to the expected payout for existing liability awards within Accounts payable and accrued expenses in the Consolidated Balance Sheets was not significant, and as December 31, 2016, the amount accrued was $1 million.
Expense for liability awards is recognized based on a re-measurement of the fair value of the awards at the end of each reporting period, including an estimate of the expected achievement of market conditions if applicable. As of December 31, 2017, there was an insignificant amount of unrecognized compensation cost related to outstanding and unvested liability-based RCUs that will be recognized over the remaining service period.
The total amount of cash paid for existing share-based liability awards was not significant for the year ended December 31, 2017, and was $3 million for the year ended December 31, 2016.
16. Fair Value Measurements |
Fair value is based on quoted market prices, where available. If quoted prices are not available, fair value is estimated based upon other observable inputs. Unobservable inputs are used when observable inputs are not available and are based upon judgments and assumptions, which are the Company’s assessment of the assumptions market participants would use in pricing the asset or liability. These inputs may include assumptions about risk, counterparty credit quality, the Company’s creditworthiness and liquidity and are developed based on the best information available.
A three-level valuation hierarchy is used to classify inputs into the measurement of assets and liabilities at fair value. The valuation hierarchy is based upon the relative reliability and availability to market participants of inputs for the valuation of an asset or liability as of the measurement date. Level One represents the highest level based upon unadjusted quoted prices to Level Three which are based upon unobservable inputs that reflect the assumptions a market participant would use in pricing the asset or liability. When the valuation technique used in determining fair value of an asset or liability utilizes inputs from different levels of the hierarchy, the level in which the asset or liability its entirety is categorized is based upon the lowest level input that is significant to the measurement.
115
The Company updates the valuation of each instrument recorded at fair value on a quarterly basis, evaluating all available observable information, which may include current market prices or bids, recent trade activity, changes in the levels of market activity and benchmarking of industry data. The assessment also includes consideration of identifying the valuation approach that would be used currently by market participants. If it is determined that a change in valuation technique or its application is appropriate, or if there are other changes in availability of observable data or market activity, the current methodology will be analyzed to determine if a transfer between levels of the valuation hierarchy is appropriate. Such reclassifications are reported as transfers into or out of a level as of the beginning of the quarter that the change occurs.
The incorporation of counterparty credit risk did not have a significant impact on the valuation of assets and liabilities recorded at fair value as of December 31, 2017 or 2016.
Recurring Fair Value Measurements
The following summarizes the fair value hierarchy for instruments measured at fair value on a recurring basis:
December 31, 2017 | |||||||||||||||||||
Level One | Level Two | Level Three | Cash Collateral and Netting | Total | |||||||||||||||
(In millions) | |||||||||||||||||||
ASSETS | |||||||||||||||||||
Mortgage loans held for sale | $ | — | $ | 261 | $ | 9 | $ | — | $ | 270 | |||||||||
Mortgage servicing rights | — | — | 476 | — | 476 | ||||||||||||||
Other assets—Derivative assets: | |||||||||||||||||||
Interest rate lock commitments | — | — | 5 | — | 5 | ||||||||||||||
LIABILITIES | |||||||||||||||||||
Mortgage servicing rights secured liability | $ | — | $ | — | $ | 419 | $ | — | $ | 419 | |||||||||
Other liabilities: | |||||||||||||||||||
Liability to deliver MSRs | — | — | 2 | — | 2 | ||||||||||||||
December 31, 2016 | |||||||||||||||||||
Level One | Level Two | Level Three | Cash Collateral and Netting | Total | |||||||||||||||
(In millions) | |||||||||||||||||||
ASSETS | |||||||||||||||||||
Mortgage loans held for sale | $ | — | $ | 636 | $ | 47 | $ | — | $ | 683 | |||||||||
Mortgage servicing rights | — | — | 690 | — | 690 | ||||||||||||||
Other assets—Derivative assets: | |||||||||||||||||||
Interest rate lock commitments | — | — | 18 | — | 18 | ||||||||||||||
Forward delivery commitments | — | 14 | — | (12 | ) | 2 | |||||||||||||
MSR-related agreements | — | 19 | — | (18 | ) | 1 | |||||||||||||
Option Contracts | — | 1 | — | (1 | ) | — | |||||||||||||
LIABILITIES | |||||||||||||||||||
Other liabilities—Derivative liabilities: | |||||||||||||||||||
Forward delivery commitments | $ | — | $ | 4 | $ | — | $ | 1 | $ | 5 | |||||||||
MSR-related agreements | — | 65 | — | (53 | ) | 12 | |||||||||||||
Option Contracts | — | — | — | 1 | 1 | ||||||||||||||
116
Significant inputs to the measurement of fair value and further information on the assets and liabilities measured at fair value are as follows:
Mortgage Loans Held for Sale. The Company elected to record Mortgage loans held for sale (“MLHS”) at fair value. This election is intended to both better reflect the underlying economics and eliminate the operational complexities of risk management activities related to MLHS and hedge accounting requirements.
For Level Two MLHS, fair value is estimated through a market approach by using either: (i) the fair value of securities backed by similar mortgage loans, adjusted for certain factors to approximate the fair value of a whole mortgage loan including the value attributable to servicing rights and credit risk; or (ii) current commitments to purchase loans. The Agency mortgage-backed security market is a highly liquid and active secondary market for conforming conventional loans whereby quoted prices are published on a regular basis and exist for securities at the pass-through level. The Company has the ability to access this market, and this is the market into which conforming mortgage loans are typically sold.
Level Three MLHS include second lien and Scratch and Dent loans, and are valued based upon a collateral-based valuation model with consideration of market bid pricing. Scratch and Dent loans represent mortgage loans with origination flaws or performance issues.
The following table reflects the difference between the carrying amounts of MLHS measured at fair value, and the aggregate unpaid principal amount that the Company is contractually entitled to receive at maturity:
December 31, 2017 | December 31, 2016 | ||||||||||||||
Total | Loans 90 days or more past due and on non-accrual status | Total | Loans 90 days or more past due and on non-accrual status | ||||||||||||
(In millions) | |||||||||||||||
Carrying amount | $ | 270 | $ | 1 | $ | 683 | $ | 7 | |||||||
Aggregate unpaid principal balance | 268 | 2 | 687 | 10 | |||||||||||
Difference | $ | 2 | $ | (1 | ) | $ | (4 | ) | $ | (3 | ) | ||||
The following table summarizes the components of Mortgage loans held for sale:
December 31, | |||||||
2017 | 2016 | ||||||
(In millions) | |||||||
First mortgages: | |||||||
Conforming | $ | 241 | $ | 531 | |||
Non-conforming | 20 | 105 | |||||
Total first mortgages | 261 | 636 | |||||
Second lien | — | 3 | |||||
Scratch and Dent | 9 | 44 | |||||
Total | $ | 270 | $ | 683 | |||
Mortgage Servicing Rights. Mortgage servicing rights (“MSRs”) are classified within Level Three of the valuation hierarchy due to the use of significant unobservable inputs and the inactive market for such assets.
The fair value of MSRs is estimated based upon projections of expected future cash flows considering prepayment estimates (developed using a model described below), the Company’s historical prepayment rates, portfolio characteristics, interest rates based on interest rate yield curves, implied volatility and other economic factors. A probability weighted option adjusted spread (“OAS”) model generates and discounts cash flows for the MSR valuation. The OAS model generates numerous interest rate paths, then calculates the MSR cash flow at each monthly point for each path and discounts those cash flows back to the current period. The MSR value is determined by averaging the discounted cash flows from each of the interest rate paths. The interest rate paths are generated with a random distribution centered around implied forward interest rates, which are determined from the interest rate yield curve at any given point of time.
117
A key assumption in the estimate of the fair value of MSRs is forecasted prepayments. A third-party model is used as a basis to forecast prepayment rates at each monthly point for each interest rate path in the OAS model. Prepayment rates used in the development of expected future cash flows are based on historical observations of prepayment behavior in similar periods, comparing current mortgage interest rates to the mortgage interest rates in the servicing portfolio. The rates incorporate loan characteristics (e.g., loan type and note rate) and factors such as recent prepayment experience, the relative sensitivity of the capitalized loan servicing portfolio to refinance if interest rates decline and estimated levels of home equity. On a quarterly basis, assumptions used in estimating fair value are validated against a number of third-party sources, which may include peer surveys, MSR broker surveys, third-party valuations and other market-based sources. As of December 31, 2017, the fair value of the portion of MSRs that remain committed under bulk sale agreements includes calibration of the valuation model, considering the pricing associated with those agreements. See Note 4, 'Servicing Activities' for further discussion of the MSR sale commitments.
The following tables summarize certain information regarding the initial and ending capitalization rate of MSRs:
Year Ended December 31, | |||||
2017 | 2016 | ||||
Initial capitalization rate of additions to MSRs | 1.10 | % | 1.02 | % | |
December 31, | |||||
2017 | 2016 | ||||
MSRs Owned | |||||
Capitalization servicing rate | 0.67 | % | 0.82 | % | |
Capitalization servicing multiple | 2.3 | 2.9 | |||
Weighted-average servicing fee (in basis points) | 29 | 28 | |||
Weighted-average life (years) | 5.7 | 6.3 | |||
December 31, 2017 | ||
MSRs Under Secured Borrowing Arrangement | ||
Capitalization servicing rate | 0.85 | % |
Capitalization servicing multiple | 3.2 | |
Weighted-average servicing fee (in basis points) | 27 | |
Weighted-average life (years) | 5.6 | |
The significant assumptions used in estimating the fair value of MSRs were as follows (in annual rates):
December 31, | |||||
2017 | 2016 | ||||
MSRs Owned | |||||
Weighted-average prepayment speed (CPR) | 9.2 | % | 9.2 | % | |
Option adjusted spread, in basis points (OAS) | 393 | 1,430 | |||
Weighted-average delinquency rate | 12.4 | % | 5.1 | % | |
December 31, 2017 | ||
MSRs Under Secured Borrowing Arrangement | ||
Weighted-average prepayment speed (CPR) | 11.2 | % |
Option adjusted spread, in basis points (OAS) | 928 | |
Weighted-average delinquency rate | 4.0 | % |
118
The following table summarizes the estimated change in the fair value of MSRs from adverse changes in the significant assumptions:
December 31, 2017 | |||||||||||
Weighted- Average Prepayment Speed | Option Adjusted Spread | Weighted- Average Delinquency Rate | |||||||||
(In millions) | |||||||||||
MSRs Owned | |||||||||||
Impact on fair value of 10% adverse change | $ | (3 | ) | $ | (2 | ) | $ | (4 | ) | ||
Impact on fair value of 20% adverse change | (5 | ) | (3 | ) | (9 | ) | |||||
MSRs Under Secured Borrowing Arrangement (1) | |||||||||||
Impact on fair value of 10% adverse change | $ | (15 | ) | $ | (18 | ) | $ | (6 | ) | ||
Impact on fair value of 20% adverse change | (29 | ) | (34 | ) | (12 | ) | |||||
———————
(1) | During 2017, the Company sold MSRs to New Residential, which have been accounted for as a secured borrowing. Any changes in fair value are expected to fully offset between the MSRs secured asset and MSRs secured liability. |
These sensitivities are hypothetical and presented for illustrative purposes only. Changes in fair value based on a 10% variation in assumptions generally cannot be extrapolated because the relationship of the change in assumption to the change in fair value may not be linear. Also, this analysis does not assume any impact resulting from management’s intervention to mitigate these variations or from the MSR sale commitments discussed in the preceding section.
The effect of a variation in a particular assumption is calculated without changing any other assumption and the assumptions used in valuing the MSRs are independently aggregated. Although there are certain inter-relationships among the various key assumptions noted above, changes in one of the significant assumptions would not independently drive changes in the others. The modeled prepayment speed assumptions are highly dependent upon interest rates, which drive borrowers’ propensity to refinance; however, there are other factors that can influence borrower refinance activity. These factors include housing prices, the levels of home equity, underwriting standards and loan product characteristics. The OAS is a component of the discount rate used to present value the cash flows of the MSR asset and represents the spread over a base interest rate that equates the present value of cash flows of an asset to the market price of that asset. The weighted average delinquency rate is based on the current and projected credit characteristics of the capitalized servicing portfolio and is dependent on economic conditions, home equity and delinquency and default patterns.
Mortgage Servicing Rights Secured Liability. The Company elected to record the MSRs secured liability at fair value consistent with the related MSR asset. The Company initially established the value of the MSRs secured liability based on the price at which the MSRs were sold. Thereafter, the carrying value is adjusted to fair value at each reporting date, and the changes in value of the MSR secured asset and liability are expected to offset in the Consolidated Statement of Operations. The Company records interest expense using the effective interest method based on the expected cash flows from the MSRs through the expected life of the underlying loans, which offsets the estimated yield on the MSR asset.
The fair value of MSRs secured liability is classified within Level Three of the valuation hierarchy due to the use of significant unobservable inputs, which is consistent with the fair value methodology of the related MSR asset. The fair value of MSRs secured liability is estimated based upon projections of expected future cash flows of the underlying MSR asset. The cash flow assumptions and prepayment assumptions used in the model are based on various factors, including portfolio characteristics, interest rates based on interest rate yield curves, implied volatility and other economic factors.
The significant assumptions used in estimating the fair value of MSRs secured liability were as follows (in annual rates):
December 31, 2017 | ||
Weighted-average prepayment speed (CPR) | 11.2 | % |
Option adjusted spread, in basis points (OAS) | 928 | |
Weighted-average delinquency rate | 4.0 | % |
119
See the illustration of changes in fair value of MSRs above for information related to the estimated changes in assumptions for MSRs secured liability.
Derivative Instruments. Derivative instruments are classified within Level Two and Level Three of the valuation hierarchy. See Note 5, 'Derivatives' for additional information regarding derivative instruments.
Interest Rate Lock Commitments (“IRLCs”) are classified within Level Three of the valuation hierarchy. IRLCs represent an agreement to extend credit to a mortgage loan applicant, or an agreement to purchase a loan from a third-party originator, whereby the interest rate on the loan is set prior to funding. The fair value of IRLCs is based upon the estimated fair value of the underlying mortgage loan, including the expected net future cash flows related to servicing the mortgage loan, adjusted for: (i) estimated costs to complete and originate the loan and (ii) an adjustment to reflect the estimated percentage of IRLCs that will result in a closed mortgage loan under the original terms of the agreement (or “pullthrough”).
The average pullthrough percentage used in measuring the fair value of IRLCs as of December 31, 2017 and 2016 was 67% and 77%, respectively. The pullthrough percentage is considered a significant unobservable input and is estimated based on changes in pricing and actual borrower behavior using a historical analysis of loan closing and fallout data. Actual loan pullthrough is compared to the modeled estimates in order to evaluate this assumption each period based on current trends. Generally, a change in interest rates is accompanied by a directionally opposite change in the assumption used for the pullthrough percentage, and the impact to fair value of a change in pullthrough would be partially offset by the related change in price.
Forward Delivery Commitments are classified within Level Two of the valuation hierarchy. Forward delivery commitments fix the forward sales price that will be realized upon the sale of mortgage loans into the secondary market. The fair value of forward delivery commitments is primarily based upon the current agency mortgage-backed security market to-be-announced pricing specific to the loan program, delivery coupon and delivery date of the trade. Best effort sales commitments are also executed for certain loans at the time the borrower commitment is made. These best effort sales commitments are valued using the committed price to the counterparty against the current market price of the interest rate lock commitment or mortgage loan held for sale.
MSR-Related Agreements are classified within Level Two of the valuation hierarchy. MSR-related agreements represent a combination of derivatives used to offset possible adverse changes in the fair value of MSRs, which include options on swap contracts, to-be-announced securities and interest rate swap contracts, among other instruments. The fair value of MSR-related agreements is determined using quoted prices for similar instruments.
Option Contracts are classified within Level Two of the valuation hierarchy. Option contracts represent the right to buy or sell mortgage-backed securities at specified prices in the future. The fair value of option contracts is based upon the underlying current to be announced pricing of the agency mortgage-backed security market, and a market-based volatility.
Liability to Deliver MSRs. The Company recognizes a liability for the servicing value included within the related IRLC and MLHS pipeline which it has the contractual obligation to transfer to a third party. This obligation arises from our portfolio defense agreements, whereby upon the refinance by the Company of any mortgage loan subserviced by the Company for the contractual counterparty as servicing rights owner, the Company agreed to transfer the MSR with respect to such new mortgage loan to the counterparty on the terms set forth in that agreement. In addition, the Company has agreed to co-issue the MSR with respect to such new mortgage loan in the name of the counterparty on the terms set forth in that agreement. The Company elected to record the Liability to deliver MSRs at a fair value consistent with the related servicing value included within the related IRLC or MLHS.
The fair value of Liability to deliver MSRs is classified within Level Three of the valuation hierarchy due to the use of significant unobservable inputs, which is consistent with the fair value methodology of the servicing rights within IRLCs. The Company initially established the value of the Liability to deliver MSRs based on the servicing value within the IRLC at inception. Thereafter, the carrying value of this liability is adjusted to fair value at each reporting date, and the changes in value are expected to offset changes in the associated servicing value within the IRLC or MLHS in the Consolidated Statements of Operations until the MSR is delivered to the counterparty.
120
Level Three Measurements
Instruments classified within Level Three of the fair value hierarchy contain significant inputs to the valuation that are based upon unobservable inputs that reflect the Company’s assessment of the assumptions a market participant would use in pricing the asset or liability. The fair value of assets and liabilities classified within Level Three of the valuation hierarchy also typically includes observable factors, and the realized or unrealized gain or loss recorded from the valuation of these instruments would also include amounts determined by observable factors.
Activity of assets and liabilities classified within Level Three of the valuation hierarchy consisted of:
Year Ended December 31, | |||||||||||||||||||||||||||||||
2017 | 2016 | ||||||||||||||||||||||||||||||
MLHS | MSRs | IRLCs, net | MSRs Secured Liability | Liability to Deliver MSRs | MLHS | MSRs | IRLCs, net | ||||||||||||||||||||||||
(In millions) | |||||||||||||||||||||||||||||||
Balance, beginning of period | $ | 47 | $ | 690 | $ | 18 | $ | — | $ | — | $ | 39 | $ | 880 | $ | 21 | |||||||||||||||
Purchases, Issuances, Sales and Settlements: | |||||||||||||||||||||||||||||||
Purchases | 7 | — | — | — | — | 13 | — | — | |||||||||||||||||||||||
Issuances | 5 | 36 | — | (467 | ) | — | 6 | 60 | — | ||||||||||||||||||||||
Sales | (59 | ) | (131 | ) | — | — | — | (24 | ) | (12 | ) | — | |||||||||||||||||||
Settlements | (12 | ) | — | (213 | ) | 29 | 3 | (11 | ) | — | (318 | ) | |||||||||||||||||||
(59 | ) | (95 | ) | (213 | ) | (438 | ) | 3 | (16 | ) | 48 | (318 | ) | ||||||||||||||||||
Realized and unrealized gains (losses) included in: | |||||||||||||||||||||||||||||||
Gain on loans held for sale, net | (3 | ) | — | 200 | — | (5 | ) | (1 | ) | — | 315 | ||||||||||||||||||||
Change in fair value of MSRs | — | (119 | ) | — | 48 | — | — | (238 | ) | — | |||||||||||||||||||||
Interest income | — | — | — | (29 | ) | — | 3 | — | — | ||||||||||||||||||||||
(3 | ) | (119 | ) | 200 | 19 | (5 | ) | 2 | (238 | ) | 315 | ||||||||||||||||||||
Transfers into Level Three | 41 | — | — | — | — | 42 | — | — | |||||||||||||||||||||||
Transfers out of Level Three | (17 | ) | — | — | — | — | (20 | ) | — | — | |||||||||||||||||||||
Balance, end of period | $ | 9 | $ | 476 | $ | 5 | $ | (419 | ) | $ | (2 | ) | $ | 47 | $ | 690 | $ | 18 | |||||||||||||
Transfers into Level Three generally represent mortgage loans held for sale with performance issues, origination flaws, or other characteristics that impact their salability in active secondary market transactions. For the year ended December 31, 2017, transfers into level three also include certain loans in foreclosure and associated reserves that were transferred out of Other assets, and were marketed and sold by the Company in the fourth quarter of 2017. Transfers out of Level Three represent Scratch and Dent loans that were foreclosed upon and loans that have been cured.
Unrealized gains (losses) included in the Consolidated Statement of Operations related to assets and liabilities classified within Level Three of the valuation hierarchy that are included in the Consolidated Balance Sheets were as follows:
Year Ended December 31, | |||||||
2017 | 2016 | ||||||
(In millions) | |||||||
Gain on loans held for sale, net | $ | 3 | $ | 11 | |||
Loan servicing income, net | (12 | ) | (100 | ) | |||
Fair Value of Other Financial Instruments
As of December 31, 2017 and 2016, all financial instruments were either recorded at fair value or the carrying value approximated fair value, with the exception of Debt. For financial instruments that were not recorded at fair value, such as Cash and cash equivalents, Accounts receivable, Restricted cash and Servicing advance receivables, the carrying value approximates fair value due to the short-term nature of such instruments.
121
Debt. As of December 31, 2017, the total fair value of Debt was $379 million, and is measured using Level Two and Level Three inputs. The total fair value of Debt as of December 31, 2016 was $1.3 billion and was measured using Level Two inputs. As of December 31, 2017, the fair value was estimated using the following valuation techniques: (i) Level Two, $252 million was measured using observable spreads and terms for recent pricing of similar instruments; and (ii) Level Three, $127 million was measured considering contractual pricing and historical broker price quotes, which are intended to reflect fair value, due to the limited trading on the Company's unsecured term notes.
Non-Recurring Fair Value Measurements
Other Assets — Equity method investments. In the fourth quarter of 2016, the Company evaluated its equity method investment of Speedy Title and Appraisal Review Services LLC ("STARS") for impairment as a result of the negative impact the PLS exit will have on STARS operating results. The exit of the PLS channel will significantly reduce STARS appraisal volume and its projected cash flows. Due to the uncertainty of the cash flows associated with an income approach, the Company performed the assessment of fair value based on an orderly liquidation of the entity. This assessment resulted in an impairment charge of $23 million, which was recorded in Other (loss) income in the Consolidated Statements of Operations during the year ended December 31, 2016.
On December 31, 2017, the Company acquired an additional 50.1% interest in STARS, increasing our ownership interest from 49.9% to 100%, and no impairment was recognized from the provisional remeasurement of the investment immediately prior to acquiring the controlling interest in the entity. See Note 1, 'Summary of Significant Accounting Policies' in the accompanying Notes to Consolidated Financial Statements for further discussion on the STARS acquisition.
Other Assets — Mortgage loans in foreclosure and Real estate owned. The evaluation of impairment reflects an estimate of losses currently incurred at the balance sheet date, which will likely not be recoverable from guarantors, insurers or investors. Mortgage loans in foreclosure represent loans for which foreclosure proceedings have been initiated and Real estate owned (“REO”) includes properties acquired from mortgagors in default. Fair value is based on the market value of the underlying collateral, determined on a loan or property level basis, less estimated costs to sell. The market value of the collateral is estimated by considering appraisals and broker price opinions, which are updated on a periodic basis to reflect current housing market conditions. Mortgage loans in foreclosure are measured at fair value whereas REO is recorded at the lower of adjusted carrying amount at the time the property is acquired or fair value. The non-recurring fair value measurements associated with mortgage loans in foreclosure and REO are based upon assumptions from Level Three of the valuation hierarchy.
During the years ended December 31, 2017 and 2016, Repurchase and foreclosure-related charges totaled $3 million and $19 million, respectively. These amounts were recorded in Other operating expenses and include changes in the estimate of losses related to loan repurchases and indemnifications in addition to the provision for or benefit from valuation adjustments for mortgage loans in foreclosure and REO. See Note 13, 'Commitments and Contingencies' and Note 7, 'Other Assets' for further information regarding the balances of mortgage loans in foreclosure, REO, and exposures to loan repurchases and indemnifications.
17. Variable Interest Entities |
The Company determines whether an entity is a variable interest entity (“VIE”) and whether it is the primary beneficiary at the date of initial involvement with the entity. The Company reassesses whether it is the primary beneficiary of a VIE upon certain events that affect the VIE’s equity investment at risk and upon certain changes in the VIE’s activities. The purposes and activities of the VIE are considered in determining whether the Company is the primary beneficiary, including the variability and related risks the VIE incurs and transfers to other entities and their related parties. Based on these factors, a qualitative assessment is made and, if inconclusive, a quantitative assessment of whether it would absorb a majority of the VIE’s expected losses or receive a majority of the VIE’s expected residual returns. If the Company determines that it is the primary beneficiary of the VIE, the VIE is consolidated within the financial statements.
The Company’s involvement in variable interest entities primarily relate to PHH Home Loans, a joint venture with Realogy Corporation, and a special purpose bankruptcy remote trust that issues asset-backed notes secured by servicing advance receivables. The activities of significant variable interest entities are more fully described below.
122
Assets and liabilities of significant variable interest entities are included in the Consolidated Balance Sheets as follows:
December 31, 2017 | December 31, 2016 | ||||||||||||||
PHH Home Loans | Servicing Advance Receivables Trust | PHH Home Loans | Servicing Advance Receivables Trust | ||||||||||||
(In millions) | |||||||||||||||
ASSETS | |||||||||||||||
Cash | $ | 33 | $ | — | $ | 67 | $ | — | |||||||
Restricted cash | 3 | 10 | 5 | 19 | |||||||||||
Mortgage loans held for sale | 60 | — | 350 | — | |||||||||||
Accounts receivable, net | 1 | — | 9 | — | |||||||||||
Servicing advances, net | — | 56 | — | 150 | |||||||||||
Property and equipment, net | — | — | 1 | — | |||||||||||
Other assets | 1 | — | 11 | 1 | |||||||||||
Total assets | $ | 98 | $ | 66 | $ | 443 | $ | 170 | |||||||
Assets held as collateral (1) | $ | 43 | $ | 66 | $ | 320 | $ | 169 | |||||||
LIABILITIES | |||||||||||||||
Accounts payable and accrued expenses | $ | 6 | $ | — | $ | 11 | $ | — | |||||||
Mortgage warehouse and advance facilities | 40 | 32 | 300 | 99 | |||||||||||
Other liabilities | 5 | — | 5 | — | |||||||||||
Total liabilities (2) | $ | 51 | $ | 32 | $ | 316 | $ | 99 | |||||||
___________________
(1) | Represents amounts not available to pay the Company’s general obligations. See Note 10, 'Debt and Borrowing Arrangements' for further information. |
(2) | Excludes intercompany payables. |
In addition to the assets and liabilities of significant variable interest entities that were consolidated as outlined above, the Company had the following involvement with these entities as of and for the years ended December 31:
Net income (loss)(1) | |||||||||||
2017 | 2016 | 2015 | |||||||||
(In millions) | |||||||||||
PHH Home Loans | $ | 47 | $ | 16 | $ | 28 | |||||
Servicing Advance Receivables Trust | (3 | ) | (4 | ) | (5 | ) | |||||
PHH Corporation Investment(2) | Intercompany receivable(2) | ||||||||||||||
2017 | 2016 | 2017 | 2016 | ||||||||||||
(In millions) | |||||||||||||||
PHH Home Loans | $ | 32 | $ | 57 | $ | 6 | $ | 13 | |||||||
Servicing Advance Receivables Trust | 51 | 83 | — | — | |||||||||||
_________________
(1) | Includes adjustments for the elimination of intercompany transactions. |
(2) | Amounts are eliminated in the Consolidated Balance Sheets. |
123
PHH Home Loans
Overview
The Company owns 50.1% of PHH Home Loans and Realogy Corporation owns the remaining 49.9%. The operations of PHH Home Loans are governed by the PHH Home Loans Operating Agreement. PHH Home Loans was formed for the purpose of originating and selling mortgage loans primarily sourced through Realogy’s owned real estate brokerage business, NRT, and corporate relocation business, Cartus. In February 2017, the Company announced it had entered into agreements to sell certain assets of PHH Home Loans and its subsidiaries, including its mortgage origination and processing centers and the majority of its employees, and subsequently purchase Realogy's ownership interest in PHH Home Loans. Agreements related to these intended transactions include:
Asset Sale Transactions. On February 15, 2017, the Company entered into an agreement to sell certain assets of the PHH Home Loans joint venture to Guaranteed Rate Affinity, LLC ("GRA"), which is a newly formed joint venture formed by subsidiaries of Realogy and Guaranteed Rate, Inc.
The asset sales with GRA were completed in a series of five closings, which occurred between August and December 2017 ("Asset Sale Transactions"). In total, the Company received $70 million of proceeds and recognized a $70 million gain in Other income within the Consolidated Statements of Operations. The Company's realized cash proceeds and income from these transactions are reduced by the noncontrolling interest holder's pro-rata share.
JV Interests Purchase. In connection with the asset sale agreements, the Company entered into an agreement to purchase Realogy's ownership interests in the PHH Home Loans joint venture ("JV Interests Purchase"), for an amount equal to its interest in the residual equity of PHH Home Loans after the final closing of the Asset sale transactions. The Company has not yet completed the purchase of Realogy's ownership interest in PHH Home Loans, but is contractually obligated to do so on or before March 19, 2018, subject to certain closing conditions. After the completion of the JV Interests Purchase, PHH Home Loans will become a wholly-owned subsidiary and its residual net assets will be included in the Company's Consolidated Financial Statements. The Company expects to receive or pay amounts to resolve the remaining assets and liabilities of the PHH Home Loans legal entity, and would no longer operate through its Real Estate channel.
In connection with these transactions, during the year ended December 31, 2017, the Company recognized $13 million of Exit and disposal costs for PHH Home Loans within the Reorganization exit program which is reduced by the noncontrolling interest holder's pro-rata share. Refer to Note 2, 'Exit Costs' for additional information regarding the Reorganization exit program.
Presentation
The Company’s determination of the primary beneficiary was based on both quantitative and qualitative factors, which indicated that its variable interests will absorb a majority of the expected losses and receive a majority of the expected residual returns of PHH Home Loans. The Company has maintained the most significant variable interests in the entity, which include the majority ownership of common equity interests, the Intercompany Line of Credit, PHH Home Loans Loan Purchase and Sale Agreement and the Management Services Agreement. The Company has been the primary beneficiary of PHH Home Loans since its inception, and there have been no current period events that would change the decision regarding whether or not to consolidate PHH Home Loans.
As a result, Realogy's ownership interest is presented in the Consolidated Financial Statements as a noncontrolling interest, and the classification of Realogy's ownership interest as a liability or Mezzanine equity in the Consolidated Balance Sheets was based upon the following analysis:
Mandatorily Redeemable Noncontrolling Interest. As of December 31, 2017, Realogy’s ownership interest in PHH Home Loans is classified within Total liabilities and presented as a Mandatorily redeemable noncontrolling interest within the Consolidated Balance Sheets, which reflects the Company’s unconditional obligation to redeem the noncontrolling interest for cash. Upon completion of the asset purchase agreement with GRA in December 2017 and, pursuant to the JV Interest Purchase agreement, the Company and Realogy waived all rights under the existing Operating Agreement that would restrict either party from completing the JV Interest Purchase, including the 2015 Put Option described below. Since neither the Company nor Realogy have a unilateral ability to avoid redemption except by both parties’ consent, and it is certain the JV Interests Purchase will occur, the noncontrolling interest and related forward purchase agreement represent an unconditional redemption obligation. The Company expects to complete the JV Interest Purchase during the first quarter of 2018. The fair value of the Mandatorily redeemable noncontrolling
124
interest as of December 31, 2017 was based upon Realogy’s portion of the net assets of PHH Home Loans, which are substantially all recorded at fair value (or approximated fair value). Under this accounting treatment, the Company will no longer allocate Realogy a portion of income or loss during each period subsequent to December 31, 2017. Since the settlement of the JV Interest Purchase agreement is not fixed and varies based upon the net assets of PHH Home Loans, during 2018, the Company expects to recognize the resulting change in the recorded amount as interest cost; however, the Company will not reduce the carrying amount of the liability below the initially recorded amount, or $20 million.
Redeemable Noncontrolling Interest. For periods between February 1, 2015 through December 18, 2017, Realogy's ownership interest in PHH Home Loans is classified within Mezzanine equity and presented as a Redeemable noncontrolling interest which reflects Realogy’s right, beginning on February 1, 2015, to require that the Company purchase all of their interest in PHH Home Loans, LLC upon two years notice at fair value, as outlined in the PHH Home Loans Operating Agreement (“2015 Put Option”), or in certain periods, the Company's contingent obligation to purchase Realogy's membership interests pursuant to the JV Interests Purchase agreement. For periods presented herein, the fair value of the 2015 Put Option was determined based upon an orderly liquidation of the entity due to the uncertainty of the cash flows associated with an income approach, specifically the impact from exercising the 2015 Put Option on the related operating and strategic relationship agreements. The resulting changes to the redemption value are recognized as an equity adjustment to Additional paid-in capital. Refer to Note 1, 'Summary of Significant Accounting Policies' for information regarding the correction of an immaterial error related to the prior classification and measurement of Realogy's ownership interests.
Other Information
The Company manages PHH Home Loans through its subsidiary, PHH Broker Partner, with the exception of certain specified actions that are subject to approval through PHH Home Loans’ board of advisors, which consists of representatives of Realogy and the Company. The board of advisors has no managerial authority, and its primary purpose is to provide a means for Realogy to exercise its approval rights over those specified actions of PHH Home Loans for which Realogy’s approval is required. PHH Mortgage operates under a Management Services Agreement with PHH Home Loans, pursuant to which PHH Mortgage provides certain mortgage origination processing and administrative services for PHH Home Loans. In exchange for such services, PHH Home Loans pays PHH Mortgage a fee per service and a fee per loan, subject to a minimum amount.
Additional details about the activity within PHH Home Loans includes the following:
Originations and Commitments. During the years ended December 31, 2017, 2016 and 2015, PHH Home Loans originated residential mortgage loans of $5.4 billion, $7.1 billion and $7.9 billion, respectively, and PHH Home Loans brokered or sold $1.7 billion, $2.0 billion and $2.7 billion, respectively, of mortgage loans to the Company under the terms of a loan purchase agreement. All loans originated by PHH Home Loans are sold to unaffiliated third-party investors or PHH Mortgage, in all cases at arm’s length terms. For the year ended December 31, 2017, 28% of the mortgage loans originated by the Company were derived from Realogy Corporation’s affiliates, of which substantially all were originated by PHH Home Loans. As of December 31, 2017, the Company had outstanding commitments to purchase or fund $39 million of mortgage loans and lock commitments expected to result in closed mortgage loans from PHH Home Loans.
Contributions and Distributions. PHH Home Loans is financed through equity contributions, sales of mortgage loans to PHH Mortgage and other investors, and secured and unsecured subordinated indebtedness. The Company did not make any capital contributions to support the operations of PHH Home Loans during the years ended December 31, 2017, 2016 and 2015. The Company is not solely obligated to provide additional financial support to PHH Home Loans.
Subject to certain regulatory and financial covenant requirements, net income generated by PHH Home Loans may be distributed quarterly to its members pro-rata based upon their respective ownership interests. PHH Home Loans may also require additional capital contributions from the Company and Realogy under the terms of the Operating Agreement if it is required to meet minimum regulatory capital and reserve requirements imposed by any governmental authority or any creditor of PHH Home Loans or its subsidiaries. Distributions received from PHH Home Loans were $60 million, $8 million and $10 million during the years ended December 31, 2017, 2016 and 2015, respectively.
Other Support. During the years ended December 31, 2017 and 2016, the Company maintained an unsecured subordinated Intercompany Line of Credit with PHH Home Loans to increase PHH Home Loans’ capacity to fund mortgage loans and to support certain covenants of the entity. This Line of Credit expired on December 31, 2017 and was not renewed. There were no borrowings under this Intercompany Line of Credit during the years ended December 31, 2017 and 2016.
125
Servicing Advance Receivables Trust
In 2014, PHH Servicer Advance Receivables Trust (“PSART”) and PHH Servicer Advance Funding Depositor, LLC (the “Depositor”) (collectively, the “Servicing Advance Receivables Trust”) were formed. PSART is a special purpose bankruptcy remote trust and was formed for the purpose of issuing asset-backed notes secured by servicing advance receivables. The Company, the Depositor and PSART entered into a Receivables Purchase and Contribution Agreement under which the Company has conveyed (and may in the future convey) to the Depositor the contractual right to the reimbursement of certain mortgage loan servicing advances made by the Company related to its servicing activities. The Depositor in turn sells the servicing advances to PSART. The Company has been the primary beneficiary of PSART and the Depositor since its inception, based on their nature and purpose, and there have been no current period events that would change that conclusion.
PSART has entered into an agreement to issue asset-backed notes as further discussed in Note 10, 'Debt and Borrowing Arrangements'. Certain capital transactions are executed between the Company and the Depositor whereby PHH Mortgage contributes receivables to the Depositor and receives distributions upon the issuance of notes or the leveraging of note series. During the year ended December 31, 2017, PHH Mortgage contributed Accounts receivable of $367 million to the Depositor, and received distributions of $401 million.
18. Segment Information |
Operations are conducted through the following two reportable segments:
▪ | Mortgage Production — provides mortgage loan origination services and sells mortgage loans. |
▪ | Mortgage Servicing — performs servicing activities for loans originated by the Company and mortgage servicing rights purchased from others, and acts as a subservicer for certain clients that own the underlying mortgage servicing rights. |
The Company's operations are located in the U.S. The heading Other includes expenses that are not allocated back to the two reportable segments, which may include Loss on early debt retirement, certain Exit and disposal costs and Professional and third-party service fees incurred related to the Company's strategic actions. Management evaluates the operating results of each of the reportable segments based upon Net revenues and Segment profit or loss, which is presented as the Income or loss before income tax expense or benefit and after Net income or loss attributable to noncontrolling interest. The Mortgage Production segment profit or loss excludes Realogy’s noncontrolling interest in the profit or loss of PHH Home Loans.
Segment results as of and for the years ended December 31 were as follows:
Total Assets | |||||||
2017 | 2016 | ||||||
(In millions) | |||||||
Mortgage Production segment | $ | 405 | $ | 913 | |||
Mortgage Servicing segment | 919 | 1,428 | |||||
Other | 487 | 834 | |||||
Total | $ | 1,811 | $ | 3,175 | |||
126
Net Revenues | Segment (Loss) (1) | ||||||||||||||||||||||
2017 | 2016 | 2015 | 2017 | 2016 | 2015 | ||||||||||||||||||
(In millions) | |||||||||||||||||||||||
Mortgage Production segment | $ | 358 | $ | 539 | $ | 586 | $ | (92 | ) | $ | (53 | ) | $ | (47 | ) | ||||||||
Mortgage Servicing segment | 98 | 83 | 198 | (121 | ) | (223 | ) | (131 | ) | ||||||||||||||
Other | — | — | 6 | (83 | ) | (37 | ) | (49 | ) | ||||||||||||||
Total | $ | 456 | $ | 622 | $ | 790 | $ | (296 | ) | $ | (313 | ) | $ | (227 | ) | ||||||||
______________
(1) | The following is a reconciliation of Income or loss from continuing operations before income taxes to Segment profit or loss: |
Year Ended December 31, | |||||||||||
2017 | 2016 | 2015 | |||||||||
(In millions) | |||||||||||
Loss before income taxes | $ | (273 | ) | $ | (304 | ) | $ | (213 | ) | ||
Less: net income attributable to noncontrolling interest | 23 | 9 | 14 | ||||||||
Segment loss | $ | (296 | ) | $ | (313 | ) | $ | (227 | ) | ||
Interest Income | Interest Expense | ||||||||||||||||||||||
2017 | 2016 | 2015 | 2017 | 2016 | 2015 | ||||||||||||||||||
(In millions) | |||||||||||||||||||||||
Mortgage Production segment | $ | 22 | $ | 32 | $ | 40 | $ | 17 | $ | 22 | $ | 45 | |||||||||||
Mortgage Servicing segment | 15 | 11 | 4 | 56 | 53 | 45 | |||||||||||||||||
Total | $ | 37 | $ | 43 | $ | 44 | $ | 73 | $ | 75 | $ | 90 | |||||||||||
19. Selected Quarterly Financial Data—(unaudited) |
The following tables present selected unaudited quarterly financial data:
Quarter Ended | |||||||||||||||
March 31, 2017 | June 30, 2017 | September 30, 2017 | December 31, 2017 | ||||||||||||
(In millions, except per share data) | |||||||||||||||
Net revenues | $ | 114 | $ | 112 | $ | 121 | $ | 109 | |||||||
Loss before income taxes | (105 | ) | (83 | ) | (78 | ) | (7 | ) | |||||||
Net loss | (71 | ) | (50 | ) | (42 | ) | (31 | ) | |||||||
Net loss attributable to PHH Corporation | (67 | ) | (46 | ) | (55 | ) | (49 | ) | |||||||
Basic and Diluted loss per share attributable to PHH Corporation | $ | (1.26 | ) | $ | (0.86 | ) | $ | (1.14 | ) | $ | (1.49 | ) | |||
Quarter Ended | |||||||||||||||
March 31, 2016 | June 30, 2016 | September 30, 2016 | December 21, 2016 | ||||||||||||
(In millions, except per share data) | |||||||||||||||
Net revenues | $ | 157 | $ | 196 | $ | 197 | $ | 72 | |||||||
Loss before income taxes | (49 | ) | (20 | ) | (29 | ) | (206 | ) | |||||||
Net loss | (30 | ) | (9 | ) | (21 | ) | (133 | ) | |||||||
Net loss attributable to PHH Corporation | (30 | ) | (12 | ) | (27 | ) | (133 | ) | |||||||
Basic and Diluted loss per share attributable to PHH Corporation | $ | (0.56 | ) | $ | (0.22 | ) | $ | (0.50 | ) | $ | (2.49 | ) | |||
127
20. Subsequent Events |
Proposed Merger with Ocwen Financial Corporation
On February 27, 2018, the Company entered into a definitive Agreement and Plan of Merger with Ocwen Financial Corporation (“Ocwen”), and POMS Corp (“MergerSub”) pursuant to which all of PHH’s outstanding common stock will be acquired by Ocwen in a merger of PHH with and into MergerSub with PHH surviving (the “Merger”) in an all cash transaction valued at approximately $360 million. The Company's Board of Directors has unanimously approved the Merger. The Merger is subject to, in addition to various other customary closing conditions; approval by the Company’s stockholders; antitrust, state licensing, and other governmental and regulatory approvals; and PHH maintaining cash and adjusted net worth above certain thresholds.
128
PHH CORPORATION AND SUBSIDIARIES
SUPPLEMENTARY FINANCIAL DATA
SCHEDULE II – VALUATION AND QUALIFYING ACCOUNTS
PHH Corporation and Subsidiaries | PHH Corporation | ||||||||||||||||||||||
2017 | 2016 | 2015 | 2017 | 2016 | 2015 | ||||||||||||||||||
(In millions) | |||||||||||||||||||||||
Deferred tax valuation allowance: | |||||||||||||||||||||||
Balance, beginning of period | $ | 44 | $ | 46 | $ | 35 | $ | 11 | $ | 11 | $ | 5 | |||||||||||
Additions: | |||||||||||||||||||||||
Charged to costs and expenses | 34 | 5 | 10 | 16 | 2 | 6 | |||||||||||||||||
Charged to other accounts | — | (7 | ) | 1 | — | (2 | ) | — | |||||||||||||||
Reductions | — | — | — | — | — | — | |||||||||||||||||
Balance, end of period | $ | 78 | $ | 44 | $ | 46 | $ | 27 | $ | 11 | $ | 11 | |||||||||||
129
Item 9. Changes in and Disagreements with Accountants on Accounting and Financial Disclosure |
None.
Item 9A. Controls and Procedures |
DISCLOSURE CONTROLS AND PROCEDURES |
As of the end of the period covered by this Report on Form 10-K, management performed, with the participation of our Chief Executive Officer and Chief Financial Officer, an evaluation of the effectiveness of our disclosure controls and procedures as defined in Rules 13a-15(e) and 15d-15(e) of the Securities Exchange Act of 1934. Our disclosure controls and procedures are designed to provide reasonable assurance that information required to be disclosed in the reports we file or submit under the Exchange Act is recorded, processed, summarized and reported within the time periods specified in the Securities and Exchange Commission’s rules and forms, and that such information is accumulated and communicated to our management, including our Chief Executive Officer and Chief Financial Officer, to allow timely decisions regarding required disclosures. Based on that evaluation, management concluded that our disclosure controls and procedures were effective as of December 31, 2017.
MANAGEMENT’S REPORT ON INTERNAL CONTROL OVER FINANCIAL REPORTING |
Management is responsible for establishing and maintaining adequate internal control over financial reporting, as defined in Rules 13a-15(f) and 15d-15(f) of the Exchange Act. Internal control over financial reporting is a process designed to provide reasonable assurance regarding the reliability of financial reporting and the preparation of financial statements in accordance with accounting principles generally accepted in the United States, which is commonly referred to as GAAP. The effectiveness of any system of internal control over financial reporting is subject to inherent limitations, including the exercise of judgment in designing, implementing, operating and evaluating our internal control over financial reporting. Because of these inherent limitations, internal control over financial reporting cannot provide absolute assurance regarding the reliability of financial reporting and the preparation of financial statements in accordance with GAAP and may not prevent or detect misstatements. Also, projections of any evaluation of effectiveness to future periods are subject to the risk that our internal control over financial reporting may become inadequate because of changes in conditions or other factors, or that the degree of compliance with the policies or procedures may deteriorate.
Management, with the participation of our Chief Executive Officer and Chief Financial Officer, assessed the effectiveness of our internal control over financial reporting as of December 31, 2017 as required under Section 404 of the Sarbanes-Oxley Act of 2002. Management’s assessment of the effectiveness of our internal control over financial reporting was conducted using the criteria in Internal Control—Integrated Framework (2013) issued by the Committee of Sponsoring Organizations of the Treadway Commission. Management concluded that our internal control over financial reporting was effective as of December 31, 2017. The effectiveness of our internal control over financial reporting as of December 31, 2017 has been audited by Deloitte & Touche LLP, our independent registered public accounting firm, as stated in their attestation report which is included in this Form 10-K.
CHANGES IN INTERNAL CONTROL OVER FINANCIAL REPORTING |
There have been no changes in our internal control over financial reporting during the quarter ended December 31, 2017 that have materially affected, or are reasonably likely to materially affect, our internal control over financial reporting.
130
REPORT OF INDEPENDENT REGISTERED PUBLIC ACCOUNTING FIRM
To the Board of Directors and Stockholders of PHH Corporation:
Opinion on Internal Control over Financial Reporting
We have audited the internal control over financial reporting of PHH Corporation and subsidiaries (the "Company") as of December 31, 2017, based on criteria established in Internal Control - Integrated Framework (2013) issued by the Committee of Sponsoring Organizations of the Treadway Commission (COSO). In our opinion, the Company maintained, in all material respects, effective internal control over financial reporting as of December 31, 2017, based on criteria established in Internal Control - Integrated Framework (2013) issued by COSO.
We have also audited, in accordance with the standards of the Public Company Accounting Oversight Board (United States) (PCAOB), the consolidated financial statements and financial statement schedules as of and for the year ended December 31, 2017 of the Company and our report dated March 1, 2018 expressed an unqualified opinion on those financial statements and financial statement schedules.
Basis for Opinion
The Company’s management is responsible for maintaining effective internal control over financial reporting and for its assessment of the effectiveness of internal control over financial reporting, included in the accompanying Management’s Report on Internal Control over Financial Reporting. Our responsibility is to express an opinion on the Company’s internal control over financial reporting based on our audit. We are a public accounting firm registered with the PCAOB and are required to be independent with respect to the Company in accordance with the U.S. federal securities laws and the applicable rules and regulations of the Securities and Exchange Commission and the PCAOB.
We conducted our audit in accordance with the standards of the PCAOB. Those standards require that we plan and perform the audit to obtain reasonable assurance about whether effective internal control over financial reporting was maintained in all material respects. Our audit included obtaining an understanding of internal control over financial reporting, assessing the risk that a material weakness exists, testing and evaluating the design and operating effectiveness of internal control based on the assessed risk, and performing such other procedures as we considered necessary in the circumstances. We believe that our audit provides a reasonable basis for our opinion.
Definition and Limitations of Internal Control over Financial Reporting
A company’s internal control over financial reporting is a process designed to provide reasonable assurance regarding the reliability of financial reporting and the preparation of financial statements for external purposes in accordance with generally accepted accounting principles. A company’s internal control over financial reporting includes those policies and procedures that (1) pertain to the maintenance of records that, in reasonable detail, accurately and fairly reflect the transactions and dispositions of the assets of the company; (2) provide reasonable assurance that transactions are recorded as necessary to permit preparation of financial statements in accordance with generally accepted accounting principles, and that receipts and expenditures of the company are being made only in accordance with authorizations of management and directors of the company; and (3) provide reasonable assurance regarding prevention or timely detection of unauthorized acquisition, use, or disposition of the company’s assets that could have a material effect on the financial statements.
Because of the inherent limitations, internal control over financial reporting may not be prevent or detect misstatements. Also, projections of any evaluation of effectiveness to future periods are subject to the risk that controls may become inadequate because of changes in conditions, or that the degree of compliance with the policies or procedures may deteriorate.
/s/ Deloitte & Touche LLP
Philadelphia, Pennsylvania
March 1, 2018
131
Item 9B. Other Information |
None.
PART III
Item 10. Directors, Executive Officers and Corporate Governance |
Information required by this Item is incorporated herein by reference to the information under the headings “Executive Officers,” “Board of Directors,” “Section 16(a) Beneficial Ownership Reporting Compliance,” “Corporate Governance” and “Committees of the Board” in our definitive Proxy Statement related to our 2018 Annual Meeting of Stockholders, which we expect to file with the Commission, pursuant to Regulation 14A, no later than 120 days after December 31, 2017 (the “2018 Proxy Statement”).
Item 11. Executive Compensation |
Information required under this Item is incorporated herein by reference to the information under the headings “Executive Compensation,” “Director Compensation” and “Compensation Committee Report” in our 2018 Proxy Statement.
Item 12. Security Ownership of Certain Beneficial Owners and Management and Related Stockholder Matters |
Information required under this Item is incorporated herein by reference to the information under the headings “Equity Compensation Plan Information” and “Security Ownership of Certain Beneficial Owners and Management” in our 2018 Proxy Statement.
Item 13. Certain Relationships and Related Transactions, and Director Independence |
Information required under this Item is incorporated herein by reference to the information under the headings “Certain Relationships and Related Transactions” and “Board of Directors” in our 2018 Proxy Statement.
Item 14. Principal Accounting Fees and Services |
Information required under this Item is incorporated herein by reference to the information under the heading “Principal Accountant Fees and Services” in our 2018 Proxy Statement.
132
PART IV
Item 15. Exhibits |
(a)(1). Financial Statements
Information in response to this Item is included in Item 8 of Part II of this Form 10-K.
(a)(2). Financial Statement Schedules
Information in response to this Item is included in Item 8 of Part II of this Form 10-K and incorporated herein by reference to Exhibit 12 attached to this Form 10-K.
(a)(3) and (b). Exhibits
Information in response to this Item is incorporated herein by reference to the Exhibit Index to this Form 10-K.
Item 16. Form 10-K Summary |
None.
133
SIGNATURES
Pursuant to the requirements of Section 13 or 15(d) of the Securities Exchange Act of 1934, as amended, the Registrant has duly caused this Annual Report on Form 10-K to be signed on its behalf by the undersigned, thereunto duly authorized on this 1st day of March, 2018.
PHH CORPORATION | ||
By: | /s/ ROBERT B. CROWL | |
Name: Robert B. Crowl | ||
Title: President and Chief Executive Officer | ||
Pursuant to the requirements of Section 13 or 15(d) of the Securities Exchange Act of 1934, as amended, this Annual Report on Form 10-K has been signed below by the following persons on behalf of the Registrant and in the capacities and on the dates indicated. The undersigned hereby constitute and appoint Robert B. Crowl, Michael R. Bogansky and Ryan Melcher, and each of them, their true and lawful agents and attorneys-in-fact with full power and authority in said agents and attorneys-in-fact, and in any one or more of them, to sign for the undersigned and in their respective names as Directors and officers of PHH Corporation, any amendment or supplement hereto. The undersigned hereby confirm all acts taken by such agents and attorneys-in-fact, or any one or more of them, as herein authorized.
Signature | Title | Date | ||
/s/ ROBERT B. CROWL | President, Chief Executive Officer and Director (Principal Executive Officer) | March 1, 2018 | ||
Robert B. Crowl | ||||
/s/ MICHAEL R. BOGANSKY | Senior Vice President and Chief Financial Officer (Principal Financial and Accounting Officer) | March 1, 2018 | ||
Michael R. Bogansky | ||||
/s/ JAMES O. EGAN | Non-Executive Chairman of the Board of Directors | March 1, 2018 | ||
James O. Egan | ||||
/s/ JANE D. CARLIN | Director | March 1, 2018 | ||
Jane D. Carlin | ||||
/s/ JAMES C. NEUHAUSER | Director | March 1, 2018 | ||
James C. Neuhauser | ||||
/s/ CHARLES P. PIZZI | Director | March 1, 2018 | ||
Charles P. Pizzi | ||||
/s/ KEVIN STEIN | Director | March 1, 2018 | ||
Kevin Stein | ||||
/s/ CARROLL R. WETZEL, JR. | Director | March 1, 2018 | ||
Carroll R. Wetzel, Jr. | ||||
134
EXHIBIT INDEX
Exhibit No. | Description | Incorporation by Reference | ||
Incorporated by reference to Exhibit 2.1 to our Current Report on Form 8-K filed on December 28, 2016. | ||||
Incorporated by reference to Exhibit 2.1 to our Current Report on Form 8-K filed on February 15, 2017. | ||||
Incorporated by reference to Exhibit 2.2 to our Current Report on Form 8-K filed on February 15, 2017. | ||||
Incorporated by reference to Exhibit 2.1 to our Current Report on Form 8-K filed on February 27, 2018. | ||||
Incorporated by reference to Exhibit 3.1 to our Annual Report on Form 10-K for the year ended December 31, 2015 filed on February 26, 2016. | ||||
Incorporated by reference to Exhibit 3.2 to our Annual Report on Form 10-K for the year ended December 31, 2015 filed on February 26, 2016. | ||||
Incorporated by reference to Exhibit 3.1 to our Current Report on Form 8-K filed on February 27, 2018. | ||||
Incorporated by reference to Exhibit 4.1 to our Annual Report on Form 10-K for the year ended December 31, 2004 filed on March 15, 2005. | ||||
Incorporated by reference to Exhibit 3.1 to our Annual Report on Form 10-K for the year ended December 31, 2015 filed on February 26, 2016. | ||||
Incorporated by reference to Exhibit 3.2 to our Annual Report on Form 10-K for the year ended December 31, 2015 filed on February 26, 2016. | ||||
135
Exhibit No. | Description | Incorporation by Reference | ||
Incorporated by reference to Exhibit 4.1 to our Current Report on Form 8-K filed on January 17, 2012. | ||||
Incorporated by reference to Exhibit 4.2 to our Current Report on Form 8-K filed on August 23, 2012. | ||||
Incorporated by reference to Exhibit A of Exhibit 4.2 to our Current Report on Form 8-K filed on August 23, 2012. | ||||
Incorporated by reference to Exhibit 4.1 to our Current Report on Form 8-K filed on July 5, 2017. | ||||
Incorporated by reference to Exhibit 4.2 to our Current Report on Form 8-K filed on August 20, 2013. | ||||
Incorporated by reference to Exhibit A of Exhibit 4.2 to our Current Report on Form 8-K filed on August 20, 2013. | ||||
Incorporated by reference to Exhibit 4.2 to our Current Report on Form 8-K filed on July 5, 2017. | ||||
Incorporated by reference to Exhibit 10.1 to our Current Report on Form 8-K filed on December 21, 2015. | ||||
Filed herewith. | ||||
Incorporated by reference to Exhibit 10.2 to our Current Report on Form 8-K filed on August 20, 2010. | ||||
Incorporated by reference to Exhibit 10.2 to our Current Report on Form 8-K filed on November 18, 2011. | ||||
Incorporated by reference to Exhibit 10.4 to our Current Report on Form 8-K filed on October 3, 2012. | ||||
Incorporated by reference to Exhibit 10.7.2 to our Quarterly Report on Form 10-Q for the period ended September 30, 2014 filed on November 5, 2014. | ||||
Incorporated by reference to Exhibit 10.1 to our Current Report on Form 8-K filed on May 29, 2014. | ||||
Incorporated by reference to Exhibit 10.2 to our Quarterly Report on Form 10-Q for the period ended September 30, 2014 filed on November 5, 2014. | ||||
Incorporated by reference to Exhibit 10.11 to our Annual Report on Form 10-K for the year ended December 31, 2014 filed on February 27, 2015. | ||||
Incorporated by reference to Exhibit 10.4 to our Quarterly Report on Form 10-Q for the period ended September 30, 2014 filed on November 5, 2014. | ||||
136
Exhibit No. | Description | Incorporation by Reference | ||
Incorporated by reference to Exhibit 10.5 to our Quarterly Report on Form 10-Q for the period ended September 30, 2014 filed on November 5, 2014. | ||||
Incorporated by reference to Exhibit 10.1 to our Quarterly Report on Form 10-Q for the period ended March 31, 2015 filed on May 7, 2015. | ||||
Incorporated by reference to Exhibit 10.2 to our Quarterly Report on Form 10-Q for the period ended March 31, 2015 filed on May 7, 2015. | ||||
Incorporated by reference to Exhibit 10.4 to our Quarterly Report on Form 10-Q for the period ended June 30, 2016 filed on August 9, 2016. | ||||
Incorporated by reference to Exhibit 10.6 to our Quarterly Report on Form 10-Q for the period ended June 30, 2016 filed on August 9, 2016. | ||||
Incorporated by reference to Exhibit 10.6.11 to our Annual Report on Form 10-K for the period ended December 31, 2016 filed on February 28, 2017. | ||||
Incorporated by reference to Exhibit 10.11 to our Quarterly Report on Form 10-Q for the period ended March 31, 2017 filed on May 10, 2017. | ||||
Incorporated by reference to Exhibit 10.12 to our Quarterly Report on Form 10-Q for the period ended March 31, 2017 filed on May 10, 2017. | ||||
Incorporated by reference to Exhibit 10.9 to our Annual Report on Form 10-K for the year ended December 31, 2014 filed on February 27, 2015. | ||||
Incorporated by reference to Exhibit 10.2 to our Quarterly Report on Form 10-Q for the period ended March 31, 2017 filed on May 10, 2017. | ||||
Incorporated by reference to Exhibit 10.6 to our Quarterly Report on Form 10-Q for the period ended September 30, 2014 filed on November 5, 2014. | ||||
Filed herewith. | ||||
Filed herewith. | ||||
Incorporated by reference to Exhibit 10.5 to our Current Report on Form 8-K filed on October 3, 2012. | ||||
Incorporated by reference to Exhibit 10.1 to our Current Report on Form 8-K filed on May 25, 2016. | ||||
Incorporated by reference to Exhibit 10.17 to our Annual Report on Form 10-K for the year ended December 31, 2014 filed on February 27, 2015. | ||||
Filed herewith. | ||||
Incorporated by reference to Exhibit 10.7 to our Quarterly Report on Form 10-Q for the period ended June 30, 2016 filed on August 9, 2016. | ||||
137
Exhibit No. | Description | Incorporation by Reference | ||
Filed herewith. | ||||
Incorporated by reference to Exhibit 10.10 to our Quarterly Report on Form 10-Q for the period ended March 31, 2017 filed on May 10, 2017. | ||||
Incorporated by reference to Exhibit 10.2 to our Quarterly Report on Form 10-Q for the period ended September 30, 2017 filed on November 8, 2017. | ||||
Filed herewith. | ||||
Incorporated by reference to Exhibit 1.1 to our Current Report on Form 8-K filed on August 14, 2012. | ||||
Incorporated by reference to Exhibit 1.1 to our Current Report on Form 8-K filed on August 12, 2013. | ||||
Incorporated by reference to Exhibit 10.1 to our Quarterly Report on Form 10-Q for the period ended September 30, 2015 filed on November 5, 2015. | ||||
Incorporated by reference to Exhibit 10.2 to our Quarterly Report on Form 10-Q for the period ended September 30, 2015 filed on November 5, 2015. | ||||
Incorporated by reference to Exhibit 10.1 to our Current Report on Form 8-K filed on December 28, 2016. | ||||
Incorporated by reference to Exhibit 10.1 to our Current Report on Form 8-K filed on June 19, 2017. | ||||
Incorporated by reference to Exhibit 10.1 to our Current Report on Form 8-K filed on February 15, 2017. | ||||
Incorporated by reference to Exhibit 10.2 to our Current Report on Form 8-K filed on June 19, 2017. | ||||
Incorporated by reference to Exhibit 10.1 to our Current Report on Form 8-K filed on April 28, 2017. | ||||
138
Exhibit No. | Description | Incorporation by Reference | ||
Incorporated by reference to Exhibit 10.3 to our Quarterly Report on Form 10-Q for the period ended March 31, 2017 filed on May 10, 2017. | ||||
Incorporated by reference to Exhibit 10.4 to our Quarterly Report on Form 10-Q for the period ended March 31, 2017 filed on May 10, 2017. | ||||
Incorporated by reference to Exhibit 10.5 to our Quarterly Report on Form 10-Q for the period ended March 31, 2017 filed on May 10, 2017. | ||||
Incorporated by reference to Exhibit 10.6 to our Quarterly Report on Form 10-Q for the period ended March 31, 2017 filed on May 10, 2017. | ||||
Filed herewith. | ||||
Filed herewith. | ||||
Filed herewith. | ||||
Filed herewith. | ||||
Filed herewith. | ||||
Incorporated by reference to Exhibit 10.9 to our Quarterly Report on Form 10-Q for the period ended March 31, 2017 filed on May 10, 2017. | ||||
Incorporated by reference to Exhibit 10.1 to our Quarterly Report on Form 10-Q for the period ended September 30, 2017 filed on November 8, 2017. | ||||
Filed herewith. | ||||
Filed herewith. | ||||
Incorporated by reference to Exhibit 10.5 to our Quarterly Report on Form 10-Q for the period ended June 30, 2017 filed on August 9, 2017. | ||||
Incorporated by reference to Exhibit 10.6 to our Quarterly Report on Form 10-Q for the period ended June 30, 2017 filed on August 9, 2017. | ||||
Filed herewith. | ||||
139
Exhibit No. | Description | Incorporation by Reference | ||
Filed herewith. | ||||
Incorporated by reference to Exhibit 10.1 to our Current Report on Form 8-K filed on June 29, 2017. | ||||
Filed herewith. | ||||
Filed herewith. | ||||
Filed herewith. | ||||
Filed herewith. | ||||
Incorporated by reference to the signature page to this Annual Report on Form 10-K. | ||||
Filed herewith. | ||||
Filed herewith. | ||||
Furnished herewith. | ||||
Furnished herewith. | ||||
101.INS | XBRL Instance Document | Filed herewith. | ||
101.SCH | XBRL Taxonomy Extension Schema Document | Filed herewith. | ||
101.CAL | XBRL Taxonomy Extension Calculation Linkbase Document | Filed herewith. | ||
101.LAB | XBRL Taxonomy Extension Labels Linkbase Document | Filed herewith. | ||
101.PRE | XBRL Taxonomy Extension Presentation Linkbase Document | Filed herewith. | ||
101.DEF | XBRL Taxonomy Extension Definition Linkbase Document | Filed herewith. | ||
________________
† Management or compensatory plan or arrangement required to be filed pursuant to Item 601(b)(10) of Regulation S-K.
‡ | Confidential treatment has been requested for certain portions of this Exhibit pursuant to an order under the Exchange Act which portions have been omitted and filed separately with the Commission. |
‡‡ Confidential treatment has been granted for certain portions of this Exhibit pursuant to an order under the Exchange Act which portions have been omitted and filed separately with the Commission.
140