Attached files
| file | filename |
|---|---|
| EX-99.2 - TRANSCRIPT TO THE 2010 ANNUAL MEETING - TIDEWATER INC | dex992.htm |
| 8-K - FORM 8-K - TIDEWATER INC | d8k.htm |
 FISCAL
2010 ANNUAL FISCAL 2010 ANNUAL
SHAREHOLDERS MEETING
SHAREHOLDERS MEETING
July 22, 2010
July 22, 2010
Jeffrey M. Platt
Jeffrey M. Platt
Chief Operations Officer
Chief Operations Officer
Dean E. Taylor
Dean E. Taylor
Chairman, President and
Chairman, President and
Chief Executive Officer
Chief Executive Officer
Quinn P. Fanning
Quinn P. Fanning
Executive Vice President
Executive Vice President
and Chief Financial Officer
and Chief Financial Officer
Exhibit 99.1 |
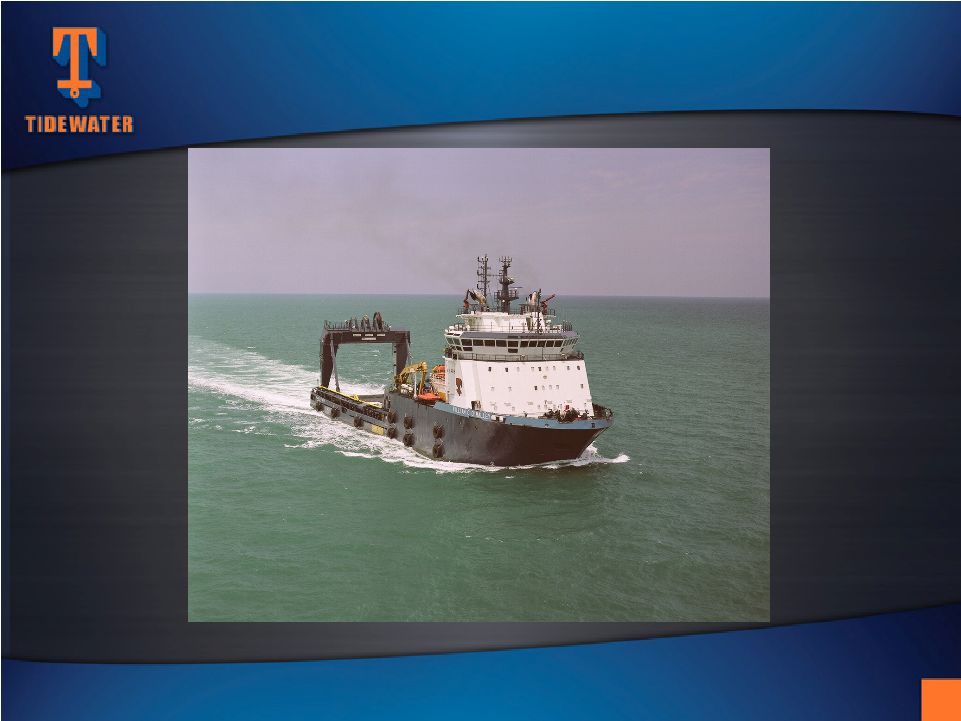
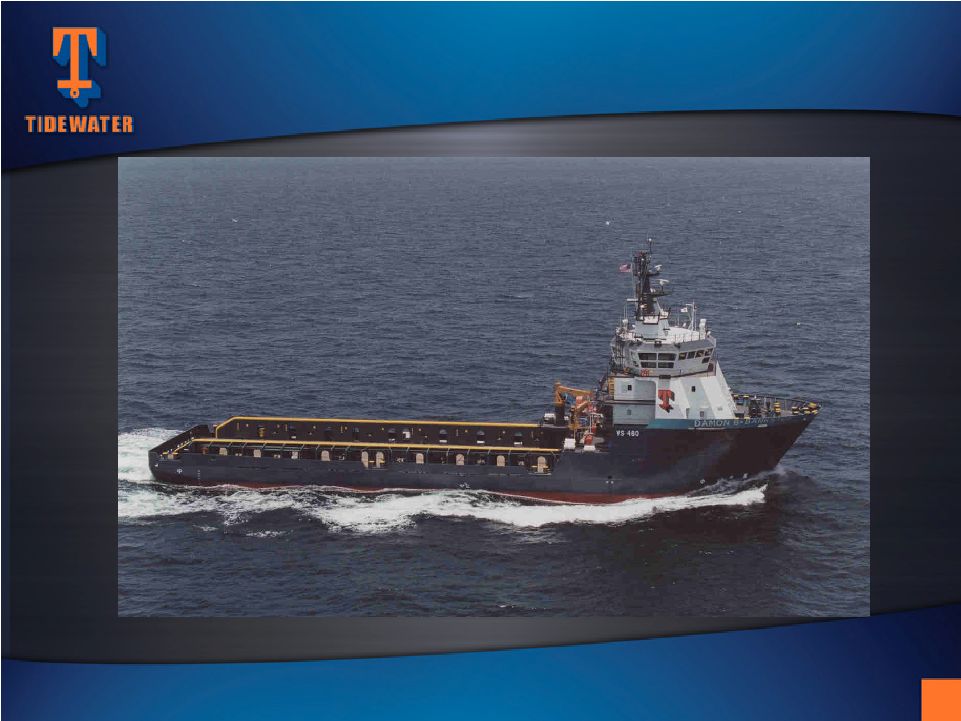 M/V
DAMON B. BANKSTON M/V DAMON B. BANKSTON
2 |
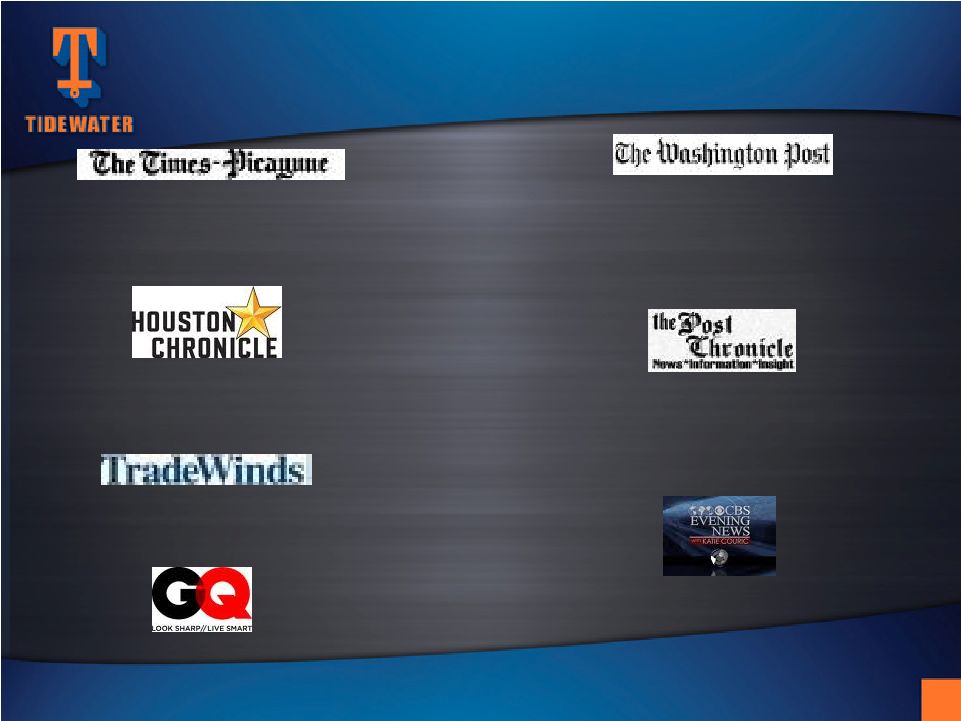 “Terror, daring rescue in Gulf of
Mexico oil rig explosion recounted”
May 7, 2010
“Sea captain tells of rig blast in gritty detail”
May 11, 2010
“Horizon hero hits the U.S.”
May 21, 2010
“Boom”
July 2010
“U.S. rig witness recalls
rain of mud, green flash”
May 11, 2010
“In the Gulf of Mexico, what went wrong
with the Deepwater Horizon oil drilling rig?”
May 9, 2010
“Oil crew rescuer opens
up about explosion”
May 13, 2010
“MEDIA COVERAGE OF HEROIC EFFORTS”
“MEDIA COVERAGE OF HEROIC EFFORTS”
3 |
 THE CREW
OF THE THE CREW OF THE
DAMON B. BANKSTON
DAMON B. BANKSTON
4 |
 CHAIRMAN’S AWARD
5 |
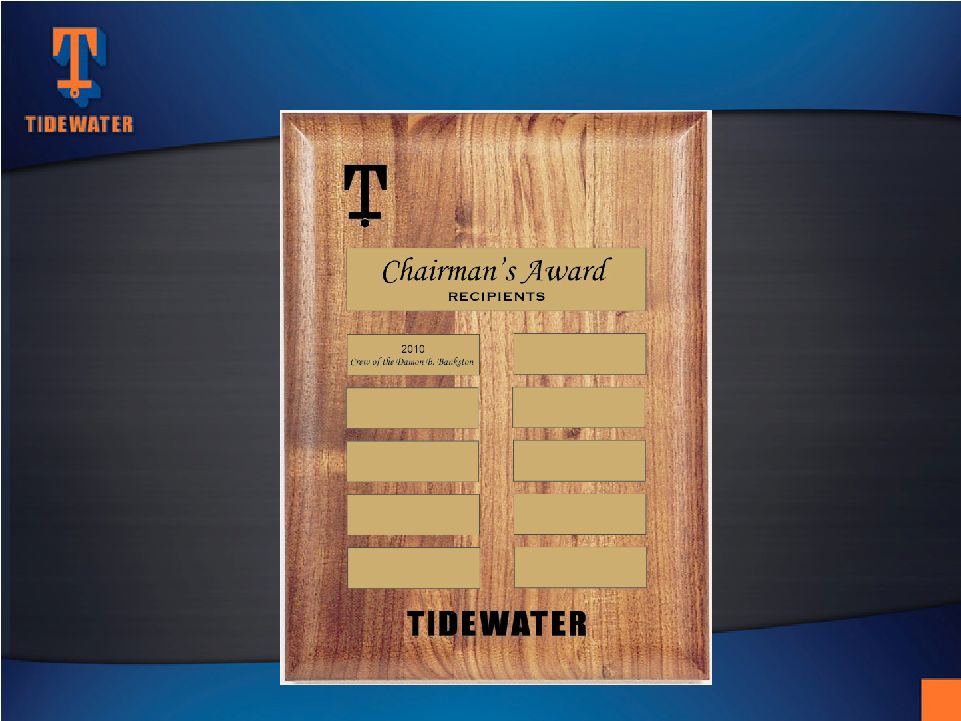 “CHAIRMAN’S AWARD”
PLAQUE
PLAQUE
6 |
 OPERATIONS REVIEW
Jeff Platt –
Jeff Platt –
Chief Operations Officer
Chief Operations Officer
7 |
 FORWARD-LOOKING STATEMENTS
8
Phone:
504.568.1010
Fax:
504.566.4580
Web:
www.tdw.com
Email:
connect@tdw.com
In accordance with the safe harbor provisions of the Private Securities Litigation Reform
Act
of
1995,
the
Company
notes
that
certain
statements
set
forth
in
this
presentation
provide other than historical information and are forward looking. The actual
achievement of any forecasted results, or the unfolding of future economic or business
developments in a way anticipated or projected by the Company, involve numerous risks
and uncertainties that may cause the Company’s actual performance to be materially
different from that stated or implied in the forward-looking statement. Among those risks
and uncertainties, many of which are beyond the control of the Company, include,
without limitation, fluctuations in worldwide energy demand and oil and gas prices;
fleet additions by competitors and industry overcapacity; changes in capital spending
by customers in the energy industry for offshore exploration, development and
production; changing customer demands for vessel specifications, which may make some of
our older vessels technologically obsolete for certain customer projects or in certain
markets; instability of global financial markets and difficulty accessing
credit or capital; acts of
terrorism and piracy; significant weather conditions; unsettled political conditions, war,
civil unrest and governmental actions, such as expropriation, especially in higher risk
countries of operations; foreign currency fluctuations; labor influences proposed by
international conventions; and enforcement of laws related to the environment, labor
and foreign corrupt practices. Participants should consider all of these risk factors
as well as other information contained in the Company’s form 10-K’s and
10-Q’s. |
 SM
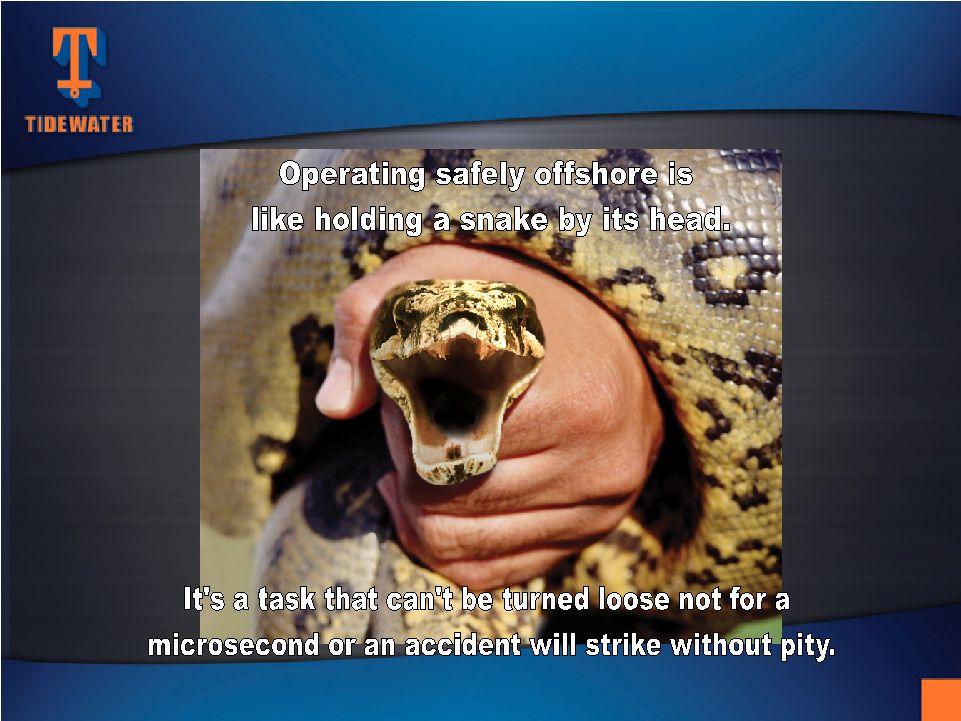
SAFETY –
SAFETY –
A TOP PRIORITY
A TOP PRIORITY
9 |
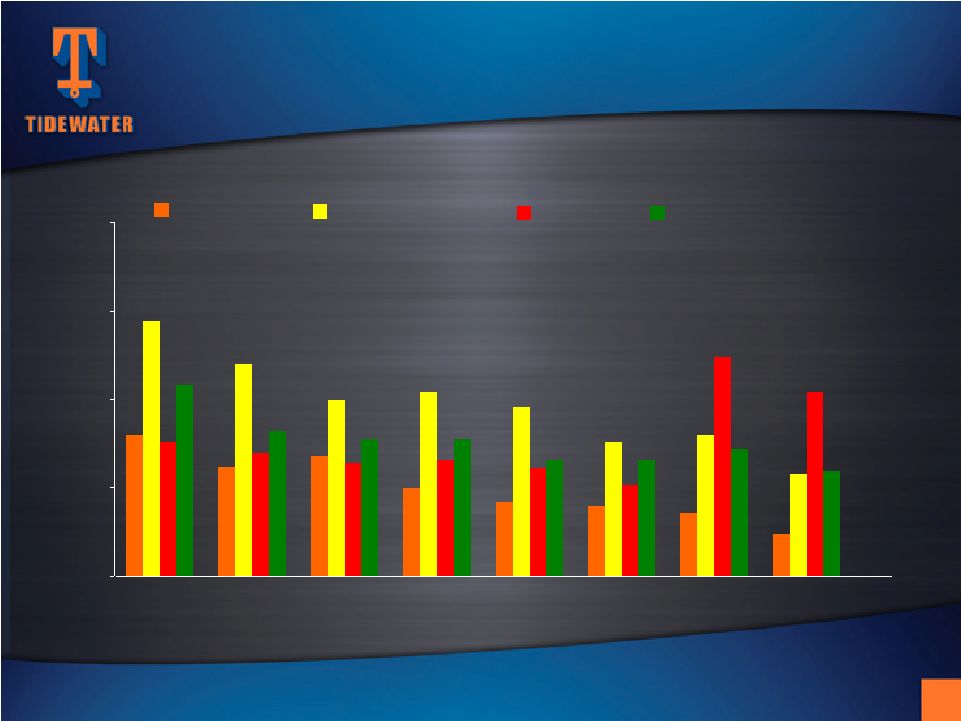 0.00
0.25
0.50
0.75
1.00
Total Recordable Incident Rates
Calendar Years
2002
2003
2004
2005
2006
2007
2008
2009
TIDEWATER
DUPONT
DOW CHEMICAL
EXXON MOBIL
SAFETY RECORD RIVALS
SAFETY RECORD RIVALS
LEADING COMPANIES
LEADING COMPANIES
10 |
 August 12, 2008
Over 700 days worked since
Over 70,000,000 man hours worked since
First Time in Tidewater History
ZERO LOST TIME ACCIDENTS
ZERO LOST TIME ACCIDENTS
IN FISCAL 2010
IN FISCAL 2010
11 |
           International / U.S.
2010: 93% / 7%
2000: 62% / 38%
North America
20
(7%)
Central/South America
69
(23%)
Europe / M.E.
32
(11%)
Far East
42
(14%)
West Africa
131
(45%)
VESSEL DISTRIBUTION BY REGION
(excludes
stacked
vessels
–
as
of
3/31/10)
12 |
 Unique global footprint; 50+ years of Int’l experience
Unmatched scale and scope of operations
International market opportunities
•
Growth
•
Longer contracts
•
Better utilization
•
Higher dayrates
Solid customer base of NOC’s
and IOC’s
INTERNATIONAL STRENGTH
INTERNATIONAL STRENGTH
13 |
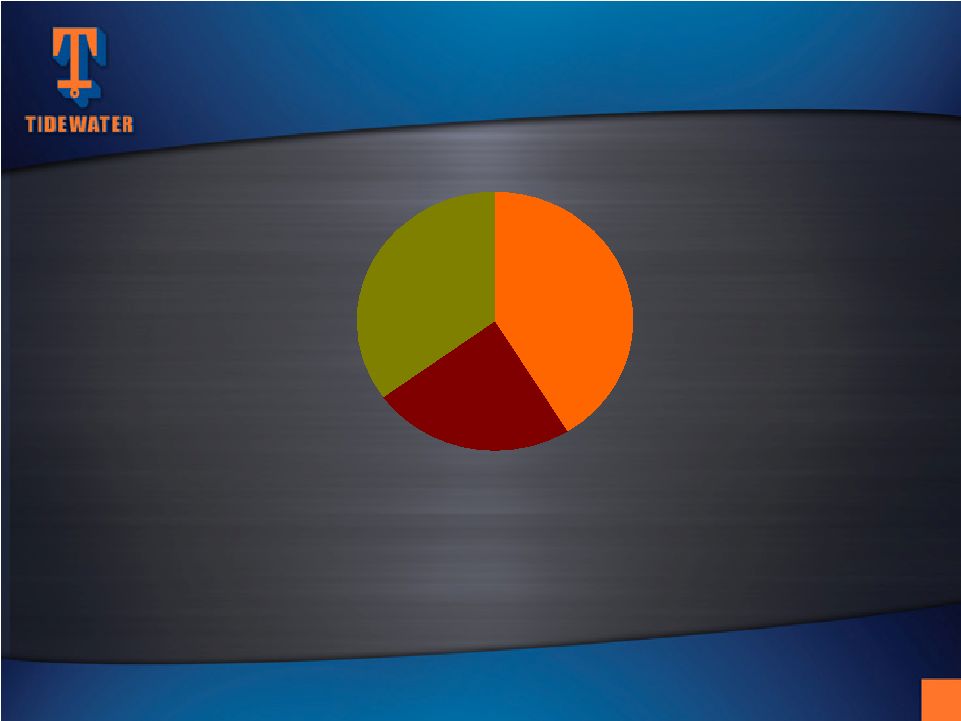 NOC's
24%
Others
35%
Super Majors
41%
Our top 10 customers in Fiscal 2010 (6 Super Majors,
3 NOC’s
and one large independent) accounted for 63% of our revenue
CURRENT REVENUE MIX
CURRENT REVENUE MIX
Quality of Customer Base
Quality of Customer Base
14 |
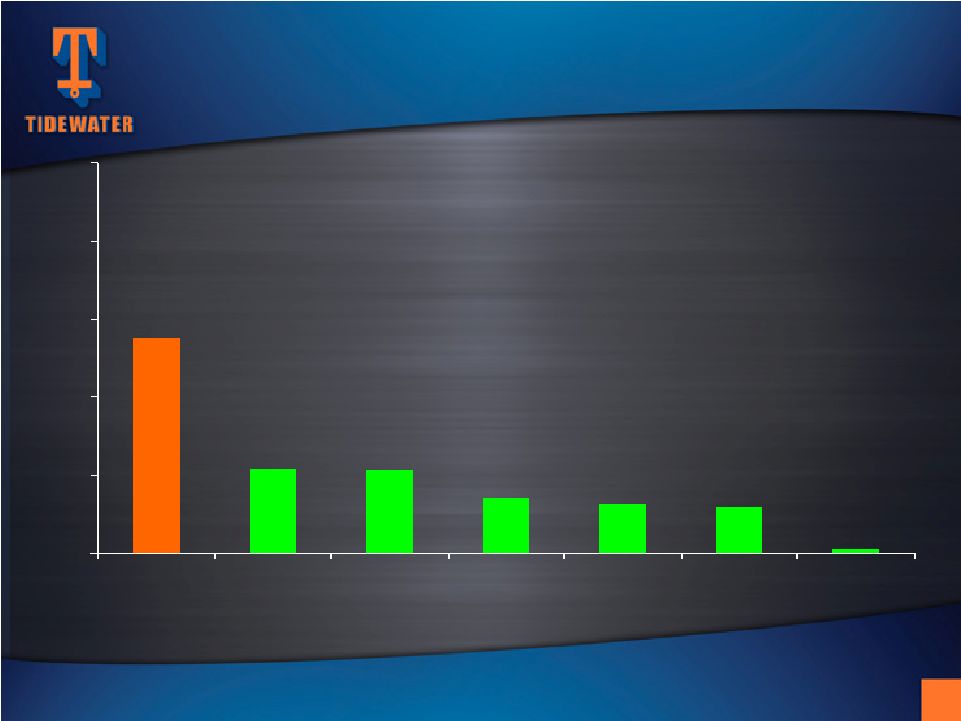 5
60
63
71
107
108
276
0
100
200
300
400
500
Source:
ODS-Petrodata
and
Tidewater
Tidewater
Competitor #2
Competitor #3
Competitor #4
Competitor # 5
Competitor #1
Avg.
All Others
(1,752 total
vessels for
300+ owners)
VESSEL POPULATION BY OWNER
(includes
AHTS’s
and
PSV’s
only)
Estimated
as
of
3/31/10
15 |
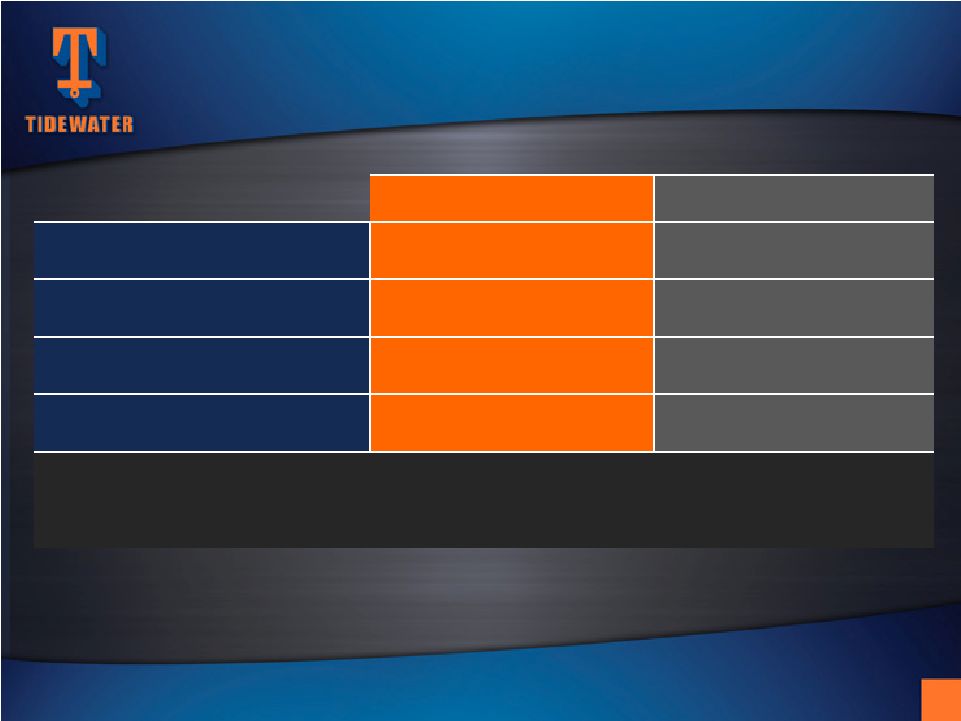 Vessel Count
Estimated Cost
AHTS
80
$1,426m
PSV’s
74
$1,449m
Crewboats
& Tugs
67
$289m
TOTALS:
221
$3,164m
At 3/31/10, 170 new vessels in fleet with ~5 year average age
Vessel Commitments
Jan. ’00 –
March ‘10
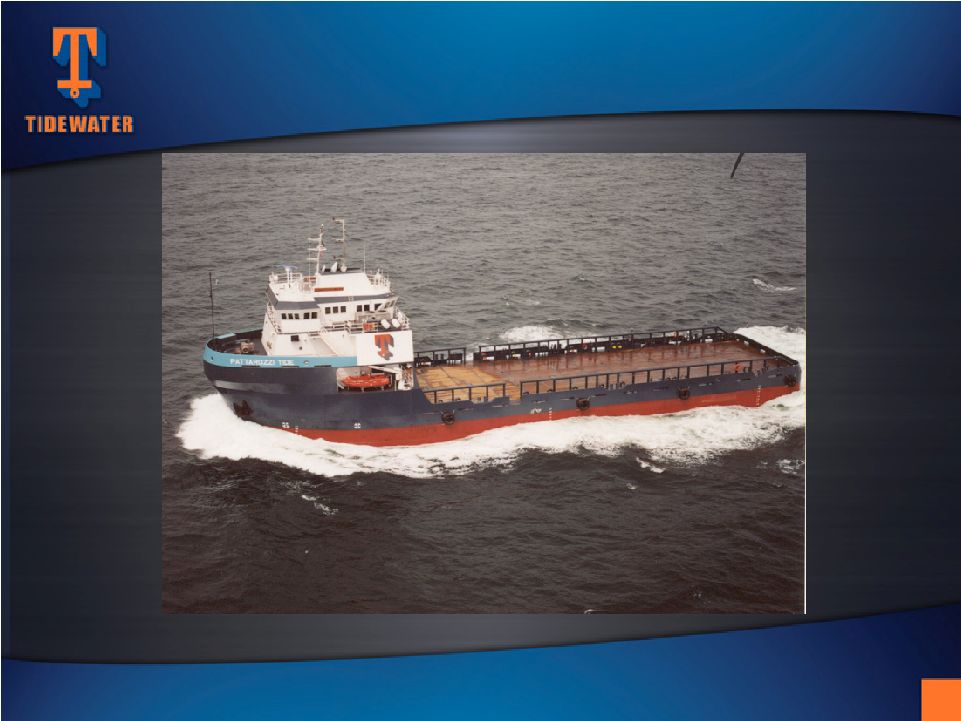
28 vessels delivered during Fiscal 2010
THE LARGEST MODERN FLEET
THE LARGEST MODERN FLEET
IN THE INDUSTRY . . . .
IN THE INDUSTRY . . . .
16 |
 Count
AHTS
18
PSV
16
Crew and Tug
2
Total
36
Vessels Under Construction*
As of March 31, 2010
* Includes five new vessels committed to purchase as of 3/31/10
21 of these vessels are expected to be delivered during Fiscal 2011
…. AND OUR LEAD IS GROWING
…. AND OUR LEAD IS GROWING
17 |
 FINANCIAL REVIEW
Quinn Fanning –
Quinn Fanning –
EVP & CFO
EVP & CFO
18 |
 Positive longer-term fundamentals
•
Global economy stabilizing; however, recovery may be slow and
choppy
•
Credit markets healthier, despite European debt crisis
•
Commodity prices support higher E&P spending (up ~12% in
2010
1
)
•
Offshore rig count recovering (ex-US GoM)
•
Market conditions require continued fleet rebalancing
1) Source: Barclays
A VIEW FROM THE BRIDGE
A VIEW FROM THE BRIDGE
19 |
 History of earnings growth and solid, through-cycle
returns
Well positioned to optimize expected market
recovery
World’s largest new fleet
•
Global operating footprint
•
High quality customer base
•
Strong financial profile
A VIEW FROM THE BRIDGE (cont.)
A VIEW FROM THE BRIDGE (cont.)
20 |
 Year Ended
3/31/10
3/31/09
Revenues
$1,169
$1,391
Adjusted Net Earnings*
$279
$407
Adjusted EPS*
$5.41
$7.89
Net Cash from Operations
$328
$526
Capital Expenditures
$452
$474
* Adjusted Net Earnings and Adjusted EPS for the year ended 3/31/10 excludes
$44.6 million, or $0.87 per share, related to provision for Venezuelan operations;
$36.1 million, or $0.70 per share, tax benefit related to favorable
resolution of tax litigation; and $11.4 million, or $0.22 per share, charge
associated with proposed settlement with the SEC. $ in Millions,
Except Per Share Data
SELECTED FINANCIAL HIGHLIGHTS
SELECTED FINANCIAL HIGHLIGHTS
21 |
 March 2010
March 2009
Cash
$223
$251
Stockholders’
Equity
$2,464
$2,245
Long-term Debt
$275
$300
Net Debt to Total Cap
2.1%
2.1%
($ in Millions)
~ $675 million of Available Liquidity at 3/31/10
(Cash plus $450m Revolver)
STRONG FINANCIAL PROFILE;
STRONG FINANCIAL PROFILE;
SIGNIFICANT AVAILABLE LIQUIDITY
SIGNIFICANT AVAILABLE LIQUIDITY
22 |
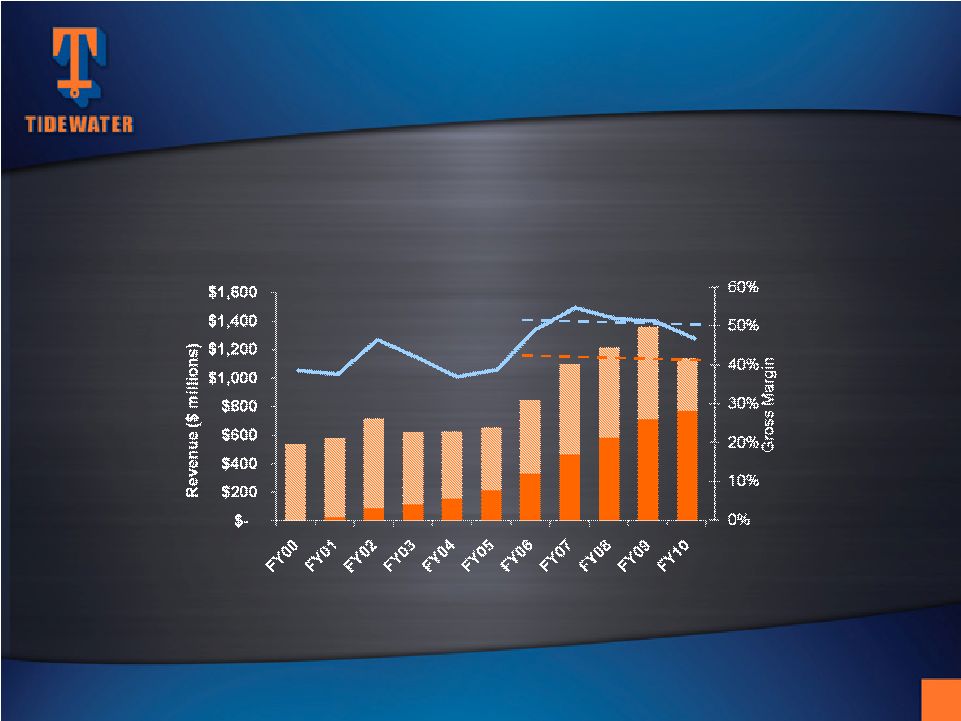 5-year average Revenue: $1,131 million
5-year average Gross Margin: 51%
5-year CAGR in New vessel revenue: ~29%
VESSEL REVENUE AND GROSS MARGINS
VESSEL REVENUE AND GROSS MARGINS
23 |
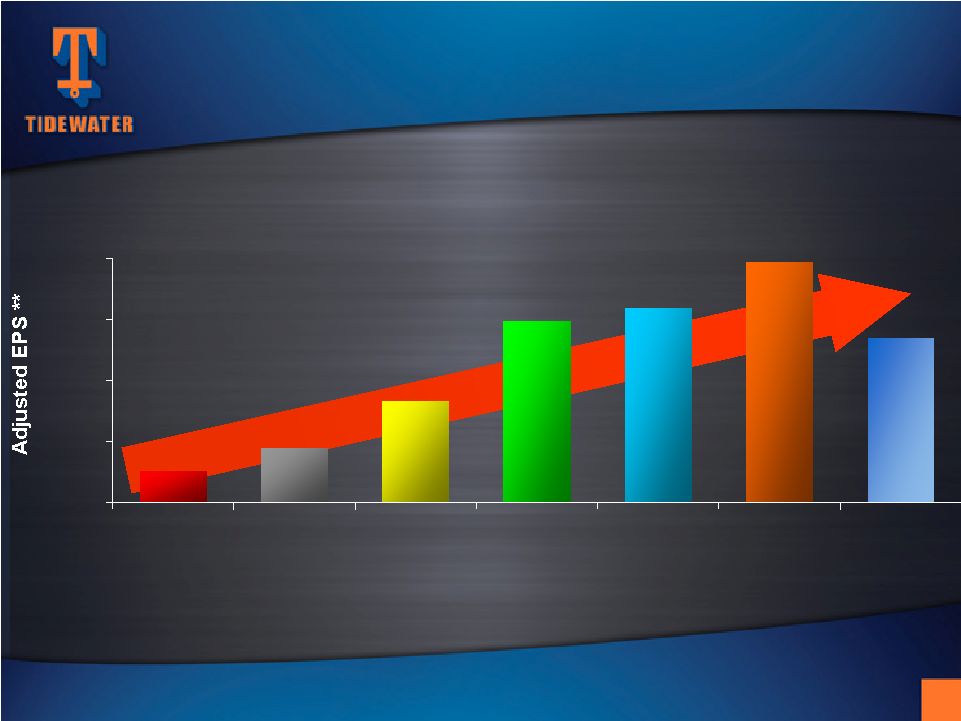 32%
Six-Year Compounded Annual Earnings Growth Rate
**
EPS
in
Fiscal
2004
is
exclusive
of
the
$.30
per
share
after
tax
impairment
charge.
EPS
in
Fiscal
2006
is
exclusive
of
the
$.74
per
share
after
tax
gain
from
the
sale
of
six
KMAR
vessels.
EPS
in
Fiscal
2007
is
exclusive
of
$.37
per
share
of
after
tax
gains
from
the
sale
of
14
offshore
tugs.
EPS
in
Fiscal
2010
is
exclusive
of
$.87
per
share
Venezuelan
provision,
a
$.70
per
share
tax
benefit
related
to
favorable
resolution
of
tax
litigation
and
a
$0.22
per
share
charge
for
the
proposed
settlement
with
the
SEC
of
the
company’s
FCPA
matter.
Adjusted Return
On Avg. Equity
4.3% 7.2%
12.4%
18.5%
18.3%
19.5%
11.9% SIGNIFICANT EARNINGS GROWTH
SIGNIFICANT EARNINGS GROWTH
24
$5.41
$7.89
$1.03
$1.78
$3.33
$5.94
$6.39
$0.00
$2.00
$4.00
$6.00
$8.00
Fiscal 2004
Fiscal 2005
Fiscal 2006
Fiscal 2007
Fiscal 2008
Fiscal 2009
Fiscal 2010 |
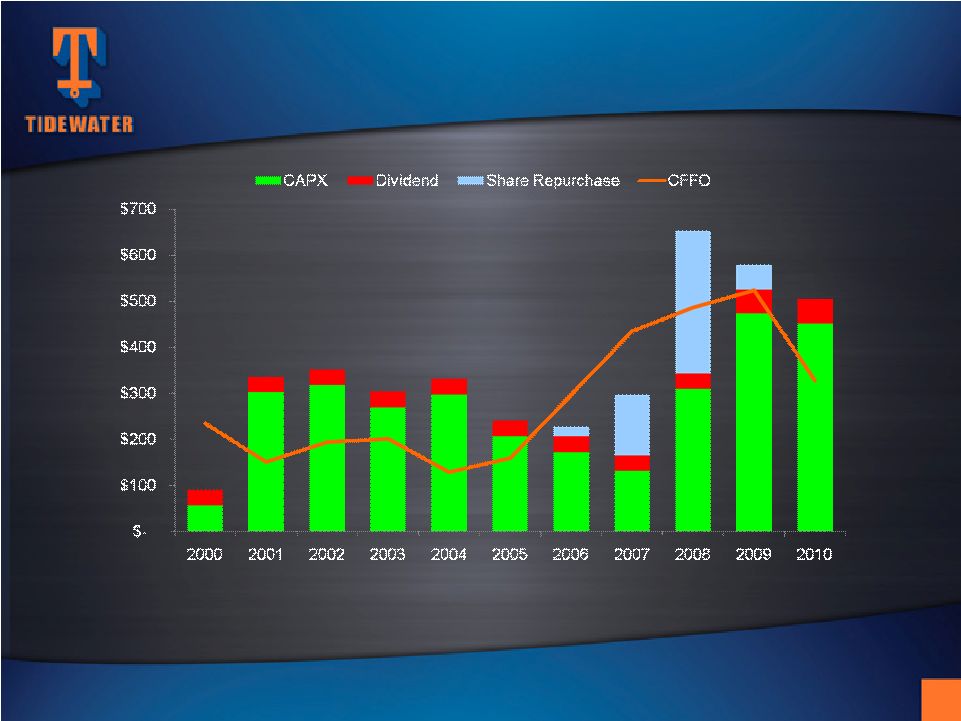 Over
an 11-year period, Tidewater invested $3.2 billion in CAPX ($2.8 billion in the “new”
fleet),
and paid out $923 million through dividends and share repurchases. Over the
same period, CFFO and proceeds from dispositions were $3.1 billion and $640
million, respectively PRIMARY USES OF CASH
PRIMARY USES OF CASH
25 |
 -50%
0%
50%
100%
150%
200%
Mar-05
Mar-06
Mar-07
Mar-08
Mar-09
Mar-10
TDW
DJIA
S&P500
OSX
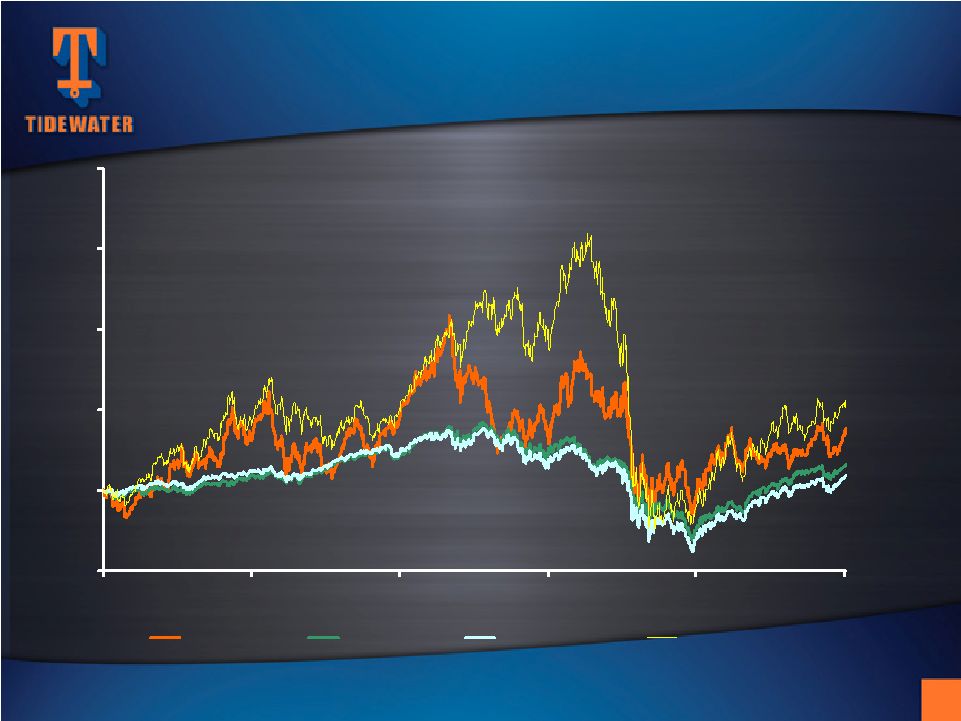
OSX 52%
S&P 500 9%
DJIA 16%
TDW 36%
RETURNS vs
RETURNS vs
the MARKET
the MARKET
FIVE YEAR STOCKHOLDER RETURN
FIVE YEAR STOCKHOLDER RETURN
26 |
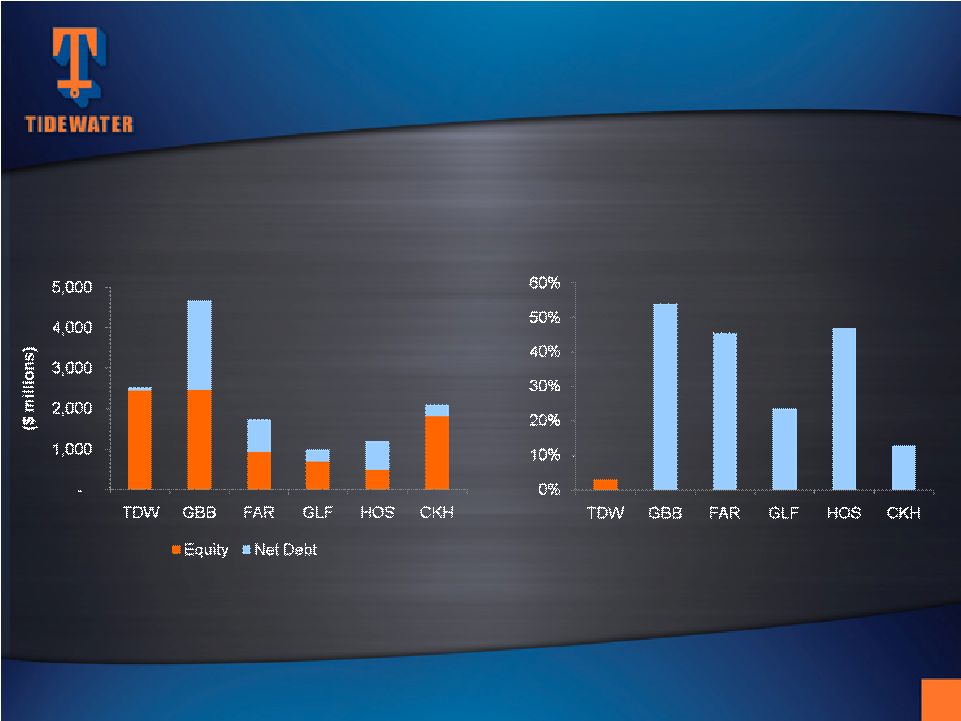 Balance Sheet data as of March 31, 2010, except GBB (12/31/09)
Net Debt = ST + LT Debt, Less Cash
Equity = Share price (in USD) at 3/31 times shares outstanding at 3/31, except GBB
(12/31) USD/EUR = 1.263; USD/NOK = 0.156
Capitalization (Market)
Net Debt / Net Book Capital
CAPITALIZATION OF KEY
CAPITALIZATION OF KEY
OSV COMPANIES
OSV COMPANIES
27 |
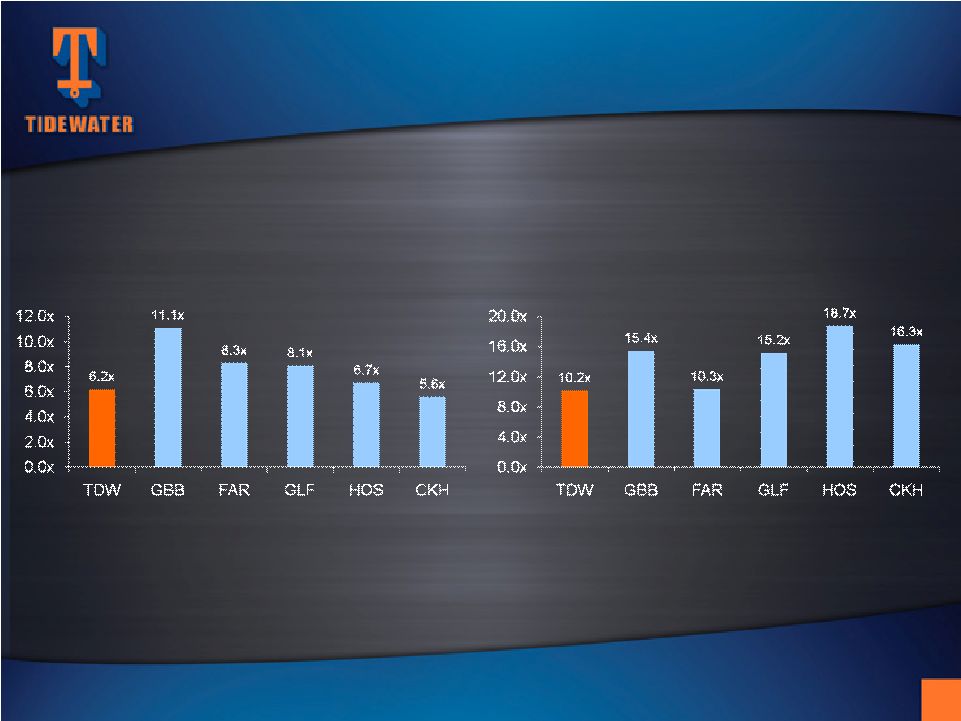 Enterprise Value / EBITDA
Price / Earnings
Source: FBR Capital Markets Corporation
Maritime Comparable Company Analysis
June 28, 2010
RELATIVE VALUATIONS
RELATIVE VALUATIONS
28
Dividend Yield
2.5%
2.6%
2.6%
--
--
-- |
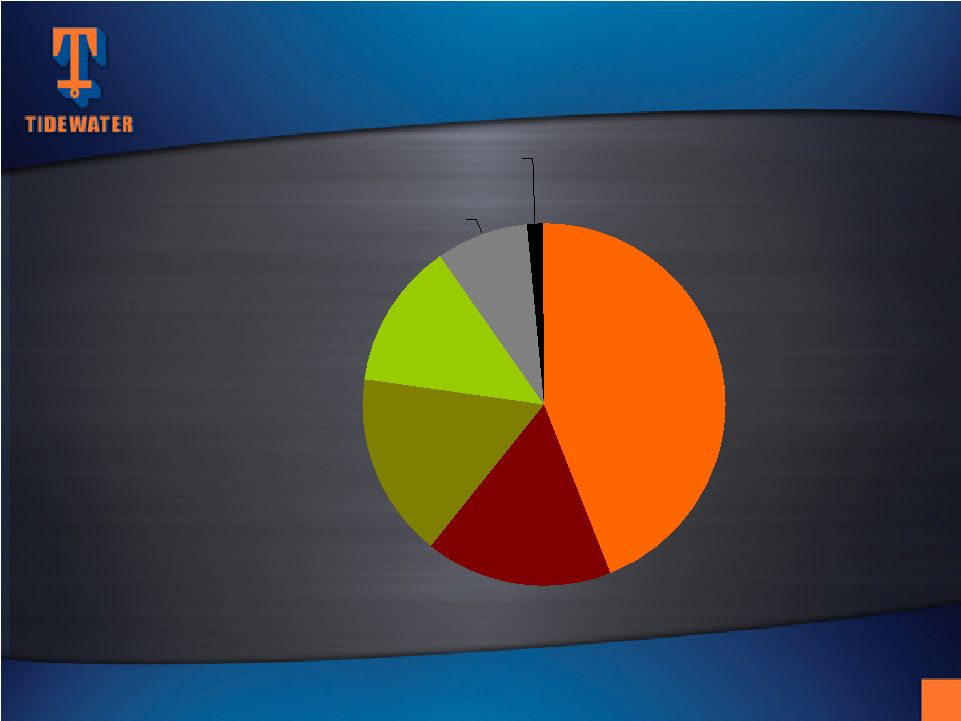 Source: Thomson Reuters
As of June 28, 2010
~71% of non-index investors
focused on long-term value creation
STOCK OWNERSHIP
STOCK OWNERSHIP
BY INVESTMENT STYLE
BY INVESTMENT STYLE
29
GARP
17%
Index
17%
Growth
13%
Income
8%
Specialty
1%
Value
43% |
 Maintain
Financial Strength
EVA-Based Investments
On Through-cycle Basis
Deliver Results
FINANCIAL STRATEGY FOCUSED ON
FINANCIAL STRATEGY FOCUSED ON
CREATING LONG-TERM SHAREHOLDER VALUE
CREATING LONG-TERM SHAREHOLDER VALUE
30 |
 FISCAL
2010 ANNUAL FISCAL 2010 ANNUAL
SHAREHOLDERS MEETING
SHAREHOLDERS MEETING
July 22, 2010
July 22, 2010
Jeffrey M. Platt
Jeffrey M. Platt
Chief Operations Officer
Chief Operations Officer
Dean E. Taylor
Dean E. Taylor
Chairman, President and
Chairman, President and
Chief Executive Officer
Chief Executive Officer
Quinn P. Fanning
Quinn P. Fanning
Executive Vice President
Executive Vice President
and Chief Financial Officer
and Chief Financial Officer |