Attached files
| file | filename |
|---|---|
| 8-K - FORM 8-K - Nuverra Environmental Solutions, Inc. | d8k.htm |
Exhibit 99.1
Exhibit 99.1
Credit Suisse 1st Annual Future of Energy Conference Washington, D.C.
June 3, 2010
The Convergence of Water and Energy
Donald G. Ezzell
Legal Disclaimer
This presentation may contain statements about future events, outlook, plans, and expectations of Heckmann Corporation (“Heckmann”) all of which are forward-looking statements within the meaning of the Private Securities Litigation Reform Act of 1995. These forward-looking statements include, but are not limited to, statements related to the status of the business, benefits of various current and prospective transactions and business alliances, expansion plans and opportunities, and attempts to enter new and existing markets for the products and services of Heckmann.
These forward-looking statements are based on information available to Heckmann as of the date of this document and current expectations, forecasts and assumptions and involve a number of risks and uncertainties. Accordingly, forward-looking statements should not be relied upon as representing Heckmann’s views as of any subsequent date and Heckmann does not undertake any obligation to update forward-looking statements to reflect events or circumstances after the date they were made. Any statement in this presentation that is not a historical fact may be deemed to be a forward-looking statement. These forward-looking statements rely on a number of assumptions concerning future events that are believed to be reasonable, but are subject to a number of risks, uncertainties and other factors, many of which are outside Heckmann’s control, and which could cause the actual results, performance or achievements of Heckmann to be materially different. While we believe that the assumptions concerning future events are reasonable, we caution that there are inherent difficulties in predicting certain important factors that could impact the future performance or results of our businesses.
Information concerning risks, uncertainties, and additional factors that could cause results to differ materially from those projected in the forward-looking statements is contained in our Annual, Quarterly, and Periodic Current Reports filed with the Securities and Exchange Commission.
Stockholders will also be able to obtain a copy of the presentation, without charge, by accessing our internet website
(http://www.heckmanncorp.com) or by directing a request to: Heckmann Corporation, 75080 Frank Sinatra Drive, Palm Desert, California 92211. The presentation can also be obtained, without charge, at the U.S. Securities and Exchange Commission’s internet site (http://www.sec.gov).
| 2 |
|
The Convergence of Water and Energy
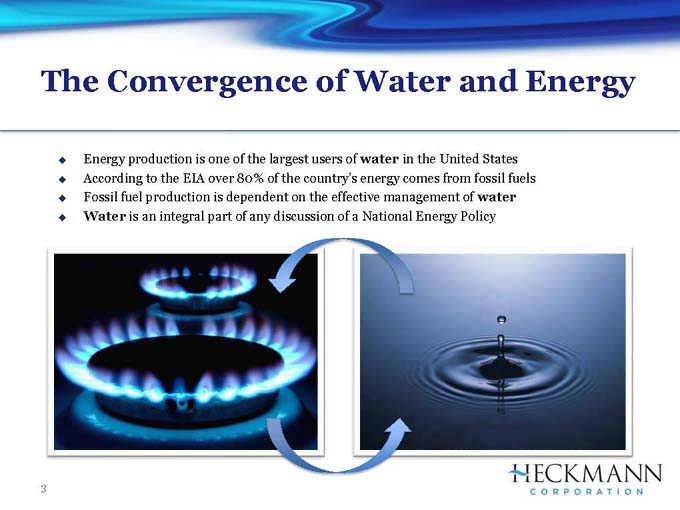
Energy production is one of the largest users of water in the United States
According to the EIA over 80% of the country’s energy comes from fossil fuels
Fossil fuel production is dependent on the effective management of water
Water is an integral part of any discussion of a National Energy Policy
| 3 |
|
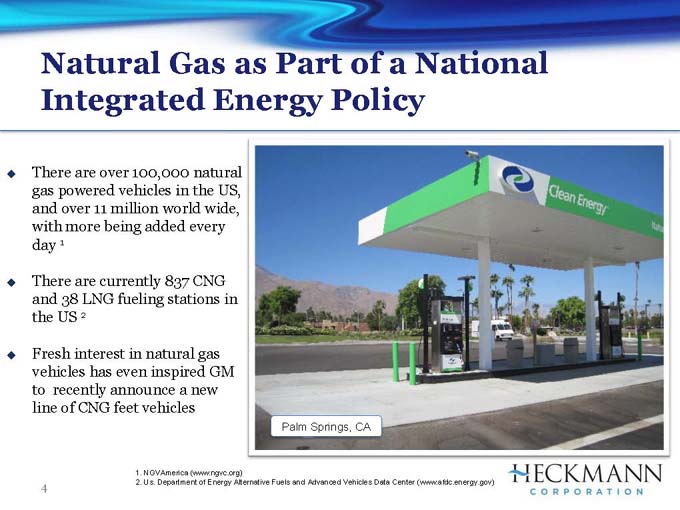
Natural Gas as Part of a National Integrated Energy Policy
There are over 100,000 natural gas powered vehicles in the US, and over 11 million world wide, with more being added every day 1
There are currently 837 CNG and 38 LNG fueling stations in the US 2
Fresh interest in natural gas vehicles has even inspired GM to recently announce a new line of CNG feet vehicles
Palm Springs, CA
1. NGVAmerica (www.ngvc.org)
2. Us. Department of Energy Alternative Fuels and Advanced Vehicles Data Center (www.afdc.energy.gov)
| 4 |
|
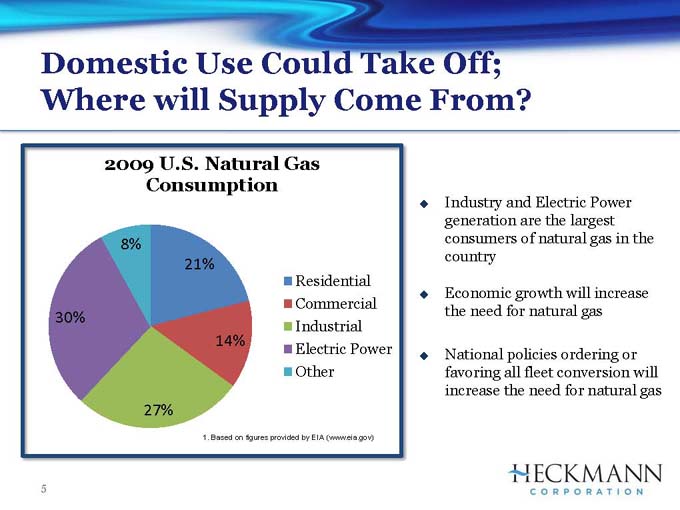
Domestic Use Could Take Off; Where will Supply Come From?
2009 U.S. Natural Gas Consumption
Residential
Commercial
Industrial
Electric Power
Other
8%
21%
30%
14%
27%
1. Based on figures provided by EIA (www.eia.gov)
Industry and Electric Power generation are the largest consumers of natural gas in the country
Economic growth will increase the need for natural gas
National policies ordering or favoring all fleet conversion will increase the need for natural gas
| 5 |
|
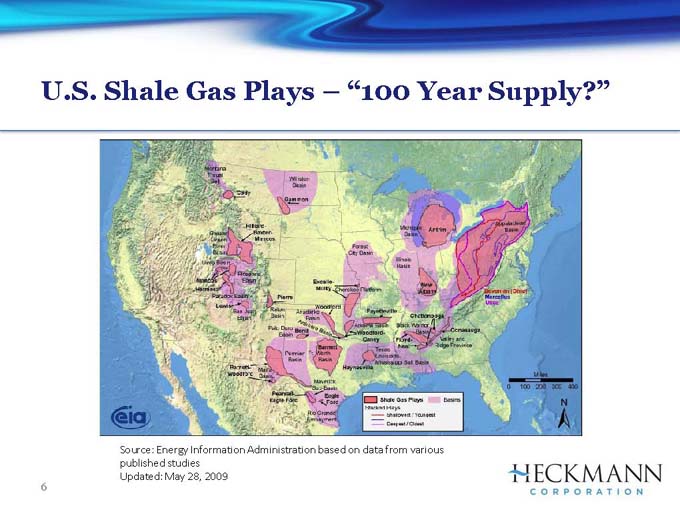
U.S. Shale Gas Plays “100 Year Supply?”
Source: Energy Information Administration based on data from various published studies Updated: May 28, 2009
| 6 |
|
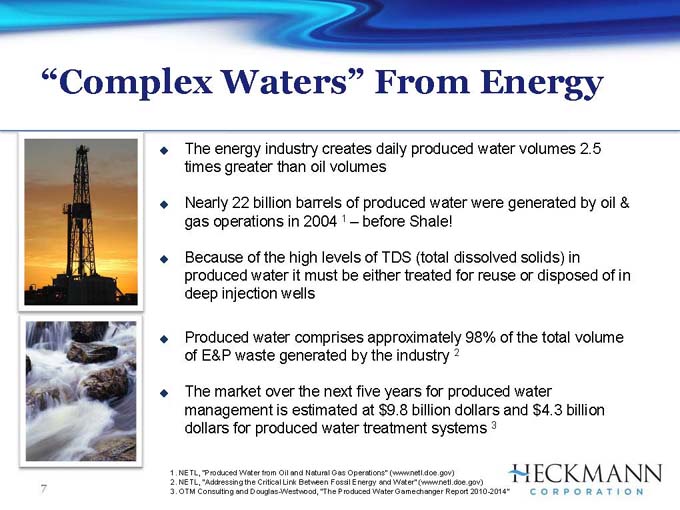
“Complex Waters” From Energy
The energy industry creates daily produced water volumes 2.5 times greater than oil volumes
Nearly 22 billion barrels of produced water were generated by oil & gas operations in 2004 1 before Shale!
Because of the high levels of TDS (total dissolved solids) in produced water it must be either treated for reuse or disposed of in deep injection wells
Produced water comprises approximately 98% of the total volume of E&P waste generated by the industry 2
The market over the next five years for produced water management is estimated at $9.8 billion dollars and $4.3 billion dollars for produced water treatment systems 3
1. NETL, “Produced Water from Oil and Natural Gas Operations” (www.netl.doe.gov)
2. NETL, “Addressing the Critical Link Between Fossil Energy and Water” (www.netl.doe.gov)
3. OTM Consulting and Douglas-Westwood, “The Produced Water Gamechanger Report 2010-2014”
| 7 |
|
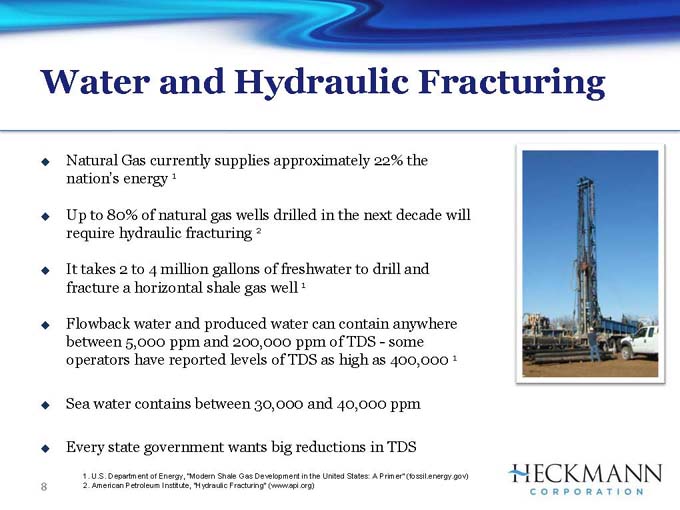
Water and Hydraulic Fracturing
Natural Gas currently supplies approximately 22% the nation’s energy 1
Up to 80% of natural gas wells drilled in the next decade will require hydraulic fracturing 2
It takes 2 to 4 million gallons of freshwater to drill and fracture a horizontal shale gas well 1
Flowback water and produced water can contain anywhere between 5,000 ppm and 200,000 ppm of TDS—some operators have reported levels of TDS as high as 400,000 1
Sea water contains between 30,000 and 40,000 ppm
Every state government wants big reductions in TDS
1. U.S. Department of Energy, “Modern Shale Gas Development in the United States: A Primer” (fossil.energy.gov)
2. American Petroleum Institute, “Hydraulic Fracturing” (www.api.org)
| 8 |
|
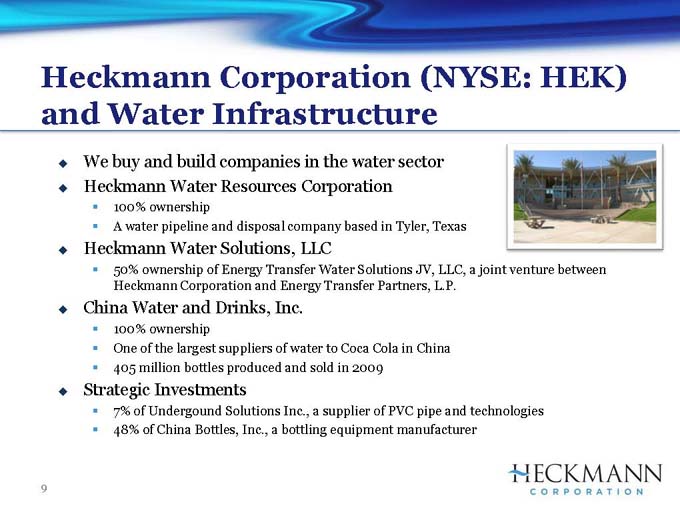
Heckmann Corporation (NYSE: HEK) and Water Infrastructure
We buy and build companies in the water sector
Heckmann Water Resources Corporation
100% ownership
A water pipeline and disposal company based in Tyler, Texas
Heckmann Water Solutions, LLC
50% ownership of Energy Transfer Water Solutions JV, LLC, a joint venture between Heckmann Corporation and Energy Transfer Partners, L.P.
China Water and Drinks, Inc.
100% ownership
One of the largest suppliers of water to Coca Cola in China
405 million bottles produced and sold in 2009
Strategic Investments
7% of Undergound Solutions Inc., a supplier of PVC pipe and technologies
48% of China Bottles, Inc., a bottling equipment manufacturer
9
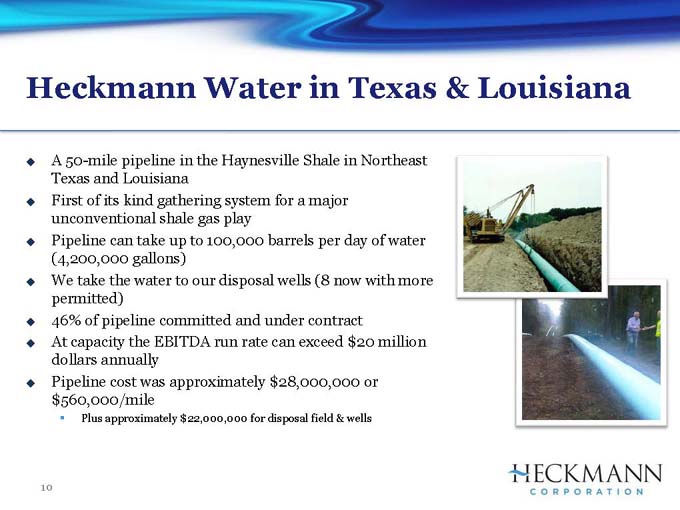
Heckmann Water in Texas & Louisiana
A 50-mile pipeline in the Haynesville Shale in Northeast Texas and Louisiana First of its kind gathering system for a major unconventional shale gas play Pipeline can take up to 100,000 barrels per day of water (4,200,000 gallons) We take the water to our disposal wells (8 now with more permitted) 46% of pipeline committed and under contract At capacity the EBITDA run rate can exceed $20 million dollars annually Pipeline cost was approximately $28,000,000 or $560,000/mile
Plus approximately $22,000,000 for disposal field & wells
10
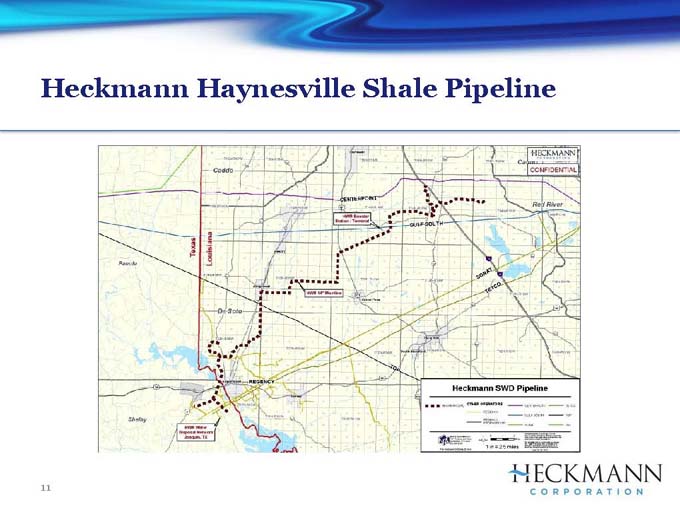
Heckmann Haynesville Shale Pipeline
11
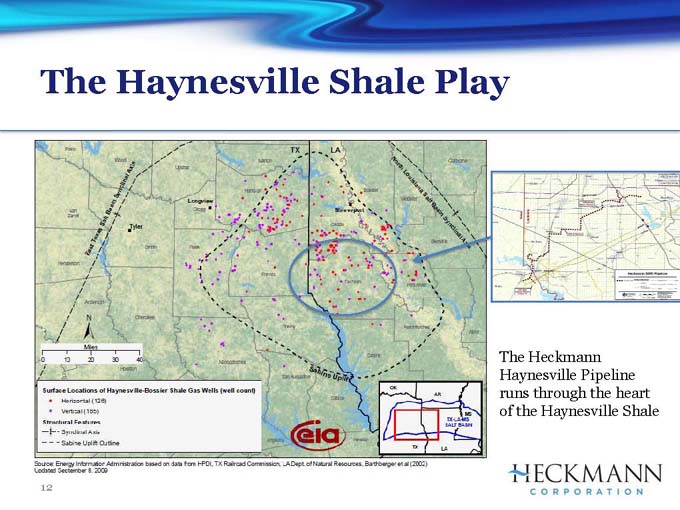
The Haynesville Shale Play
The Heckmann Haynesville Pipeline runs through the heart of the Haynesville Shale
12
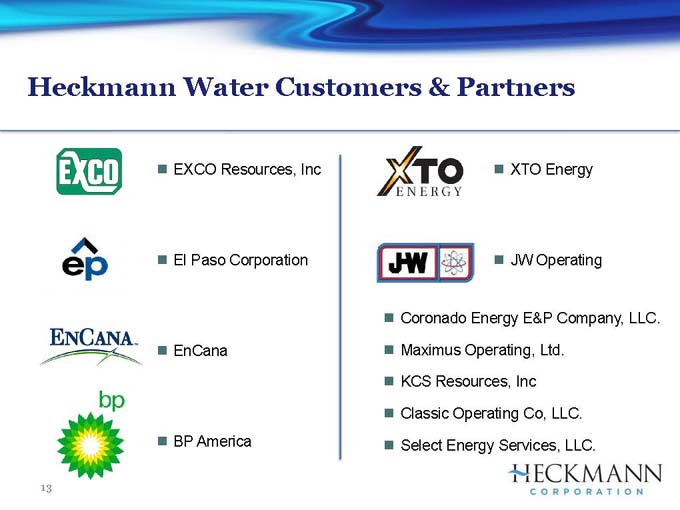
Heckmann Water Customers & Partners
EXCO Resources, Inc
E1 Paso Corporation EnCana BP America
XTO Energy
JW Operating
Coronado Energy E&P Company, LLC.
Maximus Operating, Ltd.
KCS Resources, Inc
Classic Operating Co, LLC.
Select Energy Services, LLC.
13
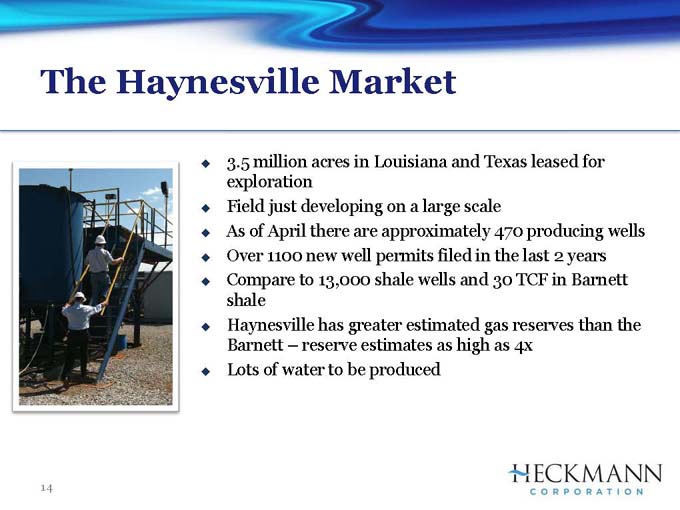
The Haynesville Market
3.5 million acres in Louisiana and Texas leased for exploration Field just developing on a large scale
As of April there are approximately 470 producing wells
Over 1100 new well permits filed in the last 2 years Compare to 13,000 shale wells and 30 TCF in Barnett shale
Haynesville has greater estimated gas reserves than the
Barnett — reserve estimates as high as 4x Lots of water to be produced
14
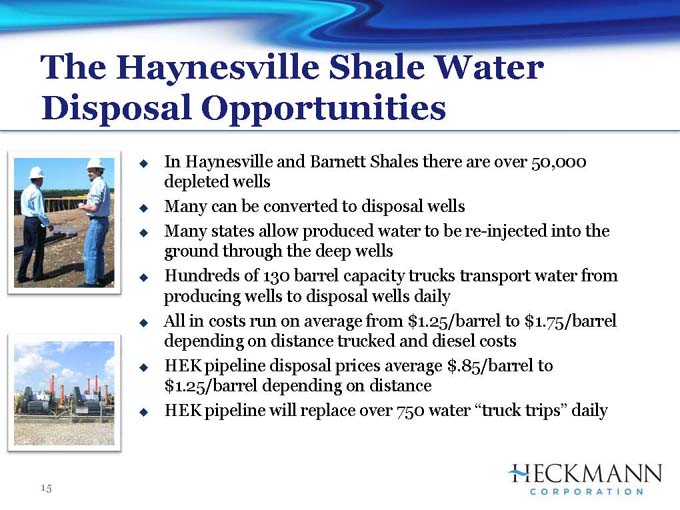
The Haynesville Shale Water
Disposal Opportunities
In Haynesville and Barnett Shales there are over 50,000 depleted wells Many can be converted to disposal wells
Many states allow produced water to be re-injected into the ground through the deep wells Hundreds of 130 barrel capacity trucks transport water from producing wells to disposal wells daily All in costs run on average from $1.25/barrel to $1.75/barrel depending on distance trucked and diesel costs HEK pipeline disposal prices average $.85/barrel to $1.25/barrel depending on distance HEK pipeline will replace over 750 water “truck
15
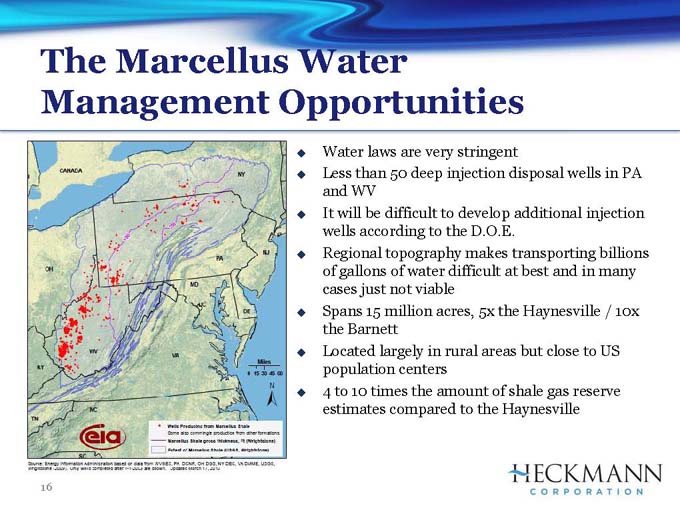
The Marcellus Water Management Opportunities
Water laws are very stringent
Less than 50 deep injection disposal wells in PA and WV
It will be difficult to develop additional injection wells according to the D.O.E.
Regional topography makes transporting billions of gallons of water difficult at best and in many cases just not viable Spans 15 million acres, 5x the Haynesville / 10x the Barnett Located largely in rural areas but close to US population centers 4 to 10 times the amount of shale gas reserve estimates compared to the Haynesville
16
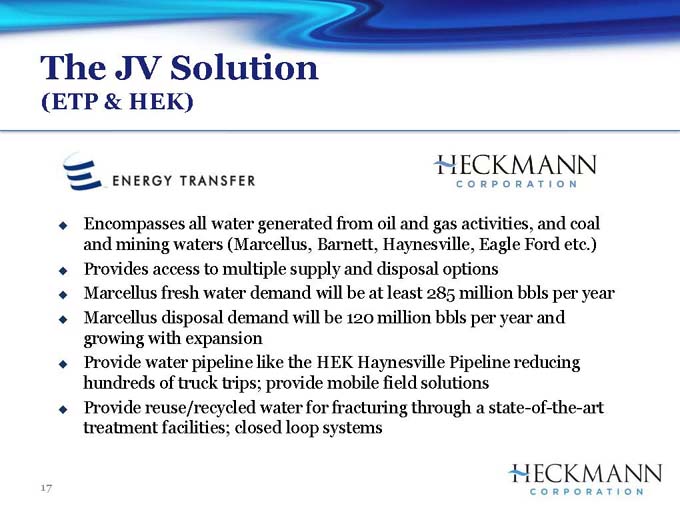
The JV Solution
(ETP & HEK)
Encompasses all water generated from oil and gas activities, and coal and mining waters (Marcellus, Barnett, Haynesville, Eagle Ford etc.) Provides access to multiple supply and disposal options Marcellus fresh water demand will be at least 285 million bbls per year Marcellus disposal demand will be 120 million bbls per year and growing with expansion Provide water pipeline like the HEK Haynesville Pipeline reducing hundreds of truck trips; provide mobile field solutions Provide reuse/recycled water for fracturing through a state-of-the-art treatment facilities; closed loop systems
17
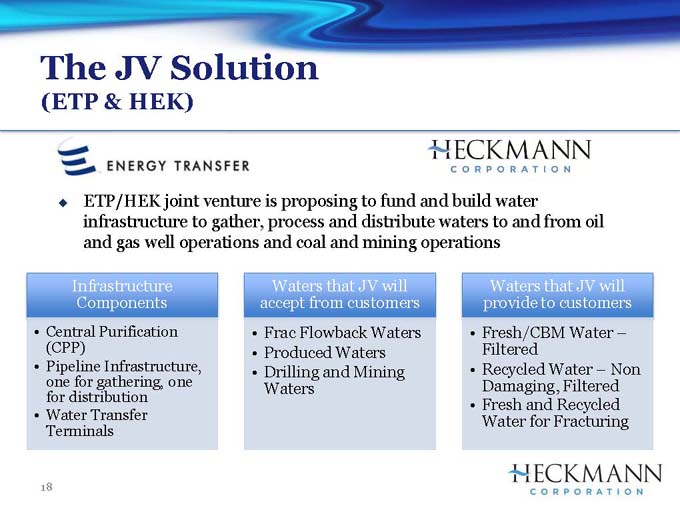
The JV Solution
(ETP & HEK)
ETP/HEK joint venture is proposing to fund and build water infrastructure to gather, process and distribute waters to and from oil and gas well operations and coal and mining operations
Infrastructure Components
Central Purification (CPP)
Pipeline Infrastructure, one for gathering, one for distribution
Water Transfer Terminals
Waters that JV will accept from customers
Frac Flowback Waters
Produced Waters
Drilling and Mining Waters
Waters that JV will provide to customers
Fresh/CBM Water
Filtered
Recycled Water Non Damaging, Filtered
Fresh and Recycled Water for Fracturing
18
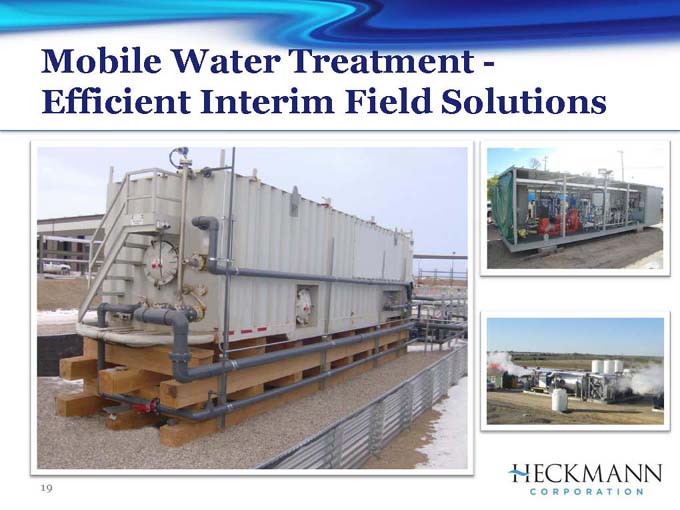
Mobile Water Treatment -Efficient Interim Field Solutions
19
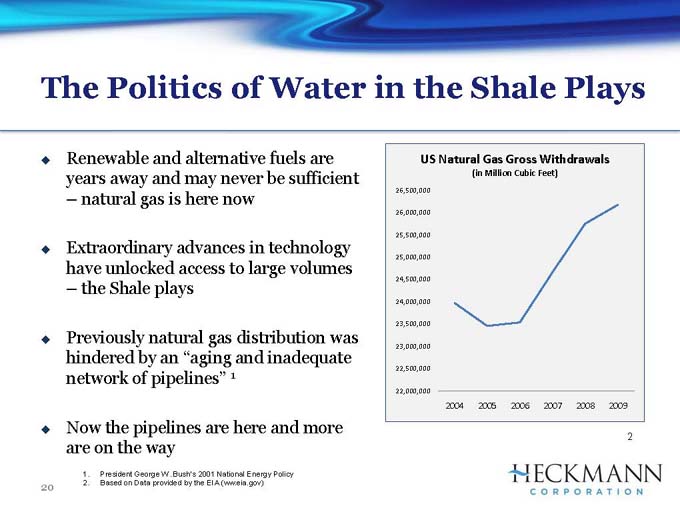
The Politics of Water in the Shale Plays
Renewable and alternative fuels are years away and may never be sufficient natural gas is here now
Extraordinary advances in technology have unlocked access to large volumes the Shale plays
Previously natural gas distribution was hindered by an “aging and inadequate network of pipelines” 1
Now the pipelines are here and more are on the way
1. President George W. Bush’s 2001 National Energy Policy
2. Based on Data provided by the EIA (ww.eia.gov)
20
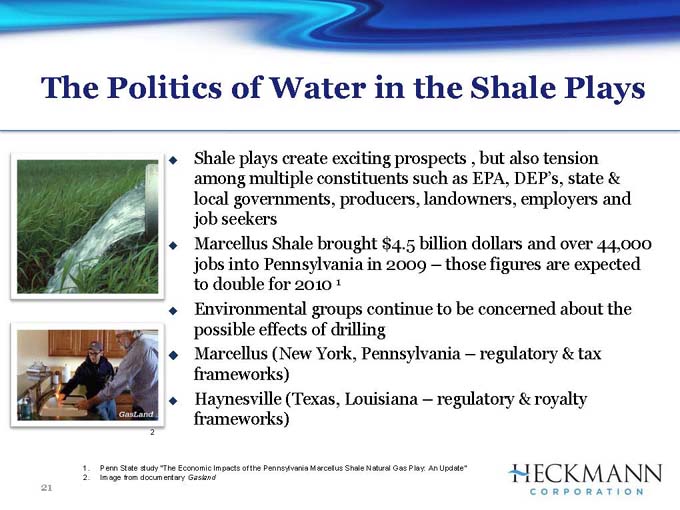
The Politics of Water in the Shale Plays
Shale plays create exciting prospects , but also tension among multiple constituents such as EPA, DEP’s, state & local governments, producers, landowners, employers and job seekers
Marcellus Shale brought $4.5 billion dollars and over 44,000 jobs into Pennsylvania in 2009 — those figures are expected to double for 2010 1
Environmental groups continue to be concerned about the possible effects of drilling
Marcellus (New York, Pennsylvania — regulatory & tax frameworks)
Haynesville (Texas, Louisiana — regulatory & royalty frameworks)
1. Penn State study “The Economic Impacts of the Pennsylvania Marcellus Shale Natural Gas Play: An Update”
2. Image from documentary Gasland
21
Investments in Water
We know that water issues are key to the development of energy
We know that shale gas development depends on the issues around water being solved
We know who the big oil and gas companies are, and We know who the big pipeline companies are
Who’s the Big Water Company?
22
Contact Us
Company Contacts:
Dick Heckmann Don Ezzell
Tel: +1 760 341-3606 Don.Ezzell@heckmanncorp.com Tel: +1 760 340-4268
Investor Relations Contact:
Kristen McNally
The Piacente Group, Inc. Tel. +1 212 481 2050 heckmann@tpg-ir.com
NYSE: HEK
23