Attached files
| file | filename |
|---|---|
| 8-K - FORM 8-K - CLINICAL DATA INC | b81084e8vk.htm |
| EX-99.3 - EX-99.3 - CLINICAL DATA INC | b81084exv99w3.htm |
| EX-99.1 - EX-99.1 - CLINICAL DATA INC | b81084exv99w1.htm |
| EX-99.2 - EX-99.2 - CLINICAL DATA INC | b81084exv99w2.htm |
| EX-99.6 - EX-99.6 - CLINICAL DATA INC | b81084exv99w6.htm |
| EX-99.5 - EX-99.5 - CLINICAL DATA INC | b81084exv99w5.htm |
| EX-99.8 - EX-99.8 - CLINICAL DATA INC | b81084exv99w8.htm |
| EX-99.7 - EX-99.7 - CLINICAL DATA INC | b81084exv99w7.htm |
Exhibit 99.4
Poster NR4-33
Vilazodone Pharmacokinetics in Subjects With Mild to Moderate Renal Impairment
Harry Alcorn, Jr, PharmD,1 James Longstreth, PhD,2 Suzanne K. Swan, MD,1,3 Marijke H. Adams, PharmD, PhD,4
Carol R. Reed, MD5
Carol R. Reed, MD5
1DaVita Clinical Research, Minneapolis, Minnesota; 2Longstreth & Associates, Inc., Mundelein, Illinois; 3Hennepin County Medical Center, Minneapolis, Minnesota;
4MH Adams & Associates, Inc., Davie, Florida; 5PGxHealth, LLC, New Haven,
Connecticut
Abstract
Objective
Vilazodone HCl (VLZ) is a dual-acting selective serotonin reuptake inhibitor and 5-HT1A receptor partial agonist in development for the treatment of major depressive
disorder. The primary objective of this study was to assess the pharmacokinetics (PK) of VLZ
in subjects with mild or moderate renal impairment.
Method
32 subjects aged 25-72 completed this phase 1, open-label, single-dose study: 8 mild renal
impaired (estimated glomerular filtration rate [eGFR] >50-80 mL/min), 8 moderate renal impaired
(eGFR ≥ 30-50 mL/min), and 16 with normal renal function individually matched for
age, sex, and BMI. Subjects received a 20-mg dose of VLZ. PK and safety measures were performed
predose to 7 days postdose.
Results
Mean values for VLZ Cmax and AUC were similar among groups. Mean
terminal elimination half-life (35.7 and 34.8 h mild and moderate vs 37.0 and 34.8 h matched controls),
total drug clearance (19.9 and 25.1 vs 26.4 and 26.9 L/h), and mean VLZ recovery in urine (1.21%
and 0.58% vs 0.95% and 0.81%) were similar for mild and moderate renally impaired and matched
healthy subjects, respectively. There were no apparent systematic trends associated with level of
renal function and no notable differences among groups. VLZ was extensively bound to plasma
proteins, with mean free fraction of 0.75% in renally impaired and 0.99% in subgroups of healthy
subjects. The variability (CV, 29%-65%) observed suggests no substantial difference in protein
binding among the 3 groups, and total drug clearance was not affected. Safety outcomes were similar
among all groups.
Conclusions
Vilazodone PK are similar in renally impaired and healthy subjects. Differences observed among
groups are considered clinically not relevant and unlikely to require dosage adjustments. Peak
exposure and drug accumulation with chronic dosing are not expected to be affected by mild or
moderate renal impairment. Safety and tolerability of vilazodone were comparable in all groups of
subjects.
Introduction
| • | Vilazodone HCl is a dual-acting potent and selective serotonin reuptake inhibitor and 5-HT1A receptor partial agonist that exerts its effects at the serotonin transporter and at pre- and post-synaptic 5-HT1A receptors1,2 |
| — | The unique dual modulation of serotonin neurotransmission by vilazodone is hypothesized to decrease endogenous serotonin negative feedback and enhance post-synaptic 5-HT effects |
| • | Data (on file) from phase 1 studies in healthy volunteers indicate |
| — | Peak serum concentrations of orally administered vilazodone typically are achieved 3 to 6 hours after dose | ||
| — | The terminal elimination half-life of vilazodone is 23.0 to 25.3 hours after a single dose and 28.9 to 30.9 hours after 10 days of dosing at 10 to 40 mg once daily | ||
| — | Vilazodone has a dose-proportional effect on Cmax and AUC for doses up to 80 mg | ||
| — | In subjects with normal kidney function, only 0.2% and 4% of vilazodone and its identified metabolites, respectively, are excreted in the urine | ||
| — | Vilazodone is highly bound (96%-99%) to plasma proteins |
| • | The pharmacokinetics (PK) of vilazodone in subjects with renal impairment have not previously been studied. The purpose of this study was to investigate the PK of a single 20-mg oral dose of vilazodone in subjects with mild or moderate renal impairment compared with those having normal renal function |
Objectives
| • | Primary |
| — | To determine the PK of orally administered vilazodone in subjects with mild or moderate renal impairment |
| • | Secondary |
| — | To compare the safety and tolerability of orally administered vilazodone in subjects with mild or moderate renal impairment with those having normal renal function |
| Presented at the 163rd Annual Meeting of the American Psychiatric Association, May 22-26, 2010, New Orleans, Louisiana | Supported by PGxHealth, LLC |
Methods
| • | All subjects provided written informed consent prior to initiating study procedures | |
| • | The study was approved by the institutional review board at each investigational center |
Study Subjects
| • | Male and female subjects 25 to 72 years of age | |
| • | Subjects were allocated to 1 of 3 cohorts based on glomerular filtration rate (GFR) using US Food and Drug Administration definitions of normal renal function (>80 mL/min), mild renal insufficiency (>50-80 mL/min), and moderate renal insufficiency (≥ 30-50 mL/min) | |
| • | Healthy subjects with normal renal function were individually matched for sex, age (±10 years), and body mass index (±15%) with subjects with mild or moderate renal impairment | |
| • | The PK population included all subjects who received a single dose of vilazodone, completed PK evaluations, and were matched with another subject who also completed PK evaluations | |
| • | The safety population included all subjects who had been exposed to vilazodone and had at least 1 postdose safety measure |
Study Design
| • | Phase 1, open label, single-dose, multicenter study | |
| • | The study included a screening period, an inpatient treatment period (days -1 through 5), outpatient visits (days 6 and 7), and a follow-up visit at day 14 ± 1 day | |
| • | GFR was estimated from serum creatinine (Scr, mg/dL) based on the Modification of Diet for
Renal Disease Study equation3-5 |
| GFR (mL/min/1.73 m2) = 186 x Scr-1.154 x Age-0.203 x 0.742 (if female) x 1.210 (if African American) |
| • | Blood samples and urine were collected before and after dosing (blood, 0-144 hours; urine, 0-96 hours) | |
| • | Concomitant substances |
| — | Subjects with renal impairment were allowed to continue medically necessary medications during the study if the dosage regimen had been stable for at least 14 days | ||
| — | For all subjects, use of the following medications was prohibited or restricted during the study: psychoactive medication, monoamine oxidase inhibitors, migraine drugs with a serotonergic mechanism of action, CYP3A4 inhibitors (food, beverage, or medication), and drugs affecting coagulation (eg, NSAIDs, aspirin >325 mg/day, warfarin, clopidogrel) | ||
| — | The use of herbal supplements and alcoholic beverages also was prohibited |
Pharmacokinetic Analytical Methods and Parameters
| • | Vilazodone concentrations in plasma and urine were determined by liquid chromatography with tandem mass spectrometry and validated for the following ranges: |
| — | Plasma, 0.8119 to 270.6 ng/mL | ||
| — | Urine, 1.0 to 200 ng/mL |
| • | Noncompartmental methods were used to determine the following vilazodone plasma PK parameters for each subject: |
| — | Maximum plasma concentration (Cmax) | ||
| — | Time to maximum plasma concentration (Tmax) | ||
| — | Area under the plasma concentration-time curve from time 0 to 24 hours (AUC0-24) | ||
| — | Area under the plasma concentration-time curve from time 0 to the last measurable concentration (AUC0-t) | ||
| — | Area under the plasma concentration-time curve from time 0 to infinity (AUC0-¥) | ||
| — | Oral clearance (CL/F), calculated as dose/AUC0-¥ | ||
| — | Terminal elimination rate constant (λz) | ||
| — | Terminal elimination half-life (t1/2) | ||
| — | Free fraction in plasma (fp) | ||
| — | Apparent free drug clearance (CLu/F), calculated as (CL/F)/fp | ||
| — | Amount recovered in urine (Au) and percentage of dose recovered in urine (% dose recovered) | ||
| — | Renal clearance (CLr), estimated by Au/AUC0-96 | ||
| — | Volume of distribution (Vz/F), calculated as dose/(λz · AUC0-¥) |
Safety
| • | Safety assessments included evaluation of adverse events (AEs), laboratory tests (chemistry, hematology, and urinalysis), electrocardiography (ECG), and vital signs |
Statistical Methods
| • | Analysis of variance (ANOVA) was performed on the natural logarithms of AUC0-t, AUC0-¥, and Cmax, with renal group (mild renal impairment, moderate renal impairment, and their healthy matches) as a fixed effect |
| — | Comparisons of renal impairment group versus the corresponding matched healthy group were made using appropriate contrast statements | ||
| — | Point estimate and 90% confidence interval (CI) for the least-square (LS) mean difference between groups in PK parameters on the log scale was exponentiated to obtain estimates for ratios of LS geometric means on the original scale |
| • | Safety assessments were summarized, with no statistical comparisons performed |
Results
Baseline Demographics
| • | Thirty-two subjects were enrolled and completed the study: 16 healthy matched subjects, 8 subjects with mild renal impairment, and 8 subjects with moderate renal impairment (Table 1) |
Table 1. Demographics and Baseline Characteristics (Safety Population)
| Mild Renal Impairment | Moderate Renal Impairment | ||||||||
| Mild | Healthy Match | Moderate | Healthy Match | ||||||
| Parameter | n = 8 | n = 8 | n = 8 | n = 8 | |||||
Age, y |
|||||||||
Mean (SD) |
58.6 (11.9) | 56.4 (13.5) | 63.9 (6.0) | 59.0 (2.5) | |||||
Median (range) |
61 (31-71) | 62 (25-66) | 64 (55-71) | 58 (55-62) | |||||
Sex, n (%) |
|||||||||
Male |
5 (62.5) | 5 (62.5) | 6 (75.0) | 6 (75.0) | |||||
Female |
3 (37.5) | 3 (37.5) | 2 (25.0) | 2 (25.0) | |||||
Race, n (%) |
|||||||||
White |
7 (87.5) | 6 (75.0) | 5 (62.5) | 8 (100) | |||||
Black |
1 (12.5) | 1 (12.5) | 2 (25.0) | 0 | |||||
Asian |
0 | 1 (12.5) | 0 | 0 | |||||
American Indian |
0 | 0 | 1 (12.5) | 0 | |||||
Height, cm |
|||||||||
Mean (SD) |
172.3 (8.4) | 167.6 (11.2) | 174.0 (8.1) | 174.5 (6.9) | |||||
Median (range) |
174.5 (160.0-183.0) | 167.5 (146.0-184.0) | 175.0 (164.0-188.0) | 175.5 (161.0-185.0) | |||||
Weight, kg |
|||||||||
Mean (SD) |
80.4 (19.8) | 76.4 (16.5) | 84.3 (15.3) | 85.4 (10.3) | |||||
Median (range) |
82.0 (48.1-112.0) | 74.0 (55.0-96.0) | 78.0 (68.0-107.0) | 85.5 (72.0-102.0) | |||||
BMI, kg/m2 |
|||||||||
Mean (SD) |
26.9 (5.6) | 27.2 (6.7) | 28.0 (5.8) | 27.8 (4.1) | |||||
Median (range) |
26.4 (18.7-38.6) | 26.4 (19.7-41.7) | 26.9 (21.9-37.6) | 26.7 (22.5-33.7) | |||||
eGFR, mL/min/1.73 m2 |
|||||||||
Mean (SD) |
69.5 (8.2) | 91.3 (8.7) | 43.6 (6.8) | 95.5 (11.5) | |||||
Median (range) |
71.0 (53.0-80.0) | 90.0 (81.0-109.0) | 47.0 (32.0-50.0) | 92.0 (82.0-110.0) | |||||
BMI, body mass index; eGFR, estimated glomerular filtration rate.
Pharmacokinetic Parameters in Renally Impaired Subjects Compared With Healthy Subjects
| • | Mean plasma vilazodone concentration-time profiles were similar between subjects with mild or moderate renal impairment and their healthy matched controls (Figures 1 and 2) |
| Figure 1. Mean vilazodone concentration profile, by group (linear scale). |
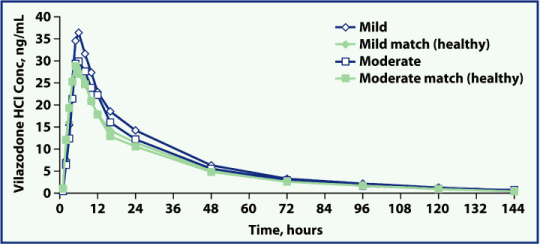
Conc, concentration; HCl, hydrochloride.
Figure 2. Mean vilazodone concentration profile, by group (log-linear scale).
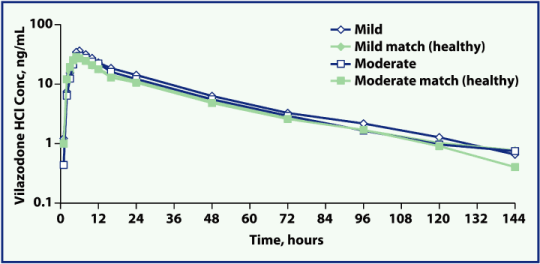
Conc, concentration; HCl, hydrochloride.
| • | Mean Cmax, Tmax, AUC, t1/2, oral clearance, and Au were each similar between subjects with mild and moderate renal impairment and their healthy matches (Table 2) |
Table 2. Vilazodone PK Parameters (PK Population)
| Mild Renal Impairment | Moderate Renal Impairment | ||||||||
| Mild | Healthy Match | Moderate | Healthy Match | ||||||
| Parameter | n = 8 | n = 8 | n = 8 | n = 8 | |||||
Cmax, ng/mL |
|||||||||
Mean (SD) |
39.3 (15.0) | 34.8 (6.9) | 33.0 (12.0) | 31.8 (14.5) | |||||
Median (range) |
35.1 (18.9, 69.0) | 34.1 (28.4, 50.0) | 29.6 (22.4, 59.2) | 29.4 (15.8, 57.3) | |||||
CV, % |
38.2 | 19.9 | 36.2 | 45.6 | |||||
Tmax, h |
|||||||||
Mean (SD) |
6.00 (1.41) | 5.25 (1.39) | 6.00 (2.00) | 5.13 (0.84) | |||||
Median (range) |
6.00 (4.00, 8.00) | 5.00 (4.00, 8.00) | 5.00 (4.00, 10.0) | 5.00 (4.00, 6.00) | |||||
CV, % |
23.6 | 26.5 | 33.3 | 16.3 | |||||
AUC0-24,ng·h/mL |
|||||||||
Mean (SD) |
496 (178) | 402 (108) | 432 (177) | 395 (143) | |||||
Median (range) |
466 (270, 895) | 372 (263, 541) | 367 (279, 824) | 383 (233, 600) | |||||
CV, % |
35.9 | 26.8 | 41.0 | 36.2 | |||||
AUC0-t, ng·h/mL |
|||||||||
Mean (SD) |
983 (217) | 795 (276) | 849 (342) | 759 (248) | |||||
Median (range) |
952 (722, 1460) | 819 (391, 1210) | 776 (430, 1510) | 697 (503, 1100) | |||||
CV, % |
22.1 | 34.7 | 40.3 | 32.6 | |||||
AUC0-oo, ng·h/mL |
|||||||||
Mean (SD) |
1038 (203) | 856 (290) | 910 (358) | 811 (257) | |||||
Median (range) |
1020 (787, 1480) | 906 (421, 1290) | 825 (472, 1570) | 745 (550, 1150) | |||||
CV, % |
19.6 | 33.9 | 39.3 | 31.7 | |||||
λz, 1/h |
|||||||||
Mean (SD) |
0.0210 (0.0067) | 0.0213 (0.0077) | 0.0226 (0.0080) | 0.0213 (0.0060) | |||||
Median (range) |
0.0187 (0.0146, 0.0339) | 0.0208 (0.0106, 0.0345) | 0.0236 (0.0114, 0.0313) | 0.0198 (0.0133, 0.0324) | |||||
CV, % |
32.1 | 36.3 | 35.2 | 28.2 | |||||
t1/2, h |
|||||||||
Mean (SD) |
35.7 (9.8) | 37.0 (14.9) | 34.8 (14.0) | 34.8 (9.4) | |||||
Median (range) |
37.7 (20.5, 47.5) | 33.4 (20.1, 65.2) | 30.7 (22.1, 60.7) | 35.1 (21.4, 52.0) | |||||
CV, % |
27.5 | 40.3 | 40.2 | 27.1 | |||||
Vz/F, L |
|||||||||
Mean (SD) |
1054 (407) | 1312 (458) | 1148 (335) | 1292 (349) | |||||
Median (range) |
1057 (398, 1550) | 1330 (710, 2040) | 1120 (678, 1670) | 1280 (833, 1940) | |||||
CV, % |
38.6 | 34.9 | 29.2 | 27.0 | |||||
CL/F, L/h |
|||||||||
Mean (SD) |
19.9 (3.4) | 26.4 (10.7) | 25.1 (9.5) | 26.9 (8.2) | |||||
Median (range) |
19.7 (13.5, 25.4) | 22.1 (15.5, 47.5) | 24.4 (12.8, 42.4) | 27.8 (17.4, 36.4) | |||||
CV, % |
17.3 | 40.5 | 38.0 | 30.5 | |||||
Au, mg |
|||||||||
Mean (SD) |
0.242 (0.195) | 0.190 (0.125) | 0.116 (0.124) | 0.163 (0.134) | |||||
Median (range) |
0.206 (0.033, 0.603) | 0.191 (0.011, 0.330) | 0.069 (0.003, 0.327) | 0.160 (0.008, 0.418) | |||||
CV, % |
80.6 | 65.9 | 106.7 | 82.1 | |||||
Dose recovered
in urine, % |
|||||||||
Mean (SD) |
1.211 (0.977) | 0.950 (0.625) | 0.580 (0.620) | 0.814 (0.668) | |||||
Median (range) |
1.029 (0.164, 3.020) | 0.955 (0.055, 1.650) | 0.347 (0.015, 1.640) | 0.801 (0.042, 2.090) | |||||
CV, % |
80.7 | 65.8 | 106.7 | 82.1 | |||||
CLr, L/h |
|||||||||
Mean (SD) |
0.296 (0.259) | 0.246 (0.182) | 0.164 (0.186) | 0.214 (0.164) | |||||
Median (range) |
0.245 (0.032, 0.782) | 0.199 (0.021, 0.479) | 0.073 (0.003, 0.498) | 0.194 (0.015, 0.532) | |||||
CV, % |
87.4 | 74.0 | 113.5 | 76.4 | |||||
| • | Vilazodone was extensively bound to plasma proteins, with mean free fraction of ~0.75% in both renal impairment groups and 0.99% in healthy subjects (Table 3) |
| — | Observed ranges in vilazodone-free fraction for the 3 subject groups extensively overlapped with nearly identical median values, suggesting there were no substantial differences in protein binding among the renal impairment and healthy groups | ||
| — | Oral clearance was not affected by mild or moderate renal impairment, also supporting that free fraction was not altered in mild or moderate renal impairment , or was not critical to vilazodone clearance |
Table 3. PK Parameters Related to Vilazodone and Protein Binding (PK Population)
| Mild Renal | Moderate Renal | |||||
| Impairment | Impairment | Healthy Match | ||||
Mean f, % |
n = 8 | n = 8 | n = 8 | |||
Mean (SD) |
0.756 (0.221) | 0.738 (0.215) | 0.985 (0.644) | |||
Median (range) |
0.765 (0.490, 1.160) | 0.745 (0.380, 1.090) | 0.790 (0.610, 2.550) | |||
CV, % |
29.3 | 29.2 | 65.4 | |||
CLu/F, L/h |
n = 8 | n = 8 | n = 4 | |||
Mean (SD) |
2849 (950) | 3422 (842) | 3285 (467) | |||
Median (range) |
2993 (1484, 4061) | 3556 (2101, 4788) | 3419 (2614, 3689) | |||
CV, % |
33.3 | 24.6 | 14.2 |
| • | Ratios of vilazodone Cmax and AUCs ranged from 1.076 and 1.286 for subjects with mild renal impairment and from 1.083 and 1.098 for subjects with moderate renal impairment compared with healthy matched subjects (Table 4) |
Table 4. Vilazodone PK Comparisons Between Impaired and Healthy Matched Groups (PK
Population)
| Comparison | Ratio | 90% Cl | ||||||
Cmax |
||||||||
Mild/healthy match |
1.076 | 0.801, 1.445 | ||||||
Moderate/healthy match |
1.083 | 0.807, 1.455 | ||||||
AUC0-t |
||||||||
Mild/healthy match |
1.286 | 0.968, 1.708 | ||||||
Moderate/healthy match |
1.094 | 0.824, 1.453 | ||||||
AUC0-¥ |
||||||||
Mild/healthy match |
1.264 | 0.958, 1.667 | ||||||
Moderate/healthy match |
1.098 | 0.832, 1.448 | ||||||
| • | The 90% CIs for the above PK parameters were outside the 0.80 to 1.25 range normally designated as proving bioequivalence (Table 4). This is likely due to the small number of subjects studied |
Safety
| • | All TEAEs were mild to moderate in intensity (Table 5); there were no SAEs | |
| • | No subject discontinued because of a TEAE |
Table 5. Incidence of TEAEs Occurring in More than 1 Subject by Preferred Term (Safety
Population)
| Subjects, n (%) | |||||||||
| Mild Renal Impairment | Moderate Renal Impairment | ||||||||
| Mild | Healthy Match | Moderate | Healthy Match | ||||||
| Preferred Terma | n = 8 | n = 8 | n = 8 | n = 8 | |||||
Diarrhea |
2 (25.0) | 4 (50.0) | 5 (62.5) | 3 (37.5) | |||||
Headache |
3 (37.5) | 1 (12.5) | 1 (12.5) | 1 (12.5) | |||||
Nausea |
1 (12.5) | 1 (12.5) | 1 (12.5) | 2 (25.0) | |||||
Dizziness |
0 | 1 (12.5) | 3 (37.5) | 0 | |||||
Fatigue |
1 (12.5) | 0 | 0 | 1 (12.5) | |||||
Somnolence |
2 (25.0) | 0 | 0 | 0 | |||||
Stomach discomfort |
0 | 0 | 1 (12.5) | 1 (12.5) | |||||
| a | Subjects might have reported more than 1 event per preferred term. |
| • | No significant effect of vilazodone on any hematology or urinalysis parameters was noted, and no shift to clinically abnormal high or clinically abnormal low values for any clinical chemistry parameter was observed | |
| • | No clinically significant abnormalities on 12-lead ECGs were reported | |
| • | Mean changes from baseline in vital signs were small, similar between groups, and not considered clinically significant (Table 6) |
Table 6. Blood Pressure and Pulse at Baseline and Change From Baseline 4 Hours After Dose and EOS/ET (Safety Population)
| Mild Renal Impairment | Moderate Renal Impairment | ||||||||
| Mild | Healthy Match | Moderate | Healthy Match | ||||||
| Parameter | n = 8 | n = 8 | n = 8 | n = 8 | |||||
SBP, mm Hg |
|||||||||
Baseline |
|||||||||
Mean (SD) |
124.6 (10.6) | 128.4 (14.2) | 123.8 (13.6) | 128.6 (16.1) | |||||
Median (range) |
122.5 (114.0, 142.0) | 126.5 (112.0, 156.0) | 125.5 (108.0, 142.0) | 125.5 (113.0, 156.0) | |||||
4 Hours after dosea |
|||||||||
Mean (SD) |
-6.3 (7.8) | -3.9 (16.1) | 1.8 (12.1) | -12.0 (13.5) | |||||
Median (range) |
-4.5 (-24.0, 0.0) | -1.5 (-31.0, 14.0) | -0.5 (-11.0, 20.0) | -11.0 (-33.0, 7.0) | |||||
EOS/ETa |
|||||||||
Mean (SD) |
-3.0 (10.1) | -5.8 (11.4) | -1.1 (19.5) | -3.3 (15.6) | |||||
Median (range) |
-2.0 (-20.0, 9.0) | -9.5 (-21.0, 11.0) | -1.0 (-41.0, 24.0) | -3.5 (-26.0, 18.0) | |||||
DBP, mm Hg |
|||||||||
Baseline |
|||||||||
Mean (SD) |
78.3 (11.8) | 74.4 (7.9) | 71.8 (10.6) | 78.9 (9.4) | |||||
Median (range) |
79.0 (62.0, 94.0) | 74.0 (62.0, 84.0) | 70.0 (58.0, 88.0) | 79.0 (67.0, 96.0) | |||||
4 Hours after dosea |
|||||||||
Mean (SD) |
-3.4 (7.7) | 0.8 (6.7) | -1.0 (6.4) | -3.5 (7.2) | |||||
Median (range) |
-1.0 (-14.0, 8.0) | 0.5 (-11.0, 9.0) | -2.5 (-8.0, 10.0) | -1.5 (-15.0, 5.0) | |||||
EOS/ETa |
|||||||||
Mean (SD) |
-2.5 (8.4) | -0.1 (7.5) | 1.0 (7.2) | 0.3 (6.6) | |||||
Median(range) |
0.0 (-19.0, 8.0) | 2.0 (-11.0, 11.0) | 3.5 (-10.0, 10.0) | -1.5 (-7.0, 15.0) | |||||
Pulse, bpm |
|||||||||
Baseline |
|||||||||
Mean (SD) |
67.1 (10.9) | 64.4 (4.5) | 74.1 (13.1) | 74.9 (15.4) | |||||
Median (range) |
67.0 (49.0, 80.0) | 64.5 (56.0, 72.0) | 73.0 (58.0, 90.0) | 76.0 (55.0, 105.0) | |||||
4 Hours after dosea |
|||||||||
Mean (SD) |
-3.8 (6.4) | -4.5 (9.1) | -9.4 (8.8) | -8.6 (8.4) | |||||
Median (range) |
-2.5 (-14.0, 5.0) | -4.0 (-15.0, 7.0) | -8.5 (-22.0, 2.0) | -7.5 (-21.0, 3.0) | |||||
EOS/ETa |
|||||||||
Mean (SD) |
1.4 (9.3) | 3.0 (9.2) | -2.0 (13.7) | -3.6 (8.6) | |||||
Median (range) |
2.5 (-15.0, 17.0) | 3.0 (-15.0, 17.0) | 0.0 (-26.0, 20.0) | -3.5 (-14.0, 6.0) | |||||
| bpm, beats per minute; DBP, diastolic blood pressure; EOS, end of study; ET, early termination; SBP, systolic blood pressure. | ||
| a | Mean change from baseline. |
Conclusions
| • | Vilazodone pharmacokinetics were similar between subjects with mild or moderate renal impairment and healthy subjects with normal renal function | |
| • | Mild or moderate renal impairment was not associated with any pattern of increased incidence of TEAEs or clinically significant changes in laboratory values, vital signs, or ECGs, compared with subjects with normal renal function | |
| • | These findings suggest that no dose adjustment of vilazodone would be required for patients with mild or moderate renal impairment |
References
| 1. | Hughes A et al. Eur J Pharmacol. 2005;510:49-57. | |
| 2. | Dawson L et al. CNS Neurosci Ther. 2009;15:107-117. | |
| 3. | K/DOQI clinical practice guidelines for chronic kidney disease: evaluation, classification, and stratification. Am J Kidney Dis. 2002;39(suppl 1):S86. | |
| 4. | Froissart M et al. J Am Soc Nephrol. 2005;16:763-773. | |
| 5. | Levey AS et al. Clin Chem. 2007;53:766-772. |