Attached files
| file | filename |
|---|---|
| 8-K - FORM 8-K - PHH CORP | y84499e8vk.htm |
Exhibit 99.1

| Investor Presentation May 11th - 12th, 2010 |

| Important Disclosures Forward-Looking Statements Statements in this presentation that are not historical facts are forward-looking statements within the meaning of Section 27A of the Securities Act of 1933, as amended, and Section 21E of the Securities Exchange Act of 1934, as amended. Such forward-looking statements are subject to known and unknown risks, uncertainties and other factors that may cause our actual results, performance or achievements to be materially different from any future results, performance or achievements expressed or implied by such forward-looking statements. Statements preceded by, followed by or that otherwise include the words "believes," "expects," "anticipates," "intends," "projects," "estimates," "plans," "potential," "may increase," "may result," "will result," "may fluctuate," "run rate," "outlook," and similar expressions or future or conditional verbs such as "will," "should," "would," "may" and "could" are generally forward-looking in nature and not historical facts. Certain factors that could cause actual results, performance or achievements to differ materially from those expressed in such forward-looking statements are described under the headings "Cautionary Note Regarding Forward-Looking Statements" and "Risk Factors" in the Company's most recent Annual Report on Form 10-K and Quarterly Reports on Form 10-Q. Investors are cautioned not to place undue reliance on any forward-looking statements. Except for our ongoing obligations to disclose material information under the federal securities laws and applicable stock exchange listing standards and unless otherwise required by applicable law, we undertake no obligation to release publicly any updates or revisions to any forward-looking statements or to report the occurrence or non-occurrence of anticipated or unanticipated events. Basis of Presentation of Financial Data Unless noted otherwise in this presentation, all reported financial data is being presented as of the period ended March 31, 2010 (unaudited). Non-GAAP Financial Measures This presentation contains certain financial measures that are not calculated in accordance with U.S. generally accepted accounting principles ("GAAP"), including "Core Earnings." As "Core Earnings" is an incomplete measure of the Company's financial performance and involve differences from segment profit (loss), Income (loss) before income taxes, Net income (loss) attributable to PHH Corporation and Basic earnings (loss) per share attributable to PHH Corporation computed in accordance with GAAP, this non-GAAP financial measure should be considered as supplementary to, and not as a substitute for, segment profit (loss), Income (loss) before income taxes, Net income (loss) attributable to PHH Corporation or Basic earnings (loss) per share attributable to PHH Corporation computed in accordance with GAAP as a measure of the Company's financial performance. The Company believes that this non- GAAP financial measure is useful to investors because it provides a means by which investors can evaluate the Company's underlying core operating performance, exclusive of certain items that investors may consider to be non-core in nature. The Company also believes that any meaningful analysis of the Company's financial performance by investors requires an understanding of the factors that drive the Company's underlying core operating performance as distinguished from the factors that are included in computing segment profit (loss), Income (loss) before income taxes, Net income (loss) attributable to PHH Corporation and Basic earnings (loss) per share attributable to PHH Corporation in accordance with GAAP and that may obscure such core operating performance for a given period or periods. Reconciliations of these non-GAAP financial measures to the most comparable GAAP measure as required by Regulation G are shown in the Appendix attached to this presentation. |

| Mortgage Outsourcing Fleet Management A leading provider of private label outsourcing services that position PHH as a top prime originator and servicer 4th largest* retail residential mortgage originator in 2009 $38 billion in first and second mortgage closed loan volume in 2009 10th largest* servicer with a $153.1 billion portfolio as of Dec 31, 2009 Focus on bank owned mortgage companies that want to mitigate risk and cost while enhancing customer experience Limited credit risk vs the industry Do not portfolio loans Minimal exposure from subprime lending, Option ARMs or other high risk products High quality underwriting culture "One stop" provider of fleet management services with a broad range of product offerings and best in class technologies Over 500,000 vehicles under management in the US and Canada Well diversified portfolio of leases to Fortune 500 companies Segment provides further outsourcing expertise as well as credit ratings stability No residual risk in 96% of our leases and services Limited credit risk * Source: Inside Mortgage Finance, Copyright 2010 Introduction to PHH Providing Tactical Expertise and Risk Reduction Solutions for Leading Companies Such As: Charles Schwab UMB Financial Northern Trust KeyBank First Tennessee Realogy Comerica Merrill Lynch Citizens Bank UBS Diebold Home Depot Quest Diagnostics Owens Corning Comcast A leading outsource provider of mortgage and vehicle fleet management services Mortgage Fleet |
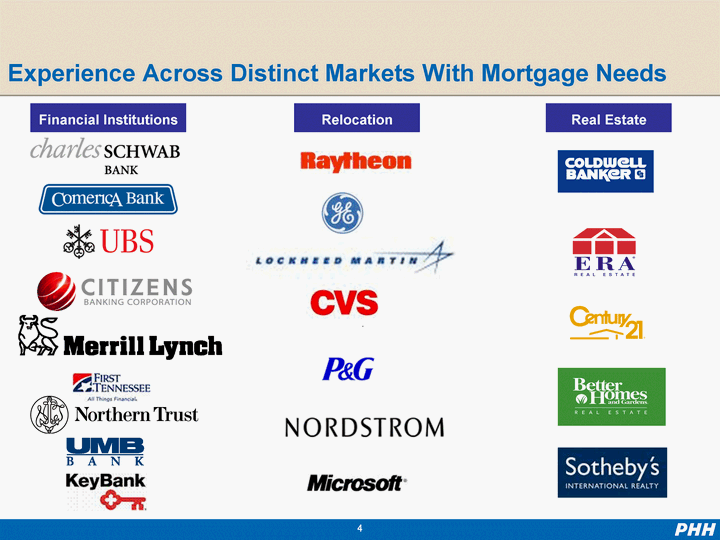
| Financial Institutions Relocation Real Estate Experience Across Distinct Markets With Mortgage Needs |
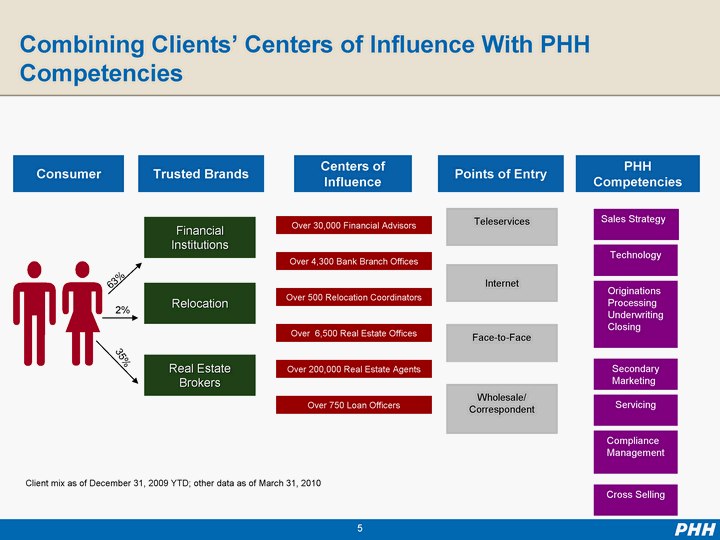
| Consumer Points of Entry PHH Competencies Relocation Real Estate Brokers Financial Institutions Face-to-Face Wholesale/ Correspondent Teleservices Trusted Brands Centers of Influence Internet Sales Strategy Originations Processing Underwriting Closing Secondary Marketing Servicing Cross Selling Technology Compliance Management Combining Clients' Centers of Influence With PHH Competencies Over 30,000 Financial Advisors Over 4,300 Bank Branch Offices Over 500 Relocation Coordinators Over 6,500 Real Estate Offices Over 200,000 Real Estate Agents Over 750 Loan Officers 63% 2% 35% Client mix as of December 31, 2009 YTD; other data as of March 31, 2010 |

| Our Fleet clients: PHH serves nearly a third of the Fortune 500(r) Over 100 PHH clients with tenures exceeding 20 years Customer satisfaction*: Client satisfaction: 84% Driver satisfaction: 98% Key Revenue Drivers: Management Fees Fee-based Services Vendor Relationships "One Stop" Provider of Fleet Management Services * Source: 2009 PHH Client and Driver Survey |

| First Quarter Results Q1 2010 Q1 2009 GAAP Net Income $8M $2M Basic EPS $0.15 $0.04 Core Earnings (after-tax)* $13M $52M Core EPS (after-tax)* $0.24 $0.96 * Core earnings (pre-tax) and (after-tax) and Core earnings per share attributable to PHH Corporation are measures that do not conform with GAAP. See "Non-GAAP Financial Measures Reconciliation" included in this presentation for reconciliation required. |
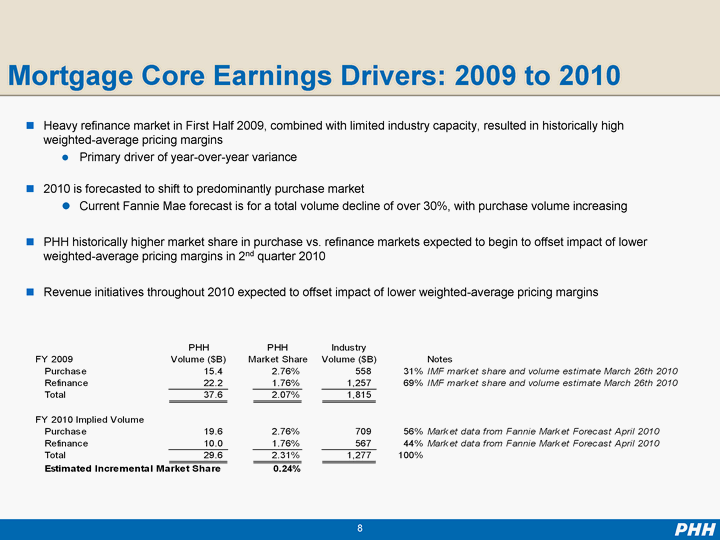
| Mortgage Core Earnings Drivers: 2009 to 2010 Heavy refinance market in First Half 2009, combined with limited industry capacity, resulted in historically high weighted-average pricing margins Primary driver of year-over-year variance 2010 is forecasted to shift to predominantly purchase market Current Fannie Mae forecast is for a total volume decline of over 30%, with purchase volume increasing PHH historically higher market share in purchase vs. refinance markets expected to begin to offset impact of lower weighted-average pricing margins in 2nd quarter 2010 Revenue initiatives throughout 2010 expected to offset impact of lower weighted-average pricing margins |

| Mortgage Origination Market Share Mortgage Origination Market Share |
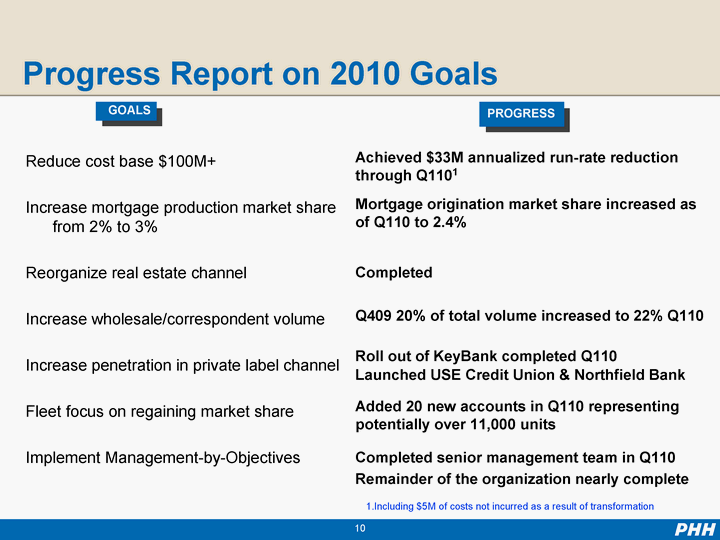
| Progress Report on 2010 Goals Reduce cost base $100M+ Increase mortgage production market share from 2% to 3% Reorganize real estate channel Increase wholesale/correspondent volume Increase penetration in private label channel Fleet focus on regaining market share Implement Management-by-Objectives Achieved $33M annualized run-rate reduction through Q1101 Mortgage origination market share increased as of Q110 to 2.4% Completed Q409 20% of total volume increased to 22% Q110 Roll out of KeyBank completed Q110 Launched USE Credit Union & Northfield Bank Added 20 new accounts in Q110 representing potentially over 11,000 units Completed senior management team in Q110 Remainder of the organization nearly complete GOALS PROGRESS 1.Including $5M of costs not incurred as a result of transformation |

| M At least $100 million of potential expense savings validated through the SMART criteria Identified and validated potential savings Mortgage Platform Fleet Platform ~$50M Total identified and validated savings ~$40M General and administrative ~$10M ~$100M Example initiatives Increase process efficiency across back office functions and transactional processes by 15%-20% using Six Sigma principles Eliminate non-value added activities Leverage automation across all support processes Significantly reduce touch points in mortgage production to result in improved customer experience Leverage technology to improve efficiency in early and late stage delinquency management Expand process improvement program to all the major processes at Fleet Develop technology solutions to enhance the customer experience and reduce inefficiencies (e.g., new web and phone-enabled technology simplifying driver access to services) |

| Small Scale Pilot - Early Results Show Promise Description Key Operational Metrics New process Baseline -58% Time per file: Underwriting Hours Cycle time: Registration to closing Days Service: Customer Satisfaction Metric Percent Base Pilot Underwriters review file only when all necessary documentation arrives, eliminating wasteful touches One underwriter assigned per file, reducing file re-learning, re-work, and eliminating need for escalation to helpdesk Milestone driven workflow modulates processor activities to avoid back-loaded reviews, escalations and rushes Junior roles utilized for basic underwriting and processing activities, increasing capacity of high skill resources End to end process redesigned to avoid redundant file touches and ensure holistic underwriting reviews Loan touches: Underwriting Units New process Baseline -73% Baseline New process -24% New process 86 Baseline +12% |
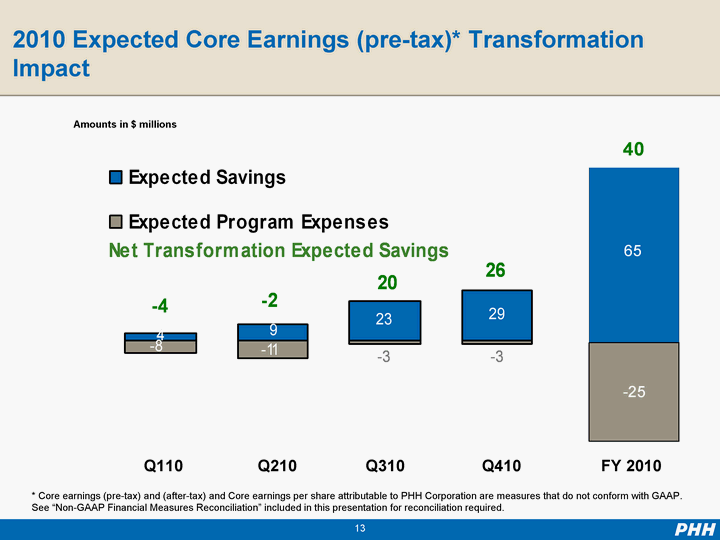
| M 2010 Expected Core Earnings (pre-tax)* Transformation Impact Q310 Q210 Q410 Q110 FY 2010 Amounts in $ millions * Core earnings (pre-tax) and (after-tax) and Core earnings per share attributable to PHH Corporation are measures that do not conform with GAAP. See "Non-GAAP Financial Measures Reconciliation" included in this presentation for reconciliation required. |

| s Expected ROE Improvement of 4-5 Percentage Points in 2011 Program increase in Return on Stockholders Equity (ROE) 1 $100M, 40% tax-rate, $60M earnings, ~$1.5B equity at end of 1Q10 2 $20M, 40% tax-rate, $12M earnings,~$1.5B equity at end of 1Q10 4.00000000000045 4.00000000000045 1.00000000000011 4.00000000000045 1.00000000000011 ROE Impact of Additional $20M Savings2 ROE Impact of $100M Cost Savings1 Total Expected ROE Increase +5% |

| PHH 2010 Outlook Transformation on track Revenue initiatives underway Overall, we are working to deliver on our goal of core earnings (pre-tax) consistent with 2009 levels |
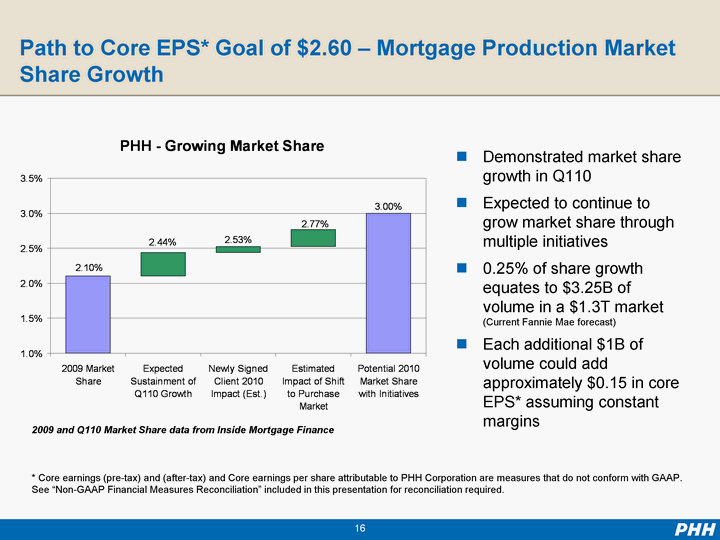
| Path to Core EPS* Goal of $2.60 - Mortgage Production Market Share Growth Demonstrated market share growth in Q110 Expected to continue to grow market share through multiple initiatives 0.25% of share growth equates to $3.25B of volume in a $1.3T market (Current Fannie Mae forecast) Each additional $1B of volume could add approximately $0.15 in core EPS* assuming constant margins 2009 and Q110 Market Share data from Inside Mortgage Finance * Core earnings (pre-tax) and (after-tax) and Core earnings per share attributable to PHH Corporation are measures that do not conform with GAAP. See "Non-GAAP Financial Measures Reconciliation" included in this presentation for reconciliation required. |

| Path to Core EPS1 Goal of $2.60 Core earnings (pre-tax) and (after-tax) and Core earnings per share attributable to PHH Corporation are measures that do not conform with GAAP. See "Non-GAAP Financial Measures Reconciliation" included in this presentation for reconciliation required. Assumes 40% effective tax rate and 55M shares outstanding |

| Summary - Investment Highlights Leading mortgage and fleet management outsource provider Driving efficiency through transformation Strong progress towards 2010 shareholder value initiatives On track to deliver on goal of 13% run-rate ROE in 2011 |

| Supplemental Information |

| Consolidated Results |

| Core Earnings |

| Non-GAAP Financial Measures Reconciliation |

| Composition of PHH Corporation Stockholders' Equity and Book Value Per Share (1) The composition of Total PHH Corporation stockholders' equity by business may be useful in determining return on stockholders' equity by business; however, the reporting of equity by segment is not prescribed nor required by GAAP. As such, these amounts may be deemed non-GAAP financial measures under Regulation G. (2) Book value per share is a commonly used financial metric but may be deemed as a non-GAAP financial measure under Regulation G. The Company calculated book value per share by dividing Total PHH Corporation stockholders' equity by outstanding shares of common stock of 55.334 million and 54.775 million as of March 31, 2010 and December 31, 2009, respectively. |
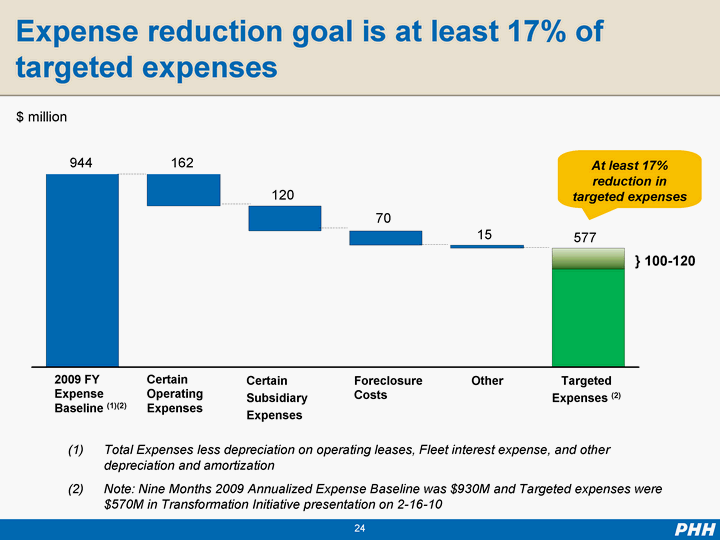
| Expense reduction goal is at least 17% of targeted expenses $ million Certain Operating Expenses 162 2009 FY Expense Baseline (1)(2) 944 Targeted Expenses (2) 577 } 100-120 Other 15 Foreclosure Costs 70 Certain Subsidiary Expenses 120 At least 17% reduction in targeted expenses Total Expenses less depreciation on operating leases, Fleet interest expense, and other depreciation and amortization Note: Nine Months 2009 Annualized Expense Baseline was $930M and Targeted expenses were $570M in Transformation Initiative presentation on 2-16-10 |

| Target Expense Sensitivities Target Expense Baseline of $577M based upon Total 2009 closings of $37.6B Savings estimates (calculated as Revised Target Expense vs Original Baseline) will be calculated assuming a constant level of volume Based upon current mix of originations, we would anticipate an adjustment of $5-$6M per $1B change in total closings For example, assume no program savings and $40.8B of originations: We would expect Revised Target Expense to be $592 - $595M Volume adjustment to compare to Original Baseline would be $15M - $18M ($577M) Savings would be calculated as zero |
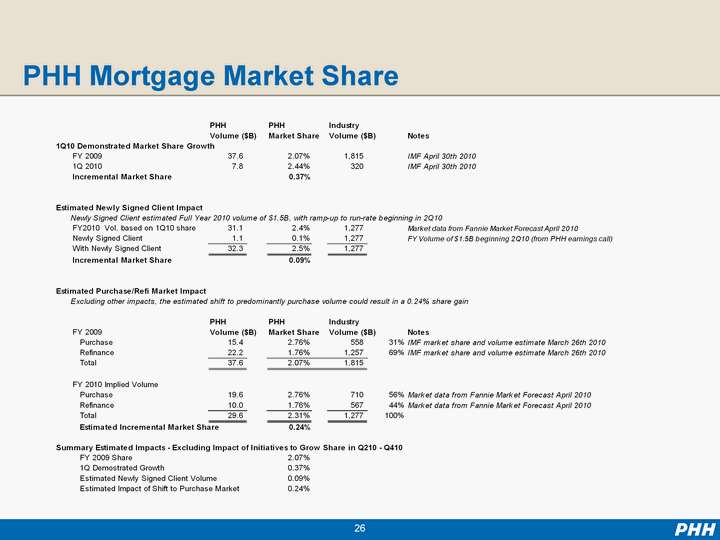
| PHH Mortgage Market Share |

| Pricing Margin and Volume Weighted-Average Pricing Margin shown above reflects the market price of the loan at the time of interest rate lock commitment relative to our basis including an expected cost of hedging the loan plus any net interest carry to be earned prior to sale as well as any discount points paid by the borrower. Excluded from margin is the base servicing value, borrower paid fees (other than discounts) and the cost of originating the loan. |

| Mortgage Production Segment 2010 Annualized Potential Profitability Sensitivity The projected 2010 results presented in the matrix above are representative of normalized results of operations for the production segment and assume an annualized volume level and an average margin for that annualized volume. Consistent with normalized results, it assumes there is no mark-to-market adjustments for loans held for sale such as scratch and dent, second lien and jumbo loans. Volumes and margins at any point in time or over a shorter time period may vary materially from those annualized assumptions. Other market factors may result in actual production segment results differing materially from the normalized results presented above. We believe the matrix continues to provide an approximation of the segment profitability, on an annualized basis, utilizing the following basic assumptions: (i) break even for the business is $22B in closings assuming margin of 80 bps; (ii) each additional $1B in closing volume would be expected to generate approximately $8-14M in segment profit at 80 bps; and (iii) loans closed to be sold is assumed at roughly 3/4 of total closings and margins in excess of 80 bps can be applied to the volume of loans closed to be sold. Revenues are recognized throughout the origination process from the interest rate commitment date through the date of sale. Comparison of quarterly periods may be distorted relative to the annualized period presented due to the potential effects of revenue recognition timing. Comparison of results may be impacted by volume mix such as retail versus wholesale and fee based versus saleable. Also, timing of transformation impacts may impact results. The projected results presented above may vary by the greater of $5 million or 20% in either direction due to factors that impact results in ways that may not be predictable. |

| Change in Fair Value of MSRs |
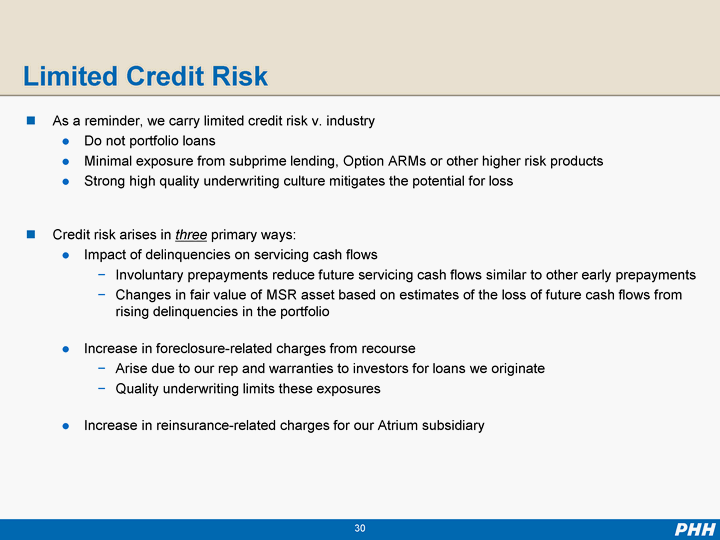
| Limited Credit Risk As a reminder, we carry limited credit risk v. industry Do not portfolio loans Minimal exposure from subprime lending, Option ARMs or other higher risk products Strong high quality underwriting culture mitigates the potential for loss Credit risk arises in three primary ways: Impact of delinquencies on servicing cash flows Involuntary prepayments reduce future servicing cash flows similar to other early prepayments Changes in fair value of MSR asset based on estimates of the loss of future cash flows from rising delinquencies in the portfolio Increase in foreclosure-related charges from recourse Arise due to our rep and warranties to investors for loans we originate Quality underwriting limits these exposures Increase in reinsurance-related charges for our Atrium subsidiary |
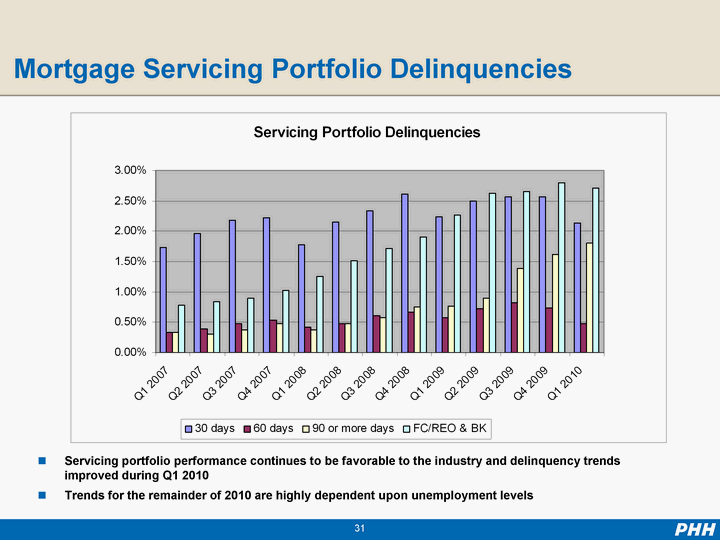
| Mortgage Servicing Portfolio Delinquencies Servicing portfolio performance continues to be favorable to the industry and delinquency trends improved during Q1 2010 Trends for the remainder of 2010 are highly dependent upon unemployment levels |

| Impact of Delinquencies on Credit Risk Higher foreclosure-related charges a function of increased severity and repurchase requests Highly correlated with unemployment As unemployment improves, we would expect a reduction in our charges to more normal levels such as those seen in 2007 Based on PHH Corporation specific data, except historical national unemployment rate obtained from the U.S Bureau of Labor Statistics. ($ in millions) |
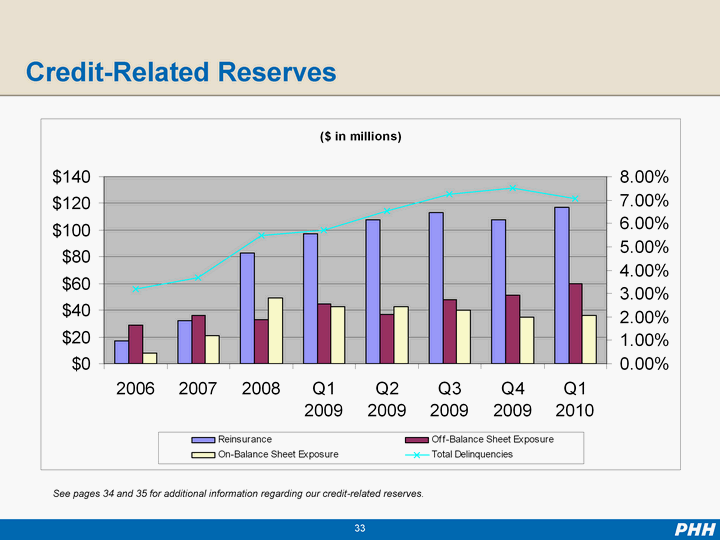
| Credit-Related Reserves See pages 34 and 35 for additional information regarding our credit-related reserves. |
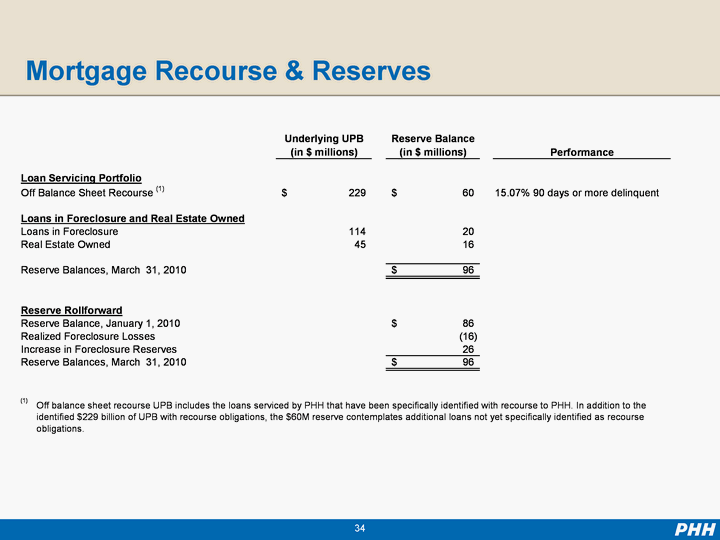
| Mortgage Recourse & Reserves |

| As of 3/31/10, Atrium had $286M in restricted cash held in trust to pay claims Atrium paid reinsurance claims of $2M in Q110 Reserves established at $117M as of 03/31/10 Projections as of 3/31/10: Future premium income of $98M on loans reinsured Future paid losses of $213M, all from book years 2004 - 2009 Cash and future premiums currently expected to be more than adequate to cover expected losses Loss projections are based on a variety of assumptions, including the characteristics of the current reinsured portfolio, historical loss experiences (loss curves) based on industry data, projected home price declines, projected unemployment rates, projected prepayment levels and other factors. Atrium's reinsurance agreements are all in runoff after 12/31/09 Atrium Reinsurance |

| Mortgage Segments Sensitivities For our combined Mortgage Segments, we have provided some sensitivities on certain key drivers that impact our results as of March 31, 2010 As refinancing subsides, we would expect our prepayments to return to more normal levels As unemployment declines, we would expect delinquency related impacts to revert to more normal levels as seen in 2007 See explanatory note at the bottom of page 37. |

| Sensitivity Example The following example presents the calculation of the estimated impact to earnings from the Interest Rate Sensitivities presented on the previous slide. This example assumes origination and prepayment volumes at the high end of the range presented in both scenarios. The sensitivity of changes in interest rates on the volume of originations and prepayments, and the related impact on earnings, is influenced by a wide variety of factors. There are certain limitations inherent in the sensitivity analysis presented, including the necessity to conduct the analysis based on a single point in time and the inability to include the complex market reactions that normally would arise from the market shifts modeled. These sensitivities are hypothetical and presented for illustrative purposes only. Additionally, these sensitivities do not include the impact of any potential risk management activities available to us. Changes in fair value based on variations in assumptions generally cannot be extrapolated because the relationship of the change in fair value may not be linear. |
