Attached files
| file | filename |
|---|---|
| 8-K - FORM 8-K - IMPERIAL OIL LTD | d8k.htm |
Exhibit 99.1

|
Q1 news release
FOR THE THREE MONTHS ENDED MARCH 31, 2010
|
Calgary, April 28, 2010
Imperial Oil announces estimated first-quarter financial and operating results
| First Quarter | ||||||
| (millions of dollars, unless noted) |
2010 | 2009 | % | |||
| Net income (U.S. GAAP) |
476 | 289 | 65 | |||
| Net income per common share |
||||||
| - assuming dilution (dollars) |
0.56 | 0.33 | 70 | |||
| Capital and exploration expenditures |
900 | 494 | 82 | |||
Bruce March, chairman, president and chief executive officer of Imperial Oil, commented:
“Net income for the first quarter was $476 million, an increase of 65 percent from the first quarter of 2009. Upstream earnings increased with stronger crude oil commodity prices that were partially offset by higher royalty costs and the unfavourable foreign exchange effects of a stronger Canadian dollar. Downstream earnings were impacted by the ongoing challenges in North American economies that resulted in continued soft demands and lower margins.
Imperial Oil continued its long-term focus and disciplined approach to capital investment. In the first quarter of 2010, we continued to invest through this down cycle and add value for our shareholders. Capital and exploration expenditures increased to $900 million in the quarter and supported company growth projects like Kearl, continued exploration of promising shale gas acreage in Horn River and sustaining capital for Cold Lake and Syncrude production. For this quarter, Imperial’s cash generation from operating activities was enough to fund the company growth and we ended with a cash balance higher than what we had coming into the year.
Our proven approach of focusing on operations excellence and the business elements within our control will continue to reward our shareholders in the future.”
Imperial Oil is one of Canada’s largest corporations and a leading member of the country’s petroleum industry. The company is a major producer of crude oil and natural gas, Canada’s largest petroleum refiner and a leading marketer with a coast-to-coast supply network that includes about 1,850 retail service stations.
1
First quarter items of interest
| — | Net income was $476 million, an increase of 65% or $187 million from the first quarter of 2009. |
| — | Net income per common share was $0.56, an increase of 70% from the first quarter of 2009. |
| — | Cash flow generated from operating activities was $914 million, compared with cash flow used in operating activities of $296 million in the same period last year. |
| — | Capital and exploration expenditures were $900 million, up 82 percent from the first quarter of 2009. |
| — | Gross oil-equivalent barrels of production averaged 291,000 barrels a day, compared with 302,000 barrels a day in the same period last year. Lower production volumes in the first quarter were primarily due to expected decline from conventional oil and natural gas assets. |
| — | Kearl oil sands project update – About 2,000 employees and contractors are working on the project. Current construction activities include work on piling, foundations and starter dike at the Kearl site along with vessel and pipe fabrication. The Kearl project will be developed in phases and will ultimately produce more than 300,000 barrels a day of bitumen before royalties. |
| — | Horn River update – Imperial advanced its second winter season drilling program at the Horn River shale gas play in northeast B.C. The company also added an additional 1,000 acres, bringing its joint venture holdings to 310,000 net acres – one of industry’s largest acreage positions in the area. |
| — | Mackenzie natural gas project update – at the National Energy Board’s request, Imperial submitted comments on recommended measures contained in the Joint Review Panel’s report for the proposed project. Final argument hearings were completed in April, with a regulatory decision from the National Energy Board expected in September 2010. |
| — | Construction of Dartmouth refinery’s sulphur recovery plant complete – the first phase of a two-part sulphur recovery project has been completed. The first project phase achieved excellent safety performance and was completed on time and on budget. The second phase involves the construction of a new sour water stripper and will be completed by the end of 2010. The entire project will reduce emissions by 25 percent and increase sulphur recovery to 98 percent. |
| — | Horn River Basin Producers Group receives CAPP’s 2010 Steward of Excellence Award for Social Performance – The award was given in recognition of the group’s work on facilitating open communication with stakeholders, mitigating environmental challenges and maximizing benefits in the area. Imperial is a founding member of the Producers Group. See the Environment & Community section at www.capp.ca for more information about the award. |
| — | Responsible development – in March, Imperial Oil Resources and Ducks Unlimited Canada signed a $720,000 partnership that will focus on wetland inventory and research in Imperial’s operational area around Cold Lake and northeast B.C. This knowledge will be used to guide future development planning and minimize wetland disturbance, and to evaluate and establish land use best practices. |
2
First quarter 2010 vs. first quarter 2009
The company’s net income for the first quarter of 2010 was $476 million or $0.56 a share on a diluted basis, compared with $289 million or $0.33 a share for the same period last year.
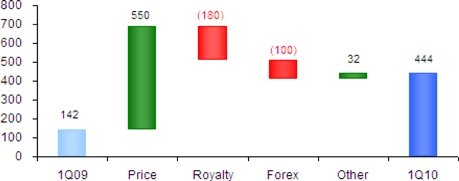
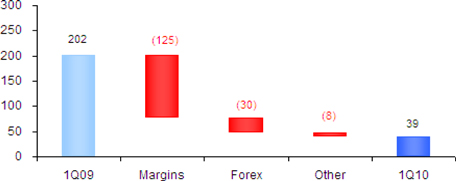
Earnings in the first quarter were higher than the same quarter in 2009, as higher Upstream earnings were partially offset by lower Downstream earnings. In the Upstream, earnings increased primarily due to the impact of higher crude oil commodity prices of about $550 million, partially offset by higher royalty costs due to higher commodity prices of about $180 million and the unfavourable foreign exchange effects of a higher Canadian dollar of about $100 million. Lower Downstream earnings were primarily due to lower margins of about $125 million.
Upstream net income in the first quarter was $444 million, $302 million higher than the same period of 2009. Higher crude oil commodity prices in the first quarter of 2010 increased revenues, contributing to higher earnings of about $550 million. This positive earnings factor was partially offset by higher royalties due to higher commodity prices of about $180 million and the unfavourable foreign exchange effects of a higher Canadian dollar of about $100 million.
The average price of Brent crude oil in U.S. dollars, a common benchmark for world oil markets, at $76.32 a barrel, in the first quarter, increased about 72 percent from the same quarter last year. The company’s average realizations on sales of Canadian conventional crude oil also increased. Prices for Canadian heavier crude oil were also higher along with the lighter crude oil. The company’s average bitumen realizations were favourably impacted by the lower spread between light and heavy crude oils in world markets, compared to the same quarter last year.
Gross production of Cold Lake bitumen returned to expected levels and averaged 148 thousand barrels a day during the first quarter, unchanged from the same quarter last year.
The company’s share of Syncrude’s gross production in the first quarter was 67 thousand barrels a day, slightly lower than 68 thousand barrels during the same period a year ago. Volumes in the first quarter of 2010 were impacted by the advancement of planned maintenance activities originally scheduled for later in the year. The maintenance activities were completed, and the impacted operating units returned to normal operations in the quarter.
In the first quarter, gross production of conventional crude oil averaged 24 thousand barrels a day, down from 26 thousand barrels in the same period last year, due to natural reservoir decline.
Gross production of natural gas during the first quarter of 2010 decreased to 273 million cubic feet a day from 307 million cubic feet in the same period last year. Lower production was primarily due to maintenance activities and natural reservoir decline.
Net income from Downstream was $39 million in the first quarter of 2010, compared with $202 million in the same period a year ago. Earnings were lower in the quarter mainly due to lower overall margins of about $125 million. Earnings were also negatively impacted by the unfavourable foreign exchange effects of a higher Canadian dollar of about $30 million and higher costs associated with planned maintenance activities in the first quarter of 2010.
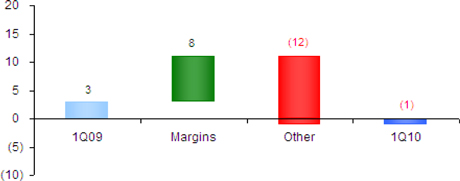
Net income from Chemical was negative $1 million in the first quarter, compared with $3 million in the same quarter last year. Higher costs associated with planned maintenance activities on the Sarnia ethylene cracker in the first quarter of 2010 more than offset improvements in industry margins.
3
First quarter 2010 vs. first quarter 2009 (continued)
Net income effects from Corporate and other were negative $6 million in the first quarter, compared with negative $58 million in the same period of 2009. Favourable earnings effects were primarily due to lower share-based compensation charges.
In the first quarter of 2010, cash flow of $914 million was generated from operations, and $813 million was used to fund growth projects such as Kearl. The company’s balance of cash was $534 million at March 31, 2010, compared with $513 million at the end of 2009.
Key financial and operating data follow.
Forward-Looking Statements
Statements in this report relating to future plans, projections, events or conditions are forward-looking statements. Actual future results, including project plans, costs, timing and capacities; financing sources; the resolution of contingencies and uncertain tax positions; the effect of changes in prices and other market conditions; and environmental and capital expenditures could differ materially depending on a number of factors, such as the outcome of commercial negotiations; changes in the supply of and demand for crude oil, natural gas, and petroleum and petrochemical products; political or regulatory events; and other factors discussed in Item 1A of the company’s 2009 Form 10K.
4
Attachment I
IMPERIAL OIL LIMITED
FIRST QUARTER 2010
| Three Months | |||||
| millions of Canadian dollars, unless noted | 2010 | 2009 | |||
| Net income (U.S. GAAP) |
|||||
| Total revenues and other income |
6,166 | 4,670 | |||
| Total expenses |
5,515 | 4,268 | |||
| Income before income taxes |
651 | 402 | |||
| Income taxes |
175 | 113 | |||
| Net income |
476 | 289 | |||
| Net income per common share (dollars) |
0.56 | 0.34 | |||
| Net income per common share - assuming dilution (dollars) |
0.56 | 0.33 | |||
| Gain/(loss) on asset sales, after tax |
4 | 1 | |||
| Total assets at March 31 |
18,335 | 16,490 | |||
| Total debt at March 31 |
139 | 143 | |||
| Interest coverage ratio - earnings basis |
|||||
| (rolling 4 quarters, times covered) |
307.1 | 472.3 | |||
| Other long-term obligations at March 31 |
2,679 | 2,185 | |||
| Shareholders’ equity at March 31 |
9,943 | 8,862 | |||
| Capital employed at March 31 |
10,118 | 9,045 | |||
| Return on average capital employed (a) |
|||||
| (rolling 4 quarters, percent) |
18.4 | 38.7 | |||
| Dividends on common stock |
|||||
| Total |
85 | 86 | |||
| Per common share (dollars) |
0.10 | 0.10 | |||
| Millions of common shares outstanding |
|||||
| At March 31 |
847.6 | 848.9 | |||
| Average - assuming dilution |
854.2 | 862.7 | |||
| (a) | Return on capital employed is net income excluding after-tax cost of financing divided by the average rolling four quarters’ capital employed. |
5
Attachment II
IMPERIAL OIL LIMITED
FIRST QUARTER 2010
| Three Months | ||||||
| millions of Canadian dollars | 2010 | 2009 | ||||
| Total cash and cash equivalents at period end |
534 | 755 | ||||
| Net income |
476 | 289 | ||||
| Adjustment for non-cash items: |
||||||
| Depreciation and depletion |
182 | 197 | ||||
| (Gain)/loss on asset sales |
(4 | ) | (1 | ) | ||
| Deferred income taxes and other |
2 | 28 | ||||
| Changes in operating assets and liabilities |
258 | (a) | (809 | ) | ||
|
Cash from (used in) operating activities
|
914
|
|
(296
|
)
| ||
| Cash from (used in) investing activities |
(807 | ) | (407 | ) | ||
| Proceeds from asset sales |
6 | 2 | ||||
| Cash from (used in) financing activities |
(86 | ) | (516 | ) | ||
| (a) | First quarter 2010 cash flow from operating activities was positively impacted by higher payable balances due to timing of expenditures and timing of scheduled income tax payments. |
6
Attachment III
IMPERIAL OIL LIMITED
FIRST QUARTER 2010
| Three Months | ||||||
|
millions of Canadian dollars
|
2010
|
2009
|
||||
| Net income (U.S. GAAP) |
||||||
| Upstream |
444 | 142 | ||||
| Downstream |
39 | 202 | ||||
| Chemical |
(1 | ) | 3 | |||
| Corporate and other
|
(6
|
)
|
(58
|
)
| ||
|
Net income
|
476
|
|
289
|
| ||
| Total revenues |
||||||
| Upstream |
2,209 | 1,420 | ||||
| Downstream |
5,192 | 4,083 | ||||
| Chemical |
353 | 272 | ||||
| Eliminations/Other
|
(1,588
|
)
|
(1,105
|
)
| ||
|
Revenues
|
6,166
|
|
4,670
|
| ||
| Purchases of crude oil and products |
||||||
| Upstream |
787 | 364 | ||||
| Downstream |
4,187 | 2,867 | ||||
| Chemical |
276 | 199 | ||||
| Eliminations
|
(1,589
|
)
|
(1,110
|
)
| ||
|
Purchases of crude oil and products
|
3,661
|
|
2,320
|
| ||
| Production and manufacturing expenses |
||||||
| Upstream |
602 | 646 | ||||
| Downstream |
370 | 336 | ||||
| Chemical
|
58
|
|
48
|
| ||
|
Production and manufacturing expenses
|
1,030
|
|
1,030
|
| ||
| Capital and exploration expenditures |
||||||
| Upstream |
855 | 447 | ||||
| Downstream |
38 | 42 | ||||
| Chemical |
6 | 4 | ||||
| Corporate and other
|
1
|
|
1
|
| ||
|
Capital and exploration expenditures
|
900
|
|
494
|
| ||
| Exploration expenses charged to income included above |
87 | 83 | ||||
7
Attachment IV
IMPERIAL OIL LIMITED
FIRST QUARTER 2010
| Operating statistics | Three Months | ||||
| 2010 | 2009 | ||||
| Gross crude oil and Natural Gas Liquids (NGL) production |
|||||
| (thousands of barrels a day) |
|||||
| Cold Lake |
148 | 148 | |||
| Syncrude |
67 | 68 | |||
| Conventional |
24 | 26 | |||
| Total crude oil production |
239 | 242 | |||
| NGLs available for sale |
6 | 9 | |||
| Total crude oil and NGL production |
245 | 251 | |||
| Gross natural gas production (millions of cubic feet a day) |
273 | 307 | |||
| Gross oil-equivalent production (a) |
|||||
| (thousands of oil-equivalent barrels a day) |
291 | 302 | |||
| Net crude oil and NGL production (thousands of barrels a day) |
|||||
| Cold Lake |
118 | 141 | |||
| Syncrude |
60 | 70 | |||
| Conventional |
17 | 23 | |||
| Total crude oil production |
195 | 234 | |||
| NGLs available for sale |
5 | 6 | |||
| Total crude oil and NGL production |
200 | 240 | |||
| Net natural gas production (millions of cubic feet a day) |
237 | 262 | |||
| Net oil-equivalent production (a) |
|||||
| (thousands of oil-equivalent barrels a day) |
240 | 284 | |||
| Cold Lake blend sales (thousands of barrels a day) |
201 | 198 | |||
| NGL Sales (thousands of barrels a day) |
12 | 12 | |||
| Natural gas sales (millions of cubic feet a day) |
264 | 277 | |||
| Average realizations (Canadian dollars) |
|||||
| Conventional crude oil realizations (a barrel) |
74.54 | 46.61 | |||
| NGL realizations (a barrel) |
55.53 | 41.20 | |||
| Natural gas realizations (a thousand cubic feet) |
5.20 | 5.82 | |||
| Synthetic oil realizations (a barrel) |
82.24 | 55.67 | |||
| Bitumen realizations (a barrel) |
62.25 | 35.00 | |||
| Refinery throughput (thousands of barrels a day) |
439 | 460 | |||
| Refinery capacity utilization (percent) |
87 | 92 | |||
| Petroleum product sales (thousands of barrels a day) |
|||||
| Gasolines |
204 | 190 | |||
| Heating, diesel and jet fuels |
145 | 158 | |||
| Heavy fuel oils |
33 | 31 | |||
| Lube oils and other products |
39 | 36 | |||
| Net petroleum products sales |
421 | 415 | |||
| Petrochemical Sales (thousands of tonnes a day)
|
2.7
|
2.7
|
| ||
| (a) | Gas converted to oil-equivalent at 6 million cubic feet = 1 thousand barrels |
8
Attachment V
IMPERIAL OIL LIMITED
FIRST QUARTER 2010
| Net income (U.S. GAAP) | Net income per common share |
||||
| (millions of Canadian dollars) | (dollars) | ||||
| 2006 |
|||||
| First Quarter |
591 | 0.60 | |||
| Second Quarter |
837 | 0.85 | |||
| Third Quarter |
822 | 0.84 | |||
| Fourth Quarter |
794 | 0.83 | |||
| Year |
3,044 | 3.12 | |||
| 2007 |
|||||
| First Quarter |
774 | 0.82 | |||
| Second Quarter |
712 | 0.76 | |||
| Third Quarter |
816 | 0.88 | |||
| Fourth Quarter |
886 | 0.97 | |||
| Year |
3,188 | 3.43 | |||
| 2008 |
|||||
| First Quarter |
681 | 0.76 | |||
| Second Quarter |
1,148 | 1.29 | |||
| Third Quarter |
1,389 | 1.57 | |||
| Fourth Quarter |
660 | 0.77 | |||
| Year |
3,878 | 4.39 | |||
| 2009 |
|||||
| First Quarter |
289 | 0.34 | |||
| Second Quarter |
209 | 0.25 | |||
| Third Quarter |
547 | 0.64 | |||
| Fourth Quarter |
534 | 0.63 | |||
| Year |
1,579 | 1.86 | |||
| 2010 |
|||||
| First Quarter |
476 | 0.56 | |||
9
IMPERIAL OIL LIMITED
FIRST QUARTER 2010
Factors affecting net income (millions of Canadian dollars)
| Upstream Earnings 1Q10 vs 1Q09
|
|||||||
|
|||||||
| 1Q10 | 1Q09 | 1Q10
vs 1Q09 |
| ||||
|
444 |
142 |
302 |
| ||||
| Downstream Earnings 1Q10 vs 1Q09 | |||||||
|
|||||||
| 1Q10 | 1Q09 | 1Q10
vs 1Q09 |
| ||||
|
39 |
202 |
(163) |
| ||||
| Chemical Earnings 1Q10 vs 1Q09 | |||||||
|
|
|||||||
| 1Q10 | 1Q09 | 1Q10
vs 1Q09 |
| ||||
|
(1) |
3 |
(4 |
) | ||||
10