Attached files
| file | filename |
|---|---|
| 8-K - FORM 8-K - LODGENET INTERACTIVE CORP | c57698e8vk.htm |
| EX-99.1 - EX-99.1 - LODGENET INTERACTIVE CORP | c57698exv99w1.htm |
Exhibit 99.2
| Certain statements in this presentation constitute "forward-looking statements." When used in this presentation the words "intends," "expects," "anticipates," "estimates," "believes," "goal," "no assurance" and similar expressions, and statements which are made in the future tense or refer to future events or developments, including, without limitation, our guidance for the second quarter of 2010, and our estimates of the effects of an economic rebound, are intended to identify such forward-looking statements. Such forward-looking statements are subject to risks, uncertainties, and other factors that could cause the actual results, performance or achievements to be materially different from any future results, performance or achievements expressed or implied by such forward-looking statements. Such factors include, among others, the following: the effects of economic conditions, including general financial conditions (including those represented recently by liquidity crises, government bailouts and assistance plans, bank failures, and recessionary threats and developments); the economic condition of the lodging industry, which can be particularly affected the financial conditions referenced above, as well as by high gas prices, levels of unemployment, consumer confidence, acts or threats of terrorism and public health issues; competition from providers of similar services and from alternative systems for accessing in-room entertainment; competition from HSIA providers; changes in demand for our products and services; programming availability, timeliness, quality, and costs; technological developments by competitors; developmental costs, difficulties, and delays; relationships with customers and property owners, in particular as we reduce capital investment; the availability of capital to finance growth; compliance with credit facility covenants; the impact of governmental regulations; potential effects of litigation; risks of expansion into new markets; risks related to the security of our data systems; and other factors detailed, from time to time, in our filings with the Securities and Exchange Commission. For any of the foregoing reasons, our guidance and our actual financial results may not meet our expectations. These forward-looking statements speak only as of the date of this presentation. We expressly disclaim any obligation or undertaking to release publicly any updates or revisions to any forward-looking statements contained herein to reflect any change in our expectations with regard thereto or any change in events, conditions or circumstances on which any such statement is based. |
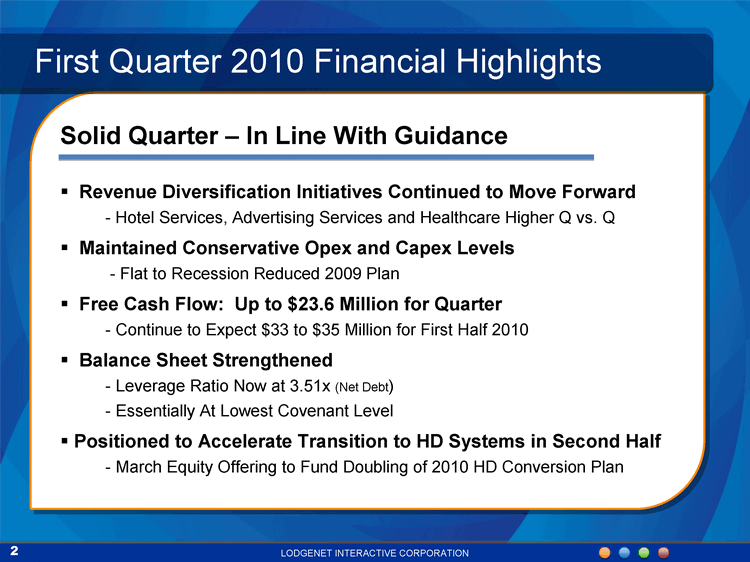
| Solid Quarter - In Line With Guidance Revenue Diversification Initiatives Continued to Move Forward - Hotel Services, Advertising Services and Healthcare Higher Q vs. Q Maintained Conservative Opex and Capex Levels - Flat to Recession Reduced 2009 Plan Free Cash Flow: Up to $23.6 Million for Quarter Continue to Expect $33 to $35 Million for First Half 2010 Balance Sheet Strengthened Leverage Ratio Now at 3.51x (Net Debt) Essentially At Lowest Covenant Level Positioned to Accelerate Transition to HD Systems in Second Half March Equity Offering to Fund Doubling of 2010 HD Conversion Plan First Quarter 2010 Financial Highlights |

| $118.1 $128.1 Revenue Total Revenue Down 7.8% ($ in millions) Increased Revenue from: Hotel Services Advertising Healthcare Growth Initiatives Generate $49 Million (41.5% of Total Revenue) Results in Line With Q1 Guidance |

| Guest Entertainment: Impacted by Conservative Consumer Buying Pattern Increased Revenue from HD Systems Hotel Services - Expanding HD Free-To-Guest Room Base System Sales - Q1 '09 Impacted by Material HD Equipment Conversion Contract Advertising Services - New Revenue from Channel Lease Program Q1 Revenue Per Room Comparison |

| Q1 Gross Margin Comparison Stable to Slightly Improving Margins All Hospitality Products and Services Generated Improved Margins |
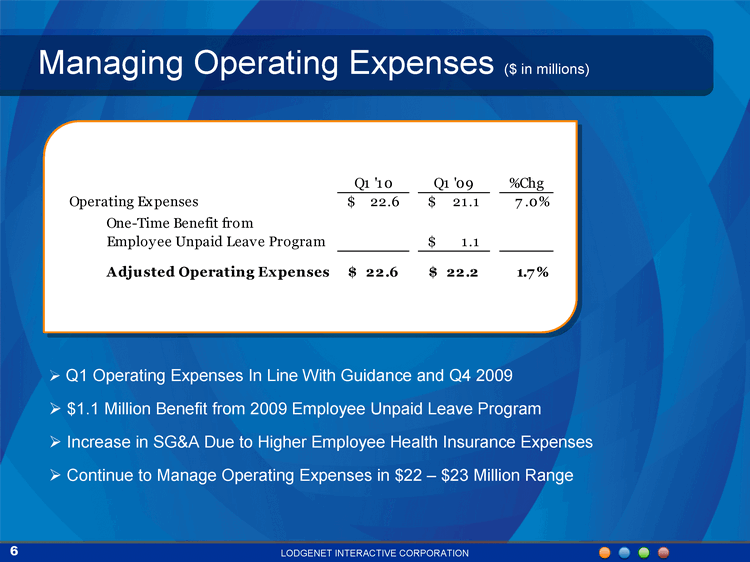
| Q1 Operating Expenses In Line With Guidance and Q4 2009 $1.1 Million Benefit from 2009 Employee Unpaid Leave Program Increase in SG&A Due to Higher Employee Health Insurance Expenses Continue to Manage Operating Expenses in $22 - $23 Million Range Managing Operating Expenses ($ in millions) |

| Profitability Metrics (in millions) * Adjusted Operating Cash Flow Definition - see slide 18 Adjusted Operating Cash Flow* $29.1 $34.6 Q1 Results In Line With Guidance Stable Results Over Last Four Quarters $31.7 $30.0 $28.0 |
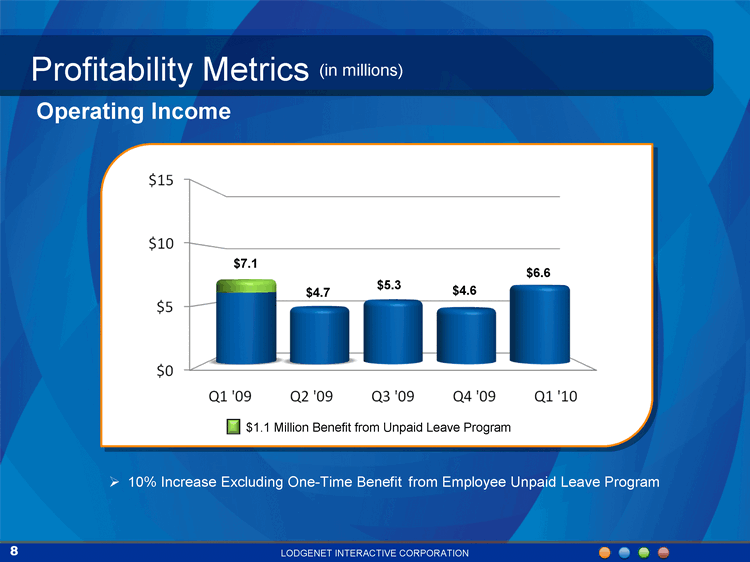
| Operating Income Profitability Metrics (in millions) 10% Increase Excluding One-Time Benefit from Employee Unpaid Leave Program $1.1 Million Benefit from Unpaid Leave Program $7.1 $4.7 $5.3 $4.6 $6.6 |
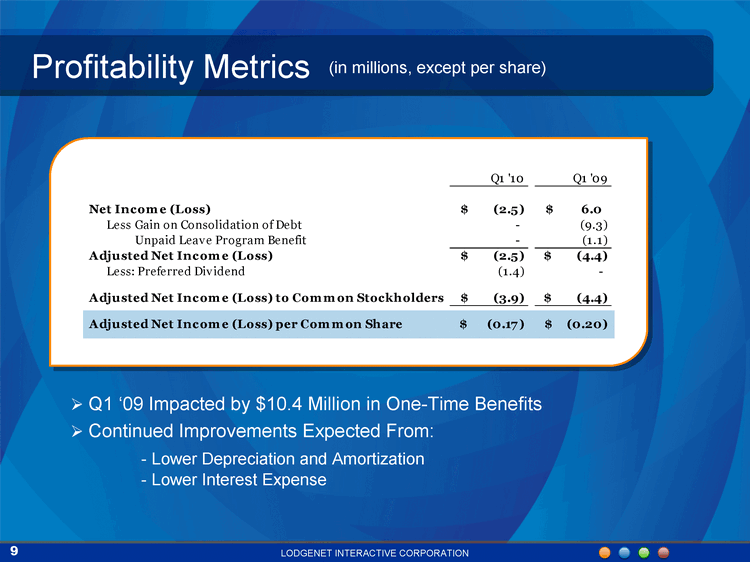
| Profitability Metrics (in millions, except per share) Q1 '09 Impacted by $10.4 Million in One-Time Benefits Continued Improvements Expected From: Lower Depreciation and Amortization Lower Interest Expense |
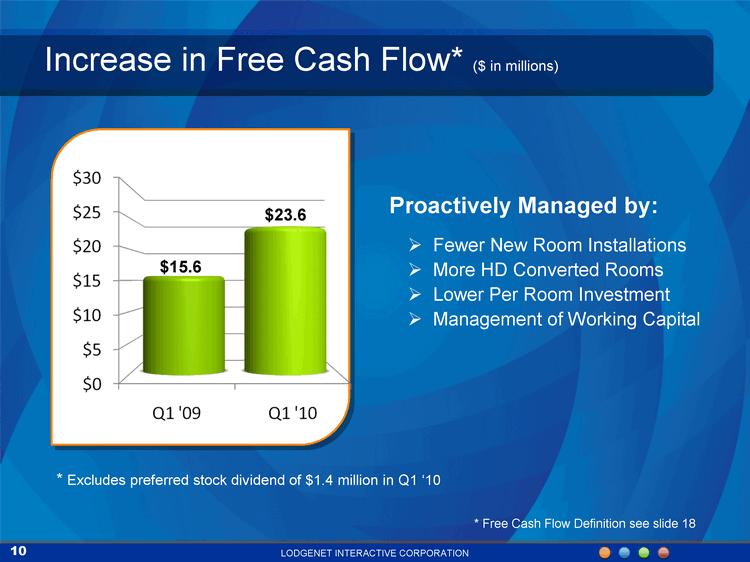
| Increase in Free Cash Flow* ($ in millions) * Free Cash Flow Definition see slide 18 * Excludes preferred stock dividend of $1.4 million in Q1 '10 $15.6 $23.6 Proactively Managed by: Fewer New Room Installations More HD Converted Rooms Lower Per Room Investment Management of Working Capital |

| Free Cash Flow Analysis* ($ in millions except per share) Quarterly comparison * Free Cash Flow Definition see slide 18 Excludes preferred stock dividend of $1.4 million in Q1 '10 |

| Reducing Leverage ($ in millions) Reduced Debt by $42.9 Million Leverage Ratio Approaching Lowest Covenant Step-Down |

| March Equity Offering Raised $13.7 Million of Growth Capital Sold 2.5 Million Shares @ $6.00 per Share 11% of Outstanding, or 7% of "As Converted" Registered Direct Offering Through Craig-Hallum Capital Group Positions LodgeNet to Accelerate Transition to HD Systems HD Systems: Performing Well In Challenging Economic Environment Capital Will Fund Doubling of 2010 HD Conversion Plan |

| HD Capital Investment Levels Decreasing per Room Gains From Technology Advances and Business Model Changes Technology Advances: - "Riding the Technology Cost Curve" - TV Companies "Embedding" LodgeNet Technology into HDTV Sets Business Model Changes: Hotels Purchasing In-Room and FTG Equipment $398 $339 $320 $241 $220-$270 $150-$200 |

| HD System Revenue Performing Well HD Systems Now in 240,000 Rooms: 14% of Guest Entertainment Rooms Base Will Expand As Economy Recovers - Hotels Buy Televisions HD Rooms = 50% More Revenue 43% More Guest Entertainment 63% More Hotel Services (TV Programming) HD Room Revenue Up 4% (vs. prior quarters) Guest Entertainment Up 5% Hotel Services Up 1% Compare: Average Room Down (2)% Solid Return on Capital Investment $175 to $245 Investment per Room Capital Returned within 18 to 24 Months +50% Prior Two Quarters |

| CFO Transition Gary H. Ritondaro Retiring Announced His Intention Last August Transitional Period Through End of July Provides for Smooth and Orderly Transition Frank P. Elsenbast Assuming Position ShopNBC CFO (2004 - 2010) The Pillsbury Company Arthur Andersen |

| Q1'10 Financial Guidance Assumes: 5% to 10% Reduction in Guest Entertainment Revenue vs. Q2 '09 Guest Entertainment Revenue Per Room Flat to Down 5% Maintaining Current Operating Cost Structure * Free Cash Flow and Adjusted Operating Cash Flow Definitions - see slide 18 |

| Reconciliation of Operating Income to Adjusted Operating Cash Flow Reconciliation of Free Cash Flow Cash from Operations Less: Cash Used for Investing Activities, including Growth-Related Capital Equals: Free Cash Flow |
