Attached files
| file | filename |
|---|---|
| 8-K - 8-K - JANUS CAPITAL GROUP INC | a10-8507_18k.htm |
| EX-99.1 - EX-99.1 - JANUS CAPITAL GROUP INC | a10-8507_1ex99d1.htm |
Exhibit 99.2
|
|
First Quarter 2010 Earnings Presentation April 22, 2010 Dick Weil Chief Executive Officer Greg Frost Chief Financial Officer C-0410-213 07-15-10 |
|
|
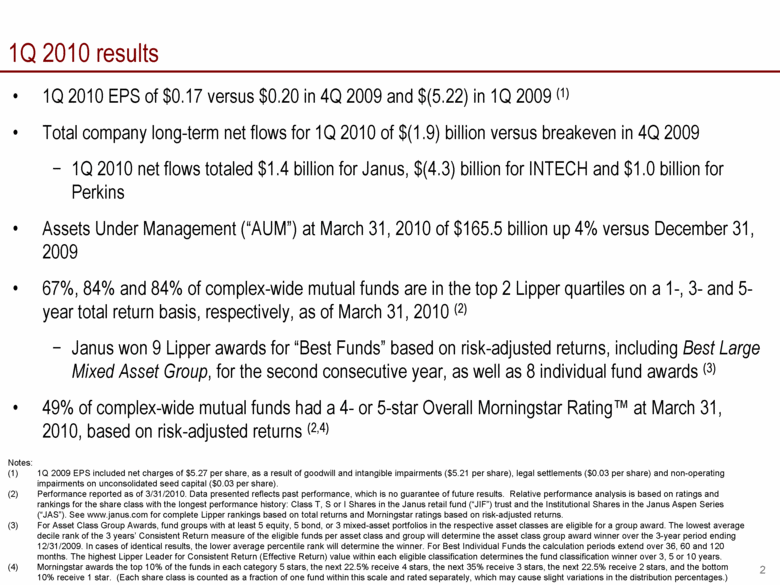
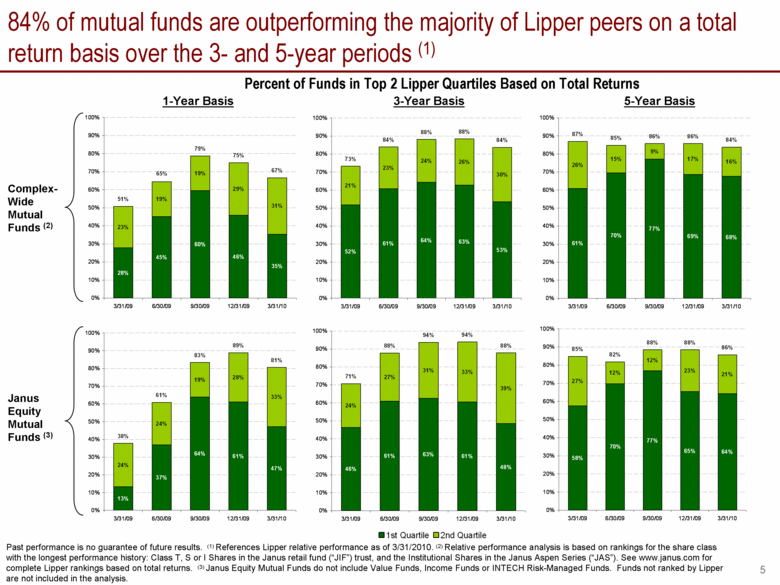
1Q 2010 results 1Q 2010 EPS of $0.17 versus $0.20 in 4Q 2009 and $(5.22) in 1Q 2009 (1) Total company long-term net flows for 1Q 2010 of $(1.9) billion versus breakeven in 4Q 2009 1Q 2010 net flows totaled $1.4 billion for Janus, $(4.3) billion for INTECH and $1.0 billion for Perkins Assets Under Management (“AUM”) at March 31, 2010 of $165.5 billion up 4% versus December 31, 2009 67%, 84% and 84% of complex-wide mutual funds are in the top 2 Lipper quartiles on a 1-, 3- and 5-year total return basis, respectively, as of March 31, 2010 (2) Janus won 9 Lipper awards for “Best Funds” based on risk-adjusted returns, including Best Large Mixed Asset Group, for the second consecutive year, as well as 8 individual fund awards (3) 49% of complex-wide mutual funds had a 4- or 5-star Overall Morningstar Rating™ at March 31, 2010, based on risk-adjusted returns (2,4) Notes: 1Q 2009 EPS included net charges of $5.27 per share, as a result of goodwill and intangible impairments ($5.21 per share), legal settlements ($0.03 per share) and non-operating impairments on unconsolidated seed capital ($0.03 per share). Performance reported as of 3/31/2010. Data presented reflects past performance, which is no guarantee of future results. Relative performance analysis is based on ratings and rankings for the share class with the longest performance history: Class T, S or I Shares in the Janus retail fund (“JIF”) trust and the Institutional Shares in the Janus Aspen Series (“JAS”). See www.janus.com for complete Lipper rankings based on total returns and Morningstar ratings based on risk-adjusted returns. For Asset Class Group Awards, fund groups with at least 5 equity, 5 bond, or 3 mixed-asset portfolios in the respective asset classes are eligible for a group award. The lowest average decile rank of the 3 years’ Consistent Return measure of the eligible funds per asset class and group will determine the asset class group award winner over the 3-year period ending 12/31/2009. In cases of identical results, the lower average percentile rank will determine the winner. For Best Individual Funds the calculation periods extend over 36, 60 and 120 months. The highest Lipper Leader for Consistent Return (Effective Return) value within each eligible classification determines the fund classification winner over 3, 5 or 10 years. Morningstar awards the top 10% of the funds in each category 5 stars, the next 22.5% receive 4 stars, the next 35% receive 3 stars, the next 22.5% receive 2 stars, and the bottom 10% receive 1 star. (Each share class is counted as a fraction of one fund within this scale and rated separately, which may cause slight variations in the distribution percentages.) |
|
|
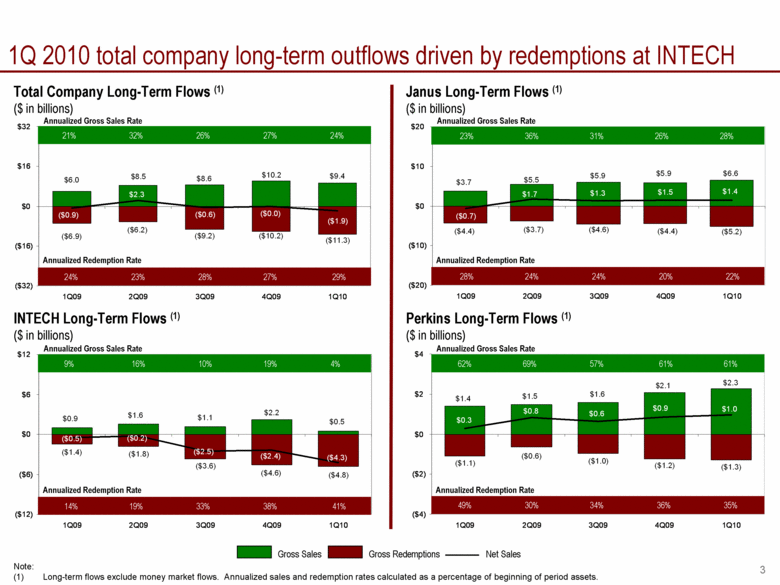
1Q 2010 total company long-term outflows driven by redemptions at INTECH Total Company Long-Term Flows (1) ($ in billions) INTECH Long-Term Flows (1) ($ in billions) Janus Long-Term Flows (1) ($ in billions) Gross Redemptions Gross Sales Net Sales Note: Long-term flows exclude money market flows. Annualized sales and redemption rates calculated as a percentage of beginning of period assets. 21% 32% 26% 27% 24% 24% 23% 28% 27% 29% Annualized Redemption Rate Annualized Gross Sales Rate Perkins Long-Term Flows (1) ($ in billions) 23% 36% 31% 26% 28% 28% 24% 24% 20% 22% Annualized Redemption Rate Annualized Gross Sales Rate 9% 16% 10% 19% 4% 14% 19% 33% 38% 41% Annualized Redemption Rate Annualized Gross Sales Rate 62% 69% 57% 61% 61% 49% 30% 34% 36% 35% Annualized Redemption Rate Annualized Gross Sales Rate $0.9 $1.6 $1.1 $0.5 $2.2 ($1.4) ($1.8) ($3.6) ($4.6) ($4.8) ($0.5) ($0.2) ($2.5) ($2.4) ($4.3) ($12) ($6) $0 $6 $12 1Q09 2Q09 3Q09 4Q09 1Q10 $2.1 $2.3 $1.6 $1.5 $1.4 ($1.3) ($1.2) ($1.0) ($0.6) ($1.1) $1.0 $0.9 $0.6 $0.8 $0.3 ($4) ($2) $0 $2 $4 1Q09 2Q09 3Q09 4Q09 1Q10 $9.4 $6.0 $8.5 $8.6 $10.2 ($11.3) ($10.2) ($9.2) ($6.2) ($6.9) ($1.9) ($0.0) ($0.6) $2.3 ($0.9) ($32) ($16) $0 $16 $32 1Q09 2Q09 3Q09 4Q09 1Q10 |
|
|
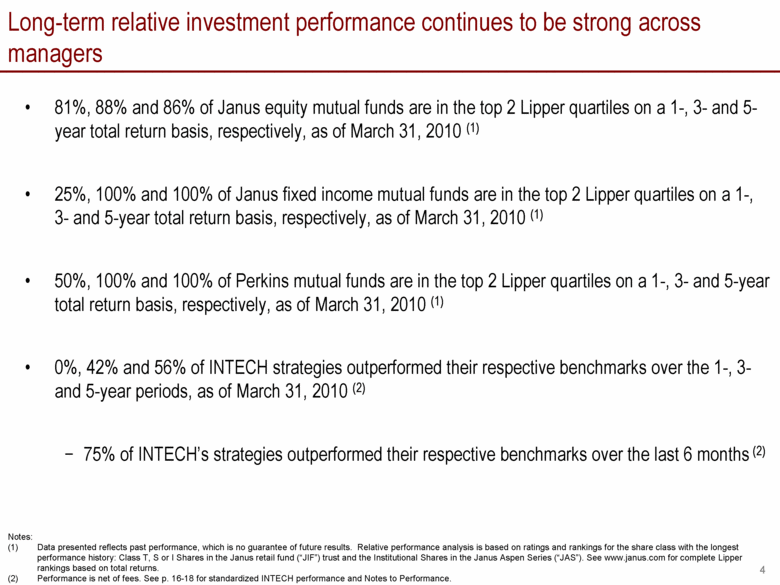
Long-term relative investment performance continues to be strong across managers 81%, 88% and 86% of Janus equity mutual funds are in the top 2 Lipper quartiles on a 1-, 3- and 5-year total return basis, respectively, as of March 31, 2010 (1) 25%, 100% and 100% of Janus fixed income mutual funds are in the top 2 Lipper quartiles on a 1-, 3- and 5-year total return basis, respectively, as of March 31, 2010 (1) 50%, 100% and 100% of Perkins mutual funds are in the top 2 Lipper quartiles on a 1-, 3- and 5-year total return basis, respectively, as of March 31, 2010 (1) 0%, 42% and 56% of INTECH strategies outperformed their respective benchmarks over the 1-, 3- and 5-year periods, as of March 31, 2010 (2) 75% of INTECH’s strategies outperformed their respective benchmarks over the last 6 months (2) Notes: Data presented reflects past performance, which is no guarantee of future results. Relative performance analysis is based on ratings and rankings for the share class with the longest performance history: Class T, S or I Shares in the Janus retail fund (“JIF”) trust and the Institutional Shares in the Janus Aspen Series (“JAS”). See www.janus.com for complete Lipper rankings based on total returns. Performance is net of fees. See p. 16-18 for standardized INTECH performance and Notes to Performance. |
|
|
84% of mutual funds are outperforming the majority of Lipper peers on a total return basis over the 3- and 5-year periods (1) 1-Year Basis 3-Year Basis Percent of Funds in Top 2 Lipper Quartiles Based on Total Returns Complex-Wide Mutual Funds (2) Janus Equity Mutual Funds (3) 5-Year Basis Past performance is no guarantee of future results. (1) References Lipper relative performance as of 3/31/2010. (2) Relative performance analysis is based on rankings for the share class with the longest performance history: Class T, S or I Shares in the Janus retail fund (“JIF”) trust, and the Institutional Shares in the Janus Aspen Series (“JAS”). See www.janus.com for complete Lipper rankings based on total returns. (3) Janus Equity Mutual Funds do not include Value Funds, Income Funds or INTECH Risk-Managed Funds. Funds not ranked by Lipper are not included in the analysis. 52% 61% 64% 63% 53% 21% 23% 24% 26% 30% 84% 88% 73% 88% 84% 0% 10% 20% 30% 40% 50% 60% 70% 80% 90% 100% 3/31/09 6/30/09 9/30/09 12/31/09 3/31/10 1st Quartile 2nd Quartile 13% 37% 64% 61% 47% 24% 24% 19% 28% 33% 61% 89% 38% 83% 81% 0% 10% 20% 30% 40% 50% 60% 70% 80% 90% 100% 3/31/09 6/30/09 9/30/09 12/31/09 3/31/10 2nd Quartile 77% 65% 64% 27% 12% 12% 23% 21% 58% 70% 82% 88% 86% 88% 85% 0% 10% 20% 30% 40% 50% 60% 70% 80% 90% 100% 3/31/09 6/30/09 9/30/09 12/31/09 3/31/10 28% 45% 60% 46% 35% 23% 19% 19% 29% 31% 67% 79% 51% 65% 75% 0% 10% 20% 30% 40% 50% 60% 70% 80% 90% 100% 3/31/09 6/30/09 9/30/09 12/31/09 3/31/10 46% 61% 63% 61% 48% 24% 27% 31% 33% 39% 88% 94% 88% 94% 71% 0% 10% 20% 30% 40% 50% 60% 70% 80% 90% 100% 3/31/09 6/30/09 9/30/09 12/31/09 3/31/10 0% 10% 20% 30% 40% 50% 60% 70% 80% 90% 100% 3/31/09 6/30/09 9/30/09 12/31/09 3/31/10 61% 87% 85% 86% 86% 84% 70% 77% 69% 68% |
|
|
Financials Greg Frost Chief Financial Officer |
|
|
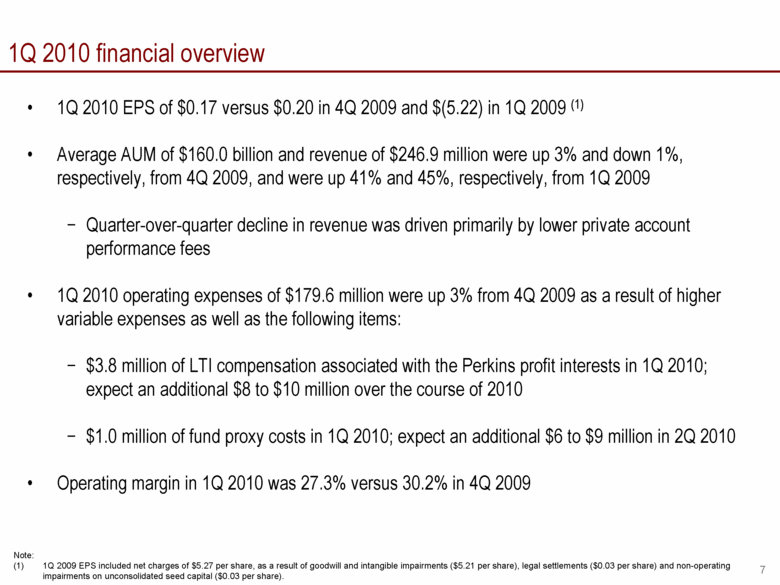
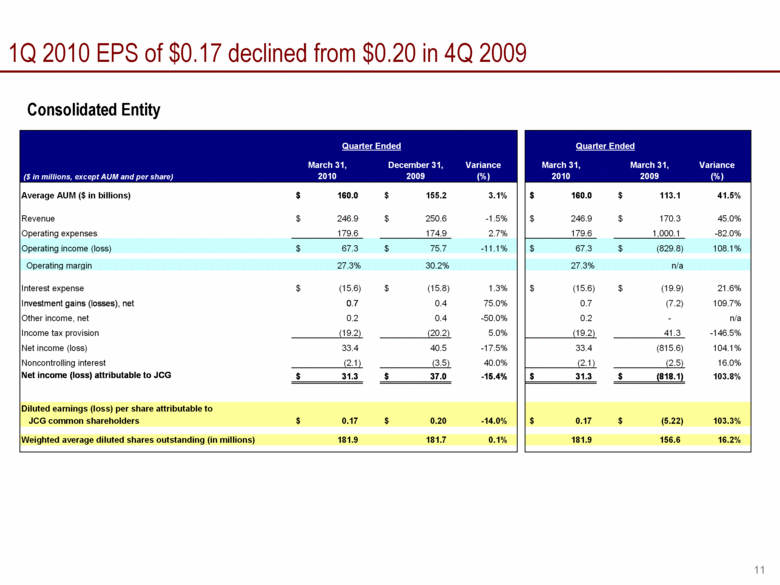
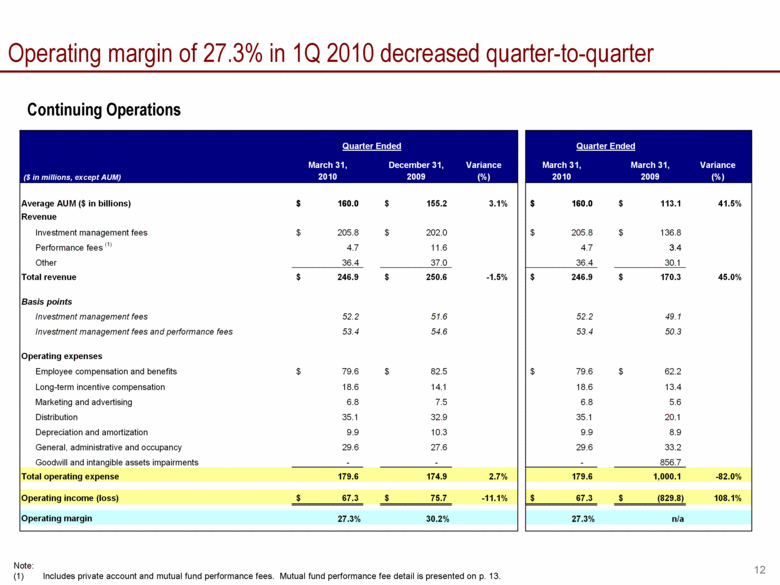
1Q 2010 financial overview 1Q 2010 EPS of $0.17 versus $0.20 in 4Q 2009 and $(5.22) in 1Q 2009 (1) Average AUM of $160.0 billion and revenue of $246.9 million were up 3% and down 1%, respectively, from 4Q 2009, and were up 41% and 45%, respectively, from 1Q 2009 Quarter-over-quarter decline in revenue was driven primarily by lower private account performance fees 1Q 2010 operating expenses of $179.6 million were up 3% from 4Q 2009 as a result of higher variable expenses as well as the following items: $3.8 million of LTI compensation associated with the Perkins profit interests in 1Q 2010; expect an additional $8 to $10 million over the course of 2010 $1.0 million of fund proxy costs in 1Q 2010; expect an additional $6 to $9 million in 2Q 2010 Operating margin in 1Q 2010 was 27.3% versus 30.2% in 4Q 2009 Note: 1Q 2009 EPS included net charges of $5.27 per share, as a result of goodwill and intangible impairments ($5.21 per share), legal settlements ($0.03 per share) and non-operating impairments on unconsolidated seed capital ($0.03 per share). |
|
|
Global priorities Deliver superior long-term investment performance Capitalize on opportunities in distribution channels Retail intermediary Increase presence in RIA channel and with regional broker/dealers Invest in infrastructure to support future growth (build out internal sales desk and enhance existing technology infrastructure) Continue to strengthen the brand Institutional INTECH – focus on client retention and growing the asset base Janus and Perkins – continue to generate traction and increase consultant recommendations Strategically expand product offering Further develop global equity, fixed income and other product types Position the firm to deliver sustained and consistent profit growth in line with the leaders of our industry |
|
|
Appendix |
|
|
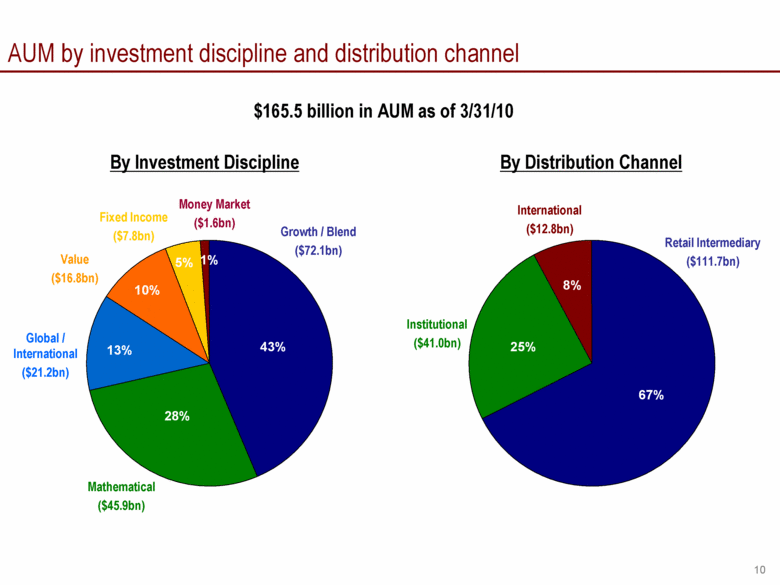
AUM by investment discipline and distribution channel Value ($16.8bn) Retail Intermediary ($111.7bn) $165.5 billion in AUM as of 3/31/10 By Investment Discipline By Distribution Channel Growth / Blend ($72.1bn) Money Market ($1.6bn) Global / International ($21.2bn) Fixed Income ($7.8bn) Mathematical ($45.9bn) Institutional ($41.0bn) International ($12.8bn) 25% 8% 67% 43% 1% 5% 10% 13% 28% |
|
|
1Q 2010 EPS of $0.17 declined from $0.20 in 4Q 2009 Consolidated Entity March 31, December 31, Variance March 31, March 31, Variance ($ in millions, except AUM and per share) 2010 2009 (%) 2010 2009 (%) Average AUM ($ in billions) 160.0 $ 155.2 $ 3.1% 160.0 $ 113.1 $ 41.5% Revenue 246.9 $ 250.6 $ -1.5% 246.9 $ 170.3 $ 45.0% Operating expenses 179.6 174.9 2.7% 179.6 1,000.1 -82.0% Operating income (loss) 67.3 $ 75.7 $ -11.1% 67.3 $ (829.8) $ 108.1% Operating margin 27.3% 30.2% 27.3% n/a Interest expense (15.6) $ (15.8) $ 1.3% (15.6) $ (19.9) $ 21.6% Investment gains (losses), net 0.7 0.4 75.0% 0.7 (7.2) 109.7% Other income, net 0.2 0.4 -50.0% 0.2 - n/a Income tax provision (19.2) (20.2) 5.0% (19.2) 41.3 -146.5% Net income (loss) 33.4 40.5 -17.5% 33.4 (815.6) 104.1% Noncontrolling interest (2.1) (3.5) 40.0% (2.1) (2.5) 16.0% Net income (loss) attributable to JCG 31.3 $ 37.0 $ -15.4% 31.3 $ (818.1) $ 103.8% Diluted earnings (loss) per share attributable to JCG common shareholders 0.17 $ 0.20 $ -14.0% 0.17 $ (5.22) $ 103.3% Weighted average diluted shares outstanding (in millions) 181.9 181.7 0.1% 181.9 156.6 16.2% Quarter Ended Quarter Ended |
|
|
Operating margin of 27.3% in 1Q 2010 decreased quarter-to-quarter Note: Includes private account and mutual fund performance fees. Mutual fund performance fee detail is presented on p. 13. Continuing Operations March 31, December 31, Variance March 31, March 31, Variance ($ in millions, except AUM) 2010 2009 (%) 2010 2009 (%) Average AUM ($ in billions) 160.0 $ 155.2 $ 3.1% 160.0 $ 113.1 $ 41.5% Revenue Investment management fees 205.8 $ 202.0 $ 205.8 $ 136.8 $ Performance fees (1) 4.7 11.6 4.7 3.4 Other 36.4 37.0 36.4 30.1 Total revenue 246.9 $ 250.6 $ -1.5% 246.9 $ 170.3 $ 45.0% Basis points Investment management fees 52.2 51.6 52.2 49.1 Investment management fees and performance fees 53.4 54.6 53.4 50.3 Operating expenses Employee compensation and benefits 79.6 $ 82.5 $ 79.6 $ 62.2 $ Long-term incentive compensation 18.6 14.1 18.6 13.4 Marketing and advertising 6.8 7.5 6.8 5.6 Distribution 35.1 32.9 35.1 20.1 Depreciation and amortization 9.9 10.3 9.9 8.9 General, administrative and occupancy 29.6 27.6 29.6 33.2 Goodwill and intangible assets impairments - - - 856.7 Total operating expense 179.6 174.9 2.7% 179.6 1,000.1 -82.0% Operating income (loss) 67.3 $ 75.7 $ -11.1% 67.3 $ (829.8) $ 108.1% Operating margin 27.3% 30.2% 27.3% n/a Quarter Ended Quarter Ended |
|
|
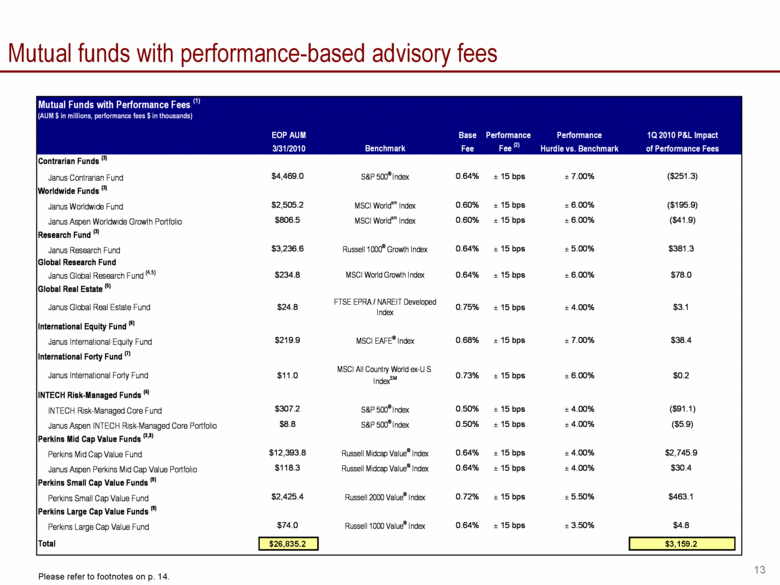
Mutual funds with performance-based advisory fees Please refer to footnotes on p. 14. Mutual Funds with Performance Fees (1) (AUM $ in millions, performance fees $ in thousands) EOP AUM Base Performance Performance 1Q 2010 P&L Impact 3/31/2010 Benchmark Fee Fee (2) Hurdle vs. Benchmark of Performance Fees Contrarian Funds (3) Janus Contrarian Fund $4,469.0 S&P 500® Index 0.64% ± 15 bps ± 7.00% ($251.3) Worldwide Funds (3) Janus Worldwide Fund $2,505.2 MSCI Worldsm Index 0.60% ± 15 bps ± 6.00% ($195.9) Janus Aspen Worldwide Growth Portfolio $806.5 MSCI Worldsm Index 0.60% ± 15 bps ± 6.00% ($41.9) Research Fund (3) Janus Research Fund $3,236.6 Russell 1000® Growth Index 0.64% ± 15 bps ± 5.00% $381.3 Global Research Fund Janus Global Research Fund (4,5) $234.8 MSCI World Growth Index 0.64% ± 15 bps ± 6.00% $78.0 Global Real Estate (5) Janus Global Real Estate Fund $24.8 FTSE EPRA / NAREIT Developed Index 0.75% ± 15 bps ± 4.00% $3.1 International Equity Fund (6) Janus International Equity Fund $219.9 MSCI EAFE® Index 0.68% ± 15 bps ± 7.00% $38.4 International Forty Fund (7) Janus International Forty Fund $11.0 MSCI All Country World ex-U.S. IndexSM 0.73% ± 15 bps ± 6.00% $0.2 INTECH Risk-Managed Funds (4) INTECH Risk-Managed Core Fund $307.2 S&P 500® Index 0.50% ± 15 bps ± 4.00% ($91.1) Janus Aspen INTECH Risk-Managed Core Portfolio $8.8 S&P 500® Index 0.50% ± 15 bps ± 4.00% ($5.9) Perkins Mid Cap Value Funds (3,8) Perkins Mid Cap Value Fund $12,393.8 Russell Midcap Value® Index 0.64% ± 15 bps ± 4.00% $2,745.9 Janus Aspen Perkins Mid Cap Value Portfolio $118.3 Russell Midcap Value® Index 0.64% ± 15 bps ± 4.00% $30.4 Perkins Small Cap Value Funds (9) Perkins Small Cap Value Fund $2,425.4 Russell 2000 Value® Index 0.72% ± 15 bps ± 5.50% $463.1 Perkins Large Cap Value Funds (9) Perkins Large Cap Value Fund $74.0 Russell 1000 Value® Index 0.64% ± 15 bps ± 3.50% $4.8 Total $26,835.2 $3,159.2 |
|
|
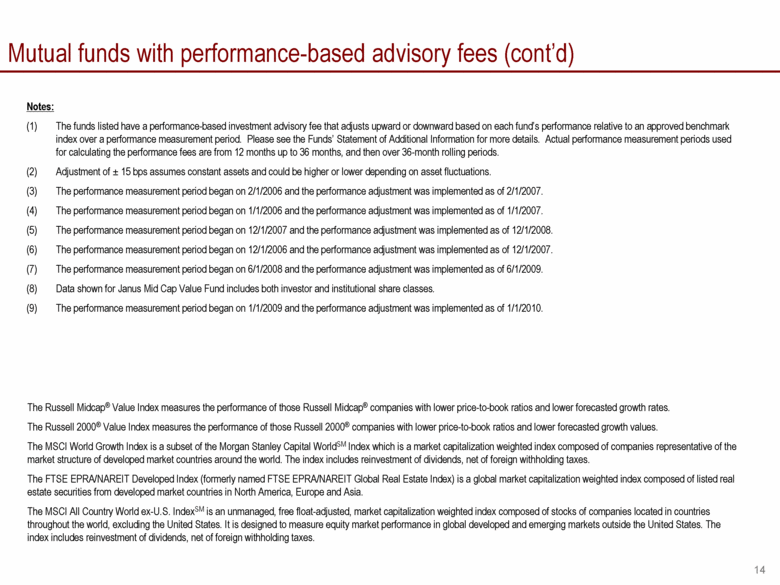
Mutual funds with performance-based advisory fees (cont’d) Notes: (1) The funds listed have a performance-based investment advisory fee that adjusts upward or downward based on each fund’s performance relative to an approved benchmark index over a performance measurement period. Please see the Funds’ Statement of Additional Information for more details. Actual performance measurement periods used for calculating the performance fees are from 12 months up to 36 months, and then over 36-month rolling periods. (2) Adjustment of ± 15 bps assumes constant assets and could be higher or lower depending on asset fluctuations. (3) The performance measurement period began on 2/1/2006 and the performance adjustment was implemented as of 2/1/2007. (4) The performance measurement period began on 1/1/2006 and the performance adjustment was implemented as of 1/1/2007. (5) The performance measurement period began on 12/1/2007 and the performance adjustment was implemented as of 12/1/2008. (6) The performance measurement period began on 12/1/2006 and the performance adjustment was implemented as of 12/1/2007. (7) The performance measurement period began on 6/1/2008 and the performance adjustment was implemented as of 6/1/2009. (8) Data shown for Janus Mid Cap Value Fund includes both investor and institutional share classes. (9) The performance measurement period began on 1/1/2009 and the performance adjustment was implemented as of 1/1/2010. The Russell Midcap® Value Index measures the performance of those Russell Midcap® companies with lower price-to-book ratios and lower forecasted growth rates. The Russell 2000® Value Index measures the performance of those Russell 2000® companies with lower price-to-book ratios and lower forecasted growth values. The MSCI World Growth Index is a subset of the Morgan Stanley Capital WorldSM Index which is a market capitalization weighted index composed of companies representative of the market structure of developed market countries around the world. The index includes reinvestment of dividends, net of foreign withholding taxes. The FTSE EPRA/NAREIT Developed Index (formerly named FTSE EPRA/NAREIT Global Real Estate Index) is a global market capitalization weighted index composed of listed real estate securities from developed market countries in North America, Europe and Asia. The MSCI All Country World ex-U.S. IndexSM is an unmanaged, free float-adjusted, market capitalization weighted index composed of stocks of companies located in countries throughout the world, excluding the United States. It is designed to measure equity market performance in global developed and emerging markets outside the United States. The index includes reinvestment of dividends, net of foreign withholding taxes. |
|
|
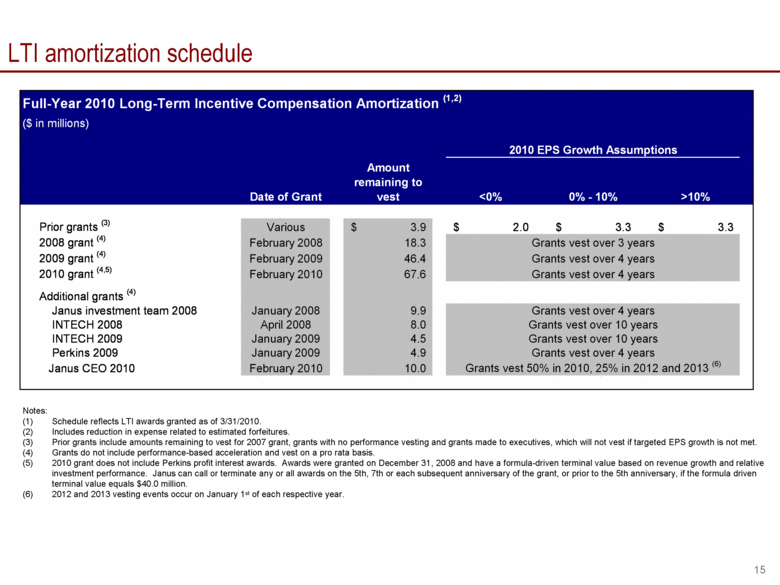
LTI amortization schedule Notes: (1) Schedule reflects LTI awards granted as of 3/31/2010. (2) Includes reduction in expense related to estimated forfeitures. (3) Prior grants include amounts remaining to vest for 2007 grant, grants with no performance vesting and grants made to executives, which will not vest if targeted EPS growth is not met. (4) Grants do not include performance-based acceleration and vest on a pro rata basis. (5) 2010 grant does not include Perkins profit interest awards. Awards were granted on December 31, 2008 and have a formula-driven terminal value based on revenue growth and relative investment performance. Janus can call or terminate any or all awards on the 5th, 7th or each subsequent anniversary of the grant, or prior to the 5th anniversary, if the formula driven terminal value equals $40.0 million. (6) 2012 and 2013 vesting events occur on January 1st of each respective year. Full-Year 2010 Long-Term Incentive Compensation Amortization (1,2) ($ in millions) Date of Grant Amount remaining to vest <0% 0% - 10% >10% Prior grants (3) Various 3.9 $ 2.0 $ 3.3 $ 3.3 $ 2008 grant (4) February 2008 18.3 2009 grant (4) February 2009 46.4 2010 grant (4,5) February 2010 67.6 Additional grants (4) Janus investment team 2008 January 2008 9.9 INTECH 2008 April 2008 8.0 INTECH 2009 January 2009 4.5 Perkins 2009 January 2009 4.9 Janus CEO 2010 February 2010 10.0 Grants vest 50% in 2010, 25% in 2012 and 2013 (6) Grants vest over 10 years Grants vest over 4 years 2010 EPS Growth Assumptions Grants vest over 10 years Grants vest over 4 years Grants vest over 3 years Grants vest over 4 years Grants vest over 4 years |
|
|
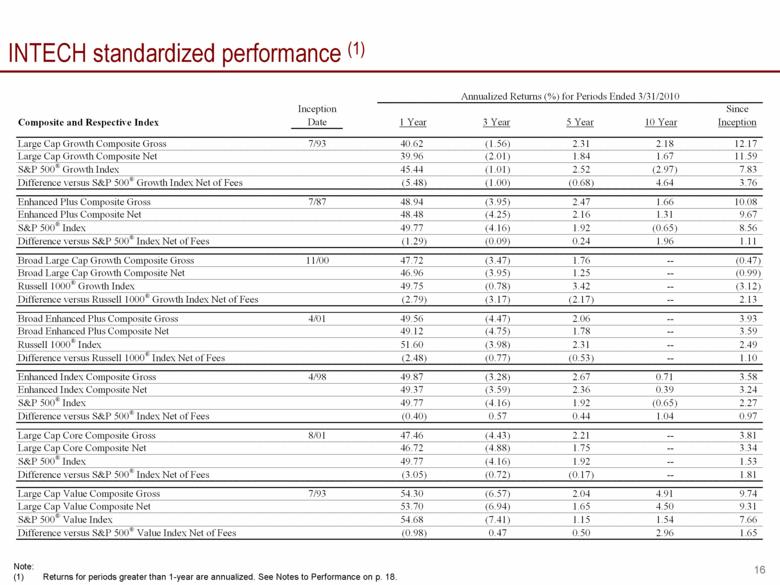
INTECH standardized performance (1) Note: Returns for periods greater than 1-year are annualized. See Notes to Performance on p. 18. Inception Since Composite and Respective Index Date 1 Year 3 Year 5 Year 10 Year Inception Large Cap Growth Composite Gross 7/93 40.62 (1.56) 2.31 2.18 12.17 Large Cap Growth Composite Net 39.96 (2.01) 1.84 1.67 11.59 S&P 500® Growth Index 45.44 (1.01) 2.52 (2.97) 7.83 Difference versus S&P 500® Growth Index Net of Fees (5.48) (1.00) (0.68) 4.64 3.76 Enhanced Plus Composite Gross 7/87 48.94 (3.95) 2.47 1.66 10.08 Enhanced Plus Composite Net 48.48 (4.25) 2.16 1.31 9.67 S&P 500® Index 49.77 (4.16) 1.92 (0.65) 8.56 Difference versus S&P 500® Index Net of Fees (1.29) (0.09) 0.24 1.96 1.11 Broad Large Cap Growth Composite Gross 11/00 47.72 (3.47) 1.76 -- (0.47) Broad Large Cap Growth Composite Net 46.96 (3.95) 1.25 -- (0.99) Russell 1000® Growth Index 49.75 (0.78) 3.42 -- (3.12) Difference versus Russell 1000® Growth Index Net of Fees (2.79) (3.17) (2.17) -- 2.13 Broad Enhanced Plus Composite Gross 4/01 49.56 (4.47) 2.06 -- 3.93 Broad Enhanced Plus Composite Net 49.12 (4.75) 1.78 -- 3.59 Russell 1000® Index 51.60 (3.98) 2.31 -- 2.49 Difference versus Russell 1000® Index Net of Fees (2.48) (0.77) (0.53) -- 1.10 Enhanced Index Composite Gross 4/98 49.87 (3.28) 2.67 0.71 3.58 Enhanced Index Composite Net 49.37 (3.59) 2.36 0.39 3.24 S&P 500® Index 49.77 (4.16) 1.92 (0.65) 2.27 Difference versus S&P 500® Index Net of Fees (0.40) 0.57 0.44 1.04 0.97 Large Cap Core Composite Gross 8/01 47.46 (4.43) 2.21 -- 3.81 Large Cap Core Composite Net 46.72 (4.88) 1.75 -- 3.34 S&P 500® Index 49.77 (4.16) 1.92 -- 1.53 Difference versus S&P 500® Index Net of Fees (3.05) (0.72) (0.17) -- 1.81 Large Cap Value Composite Gross 7/93 54.30 (6.57) 2.04 4.91 9.74 Large Cap Value Composite Net 53.70 (6.94) 1.65 4.50 9.31 S&P 500® Value Index 54.68 (7.41) 1.15 1.54 7.66 Difference versus S&P 500® Value Index Net of Fees (0.98) 0.47 0.50 2.96 1.65 Annualized Returns (%) for Periods Ended 3/31/2010 |
|
|
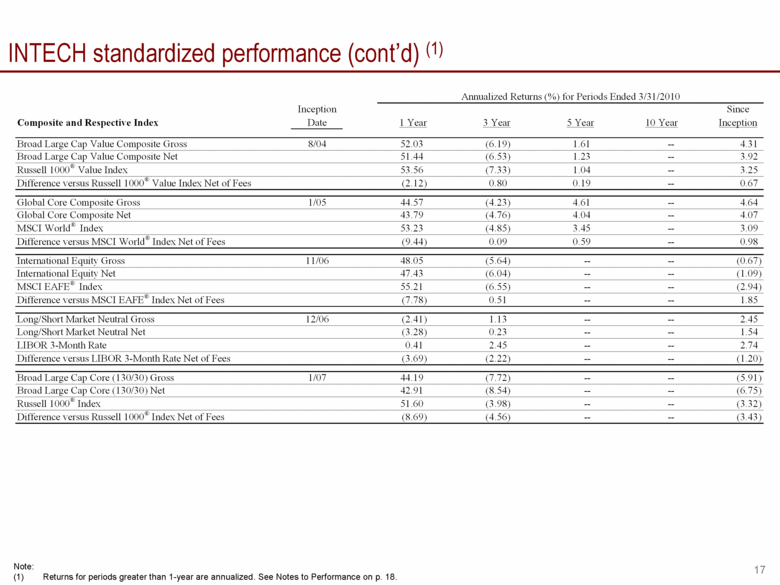
INTECH standardized performance (cont’d) (1) Note: Returns for periods greater than 1-year are annualized. See Notes to Performance on p. 18. Inception Since Composite and Respective Index Date 1 Year 3 Year 5 Year 10 Year Inception Broad Large Cap Value Composite Gross 8/04 52.03 (6.19) 1.61 -- 4.31 Broad Large Cap Value Composite Net 51.44 (6.53) 1.23 -- 3.92 Russell 1000® Value Index 53.56 (7.33) 1.04 -- 3.25 Difference versus Russell 1000® Value Index Net of Fees (2.12) 0.80 0.19 -- 0.67 Global Core Composite Gross 1/05 44.57 (4.23) 4.61 -- 4.64 Global Core Composite Net 43.79 (4.76) 4.04 -- 4.07 MSCI World® Index 53.23 (4.85) 3.45 -- 3.09 Difference versus MSCI World® Index Net of Fees (9.44) 0.09 0.59 -- 0.98 International Equity Gross 11/06 48.05 (5.64) -- -- (0.67) International Equity Net 47.43 (6.04) -- -- (1.09) MSCI EAFE® Index 55.21 (6.55) -- -- (2.94) Difference versus MSCI EAFE® Index Net of Fees (7.78) 0.51 -- -- 1.85 Long/Short Market Neutral Gross 12/06 (2.41) 1.13 -- -- 2.45 Long/Short Market Neutral Net (3.28) 0.23 -- -- 1.54 LIBOR 3-Month Rate 0.41 2.45 -- -- 2.74 Difference versus LIBOR 3-Month Rate Net of Fees (3.69) (2.22) -- -- (1.20) Broad Large Cap Core (130/30) Gross 1/07 44.19 (7.72) -- -- (5.91) Broad Large Cap Core (130/30) Net 42.91 (8.54) -- -- (6.75) Russell 1000® Index 51.60 (3.98) -- -- (3.32) Difference versus Russell 1000® Index Net of Fees (8.69) (4.56) -- -- (3.43) Annualized Returns (%) for Periods Ended 3/31/2010 |
|
|
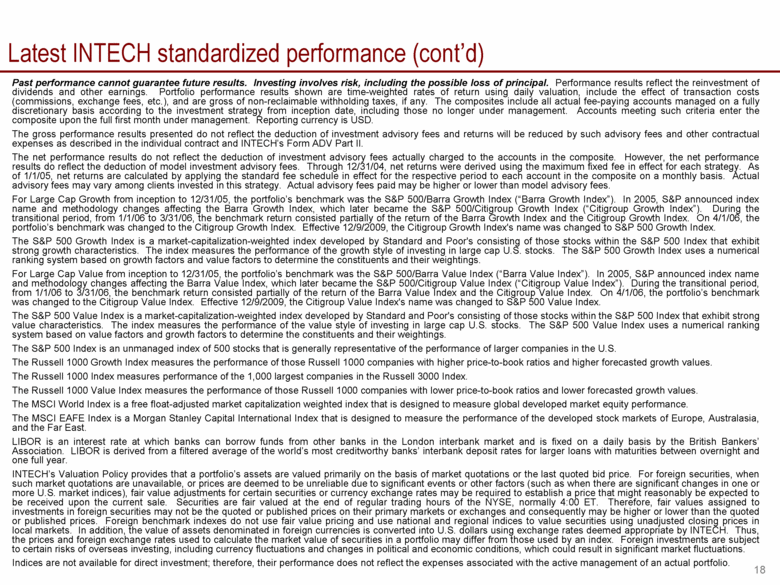
Latest INTECH standardized performance (cont’d) Past performance cannot guarantee future results. Investing involves risk, including the possible loss of principal. Performance results reflect the reinvestment of dividends and other earnings. Portfolio performance results shown are time-weighted rates of return using daily valuation, include the effect of transaction costs (commissions, exchange fees, etc.), and are gross of non-reclaimable withholding taxes, if any. The composites include all actual fee-paying accounts managed on a fully discretionary basis according to the investment strategy from inception date, including those no longer under management. Accounts meeting such criteria enter the composite upon the full first month under management. Reporting currency is USD. The gross performance results presented do not reflect the deduction of investment advisory fees and returns will be reduced by such advisory fees and other contractual expenses as described in the individual contract and INTECH’s Form ADV Part II. The net performance results do not reflect the deduction of investment advisory fees actually charged to the accounts in the composite. However, the net performance results do reflect the deduction of model investment advisory fees. Through 12/31/04, net returns were derived using the maximum fixed fee in effect for each strategy. As of 1/1/05, net returns are calculated by applying the standard fee schedule in effect for the respective period to each account in the composite on a monthly basis. Actual advisory fees may vary among clients invested in this strategy. Actual advisory fees paid may be higher or lower than model advisory fees. For Large Cap Growth from inception to 12/31/05, the portfolio’s benchmark was the S&P 500/Barra Growth Index (“Barra Growth Index”). In 2005, S&P announced index name and methodology changes affecting the Barra Growth Index, which later became the S&P 500/Citigroup Growth Index (“Citigroup Growth Index”). During the transitional period, from 1/1/06 to 3/31/06, the benchmark return consisted partially of the return of the Barra Growth Index and the Citigroup Growth Index. On 4/1/06, the portfolio’s benchmark was changed to the Citigroup Growth Index. Effective 12/9/2009, the Citigroup Growth Index's name was changed to S&P 500 Growth Index. The S&P 500 Growth Index is a market-capitalization-weighted index developed by Standard and Poor's consisting of those stocks within the S&P 500 Index that exhibit strong growth characteristics. The index measures the performance of the growth style of investing in large cap U.S. stocks. The S&P 500 Growth Index uses a numerical ranking system based on growth factors and value factors to determine the constituents and their weightings. For Large Cap Value from inception to 12/31/05, the portfolio’s benchmark was the S&P 500/Barra Value Index (“Barra Value Index”). In 2005, S&P announced index name and methodology changes affecting the Barra Value Index, which later became the S&P 500/Citigroup Value Index (“Citigroup Value Index”). During the transitional period, from 1/1/06 to 3/31/06, the benchmark return consisted partially of the return of the Barra Value Index and the Citigroup Value Index. On 4/1/06, the portfolio’s benchmark was changed to the Citigroup Value Index. Effective 12/9/2009, the Citigroup Value Index's name was changed to S&P 500 Value Index. The S&P 500 Value Index is a market-capitalization-weighted index developed by Standard and Poor's consisting of those stocks within the S&P 500 Index that exhibit strong value characteristics. The index measures the performance of the value style of investing in large cap U.S. stocks. The S&P 500 Value Index uses a numerical ranking system based on value factors and growth factors to determine the constituents and their weightings. The S&P 500 Index is an unmanaged index of 500 stocks that is generally representative of the performance of larger companies in the U.S. The Russell 1000 Growth Index measures the performance of those Russell 1000 companies with higher price-to-book ratios and higher forecasted growth values. The Russell 1000 Index measures performance of the 1,000 largest companies in the Russell 3000 Index. The Russell 1000 Value Index measures the performance of those Russell 1000 companies with lower price-to-book ratios and lower forecasted growth values. The MSCI World Index is a free float-adjusted market capitalization weighted index that is designed to measure global developed market equity performance. The MSCI EAFE Index is a Morgan Stanley Capital International Index that is designed to measure the performance of the developed stock markets of Europe, Australasia, and the Far East. LIBOR is an interest rate at which banks can borrow funds from other banks in the London interbank market and is fixed on a daily basis by the British Bankers’ Association. LIBOR is derived from a filtered average of the world’s most creditworthy banks’ interbank deposit rates for larger loans with maturities between overnight and one full year. INTECH’s Valuation Policy provides that a portfolio’s assets are valued primarily on the basis of market quotations or the last quoted bid price. For foreign securities, when such market quotations are unavailable, or prices are deemed to be unreliable due to significant events or other factors (such as when there are significant changes in one or more U.S. market indices), fair value adjustments for certain securities or currency exchange rates may be required to establish a price that might reasonably be expected to be received upon the current sale. Securities are fair valued at the end of regular trading hours of the NYSE, normally 4:00 ET. Therefore, fair values assigned to investments in foreign securities may not be the quoted or published prices on their primary markets or exchanges and consequently may be higher or lower than the quoted or published prices. Foreign benchmark indexes do not use fair value pricing and use national and regional indices to value securities using unadjusted closing prices in local markets. In addition, the value of assets denominated in foreign currencies is converted into U.S. dollars using exchange rates deemed appropriate by INTECH. Thus, the prices and foreign exchange rates used to calculate the market value of securities in a portfolio may differ from those used by an index. Foreign investments are subject to certain risks of overseas investing, including currency fluctuations and changes in political and economic conditions, which could result in significant market fluctuations. Indices are not available for direct investment; therefore, their performance does not reflect the expenses associated with the active management of an actual portfolio. |
|
|
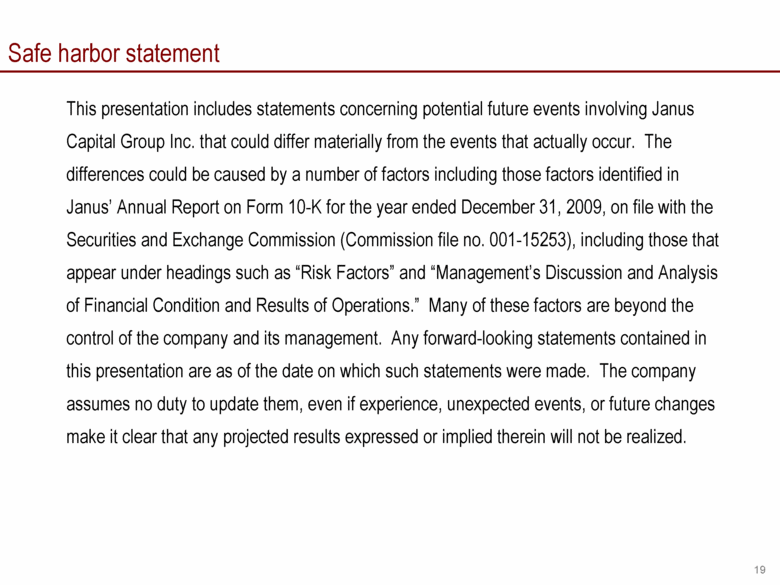
Safe harbor statement This presentation includes statements concerning potential future events involving Janus Capital Group Inc. that could differ materially from the events that actually occur. The differences could be caused by a number of factors including those factors identified in Janus’ Annual Report on Form 10-K for the year ended December 31, 2009, on file with the Securities and Exchange Commission (Commission file no. 001-15253), including those that appear under headings such as “Risk Factors” and “Management’s Discussion and Analysis of Financial Condition and Results of Operations.” Many of these factors are beyond the control of the company and its management. Any forward-looking statements contained in this presentation are as of the date on which such statements were made. The company assumes no duty to update them, even if experience, unexpected events, or future changes make it clear that any projected results expressed or implied therein will not be realized. |
|
|
Please consider the charges, risks, expenses and investment objectives carefully before investing. For a prospectus containing this and other information, please call Janus at 1-800-525-3713 or download the file from www.janus.com. Read it carefully before you invest or send money. Janus Capital Group consists of Janus Capital Management LLC, Enhanced Investment Technologies, LLC (INTECH) and Perkins Investment Management, LLC (Perkins). INTECH Investment Management LLC and Perkins Investment Management LLC are indirect subsidiaries of Janus Capital Group Inc. and serve as investment advisers on certain products. Indexes are not available for direct investment; therefore, their performance does not reflect the expenses associated with the active management of an actual portfolio. The Russell 1000® Growth Index measures the performance of those Russell 1000 companies with higher price-to-book ratios and higher forecasted growth values. The Russell 1000® Value Index measures the performance of those Russell 1000 companies with lower price-to-book ratios and lower forecasted growth values. The S&P 500® Index is a commonly recognized, market capitalization weighted index of 500 widely held equity securities, designed to measure broad U.S. equity performance. The MSCI Worldsm Index is a market capitalization weighted index composed of companies representative of the market structure of Developed Market countries in North America, Europe and the Asia/Pacific Region. The MSCI EAFE® Index is a market capitalization weighted index composed of companies representative of the market structure of Developed Market countries in Europe, Australasia and the Far East. Lipper, a wholly-owned subsidiary of Thomson Reuters, provides independent insight on global collective investments including mutual funds, retirement funds, hedge funds, fund fees and expenses to the asset management and media communities. Lipper ranks the performance of mutual funds within a classification of funds that have similar investment objectives. The Overall Morningstar RatingTM for a fund is derived from a weighted average of the performance figures associated with its three-, five- and ten-year (if applicable) Morningstar RatingTM metrics. © 2010 Morningstar, Inc. All Rights Reserved. Funds distributed by Janus Distributors LLC (4/10) Other important disclosures |

