Attached files
| file | filename |
|---|---|
| 8-K - FORM 8-K - CALPINE CORP | d8k.htm |
| EX-99.1 - PRESS RELEASE DATED APRIL 21, 2010 - CALPINE CORP | dex991.htm |
 CALPINE
CORPORATION Strategic Transactions Overview:
Acquisition
of
Conectiv
Fleet
&
Sale of Colorado Plants
April 21, 2010
Exhibit 99.2 |
 Agenda
•
Welcome and Safe Harbor
Andre Walker
VP, Finance & Investor Relations
•
Recent Strategic Transactions
Jack Fusco
President, Chief Executive Officer
•
Operations Overview
Thad Hill
EVP, Chief Commercial Officer
•
Financial Considerations
Zamir
Rauf
EVP, Chief Financial Officer
•
Concluding Remarks
Jack Fusco
President, Chief Executive Officer
•
Q & A
1 |
 Safe
Harbor Statement
Forward-Looking Statements
The information contained in this presentation includes certain estimates, projections
and other forward-looking information that reflect Calpine’s current
views with respect to future events and financial performance. These estimates,
projections and other forward-looking information are based on assumptions that
Calpine believes, as of the date hereof, are reasonable. Inevitably, there will
be differences between such estimates and actual results, and those differences may
be material.
There can be no assurance that any estimates, projections or forward-looking
information will be realized. All such estimates, projections and
forward-looking information speak only as of the date hereof. Calpine undertakes no
duty to update or revise the information contained herein.
You are cautioned not to place undue reliance on the estimates, projections and other
forward-looking information in this presentation as they are based on
current expectations and general assumptions and are subject to various risks,
uncertainties and other factors, including those set forth in Calpine’s Annual
Report on Form 10-K for the year ended December 31, 2009 and in other
documents that Calpine files with the SEC. Many of these risks,
uncertainties and other factors are beyond Calpine’s control and may cause
actual results to differ materially from the views, beliefs and estimates
expressed herein. Calpine’s reports and other information filed with the SEC,
including the risk factors identified in its Annual
Report
on
Form
10-K
for
the
year
ended
December
31,
2009,
can
be
found
on
the
SEC’s
website
at
www.sec.gov
and
on Calpine’s website at www.calpine.com.
Reconciliation to GAAP Financial Information
The
following
presentation
includes
certain
“non-GAAP
financial
measures”
as
defined
in
Regulation
G
under
the
Securities
Exchange Act of 1934. Schedules are included herein that reconcile the
non-GAAP financial measures included in the following
presentation
to
the
most
directly
comparable
financial
measures
calculated
and
presented
in
accordance
with
GAAP.
2 |
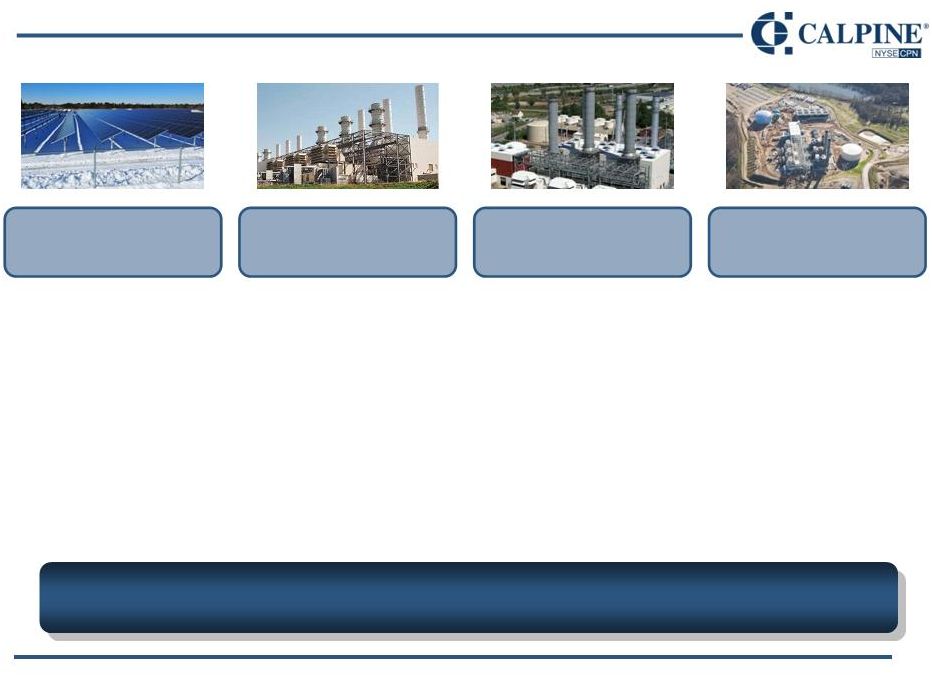
 LEGEND
CCGT
CT
Conventional
Solar
Internal combustion
•
2 plants
•
931 MW
•
$739 million
•
$794 / KW
•
19
plants
•
4,490 MW
•
$1.65
billion
•
$381 / KW
Achieving Strategic Goals
CPN as Seller:
CPN as Buyer:
Transactions Exceed
Current Calpine
Valuation Metrics
Long-Term Value
Enhancement
Divestiture of
Non-Strategic Assets
+
Scale Expansion in
Strategic Markets
+
Committed Financing
with No New Equity
Includes projects under construction.
Includes 3,860 MW of capacity expected to be in operation as of the close of the
transaction, 65 MW of upgrades to be completed after the close of the transaction, and 565 MW of capacity under construction.
Adjustments to include (but may not be limited to) purchases of liquid fuel
inventory, changes in other working capital items versus pro forma assumptions, and other customary adjustments (e.g,
adjustments for actual versus planned capital expenditures).
3
1
2
3
1
3
2 |
 •
Description
Acquisition
of
Conectiv
Energy
from
Pepco
Holdings
Inc.
(PHI)
•
Price
$1.65
billion
+
Adjustments
•
Operations
Short-Term: Convert coal-fired generation primarily to gas
Long-Term: Modernize sites
•
Key Considerations
CPN
to
acquire
all
of
Conectiv
Energy
except:
-
Load-serving auction positions
-
Legacy trading book
$1.3 billion committed term loan
•
Regulatory Approvals
FERC
HSR
•
Est. Transaction Close
July 1, 2010
Calpine as Buyer: Key Transaction Terms
Asset Profile²:
2,260 MW
Late-model CCGT
771 MW
Peaking (CT)
868 MW
Conventional Gas
22 MW
Internal Combustion
4 MW
Solar
565 MW
New CCGT
(Under Construction)
4,490 MW
PJM-E Capacity
1
1
Acquisition
is
Accretive
to
CPN’s
Adjusted
EBITDA
and
Adjusted
Free
Cash
Flow
4
Adjustments to include (but may not be limited to) purchases of liquid fuel inventory,
changes in other working capital items versus pro forma assumptions, and other customary adjustments (e.g,
adjustments for actual versus planned capital expenditures).
2
The capacities shown above include 3,860 MW of capacity expected to be in operation
as of the close of the transaction and 65 MW of upgrades to be completed after the close of the transaction. |
 Benefits of
Transaction •
Presence in IPP-friendly
PJM market
•
Assets located in
transmission-
constrained PJM-E
region
•
Increasingly diversified
national footprint
through scale
acquisition in third
region
•
PJM capacity revenues
firm through May 2013
(through 2014 at close)
•
Addition of long-term
capacity contracts
improves risk profile of
CPN overall portfolio
•
Transaction economics
feature low gas price
sensitivity
•
Delta
—
Phase I: 565 MW CCGT
currently under
construction; long-term
tolling agreement with
Constellation
—
Phase II: 565 MW CCGT
permitted at same site
•
Short term: Optimize /
upgrade assets at
existing sites
•
Long term: Modernize
conventional-fired sites;
Expand solar
•
Purchase price of
$381/KW
•
Accretive Transaction
—
Adjusted EBITDA:
Implied 2011 EV/Adj.
EBITDA multiple of 6.9x
vs. CPN of ~
8.8x
—
Adjusted Free Cash
Flow per Share: 35%
accretive in 2011
—
Adjusted Free Cash
Flow accretive for the
long term
1
Based on midpoint of 2011 guidance. See slide 17 for additional detail.
Acquisition of clean fleet
at attractive valuation
Sizeable entry into
strategically-targeted
Mid-Atlantic region
Stable cash flows from
contracted capacity
revenues
Portfolio of growth
opportunities
Unique opportunity to build scale in third region through acquisition of
quality assets with potential for additional growth
1
5 |
  •
Description
Sale of Colorado plants to Xcel Energy
•
Price
$739 million
•
Regulatory Approvals
FERC
HSR
Colorado PUC
•
Est. Transaction Close
December 1, 2010
•
Use of Proceeds
$412
million
debt
repayment
-
Fully retire 2011 maturities
-
Release ~$90 million restricted cash
$327 million pre-tax proceeds
Calpine as Seller: Key Transaction Terms
Asset Profile:
621 MW
Late-model CCGT
PPA
to
expire
2014
310 MW
Peaking (CT)
PPA to expire 2013
931 MW
WECC Capacity
Rocky Mountain Energy Center
Attractively-priced sale of non-core assets
provides opportunity to redeploy capital into strategic markets
2
1
1
PPA includes immaterial generation requirement through 2017.
2
Includes debt associated with Riverside Energy Center, which is not being
sold. Debt and restricted cash balances are projected as of 12/1/10, and reflect impacts of estimated payments
made prior to such date.
6 |
  Transaction
Comparative 7
What We’re Selling:
Colorado
What We’re Buying:
Conectiv
CPN
(As Is)
Full Value
Post
Contracts
Full Value
Less Delta
(at cost)
Enterprise Value
1
($ millions)
$739
$739
$1,650
$1,230
$14,375
Adj. EBITDA
2
($ millions)
$80
$40
$240
$190
$1,525 -
$1,725
Capacity (MW)
931
931
4,490
3,925
24,738
Adj. EBITDA Multiple
9.2x
18.5x
6.9x
6.5x
8.3x –
9.4x
Value
3
/ KW
$794
$381
$313 $581
Asset sale
completed at valuation
ABOVE
corporate metrics
Asset purchase
completed at valuation
BELOW
corporate metrics
Successful execution of value-enhancing transactions
Conectiv Less Delta based on $1,650 million purchase, less $420 million estimated
construction cost of Delta incurred as of close date. CPN based on $11.89 share price as of 4/16/10 x 486 million shares +
$8.6 billion of projected net debt at YE2011.
CPN estimates for Colorado and Conectiv full value based upon CPN projection of
Commodity Margin, less expenses, as adjusted. Colorado Post Contracts reflects CPN estimates of recontracted value
after current PPAs expire. Conectiv Less Delta reflects
estimated removal of fully-contracted Delta plant. CPN represents 2011 guidance. See reconciliation of CPN Adj. EBITDA on slide 27.
Value / KW calculation for Conectiv based upon unadjusted Enterprise Value of $1,650
million, plus $62 million of remaining costs construction costs for Delta and scheduled upgrades.
1
2
3 |
 OPERATIONS OVERVIEW
8 |
   PJM:
Strategic Market for Future Calpine Growth “At Risk ”
Coal Plants in PJM, NY & NE:
~12,000 MW Total (~10,000 MW in PJM)
•
Robust capacity market
•
Conectiv
plants located behind transmission constraints
•
High dispatch flexibility
-
Current CCGTs
all with bypass stacks / quick-start capabilities (in a world of
increasing intermittent resources)
CPN remains well-positioned for
tougher environmental standards
1
Source:
Conectiv
Energy,
Energy
Velocity
2008.
Conectiv
emissions
shown for natural gas-fired generation only. Dynegy adjusted for estimated impacts
of 2009 plant sale to LS Power. 2
Graph
depicts
uncontrolled
units
with
<250
MW
of
capacity
and
>
30
years
old.
Source:
Energy
Velocity.
Other PJM / Conectiv
Benefits:
Combining two of the
cleanest merchant fleets…
…and positioning Calpine where
“clean”
capacity will be needed
2
1
0
500
1,000
1,500
2,000
2,500
CPN
Conectiv
DYN
MIR
NRG
RRI
9 |
 Fulfilling
Strategic Objective of Mid-Atlantic Presence NY
PA
VA
NJ
WV
DE
Combined Cycle (CC)
CC -
Under Construction
CT / Other
Steam Turbines
Solar
Plants by fuel type
Calpine North Region (pro forma)
CPN
North Region
(Today)
Conectiv
1
CPN
North Region
(Pro Forma)
CCGT
2,363 MW
2,825 MW
5,188 MW
CT / Other
1,054 MW
1,661 MW
2,715 MW
Renewable
—
4 MW
4 MW
TOTAL
3,417 MW
4,490 MW
7,907 MW
CPN TOTAL
28,297 MW
1
Includes
3,860
MW
of
capacity
expected
to
be
in
operation
as
of
the
close
of
the
transaction,
65
MW
of
upgrades
to
the
completed
after
the
close
of
the
transaction,
and
565
MW
of
capacity
under
construction.
CPN Plant
Conectiv
Plant
Conectiv
Fleet
Delta
Bethlehem
Hay Road
MD
10 |
 Energy
Margin
11%
Reliability &
Other Margin
89%
Understanding
the
Conectiv
Fleet
11
Lower CCGT Capacity Factors,
Given PJM Reliance on Coal…
…but changing coal viability &
capacity markets compensate
0%
2%
4%
6%
2007
2008
2009
Strong Assets / Good Operators
CCGT Equivalent Forced Outage Rate (%)
Source: Conectiv Energy. Comparable to Forced Outage Factor (FOF), as
traditionally reported by CPN. Note that FOF is typically higher than EFOR
due to the nature of the calculation. 0%
5%
10%
15%
20%
25%
2007
2008
2009
Source:
Conectiv
Energy.
Highly Flexible Units in World
of Increasing Intermittent Supply
Quick-start
Capabilities
MW Capacity
1
Time to Start
CCGT w/
Bypass Stack
2
2,260 MW
0.5 hrs (CT) /
2 hours (CCGT)
Combustion
Turbine
771 MW
<0.5 hours
Standard CCGT start time
is 4 hours
1
Capacities include ongoing upgrade projects.
2
Hay Road and Bethlehem.
Historical Coal Units
Can Run on Natural Gas
Edge Moor & Deep Water 2010E Commodity Margin:
Value Primarily from Regulatory Capacity
Source: Calpine estimates. |
 Key
Integration Considerations •
Commercial Operations
-
PHI to retain trading book and load serving auction positions
-
Calpine takes business without legacy positions or collateral
-
Fleet dispatch and hedging decisions managed from Houston
•
Fuel Conversion: CALPINE DOES NOT INTEND TO BURN
COAL -
From Day 1, have positive environmental impact on local community
and send clear signal on future of power generation
-
Fuel oil as back-up for much of the capacity
•
Operations Management
-
New regional office with local operations, regulatory, origination and
legal functions
-
All other support (Accounting / back office, Maintenance) provided
from Houston
•
Calpine management and integration teams on-site
•
Calpine
to
be
informed
of
key
business
issues
during
transition
•
Coordination of transition plans between PHI and Calpine
How We Intend
to Operate
Between Now
and Close
12 |
  Individual
Hedging
Profiles:
Energy
Margin
1
Pro
Forma
Calpine
Energy
Hedge
Profile
2
(Reflects Sale of Colorado)
2010
2011
2012
Hedged
Margin
($/MWh)
2
$23
$27
$30
Hedged
Gas
Price
($/mmbtu)
4
$6.35
$7.05
n/a
Capacity (MW)
5
24,738
23,852
23,897
1
Energy Margin + Regulatory & Other Margin = Total Commodity Margin.
2
Estimated as of 4/9/10. Calpine figures reflect sale of Colorado plants as of
12/1/10. Hedged margin excludes
unconsolidated
projects.
Changing
market
heat
rates
will
change
delta
volumes
and
gas
price
exposures.
Sensitivities
are
assumed
to
occur
across
the
portfolio.
3
Volumes are on a delta hedge basis. Delta volumes are the expected volume based on the
probability of economic dispatch at a future date based on current market prices for that future date. This is typically lower
than the notional volume, which is plant capacity, less known performance and operating
constraints. 4
Pertains to Hedged Gas Length (shown above) only.
5
Represents forecasted net ownership interest with peaking capacity. New capacity
shown during first full year of operation. 6
CPN
capacity
factor
shown
for
gas
fleet
only,
excluding
peakers.
Conectiv
capacity
factor
shown
for
CCGT
units
only.
7
Premium
applies
to
all
MWh
generated
by
entire
gas
fleet.
Percentages
calculated
assuming
7.0
mmbtu/MWh
heat
rate.
Reliability Margin
1,2
as % of Total Commodity Margin (by year):
13%
15%
15%
Est.
Conectiv
Energy
Hedge
Profile
2
Reliability Margin
1,2
as % of Total Commodity Margin (by year):
69%
64%
62%
2010
2011
2012
Capacity (MW)
5
3,845
3,925
4,490
2009 Capacity Factor
6
Premium to Peak Spark
7
CPN
43%
8%
Conectiv
13%
35%
Pro Forma
10 -
15%
90%
58%
39%
8%
10%
2%
32%
61%
2010
2011
2012
Hedged Volume
³
Additional Hedged Gas Length,
³
Open HR
Open Volume
³
11%
19%
100%
89%
81%
2010
2011
2012
Hedged Volume
³
Open Volume
³
13 |
 Growth
Opportunities DELTA –
PHASE 1
Under Construction
•
565 MW Combined-Cycle Plant
•
Targeted COD: 2Q 2011
•
6-year PPA with Constellation
covering Energy, Capacity and
Ancillary Services
•
Growth CapEx
requirements
-
2010: $45 million
-
2011: $15 million
OTHER OPPORTUNITIES
•
Up to 1,000MW of additional gas generation new build opportunities, across 4
sites •
PJM
queue
position
in
place
across
gas
projects,
existing
permit
in
place
for
Delta
2
•
Land and infrastructure for up to 50 MW of Solar
A
Delta Phase 2
-
565 MW CCGT
-
Permits & infrastructure
B
Talbert & Powell
-
400 MW CT
-
PJM Queue, land optioned
C
Cumberland 3
-
100 MW CT
-
PJM Queue, infrastructure in
place
D
Potential for Solar Expansion
-
Additional PV solar opportunities
at various locations
A
B
C
D
14
Source: Conectiv
Energy |
 FINANCIAL CONSIDERATIONS
15 |
 Key
Financial Messages Pro forma 2010 and 2011
Adjusted EBITDA and
Adjusted Free Cash Flow
guidance demonstrate
accretion
Conectiv
acquisition
funded through subsidiary-
level term loan and
corporate cash
Net liquidity impact of
both transactions limited
to <$200 million
Delivering value
through accretive
transactions
Efficiently
deploying
capital without
diluting equity base
Achieving strategic
growth while
maintaining strong
liquidity
16 |
   Updated
Guidance (pro forma) ($ millions)
Adj. EBITDA, As Is
$1,500 -
$1,600
$1,525 -
$1,725
Colorado sale
$(5)
$(80)
Conectiv acquisition
$130
$240
Adj. EBITDA, Pro Forma
$1,625 -
$1,725
$1,685 –
$1,885
Adj. Free Cash Flow, As Is
$400 -
$500
$300 -
$500
Colorado sale
—
$(55)
Adj. Free Cash Flow, Pro Forma
$400 -
$500
$245 -
$445
Conectiv acquisition
$65
$120
Adj. Free Cash Flow, Pro Forma
$465 –
$565
$365 -
$565
Note: Figures assume closing dates of 12/1/10 and 7/1/10 for Colorado and Conectiv,
respectively. 1
Calculation based upon midpoint of 2011 guidance range.
“Peak”
Major
Maintenance year +
“Peak”
South Point
lease payment
35% accretive
2010
2011
1
Even after “normalizing”
to run rate
major maintenance and lease payments,
transaction is
24% accretive
1
17 |
 Project Debt
$1,035
Calpine Corp
$5,961
Pro Forma Capital Structure: Base Case Financing
•
Description:
Term loan plus Revolver
•
Term Loan:
$1,300 million
•
Revolver:
$100 million
•
Tenor:
7 years
Financing Terms
CCFC
$959
Other
1
$977
New Borrower
$1,300
($ millions)
Note: All balances shown as of 12/31/09, excluding New Borrower. Project
Debt shown pro forma, assuming repayment of Blue Spruce, Riverside and Rocky Mountain. Chart does not include debt from
unconsolidated projects.
1
Other includes preferred interests, notes payable, capital leases and other debt.
Advantages of Subsidiary Level Financing:
•
Lower cost of debt
•
Pre-payable
•
Rapidly amortizing term loan without any
restrictions added at corporate level
•
No corporate term loan amendment required
18 |
  Conectiv
Acquisition: Sources and Uses of Cash Sources
Amount
Uses
Amount
Secured Term Loan
$1,300
Payment to Pepco Holdings
$1,650
Corporate Cash
535
Fees and Transaction Costs¹
(est.)
75
Remaining Delta Construction Costs (est.)
60
Liquid Fuel Inventory²
(est.)
50
Total Sources
$1,835
Total Uses³
$1,835
($ millions)
1
Includes financing and general transaction costs.
2
Will be adjusted to market value of viable inventory at close.
3
Does
not
include
any
additional
adjustments
for
working
capital
or
other
items.
•
Base Case debt funding assumes term loan, but is subject to change
-
Commitments
received
from
Credit
Suisse,
Citi
and
Deutsche
Bank
•
Initial focus is to fund the balance of the acquisition price with cash
We do not intend to use stock as a source of capital
19 |
 $100
$1,000
$2,264
$89
$4,100
2010
2011
2012
2013
2014
2015
2016
2017
CCR
Project Debt
Exit Facility
CCFC
Senior Secured Notes
Term Loan
Liquidity and Debt Maturity Impacts (pro forma)
12/31/09
Colorado Sale
12/31/09
(pro forma)
Conectiv
Acquisition
12/31/09
(pro forma)
Liquidity
2,379
315
2,694
(485)
2,209
Net Debt
(Consolidated)
7,908
(710)
7,198
1,835
9,033
Net Debt
(Incl.
Unconsolidated Plants)
8,503
7,793
9,628
Net Debt /
Adj. EBITDA
4.6x
4.4x
4.8x
Note: The debt maturity schedules shown here are not prepared on a GAAP basis and
do not conform to the debt maturity schedule presented in Calpine’s Form 10-K. (Refer to the Form 10-K for further
information regarding GAAP-basis debt maturities.) Assumptions used in debt
maturity charts shown here include: (i) excludes letter of credit facilities; (ii) maturity balances assume cash sweeps; and
(iii) all other debt maturities are paid from operating cash flows at the project
level. The debt maturity charts exclude anticipated maturities less than $50 million.
1
Estimates.
Amounts
subject
to
change
in
connection
with
actual
close
of
transaction.
2
Liquidity impacts include changes in LC and Revolver availability.
3
Colorado reduction of Net Debt reflects payment $29 million estimated cash taxes, which
are netted against pre-tax proceeds of $739 million. 4
Calculation
not
performed
in
accordance
with
debt
covenant
definitions.
Based
on
LTM
Adjusted
EBITDA.
Adjusted
EBITDA
from
Otay
Mesa
Energy
Center,
which
opened
during
the
fourth
quarter
of
2009,
has
been
annualized
for
the
purposes
of
this
calculation.
Pro
Forma
calculation
with
Conectiv
acquisition
assumes
$240
million
of
Adjusted
EBITDA
for
Conectiv.
($ millions)
Improved Debt
Maturity Profile
COLORADO SALE:
Blue Spruce, Rocky Mountain,
& Riverside Retired
CONECTIV ACQUISITION:
New term loan
~ $90 million
Restricted Cash
Released
2
3
4
1
1
20 |
 CONCLUSION
21 |
 Enhanced
Company Summary Statistics
•
Operating capacity¹:
28,297 MW
•
Plants
:
93
•
States:
20
1
Includes plants/capacity currently under construction, including ongoing upgrade
projects. Southeast
6,083 MW
22%
Texas
7,392 MW
26%
West
6,915 MW
24%
North
7,907 MW
28%
Source: 2009 SEC filings, Company presentations. Items marked by * indicate
pro forma capacity assuming completion of announced transactions.
1
Geographic Diversity
in Strategic Markets
Scale
0
25,000
50,000
75,000
100,000
Calpine*
NRG
GenOn Energy*
Dynegy
Largest Pure-Play Independent Power Provider
22
(pro forma) |
 APPENDIX
23 |
 Conectiv
Transaction
Scope
What is Calpine Acquiring?
What is Pepco Holdings Inc. Retaining?
•
Conectiv
Energy power plants: 18 operating + 1 under
construction
•
Usable liquid fuel inventory (valued at market, not included
in purchase price)
•
All spare parts (included in purchase price)
•
All emissions allowances (included in purchase price)
•
Legacy hedge book and load-serving auction positions
•
Collateral requirements
•
RPM capacity awards
•
Tolling agreement for Delta CCGT construction project
•
Other contracts needed for plant operations (e.g., local
fuel supply)
•
Tolled capacity
•
Future pension costs for union employees as incurred, but
no obligation to cover any pre-close under-funding
•
Historical pension accruals
•
Retiree medical
•
On-site environmental liabilities, but indemnified above
$10 million for New Jersey ISRA
•
Off-site environmental liabilities, including coal/ash
disposal
•
>$10 million New Jersey ISRA obligations
•
Plant employees
•
Selected employees for regional office needs
•
All non-union employees not selected by Calpine
24 |
  Conectiv
Plant Overview
Source: Conectiv
Energy, Calpine. Note: Capacities above include 3,860 MW of capacity expected to
be in operation as of the close of the transaction, 65 MW of upgrades to be completed after the close
of the transaction, and 565 MW of capacity under construction.
25
Technology
Load
Type
Location
PJM Capacity
Pricing Zone
COD
With
Peaking
Capacity
CPN
Interest
With Peaking
Capacity, Net
2009
Generation
(000 MWh)
Bethlehem
Natural Gas/Oil
Intermediate
PA
MACC
2003
1,130
100%
1,130
1,320
Hay Road
Natural Gas/Oil
Intermediate
DE
E-MACC
1993 / 2002
1,130
100%
1,130
1,301
Edge Moor
Natural Gas/Oil
Peaking
DE
E-MACC
1954 - 1973
723
100%
723
591
Cumberland
Natural Gas/Oil
Peaking
NJ
E-MACC
1990 / 2009
194
100%
194
27
Deep Water
Natural Gas/Oil
Peaking
NJ
E-MACC
1954 / 1958
158
100%
158
74
Sherman Avenue
Natural Gas/Oil
Peaking
NJ
E-MACC
1991
92
100%
92
7
Middle
Oil
Peaking
NJ
E-MACC
1970 / 1971
77
100%
77
0
Carlls Corner
Natural Gas/Oil
Peaking
NJ
E-MACC
1973
73
100%
73
1
Cedar
Oil
Peaking
NJ
E-MACC
1972
68
100%
68
3
Missouri Avenue
Oil
Peaking
NJ
E-MACC
1969
60
100%
60
0
Mickleton
Natural Gas/Oil
Peaking
NJ
E-MACC
1974
67
100%
67
0
Christiana
Oil
Peaking
DE
E-MACC
1973
53
100%
53
1
Tasley
Oil
Peaking
VA
DPL-S
1972
31
100%
31
0
Delaware City
Oil
Peaking
DE
E-MACC
1968
23
100%
23
0
West
Oil
Peaking
DE
E-MACC
1964
20
100%
20
0
Bayview
Oil
Peaking
VA
DPL-S
1963
12
100%
12
1
Crisfield
Oil
Peaking
MD
DPL-S
1968
10
100%
10
0
Vineland
Solar
Peaking
NJ
E-MACC
2009
4
100%
4
1
TOTAL - CONECTIV
3,925
3,925
3,327
Delta - Under Construction
Natural Gas/Oil
Intermediate
E-MACC
565
100%
565
|
 87%
56%
38%
8%
9%
5%
35%
62%
2010
2011
2012
Pro
Forma
Hedging
Profile:
Energy
Margin
1
Energy
Hedge
Profile
2
(based on March curves and assuming 7/1/10 close)
2010
2011
2012
Hedged
Margin
($/MWh)
2
$23
$27
$31
Hedged Gas Price ($/mmbtu)
4
$6.35
$7.05
n/a
Capacity (MW)
5
28,583
27,777
28,387
1
Energy Margin + Regulatory & Other Margin = Total Commodity Margin.
2
Estimated as of 4/9/10. Hedged margin excludes unconsolidated projects. Changing
market heat rates will change delta volumes and gas price exposures.
Sensitivities are assumed to occur across the portfolio. 3
Volumes are on a delta hedge basis. Delta volumes are the expected volume based on the
probability of economic dispatch at a future date based on current market prices
for that future date. This is typically lower than the notional volume, which is plant capacity, less
known performance and operating constraints.
4
Pertains to Hedged Gas Length (shown above) only.
5
Represents Calpine’s forecasted net ownership interest with peaking capacity.
New capacity shown during first full year of operation. $48M
Premiums
collected
Reliability Margin
1,2
as % of Total Commodity Margin (by year):
17%
22%
21%
26
27
94
208
(33)
(99)
(194)
($250)
($200)
($100)
($50)
$0
$50
$100
$150
$200
$250
2010
2011
2012
Natural Gas +$1/mmbtu
Natural Gas -
$1/mmbtu
17
52
73
(16)
(49)
(70)
($200)
($150)
($100)
($50)
$0
$50
$100
$150
$200
2010
2011
2012
Heat Rate +170 btu/KWh
Heat Rate -
170 btu/KWh
Natural
Gas
Price
Sensitivity
($mm)
2
Market
Heat
Rate
Sensitivity
($mm)
1
($150)
Hedged
Volume
3
Additional
Hedged
Gas
Length,
3
Open
Volume
3
Open HR |
 Reg G
Reconciliations: 2010 and 2011 Guidance Adjusted EBITDA represents net income
(loss) before interest, taxes, depreciation and amortization, adjusted for
certain non-cash or non-recurring items as detailed in the following
reconciliation. Adjusted EBITDA is presented because our
management uses Adjusted EBITDA (i) as a measure of
operating performance to assist in comparing performance
from period to period on a consistent basis and to readily
view operating trends; (ii) as a measure for planning and
forecasting overall expectations and for evaluating actual
results against such expectations; and (iii) in communications
with our Board of Directors, shareholders, creditors, analysts
and investors concerning our financial performance. We
believe Adjusted EBITDA is also used by and is useful to
investors and other users of our financial statements in
evaluating our operating performance because it provides
them with an additional tool to compare business
performance across companies and across periods. Adjusted
EBITDA is not a measure calculated in accordance with GAAP,
and should be viewed as a supplement to and not a substitute
for our results of operations presented in accordance with
GAAP. Adjusted EBITDA is not intended to represent cash
flows from operations or net income (loss) as defined by
GAAP as an indicator of operating performance. Furthermore,
Adjusted EBITDA is not necessarily comparable to similarly-
titled measures reported by other companies.
Adjusted Free Cash Flow represents net income before
interest, taxes, depreciation and amortization, as adjusted,
less operating lease payments, major maintenance expense
and maintenance capital expenditures, net cash interest, cash
taxes, working capital and other adjustments. Adjusted Free
Cash Flow is presented because our management uses this
measure, among others, to make decisions about capital
allocation. Adjusted Free Cash Flow is not intended to
represent cash flows from operations as defined by GAAP as
an indicator of operating performance and is not necessarily
comparable to similarly-titled measures reported by other
companies.
__________
Full Year 2010 Range:
Low
High
(in millions)
GAAP Net Income (Loss)
$
(30)
$
70
Plus:
Interest expense, net of interest income
710
710
465
465
Major maintenance expense
180
180
Operating lease expense
50
50
Other
(1)
125
125
Adjusted EBITDA
$
1,500
$
1,600
Less:
Operating lease payments
50
50
290
290
(3)
750
750
Cash taxes
10
10
Adjusted Free Cash Flow
$
400
$
500
Full Year 2011 Range:
Low
High
(in millions)
GAAP Net Income
$
30
$
230
Plus:
Interest expense, net of interest income
695
695
460
460
Major maintenance expense
210
210
45
45
Other
(1)
85
85
Adjusted EBITDA
$
1,525
$
1,725
Less:
Operating lease payments
100
100
(2)
375
375
Cash interest, net
(3)
735
735
15
15
Adjusted Free Cash Flow
$
300
$
500
(2)
(1)
Other includes stock-based compensation expense, adjustments to
reflect Adjusted EBITDA from unconsolidated investments and
other items. (2)
Includes projected Major Maintenance Expense of $178 million and $205
million in 2010 and 2011, respectively and maintenance Capital
Expenditures of $112 million and $170 million in 2010 and 2011, respectively. Capital expenditures
exclude major construction and development projects.
(3)
Includes fees for letters of credit, net of interest income.
Cash
interest,
net
Cash taxes
Depreciation and amortization expense
Depreciation and amortization expense
Operating lease expense
Major
maintenance
expense
and
maintenance
capital
expenditures
Major
maintenance
expense
and
maintenance
capital
expenditures
27 |
 |