Attached files
UNITED STATES SECURITIES AND EXCHANGE COMMISSION
Washington, D.C. 20549
____________________
Form 10-K
[X] | ANNUAL REPORT PURSUANT TO SECTION 13 OR 15(d) OF THE SECURITIES EXCHANGE ACT OF 1934 | |
For the fiscal year ended December 31, 2016 | ||
[ ] | TRANSITION REPORT PURSUANT TO SECTION 13 OR 15(d) OF THE SECURITIES EXCHANGE ACT OF 1934 | |
For the transition period from to | ||
Commission File No. 001-12079
______________________

Calpine Corporation
(A Delaware Corporation)
I.R.S. Employer Identification No. 77-0212977
717 Texas Avenue, Suite 1000, Houston, Texas 77002
Telephone: (713) 830-2000
Not Applicable
(Former Address)
Securities registered pursuant to Section 12(b) of the Act:
Calpine Corporation Common Stock, $0.001 Par Value
Name of each exchange on which registered:
New York Stock Exchange
Securities registered pursuant to Section 12(g) of the Act:
None
Indicate by check mark if the registrant is a well-known seasoned issuer, as defined in Rule 405 of the Securities Act. Yes [X] No [ ]
Indicate by check mark if the registrant is not required to file reports pursuant to Section 13 or Section 15(d) of the Act. Yes [ ] No [X]
Indicate by check mark whether the registrant (1) has filed all reports required to be filed by Section 13 or 15(d) of the Securities Exchange Act of 1934 during the preceding 12 months (or for such shorter period that the registrant was required to file such reports), and (2) has been subject to such filing requirements for the past 90 days. Yes [X] No [ ]
Indicate by check mark whether the registrant has submitted electronically and posted on its corporate Website, if any, every Interactive Data File required to be submitted and posted pursuant to Rule 405 of Regulation S-T during the preceding 12 months (or for such shorter period that the registrant was required to submit and post such files). Yes [X] No [ ]
Indicate by check mark if disclosure of delinquent filers pursuant to Item 405 of Regulation S-K is not contained herein, and will not be contained, to the best of registrant’s knowledge, in definitive proxy or information statements incorporated by reference in Part III of this Form 10-K or any amendment to this Form 10-K. [X]
Indicate by check mark whether the registrant is a large accelerated filer, an accelerated filer, a non-accelerated filer, or a smaller reporting company. See definitions of “large accelerated filer, “accelerated filer,” and “smaller reporting company” in Rule 12b-2 of the Exchange Act. (Check one):
Large accelerated filer [X] | Accelerated filer [ ] | |
Non-accelerated filer [ ] | Smaller reporting company [ ] | |
(Do not check if a smaller reporting company) | ||
Indicate by check mark whether the registrant is a shell company (as defined in Rule 12b-2 of the Act). Yes [ ] No [X]
State the aggregate market value of the voting and non-voting common equity held by non-affiliates of the registrant as of June 30, 2016, the last business day of the registrant’s most recently completed second fiscal quarter: approximately $4,694 million.
Indicate the number of shares outstanding of each of the registrant’s classes of common stock, as of the latest practicable date: Calpine Corporation: 359,054,117 shares of common stock, par value $0.001, were outstanding as of February 8, 2017.
DOCUMENTS INCORPORATED BY REFERENCE
Portions of the documents listed below have been incorporated by reference into the indicated parts of this Report, as specified in the responses to the item numbers involved.
Designated portions of the Proxy Statement relating to the 2017 Annual Meeting of Shareholders are incorporated by reference into Part III to the extent described therein.
CALPINE CORPORATION AND SUBSIDIARIES
FORM 10-K
ANNUAL REPORT
For the Year Ended December 31, 2016
TABLE OF CONTENTS
Page | ||
Item 1. | ||
Item 1A. | ||
Item 1B. | ||
Item 2. | ||
Item 3. | ||
Item 4. | ||
Item 5. | ||
Item 6. | ||
Item 7. | ||
Item 7A. | ||
Item 8. | ||
Item 9. | ||
Item 9A. | ||
Item 9B. | ||
Item 10. | ||
Item 11. | ||
Item 12. | ||
Item 13. | ||
Item 14. | ||
Item 15. | ||
Item 16. | ||
i
DEFINITIONS
As used in this annual report for the year ended December 31, 2016, the following abbreviations and terms have the meanings as listed below. Additionally, the terms “Calpine,” “we,” “us” and “our” refer to Calpine Corporation and its consolidated subsidiaries, unless the context clearly indicates otherwise. The term “Calpine Corporation” refers only to Calpine Corporation and not to any of its subsidiaries. Unless and as otherwise stated, any references in this Report to any agreement means such agreement and all schedules, exhibits and attachments in each case as amended, restated, supplemented or otherwise modified to the date of filing this Report.
ABBREVIATION | DEFINITION | |
2017 First Lien Term Loan | The $550 million first lien senior secured term loan, dated December 1, 2016, among Calpine Corporation, as borrower, the lenders party thereto, Morgan Stanley Senior Funding, Inc., as administrative agent and MUFG Union Bank, N.A., as collateral agent | |
2019 First Lien Notes | The $400 million aggregate principal amount of 8.0% senior secured notes due 2019, issued May 25, 2010, and repaid in a series of transactions on November 7, 2012, December 2, 2013 and July 22, 2014 | |
2019 First Lien Term Loan | The $835 million first lien senior secured term loan, dated October 9, 2012, among Calpine Corporation, as borrower, the lenders party thereto, Morgan Stanley Senior Funding, Inc., as administrative agent and Goldman Sachs Credit Partners L.P., as collateral agent, repaid on May 31, 2016 | |
2020 First Lien Term Loan | The $390 million first lien senior secured term loan, dated October 23, 2013, among Calpine Corporation, as borrower, the lenders party thereto, Citibank, N.A., as administrative agent and Goldman Sachs Credit Partners L.P., as collateral agent, repaid on May 31, 2016 | |
2022 First Lien Notes | The $750 million aggregate principal amount of 6.0% senior secured notes due 2022, issued October 31, 2013 | |
2023 First Lien Notes | The $1.2 billion aggregate principal amount of 7.875% senior secured notes due 2023, issued January 14, 2011, and partially repaid in a series of transactions on November 7, 2012, December 2, 2013, December 4, 2014, February 3, 2015, December 7, 2015 and December 19, 2016 | |
2023 First Lien Term Loan | The $550 million first lien senior secured term loan, dated December 15, 2015, among Calpine Corporation, as borrower, the lenders party thereto, Morgan Stanley Senior Funding, Inc., as administrative agent and Goldman Sachs Credit Partners L.P., as collateral agent | |
2023 First Lien Term Loans | Collectively, the 2023 First Lien Term Loan and the New 2023 First Lien Term Loan | |
2023 Senior Unsecured Notes | The $1.25 billion aggregate principal amount of 5.375% senior unsecured notes due 2023, issued July 22, 2014 | |
2024 First Lien Notes | The $490 million aggregate principal amount of 5.875% senior secured notes due 2024, issued October 31, 2013 | |
2024 First Lien Term Loan | The $1.6 billion first lien senior secured term loan, dated May 28, 2015 (as amended December 21, 2016), among Calpine Corporation, as borrower, the lenders party thereto, Morgan Stanley Senior Funding, Inc., as administrative agent and Goldman Sachs Credit Partners L.P., as collateral agent | |
2024 Senior Unsecured Notes | The $650 million aggregate principal amount of 5.5% senior unsecured notes due 2024, issued February 3, 2015 | |
2025 Senior Unsecured Notes | The $1.55 billion aggregate principal amount of 5.75% senior unsecured notes due 2025, issued July 22, 2014 | |
2026 First Lien Notes | The $625 million aggregate principal amount of 5.25% senior secured notes due 2026, issued May 31, 2016 | |
ii
ABBREVIATION | DEFINITION | |
AB 32 | California Assembly Bill 32 | |
Accounts Receivable Sales Program | Receivables purchase agreement between Calpine Solutions, formerly Noble Solutions, and Calpine Receivables, formerly Noble Americas Treasury Solutions LLC, and the purchase and sale agreement between Calpine Receivables and an unaffiliated financial institution, both which allows for the revolving sale of up to $250 million in certain trade accounts receivables to third parties | |
Adjusted EBITDA | EBITDA as adjusted for the effects of (a) impairment charges, (b) major maintenance expense, (c) operating lease expense, (d) gains or losses on commodity derivative mark-to-market activity, (e) adjustments to reflect only the Adjusted EBITDA from our unconsolidated investments, (f) adjustments to exclude the Adjusted EBITDA related to the noncontrolling interest, (g) stock-based compensation expense, (h) gains or losses on sales, dispositions or retirements of assets, (i) non-cash gains and losses from foreign currency translations, (j) gains or losses on the repurchase, modification or extinguishment of debt, (k) non-cash GAAP-related adjustments to levelize revenues from tolling agreements and (l) other extraordinary, unusual or non-recurring items | |
AOCI | Accumulated Other Comprehensive Income | |
Average availability | Represents the total hours during the period that our plants were in-service or available for service as a percentage of the total hours in the period | |
Average capacity factor, excluding peakers | A measure of total actual power generation as a percent of total potential power generation. It is calculated by dividing (a) total MWh generated by our power plants, excluding peakers, by (b) the product of multiplying (i) the average total MW in operation, excluding peakers, during the period by (ii) the total hours in the period | |
Bcf | Billion cubic feet | |
Btu | British thermal unit(s), a measure of heat content | |
CAA | Federal Clean Air Act, U.S. Code Title 42, Chapter 85 | |
CAISO | California Independent System Operator | |
Calpine Equity Incentive Plans | Collectively, the Director Plan and the Equity Plan, which provide for grants of equity awards to Calpine non-union employees and non-employee members of Calpine’s Board of Directors | |
Calpine Receivables | Calpine Receivables, LLC, formerly Noble Americas Treasury Solutions LLC, an indirect, wholly-owned subsidiary of Calpine, which was established as bankruptcy remote, special purpose subsidiary and is responsible for administering the Accounts Receivable Sales Program | |
Calpine Solutions | Calpine Energy Solutions, LLC, formerly Noble Solutions, an indirect, wholly-owned subsidiary of Calpine, which is the third largest supplier of power to commercial and industrial retail customers in the United States with customers in 19 states, including presence in California, Texas, the Mid-Atlantic and the Northeast | |
Cap-and-Trade | A government imposed emissions reduction program that would place a cap on the amount of emissions that can be emitted from certain sources, such as power plants. In its simplest form, the cap amount is set as a reduction from the total emissions during a base year and for each year over a period of years the cap amount would be reduced to achieve the targeted overall reduction by the end of the period. Allowances or credits for emissions in an amount equal to the cap would be issued or auctioned to companies with facilities, permitting them to emit up to a certain amount of emissions during each applicable period. After allowances have been distributed or auctioned, they can be transferred or traded | |
CARB | California Air Resources Board | |
CCFC | Calpine Construction Finance Company, L.P., an indirect, wholly-owned subsidiary of Calpine | |
iii
ABBREVIATION | DEFINITION | |
CCFC Term Loans | Collectively, the $900 million first lien senior secured term loan and the $300 million first lien senior secured term loan entered into on May 3, 2013, and the $425 million first lien senior secured term loan entered into on February 26, 2014, between CCFC, as borrower, and Goldman Sachs Lending Partners, LLC, as administrative agent and as collateral agent, and the lenders party thereto | |
CDHI | Calpine Development Holdings, Inc., an indirect, wholly-owned subsidiary of Calpine | |
CFTC | Commodities Futures Trading Commission | |
Champion Energy | Champion Energy Marketing, LLC, which owns a retail electric provider that serves residential, governmental, commercial and industrial customers in deregulated electricity markets in Texas, Illinois, Pennsylvania, Ohio, New Jersey, Maryland, Massachusetts, New York, Delaware, Maine, Connecticut, California and the District of Columbia | |
Chapter 11 | Chapter 11 of the U.S. Bankruptcy Code | |
CO2 | Carbon dioxide | |
COD | Commercial operations date | |
Cogeneration | Using a portion or all of the steam generated in the power generating process to supply a customer with steam for use in the customer's operations | |
Commodity expense | The sum of our expenses from fuel and purchased energy expense, fuel transportation expense, transmission expense, environmental compliance expense and realized settlements from our marketing, hedging and optimization activities including natural gas and fuel oil transactions hedging future power sales, but excludes our mark-to-market activity | |
Commodity Margin | Non-GAAP financial measure that includes power and steam revenues, sales of purchased power and physical natural gas, capacity revenue, REC revenue, sales of surplus emission allowances, transmission revenue and expenses, fuel and purchased energy expense, fuel transportation expense, environmental compliance expense, and realized settlements from our marketing, hedging, optimization and trading activities, but excludes our mark-to-market activity and other revenues | |
Commodity revenue | The sum of our revenues from power and steam sales, sales of purchased power and physical natural gas, capacity revenue, REC revenue, sales of surplus emission allowances, transmission revenue and realized settlements from our marketing, hedging, optimization and trading activities, but excludes our mark-to-market activity | |
Company | Calpine Corporation, a Delaware corporation, and its subsidiaries | |
Corporate Revolving Facility | The $1.8 billion aggregate amount revolving credit facility credit agreement, dated as of December 10, 2010, as amended on June 27, 2013, July 30, 2014, February 8, 2016 and December 1, 2016 among Calpine Corporation, the Bank of Tokyo-Mitsubishi UFJ, Ltd., as successor administrative agent, MUFG Union Bank, N.A., as successor collateral agent, the lenders party thereto and the other parties thereto | |
CPUC | California Public Utilities Commission | |
CSAPR | Cross-State Air Pollution Rule | |
D.C. Circuit | U.S. Court of Appeals for the District of Columbia Circuit | |
Director Plan | The Amended and Restated Calpine Corporation 2008 Director Incentive Plan | |
Dodd-Frank Act | The Dodd-Frank Wall Street Reform and Consumer Protection Act of 2010 | |
iv
ABBREVIATION | DEFINITION | |
EBITDA | Net income (loss) attributable to Calpine before net (income) loss attributable to the noncontrolling interest, interest, taxes, depreciation and amortization | |
EIA | Energy Information Administration of the U.S. Department of Energy | |
EPA | U.S. Environmental Protection Agency | |
Equity Plan | The Amended and Restated Calpine Corporation 2008 Equity Incentive Plan | |
ERCOT | Electric Reliability Council of Texas | |
EWG(s) | Exempt wholesale generator(s) | |
Exchange Act | U.S. Securities Exchange Act of 1934, as amended | |
FASB | Financial Accounting Standards Board | |
FDIC | U.S. Federal Deposit Insurance Corporation | |
FERC | U.S. Federal Energy Regulatory Commission | |
First Lien Notes | Collectively, the 2022 First Lien Notes, the 2023 First Lien Notes, the 2024 First Lien Notes and the 2026 First Lien Notes | |
First Lien Term Loans | Collectively, the 2017 First Lien Term Loan, the 2019 First Lien Term Loan, the 2020 First Lien Term Loan, the 2023 First Lien Term Loans and the 2024 First Lien Term Loan | |
FRCC | Florida Reliability Coordinating Council | |
GE | General Electric International, Inc. | |
Geysers Assets | Our geothermal power plant assets, including our steam extraction and gathering assets, located in northern California consisting of 13 operating power plants | |
GHG(s) | Greenhouse gas(es), primarily carbon dioxide (CO2), and including methane (CH4), nitrous oxide (N2O), sulfur hexafluoride (SF6), hydrofluorocarbons (HFCs) and perfluorocarbons (PFCs) | |
Greenfield LP | Greenfield Energy Centre LP, a 50% partnership interest between certain of our subsidiaries and a third party which operates the Greenfield Energy Centre, a 1,038 MW natural gas-fired, combined-cycle power plant in Ontario, Canada | |
Heat Rate(s) | A measure of the amount of fuel required to produce a unit of power | |
Hg | Mercury | |
IPP(s) | Independent Power Producers | |
IPP Peers | Dynegy Inc. and NRG Energy, Inc. | |
IRC | Internal Revenue Code | |
IRS | U.S. Internal Revenue Service | |
ISO(s) | Independent System Operator(s) | |
ISO-NE | ISO New England Inc., an independent nonprofit RTO serving states in the New England area, including Connecticut, Maine, Massachusetts, New Hampshire, Rhode Island and Vermont | |
v
ABBREVIATION | DEFINITION | |
KWh | Kilowatt hour(s), a measure of power produced, purchased or sold | |
LIBOR | London Inter-Bank Offered Rate | |
LTSA(s) | Long-Term Service Agreement(s) | |
Market Heat Rate(s) | The regional power price divided by the corresponding regional natural gas price | |
MATS | Mercury and Air Toxics Standard | |
MISO | Midwest ISO | |
MMBtu | Million Btu | |
MRO | Midwest Reliability Organization | |
MW | Megawatt(s), a measure of plant capacity | |
MWh | Megawatt hour(s), a measure of power produced, purchased or sold | |
NAAQS | National Ambient Air Quality Standards | |
North American Power | North American Power & Gas, LLC, an indirect, wholly-owned subsidiary of Calpine, which was acquired on January 17, 2017 and is a growing retail energy supplier for homes and small businesses primarily concentrated in the Northeast U.S. | |
NERC | North American Electric Reliability Council | |
New 2019 First Lien Term Loan | The $400 million first lien senior secured term loan, dated February 3, 2017, among Calpine Corporation, as borrower, the lenders party thereto, Morgan Stanley Senior Funding, Inc., as administrative agent and MUFG Union Bank, N.A., as collateral agent | |
New 2023 First Lien Term Loan | The $562 million first lien senior secured term loan, dated May 31, 2016, among Calpine Corporation, as borrower, the lenders party thereto, Citibank, N.A., as administrative agent and MUFG Union Bank, N.A., as collateral agent | |
Noble Solutions | Noble Americas Energy Solutions LLC, which was legally renamed Calpine Energy Solutions, LLC on December 1, 2016 following the completion of its acquisition by an indirect, wholly-owned subsidiary of Calpine Corporation | |
NOL(s) | Net operating loss(es) | |
NOx | Nitrogen oxides | |
NPCC | Northeast Power Coordinating Council | |
NYISO | New York ISO | |
NYMEX | New York Mercantile Exchange | |
NYSE | New York Stock Exchange | |
OCI | Other Comprehensive Income | |
OMEC | Otay Mesa Energy Center, LLC, an indirect, wholly-owned subsidiary of Calpine that owns the Otay Mesa Energy Center, a 608 MW natural gas-fired, combined-cycle power plant located in San Diego county, California | |
vi
ABBREVIATION | DEFINITION | |
OTC | Over-the-Counter | |
PG&E | Pacific Gas & Electric Company | |
PJM | PJM Interconnection is a RTO that coordinates the movement of wholesale electricity in all or parts of Delaware, Illinois, Indiana, Kentucky, Maryland, Michigan, New Jersey, North Carolina, Ohio, Pennsylvania, Tennessee, Virginia, West Virginia and the District of Columbia | |
PPA(s) | Any term power purchase agreement or other contract for a physically settled sale (as distinguished from a financially settled future, option or other derivative or hedge transaction) of any power product, including power, capacity and/or ancillary services, in the form of a bilateral agreement or a written or oral confirmation of a transaction between two parties to a master agreement, including sales related to a tolling transaction in which the purchaser provides the fuel required by us to generate such power and we receive a variable payment to convert the fuel into power and steam | |
PSD | Prevention of Significant Deterioration | |
PUCT | Public Utility Commission of Texas | |
PUHCA 2005 | U.S. Public Utility Holding Company Act of 2005 | |
PURPA | U.S. Public Utility Regulatory Policies Act of 1978 | |
QF(s) | Qualifying facility(ies), which are cogeneration facilities and certain small power production facilities eligible to be “qualifying facilities” under PURPA, provided that they meet certain power and thermal energy production requirements and efficiency standards. QF status provides an exemption from the books and records requirement of PUHCA 2005 and grants certain other benefits to the QF | |
REC(s) | Renewable energy credit(s) | |
Report | This Annual Report on Form 10-K for the year ended December 31, 2016, filed with the SEC on February 10, 2017 | |
Reserve margin(s) | The measure of how much the total generating capacity installed in a region exceeds the peak demand for power in that region | |
RFC | Reliability First Corporation | |
RGGI | Regional Greenhouse Gas Initiative | |
Risk Management Policy | Calpine’s policy applicable to all employees, contractors, representatives and agents, which defines the risk management framework and corporate governance structure for commodity risk, interest rate risk, currency risk and other risks | |
RMR Contract(s) | Reliability Must Run contract(s) | |
RPS | Renewable Portfolio Standard | |
RTO(s) | Regional Transmission Organization(s) | |
SEC | U.S. Securities and Exchange Commission | |
Securities Act | U.S. Securities Act of 1933, as amended | |
Senior Unsecured Notes | Collectively, the 2023 Senior Unsecured Notes, the 2024 Senior Unsecured Notes and the 2025 Senior Unsecured Notes | |
SERC | Southeastern Electric Reliability Council | |
vii
ABBREVIATION | DEFINITION | |
SO2 | Sulfur dioxide | |
Spark Spread(s) | The difference between the sales price of power per MWh and the cost of natural gas to produce it | |
Steam Adjusted Heat Rate | The adjusted Heat Rate for our natural gas-fired power plants, excluding peakers, calculated by dividing (a) the fuel consumed in Btu reduced by the net equivalent Btu in steam exported to a third party by (b) the KWh generated. Steam Adjusted Heat Rate is a measure of fuel efficiency, so the lower our Steam Adjusted Heat Rate, the lower our cost of generation | |
TCEQ | Texas Commission on Environmental Quality | |
TRE | Texas Reliability Entity, Inc. | |
TSR | Total shareholder return | |
U.S. GAAP | Generally accepted accounting principles in the U.S. | |
VAR | Value-at-risk | |
VIE(s) | Variable interest entity(ies) | |
WECC | Western Electricity Coordinating Council | |
Whitby | Whitby Cogeneration Limited Partnership, a 50% partnership interest between certain of our subsidiaries and a third party which operates Whitby, a 50 MW natural gas-fired, simple-cycle cogeneration power plant located in Ontario, Canada | |
viii
Forward-Looking Statements
This Report contains “forward-looking statements” within the meaning of the Private Securities Litigation Reform Act of 1995, Section 27A of the Securities Act, and Section 21E of the Exchange Act. Forward-looking statements may appear throughout this Report, including without limitation, the “Management’s Discussion and Analysis” section. We use words such as “believe,” “intend,” “expect,” “anticipate,” “plan,” “may,” “will,” “should,” “estimate,” “potential,” “project” and similar expressions to identify forward-looking statements. Such statements include, among others, those concerning our expected financial performance and strategic and operational plans, as well as all assumptions, expectations, predictions, intentions or beliefs about future events. We believe that the forward-looking statements are based upon reasonable assumptions and expectations. However, you are cautioned that any such forward-looking statements are not guarantees of future performance and that a number of risks and uncertainties could cause actual results to differ materially from those anticipated in the forward-looking statements. Such risks and uncertainties include, but are not limited to:
• | Financial results that may be volatile and may not reflect historical trends due to, among other things, seasonality of demand, fluctuations in prices for commodities such as natural gas and power, changes in U.S. macroeconomic conditions, fluctuations in liquidity and volatility in the energy commodities markets and our ability and extent to which we hedge risks; |
• | Laws, regulations and market rules in the markets in which we participate and our ability to effectively respond to changes in laws, regulations or market rules or the interpretation thereof including those related to the environment, derivative transactions and market design in the regions in which we operate; |
• | Our ability to manage our liquidity needs, access the capital markets when necessary and comply with covenants under our Senior Unsecured Notes, First Lien Notes, First Lien Term Loans, Corporate Revolving Facility, CCFC Term Loans and other existing financing obligations; |
• | Risks associated with the operation, construction and development of power plants, including unscheduled outages or delays and plant efficiencies; |
• | Risks related to our geothermal resources, including the adequacy of our steam reserves, unusual or unexpected steam field well and pipeline maintenance requirements, variables associated with the injection of water to the steam reservoir and potential regulations or other requirements related to seismicity concerns that may delay or increase the cost of developing or operating geothermal resources; |
• | Competition, including from renewable sources of power, interference by states in competitive power markets through subsidies or similar support for new or existing power plants, and other risks associated with marketing and selling power in the evolving energy markets; |
• | Structural changes in the supply and demand of power, resulting from the development of new fuels or technologies and demand-side management tools (such as distributed generation, power storage and other technologies); |
• | The expiration or early termination of our PPAs and the related results on revenues; |
• | Future capacity revenue may not occur at expected levels; |
• | Natural disasters, such as hurricanes, earthquakes, droughts, wildfires and floods, acts of terrorism or cyber attacks that may affect our power plants or the markets our power plants or retail operations serve and our corporate headquarters; |
• | Disruptions in or limitations on the transportation of natural gas or fuel oil and the transmission of power; |
• | Our ability to manage our counterparty and customer exposure and credit risk, including our commodity positions; |
• | Our ability to attract, motivate and retain key employees; |
• | Present and possible future claims, litigation and enforcement actions that may arise from noncompliance with market rules promulgated by the SEC, CFTC, FERC and other regulatory bodies; and |
• | Other risks identified in this Report. |
Given the risks and uncertainties surrounding forward-looking statements, you should not place undue reliance on these statements. Many of these factors are beyond our ability to control or predict. Our forward-looking statements speak only as of the date of this Report. Other than as required by law, we undertake no obligation to update or revise forward-looking statements, whether as a result of new information, future events, or otherwise.
1
Where You Can Find Other Information
Our website is www.calpine.com. Information contained on our website is not part of this Report. Information that we furnish or file with the SEC, including our annual reports on Form 10-K, quarterly reports on Form 10-Q, current reports on Form 8-K and any amendments to, or exhibits included in, these reports are available for download, free of charge, on our website as soon as reasonably practicable after such materials are filed with or furnished to the SEC. Our SEC filings, including exhibits filed therewith, are also available on the SEC’s website at www.sec.gov. You may obtain and copy any document we furnish or file with the SEC at the SEC’s public reference room at 100 F Street, NE, Room 1580, Washington, D.C. 20549. You may obtain information on the operation of the SEC’s public reference facilities by calling the SEC at 1-800-SEC-0330. You may request copies of these documents, upon payment of a duplicating fee, by writing to the SEC at its principal office at 100 F Street, NE, Room 1580, Washington, D.C. 20549.
2
PART I
Item 1. | Business |
BUSINESS AND STRATEGY
Business
We are a premier competitive power company with 80 power plants primarily in the U.S. We sell the power and related services we produce to our wholesale customers who include commercial and industrial end-users, state and regional wholesale market operators, and our retail affiliates who serve retail customers. We measure our success by delivering long-term shareholder value. We accomplish this through our focus on operational excellence at our power plants and in our customer and commercial activity, as well as through our disciplined approach to capital allocation.
Our capital allocation philosophy seeks to maximize levered cash returns to equity while maintaining a strong balance sheet. We seek to enhance shareholder value through a diverse and balanced capital allocation approach that includes portfolio management, organic or acquisitive growth, returning capital to shareholders and debt reduction. The mix of this activity shifts over time given the external market environment and the opportunity set. In the current environment, we believe that paying down debt and strengthening our balance sheet is a high return investment for our shareholders. We also consider the repurchases of our own shares of common stock as an attractive investment opportunity, and we utilize the expected returns from this investment as the benchmark against which we evaluate all other capital allocation decisions. We believe this philosophy closely aligns our objectives with those of our shareholders.
We are one of the largest power generators in the U.S. measured by power produced. We own and operate primarily natural gas-fired and geothermal power plants in North America and have a significant presence in major competitive wholesale power markets in California (included in our West segment), Texas (included in our Texas segment) and the Northeast and Mid-Atlantic regions (included in our East segment) of the U.S. Since our inception in 1984, we have been a leader in environmental stewardship. We have invested in clean power generation to become a recognized leader in developing, constructing, owning and operating an environmentally responsible portfolio of flexible and reliable power plants. Our portfolio is primarily comprised of two types of power generation technologies: natural gas-fired combustion turbines, which are primarily efficient combined-cycle plants, and renewable geothermal conventional steam turbines. We are among the world’s largest owners and operators of industrial gas turbines as well as cogeneration power plants. Our Geysers Assets located in northern California represent the largest geothermal power generation portfolio in the U.S. as well as the largest single producing power generation asset of all renewable energy in the state of California.
We continue to focus on getting closer to our customers through expansion of our retail platform which began with the acquisition of Champion Energy in 2015 and was followed by the acquisitions of Calpine Solutions in late 2016 and North American Power in early 2017. Our retail portfolio has been established to provide an additional source of liquidity for our generation fleet as we hedge retail load from our wholesale generation assets as appropriate.
We sell power, steam, capacity, renewable energy credits and ancillary services to our customers, which include utilities, independent electric system operators, industrial and agricultural companies, retail power providers, municipalities and other governmental entities, power marketers as well as retail commercial, industrial, governmental and residential customers. We purchase primarily natural gas and some fuel oil as fuel for our power plants and engage in related natural gas transportation and storage transactions. We also purchase power for sale to our customers and purchase electric transmission rights to deliver power to our customers. Additionally, consistent with our Risk Management Policy, we enter into natural gas, power, environmental product, fuel oil and other physical and financial commodity contracts to hedge certain business risks and optimize our portfolio of power plants. Seasonality and weather can have a significant effect on our results of operations and are also considered in our hedging and optimization activities.
Subsequent to the completion of the sale of Osprey Energy Center on January 3, 2017 and the retirement of the Clear Lake Power Plant on February 1, 2017, our portfolio, including partnership interests, consists of 80 power plants, including one under construction, with an aggregate current generation capacity of 25,908 MW and 828 MW under construction. Inclusive of our power generation portfolio and our retail sales platforms, we serve customers in 25 states in the U.S. and in Canada and Mexico. Our fleet, including projects under construction, consists of 65 natural gas-fired combustion turbine-based plants, one fuel oil-fired steam-based plant, 13 geothermal steam turbine-based plants and one photovoltaic solar plant. In 2016, our fleet of power plants produced approximately 110 billion KWh of electric power for our customers. In addition, we are one of the largest consumers of natural gas in North America. In 2016, we consumed 839 Bcf or approximately 8% of the total estimated natural gas consumed
3
for power generation in the U.S. Our retail affiliates provided approximately 65 billion KWh to customers in 2016. We are actively seeking to continue to grow our wholesale and retail sales efforts.
We believe our unique fleet compares favorably with those of our major competitors on the basis of environmental stewardship, scale and geographical diversity. The discovery and exploitation of natural gas from shale combined with our modern, efficient and flexible combined-cycle power plants has created short-term and long-term advantages. In the short-term, we are often the lowest cost resource to dispatch compared to Eastern coal types and oil as demonstrated in recent years when we realized meaningfully higher capacity factors than we have historically, given our ability to displace other fuel types and older technologies. In the long-term, when compared on a full life-cycle cost, we believe our power plants will be even more competitive when considering the greater non-fuel operating costs and potential environmental liabilities associated with other technologies and the flexibility needed to support the integration of intermittent renewable resources.
The environmental profile of our power plants reflects our commitment to environmental leadership and stewardship. We have invested the capital necessary to develop a power generation portfolio that has substantially lower air emissions compared to our major competitors’ power plants that use other fossil fuels, such as coal. In addition, we strive to preserve our nation’s valuable water and land resources. To condense steam, our combined-cycle power plants use cooling towers with a closed water cooling system or air cooled condensers and do not employ “once-through” water cooling, which uses large quantities of water from adjacent waterways, negatively affecting aquatic life. Since our plants are modern and efficient and utilize cleaner burning natural gas, we do not require large areas of land for our power plants nor do we require large specialized landfills for the disposal of coal ash or nuclear plant waste.
Our scale provides the opportunity to have meaningful regulatory input, to leverage our procurement efforts for better pricing, terms and conditions on our goods and services, and to develop and offer a wide array of products and services to our customers. Finally, geographic diversity helps us manage and mitigate the effect of weather, regulatory and regional economic differences across our markets to provide more consistent financial performance.
To optimize the price received for the products that we produce, we utilize both wholesale and retail customer sales channels which include an active wholesale origination function, a residential retail channel (primarily focused in Texas and the Northeast and Mid-Atlantic regions), and channels that serve commercial and industrial end users through both brokered and direct sales.
Our principal offices are located in Houston, Texas with the principal offices of our retail affiliates located in Houston, Texas and San Diego, California. We also have regional offices in Dublin, California and Wilmington, Delaware, an engineering, construction and maintenance services office in Pasadena, Texas and government affairs offices in Washington D.C., Sacramento, California and Austin, Texas. We operate our business through a variety of divisions, subsidiaries and affiliates.
Strategy
Our goal is to be recognized as the premier competitive power company in the U.S. as viewed by our employees, shareholders, customers and policy-makers as well as the communities in which our facilities are located. We seek to deliver long-term shareholder value through operational excellence at our power plants and in our customer and commercial activity, as well as through our disciplined approach to capital allocation. Our strategy to achieve this is reflected in the following five major initiatives listed below and subsequently described in further detail:
•Focus on being a premier operating company;
•Focus on expanding our customer sales channels;
•Focus on optimizing our portfolio;
•Focus on advocacy and corporate responsibility; and
• | Focus on disciplined capital allocation. |
1. | Focus on Being a Premier Operating Company — Our objective is to be the “best-in-class” in regards to certain operational performance metrics, such as safety, availability, reliability, efficiency and cost management. We operate and maintain our fleet with the objective of ensuring that our plants remain among the most flexible in the sector and are best positioned to capture value in response to grid needs, especially in light of the continued integration of intermittent renewable resources. |
4
• | During 2016, our employees achieved a total recordable incident rate of 0.55 recordable injuries per 100 employees which places us in the first quartile performance for power generation companies with 1,000 or more employees. |
• | Our entire fleet achieved a forced outage factor of 2.8% and a starting reliability of 97.9% during the year ended December 31, 2016. |
• | During 2016, our outage services subsidiary completed 17 major inspections and eight hot gas path inspections. |
• | For the past 16 years, our Geysers Assets have reliably generated, on average, approximately six million MWh of renewable power per year. |
2. | Focus on Expanding our Customer Sales Channels — We continue to focus on getting closer to our customers through expansion of our retail platform which began with the acquisition of Champion Energy in 2015 and was followed by the acquisitions of Calpine Solutions in late 2016 and North American Power in early 2017. Our retail platform geographically and strategically complements our wholesale generation fleet by providing forward liquidity with sufficient margins. The combination of our wholesale origination and retail platforms provides Calpine access to both direct and mass market sales channels. Our direct sales efforts aim to provide our larger customers with customized products, leveraging both our successful wholesale origination efforts and Calpine Solutions’ presence among large commercial and industrial organizations to secure new contracts. Our mass market approach relies upon our expanded Champion Energy retail platform to serve the needs of both residential and smaller commercial and industrial customers across the country. We believe that our retail platform is strategically complete and are now focused on integrating it into our business and optimizing its financial performance. A summary of our more significant customer sales channel efforts and retail growth in 2016 and through the filing of this Report is as follows: |
Wholesale
• | Our ten-year PPA with Southern California Edison for 50 MW of capacity and renewable energy from our Geysers Assets commencing in January 2018 was approved by the CPUC in the second quarter of 2016. |
• | We entered into a new five-year PPA with USS-POSCO Industries to provide 50 MW of energy and steam from our Los Medanos Energy Center commencing in January 2017 which also provides for annual extensions through 2024. |
• | We entered into a new five-year steam agreement, subject to certain conditions precedent, with a wholly-owned subsidiary of The Dow Chemical Company to provide steam from our Texas City Power Plant through 2021. |
• | We entered into a new five-year PPA with a third party to provide 50 MW of capacity from our RockGen Energy Center commencing in June 2017, which increases to 100 MW of capacity commencing in June 2019. |
• | We entered into a new ten-year PPA with the Tennessee Valley Authority to provide 615 MW of energy and capacity from our Morgan Energy Center commencing in February 2016. |
Retail
• | In 2016, our retail subsidiaries served approximately 65 million MWh of customer load consisting of approximately 6.5 million annualized residential customer equivalents at December 31, 2016. |
• | During the third quarter of 2016, Champion Energy was ranked highest in customer satisfaction among Texas retail electric providers according to the J.D. Power 2016 Electric Provider Retail Customer Satisfaction Study. This is the sixth time Champion Energy has received the top ranking in the past seven years. |
• | During 2016, Champion Energy expanded its service territory to include commercial and industrial customers in Maine, Connecticut and California. |
• | On December 1, 2016, we completed the purchase of Calpine Solutions, formerly Noble Solutions, along with a swap contract for approximately $800 million plus approximately $350 million of net working capital at closing. We recovered approximately $250 million in cash subsequent to closing and expect to recover an additional approximately $200 million through collateral synergies and the runoff of acquired legacy hedges, substantially within the first year. Calpine Solutions is a commercial and industrial retail electricity provider with customers in 19 states in the U.S., including presence in California, Texas, the Mid-Atlantic and Northeast, where our wholesale power generation fleet is primarily concentrated. The acquisition of this best-in-class direct energy sales platform is consistent with our stated goal of getting closer to our end-use customers and expands our retail customer base, complementing our existing retail business while providing us a valuable sales channel for reaching a much greater portion of the load we seek to serve. |
5
• | On January 17, 2017, we completed the purchase of North American Power for approximately $105 million, excluding working capital and other adjustments. North American Power is a growing retail energy supplier for homes and small businesses and is primarily concentrated in the Northeast U.S. where Calpine has a substantial power generation presence and where Champion Energy has a substantial retail sales footprint that will be enhanced by the addition of North American Power, which will be integrated into our Champion Energy retail platform. |
3. | Focus on Optimizing our Portfolio — Our goal is to take advantage of favorable opportunities to continue to design, develop, acquire, construct and operate the next generation of highly efficient, operationally flexible and environmentally responsible power plants where such investment meets our rigorous financial hurdles, particularly if power contracts and financing are available and attractive returns are expected. Likewise, we actively seek to divest non-core assets where we can find opportunities to do so accretively. During 2016 and through the filing of this Report, we strategically repositioned our portfolio by adding capacity in our core regions, divesting positions in non-core markets and retiring uneconomic plants through the following transactions: |
• | On February 5, 2016, we completed the purchase of Granite Ridge Energy Center, a power plant with a nameplate capacity of 745 MW (summer peaking capacity of 695 MW), for approximately $500 million, excluding working capital and other adjustments. The addition of this modern, efficient, natural gas-fired, combined-cycle power plant increased capacity in our East segment, specifically the constrained New England market. |
• | On April 1, 2016, we entered into an asset sale agreement for the sale of substantially all of the assets comprising our South Point Energy Center to Nevada Power Company d/b/a NV Energy for approximately $76 million plus the assumption by the purchaser of existing transmission capacity contracts with a future net present value payment obligation of approximately $112 million, approximately $9 million in remaining tribal lease costs and approximately $21 million in near-term repairs, maintenance and capital improvements to restore the power plant to full capacity. The sale is subject to certain conditions precedent, as well as federal and state regulatory approvals. This transaction supports our effort to divest non-core assets outside our strategic concentration. In December 2016, the Nevada Public Utility Commission issued an order rejecting the asset sale agreement. In January 2017, Nevada Power Company filed a motion for reconsideration of this order. In February 2017, the FERC approved Nevada Power Company’s acquisition of the South Point Energy Center. However, on February 8, 2017, the Nevada Public Utility Commission denied Nevada Power Company’s purchase of the South Point Energy Center. Nevada Power Company has the right to appeal this decision. We are also currently assessing our options; however, we do not anticipate that the denial of the sale by the Nevada Public Utility Commission will have a material effect on our financial condition, results of operations or cash flows. |
• | During the third quarter of 2016, we filed with ERCOT to retire our 400 MW Clear Lake Power Plant. ERCOT subsequently approved our plan to discontinue operations. Built in 1985, Clear Lake utilizes an older technology. Due to growing maintenance costs and lack of adequate compensation in Texas, we retired the power plant on February 1, 2017. The book value associated with our Clear Lake Power Plant is immaterial. |
• | On October 26, 2016, we completed the sale of our Mankato Power Plant, a 375 MW natural gas-fired, combined-cycle power plant and 345 MW expansion project under advanced development located in Minnesota, to Southern Power Company, a subsidiary of Southern Company, for $396 million, excluding working capital and other adjustments. This transaction supports our effort to divest non-core assets outside our strategic concentration. |
• | On January 3, 2017, we completed the sale of our Osprey Energy Center to Duke Energy Florida, Inc. for approximately $166 million, excluding working capital and other adjustments. This transaction supports our effort to divest non-core assets outside our strategic concentration. |
In addition, our significant ongoing projects under construction and growth initiatives are discussed below:
• | York 2 Energy Center — York 2 Energy Center is an 828 MW dual-fuel, combined-cycle project that is co-located with our York Energy Center in Peach Bottom Township, Pennsylvania. Once complete, the power plant will feature two combustion turbines, two heat recovery steam generators and one steam turbine. The project is under construction and the initial 760 MW of capacity cleared PJM’s last three base residual auctions with the 68 MW of incremental capacity clearing the last two base residual auctions. Due to construction delays, we are now targeting COD in late 2017. |
• | Guadalupe Peaking Energy Center — In April 2015, we executed an agreement with Guadalupe Valley Electric Cooperative (“GVEC”) related to the construction of a 418 MW natural gas-fired peaking power plant to be co-located with our Guadalupe Energy Center. Under the terms of the agreement, construction of the Guadalupe Peaking Energy Center (“GPEC”) may commence at our discretion, so long as the power plant reaches COD by June 1, 2019. When the power plant begins commercial operation, GVEC will purchase a 50% ownership interest in GPEC. Once built, GPEC will feature two fast-ramping combustion turbines capable of responding to peaks in power |
6
demand. This project represents a mutually beneficial response to our customer’s desire to have direct access to peaking generation resources, as it leverages the benefits of our existing site and development rights and our construction and operating expertise, as well as our customer’s ability to fund its investment at attractive rates, all while affording us the flexibility of timing the plant’s construction in response to market pricing signals.
4. | Focus on Advocacy and Corporate Responsibility — We recognize that our business is heavily influenced by laws, regulations and rules at federal, state and local levels as well as by rules of the ISOs and RTOs that oversee the competitive markets in which we operate. We believe that being active participants in the legislative, regulatory and rulemaking processes may yield better outcomes for all stakeholders, including Calpine. Our three basic areas of focus are competitive wholesale power markets, competitive retail power markets and environmental stewardship in power generation. Below are some recent examples of our advocacy efforts: |
Ensuring Competitive Market Structure/Rules
• | Successfully advocated for the PUCT to evaluate the performance of the Operating Reserve Demand Curve, and to pursue improvements as necessary. The PUCT received several rounds of comments from Calpine and other market participants, and we are currently awaiting a decision from the agency. |
• | Worked individually and with trade groups to remove language in the proposed federal energy bill that would have resulted in rules that could potentially undermine the PJM and ISO-NE capacity markets. |
Stopping Non-Competitive/Subsidized Generation
• | Participated with a coalition of generators and others opposed to the sole source PPAs between regulated utilities and their unregulated generation affiliates in Ohio. In response to this opposition, the FERC decided that the contracts were not exempt from their Edgar Standard review regarding affiliate power sales restrictions and directed both utilities to submit the PPAs for review and approval prior to transacting under the contracts. As a result, both of the regulated utilities dropped their efforts. |
• | Worked with other generators to stop legislation in Connecticut that would have provided out-of-market subsidies to the Millstone nuclear power plant. We expect this legislation to be reintroduced this year and will continue to oppose. |
5. | Focus on Disciplined Capital Allocation — We seek to enhance shareholder value through optimizing our portfolio, prudently managing our balance sheet and returning capital to shareholders. We continue our disciplined approach to capital allocation, benchmarking each decision against the opportunity to repurchase shares of our own common stock. In the current environment, we believe that paying down debt and strengthening our balance sheet is a high return investment for our shareholders. We further optimized our capital structure by refinancing, redeeming or amending several of our debt instruments during the year ended December 31, 2016: |
• | On February 8, 2016, we amended our Corporate Revolving Facility, extending the maturity by two years to June 27, 2020, and increasing the capacity by an additional $178 million to $1,678 million through June 27, 2018, reverting back to $1,520 million through the maturity date. Further, we increased the letter of credit sublimit by $250 million to $1.0 billion and extended the maturity by two years to June 27, 2020. |
• | In May 2016, we repaid our 2019 and 2020 First Lien Term Loans with the proceeds from our New 2023 First Lien Term Loan and 2026 First Lien Notes which extended the maturity on approximately $1.2 billion of corporate debt. |
• | On December 1, 2016, we amended our Corporate Revolving Facility to increase the aggregate revolving loan commitments available thereunder by approximately $112 million to $1,790 million for the full term through the maturity date of June 27, 2020. |
• | In December 2016, we used cash on hand to redeem $120 million of our 2023 First Lien Notes, plus accrued and unpaid interest. |
• | In December 2016, we repriced our 2023 First Lien Term Loans by lowering the margin over LIBOR by 0.25% to 2.75% and extended the maturity of our 2024 First Lien Term Loan from May 2022 to January 2024. |
• | As part of our stated goal to reduce debt and interest expense, on February 3, 2017, we issued a notice of redemption to repay the remaining $453 million of our outstanding 2023 First Lien Notes using cash on hand along with the proceeds from the New 2019 First Lien Term Loan which contains a substantially lower variable rate of LIBOR plus 1.75% per annum. We intend to repay the New 2019 First Lien Term Loan in full by the end of 2018. This accelerates debt reduction and achieves substantial annual interest savings of more than $20 million. |
7
THE MARKET FOR POWER
Our Power Markets and Market Fundamentals
The power industry represents one of the largest industries in the U.S. and affects nearly every aspect of our economy, with an estimated end-user market of approximately $380 billion in power sales in 2016 according to the EIA. Historically, vertically integrated power utilities with monopolies over franchised territories dominated the power generation industry in the U.S. Over the last 25 years, industry trends and legislative and regulatory initiatives, culminating with the deregulation trend of the late 1990’s and early 2000’s, provided opportunities for wholesale power producers to compete to provide power. Although different regions of the country have very different models and rules for competition, the markets in which we operate have some form of wholesale market competition. California (included in our West segment), Texas (included in our Texas segment) and the Northeast and Mid-Atlantic regions (included in our East segment), which are the markets in which we have our largest presence, have emerged as among the most competitive wholesale power markets in the U.S. We also operate, to a lesser extent, in competitive wholesale power markets in the Southeast and the Midwest. In addition to our sales of electrical power and steam, we produce several ancillary products for sale to our customers.
• | First, we are a provider of power to utilities, independent electric system operators, industrial and agricultural companies, retail power providers, municipalities and other governmental entities, power marketers as well as retail commercial, industrial, governmental and residential customers. We continue to focus on getting closer to our customers through expansion of our retail platform which began with the acquisition of Champion Energy in 2015 and was followed by the acquisitions of Calpine Solutions in late 2016 and North American Power in early 2017. Our power sales occur in several different product categories including baseload (around the clock generation), intermediate (generation typically more expensive than baseload and utilized during higher demand periods to meet shifting demand needs), and peaking energy (most expensive variable cost and utilized during the highest demand periods), for which the latter is provided by some of our stand-alone peaking power plants/units and from our combined-cycle power plants by using technologies such as steam injection or duct firing additional burners in the heat recovery steam generators. Many of our units have operated more frequently as baseload units at times when low natural gas prices have driven their production costs below those of some competing coal-fired units. We also sell “full requirements” electricity for wholesale and retail customers, whereby we utilize our power plants as well as market purchases to serve the total electricity demand of the customer even as it varies across time. |
• | Second, we provide capacity for sale to utilities, independent electric system operators and retail power providers. In various markets, retail power providers (or independent electric system operators on their behalf) are required to demonstrate adequate resources to meet their power sales commitments. To meet this obligation, they procure a market product known as capacity from power plant owners or resellers. Most electricity market administrators have acknowledged that an energy only market does not provide sufficient revenues to enable existing merchant generators to recover all of their costs or to encourage the construction of new power plants. Capacity auctions have been implemented in the Northeast, Mid-Atlantic and certain Midwest regional markets to address this issue. California has a bilateral capacity program. Texas does not presently have a capacity market or a requirement for retailers to ensure adequate resources. |
• | Third, we sell RECs from our Geysers Assets in northern California. California has an RPS that requires load serving entities to have RECs for a certain percentage of their demand for the purpose of guaranteeing a certain level of renewable generation in the state or in neighboring areas. Because geothermal is a renewable source of energy, we receive a REC for each MWh we produce and are able to sell our RECs to load serving entities. We also purchase RECs from other sources for resale to our customers. |
• | Fourth, our cogeneration power plants produce steam, in addition to electricity, for sale to industrial customers for use in their manufacturing processes or heating, ventilation and air conditioning operations. |
• | Fifth, we provide ancillary service products to wholesale power markets. These products include the right for the purchaser to call on our generation to provide flexibility to the market and support operation of the electric grid. For example, we are sometimes paid to reserve a portion of capacity at some of our power plants that could be deployed quickly should there be an unexpected increase in load or to assure reliability due to fluctuations in the supply of power from variable renewable resources such as wind and solar generation. These ramping characteristics are becoming increasingly necessary in markets where intermittent renewables have large penetrations. |
In addition to the five products above, we are buyers and sellers of emission allowances and credits, including those under California’s AB 32 GHG reduction program, RGGI, the federal Acid Rain and CSAPR programs and emission reduction credits under the federal Nonattainment New Source Review program.
8
Although all of the products mentioned above contribute to our financial performance and are the primary components of our Commodity Margin, the most important are our sales of wholesale power and capacity. We utilize long-term customer contracts for our power and steam sales where possible. For power and capacity that are not sold under customer contracts or longer-dated capacity auctions, we use our hedging program and retail channels and sell power into shorter term markets throughout the regions in which we participate.
When selling power from our natural gas-fired fleet into the short-term or spot markets, we attempt to maximize our operations when the market Spark Spread is positive. Assuming rational economic behavior by market participants, generating units generally are dispatched in order of their variable costs, with lower cost units being dispatched first and units with higher costs dispatched as demand, or “load,” grows beyond the capacity of the lower cost units. For this reason, in a competitive market, the price of power typically is related to the variable operating costs of the marginal generator, which is the last unit to be dispatched in order to meet demand. The factors that most significantly affect our operations are reserve margins in each of our markets, the price and supply of natural gas and competing fuels such as coal and oil, weather patterns and natural events, our operating Heat Rate, availability factors, and regulatory and environmental pressures as further discussed below.
Reserve Margins
Reserve margin, a measure of excess generation capacity in a market, is a key indicator of the competitive conditions in the markets in which we operate. For example, a reserve margin of 15% indicates that supply is 115% of expected peak power demand under normal weather and power plant operating conditions. Holding other factors constant, lower reserve margins typically lead to higher power prices because the less efficient capacity in the region is needed more often to satisfy power demand or voluntary or involuntary load shedding measures are taken. Markets with tight demand and supply conditions often display price spikes, higher capacity prices and improved bilateral contracting opportunities. Typically, the market price effect of reserve margins, as well as other supply/demand factors, is reflected in the Market Heat Rate, calculated as the local market power price divided by the local natural gas price.
During the last decade, the supply and demand fundamentals have varied across our regional markets. Key trends include lower weather normalized load growth in some regions due to increased energy efficiency as well as rooftop solar installations, new renewable and natural gas-fired supply additions, and significant retirements of older, less efficient fossil-fueled plants. Reserve margins by NERC regional assessment area for each of our segments are listed below:
2016(1) | ||
West: | ||
WECC | 26.0 | % |
Texas: | ||
TRE | 15.5 | % |
East: | ||
NPCC | 22.9 | % |
MISO | 18.0 | % |
PJM | 28.9 | % |
SERC | 25.8 | % |
FRCC | 24.3 | % |
___________
(1) | Data source is NERC weather-normalized estimates for 2016 published in May 2016. |
In recent years and in some regional markets such as PJM, the ability of customers to curtail load or temporarily utilize onsite backup generation instead of grid-provided electricity, known as “demand response,” has become a meaningful portion of “supply” and thus contributes to reserve margin estimates. While demand response reduces demand for centralized generation during peak times, it typically does so at a very high variable cost. To the extent demand response resources are treated like other sources of supply (e.g., their variable cost-based bids are allowed to affect the market clearing price for power), high resulting prices benefit lower-cost units like ours. Further, demand response may discourage new investment in competing centralized generation plants (for example, by winning capacity auctions instead of new units). This may contribute to higher energy price volatility during peak energy demand periods.
9
The Price and Supply of Natural Gas
Approximately 96% of our generating capability’s fuel requirements are met with natural gas. We have approximately 725 MW of baseload capacity from our Geysers Assets and our expectation is that the steam reservoir at our Geysers Assets will be able to supply economic quantities of steam for the foreseeable future as our steam flow decline rates have become very small over the past several years. We also have approximately 391 MW of capacity from power plants where we purchase fuel oil to meet generation requirements, but generally do not expect fuel oil requirements to be material to our portfolio of power plants. In our East segment, where the supply of natural gas can be constrained under some weather circumstances, we have approximately 6,100 MW of dual-fueled capable power plants. Additionally, we have 4 MW of capacity from solar power generation technology with no fuel requirement.
We procure natural gas from multiple suppliers and transportation and storage sources. Although availability is generally not an issue, localized shortages (especially in extreme weather conditions in and around population centers), transportation availability and supplier financial stability issues can and do occur. When natural gas supply interruptions do occur, some of our power plants benefit from the ability to operate on fuel oil instead of natural gas.
The price of natural gas, economic growth and environmental regulations affect our Commodity Margin and liquidity. The effect of changes in natural gas prices differs according to the time horizon and regional market conditions and depends on our hedge levels and other factors discussed below.
Lower natural gas prices over the past six years have had a significant effect on power markets. Beginning in 2009, there was a significant decrease in NYMEX Henry Hub natural gas prices from a range of $6/MMBtu to $13/MMBtu during 2008 to an average natural gas price of $4.26/MMBtu, $2.63/MMBtu and $2.55/MMBtu during 2014, 2015 and 2016, respectively.
The availability of non-conventional natural gas supplies, in particular shale natural gas, has been the primary driver of reduced natural gas prices. Access to significant deposits of shale natural gas has altered the natural gas supply landscape in the U.S. and has had a profound effect on both the outright price of natural gas and the historical regional natural gas price relationships (basis differentials). The U.S. Department of Energy estimates that shale natural gas production has the potential of 3 trillion to 4 trillion cubic feet per year and may be sustainable for decades with enough natural gas to supply the U.S. for the next 90 years. Despite moderate increases in natural gas prices and some significant, weather induced regional price spikes in the winter of 2014, there is an emerging view that lower priced natural gas will be available for the medium to long-term future. Further, high levels of natural gas production relative to available pipeline export capacity in some locations such as the Marcellus shale production region have put additional, seasonal downward pressure on local natural gas prices. Overall, low natural gas prices and corresponding low power prices have challenged the economics of nuclear and coal-fired plants, leading to numerous announced and potential unit retirements.
Much of our generating capacity is located in California (included in our West segment), Texas (included in our Texas segment) and the Northeast and Mid-Atlantic (included in our East segment) where natural gas-fired units set power prices during many hours. When natural gas is the price-setting fuel (i.e., natural gas prices are above coal prices in our Texas or East segments), increases in natural gas prices may increase our unhedged Commodity Margin because our combined-cycle power plants in those markets are more fuel-efficient than conventional natural gas-fired technologies and peaking power plants. Conversely, decreases in natural gas prices may decrease our unhedged Commodity Margin. In these instances, our cost of production advantage relative to less efficient natural gas-fired generation is diminished on an absolute basis. Additionally, in the Northeast and Mid-Atlantic regions, we have generating units capable of burning either natural gas or fuel oil. For these units, on the rare occasions when the cost of consuming natural gas is excessively high relative to fuel oil, our unhedged Commodity Margin may increase as a result of our ability to use the lower cost fuel.
Where we operate under long-term contracts, changes in natural gas prices can have a neutral effect on us in the short-term. This tends to be the case where we have entered into tolling agreements under which the customer provides the natural gas and we convert it to power for a fee, or where we enter into indexed-based agreements with a contractual Heat Rate at or near our actual Heat Rate for a monthly payment.
Changes in natural gas prices or power prices may also affect our liquidity. During periods of high or volatile natural gas prices, we could be required to post additional cash collateral or letters of credit.
Despite these short-term dynamics, over the long-term, we expect lower natural gas prices to enhance the competitiveness of our modern, natural gas-fired fleet by making investment in other technologies such as coal, nuclear or renewables less economic and, in fact, making it more challenging for existing coal and nuclear resources to continue operating economically.
Beginning in the second half of 2014 and continuing throughout 2015, global oil prices declined significantly. Brent crude oil (a commonly cited global oil index) spot prices fell from a 2014 high of $115 per barrel in June 2014 to a low of $35
10
per barrel in December 2015 while moderately recovering to an average price of $44 per barrel in 2016 (per the EIA). Since U.S. power and natural gas prices are generally not linked to oil prices, the oil market shift has not been material to our financial performance. The effect going forward will also likely not be material to our financial performance. While lower oil prices may lead to lower oil extraction and lower power demand in some parts of the U.S., such as North Dakota and Texas, lower oil prices are generally considered a boon to economic growth more broadly, which typically contributes to higher electricity demand.
Weather Patterns and Natural Events
Weather generally has a significant short-term effect on supply and demand for power and natural gas. Historically, demand for and the price of power is higher in the summer and winter seasons when temperatures are more extreme, and therefore, our unhedged revenues and Commodity Margin could be negatively affected by relatively cool summers or mild winters. However, our geographically diverse portfolio mitigates the effect on our Commodity Margin of weather in specific regions of the U.S. Additionally, a disproportionate amount of our total revenue is usually realized during the summer months of our third fiscal quarter. We expect this trend to continue in the future as U.S. demand for power generally peaks during this time.
Operating Heat Rate and Availability
Our fleet is modern and more efficient than the average generation fleet; accordingly, we run more and earn incremental margin in markets where less efficient natural gas units frequently set the power price. In such cases, our unhedged Commodity Margin is positively correlated with how much more efficient our fleet is than our competitors’ fleets and with higher natural gas prices. Efficient operation of our fleet creates the opportunity to capture Commodity Margin in a cost effective manner. However, unplanned outages during periods when Commodity Margin is positive could result in a loss of that opportunity. We generally measure our fleet performance based on our availability factors, operating Heat Rate and plant operating expense. The higher our availability factor, the better positioned we are to capture Commodity Margin. The lower our operating Heat Rate compared to the Market Heat Rate, the more favorable the effect on our Commodity Margin.
Regulatory and Environmental Trends
We believe that that our fleet is generally favored by regulatory requirements for the industry to reduce air and water emissions, including those described below, given the characteristics of our power plant portfolio. Many of these trends, but not all, are positive for our portfolio of power plants:
• | Economic pressures continue to increase for coal-fired power generation as natural gas prices remain low and state and federal agencies enact environmental regulations to reduce air emissions of certain pollutants such as SO2, NOX, GHG, Hg and acid gases, restrict the use of once-through cooling, and provide for stricter standards for managing coal combustion residuals. Depending on how the new presidential administration approaches existing and proposed rules, older, less efficient fossil-fuel power plants that emit much higher amounts of GHG, SO2, NOX, Hg and acid gases, which operate nationwide, but more prominently in the eastern U.S., may need to install expensive air pollution controls or reduce or discontinue operations. Any retirements or curtailments could enhance our growth opportunities through greater utilization of our existing power plants and development of new power plants. The estimated capacity for fossil-fueled plants older than 50 years and the total estimated capacity for fossil-fueled plants by NERC region are as follows: |
Generating Capacity Older Than 50 years | Total Generating Capacity | |||||||
West: | ||||||||
WECC | 9,212 | MW | 132,279 | MW | ||||
Texas: | ||||||||
TRE | 4,225 | MW | 87,047 | MW | ||||
East: | ||||||||
NPCC | 8,503 | MW | 56,471 | MW | ||||
MRO | 4,428 | MW | 45,008 | MW | ||||
RFC | 20,408 | MW | 185,251 | MW | ||||
SERC | 24,796 | MW | 224,903 | MW | ||||
FRCC | 844 | MW | 60,818 | MW | ||||
Total | 72,416 | MW | 791,777 | MW | ||||
• | An increase in power generated from renewable sources could lead to an increased need for flexible power that many of our power plants provide to protect the reliability of the grid and earn premium compensation for that flexibility; |
11
however, risks also exist that renewables have the ability to lower overall wholesale power prices which could negatively affect us. Significant economic and reliability concerns for renewable generation have been raised, but we expect that renewable market penetration will continue, assisted by state-level renewable portfolio standards and federal tax incentives. The Consolidated Appropriations Act which extended the production tax credit for wind through the end of 2016 with gradual decreases thereafter until the tax credit expires completely in 2019 and extended the 30% investment tax credit for solar through the end of 2019 with gradual decreases through 2021 after which the investment tax credit declines to 10% was enacted in December 2015. Increased renewable penetration has a particularly negative effect on inflexible baseload units and may lead to retirement of additional baseload units, which would benefit us; however, our energy margin may also decrease due to lower market clearing prices which result from the growth of zero marginal cost renewables supply in the market. To the extent market structures evolve to appropriately compensate units for providing flexible capacity to ensure reliability, our capacity revenue may increase.
• | One small but growing source of competing renewable generation in some of our regional markets (primarily California) is customer-sited (primarily rooftop) solar generation. Levelized costs for solar installation have fallen significantly over the past several years, aided by federal tax subsidies and other local incentives, and are now in some regions lower than customer retail electric rates. To the extent on-site solar generation is compensated at the full retail rate (an increasingly controversial policy known as “net energy metering”), rooftop solar installations may continue to grow. Should net energy metered solar installations remain at relatively low levels of penetration or net energy metering policies be weakened (by rate structure reforms that charge customers fixed amounts regardless of the level of electricity consumed, thus lowering the variable portion of the rates), rooftop solar growth might diminish. Absent incentives and supportive policies, rooftop solar is currently generally not competitive with wholesale power. |
• | The regulators in our core markets remain committed to the competitive wholesale power model, particularly in ERCOT, PJM and ISO-NE where they continue to focus on market design and rules to assure the long-term viability of competition and the benefits to customers that justify competition. However, certain states have taken or are considering subsidizing or otherwise providing economic support to existing, uneconomic power plants such as nuclear power plants. These efforts, if successful, could reduce the number of nuclear unit retirements that would result from currently low market prices. |
• | Utilities are increasingly focused on demand side management – managing the level and timing of power usage through load curtailment, dispatching generators located at commercial or industrial sites, and “smart grid” technologies that may improve the efficiencies, dispatch usage and reliability of electric grids. Performance standards for demand side resources have been made more stringent recently as system operators evaluate their reliability (especially at high levels of penetration) and environmental authorities deal with the implications of relying on smaller, less environmentally efficient generation sources during periods of peak demand when air quality is already challenged. |
• | Environmental permitting requirements for new power plants, transmission lines and pipelines continue to increase in stringency and complexity, resulting in prolonged, expensive development cycles and high capital investments. |
We believe many of these trends, but not all, are positive for our existing fleet. For a discussion of federal, state and regional legislative and regulatory initiatives and how they might affect us, see “— Governmental and Regulatory Matters.”
It is very difficult to predict the continued evolution of our markets due to the uncertainty of various risk factors which could affect our business. A description of these risk factors is included under Item 1A. “Risk Factors.”
Competition
Wholesale power generation is a capital-intensive, commodity-driven business with numerous industry participants. We compete against other independent power producers, power marketers and trading companies, including those owned by financial institutions, retail load aggregators, municipalities, retail power providers, cooperatives and regulated utilities to supply power and power-related products to our customers in major markets in the U.S. and Canada. In addition, in some markets, we compete against some of our customers.
In markets with centralized ISOs, such as California, Texas, the Northeast and Mid-Atlantic, our natural gas-fired power plants compete directly with all other sources of power. The EIA estimates that in 2016, 34% of the power generated in the U.S. was fueled by natural gas, 30% by coal, 20% by nuclear facilities and the remaining 16% of power generated by hydroelectric, fuel oil, geothermal and other energy sources. We are subject to complex and stringent energy, environmental and other governmental laws and regulations at the federal, state and local levels in connection with the development, ownership and operation of our power plants. Federal and state legislative and regulatory actions continue to change. While the new presidential administration’s plans have not yet been announced, existing and proposed regulations continue to target lower air pollutant
12
emissions such as NOX, SO2, GHG, Hg and acid gases and also limit the use of once-through cooling and some methods of coal ash disposal. Although we cannot predict the ultimate effect any future environmental legislation or regulations will have on our business, as a clean energy provider, we believe that we are well positioned for increases in environmental rule stringency. We are actively participating in these debates at the federal, regional and state levels. For a further discussion of the environmental and other governmental regulations that affect us, see “— Governmental and Regulatory Matters.”
With new environmental regulations and a stable and affordable supply of natural gas, the proportion of power generated by natural gas and other low emissions resources is expected to increase because older coal-fired power plants will be required to install costly emissions control devices, limit their operations or retire. Meanwhile, many states are considering or have already mandated that certain percentages of power delivered to end users in their jurisdictions be produced from renewable resources, such as geothermal, wind and solar energy.
Competition from nuclear energy is currently seen as unlikely to increase in the future. The nuclear incident in March 2011 at the Fukushima Daiichi nuclear power plant introduced substantial uncertainties around new nuclear power plant development in the U.S. The nuclear projects that are currently under construction in the U.S. are experiencing cost overruns and delays. Further, low power prices are challenging the economics of existing nuclear facilities, resulting in the retirement or potential retirement of certain existing nuclear generating units and triggering efforts on the part of nuclear power plant owners and stakeholders to seek out-of-market subsidies to maintain operations.
Competition from renewable generation is likely to increase in the future. Federal and state financial incentives and RPS requirements continue to foster renewables development. The Consolidated Appropriations Act which extended the production tax credit for wind through the end of 2016 with gradual decreases thereafter until the tax credit expires completely in 2019 and extended the 30% investment tax credit for solar through the end of 2019 with gradual decreases through 2021 after which the investment tax credit declines to 10% was enacted in December 2015. In October 2015, the EPA promulgated the Clean Power Plan which requires future reductions in GHG emissions from existing power plants and provides flexibility in meeting the emissions reduction requirements including adding renewable generation, although the ultimate implementation of this rule is uncertain given the change in presidential administration. Beyond economic issues, there are concerns over the reliability and adequacy of transmission infrastructure to transmit certain renewable generation from its source to where it is needed. Consequently, while subsidized renewables growth is likely to continue, natural gas units will likely be needed as baseload and “back-up” generation in the long-term.
Retail electricity and natural gas is similarly a commodity-driven business with numerous industry participants. We compete against other integrated power companies, regulated utilities, other retail power providers, brokers, trading companies including those owned by financial institutions, retail load aggregators, municipalities and cooperatives to supply power and power-related products to our customers in major markets in the U.S. and Canada.
We believe our ability to compete in both wholesale and retail markets will be driven by the extent to which we are able to accomplish the following:
• | provide affordable, reliable services to our customers; |
• | maintain excellence in operations; |
• | achieve and maintain a lower cost of production, primarily by maintaining unit availability, efficiency and production cost management; |
• | effectively utilize our sales channels to reach our customers; |
• | accurately assess and effectively manage our risks; and |
• | accomplish all of the above with an environmental effect that is lower than the competition and further decreasing over time. |
MARKETING, HEDGING AND OPTIMIZATION ACTIVITIES
Our commercial hedging and optimization strategies are designed to maximize our risk-adjusted Commodity Margin by leveraging our knowledge, experience and fundamental views on natural gas and power. Additionally, we seek strong bilateral relationships with load serving entities that can benefit us and our customers. Our retail subsidiaries also provide us with a hedging outlet for our wholesale power plant portfolio.
The majority of our risk exposures arise from our ownership and operation of power plants. Our primary risk exposures are Spark Spread, power prices, natural gas prices, capacity prices, locational price differences in power and in natural gas, natural gas transportation, electric transmission, REC prices, carbon allowance prices in California and the Northeast and other emissions credit prices. In addition to the direct risk exposure to commodity prices, we also have general market risks such as risk related
13
to performance of our counterparties and customers and plant operating performance risk. We also have a small exposure to Canadian exchange rates due to our partial ownership of Greenfield LP and Whitby located in Canada, which are under long term contracts, and minimal fuel oil exposure which are not currently material to our operations. As such, we have currently elected not to hedge our Canadian exchange rate exposure and our hedging activities related to our fuel oil exposure are not material to our financial condition, results of operations or cash flows.
We produced approximately 110 billion KWh of electricity in 2016 across North America and consumed approximately 839 Bcf of natural gas, making us one of the largest producers of electricity and consumers of natural gas in North America. Our retail affiliates provided approximately 65 billion KWh to customers in 2016. Our retail portfolio has been established to provide an additional source of liquidity for our generation fleet as we hedge retail load from our wholesale generation assets as appropriate.
The primary power markets in which we conduct our wholesale power operations are California (included in our West segment), Texas (included in our Texas segment) and the Northeast and Mid-Atlantic (included in our East segment) which have centralized markets for which power demand and prices are determined on a spot basis (day ahead and real time). Most of the power generated by our power plants is sold to entities such as independent electric system operators, utilities, municipalities and cooperatives, as well as to retail power providers including our retail affiliates, commercial and industrial wholesale and retail end users, financial institutions, power trading and marketing companies, residential end users (through our retail subsidiaries) and other third parties. Our retail affiliates conduct business in 20 states including California, Texas, the Mid-Atlantic and Northeast where our wholesale power generation fleet is concentrated.
We actively manage our risk exposures with a variety of physical and financial instruments with varying time horizons. These instruments include PPAs, tolling arrangements, Heat Rate swaps and options, retail power sales including through our retail affiliates, steam sales, buying and selling standard physical power and natural gas products, buying and selling exchange traded instruments, buying and selling environmental and capacity products, natural gas transportation and storage arrangements, electric transmission service and other contracts for the sale and purchase of power products. We utilize these instruments to maximize the risk-adjusted returns for our Commodity Margin.
At any point in time, the relative quantity of our products hedged or sold under longer-term contracts is determined by the availability of forward product sales opportunities and our view of the attractiveness of the pricing available for forward sales. We have economically hedged a portion of our expected generation and natural gas portfolio as well as retail load supply obligations, where appropriate, mostly through power and natural gas forward physical and financial transactions including retail power sales; however, we currently remain susceptible to significant price movements for 2017 and beyond. When we elect to enter into these transactions, we are able to economically hedge a portion of our Spark Spread at pre-determined generation and price levels.
We conduct our hedging and optimization activities within a structured risk management framework based on controls, policies and procedures. We monitor these activities through active and ongoing management and oversight, defined roles and responsibilities, and daily risk estimates and reporting. Additionally, we seek to manage the associated risks through diversification, by controlling position sizes, by using portfolio position limits, and by actively managing hedge positions to lock in margin. We are exposed to commodity price movements (both profits and losses) in connection with these transactions. These positions are included in and subject to our consolidated risk management portfolio position limits and controls structure. Our future hedged status and marketing and optimization activities are subject to change as determined by our commercial operations group, Chief Risk Officer, senior management and Board of Directors. For control purposes, we have VAR limits that govern the overall risk of our portfolio of power plants, energy contracts, financial hedging transactions and other contracts. Our VAR limits, transaction approval limits and other risk related controls are dictated by our Risk Management Policy which is approved by our Board of Directors and by a committee comprised of members of our senior management and administered by our Chief Risk Officer’s organization. The Chief Risk Officer’s organization is segregated from the commercial operations unit and reports directly to our Audit Committee and Chief Financial Officer. Our Risk Management Policy is primarily designed to provide us with a degree of protection from significant downside commodity price risk exposure to our cash flows.
We have historically used interest rate hedging instruments to adjust the mix between our fixed and variable rate debt. To the extent eligible, our interest rate hedging instruments have been designated as cash flow hedges, and changes in fair value are recorded in OCI to the extent they are effective with gains and losses reclassified into earnings in the same period during which the hedged forecasted transaction affects earnings.
Seasonality and weather can have a significant effect on our results of operations and are also considered in our hedging and optimization activities. Most of our power plants are located in regional power markets where the greatest demand for power occurs during the summer months, which coincides with our third fiscal quarter. Depending on existing contract obligations and forecasted weather and power demands, we may maintain either a larger or smaller open position on fuel supply and committed generation during the summer months in order to protect and enhance our Commodity Margin accordingly.
14
SEGMENT AND SIGNIFICANT CUSTOMER INFORMATION
See Note 16 of the Notes to Consolidated Financial Statements for a discussion of financial information by reportable segment and geographic area and significant customer information for the years ended December 31, 2016, 2015 and 2014.
15
DESCRIPTION OF OUR POWER PLANTS
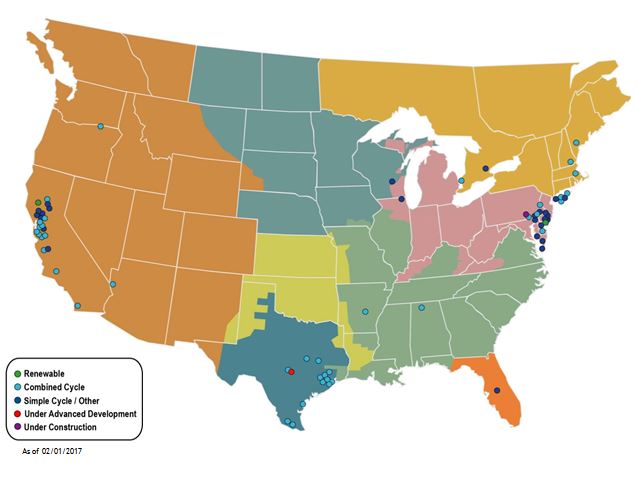
Geographic Diversity | Dispatch Technology |
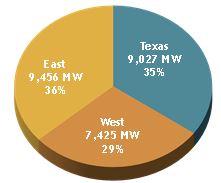 | |
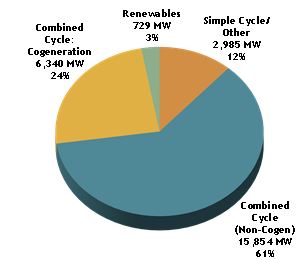 | |
16
Power Plants in Operation
Subsequent to the completion of the sale of Osprey Energy Center on January 3, 2017 and the retirement of the Clear Lake Power Plant on February 1, 2017, we own 80 power plants, including one under construction, with an aggregate generation capacity of 25,908 MW and 828 MW under construction.
Natural Gas-Fired Fleet
Our natural gas-fired power plants primarily utilize two types of designs: 2,260 MW of simple-cycle combustion turbines and 22,194 MW of combined-cycle combustion turbines and a small portion from conventional natural gas/oil-fired boilers with steam turbines. Simple-cycle combustion turbines burn natural gas or fuel oil to spin an electric generator to produce power. A combined-cycle unit combusts fuel like a simple-cycle combustion turbine and the exhaust heat is captured by a heat recovery boiler to create steam which can then spin a steam turbine. Simple-cycle turbines are easier to maintain, but combined-cycle turbines operate with much higher efficiency. Each of our power plants currently in operation is capable of producing power for sale to a utility, another third-party end user, our retail customers or an intermediary such as a marketing company. At 15 of our power plants, we also produce thermal energy (primarily steam and chilled water), which can be sold to industrial and governmental users. These plants are called combined heat and power facilities.
Our Steam Adjusted Heat Rate for 2016 for the power plants we operate was 7,324 Btu/KWh which results in a power conversion efficiency of approximately 47%. The power conversion efficiency is a measure of how efficiently a fossil fuel power plant converts thermal energy to electrical energy. Our Steam Adjusted Heat Rate includes all fuel required to dispatch our power plants including “start-up” and “shut-down” fuel, as well as all non-steady state operations. Once our power plants achieve steady state operations, our combined-cycle power plants achieve an average power conversion efficiency of approximately 50%. Additionally, we also sell steam from our combined heat and power plants, which improves our power conversion efficiency in steady state operations from these power plants to an average of approximately 53%. Due to our modern combustion turbine fleet, our power conversion efficiency is significantly better than that of older technology natural gas-fired power plants and coal-fired power plants, which typically have power conversion efficiencies that range from 28% to 36%.
Our natural gas fleet is relatively young with a weighted average age, based upon MW capacities in operation, of approximately 16 years. Taken as a portfolio, our natural gas power plants are among the most efficient in converting natural gas to power and emit far fewer pollutants per MWh produced than most typical utility fleets. The age, scale, efficiency and cleanliness of our power plants is a unique profile in the wholesale power sector.
The majority of the combustion turbines in our fleet are one of four technologies: General Electric 7FA, General Electric LM6000, Siemens 501FD or Siemens V84.2 turbines. We maintain our fleet through a regular and rigorous maintenance program. As units reach certain operating targets, which are typically based upon service hours or number of starts, we perform the maintenance that is required for that unit at that stage in its life cycle. Our large fleet of similar technologies has enabled us to build significant technical and engineering experience with these units and minimize the number of replacement parts in inventory. We leverage this experience by performing much of our major maintenance ourselves with our outage services subsidiary.
Geothermal Fleet
Our Geysers Assets are a 725 MW fleet of 13 operating power plants in northern California. Geothermal power is considered renewable energy because the steam harnessed to power our turbines is produced inside the Earth and does not require burning fuel. The steam is produced below the Earth’s surface from reservoirs of hot water, both naturally occurring and injected. The steam is piped directly from the underground production wells to the power plants and used to spin turbines to generate power. For the past 16 years, our Geysers Assets have reliably generated, on average, approximately six million MWh of renewable power per year. Unlike other renewable resources such as wind or sunlight, which depend on intermittent sources to generate power, making them less reliable, geothermal power provides a consistent source of energy as evidenced by our Geysers Assets’ availability of approximately 90% in 2016.
We inject water back into the steam reservoir, which extends the useful life of the resource and helps to maintain the output of our Geysers Assets. The water we inject comes from the condensate associated with the steam extracted to generate power, wells and creeks, as well as water purchase agreements for reclaimed water. We receive and inject an average of approximately 14 million gallons of reclaimed water per day into the geothermal steam reservoir at The Geysers where the water is naturally heated by the Earth, creating additional steam to fuel our Geysers Assets. Approximately 12 million gallons per day are received from the Santa Rosa Geysers Recharge Project, which we developed jointly with the City of Santa Rosa, and we receive, on average, approximately two million gallons a day from The Lake County Recharge Project from Lake County. As a result of these recharge projects, MWh production has been relatively constant. We expect that, as a result of the water injection program, the reservoir at our Geysers Assets will be able to supply economic quantities of steam for the foreseeable future.
17
We periodically review our geothermal studies to help us assess the economic life of our geothermal reserves. Our most recent geothermal reserve study was conducted in 2015. Our evaluation of our geothermal reserves, including our review of any applicable independent studies conducted, indicated that our Geysers Assets should continue to supply sufficient steam to generate positive cash flows at least through 2073. In reaching this conclusion, our evaluation, consistent with the due diligence study of 2015, assumes that defined “proved reserves” are those quantities of geothermal energy which, by analysis of geological and engineering data, can be estimated with reasonable certainty to be commercially recoverable, from a given date forward, from known reservoirs and under current economic conditions, operating methods and government regulations.
We lease the geothermal steam fields from which we extract steam for our Geysers Assets. We have leasehold mineral interests in 107 leases comprising approximately 29,000 acres of federal, state and private geothermal resource lands in The Geysers region of northern California. Our leases cover one contiguous area of property that comprises approximately 45 square miles in the northwest corner of Sonoma County and southeast corner of Lake County. The approximate breakout by volume of steam removed under the above leases for the year ended 2016 is:
• | 26% related to leases with the federal government via the Office of Natural Resources Revenue, |
• | 30% related to leases with the California State Lands Commission and |
• | 44% related to leases with private landowners/leaseholders. |
In general, our geothermal leases grant us the exclusive right to drill for, produce and sell geothermal resources from these properties and the right to use the surface for all related purposes. Each lease requires the payment of annual rent until commercial quantities of geothermal resources are established. After such time, the leases require the payment of minimum advance royalties or other payments until production commences, at which time production royalties are payable on a monthly basis from 10 to 31 days (depending upon the lease terms) following the close of the production month. Such royalties and other payments are payable to landowners, state and federal agencies and others, and vary widely as to the particular lease. In general, royalties payable are calculated based upon a percentage of total gross revenue received by us associated with our geothermal leases. Each lease’s royalty calculation is based upon its percentage of revenue as calculated by its steam generated relative to the total steam generated by our Geysers Assets as a whole.
Our geothermal leases are generally for initial terms varying from five to 20 years and for so long as geothermal resources are produced and sold. A few of our geothermal leases were signed in excess of 30 years ago. Our federal leases are, in general, for an initial 10-year period with renewal clauses for an additional 40 years for a maximum of 50 years. The 50-year term expires in 2024 for the majority of our federal leases. However, our federal leases allow for a preferential right to renewal for a second 40-year term on such terms and conditions as the lessor deems appropriate if, at the end of the initial 40-year term, geothermal steam is being produced or utilized in commercial quantities. The majority of our other leases run through the economic life of our Geysers Assets and provide for renewals so long as geothermal resources are being produced or utilized, or are capable of being produced or utilized, in commercial quantities from the leased land or from land unitized with the leased land. Although we believe that we will be able to renew our leases through the economic life of our Geysers Assets on terms that are acceptable to us, it is possible that certain of our leases may not be renewed, or may be renewable only on less favorable terms.
In addition, we hold 40 geothermal leases comprising approximately 43,840 acres of federal geothermal resource lands in the Glass Mountain area in northern California, which is separate from The Geysers region. Four test production wells were drilled prior to our acquisition of these leases and we have drilled one test well since their acquisition, which produced commercial quantities of steam during flow tests. However, the properties subject to these leases have not been developed and there can be no assurance that these leases will ultimately be developed.
Other Power Generation Technologies
We also have 725 MW of older, less efficient technology at our Edge Moor Energy Center which has conventional steam turbine technology. We also have 4 MW of capacity from solar power generation technology at our Vineland Solar Energy Center in New Jersey.
18
Table of Operating Power Plants and Projects Under Construction and Advanced Development
Set forth below is certain information regarding our operating power plants and projects under construction and advanced development at February 1, 2017.
SEGMENT / Power Plant | NERC Region | U.S. State or Canadian Province | Technology | Calpine Interest Percentage | Calpine Net Interest Baseload (MW)(1)(3) | Calpine Net Interest With Peaking (MW)(2)(3) | 2016 Total MWh Generated(4) | |||||||||||
WEST | ||||||||||||||||||
Geothermal | ||||||||||||||||||
McCabe #5 & #6 | WECC | CA | Renewable | 100 | % | 84 | 84 | 696,123 | ||||||||||
Ridge Line #7 & #8 | WECC | CA | Renewable | 100 | % | 76 | 76 | 659,244 | ||||||||||
Calistoga | WECC | CA | Renewable | 100 | % | 69 | 69 | 557,650 | ||||||||||
Eagle Rock | WECC | CA | Renewable | 100 | % | 68 | 68 | 585,585 | ||||||||||
Big Geysers | WECC | CA | Renewable | 100 | % | 61 | 61 | 603,910 | ||||||||||
Lake View | WECC | CA | Renewable | 100 | % | 54 | 54 | 502,494 | ||||||||||
Quicksilver | WECC | CA | Renewable | 100 | % | 53 | 53 | 254,294 | ||||||||||
Sonoma | WECC | CA | Renewable | 100 | % | 53 | 53 | 242,481 | ||||||||||
Cobb Creek | WECC | CA | Renewable | 100 | % | 51 | 51 | 439,944 | ||||||||||
Socrates | WECC | CA | Renewable | 100 | % | 50 | 50 | 240,569 | ||||||||||
Sulphur Springs | WECC | CA | Renewable | 100 | % | 47 | 47 | 487,859 | ||||||||||
Grant | WECC | CA | Renewable | 100 | % | 41 | 41 | 158,948 | ||||||||||
Aidlin | WECC | CA | Renewable | 100 | % | 18 | 18 | 125,287 | ||||||||||
Natural Gas-Fired | ||||||||||||||||||
Delta Energy Center | WECC | CA | Combined Cycle | 100 | % | 835 | 857 | 3,434,343 | ||||||||||
Pastoria Energy Center | WECC | CA | Combined Cycle | 100 | % | 770 | 749 | 4,366,356 | ||||||||||
Hermiston Power Project | WECC | OR | Combined Cycle | 100 | % | 566 | 635 | 3,179,622 | ||||||||||
Otay Mesa Energy Center | WECC | CA | Combined Cycle | 100 | % | 513 | 608 | 2,668,269 | ||||||||||
Metcalf Energy Center | WECC | CA | Combined Cycle | 100 | % | 564 | 605 | 2,709,083 | ||||||||||
Sutter Energy Center(5) | WECC | CA | Combined Cycle | 100 | % | 542 | 578 | — | ||||||||||
Los Medanos Energy Center | WECC | CA | Cogen | 100 | % | 518 | 572 | 2,889,852 | ||||||||||
South Point Energy Center(6) | WECC | AZ | Combined Cycle | 100 | % | 520 | 530 | — | ||||||||||
Russell City Energy Center | WECC | CA | Combined Cycle | 75 | % | 429 | 464 | 585,552 | ||||||||||
Los Esteros Critical Energy Facility | WECC | CA | Combined Cycle | 100 | % | 243 | 309 | 153,482 | ||||||||||
Gilroy Energy Center | WECC | CA | Simple Cycle | 100 | % | — | 141 | 18,167 | ||||||||||
Gilroy Cogeneration Plant | WECC | CA | Cogen | 100 | % | 109 | 130 | 141,394 | ||||||||||
King City Cogeneration Plant | WECC | CA | Cogen | 100 | % | 120 | 120 | 416,343 | ||||||||||
Wolfskill Energy Center | WECC | CA | Simple Cycle | 100 | % | — | 48 | 16,429 | ||||||||||
Yuba City Energy Center | WECC | CA | Simple Cycle | 100 | % | — | 47 | 30,535 | ||||||||||
Feather River Energy Center | WECC | CA | Simple Cycle | 100 | % | — | 47 | 26,088 | ||||||||||
Creed Energy Center | WECC | CA | Simple Cycle | 100 | % | — | 47 | 8,502 | ||||||||||
Lambie Energy Center | WECC | CA | Simple Cycle | 100 | % | — | 47 | 9,299 | ||||||||||
Goose Haven Energy Center | WECC | CA | Simple Cycle | 100 | % | — | 47 | 8,742 | ||||||||||
Riverview Energy Center | WECC | CA | Simple Cycle | 100 | % | — | 47 | 18,119 | ||||||||||
King City Peaking Energy Center | WECC | CA | Simple Cycle | 100 | % | — | 44 | 4,391 | ||||||||||
Agnews Power Plant | WECC | CA | Combined Cycle | 100 | % | 28 | 28 | 16,924 | ||||||||||
Subtotal | 6,482 | 7,425 | 26,255,880 | |||||||||||||||
19
SEGMENT / Power Plant | NERC Region | U.S. State or Canadian Province | Technology | Calpine Interest Percentage | Calpine Net Interest Baseload (MW)(1)(3) | Calpine Net Interest With Peaking (MW)(2)(3) | 2016 Total MWh Generated(4) | |||||||||||
TEXAS | ||||||||||||||||||
Deer Park Energy Center | TRE | TX | Cogen | 100 | % | 1,103 | 1,204 | 6,697,711 | ||||||||||
Guadalupe Energy Center | TRE | TX | Combined Cycle | 100 | % | 1,009 | 1,000 | 5,277,381 | ||||||||||
Baytown Energy Center | TRE | TX | Cogen | 100 | % | 782 | 842 | 4,563,333 | ||||||||||
Channel Energy Center | TRE | TX | Cogen | 100 | % | 723 | 808 | 4,264,358 | ||||||||||
Pasadena Power Plant(7) | TRE | TX | Cogen/Combined Cycle | 100 | % | 763 | 781 | 4,865,887 | ||||||||||
Bosque Energy Center | TRE | TX | Combined Cycle | 100 | % | 740 | 762 | 4,586,639 | ||||||||||
Freestone Energy Center | TRE | TX | Combined Cycle | 75 | % | 779 | 746 | 4,466,975 | ||||||||||
Magic Valley Generating Station | TRE | TX | Combined Cycle | 100 | % | 682 | 712 | 3,198,311 | ||||||||||
Brazos Valley Power Plant | TRE | TX | Combined Cycle | 100 | % | 523 | 609 | 2,858,695 | ||||||||||
Corpus Christi Energy Center | TRE | TX | Cogen | 100 | % | 426 | 500 | 2,478,834 | ||||||||||
Texas City Power Plant | TRE | TX | Cogen | 100 | % | 400 | 453 | 875,156 | ||||||||||
Hidalgo Energy Center | TRE | TX | Combined Cycle | 78.5 | % | 392 | 374 | 2,168,654 | ||||||||||
Freeport Energy Center(8) | TRE | TX | Cogen | 100 | % | 210 | 236 | 1,230,677 | ||||||||||
Subtotal | 8,532 | 9,027 | 47,532,611 | |||||||||||||||
EAST | ||||||||||||||||||
Bethlehem Energy Center | RFC | PA | Combined Cycle | 100 | % | 1,062 | 1,130 | 5,343,008 | ||||||||||
Hay Road Energy Center | RFC | DE | Combined Cycle | 100 | % | 1,039 | 1,130 | 3,858,419 | ||||||||||
Morgan Energy Center | SERC | AL | Cogen | 100 | % | 720 | 807 | 4,154,885 | ||||||||||
Fore River Energy Center | NPCC | MA | Combined Cycle | 100 | % | 750 | 731 | 3,840,808 | ||||||||||
Edge Moor Energy Center | RFC | DE | Steam Cycle | 100 | % | — | 725 | 869,844 | ||||||||||
Granite Ridge Energy Center | NPCC | NH | Combined Cycle | 100 | % | 745 | 695 | 3,221,204 | ||||||||||
York Energy Center | RFC | PA | Combined Cycle | 100 | % | 519 | 565 | 1,552,415 | ||||||||||
Westbrook Energy Center | NPCC | ME | Combined Cycle | 100 | % | 552 | 552 | 2,183,066 | ||||||||||
Greenfield Energy Centre(9) | NPCC | ON | Combined Cycle | 50 | % | 422 | 519 | 873,687 | ||||||||||
RockGen Energy Center | MRO | WI | Simple Cycle | 100 | % | — | 503 | 394,661 | ||||||||||
Zion Energy Center | RFC | IL | Simple Cycle | 100 | % | — | 503 | 435,494 | ||||||||||
Garrison Energy Center | RFC | DE | Combined Cycle | 100 | % | 273 | 309 | 1,565,129 | ||||||||||
Pine Bluff Energy Center | SERC | AR | Cogen | 100 | % | 184 | 215 | 1,205,874 | ||||||||||
Cumberland Energy Center | RFC | NJ | Simple Cycle | 100 | % | — | 191 | 115,967 | ||||||||||
Kennedy International Airport Power Plant | NPCC | NY | Cogen | 100 | % | 110 | 121 | 686,542 | ||||||||||
Auburndale Peaking Energy Center | FRCC | FL | Simple Cycle | 100 | % | — | 117 | 22,004 | ||||||||||
Sherman Avenue Energy Center | RFC | NJ | Simple Cycle | 100 | % | — | 92 | 48,823 | ||||||||||
Bethpage Energy Center 3 | NPCC | NY | Combined Cycle | 100 | % | 60 | 80 | 284,539 | ||||||||||
Carll’s Corner Energy Center | RFC | NJ | Simple Cycle | 100 | % | — | 73 | 19,265 | ||||||||||
Mickleton Energy Center | RFC | NJ | Simple Cycle | 100 | % | — | 67 | 6,102 | ||||||||||
Bethpage Power Plant | NPCC | NY | Combined Cycle | 100 | % | 55 | 56 | 299,586 | ||||||||||
Christiana Energy Center | RFC | DE | Simple Cycle | 100 | % | — | 53 | 103 | ||||||||||
Bethpage Peaker | NPCC | NY | Simple Cycle | 100 | % | — | 48 | 202,980 | ||||||||||
Stony Brook Power Plant | NPCC | NY | Cogen | 100 | % | 45 | 47 | 285,091 | ||||||||||
Tasley Energy Center | RFC | VA | Simple Cycle | 100 | % | — | 33 | 1,575 | ||||||||||
Whitby Cogeneration(10) | NPCC | ON | Cogen | 50 | % | 25 | 25 | 198,526 | ||||||||||
Delaware City Energy Center | RFC | DE | Simple Cycle | 100 | % | — | 23 | 57 | ||||||||||
West Energy Center | RFC | DE | Simple Cycle | 100 | % | — | 20 | 352 | ||||||||||
20
SEGMENT / Power Plant | NERC Region | U.S. State or Canadian Province | Technology | Calpine Interest Percentage | Calpine Net Interest Baseload (MW)(1)(3) | Calpine Net Interest With Peaking (MW)(2)(3) | 2016 Total MWh Generated(4) | |||||||||||
Bayview Energy Center | RFC | VA | Simple Cycle | 100 | % | — | 12 | 3,933 | ||||||||||
Crisfield Energy Center | RFC | MD | Simple Cycle | 100 | % | — | 10 | 1,467 | ||||||||||
Vineland Solar Energy Center | RFC | NJ | Renewable | 100 | % | — | 4 | 5,666 | ||||||||||
Subtotal | 6,561 | 9,456 | 31,681,072 | |||||||||||||||
Total operating power plants | 79 | 21,575 | 25,908 | 105,469,563 | ||||||||||||||
Power plants sold or retired during 2016 and early 2017 | ||||||||||||||||||
Mankato Power Plant | MRO | MN | Combined Cycle | 100% | n/a | n/a | 799,611 | |||||||||||
Osprey Energy Center | FRCC | FL | Combined Cycle | 100% | n/a | n/a | 2,953,901 | |||||||||||
Clear Lake Power Plant | TRE | TX | Cogen | 100% | n/a | n/a | 343,900 | |||||||||||
Subtotal | 4,097,412 | |||||||||||||||||
Total operating, sold and retired power plants | 109,566,975 | |||||||||||||||||
Projects Under Construction and Advanced Development | ||||||||||||||||||
Projects Under Construction | ||||||||||||||||||
York 2 Energy Center | RFC | PA | Combined Cycle | 100 | % | 736 | 828 | n/a | ||||||||||
Projects Under Advanced Development | ||||||||||||||||||
Guadalupe Peaking Energy Center(11) | TRE | TX | Simple Cycle | 100 | % | — | 418 | n/a | ||||||||||
Total operating power plants and projects | 22,311 | 27,154 | ||||||||||||||||
___________
(1) | Natural gas-fired fleet capacities are generally derived on as-built as-designed outputs, including upgrades, based on site specific annual average temperatures and average process steam flows for cogeneration power plants, as applicable. Geothermal capacities are derived from historical generation output and steam reservoir modeling under average ambient conditions (temperatures and rainfall). |
(2) | Natural gas-fired fleet peaking capacities are primarily derived on as-built as-designed peaking outputs based on site specific average summer temperatures and include power enhancement features such as heat recovery steam generator duct-firing, gas turbine power augmentation, and/or other power augmentation features. For certain power plants with definitive contracts, capacities at contract conditions have been included. Oil-fired capacities reflect capacity test results. |
(3) | These outputs do not factor in the typical MW loss and recovery profiles over time, which natural gas-fired turbine power plants display associated with their planned major maintenance schedules. |
(4) | MWh generation is shown here as our net operating interest. |
(5) | We suspended operations at our Sutter Energy Center to assess the future of the facility. |
(6) | We have entered into an agreement to sell South Point Energy Center. South Point Unit 2 experienced a combustion turbine outage in the Fall of 2015 and we are currently evaluating the timing of repairs in light of the impending sale. Further, the balance of the facility is not currently operating, however, it can be operated at our discretion based on market conditions. |
(7) | Pasadena is comprised of 260 MW of cogen technology and 521 MW of combined cycle (non-cogen) technology. |
(8) | Freeport Energy Center is owned by Calpine; however, it is contracted and operated by The Dow Chemical Company. |
(9) | Calpine holds a 50% partnership interest in Greenfield LP through its subsidiaries; however, it is operated by a third party. |
(10) | Calpine holds a 50% partnership interest in Whitby Cogeneration through its subsidiaries; however, it is operated by Atlantic Packaging Products Ltd. |
(11) | In accordance with a power purchase agreement, a third party will purchase a 50% ownership interest in this power plant upon achieving commercial operation. |
We provide operations and maintenance services for all but three of the power plants in which we have an interest. Such services include the operation of power plants, geothermal steam fields, wells and well pumps and natural gas pipelines. We also supervise maintenance, materials purchasing and inventory control, manage cash flow, train staff and prepare operations and maintenance manuals for each power plant that we operate. As a power plant develops an operating history, we analyze its operation
21
and may modify or upgrade equipment, or adjust operating procedures or maintenance measures to enhance the power plant’s reliability or profitability. Although we do not operate the Freeport Energy Center, our outage services subsidiary performs all major maintenance services for this plant under a contract with The Dow Chemical Company through April 2032.
Certain power plants in which we have an interest have been financed primarily with project financing that is structured to be serviced out of the cash flows derived from the sale of power (and, if applicable, thermal energy and capacity) produced by such power plants and generally provide that the obligations to pay interest and principal on the loans are secured solely by the capital stock or partnership interests, physical assets, contracts and/or cash flows attributable to the entities that own the power plants. The lenders under these project financings generally have no recourse for repayment against us or any of our assets or the assets of any other entity other than foreclosure on pledges of stock or partnership interests and the assets attributable to the entities that own the power plants. However, defaults under some project financings may result in cross-defaults to certain of our other debt instruments, including our First Lien Notes, First Lien Term Loans and Corporate Revolving Facility. Acceleration of the maturity of a project financing following a default may also result in a cross-acceleration of such other debt.
Substantially all of the power plants in which we have an interest are located on sites which we either own or lease on a long-term basis.
EMISSIONS AND OUR ENVIRONMENTAL PROFILE
Our environmental record has been widely recognized. We were an EPA Climate Leaders Partner with a stated goal to reduce GHG emissions, and we became the first power producer to earn the distinction of Climate Action LeaderTM. In 2015, our emissions of GHG amounted to approximately 50 million tons.
Natural Gas-Fired Generation
Our natural gas-fired, primarily combined-cycle fleet consumes significantly less fuel to generate power than conventional boiler/steam turbine power plants and emits fewer air pollutants per MWh of power produced as compared to coal-fired or oil-fired power plants. All of our power plants have air emissions controls and most have selective catalytic reduction to further reduce emissions of NOx, a precursor of atmospheric ozone and acid rain. In addition, we have implemented a program of proprietary operating procedures to reduce natural gas consumption and further lower air pollutant emissions per MWh of power generated. The table below summarizes approximate air pollutant emission rates from our natural gas-fired, combined-cycle power plants compared to the average emission rates from U.S. coal-, oil- and natural gas-fired power plants as a group, based on the most recent statistics available to us.
Air Pollutant Emission Rates — Pounds of Pollutant Emitted Per MWh of Power Generated | ||||||
Air Pollutants | Average U.S. Coal-, Oil-, and Natural Gas-Fired Power Plant(1) | Calpine Natural Gas-Fired, Combined-Cycle Power Plant(2) | Advantage Compared to Average U.S. Coal-, Oil-, and Natural Gas-Fired Power Plant | |||
Nitrogen Oxides, NOx | 1.49 | 0.121 | 91.9% | |||
Acid rain, smog and fine particulate formation | ||||||
Sulfur Dioxide, SO2 | 2.08 | 0.0052 | 99.8% | |||
Acid rain and fine particulate formation | ||||||
Mercury Compounds(3) | 0.00002 | — | 100% | |||
Neurotoxin | ||||||
Carbon Dioxide, CO2 | 1,657 | 860 | 48.1% | |||
Principal GHG — contributor to climate change | ||||||
___________
(1) | The average U.S. coal-, oil- and natural gas-fired power plants’ emission rates were obtained from the U.S. Department of Energy’s Electric Power Annual Report for 2015. Emission rates are based on 2015 emissions and net generation. The U.S. Department of Energy has not yet released 2016 information. |
(2) | Our natural gas-fired, combined-cycle power plant estimated emission rates are based on our 2015 emissions and power generation data from our natural gas-fired, combined-cycle power plants (excluding combined heat power plants) as measured under the EPA reporting requirements. |
22
(3) | The U.S. coal-, oil- and natural gas-fired power plant air emissions of mercury compounds were obtained from the EPA Toxics Release Inventory for 2014. Emission rates are based on 2015 emissions and net generation from U.S. Department of Energy’s Electric Power Annual Report for 2015. |
Geothermal Generation
Our 725 MW fleet of geothermal turbine-based power plants utilizes a natural, renewable energy source, steam from the Earth’s interior, to generate power. Since these power plants do not burn fossil fuel, they are able to produce power with negligible CO2 (the principal GHG), NOX and SO2 emissions. Compared to the average U.S. coal-, oil- and natural gas-fired power plant, our Geysers Assets emit 99.9% less NOx, 100% less SO2 and 96.5% less CO2. There are 15 active geothermal power plants located in The Geysers region of northern California. We own and operate 13 of them. We recognize the importance of our Geysers Assets and we are committed to extending this renewable geothermal resource through the addition of new steam wells and wastewater recharge projects where clean, reclaimed water from local municipalities is recycled into the geothermal resource where it is converted by the Earth’s heat into steam for power production.
Water Conservation and Reclamation
We have also invested substantially in technologies and systems that reduce the effect of our operations on water as a natural resource:
• | We receive and inject an average of approximately 14 million gallons of reclaimed water per day into the geothermal steam reservoir at The Geysers where the water is naturally heated by the Earth, creating additional steam to fuel our Geysers Assets. Approximately 12 million gallons per day are received from the Santa Rosa Geysers Recharge Project, which we developed jointly with the City of Santa Rosa, and we receive, on average, approximately two million gallons a day from The Lake County Recharge Project from Lake County. |
• | In our combined-cycle power plants, we use mechanical draft cooling towers, which use up to 90% less water than conventional once-through cooling systems. |
• | Three of our power plants (Sutter Energy Center, Otay Mesa Energy Center and Fore River Energy Center) employ air cooled condensers for cooling, consuming virtually no water for cooling. |
• | In 12 of our operating natural gas-fired power plants equipped with cooling towers, we reuse treated water from municipal treatment systems for cooling. By reusing water in these cooling towers, we avoid the usage of as much as 38 million gallons per day of valuable surface and/or groundwater for cooling. |
GOVERNMENTAL AND REGULATORY MATTERS
We are subject to complex and stringent energy, environmental and other laws and regulations at the federal, state and local levels as well as within the RTO and ISO markets in which we participate in connection with the development, ownership and operation of our power plants. Federal and state legislative and regulatory actions continue to have an effect on our business. Some of the more significant governmental and regulatory matters that affect our business are discussed below.
Environmental Matters
In November 2016, the United States held elections which resulted in the Republican presidential candidate, Donald Trump, being elected as the 45th President of the United States and the Republican Party maintaining control of both houses of the U.S. Congress. At this time, we cannot predict the effect the result of the election will have on current or pending environmental regulations promulgated by the EPA. However, we intend to continue to advocate for reasonable regulations protecting the environment which positively benefit our competitive market position by recognizing the value of our investments in clean and efficient power generation technology.
Federal Air Emissions Regulations
CAA
The CAA provides for the regulation of air quality and air emissions, largely through state implementation of federal requirements. We believe that all of our operating power plants comply with existing federal and state performance standards mandated under the CAA. In addition to regulation of air emissions at the federal level, a number of states in which we do business have implemented regulations that go beyond current federal environmental requirements. We continue to monitor and actively participate in federal and state initiatives which further our environmental and business objectives and where we anticipate an effect on our business.
23
The CAA requires the EPA to regulate emissions of pollutants considered harmful to public health and the environment. The EPA has set NAAQS for six “criteria” pollutants: carbon monoxide, lead, NO2, particulate matter, ozone and SO2. In addition, the CAA regulates a large number of air pollutants that are known to cause or may reasonably be anticipated to cause adverse effects to human health or adverse environmental effects, known as hazardous air pollutants (“HAPs”). The EPA is required to issue technology-based national emissions standards for hazardous air pollutants (“NESHAPs”) to limit the release of specified HAPs from specific industrial sectors. The EPA also regulates emissions of certain pollutants that affect visibility in national parks and wilderness areas (“Regional Haze”). Finally, the EPA has begun regulating GHG emissions from various industries, including the power sector.
CAA regulations primarily affect higher-emitting units in the national power generating fleet. Our commitment to environmental stewardship is reflected in our history of investing in low-emitting power plant technologies. As a result, these regulations generally do not have a meaningful, direct adverse effect on our generating fleet, although they may impose significant costs on the power industry overall.
NAAQS — Ozone
As part of its ongoing CAA obligation to periodically review NAAQS to ensure that air quality is protective of human health and the environment, on October 1, 2015, the EPA set a new standard for ground-level of ozone of 70 parts per billion, down from the standard set in 2008 of 75 parts per billion. This is significant to the power sector because ground-level ozone is a product of complex chemical reactions contributed to by NOx, which are one of the primary emissions of concern from power plants.
Air quality in the Houston area, where seven of our power plants are located, has improved over the last two decades. As a result, the Houston area was determined by the EPA to be attaining the 1-hour ozone standard, effective November 19, 2015, and the 1997 8-hour ozone standard, effective January 29, 2016. The Houston area remains in nonattainment relative to the 2008 ozone standard, and in fact, was downgraded in overall status relative to that standard on December 14, 2016. The area’s status has not yet been determined for the 2015 ozone standard, but is likely to be in nonattainment as well, which could lead to further, more stringent regulation of NOx emissions from mobile sources and a number of industry sources, particularly the power industry.
Pursuant to authority granted under the CAA, the TCEQ adopted regulations to attain the earlier NAAQS for ozone including the establishment of a Cap-and-Trade program for NOx emitted by power plants in the Houston-Galveston-Brazoria ozone nonattainment area. We own and operate seven power plants that participate in this program, all of which received free NOx allowances based on historical operating profiles. At this time, our Houston-area power plants have sufficient NOx allowances to meet forecasted obligations under the program. Due to the more stringent ozone standard promulgated in 2015, allowable NOx emissions under this program could be reduced at some point in the future, which could cause us to incur additional compliance costs. However, we cannot estimate such costs until such program changes are proposed and finalized.
Mercury and Air Toxics Standards
On February 16, 2012, the EPA promulgated the NESHAP from Coal- and Oil-fired Electric Utility Steam Generating Units and Standards of Performance for Fossil-Fuel-Fired Electric Utility, Industrial-Commercial-Institutional, and Small Industrial-Commercial-Institutional Steam Generating Units, otherwise known as MATS. MATS will reduce emissions of all hazardous air pollutants emitted by coal- and oil-fired electric generating units, including mercury (Hg), arsenic (As), chromium (Cr), nickel (Ni) and acid gases.
The EPA estimates there are approximately 1,400 units affected by MATS, consisting of approximately 1,100 existing coal-fired units and 300 oil-fired units at approximately 600 power plants. MATS required existing coal-fired units without emissions controls to retire or install controls on acid gases, mercury and particulate matter emissions by April 16, 2015. State enforcement authorities also have discretion under the CAA to provide an additional year for technology installation to comply with MATS, which many sources have successfully requested. Further, the EPA may provide, in limited circumstances due to delays in the installation of controls, an additional year extension for MATS compliance where necessary to maintain electric system reliability. Very few of these “second year” extensions have been issued. None of our facilities are subject to MATS.
MATS has been heavily litigated since its promulgation. On June 13, 2016, the U.S. Supreme Court denied a request to stay MATS which effectively ends the legal challenges to stop MATS from being implemented. On April 25, 2016, the EPA published in the Federal Register the final, revised “necessary and appropriate” determination to address the narrow issue for which the U.S. Supreme Court, and subsequently the D.C. Circuit, had remanded the MATS rule to the EPA for further action. This effectively addresses previous litigation related to MATS, although this action itself is now the subject of further litigation.
24
Multi-Pollutant Programs — CSAPR
Pursuant to authority granted under the CAA, the EPA has promulgated a series of regulations to reduce region-wide emissions of NOx and SO2 in the eastern U.S. The most recent of these regulations is CSAPR, which became effective on January 1, 2015. The purpose of CSAPR and predecessor regulations is to facilitate attainment of ozone and fine particulates NAAQS. These regulations have required reductions of SO2 emissions in affected states by over 70%, and NOX emissions by over 60% from 2003 levels by 2015 through Cap-and-Trade programs. Further region-wide reductions in NOx and SO2 will be required by a CSAPR update published on October 26, 2016.
CSAPR and prior regional multipollutant regulations have been heavily litigated since their inception beginning in 2002. This litigation has played out with the regional program largely remaining in place as written, with some modifications required by the courts. Specifically, the court vacated the CSAPR SO2 budgets for four states, including Alabama and Texas, and remanded the CSAPR SO2 program for those states to the EPA for correction. This action didn’t affect the CSAPR SO2 program in other states, or the CSAPR NOx program in these four states.
MATS and CSAPR primarily affect coal-fired power plants; therefore, these rules do not directly affect our power plants.
Regional Haze
The EPA first issued the Regional Haze rule in 1999, with a focus on emissions of SO2, NOx, and particulate matter, particularly PM2.5. The Regional Haze program includes two major components: demonstration of Reasonable Further Progress, and installation of Best Achievable Retrofit Technology (“BART”). States submit State Implementation Plans (“SIP”) to the EPA for approval. These SIPs delineate all of the relevant emission controls programs in the state, and demonstrate that the state is making reasonable progress toward the Regional Haze program visibility goals. In addition, states must require the installation of a minimum level of controls that are considered cost-effective on coal- and oil-fired power plants within the state. In the eastern U.S., regional NOx and SO2 programs like CSAPR are relied upon in Regional Haze SIPs to achieve much of the required emission reductions, and are also allowed by EPA policy to substitute for the installation of BART. If the EPA does not approve a SIP, it may instead issue a Federal Implementation Plan (“FIP”), which will specify the control requirements for sources in a state. On January 4, 2016, the EPA finalized its rule partially disapproving Texas’ Regional Haze SIP and imposing a FIP that requires installation of SO2 emission controls at several coal-fired power plants in Texas. Litigation ensued, and the SIP disapproval and FIP are currently stayed by court action. Because the CSAPR SO2 program for Texas was vacated, the requirement to install BART for SO2 emissions is now applicable. Accordingly, the EPA proposed a FIP for BART controls on December 9, 2016. This FIP would require installation or upgrade of SO2 controls on 16 units at seven coal-fired power plants in Texas. While the ultimate outcome of these actions will not directly affect our fleet, it does have the potential to affect the power market in Texas because the affected facilities would either have to further reduce emissions or retire, although the ultimate implementation of this rule is uncertain given the change in presidential administration.
GHG Emissions
Over the past several years, the EPA has proposed and issued rules related to GHG emissions within the power sector. The new presidential administration, however, has not indicated support for some of these rules, including, most notably, the Clean Power Plan.
The EPA’s regulation of GHG in response to the 2007 decision of the U.S. Supreme Court in Massachusetts v. EPA has been controversial and heavily litigated at every step of the regulatory process. Within the power industry, the EPA first proposed to regulate GHG emissions through the PSD and Title V programs, the two major permitting programs of the CAA.
These permitting rules were the subject of more than 60 petitions for review by industry and the states. The U.S. Supreme Court ultimately heard the case, and on June 23, 2014, rejected the PSD and Title V permitting rules in part but upheld the EPA’s authority to impose GHG limits on large new or modified sources if such sources were required to obtain permits for other pollutants. Our clean portfolio and additions thereto already meet the technology required by these rules. Therefore, we believe we are well-positioned to benefit from this regulatory development.
In January 2014, the EPA proposed New Source Performance Standards (“NSPS”) for GHG emissions from new power plants. In June 2014, the EPA proposed the Clean Power Plan which required a reduction in GHG emissions from existing power plants of 30% from 2005 levels by 2030. In June 2014, the EPA also proposed GHG NSPS provisions for modified and reconstructed sources.
On October 23, 2015, the EPA published the final NSPS for GHG emissions from new, modified and reconstructed power plants and the Clean Power Plan. The final Clean Power Plan requires a reduction in GHG emissions from existing power plants of 32% from 2005 levels by 2030. Litigation challenging the Clean Power Plan has been filed by at least 25 states and a number
25
of industry opponents. In addition to litigation challenging the rule on the merits, several motions for stay of the rule and for expedited consideration of the appeals were also filed. On February 9, 2016, the U.S. Supreme Court issued a stay of the Clean Power Plan until the D.C. Circuit issues a ruling on the merits and through final determination in any further appeal to the U.S. Supreme Court from the D.C. Circuit decision. Oral arguments were held on September 27, 2016 in the D.C. Circuit. Overall, we support the Clean Power Plan and believe we are well positioned to comply with its provisions. We expect the Clean Power Plan to be beneficial to Calpine, although the ultimate implementation of this rule is uncertain given the change in presidential administration.
In addition to federal GHG rules, several states and regional organizations have developed state-specific or regional initiatives to reduce GHG emissions through mandatory programs. The most advanced programs include California’s suite of GHG policies promulgated pursuant to AB 32, including its Cap-and-Trade program, and RGGI in the Northeast. The evolution of these programs could have a material effect on our business.
In both of these programs, a cap is established defining the maximum allowable emissions of GHGs emitted by sources subject to the program. Affected sources are required to hold one allowance for each ton of CO2 emitted (and, in the case of California’s program, other GHGs) during the applicable compliance period. Both programs also contain provisions for the use of qualified offsets in lieu of allowances. Allowances are distributed through auctions or through allocations to affected companies. In addition, there are functional secondary markets for allowances. We obtain allowances in a variety of ways, including participation in auctions, as part of PPAs, and through bilateral or exchange transactions.
State Air Emissions Regulations
California: GHG - Cap-and-Trade Regulation
AB 32 requires the state to reduce statewide GHG emissions in reference to 1990 levels. To meet this mandate, the CARB has promulgated a number of regulations, including the Cap-and-Trade Regulation and Mandatory Reporting Rule, which took effect on January 1, 2012. These regulations have since been amended by the CARB several times.
Under the Cap-and-Trade Regulation, the first compliance period for covered entities like us began on January 1, 2013 and ended on December 31, 2014. The second and third compliance periods, wherein the program applies to a broader scope of entities, including transportation fuels and natural gas distribution, run through the end of 2017 and 2020, respectively. Covered entities must surrender compliance instruments, which include both allowances and offset credits, in an amount equivalent to their GHG emissions.
The California Cap-and-Trade market has been linked to the GHG Cap-and-Trade market in Québec since 2014. Joint auctions of allowances issued by both jurisdictions, which can be used interchangeably, are held quarterly. The Canadian province of Ontario also began implementing its own Cap-and-Trade Program in 2017, with the goal of linking with the California- Québec market as soon as 2018. The Governor of New York has also previously announced that New York would explore the possibility of linking RGGI, a carbon market operating in nine northeastern states, with the California-Québec and Ontario markets.
In addition to the 2020 goal, California also has a long-term goal established by a 2005 executive order to reduce statewide GHG emissions to 80% below 1990 levels by 2050. Additionally, in 2015, California Governor Jerry Brown issued an executive order that establishes an interim GHG reduction target of 40% below 1990 levels by 2030 and orders the CARB to update its Climate Change Scoping Plan to express the 2030 target in tons of GHG emissions.
The 2030 target was enacted into law on September 8, 2016, when Governor Brown signed Senate Bill 32 (“SB 32”). SB 32 amends AB 32 by requiring the CARB to ensure that statewide GHG emissions are reduced to at least 40% below 1990 levels by 2030. SB 32 was joined to companion legislation, Assembly Bill 197 (“AB 197”), which Governor Brown also signed into law on September 8, 2016. AB 197 amends AB 32 to specify that CARB must prioritize emission reduction rules and regulations that result in direct emission reductions from sources of GHG emissions. While the author of AB 197 confirmed in an accompanying statement that AB 197 does not preclude the CARB from adopting market-based compliance mechanisms pursuant to AB 32, neither SB 32, nor AB 197, expressly affirms the CARB’s authority to extend the Cap-and-Trade Regulation beyond 2020.
The CARB has proposed amendments to the Cap-and-Trade Regulation that would extend the program beyond 2020 and add provisions so that its implementation can be relied upon to satisfy the requirements of the federal Clean Power Plan regulation. Due to uncertainty created by litigation currently pending at the California Court of Appeals challenging the Cap-and-Trade Regulation’s auctions as an unlawful tax and potential claims that might be brought challenging the CARB’s adoption of the proposed amendments to the Cap-and-Trade Regulation, Governor Brown proposed as part of his release of the proposed budget on January 10, 2017, legislation confirming the CARB’s authority to continue implementing the Cap-and-Trade Program’s auctions. The Governor previously announced that, if such legislation should not pass in 2017, he would seek authorization for continuation of the Cap-and-Trade Program through the voter initiative process.
26
The CARB is currently developing an update to its AB 32 Scoping Plan, laying out the strategies California will utilize to achieve the 2030 target established by SB 32, including continuation of the Cap-and-Trade Program. The CARB is also considering two alternatives to its proposed Scoping Plan scenario, one which would not include continuation of the Cap-and-Trade Program and one which would rely upon implementation of a carbon tax in lieu of the Cap-and-Trade Program.
Overall, we support AB 32 and expect the net effect of the Cap-and-Trade Regulation to be beneficial to Calpine, particularly by increasing the appeal of our Geysers Assets. We also believe we are well positioned to comply with the Cap-and-Trade Regulation.
Northeast GHG Regulation: RGGI
Nine states in the Northeast participate in RGGI, a Cap-and-Trade program, which affects our power plants in Maine, Massachusetts, New Hampshire, New York and Delaware (together emitting about 5.4 million tons of CO2 annually).
We receive annual allocations from New York’s long-term contract set-aside pool to cover some of the CO2 emissions attributable to our PPAs at both the Kennedy International Airport Power Plant and Stony Brook Power Plant. We do not anticipate any significant business or financial effect from RGGI, given the efficiency of our power plants in RGGI states.
Consistent with the original memorandum of understanding under which the states created RGGI, the overall success of the RGGI program was reviewed in 2013, and is in the process of being reviewed again. The 2013 program review led to a number of changes, most significant of which was a reduction of the aggregate RGGI cap from 165 million tons to 91 million tons, slightly less than RGGI-wide emissions in 2012. We do not expect any material effect to our business from this change in regulations. At this time, it is not possible to predict the outcome of the current program review.
Massachusetts: Global Warming Solutions Act
On December 16, 2016, the Massachusetts Department of Environmental Protection proposed regulations that would impose new GHG limits on power plants and other sources. These regulations are notable because they are structured as declining caps on emissions from regulated facilities with a limited allowance trading program. We are engaged in the rulemaking process, but are unable to predict the outcome of these regulations at this time. Although we view the regulations as proposed as likely to result in market distortions impeding the efficient operation of both power and emissions markets, we believe that we will be able to comply with its provisions if this regulation is finalized.
Maryland: Greenhouse Gas Emissions Reduction Act
On April 4, 2016, the Governor of Maryland signed into law the Reauthorization of the Greenhouse Gas Emissions Reduction Act which builds on the 2009 Greenhouse Gas Emissions Reduction Act that required a 25% reduction of GHG emissions from 2006 levels by 2020. The legislation requires the Maryland Department of the Environment (“MDE”), in coordination with other Maryland agencies, to develop plans, adopt regulations and implement programs to reduce GHGs. The legislation includes several “off ramps” designed to protect manufacturers and electric generators. Under the bill, the State must demonstrate MDE’s compliance plans will have a positive effect on Maryland’s economy and will protect existing manufacturing jobs.
Ontario: Climate Change Mitigation and Low-Carbon Economy Act
Ontario is implementing a new GHG law with an associated Cap-and-Trade program which became effective January 1, 2017. This program requires power generators to either acquire related CO2 allowances on their own behalf or, in most cases, the natural gas pipeline supplying the power generation facility will procure such allowances and bill the power generator in the form of a CO2 surcharge on its natural gas transportation invoice. Greenfield LP has a long-term Clean Energy Supply Contract with the IESO, successor to the Ontario Power Authority. We believe the contract contemplates and provides for the full pass-through of CO2 cost, although there have been communications from the IESO which indicate an alternative view. Greenfield LP is currently negotiating to remedy this matter. On a related note, Whitby has a PPA with the Ontario Electricity Financial Corporation, successor to Ontario Hydro. Whitby is also seeking to recover related CO2 cost being applied to its natural gas transportation invoice. As this issue is ongoing, we cannot predict the ultimate effect on our financial condition, results of operations or cash flows.
Other Environmental Regulations
RPS
We are subject to an RPS in multiple states in which we do business. Generally, an RPS requires each retail seller of electricity to include in its resource portfolio (the resources procured by the retail seller to supply its retail customers) a certain amount of power generated from renewable or clean energy resources by a certain date.
27
California RPS
California’s RPS requires retail power providers to generate or procure 33% and 50% of the power they sell to retail customers from renewable resources by 2020 and 2030, respectively, with intermediate targets leading up to 2020 and 2030. Behind-the-meter solar generally does not count towards California’s RPS requirements. Under California’s RPS, there are limits on different “buckets” of procurement that can be used to satisfy the RPS. Load-serving entities must satisfy a growing fraction of their compliance obligations with renewable power from resources located in California or delivered into California within the hour, such as our Geysers Assets. While the RPS generally depresses wholesale energy prices, the intermittency of many renewable resources raises operational flexibility challenges that present opportunities for natural gas-fired generation to provide capacity and ancillary services products.
Other States
A number of additional states have an RPS in place. Existing state-specific RPS requirements may change due to regulatory and/or legislative initiatives, and other states may consider implementing an enforceable RPS in the future. Our retail subsidiaries operate in states that have an RPS in place and are required to procure a certain amount of power from renewable sources or purchase renewable energy credits in order to comply with the RPS requirements.
Miscellaneous
In addition to controls on air emissions, our power plants and the equipment necessary to support them are subject to other extensive federal, state and local laws and regulations adopted for the protection of the environment and to regulate land use. The laws and regulations applicable to us primarily involve the discharge of wastewater and the use of water, but can also include wetlands protection and preservation, protection of endangered species, hazardous materials handling and disposal, waste disposal and noise regulations. Noncompliance with environmental laws and regulations can result in the imposition of civil or criminal fines or penalties. In some instances, environmental laws may also impose clean-up or other remedial obligations in the event of a release of pollutants or contaminants into the environment. The following federal laws are among the more significant environmental laws that apply to us. In most cases, analogous state laws also exist that may impose similar and, in some cases, more stringent requirements on us than those discussed below. In general, our relatively clean portfolio as compared to our competitors affords us some advantage in complying with these laws.
Clean Water Act
The federal Clean Water Act establishes requirements relating to the discharge of pollutants into waters of the U.S., including from cooling water intake structures. We are required to obtain wastewater and storm water discharge permits for wastewater and runoff, respectively, for some of our power plants. We are subject to the requirements for cooling water intake structures at one of our power plants. In addition, we are required to maintain spill prevention control and countermeasure plans for some of our power plants. We believe that we are in compliance with applicable discharge requirements of the Clean Water Act.
In California, the EPA delegates the implementation of Section 316(b) to the California State Water Resources Control Board (“SWRCB”). The SWRCB has promulgated its own once-through cooling policy that establishes a schedule for once-through cooling units to install closed-cycle wet cooling (i.e., cooling towers) or reduce entrainment and impingement to comparable levels as would be achieved with a cooling tower, or be retired. The compliance dates for approximately 12,000 MW of once-through cooling capacity in California occur between 2012 and 2020. We do not anticipate that the SWRCB’s policy will have a negative effect on our operations, as none of our power plants in California utilize once-through cooling systems.
Safe Drinking Water Act
Part C of the Safe Drinking Water Act establishes the underground injection control program that regulates the disposal of wastes by means of deep well injection. Although geothermal production wells, which are wells that bring steam to the surface, are exempt under the Energy Policy Act of 2005 (“EPAct 2005”), we use geothermal re-injection wells to inject reclaimed wastewater back into the steam reservoir, which are subject to the underground injection control program. We believe that we are in compliance with Part C of the Safe Drinking Water Act.
Resource Conservation and Recovery Act
The Resource Conservation and Recovery Act (“RCRA”), regulates the management of solid and hazardous waste. With respect to our solid waste disposal practices at our power plants and steam fields located in The Geysers region of northern California, we are also subject to certain solid waste requirements under applicable California laws. We believe that our operations are in compliance with RCRA and related state laws.
28
Comprehensive Environmental Response, Compensation and Liability Act
The Comprehensive Environmental Response, Compensation and Liability Act (“CERCLA”), also referred to as the Superfund, requires cleanup of sites from which there has been a release or threatened release of hazardous substances, and authorizes the EPA to take any necessary response action at Superfund sites, including ordering potentially responsible parties liable for the release to pay for such actions. Potentially responsible parties are broadly defined under CERCLA to include past and present owners and operators of, as well as generators of, wastes sent to a site. As of the filing of this Report, we are not subject to any material liability for any Superfund matters. However, we generate certain wastes, including hazardous wastes, and send certain of our wastes to third party waste disposal sites. As a result, there can be no assurance that we will not incur a liability under CERCLA in the future.
Federal Litigation Regarding Liability for GHG Emissions
Litigation relating to common law tort liability for GHG emissions is working its way through the federal courts. While the U.S. Supreme Court has established that, in light of the EPA regulation of GHGs under the CAA, companies cannot be sued under federal common law theories of nuisance and negligence for their contribution to climate change, questions remain as to the viability of related state-law claims. In general, these state law-related claims have been unsuccessful in assigning tort liability for GHG emissions to power generators. We cannot predict the outcomes of these cases or what effect such cases, if successful, could have on our business.
Power and Natural Gas Matters
Federal Regulation of Power
FERC Jurisdiction
Electric utilities have been highly regulated by the federal government since the 1930s, principally under the Federal Power Act (“FPA”) and the U.S. Public Utility Holding Company Act of 1935. These statutes have been amended and supplemented by subsequent legislation, including PURPA, EPAct 2005, and PUHCA 2005. These particular statutes and regulations are discussed in more detail below.
The FPA grants the federal government broad authority over electric utilities and independent power producers, and vests its authority in the FERC. Unless otherwise exempt, any person that owns or operates facilities used for the wholesale sale or transmission of power in interstate commerce is a public utility subject to FERC’s jurisdiction. The FERC governs, among other things, the disposition of certain utility property, the issuance of securities by public utilities, the rates, the terms and conditions for the transmission or wholesale sale of power in interstate commerce, the interlocking directorates, and the uniform system of accounts and reporting requirements for public utilities.
The majority of our power plants are subject to FERC’s jurisdiction; however, certain power plants qualify for available exemptions. FERC’s jurisdiction over EWGs under the FPA applies to the majority of our power plants because they are EWGs or are owned by EWGs, except our EWGs located in ERCOT. Power plants located in ERCOT are exempt from many FERC regulations under the FPA. Many of our power plants that are not EWGs are operated as QFs under PURPA. Several of our affiliates have been granted authority to engage in sales at market-based rates and blanket authority to issue securities, and have also been granted certain waivers of FERC reporting and accounting regulations available to non-traditional public utilities; however, we cannot assure that such authorities or waivers will not be revoked for these affiliates or will be granted in the future to other affiliates.
FERC has the right to review books and records of “holding companies,” as defined in PUHCA 2005, that are determined by FERC to be relevant to the companies’ respective FERC-jurisdictional rates. We are considered a holding company, as defined in PUHCA 2005, by virtue of our control of the outstanding voting securities of our subsidiaries that own or operate power plants used for the generation of power for sale, or that are themselves holding companies. However, we are exempt from FERC’s books and records inspection rights pursuant to one of the limited exemptions under PUHCA 2005 as we are a holding company due solely to our owning one or more QFs, EWGs and Foreign Utility Companies (“FUCOs”). If any of our entities were not a QF, EWG or FUCO, then we and our holding company subsidiaries would be subject to the books and records access requirement.
FERC has civil penalty authority over violations of any provision of Part II of the FPA, as well as any rule or order issued thereunder. FERC is authorized to assess a maximum civil penalty of approximately $1.2 million per violation for each day that the violation continues. The FPA also provides for the assessment of criminal fines and imprisonment for violations under Part II of the FPA. This penalty authority was enhanced in EPAct 2005.
Pursuant to EPAct 2005, NERC has been certified by the FERC as the Electric Reliability Organization to develop and enforce reliability standards and critical infrastructure protection standards, which protect the bulk power system against potential
29
disruptions from cyber and physical security breaches. The NERC standards are applicable throughout the U.S. and are subject to FERC review and approval. FERC-approved reliability standards may be enforced by FERC independently, or, alternatively, by NERC and the regional reliability organizations with frontline responsibility for auditing, investigating and otherwise ensuring compliance with reliability standards, subject to FERC oversight. The critical infrastructure protection standards focus on controlling access to critical physical and cybersecurity assets, including supervisory control and data acquisition systems for the electric grid. Compliance with these standards is mandatory. Monetary penalties of approximately $1.2 million per day per violation may be assessed for violations of the reliability and critical infrastructure protection standards.
The composition of the FERC commissioners will change as a result of the new presidential administration. Cheryl LaFleur, a Democrat, was recently named Acting Chairman of the FERC, replacing Norman Bay, another Democrat. Shortly after the LaFleur announcement, Norman Bay announced that he would resign from the FERC, effective February 3, 2017. This leaves only two commissioners at the FERC which results in a lack of quorum that is required for the commissioners to issue orders. It is expected that Chairman LaFleur will delegate authority to the FERC staff to manage some issues, but it is expected that much of the FERC’s work will be delayed until additional commissioners are named by the President and confirmed by the U.S. Senate. With new commissioners, the FERC’s focus and direction will likely change, resulting in possible changes in the FERC’s policies and rules in the future, but we cannot predict at this time the effect those changes may have on our business.
State Regulation of Power
State Public Utility Commissions, or PUC(s), have historically had broad authority to regulate both the rates charged by, and the financial activities of, electric utilities operating in their states and to promulgate regulation for implementation of PURPA. Since all of our affiliates are either QFs or EWGs, none of our affiliates are currently subject to direct rate regulation by a state PUC. However, states may assert jurisdiction over the siting and construction of power generating facilities including QFs and EWGs and, with the exception of QFs, over the issuance of securities and the sale or other transfer of assets by these facilities. State PUCs also maintain extensive control over the procurement of wholesale power by the utilities that they regulate. Many of these utilities are our customers, and agreements between us and these counterparties often require approval by state PUCs.
Power Regions
The following is a brief overview of the most significant regulatory issues affecting our business in our core power regions – CAISO, ERCOT, PJM, ISO-NE and NYISO. The CAISO market is in our West segment. The ERCOT market is in our Texas segment. The PJM, ISO-NE and NYISO markets are in our East segment.
CAISO
The majority of our power plants in our West segment are located in California, in the CAISO region. We also own one power plant in Arizona and one in Oregon.
CAISO is responsible for ensuring the safe and reliable operation of the transmission grid within the bulk of California and providing open, nondiscriminatory transmission services. CAISO maintains various markets for wholesale sales of power, differentiated by time and type of electrical service, into which our subsidiaries may sell power from time to time. These markets are subject to various controls, such as price caps and mitigation of bids when transmission constraints arise. The controls and the markets themselves are subject to regulatory change at any time.
The CPUC and CAISO continue to evaluate capacity procurement policies and products for the California power market. With the expectation of significant increases in renewables, both entities are evaluating the need for operational flexibility, including the ability to start and ramp quickly as well as the ability to operate efficiently at low output levels or cycle off. We are an active participant in these discussions and support products and policies that would provide appropriate compensation for the required attributes. As these proceedings are ongoing, we cannot predict the ultimate effect on our financial condition, results of operations or cash flows, although we believe our fleet offers many features that can, and do, provide operational flexibility to the power markets.
In July 2016, we filed a protest with the FERC in response to a complaint filed against the CAISO on June 17, 2016, by the owner of a natural gas-fired power plant located in Kern County, California (“La Paloma”). Our protest requested the FERC to reject the relief sought in the complaint as a one-off solution to a larger problem and, rather, to convene a technical conference to consider whether the California wholesale power market allows modern, efficient natural gas-fired power plants that are needed for reliability and flexibility to recover their costs, including a return of, and on, capital and to consider necessary changes to the market structure to ensure revenue adequacy. On October 3, 2016, the FERC denied our request for a technical conference but encouraged the CAISO to continue an investigation into possible compensation for generation units that are needed but otherwise uneconomic to operate. The CAISO is increasingly concerned with the premature retirement of uneconomic generation resources. It is evaluating the viability of units it deems at risk of retirement in local, reliability constrained areas through its transmission
30
planning process. It is also considering modifications to the review and approval of compensation for units threatened by economic retirement, but needed for reliability under the Capacity Procurement Mechanism portion of its tariff.
ERCOT
ERCOT is the ISO that manages approximately 85% of Texas’ load and an electric grid covering about 75% of the state, overseeing transactions associated with Texas’ competitive wholesale and retail power markets. FERC does not regulate wholesale sales of power in ERCOT. The PUCT exercises regulatory jurisdiction over the rates and services of any electric utility conducting business within Texas. Our subsidiaries that own power plants in Texas have power generation company status at the PUCT, and are either EWGs or QFs and are exempt from PUCT rate regulation. ERCOT ensures resource adequacy through an energy-only model. In ERCOT, there is a market offer price cap for energy and capacity services purchased by ERCOT. Under certain market conditions, the offer cap could be lower. Our subsidiaries are subject to the offer cap rules, but only for sales of power and capacity services to ERCOT.
The PUCT is considering changes regarding its approach to resource adequacy, including price formation and scarcity pricing as operating reserves decline. ERCOT successfully launched the Operating Reserve Demand Curve (“ORDC”) functionality on June 1, 2014. This application produces a price “adder” to the clearing price of energy that increases as reserve capacity declines. The PUCT requested a review of the effectiveness of the ORDC and requested input from ERCOT and market participants, including any recommendations to improve the ORDC. The PUCT continues to consider the appropriate reliability standard that should be used to set ERCOT’s planning reserve margin. As these proceedings are ongoing and the timing of these changes is uncertain, we cannot predict the ultimate effect on our financial condition, results of operations or cash flows.
PJM
PJM operates wholesale power markets, a locationally based energy market, a forward capacity market and ancillary service markets. PJM also performs transmission planning and operation for the region. The rules and regulations affecting PJM power markets and transmission are subject to change at any time.
PJM experienced several unusual cold weather events during January 2014. PJM maintained system reliability, but the system was challenged. In order to address some of these challenges, PJM filed proposed capacity market rule changes in December 2014 which include much stronger performance incentives and more significant penalties for failure to perform during emergency power system conditions. The FERC approved PJM’s proposed changes with minor alterations. Additional risk premiums associated with the capacity market rule changes are expected to produce commensurately higher capacity market prices and appear to have done so to date. Several entities have appealed the FERC’s orders approving PJM’s capacity market rule changes. The appellate case is pending. We support PJM’s capacity market rule changes and believe that, overall, they enhance the competitiveness and reliability of the PJM power market.
In Ohio, after FirstEnergy Corp. (“FE”) submitted various proposals to the Public Utility Commission of Ohio (“PUCO”) to enhance its generation company revenue, the PUCO approved a Distribution Modernization Rider (“DMR”) for the FE utilities that results in approximately $200 million per year for three years of ratepayer subsidized payments to FE. The PUCO’s order approving the DMR has been challenged by several parties. Appeals to the Ohio Supreme Court remain pending. In a related move, the Ohio Utilities, led by American Electric Power, Inc. and FE, have indicated their intentions to advocate for some form of re-regulation in this year’s legislative session which began on January 3, 2017. Re-regulation will require enabling legislation, and to date no proposal has been made public by the utilities.
Over significant opposition, the Illinois legislature voted to approve an out-of-market nuclear subsidy scheme put forward by Exelon Corporation (“Exelon”). Zero emission credits are to be paid to Exelon’s nuclear units beginning with the planning year commencing June 1, 2017. It is expected that the legislation will be challenged in court, although we cannot predict the outcome of any possible litigation. If left unchecked, we believe these subsidies will adversely affect the power markets in PJM by artificially suppressing prices.
ISO-NE
We have three power plants in our East segment located in Massachusetts, Maine and New Hampshire, all of which participate in the regional wholesale market in which ISO-NE is the RTO. ISO-NE has broad authority over the day-to-day operation of the transmission system and, among other responsibilities, operates a day-ahead and real-time wholesale energy market, a forward capacity market and an ancillary services market.
ISO-NE has requested that the FERC approve a revised Cost of New Entry (“Net CONE”) parameter for Forward Capacity Auctions beginning in 2018 which is lower than the previous Net CONE. The potential effect on our business is currently unknown.
31
In 2016, Massachusetts passed legislation mandating the issuance of Requests for Proposals for up to 2,800 MW of renewable generation including hydro and offshore wind that would be procured under long-term contracts. Massachusetts is also considering the procurement of up to 600 MW of storage resources under the provisions of the 2016 energy bill. As the provisions of the legislation are still being finalized, we cannot predict the ultimate effect on our financial condition, results of operations or cash flows.
NYISO
We have five power plants in our East segment located in New York where NYISO is the RTO which manages the transmission system in New York and operates the state’s wholesale power markets. NYISO manages both day-ahead and real-time energy markets using a locationally based marginal pricing mechanism that pays each generator the zonal marginally accepted bid price for the energy it produces.
On August 1, 2016, the New York State Public Service Commission (“PSC”) approved the Clean Energy Standard which requires 50% of the state’s generation to be produced by renewable resources by 2030. In addition, the Clean Energy Standard provides for out-of-market financial subsidies for some of the state’s existing nuclear generation facilities. In October 2016, a group of generators and our trade association, the Electric Power Supply Association, filed a lawsuit in federal court challenging the PSC’s ruling on constitution grounds. We cannot predict the outcome of that litigation, but if left unchecked, we believe these subsidies will adversely affect the power markets in NYISO by artificially suppressing prices.
Regulation of Transportation and Sale of Natural Gas
Since the majority of our power generating capacity is derived from natural gas-fired power plants, we are broadly affected by federal regulation of natural gas transportation and sales. Furthermore, one of our natural gas transportation pipelines in Texas is subject to dual jurisdiction by the FERC and the Texas Railroad Commission. This pipeline is an intrastate pipeline within the meaning of Section 2(16) of the Natural Gas Policy Act (“NGPA”). FERC regulates the rates charged by this pipeline for transportation services performed under Section 311 of the NGPA, and the Texas Railroad Commission regulates the rates and services provided by this pipeline as a gas utility in Texas. We also own a pipeline in Texas that is subject to the Texas Railroad Commission regulation as a Texas gas utility.
We also operate a proprietary pipeline system in California, which is regulated by the U.S. Department of Transportation and the Pipeline and Hazardous Materials Safety Administration with regard to safety matters. Additionally, some of our power plants own and operate short pipeline laterals that connect the natural gas-fired power plants to the North American natural gas grid. Some of these laterals are subject to state and/or federal safety regulations.
The FERC has civil penalty authority for violations of the Natural Gas Act (“NGA”) and NGPA, as well as any rule or order issued thereunder. The FERC’s regulations specifically prohibit the manipulation of the natural gas markets by making it unlawful for any entity in connection with the purchase or sale of natural gas, or the purchase or sale of transportation service under the FERC’s jurisdiction, to engage in fraudulent or deceptive practices. Similar to its penalty authority under the FPA described above, the FERC is authorized to assess a maximum civil penalty of approximately $1.2 million per violation for each day that the violation continues. The NGA and NGPA also provide for the assessment of criminal fines and imprisonment time for violations.
Federal Regulation of Futures and Other Derivatives
CFTC Regulation of Futures Transactions
The CFTC has regulatory oversight of the futures markets, including trading on NYMEX for energy, and licensed futures professionals such as brokers, clearing members and large traders. In connection with its oversight of the futures markets and NYMEX, the CFTC regularly investigates market irregularities and potential manipulation of those markets. Recent laws also give the CFTC certain powers with respect to broker-type markets referred to as “exempt commercial markets” or ECMs, including the Intercontinental Exchange. The CFTC monitors activities in the OTC, ECM and physical markets that may be undertaken for the purpose of influencing futures prices. With respect to ECMs, the CFTC exercises only light-handed regulation primarily related to trade reporting, price dissemination and record retention (including retention of fraudulent claims and allegations).
The Dodd-Frank Wall Street Reform and Consumer Protection Act of 2010
CFTC Regulation of Derivatives Transactions
The Dodd-Frank Act, which was signed into law on July 21, 2010, contains a variety of provisions designed to regulate financial markets, including credit and derivatives transactions. Title VII of the Dodd-Frank Act addresses regulatory reform of the OTC derivatives market in the U.S. and significantly changes the regulatory framework of this market. Certain Title VII
32
regulations have been finalized and are effective though some regulations remain subject to a delayed compliance schedule. Other key regulations have not been finalized as of this time or remain in draft form. Until all of these regulations have been finalized, the extent to which the provisions of Title VII might affect our derivatives activities cannot be completely known.
While we are closely monitoring this rulemaking process from the CFTC (including related no-action relief, interpretations and orders), we have reviewed and assessed the effect of the CFTC’s Title VII regulations on our business and related processes, and we have adjusted our internal procedures where necessary to comply with the applicable statutory law and related Title VII regulations which are effective at this time. We will continue to monitor all relevant developments and rulemaking initiatives and expect to successfully implement any new applicable requirements.
EMPLOYEES
At December 31, 2016, we employed 2,372 full-time employees, of whom 184 were represented by collective bargaining agreements. Two collective bargaining agreements, representing a total of 44 employees, will expire within one year. We have never experienced a work stoppage or a strike.
Item 1A. | Risk Factors |
Commercial Operations
Our financial performance is affected by price fluctuations in the wholesale power and natural gas markets and other market factors that are beyond our control.
Market prices for power, generation capacity, ancillary services, natural gas and fuel oil are unpredictable and fluctuate substantially. Unlike most other commodities, power can only be stored on a very limited basis and generally must be produced concurrently with its use. As a result, power prices are subject to significant volatility due to supply and demand imbalances, especially in the day-ahead and spot markets. Long- and short-term power and natural gas prices may also fluctuate substantially due to other factors outside of our control, including:
• | increases and decreases in generation capacity in our markets, including the addition of new supplies of power as a result of the development of new power plants, expansion of existing power plants or additional transmission capacity; |
• | changes in power transmission or fuel transportation capacity constraints or inefficiencies; |
• | power supply disruptions, including power plant outages and transmission disruptions; |
• | weather conditions, particularly unusually mild summers or warm winters in our market areas; |
• | quarterly and seasonal fluctuations; |
• | an economic downturn which could negatively affect demand for power; |
• | changes in the supply of commodities, including but not limited to coal, natural gas and fuel oil; |
• | changes in the demand for power or in patterns of power usage, including the potential development of demand-side management tools and practices; |
• | development of new fuels or new technologies for the production or storage of power; |
• | federal and state regulations and actions of the ISOs; |
• | federal and state power, market and environmental regulation and legislation, including mandating an RPS or creating financial incentives, each resulting in new renewable energy generation capacity creating oversupply; |
• | changes in prices related to RECs and other environmental allowance products; and |
• | changes in capacity prices and capacity markets. |
These factors have caused our operating results to fluctuate in the past and will continue to cause them to do so in the future.
Our revenues and results of operations depend on market rules, regulation and other forces beyond our control.
Our revenues and results of operations are influenced by factors that are beyond our control, including:
• | rate caps, price limitations and bidding rules imposed by ISOs, RTOs and other market regulators that may impair our ability to recover our costs and limit our return on our capital investments; |
• | regulations promulgated by the FERC and the CFTC; |
33
• | sufficient liquidity in the forward commodity markets to conduct our hedging activities; |
• | some of our competitors (mainly utilities) receive entitlement-guaranteed rates of return on their capital investments, with returns that exceed market returns and may affect our ability to sell our power at economical rates; |
• | structure and operating characteristics of our capacity markets such as our PJM capacity auctions and our NYISO markets; and |
• | regulations and market rules related to our RECs. |
Accounting for our hedging activities may increase the volatility in our quarterly and annual financial results.
We engage in commodity-related marketing and price-risk management activities in order to economically hedge our exposure to market risk with respect to power sales from our power plants, fuel utilized by those assets and emission allowances. We generally attempt to balance our fixed-price physical and financial purchases, and sales commitments in terms of contract volumes and the timing of performance and delivery obligations through the use of financial and physical derivative contracts. These derivatives are accounted for under U.S. GAAP, which requires us to record all derivatives on the balance sheet at fair value unless they qualify for, and we elect, the normal purchase normal sale exemption. As a result, we are unable to accurately predict the effect that our risk management decisions may have on our quarterly and annual financial results.
The use of hedging agreements may not work as planned or fully protect us and could result in financial losses.
We typically enter into hedging agreements, including contracts to purchase or sell commodities at future dates and at fixed prices, in order to manage our commodity price risks. These activities, although intended to mitigate price volatility, expose us to risks related to commodity price movements, deviations in weather and other risks. When we sell power forward, we may be required to post significant amounts of cash collateral or other credit support to our counterparties, and we give up the opportunity to sell power at higher prices if spot prices are higher in the future. Further, if the values of the financial contracts change in a manner that we do not anticipate, or if a counterparty or customer fails to perform under a contract, it could harm our financial condition, results of operations and cash flows.
We do not typically hedge the entire exposure of our operations against commodity price volatility. To the extent we do not hedge against commodity price volatility, our financial condition, results of operations and cash flows may be diminished based upon adverse movement in commodity prices.
In addition, we have various internal policies and procedures designed to monitor hedging activities and positions. These policies and procedures are designed, in part, to prevent unauthorized purchases or sales of products by our employees. We cannot assure, however, that these steps will detect and prevent all violations of our Risk Management Policy, particularly if deception or other intentional misconduct is involved. A significant policy violation that is not detected could result in a material financial loss for us.
Our ability to enter into hedging agreements and manage our counterparty and customer credit risk could adversely affect us.
Our wholesale counterparties, retail customers and suppliers may experience deteriorating credit. These conditions could cause counterparties in the natural gas and power markets, particularly in the energy commodity derivative markets that we rely on for our hedging activities, to withdraw from participation in those markets. If multiple parties withdraw from those markets, market liquidity may be threatened, which in turn could adversely affect our business and create more volatility in our earnings. Additionally, these conditions may cause our counterparties or customers to seek bankruptcy protection under Chapter 11 or liquidation under Chapter 7 of the U.S. Bankruptcy Code. Our credit risk may be exacerbated to the extent collateral held by us cannot be realized or is liquidated at prices not sufficient to recover the full amount of the exposure due to us. There can be no assurance that any such losses or impairments to the carrying value of our financial assets would not materially and adversely affect our financial condition, results of operations and cash flows.
Competition in the power generation industry could adversely affect our performance.
The power generation industry is characterized by intense competition, and we encounter competition from utilities, industrial companies, marketing and trading companies and other independent power producers. This competition has put pressure on power utilities to lower their costs, including the cost of purchased power, and increasing competition in the supply of power in the future could increase this pressure. In addition, construction during the last decade has created excess power supply and higher reserve margins in the power trading markets, putting downward pressure on prices.
34
Other companies we compete with may have greater liquidity, greater access to credit and other financial resources, lower cost structures, greater ability to incur losses, longer-standing relationships with customers, greater potential for profitability from ancillary services or greater flexibility in the timing of their sale of generation capacity and ancillary services than we do.
In certain situations, our PPAs and other contractual arrangements, including construction agreements, commodity contracts, maintenance agreements and other arrangements, may be terminated by the counterparty or customer and/or may allow the counterparty or customer to seek liquidated damages.
The situations that could allow a counterparty or customer to terminate the contract and/or seek liquidated damages include:
• | the cessation or abandonment of the development, construction, maintenance or operation of a power plant; |
• | failure of a power plant to achieve construction milestones or commercial operation by agreed-upon deadlines; |
• | failure of a power plant to achieve certain output or efficiency minimums; |
• | our failure to make any of the payments owed to the counterparty or to establish, maintain, restore, extend the term of or increase any required collateral; |
• | failure of a power plant to obtain material permits and regulatory approvals by agreed-upon deadlines; |
• | a material breach of a representation or warranty or our failure to observe, comply with or perform any other material obligation under the contract; or |
• | events of liquidation, dissolution, insolvency or bankruptcy. |
Revenue may be reduced significantly upon expiration or termination of our PPAs.
Some of the capacity from our existing portfolio is sold under long-term PPAs that expire at various times. We seek to sell any capacity not sold under long-term PPAs, on a short-term basis as market opportunities arise. Our non-contracted capacity is generally sold on the spot market at current market prices as merchant energy. When the terms of each of our various PPAs expire, it is possible that the price paid to us for the generation of power under subsequent arrangements or in short-term markets may be significantly less than the price that had been paid to us under the PPA. Power plants without long-term PPAs involve risk and uncertainty in forecasting future demand load for merchant sales because they are exposed to market fluctuations for some or all of their generating capacity and output. A significant under- or over-estimation of load requirements may increase our operating costs. Without the benefit of long-term PPAs, we may not be able to sell any or all of the capacity from these power plants at commercially attractive rates and these power plants may not be able to operate profitably. Certain of our PPAs have values in excess of current market prices. We are at risk of loss of margins to the extent that these contracts expire or are terminated and we are unable to replace them on comparable terms. Additionally, our PPAs contain termination provisions standard to contracts in our industry such as negligence, performance default or prolonged events of force majeure.
Our retail subsidiaries may experience customer attrition or may not be able to originate new business at the same levels as in the past which could adversely affect our performance.
There is extensive competition in the retail power markets in which our retail subsidiaries operate. Competitors may offer lower prices or other incentives which may attract customers away from our retail subsidiaries. We may also face competition from a number of other energy service providers, other energy industry participants, or nationally branded providers of consumer products and services who may develop business that will compete with our retail subsidiaries.
The introduction or expansion of competing technologies for power generation and demand-side management tools could adversely affect our performance.
The power generation business has seen a substantial change in the technologies used to produce power. With federal and state incentives for the development and production of renewable sources of power, we have seen market penetration of competing technologies, such as wind, solar, and commercial-sized power storage. Additionally, the development of demand-side management tools and practices can effect peak demand requirements for some of our markets at certain times during the year. The continued development of subsidized, competing power generation technologies and significant development of demand-side management tools and practices could alter the market and price structure for power and negatively affect our financial condition, results of operations and cash flows.
35
Power Operations
Our power generating operations performance involves significant risks and hazards and may be below expected levels of output or efficiency.
The operation of power plants involves risks, including the breakdown or failure of power generation equipment, transmission lines, pipelines or other equipment or processes, performance below expected levels of output or efficiency and risks related to the creditworthiness of our contract counterparties and the creditworthiness of our counterparties’ customers or other parties, such as steam hosts, with whom our counterparties have contracted. From time to time our power plants have experienced unplanned outages, including extensions of scheduled outages due to equipment breakdowns, failures or other problems which are an inherent risk of our business. Unplanned outages typically can result in lost revenues, increase our maintenance expenses and may reduce our profitability, which could have a material adverse effect on our financial condition, results of operations and cash flows.
In addition, an unplanned outage may prevent the affected power plant from performing under any applicable PPAs, commodity contracts or other contractual arrangements. Such failure may allow a counterparty to terminate an agreement and/or seek liquidated damages, and we could incur costs to cover our hedges. Although insurance is maintained to partially protect against operating risks, the proceeds of insurance may not be adequate to cover lost revenues or increased expenses. As a result, we could be unable to service principal and interest payments under, or may otherwise breach, our financing obligations, particularly with respect to the affected power plant, which could result in losing our interest in the affected power plant or, possibly, one or more other power plants.
We may be subject to future claims, litigation and enforcement.
Our power generating operations are inherently hazardous and may lead to catastrophic events, including loss of life, personal injury and destruction of property, and subject us to litigation. Natural gas is highly explosive and power generation involves hazardous activities, including acquiring, transporting and delivering fuel, operating large pieces of rotating equipment and delivering power to transmission and distribution systems. These and other hazards can cause severe damage to and destruction of property, plant and equipment and suspension of operations. In the worst circumstances, catastrophic events can cause significant personal injury or loss of life. Further, the occurrence of any one of these events may result in us being named as a defendant in lawsuits asserting claims for substantial damages. We maintain an amount of insurance protection that we consider adequate; however, we cannot provide any assurance that the insurance will be sufficient or effective under all circumstances and against all hazards or liabilities to which we are subject.
Additionally, we are party to various litigation matters, including regulatory and administrative proceedings arising out of the normal course of business. We review our litigation activities and determine if an unfavorable outcome to us is considered “remote,” “reasonably possible” or “probable” as defined by U.S. GAAP. Where we have determined an unfavorable outcome is probable and is reasonably estimable, we accrue for potential litigation losses. A successful claim against us that is not fully insured could be material. The liability we may ultimately incur with respect to such litigation matters, in the event of a negative outcome, may be in excess of amounts currently accrued, if any. Where we determine an unfavorable outcome is not probable or reasonably estimable, we do not accrue for any potential litigation loss. The ultimate outcome of these litigation matters cannot presently be determined, nor can the liability that could potentially result from a negative outcome be reasonably estimated. As a result, we give no assurance that such litigation matters would, individually or in the aggregate, not have a material adverse effect on our financial condition, results of operations or cash flows. See also Note 15 of the Notes to Consolidated Financial Statements for a description of our more significant litigation matters.
We rely on power transmission and fuel distribution facilities owned and operated by other companies.
We depend on facilities and assets that we do not own or control for the transmission to our customers of the power produced by our power plants and the distribution of natural gas fuel or fuel oil to our power plants. If these transmission and distribution systems are disrupted or capacity on those systems is inadequate, our ability to sell and deliver power products or obtain fuel may be hindered. ISOs that oversee transmission systems in regional power markets have imposed price limitations and other mechanisms to address volatility in their power markets. Existing congestion, as well as expansion of transmission systems, could affect our performance, which in turn could adversely affect our business.
Our power project development and construction activities involve risk and may not be successful.
The development and construction of power plants is subject to substantial risks. In connection with the development of a power plant, we must generally obtain:
36
• | necessary power generation equipment; |
• | governmental permits and approvals including environmental permits and approvals; |
• | fuel supply and transportation agreements; |
• | sufficient equity capital and debt financing; |
• | power transmission agreements; |
• | water supply and wastewater discharge agreements or permits; and |
• | site agreements and construction contracts. |
To the extent that our development and construction activities continue or expand, we may be unsuccessful on a timely and profitable basis. Although we may attempt to minimize the financial risks of these activities by securing a favorable PPA and arranging adequate financing prior to the commencement of construction, the development of a power project may require us to expend significant cash sums for preliminary engineering, permitting, legal and other expenses before we can determine whether a project is feasible, economically attractive or financeable. The process for obtaining governmental permits and approvals is complicated and lengthy, often taking more than one year, and is subject to significant uncertainties. We may be unable to obtain all necessary licenses, permits, approvals and certificates for proposed projects, and completed power plants may not comply with all applicable permit conditions, statutes or regulations. In addition, regulatory compliance for the construction and operation of our power plants can be a costly and time-consuming process. Intricate and changing environmental and other regulatory requirements may necessitate substantial expenditures to obtain and maintain permits. If a project is unable to function as planned due to changing requirements, loss of required permits or regulatory status or local opposition, it may create expensive delays, extended periods of non-operation or significant loss of value in a project resulting in potential impairments.
We may be unable to obtain an adequate supply of fuel in the future.
We obtain substantially all of our physical natural gas and fuel oil supply from third parties pursuant to arrangements that vary in term, pricing structure, firmness and delivery flexibility. Our physical natural gas and fuel oil supply arrangements must be coordinated with transportation agreements, balancing agreements, storage services, financial hedging transactions and other contracts so that the natural gas and fuel oil is delivered to our power plants at the times, in the quantities and otherwise in a manner that meets the needs of our generation portfolio and our customers. We must also comply with laws and regulations governing natural gas transportation.
Additionally, the PJM power market has recently experienced an increase in natural gas-fired generation assets that supply electricity to the area. As a result, there has been a corresponding increase in the need for natural gas transmission assets to supply the generation assets with fuel to generate power. When extreme cold temperatures rapidly increase the demand for natural gas used for residential heating, it can also create constraints on natural gas pipelines that serve power generation assets. When these conditions exist, it could interrupt the fuel supply to our natural gas-fired power plants in the PJM power market, although some of our natural gas-fired power plants in this region are dual-fuel and benefit from the ability to operate on both natural gas and fuel oil.
While adequate supplies of natural gas and fuel oil are currently available to us at prices we believe are reasonable for each of our power plants, we are exposed to increases in the price of natural gas and fuel oil, and it is possible that sufficient supplies to operate our portfolio profitably may not continue to be available to us. In addition, we face risks with regard to the delivery to and the use of natural gas and fuel oil by our power plants including the following:
• | transportation may be unavailable if pipeline infrastructure is damaged or disabled; |
• | pipeline tariff changes may adversely affect our ability to, or cost to, deliver natural gas and fuel oil supply; |
• | third-party suppliers may default on natural gas supply obligations, and we may be unable to replace supplies currently under contract; |
• | market liquidity for physical natural gas and fuel oil or availability of natural gas and fuel oil services (e.g. storage) may be insufficient or available only at prices that are not acceptable to us; |
• | natural gas and fuel oil quality variation may adversely affect our power plant operations; |
• | our natural gas and fuel oil operations capability may be compromised due to various events such as natural disaster, loss of key personnel or loss of critical infrastructure; |
• | fuel supplies diverted to residential heating for humanitarian reasons; and |
37
• | any other reasons. |
Our power plants and construction projects are subject to impairments.
If we were to experience a significant reduction in our expected revenues and operating cash flows for an extended period of time from a prolonged economic downturn or from advances or changes in technologies, we could experience future impairments of our power plant assets as a result. There can be no assurance that any such losses or impairments to the carrying value of our financial assets would not have a material adverse effect on our financial condition, results of operations and cash flows.
Our geothermal power reserves may be inadequate for our operations.
In connection with each geothermal power plant, we estimate the productivity of the geothermal resource and the expected decline in productivity. The productivity of a geothermal resource may decline more than anticipated, resulting in insufficient reserves being available for sustained generation of the power capacity desired. In addition, we may not be able to successfully manage the development and operation of our geothermal reservoirs or accurately estimate the quantity or productivity of our steam reserves. An incorrect estimate or inability to manage our geothermal reserves or a decline in productivity could adversely affect our results of operations or financial condition. In addition, the development and operation of geothermal power resources are subject to substantial risks and uncertainties. The successful exploitation of a geothermal power resource ultimately depends upon many factors including the following:
• | the heat content of the extractable steam or fluids; |
• | the geology of the reservoir; |
• | the total amount of recoverable reserves; |
• | operating expenses relating to the extraction of steam or fluids; |
• | price levels relating to the extraction of steam, fluids or power generated; and |
• | capital expenditure requirements relating primarily to the drilling of new wells. |
Significant events beyond our control, such as natural disasters, including weather-related events, or acts of terrorism (including cyber attacks), could damage our power plants or our corporate offices or cause a loss of system load and may affect us in unpredictable ways.
Certain of our geothermal and natural gas-fired power plants, particularly in the West, are subject to frequent low-level seismic disturbances and a persistent risk of wildfires, such as the September 2015 wildfire incident at our Geysers Assets in Lake and Sonoma Counties, California, affecting five of our power plants in the region. More significant seismic disturbances are possible. In addition, other areas in which we operate, particularly in Texas and the Southeast, experience tornados and hurricanes. Operations at our corporate offices in Houston, Texas could be substantially affected by a hurricane. Any significant loss of system load resulting from a weather-related event could negatively affect our wholesale business and retail subsidiaries. Such events could damage or shut down our power plants, power transmission or the fuel supply facilities upon which our wholesale business and retail subsidiaries are dependent. Our existing power plants are built to withstand relatively significant levels of seismic and other disturbances, and we believe we maintain adequate insurance protection. However, earthquake, property damage or business interruption insurance may be inadequate to cover all potential losses sustained in the event of serious damages to our power plants or disruptions to our wholesale and retail operations due to natural disasters.
In addition to physical damage to our power plants, the risk of future terrorist activity (including cyber attacks) could result in adverse changes in the insurance markets and disruptions in the power and fuel markets. These events could also adversely affect the U.S. economy, create instability in the financial markets and, as a result, have an adverse effect on our ability to access capital on terms and conditions acceptable to us.
Our business, financial condition and results of operations could be adversely affected by strikes or work stoppages by unionized employees or by our inability to replace key employees.
Approximately 8% of our employees are subject to collective bargaining agreements. In the event that our union employees participate in a strike, work stoppage or engage in other forms of labor disruption, we would be responsible for procuring replacement labor and could experience reduced power generation or outages.
In addition, our success is largely dependent on the skills, experience and efforts of our people. The loss of the services of one or more members of our senior management or of numerous employees with critical skills could have a negative effect on our business, financial condition and results of operations and future growth if we were unable to replace them.
38
We depend on computer and telecommunications systems we do not own or control and failures in our systems or a cybersecurity attack or breach of our IT systems or technology could significantly disrupt our business operations or result in sensitive customer information being compromised which would negatively materially affect our reputation and/or results of operations.
We have entered into agreements with third parties for hardware, software, telecommunications and other information technology services in connection with the operation of our power plants. In addition, we have developed proprietary software systems, management techniques and other information technologies incorporating software licensed from third parties. We also rely on software systems owned and operated by third parties, such as ISOs and RTOs, to be functioning in order to be able to transmit the electricity produced by our power plants to our customers. It is possible we or a third party that we rely on could incur interruptions from a loss of communications, hardware or software failures, a cybersecurity attack or a breach of our IT systems or technology, computer viruses or malware. We believe that we have positive relations with our vendors and maintain adequate anti-virus and malware software and controls; however, any interruptions to our arrangements with third parties, to our computing and communications infrastructure, or to our information systems or any of those operated by a third party that we rely on could significantly disrupt our business operations.
A cyber attack of our systems or networks that impairs our information technology systems could disrupt our business operations and result in loss of service to customers. We have a comprehensive cybersecurity program designed to protect and preserve the integrity of our information technology systems. We have experienced and expect to continue to experience actual or attempted cyber attacks of our IT systems or networks; however, none of these actual or attempted cyber attacks has had a material effect on our operations or financial condition.
Additionally, our retail subsidiaries require access to sensitive customer information in the ordinary course of business. If a significant data breach occurred, the reputation of our retail subsidiaries may be adversely affected, customer confidence may be diminished, or our retail subsidiaries may be subject to legal claims, any of which may contribute to the loss of customers and have a material adverse effect on our retail subsidiaries.
Capital Resources; Liquidity
We have substantial liquidity needs and could face liquidity pressure.
As of December 31, 2016, our consolidated debt outstanding was $12.2 billion, of which approximately $8.9 billion was outstanding under our Senior Unsecured Notes, First Lien Term Loans and First Lien Notes. In addition, we had $991 million issued in letters of credit and our pro rata share of unconsolidated subsidiary debt was approximately $130 million. Although we significantly extended our maturities during the last several years, we could face liquidity challenges as we continue to have substantial debt and substantial liquidity needs in the operation of our business. Our ability to make payments on our indebtedness, to meet margin requirements and to fund planned capital expenditures and development efforts will depend on our ability to generate cash in the future from our operations and our ability to access the capital markets. This, to a certain extent, is dependent upon industry conditions, as well as general economic, financial, competitive, legislative, regulatory and other factors that are beyond our control, as discussed further in “— Commercial Operations” above. Although we are permitted to enter into new project financing credit facilities to fund our development and construction activities, there can be no assurance that we will not face liquidity pressure in the future.
We also have exposure to many different financial institutions and counterparties including those under our Senior Unsecured Notes, First Lien Term Loans, First Lien Notes, Corporate Revolving Facility and other credit and financing arrangements as we routinely execute transactions in connection with our hedging and optimization activities, including brokers and dealers, commercial banks, investment banks and other institutions and industry participants. Many of these transactions expose us to credit risk in the event that any of our lenders or counterparties are unable to honor their commitments or otherwise default under a financing agreement. See additional discussion regarding our capital resources and liquidity in Item 7. “Management’s Discussion and Analysis of Financial Condition and Results of Operations — Liquidity and Capital Resources.”
Our indebtedness could adversely affect our financial health and limit our operations.
Our indebtedness has important consequences, including:
• | limiting our ability to borrow additional amounts for working capital, capital expenditures, debt service requirements, potential growth or other purposes; |
• | limiting our ability to use operating cash flows in other areas of our business because we must dedicate a substantial portion of these funds to service our debt; |
39
• | increasing our vulnerability to general adverse economic and industry conditions; |
• | limiting our ability to capitalize on business opportunities and to react to competitive pressures and adverse changes in governmental regulation; |
• | limiting our ability or increasing the costs to refinance indebtedness or to repurchase equity issued by certain of our subsidiaries to third parties; and |
• | limiting our ability to enter into marketing, hedging and optimization activities by reducing the number of counterparties with whom we can transact as well as the volume and type of those transactions. |
We may be unable to obtain additional financing or access the credit and capital markets in the future at prices that are beneficial to us or at all.
If our available cash, including future cash flows generated from operations, is not sufficient in the near term to finance our operations, post collateral or satisfy our obligations as they become due, we may need to access the capital and credit markets. Our ability to arrange financing (including any extension or refinancing) and the cost of the financing is dependent upon numerous factors, including general economic and capital market conditions. Market disruptions such as those experienced in the U.S. and abroad in recent years, may increase our cost of borrowing or adversely affect our ability to access capital. In addition, we believe these conditions have and may continue to have an adverse effect on the price of our common stock, which in turn may also reduce our ability to access capital or credit markets. Other factors include:
• | low credit ratings may prevent us from obtaining any material amount of additional debt financing; |
• | conditions in energy commodity markets; |
• | regulatory developments; |
• | credit availability from banks or other lenders for us and our industry peers; |
• | investor confidence in the industry and in us; |
• | the continued reliable operation of our current power plants; and |
• | provisions of tax, regulatory and securities laws that are conducive to raising capital. |
While we have utilized non-recourse or lease financing when appropriate, market conditions and other factors may prevent us from completing similar financings in the future. It is possible that we may be unable to obtain the financing required to develop, construct, acquire or expand power plants on terms satisfactory to us. We have financed our existing power plants using a variety of leveraged financing structures, including senior secured and unsecured indebtedness, construction financing, project financing, term loans and lease obligations. In the event of a default under a financing agreement which we do not cure, the lenders or lessors would generally have rights to the power plant and any related assets. In the event of foreclosure after a default, we may not be able to retain any interest in the power plant or other collateral supporting such financing. In addition, any such default or foreclosure may trigger cross default provisions in our other financing agreements.
Our Senior Unsecured Notes, First Lien Term Loans, First Lien Notes, Corporate Revolving Facility, CCFC Term Loans and our other debt instruments impose restrictions on us and any failure to comply with these restrictions could have a material adverse effect on our liquidity and our operations.
The restrictions under our Senior Unsecured Notes, First Lien Term Loans, First Lien Notes, Corporate Revolving Facility, CCFC Term Loans and other debt instruments could adversely affect us by limiting our ability to plan for or react to market conditions or to meet our capital needs and, if we were unable to comply with these restrictions, could result in an event of default under these debt instruments. These restrictions require us to meet certain financial performance tests on a quarterly basis and limit or prohibit our ability, subject to certain exceptions to, among other things:
• | incur or guarantee additional first lien indebtedness up to certain consolidated net tangible asset ratios; |
• | enter into certain types of commodity hedge agreements that can be secured by first lien collateral; |
• | enter into sale and leaseback transactions; |
• | make certain investments; |
• | create or incur liens; |
• | consolidate or merge with or transfer all or substantially all of our assets to another entity, or allow substantially all of our subsidiaries to do so; |
40
• | lease, transfer or sell assets and use proceeds of permitted asset leases, transfers or sales; |
• | engage in certain business activities; and |
• | enter into certain transactions with our affiliates. |
Our Senior Unsecured Notes, First Lien Term Loans, First Lien Notes, Corporate Revolving Facility, CCFC Term Loans and our other debt instruments contain events of default customary for financings of their type, including a cross default to debt other than non-recourse project financing debt, a cross-acceleration to non-recourse project financing debt and certain change of control events. If we fail to comply with the covenants and are unable to obtain a waiver or amendment, or a default exists and is continuing under such debt, the lenders or the holders or trustee of the First Lien Notes, as applicable, could give notice and declare outstanding borrowings and other obligations under such debt immediately due and payable.
Our ability to comply with these covenants may be affected by events beyond our control, and any material deviations from our forecasts could require us to seek waivers or amendments of covenants or alternative sources of financing or to reduce expenditures. We may not be able to obtain such waivers, amendments or alternative financing, or if obtainable, it could be on terms that are not acceptable to us. If we are unable to comply with the terms of our Senior Unsecured Notes, First Lien Term Loans, First Lien Notes, Corporate Revolving Facility, CCFC Term Loans and our other debt instruments, or if we fail to generate sufficient cash flows from operations, or if it becomes necessary to obtain such waivers, amendments or alternative financing, it could adversely affect our financial condition, results of operations and cash flows.
Our credit status is below investment grade, which may restrict our operations, increase our liquidity requirements and restrict financing opportunities.
There are a number of factors that rating agencies evaluate to arrive at credit ratings for us and our subsidiaries, including regulatory framework, ability to recover costs and earn returns, diversification, financial strength and liquidity. If one or more rating agencies downgrade us, borrowing costs would increase, the potential pool of investors and funding sources would likely decrease, and cash or letter of credit collateral demands may be triggered by the terms of a number of commodity contracts, leases and other agreements.
Our corporate and debt credit ratings are below investment grade. There is no assurance that our credit ratings will improve in the future, which may restrict the financing opportunities available to us or may increase the cost of any available financing. Our current credit rating has resulted in the requirement that we provide additional collateral in the form of letters of credit or cash for credit support obligations and may adversely affect our subsidiaries’ and our financial position and results of operations.
Certain of our obligations are required to be secured by letters of credit or cash, which increase our costs; if we are unable to provide such security it may restrict our ability to conduct our business.
Companies using derivatives, which include many commodity contracts, are subject to the inherent risks of such transactions. Consequently, many such companies, including us, may be required to post cash collateral for certain commodity transactions; and, the level of collateral will increase as a company increases its hedging activities. We use margin deposits, prepayments and letters of credit as credit support for commodity procurement and risk management activities. Future cash collateral requirements may increase based on the extent of our involvement in standard contracts and movements in commodity prices, and also based on our credit ratings and general perception of creditworthiness in this market. Certain of our financing arrangements for our power plants have required us to post letters of credit which are at risk of being drawn down in the event we, or the applicable subsidiary, default on our obligations.
Many of our collateral agreements require that letters of credit posted as collateral must be issued by a financial institution with a minimum credit rating of “A”. Currently the financial institutions that issue letters of credit under our Corporate Revolving Facility and other letter of credit facilities meet or exceed the minimum credit rating criteria. However, if one or more of these financial institutions is no longer able to meet the minimum credit rating criteria, then we could be required to post collateral funding from our cash and cash equivalents which could negatively affect our liquidity.
These letter of credit and cash collateral requirements increase our cost of doing business and could have an adverse effect on our overall liquidity, particularly if there was a call for a large amount of additional cash or letter of credit collateral due to an unexpectedly large movement in the market price of a commodity. As of December 31, 2016, we had $991 million issued in letters of credit under our Corporate Revolving Facility and other facilities, with $1.3 billion remaining available for borrowing or for letter of credit support under our Corporate Revolving Facility. In addition, we have ratably secured our obligations under certain of our power and natural gas agreements that qualify as eligible commodity hedge agreements with the assets subject to liens under our First Lien Notes, First Lien Term Loans and Corporate Revolving Facility.
41
Additionally, changes in market regulations can increase the use of credit support and collateral.
We may not have sufficient liquidity to hedge market risks effectively.
We are exposed to market risks through our sale of power, capacity and related products and the purchase and sale of fuel, transmission services and emission allowances. These market risks include, among other risks, volatility arising from location and timing differences that may be associated with buying and transporting fuel, converting fuel into power and delivering the power to a buyer.
We undertake these activities through agreements with various counterparties, many of which require us to provide guarantees, offset or netting arrangements, letters of credit, a second lien on assets and/or cash collateral to protect the counterparties against the risk of our default or insolvency. The amount of such credit support that must be provided typically is based on the difference between the price of the commodity in a given contract and the market price of the commodity. Significant movements in market prices can result in our being required to provide cash collateral and letters of credit in very large amounts. The effectiveness of our strategy may be dependent on the amount of collateral available to enter into or maintain these contracts, and liquidity requirements may be greater than we anticipate or will be able to meet. Without a sufficient amount of working capital to post as collateral in support of performance guarantees or as a cash margin, we may not be able to manage price volatility effectively or to implement our strategy. An increase in the amount of letters of credit or cash collateral required to be provided to our counterparties may negatively affect our liquidity and financial condition.
Further, if any of our power plants experience unplanned outages, we may be required to procure replacement power at spot market prices in order to fulfill contractual commitments. Without adequate liquidity to meet margin and collateral requirements, we may be exposed to significant losses, may miss significant opportunities and may have increased exposure to the volatility of spot markets.
Our ability to receive future cash flows generated from the operation of our subsidiaries may be limited.
Almost all of our operations are conducted through our subsidiaries and other affiliates. As a result, we depend almost entirely upon their earnings and cash flows to service our indebtedness, post collateral and finance our ongoing operations. Certain of our project debt and other agreements restrict our ability to receive dividends and other distributions from our subsidiaries. Some of these limitations are subject to a number of significant exceptions (including exceptions permitting such restrictions in connection with certain subsidiary financings). Accordingly, the financing agreements of certain of our subsidiaries and other affiliates generally restrict their ability to pay dividends, make distributions or otherwise transfer funds to us prior to the payment of their other obligations, including their outstanding debt, operating expenses, lease payments and reserves or during the existence of a default.
We may utilize project financing, preferred equity and other types of subsidiary financing transactions when appropriate in the future, which could increase our debt and may be structurally senior to other debt such as our First Lien Term Loans, First Lien Notes and Corporate Revolving Facility.
Our ability and the ability of our subsidiaries to incur additional indebtedness are limited in some cases by existing indentures, debt instruments or other agreements. Our subsidiaries may incur additional construction/project financing indebtedness, issue preferred equity to finance the acquisition and development of new power plants and engage in certain types of non-recourse financings to the extent permitted by existing agreements, and may continue to do so in order to fund our ongoing operations. Any such newly incurred subsidiary preferred equity would be added to our current consolidated debt levels and would likely be structurally senior to our debt, which could also intensify the risks associated with our already existing leverage.
Our First Lien Term Loans, First Lien Notes and Corporate Revolving Facility are effectively subordinated to certain project indebtedness.
Certain of our subsidiaries and other affiliates are separate and distinct legal entities and, except in limited circumstances, have no obligation to pay any amounts due with respect to our indebtedness or indebtedness of other subsidiaries or affiliates, and do not guarantee the payment of interest on or principal of such indebtedness. In the event of our bankruptcy, liquidation or reorganization (or the bankruptcy, liquidation or reorganization of a subsidiary or affiliate), such subsidiaries’ or other affiliates’ creditors, including trade creditors and holders of debt issued by such subsidiaries or affiliates, will generally be entitled to payment of their claims from the assets of those subsidiaries or affiliates before any assets are made available for distribution to us or the holders of our indebtedness. As a result, holders of our indebtedness will be effectively subordinated to all present and future debts and other liabilities (including trade payables) of certain of our subsidiaries. As of December 31, 2016, our subsidiaries had approximately $1.6 billion in debt from our CCFC subsidiary and approximately $1.6 billion in secured project financing from other subsidiaries, which are effectively senior to our First Lien Term Loans, First Lien Notes and Corporate Revolving Facility.
42
We may incur additional project financing indebtedness in the future, which will be effectively senior to our other secured and unsecured debt.
Governmental Regulation
Federal tax incentives and regulations, existing and proposed state RPS and energy efficiency standards, as well as economic support for renewable sources of power under federal or state legislation could adversely affect our operations.
Renewables have the ability to take market share from us and to lower overall wholesale power prices which could negatively affect us. The Consolidated Appropriations Act which extended the production tax credit for wind through the end of 2016 with gradual decreases thereafter until the tax credit expires completely in 2019 and extended the 30% investment tax credit for solar through the end of 2019 with gradual decreases through 2021 after which the investment tax credit declines to 10% was enacted in December 2015. In October 2015, the EPA promulgated the Clean Power Plan which requires future reductions in GHG emissions from existing power plants and provides flexibility in meeting the emissions reduction requirements including adding renewable generation (although ultimate implementation of this rule has come into question due to the change in the EPA administration). California has a RPS in effect and in 2015 enacted legislation requiring implementation of a 50% RPS by 2030. A number of additional states, including Maine, New York, Texas and Wisconsin, have an array of different RPS in place. Existing state-specific RPS requirements may change due to regulatory and/or legislative initiatives, and other states may consider implementing enforceable RPS in the future. A more robust RPS in states in which we are active, coupled with federal tax incentives, would likely initially drive up the number of wind and solar resources, increasing power supply to various markets which could negatively affect the dispatch of our natural gas-fired power plants, primarily in Texas and California.
Similarly, several states have energy efficiency initiatives in place while others are considering imposing them. Improved energy efficiency when mandated by law or promoted by government sponsored incentives can decrease demand for power which could negatively affect the dispatch of our natural gas-fired power plants, primarily in Texas and California.
Increased oversight and investigation by the CFTC relating to derivative transactions, as well as certain financial institutions, could have an adverse effect on our ability to hedge risks associated with our business.
The CFTC has regulatory oversight of the futures markets, including trading on NYMEX for energy, and licensed futures professionals such as brokers, clearing members and large traders. In connection with its oversight of the futures markets and NYMEX, the CFTC regularly investigates market irregularities and potential manipulation of those markets. Recent laws also give the CFTC certain powers with respect to broker-type markets referred to as “exempt commercial markets” or ECMs, including the Intercontinental Exchange. The CFTC monitors activities in the OTC, ECM and physical markets that may be undertaken for the purpose of influencing futures prices. With respect to ECMs, the CFTC exercises only light-handed regulation primarily related to trade reporting, price dissemination and record retention (including retention of fraudulent claims and allegations).
Changes in the regulation of the power markets in which we operate could negatively affect us.
We have a significant presence in the major competitive power markets for California, Texas and the Northeast and Mid-Atlantic regions of the U.S. While these markets are largely deregulated, they continue to evolve. Existing regulations within the markets in which we operate may be revised or reinterpreted and new laws or regulations may be issued. We cannot predict the future development of regulation or legislation nor the ultimate effect such changes in these markets could have on our business; however, we could be negatively affected.
State legislative and regulatory action could adversely affect our competitive position and business.
Certain states have taken or are considering taking anticompetitive actions by subsidizing or otherwise providing economic support to existing, uneconomic power plants in a manner that could have an adverse effect on the deregulated power markets. We are actively participating in many of the legislative, regulatory and judicial processes challenging these actions at the state and federal levels. If these anticompetitive actions are ultimately upheld and implemented, they could adversely affect capacity and energy prices in the deregulated electricity markets which in turn could have a material negative effect on our business prospects and financial results.
Existing and future anticipated GHG/Carbon and other environmental regulations could cause us to incur significant costs and adversely affect our operations generally or in a particular quarter when such costs are incurred.
Environmental laws and regulations have generally become more stringent over time, and this trend is likely to continue. In particular, there is growing likelihood that carbon tax or limits on carbon, CO2 and other GHG emissions will be implemented at the federal or expanded at the state or regional levels.
43
Currently, nine states in the Northeast are required to comply with a Cap-and-Trade program, RGGI, to regulate CO2 emissions from power plants. California has implemented AB 32 which places a statewide cap on GHG emissions and requires the state to return to 1990 emission levels by 2020. In December 2010, CARB adopted a regulation establishing a GHG Cap-and- Trade program which is in effect for electric utilities and other “major industrial sources,” and in 2015 for certain other GHG sources including transportation fuels and natural gas distribution.
In 2011, the EPA finalized regulations governing GHG emissions from major sources as well as emissions of criteria and hazardous air pollutants from the electric generation sector. We continue to monitor and actively participate in the EPA initiatives where we anticipate a material effect on our business.
We are subject to other complex governmental regulation which could adversely affect our operations.
Generally, in the U.S., we are subject to regulation by the FERC regarding the terms and conditions of wholesale service and the sale and transportation of natural gas, as well as by state agencies regarding physical aspects of the power plants. The majority of our generation is sold at market prices under the market-based rate authority granted by the FERC. If certain conditions are not met, FERC has the authority to withhold or rescind market-based rate authority and require sales to be made based on cost-of-service rates. A loss of our market-based rate authority could have a materially negative effect on our generation business. FERC could also impose fines or other restrictions or requirements on us under certain circumstances.
The construction and operation of power plants require numerous permits, approvals and certificates from the appropriate foreign, federal, state and local governmental agencies, as well as compliance with numerous environmental laws and regulations of federal, state and local authorities. We could also be required to install expensive pollution control measures or limit or cease activities, including the retirement of certain generating plants, based on these regulations. Should we fail to comply with any environmental requirements that apply to power plant construction or operations, we could be subject to administrative, civil and/or criminal liability and fines, and regulatory agencies could take other actions to curtail our operations.
Furthermore, certain environmental laws impose strict, joint and several liability for costs required to clean up and restore sites where hazardous substances have been disposed or otherwise released. We are generally responsible for all liabilities associated with the environmental condition of our power plants, including any soil or groundwater contamination that may be present, regardless of when the liabilities arose and whether the liabilities are known or unknown, or arose from the activities of predecessors or third parties.
If we were deemed to have market power in certain markets as a result of the ownership of our stock by certain significant shareholders, we could lose FERC authorization to sell power at wholesale at market-based rates in such markets or be required to engage in mitigation in those markets.
Certain of our significant shareholder groups own power generating assets, or own significant equity interests in entities with power generating assets, in markets where we currently own power plants. We could be determined to have market power if these existing significant shareholders acquire additional significant ownership or equity interest in other entities with power generating assets in the same markets where we generate and sell power.
If the FERC makes the determination that we have market power, the FERC could, among other things, revoke market-based rate authority for the affected market-based companies or order them to mitigate that market power. If market-based rate authority was revoked for any of our market-based rate companies, those companies would be required to make wholesale sales of power based on cost-of-service rates, which could negatively affect their revenues. If we are required to mitigate market power, we could be required to sell certain power plants in regions where we are determined to have market power. A loss of our market-based rate authority or required sales of power plants, particularly if it affected several of our power plants or was in a significant market, could have a material negative effect on our financial condition, results of operations and cash flows.
Item 1B. | Unresolved Staff Comments |
None.
Item 2. | Properties |
Our principal offices are located in Houston, Texas with the principal offices of our retail affiliates located in Houston, Texas and San Diego, California. We also have regional offices in Dublin, California and Wilmington, Delaware, an engineering, construction and maintenance services office in Pasadena, Texas and government affairs offices in Washington D.C., Sacramento, California and Austin, Texas.
44
We either lease or own the land upon which our power plants are built. We believe that our properties are adequate for our current operations. A description of our power plants is included under Item 1. “Business — Description of Our Power Plants.”
Item 3. | Legal Proceedings |
See Note 15 of the Notes to Consolidated Financial Statements for a description of our legal proceedings.
Item 4. | Mine Safety Disclosures |
Not applicable.
45
PART II
Item 5. | Market for Registrant’s Common Equity, Related Stockholder Matters and Issuer Purchases of Equity Securities |
Market Information and Stockholder Matters
Calpine Corporation common stock is traded on the NYSE under the symbol “CPN”. The following table sets forth the high and low sales price per share for our common stock for each quarter of the years 2016 and 2015, as reported on the NYSE.
High | Low | ||||||
2016 | |||||||
First Quarter | $ | 16.49 | $ | 11.53 | |||
Second Quarter | 16.07 | 13.22 | |||||
Third Quarter | 15.12 | 11.97 | |||||
Fourth Quarter | 13.22 | 10.39 | |||||
2015 | |||||||
First Quarter | $ | 22.89 | $ | 20.16 | |||
Second Quarter | 23.51 | 17.66 | |||||
Third Quarter | 19.73 | 14.09 | |||||
Fourth Quarter | 16.60 | 11.75 | |||||
As of December 31, 2016, there were 89 registered shareholders of record of our common stock according to our stock transfer agent.
We have never paid cash dividends on our common stock. Future cash dividends, if any, will be at the discretion of our Board of Directors and will depend upon, among other things, our future operations and earnings, capital requirements, general financial condition, contractual and financing restrictions and such other factors as our Board of Directors may deem relevant.
Repurchase of Equity Securities
Period | (a) Total Number of Shares Purchased(1) | (b) Average Price Paid Per Share | (c) Total Number of Shares Purchased as Part of Publicly Announced Plans or Programs(2) | (d) Maximum Dollar Value of Shares That May Yet Be Purchased Under the Plans or Programs (in millions) | ||||||||||
October | 1,837 | $ | 12.09 | — | $ | 307 | ||||||||
November | 6,281 | $ | 11.48 | — | $ | 307 | ||||||||
December | 27,290 | $ | 11.40 | — | $ | 307 | ||||||||
Total | 35,408 | $ | 11.45 | — | $ | 307 | ||||||||
___________
(1) | To satisfy tax withholding obligations associated with the vesting of restricted stock awarded to employees during the fourth quarter of 2016, we withheld a total of 35,408 shares that are included in the total number of shares purchased. |
(2) | In November 2014, our Board of Directors authorized an increase in the total authorization of our multi-year share repurchase program to $1.0 billion. There is no expiration date on the repurchase authorization and the amount and timing of future share repurchases, if any, will be determined as market and business conditions warrant. |
46
Stock Performance Graph
The performance graph below compares cumulative return on our common stock for the period December 31, 2011 through December 31, 2016, with the cumulative return of Standard & Poor’s 500 Index (S&P 500) and the S&P 500 Utilities Index.
The graph below compares each period assuming that $100 was invested on December 31, 2011 in our common stock and each of above indices and that all dividends are reinvested. The returns shown below may not be indicative of future performance.
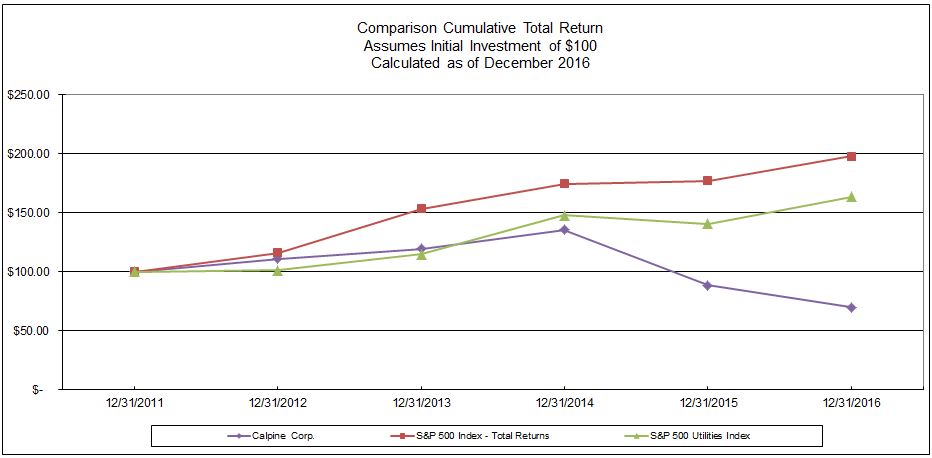
Company / Index | December 31, 2011 | December 31, 2012 | December 31, 2013 | December 31, 2014 | December 31, 2015 | December 31, 2016 | ||||||||||||||||||
Calpine Corporation | $ | 100.00 | $ | 111.02 | $ | 119.47 | $ | 135.52 | $ | 88.61 | $ | 69.99 | ||||||||||||
S&P 500 Index | 100.00 | 115.99 | 153.55 | 174.57 | 176.98 | 198.15 | ||||||||||||||||||
S&P Utilities Index | 100.00 | 101.28 | 114.66 | 147.89 | 140.72 | 163.64 | ||||||||||||||||||
47
Item 6. Selected Financial Data
SELECTED CONSOLIDATED FINANCIAL DATA
Years Ended December 31, | |||||||||||||||||||
2016 | 2015 | 2014 | 2013 | 2012 | |||||||||||||||
(in millions, except per share amounts) | |||||||||||||||||||
Statement of Operations data: | |||||||||||||||||||
Operating revenues | $ | 6,716 | $ | 6,472 | $ | 8,030 | $ | 6,301 | $ | 5,478 | |||||||||
Net income attributable to Calpine | $ | 92 | $ | 235 | $ | 946 | $ | 14 | $ | 199 | |||||||||
Basic earnings per common share: | |||||||||||||||||||
Net income per common share attributable to Calpine | $ | 0.26 | $ | 0.65 | $ | 2.34 | $ | 0.03 | $ | 0.43 | |||||||||
Diluted earnings per common share: | |||||||||||||||||||
Net income per common share attributable to Calpine | $ | 0.26 | $ | 0.64 | $ | 2.31 | $ | 0.03 | $ | 0.42 | |||||||||
Balance Sheet data: | |||||||||||||||||||
Total assets(1) | $ | 19,317 | $ | 18,681 | $ | 18,228 | $ | 16,402 | $ | 16,394 | |||||||||
Short-term debt and capital lease obligations(1) | $ | 748 | $ | 221 | $ | 199 | $ | 204 | $ | 115 | |||||||||
Long-term debt and capital lease obligations(1) | $ | 11,431 | $ | 11,716 | $ | 10,933 | $ | 10,751 | $ | 10,480 | |||||||||
____________
(1) | We retrospectively adopted Accounting Standards Update 2015-03 in the first quarter of 2016. As a result, we reclassified our debt issuance costs from other assets to debt, net of current portion on our Consolidated Balance Sheets. See Note 2 of the Notes to Consolidated Financial Statements for further information related to our adoption of Accounting Standards Update 2015-03. |
48
Item 7. | Management’s Discussion and Analysis of Financial Condition and Results of Operations |
Forward-Looking Information
This Management’s Discussion and Analysis of Financial Condition and Results of Operations should be read in conjunction with our accompanying Consolidated Financial Statements and related Notes. See the cautionary statement regarding forward-looking statements at the beginning of this Report for a description of important factors that could cause actual results to differ from expected results. See also Item 1A. “Risk Factors.”
INTRODUCTION AND OVERVIEW
Our Business
We are one of the largest power generators in the U.S. measured by power produced. We own and operate primarily natural gas-fired and geothermal power plants in North America and have a significant presence in major competitive wholesale power markets in California (included in our West segment), Texas (included in our Texas segment) and the Northeast and Mid-Atlantic regions (included in our East segment) of the U.S. We sell power, steam, capacity, renewable energy credits and ancillary services to our customers, which include utilities, independent electric system operators, industrial and agricultural companies, retail power providers, municipalities and other governmental entities, power marketers as well as retail commercial, industrial governmental and residential customers. We continue to focus on getting closer to our customers through expansion of our retail platform which began with the acquisition of Champion Energy in 2015 and was followed by the acquisitions of Calpine Solutions in late 2016 and North American Power in early 2017. We have invested in clean power generation to become a recognized leader in developing, constructing, owning and operating an environmentally responsible portfolio of flexible and reliable power plants.
In order to manage our various physical assets and contractual obligations, we execute commodity and commodity transportation agreements within the guidelines of our Risk Management Policy. We purchase primarily natural gas and some fuel oil as fuel for our power plants and engage in related natural gas transportation and storage transactions. We also purchase power for sale to our customers and purchase electric transmission rights to deliver power to our customers. Additionally, consistent with our Risk Management Policy, we enter into natural gas, power, environmental product, fuel oil and other physical and financial commodity contracts to hedge certain business risks and optimize our portfolio of power plants. Seasonality and weather can have a significant effect on our results of operations and are also considered in our hedging and optimization activities.
We assess our business on a regional basis due to the effect on our financial performance of the differing characteristics of these regions, particularly with respect to competition, regulation and other factors affecting supply and demand. Our reportable segments are West (including geothermal), Texas and East (including Canada).
Subsequent to the completion of the sale of Osprey Energy Center on January 3, 2017 and the retirement of the Clear Lake Power Plant on February 1, 2017, our portfolio, including partnership interests, consists of 80 power plants, including one under construction, with an aggregate current generation capacity of 25,908 MW and 828 MW under construction. Our fleet, including projects under construction, consists of 65 natural gas-fired combustion turbine-based plants, one fuel oil-fired steam-based plant, 13 geothermal steam turbine-based plants and one photovoltaic solar plant. Our segments have an aggregate generation capacity of 7,425 MW in the West, 9,027 MW in Texas and 9,456 MW with an additional 828 MW under construction in the East. Inclusive of our power generation portfolio and our retail sales platforms, we serve customers in 25 states in the U.S. and in Canada and Mexico.
In addition to the unique profile of our fleet, we believe our business is also advantaged by our capital allocation philosophy which seeks to maximize levered cash returns to equity while maintaining a strong balance sheet. We seek to enhance shareholder value through a diverse and balanced capital allocation approach that includes portfolio management, organic or acquisitive growth, returning capital to shareholders and debt reduction. The mix of this activity shifts over time given the external market environment and the opportunity set. In the current environment, we believe that paying down debt and strengthening our balance sheet is a high return investment for our shareholders. We also consider the repurchases of our own shares of common stock as an attractive investment opportunity, and we utilize the expected returns from this investment as the benchmark against which we evaluate all other capital allocation decisions. We believe this philosophy closely aligns our objectives with those of our shareholders.
Our goal is to be recognized as the premier competitive power company in the U.S. as viewed by our employees, shareholders, customers and policy-makers as well as the communities in which our facilities are located. We seek to deliver long-term shareholder value through operational excellence at our power plants and in our customer and commercial activity, as well as through our disciplined approach to capital allocation. A description of our strategy is included under Item 1. “Business — Strategy.”
49
RESULTS OF OPERATIONS FOR THE YEARS ENDED DECEMBER 31, 2016 AND 2015
Below are our results of operations for the year ended December 31, 2016, as compared to the same period in 2015 (in millions, except for percentages and operating performance metrics). In the comparative tables below, increases in revenue/income or decreases in expense (favorable variances) are shown without brackets while decreases in revenue/income or increases in expense (unfavorable variances) are shown with brackets.
2016 | 2015 | Change | % Change | |||||||||||
Operating revenues: | ||||||||||||||
Commodity revenue | $ | 6,943 | $ | 6,389 | $ | 554 | 9 | |||||||
Mark-to-market gain (loss) | (245 | ) | 65 | (310 | ) | # | ||||||||
Other revenue | 18 | 18 | — | — | ||||||||||
Operating revenues | 6,716 | 6,472 | 244 | 4 | ||||||||||
Operating expenses: | ||||||||||||||
Fuel and purchased energy expense: | ||||||||||||||
Commodity expense | 4,431 | 3,589 | (842 | ) | (23 | ) | ||||||||
Mark-to-market (gain) loss | (244 | ) | 178 | 422 | # | |||||||||
Fuel and purchased energy expense | 4,187 | 3,767 | (420 | ) | (11 | ) | ||||||||
Plant operating expense | 977 | 1,018 | 41 | 4 | ||||||||||
Depreciation and amortization expense | 662 | 638 | (24 | ) | (4 | ) | ||||||||
Sales, general and other administrative expense | 140 | 138 | (2 | ) | (1 | ) | ||||||||
Other operating expenses | 79 | 80 | 1 | 1 | ||||||||||
Total operating expenses | 6,045 | 5,641 | (404 | ) | (7 | ) | ||||||||
Impairment losses | 13 | — | (13 | ) | # | |||||||||
(Gain) on sale of assets, net | (157 | ) | — | 157 | # | |||||||||
(Income) from unconsolidated subsidiaries | (24 | ) | (24 | ) | — | — | ||||||||
Income from operations | 839 | 855 | (16 | ) | (2 | ) | ||||||||
Interest expense | 631 | 628 | (3 | ) | — | |||||||||
Debt modification and extinguishment costs | 25 | 40 | 15 | 38 | ||||||||||
Other (income) expense, net | 24 | 14 | (10 | ) | (71 | ) | ||||||||
Income before income taxes | 159 | 173 | (14 | ) | (8 | ) | ||||||||
Income tax expense (benefit) | 48 | (76 | ) | (124 | ) | # | ||||||||
Net income | 111 | 249 | (138 | ) | (55 | ) | ||||||||
Net income attributable to the noncontrolling interest | (19 | ) | (14 | ) | (5 | ) | (36 | ) | ||||||
Net income attributable to Calpine | $ | 92 | $ | 235 | $ | (143 | ) | (61 | ) | |||||
2016 | 2015 | Change | % Change | ||||||||
Operating Performance Metrics: | |||||||||||
MWh generated (in thousands)(1)(2) | 107,264 | 112,150 | (4,886 | ) | (4 | ) | |||||
Average availability(2) | 90.5 | % | 89.2 | % | 1.3 | % | 1 | ||||
Average total MW in operation(1) | 26,368 | 25,785 | 583 | 2 | |||||||
Average capacity factor, excluding peakers | 51.2 | % | 55.6 | % | (4.4 | )% | (8 | ) | |||
Steam Adjusted Heat Rate(2) | 7,324 | 7,306 | (18 | ) | — | ||||||
# | Variance of 100% or greater |
(1) | Represents generation and capacity from power plants that we both consolidate and operate. See “— Description of Our Power Plants – Table of Operating Power Plants and Projects Under Construction and Advanced Development” for our total equity generation and capacities. |
(2) | Generation, average availability and Steam Adjusted Heat Rate exclude power plants and units that are inactive. |
50
We evaluate our Commodity revenue and Commodity expense on a collective basis because the price of power and natural gas tend to move together as the price for power is generally determined by the variable operating cost of the next marginal generator to be dispatched to meet demand. The spread between our Commodity revenue and Commodity expense represents a significant portion of our Commodity Margin. Our financial performance is correlated to how we maximize our Commodity Margin through management of our portfolio of power plants, as well as our hedging and optimization activities. See additional segment discussion in “Commodity Margin and Adjusted EBITDA.”
Commodity revenue, net of Commodity expense, decreased $288 million for the year ended December 31, 2016, compared to the year ended December 31, 2015, primarily due to:
(in millions) | ||||
$ | (215 | ) | Lower energy margins due to decreased contribution from wholesale hedges, lower realized Spark Spreads in our Texas and West segments and the expiration of the Pastoria Energy Center PPA. These factors were partially offset by increased contribution from our retail hedging activity and the positive effect of a new PPA associated with our Morgan Energy Center in the East segment(1) | |
(44 | ) | Lower regulatory capacity revenue primarily in the East and West segments at our power plants which were fully operational period-over-period(1) | ||
40 | A natural gas pipeline transportation billing credit received in the West segment(1) | |||
37 | The net year-over-year effect of our portfolio management activities, including the acquisition of our 695 MW Granite Ridge Energy Center on February 5, 2016 and the commencement of commercial operations at our 309 MW Garrison Energy Center in June 2015 partially offset by the sale of our 375 MW Mankato Power Plant in October 2016 and the expiration of the operating lease related to the Greenleaf power plants in June 2015(1) | |||
(106 | ) | Contract amortization, lease levelization related to tolling contracts and other(2) | ||
$ | (288 | ) | ||
__________
(1) | These items comprise the year-over-year change in our Commodity Margin which is a non-GAAP financial measure. See “Commodity Margin and Adjusted EBITDA” for a description of our Non-GAAP financial measures and a discussion of the year-over-year change in Commodity Margin by segment. |
(2) | Commodity Margin excludes amortization expense related to contracts recorded at fair value, non-cash GAAP-related adjustments to levelize revenues from tolling agreements, Commodity revenue and Commodity expense attributable to the noncontrolling interest and other unusual or non-recurring items. |
Mark-to-market gain/loss from hedging our future generation, retail activities and fuel needs had a favorable variance of $112 million primarily driven by a decrease in net mark-to-market losses in the current year as compared to the prior year.
Our normal, recurring plant operating expense decreased $38 million during 2016 compared to 2015. The decrease in our normal, recurring plant operating expense was primarily due to a $16 million decrease in repairs and maintenance expense and production-related expenses, a $7 million reduction in equipment failure costs related to outages, a $6 million decrease primarily from lower property taxes associated with two power plants in our Texas segment and a $9 million decrease in other miscellaneous expenses. The remaining net decrease of $3 million includes a $30 million decrease in major maintenance expense resulting from our plant outage schedule and costs from scrap parts related to outages, a $24 million decrease related to costs associated with a wildfire at our Geysers Assets in September 2015, a $40 million increase attributable to power plant portfolio changes and the acquisitions of our retail subsidiaries and an $11 million increase in stock based compensation expense and other miscellaneous items.
In line with our strategy to focus on competitive wholesale markets and sell or contract power plants located in power markets dominated by regulated utilities or outside our strategic concentration, we completed the sale of the Mankato Power Plant in our East segment on October 26, 2016, resulting in a gain on sale of assets, net of $157 million during the year ended December 31, 2016. In addition, we entered into an asset sale agreement on April 1, 2016 for the sale of substantially all of the assets comprising our South Point Energy Center to Nevada Power Company d/b/a NV Energy for approximately $76 million which resulted in an impairment loss of approximately $13 million that was recorded during the first quarter of 2016. See Note 3 of the Notes to Consolidated Financial Statements for further information regarding the sales of Mankato Power Plant and South Point Energy Center.
Debt modification and extinguishment costs for the year ended December 31, 2016, consisted of $15 million from the write-off of debt issuance costs in connection with the repayment of our 2019 and 2020 First Lien Term Loans in May 2016, $5 million from the write-off of debt issuance costs in connection with repurchase of a portion of our 2023 First Lien Notes in December 2016 and $5 million in debt modification and extinguishment costs associated with the refinancing of project debt in
51
November 2016. Debt modification and extinguishment costs for the year ended December 31, 2015, consisted of $26 million in debt extinguishment costs in connection with the repurchases of a portion of our 2023 First Lien Notes, which is comprised of $22 million of prepayment penalties and $4 million associated with the write-off of debt issuance costs and $13 million in debt modification costs related to the issuance of our 2024 First Lien Term Loan in May 2015.
Other (income) expense, net increased by $10 million during 2016 compared to 2015 primarily due to a $5 million increase related to credit fees associated with our retail operations during 2016 and a $5 million increase resulting from a foreign currency translation loss related to our Canadian subsidiaries.
During the year ended December 31, 2016, we recorded income tax expense of $48 million compared to income tax benefit of $76 million for the year ended December 31, 2015. The unfavorable year-over-year change primarily resulted from an internal restructuring during 2015 of certain of our international entities by moving certain foreign subsidiaries under a different foreign parent. This restructuring resulted in our ability to further utilize foreign NOLs that were previously unavailable to offset the income tax obligation on future earnings and, thus, resulted in a partial release of our valuation allowance recorded against our NOLs. Additionally, the unfavorable year-over-year change resulted from recent acquisitions and domestic restructurings.
52
RESULTS OF OPERATIONS FOR THE YEARS ENDED DECEMBER 31, 2015 AND 2014
Below are our results of operations for the year ended December 31, 2015, as compared to the same period in 2014 (in millions, except for percentages and operating performance metrics). In the comparative tables below, increases in revenue/income or decreases in expense (favorable variances) are shown without brackets while decreases in revenue/income or increases in expense (unfavorable variances) are shown with brackets.
2015 | 2014 | Change | % Change | |||||||||||
Operating revenues: | ||||||||||||||
Commodity revenue | $ | 6,389 | $ | 7,595 | $ | (1,206 | ) | (16 | ) | |||||
Mark-to-market gain (loss) | 65 | 419 | (354 | ) | (84 | ) | ||||||||
Other revenue | 18 | 16 | 2 | 13 | ||||||||||
Operating revenues | 6,472 | 8,030 | (1,558 | ) | (19 | ) | ||||||||
Operating expenses: | ||||||||||||||
Fuel and purchased energy expense: | ||||||||||||||
Commodity expense | 3,589 | 4,815 | 1,226 | 25 | ||||||||||
Mark-to-market (gain) loss | 178 | 77 | (101 | ) | # | |||||||||
Fuel and purchased energy expense | 3,767 | 4,892 | 1,125 | 23 | ||||||||||
Plant operating expense | 1,018 | 969 | (49 | ) | (5 | ) | ||||||||
Depreciation and amortization expense | 638 | 603 | (35 | ) | (6 | ) | ||||||||
Sales, general and other administrative expense | 138 | 144 | 6 | 4 | ||||||||||
Other operating expenses | 80 | 88 | 8 | 9 | ||||||||||
Total operating expenses | 5,641 | 6,696 | 1,055 | 16 | ||||||||||
Impairment losses | — | 123 | 123 | # | ||||||||||
(Gain) on sale of assets, net | — | (753 | ) | (753 | ) | # | ||||||||
(Income) from unconsolidated subsidiaries | (24 | ) | (25 | ) | (1 | ) | (4 | ) | ||||||
Income from operations | 855 | 1,989 | (1,134 | ) | (57 | ) | ||||||||
Interest expense | 628 | 645 | 17 | 3 | ||||||||||
Debt extinguishment costs | 40 | 346 | 306 | 88 | ||||||||||
Other (income) expense, net | 14 | 15 | 1 | 7 | ||||||||||
Income before income taxes | 173 | 983 | (810 | ) | (82 | ) | ||||||||
Income tax expense (benefit) | (76 | ) | 22 | 98 | # | |||||||||
Net income | 249 | 961 | (712 | ) | (74 | ) | ||||||||
Net income attributable to the noncontrolling interest | (14 | ) | (15 | ) | 1 | 7 | ||||||||
Net income attributable to Calpine | $ | 235 | $ | 946 | $ | (711 | ) | (75 | ) | |||||
2015 | 2014 | Change | % Change | ||||||||
Operating Performance Metrics: | |||||||||||
MWh generated (in thousands)(1)(2) | 112,150 | 100,617 | 11,533 | 11 | |||||||
Average availability(2) | 89.2 | % | 90.7 | % | (1.5 | )% | (2 | ) | |||
Average total MW in operation(1) | 25,785 | 26,652 | (867 | ) | (3 | ) | |||||
Average capacity factor, excluding peakers | 55.6 | % | 48.4 | % | 7.2 | % | 15 | ||||
Steam Adjusted Heat Rate(2) | 7,306 | 7,384 | 78 | 1 | |||||||
# | Variance of 100% or greater |
(1) | Represents generation and capacity from power plants that we both consolidate and operate. See “— Description of Our Power Plants – Table of Operating Power Plants and Projects Under Construction and Advanced Development” for our total equity generation and capacities. |
(2) | Generation, average availability and Steam Adjusted Heat Rate exclude power plants and units that are inactive. |
53
We evaluate our Commodity revenue and Commodity expense on a collective basis because the price of power and natural gas tend to move together as the price for power is generally determined by the variable operating cost of the next marginal generator to be dispatched to meet demand. The spread between our Commodity revenue and Commodity expense represents a significant portion of our Commodity Margin. Our financial performance is correlated to how we maximize our Commodity Margin through management of our portfolio of power plants, as well as our hedging and optimization activities. See additional segment discussion in “Commodity Margin and Adjusted EBITDA.”
Commodity revenue, net of Commodity expense, increased $20 million for the year ended December 31, 2015, compared to the year ended December 31, 2014, primarily due to:
(in millions) | ||||
$ | 62 | Higher energy margins due to higher contribution from hedges in our West and East segments and hedging through our Champion Energy retail subsidiary, which more than offset lower on-peak Spark Spreads across all of our segments, including the effect of the polar vortex events experienced during the first quarter of 2014(1) | ||
(25 | ) | Lower regulatory capacity revenue in PJM during the first five months of 2015, partially offset by higher regulatory capacity revenue in PJM during the remaining seven months of 2015(1) | ||
(10 | ) | The net year-over-year effect of our portfolio management activities, primarily including the sale of six power plants with a total capacity of 3,498 MW in our East segment in July 2014, the acquisitions of our Guadalupe and Fore River Energy Centers in February and November 2014, respectively, the completion of our Deer Park and Channel Energy Center expansions in June 2014, the commencement of commercial operations at our Garrison Energy Center in June 2015 and the expiration of the operating lease related to the Greenleaf power plants in June 2015(1) | ||
(7 | ) | Contract amortization, lease levelization related to tolling contracts and other(2) | ||
$ | 20 | |||
__________
(1) | These items comprise the year-over-year change in our Commodity Margin which is a non-GAAP financial measure. See “Commodity Margin and Adjusted EBITDA” for a description of our Non-GAAP financial measures and a discussion of the year-over-year change in Commodity Margin by segment. |
(2) | Commodity Margin excludes amortization expense related to contracts recorded at fair value, non-cash GAAP-related adjustments to levelize revenues from tolling agreements, Commodity revenue and Commodity expense attributable to the noncontrolling interest and other unusual or non-recurring items. |
Mark-to-market gain/loss from hedging our future generation and fuel needs had an unfavorable variance of $455 million primarily driven by the maturity of favorable hedges during 2015 as compared to 2014.
Our normal, recurring plant operating expense decreased $3 million during 2015 compared to 2014 after excluding the net effect of a $8 million decrease from power plant portfolio changes, a $3 million decrease in stock based compensation expense, a $47 million increase in major maintenance expense resulting from our plant outage schedule and costs from scrap parts related to outages and a $16 million increase related to repairs to five of our geothermal power plants damaged by a wildfire in September of 2015. Repairs have been completed and our Geysers Assets are currently generating renewable power for our customers at pre-fire levels.
Depreciation and amortization expense increased by $35 million during the year ended December 31, 2015, compared to the year ended December 31, 2014, primarily due to the acquisition of our Guadalupe and Fore River Energy Centers in February and November 2014, respectively, the acquisition of Champion Energy in October 2015, the commencement of commercial operations at our Garrison Energy Center in June 2015 and the completion of our Deer Park and Channel Energy Center expansions in June 2014.
In line with our strategy to sell or contract power plants located in wholesale power markets dominated by regulated utilities and focus on competitive wholesale markets, we completed the sale of six of our power plants in our East segment on July 3, 2014, resulting in a gain on sale of assets, net of $753 million during the year ended December 31, 2014. In addition, we executed a term sheet with a third party related to our Osprey Energy Center in August 2014 for a new PPA with a term of 27 months, after which the third party would purchase our Osprey Energy Center which resulted in an impairment loss of approximately $123 million that was recorded during the third quarter of 2014. See Notes 2 and 3 of the Notes to Consolidated Financial Statements for further information regarding the impairment and the sale of six power plants, respectively.
54
Interest expense decreased by $17 million for the year ended December 31, 2015, compared to the year ended December 31, 2014, primarily due to a decrease in our annual effective interest rate on our consolidated debt, excluding the effect of capitalized interest and mark-to-market gains (losses) on interest rate hedging instruments, to 5.5% for the year ended December 31, 2015, from 5.9% for the year ended December 31, 2014. The issuance of our Senior Unsecured Notes in July 2014 and February 2015 and our 2024 First Lien Term Loan in May 2015 allowed us to reduce our overall cost of debt by replacing a portion of our 2023 First Lien Notes and all of our 2018 First Lien Term Loans with debt carrying lower interest rates.
Debt modification and extinguishment costs for the year ended December 31, 2015, consisted of $26 million in debt extinguishment costs in connection with the repurchases of a portion of our 2023 First Lien Notes, which is comprised of $22 million of prepayment penalties and $4 million associated with the write-off of debt issuance costs and $13 million in debt modification costs related to the issuance of our 2024 First Lien Term Loan in May 2015. Debt extinguishment costs for the year ended December 31, 2014, consisted primarily of $340 million related to the prepayment of our 2019 First Lien Notes, 2020 First Lien Notes and 2021 First Lien Notes, which is comprised of $306 million of prepayment penalties and $34 million associated with the write-off of unamortized debt discount and debt issuance costs.
During the year ended December 31, 2015, we recorded income tax benefit of $76 million compared to income tax expense of $22 million for the year ended December 31, 2014. The favorable year-over-year change primarily resulted from an internal restructuring of certain of our international entities by moving certain foreign subsidiaries under a different foreign parent during 2015. This restructuring resulted in our ability to further utilize foreign NOLs that were previously unavailable to offset the income tax obligation on future earnings and, thus, resulted in a partial release of our valuation allowance recorded against our NOLs. We do not currently believe that similar restructuring opportunities exist within our current tax structure. See Note 10 of the Notes to Consolidated Financial Statements for further discussion of our NOLs and valuation allowance. In addition, a portion of the favorable year-over-year change relates to the recognition of a future tax benefit related to a tax credit associated with our capital expenditures.
55
COMMODITY MARGIN AND ADJUSTED EBITDA
Management’s Discussion and Analysis of Financial Condition and Results of Operations includes financial information prepared in accordance with U.S. GAAP, as well as the non-GAAP financial measures, Commodity Margin and Adjusted EBITDA, discussed below, which we use as measures of our performance. Generally, a non-GAAP financial measure is a numerical measure of financial performance, financial position or cash flows that excludes (or includes) amounts that are included in (or excluded from) the most directly comparable measure calculated and presented in accordance with U.S. GAAP.
We use Commodity Margin, a non-GAAP financial measure, to assess our performance by our reportable segments. Commodity Margin includes our power and steam revenues, sales of purchased power and physical natural gas, capacity revenue, REC revenue, sales of surplus emission allowances, transmission revenue and expenses, fuel and purchased energy expense, fuel transportation expense, environmental compliance expense, and realized settlements from our marketing, hedging, optimization and trading activities, but excludes mark-to-market activity and other revenues. We believe that Commodity Margin is a useful tool for assessing the performance of our core operations and is a key operational measure reviewed by our chief operating decision maker. Commodity Margin is not a measure calculated in accordance with U.S. GAAP and should be viewed as a supplement to and not a substitute for our results of operations presented in accordance with U.S. GAAP. Commodity Margin does not intend to represent income from operations, the most comparable U.S. GAAP measure, as an indicator of operating performance and is not necessarily comparable to similarly titled measures reported by other companies. See Note 16 of the Notes to Consolidated Financial Statements for a reconciliation of Commodity Margin to income from operations by segment.
Commodity Margin by Segment for the Years Ended December 31, 2016 and 2015
The following tables show our Commodity Margin and related operating performance metrics by segment for the years ended December 31, 2016 and 2015 (exclusive of the noncontrolling interest). In the comparative tables below, favorable variances are shown without brackets while unfavorable variances are shown with brackets. The MWh generated by segment below represent generation from power plants that we both consolidate and operate. Generation, average availability and Steam Adjusted Heat Rate exclude power plants and units that are inactive.
West: | 2016 | 2015 | Change | % Change | ||||||||||
Commodity Margin (in millions) | $ | 991 | $ | 1,106 | $ | (115 | ) | (10 | ) | |||||
Commodity Margin per MWh generated | $ | 37.74 | $ | 31.75 | $ | 5.99 | 19 | |||||||
MWh generated (in thousands) | 26,256 | 34,836 | (8,580 | ) | (25 | ) | ||||||||
Average availability | 92.0 | % | 89.2 | % | 2.8 | % | 3 | |||||||
Average total MW in operation | 7,425 | 7,475 | (50 | ) | (1 | ) | ||||||||
Average capacity factor, excluding peakers | 43.2 | % | 56.8 | % | (13.6 | )% | (24 | ) | ||||||
Steam Adjusted Heat Rate | 7,277 | 7,320 | 43 | 1 | ||||||||||
West — Commodity Margin in our West segment decreased by $115 million, or 10%, for the year ended December 31, 2016 compared to the year ended December 31, 2015, primarily due to lower contribution from hedges, as we realized lower power prices at our Geysers Assets resulting from lower forward natural gas prices. Also contributing to the year-over-year decrease in Commodity Margin was the expiration of a PPA and a resource adequacy contract at our Pastoria Energy Center in December 2015 and the expiration of the operating lease related to the Greenleaf power plants in June 2015. The decrease in Commodity Margin was partially offset by the receipt of a natural gas pipeline transportation billing credit during the second quarter of 2016. Generation decreased 25% primarily due to the suspension of operations at our Sutter Energy Center in 2016, the reclassification of our South Point Energy Center to inactive reserve in 2016 pending its sale in early 2017 and an increase in hydroelectric generation in California and the Pacific Northwest during the year ended December 31, 2016 compared to the same period in 2015.
56
Texas: | 2016 | 2015 | Change | % Change | ||||||||||
Commodity Margin (in millions) | $ | 655 | $ | 736 | $ | (81 | ) | (11 | ) | |||||
Commodity Margin per MWh generated | $ | 14.04 | $ | 15.37 | $ | (1.33 | ) | (9 | ) | |||||
MWh generated (in thousands) | 46,646 | 47,873 | (1,227 | ) | (3 | ) | ||||||||
Average availability | 90.3 | % | 89.4 | % | 0.9 | % | 1 | |||||||
Average total MW in operation | 9,191 | 9,191 | — | — | ||||||||||
Average capacity factor, excluding peakers | 57.8 | % | 59.5 | % | (1.7 | )% | (3 | ) | ||||||
Steam Adjusted Heat Rate | 7,143 | 7,089 | (54 | ) | (1 | ) | ||||||||
Texas — Commodity Margin in our Texas segment decreased by $81 million, or 11%, for the year ended December 31, 2016 compared to the year ended December 31, 2015, primarily due to lower realized Spark Spreads resulting from a decrease in hedge value and lower market liquidations, partially offset by positive contribution from our retail hedging activity following the acquisitions of Champion Energy and Calpine Solutions in October 2015 and December 2016, respectively.
East: | 2016 | 2015 | Change | % Change | ||||||||||
Commodity Margin (in millions) | $ | 958 | $ | 944 | $ | 14 | 1 | |||||||
Commodity Margin per MWh generated | $ | 27.88 | $ | 32.06 | $ | (4.18 | ) | (13 | ) | |||||
MWh generated (in thousands) | 34,362 | 29,441 | 4,921 | 17 | ||||||||||
Average availability | 89.7 | % | 89.0 | % | 0.7 | % | 1 | |||||||
Average total MW in operation | 9,752 | 9,119 | 633 | 7 | ||||||||||
Average capacity factor, excluding peakers | 50.4 | % | 48.8 | % | 1.6 | % | 3 | |||||||
Steam Adjusted Heat Rate | 7,617 | 7,663 | 46 | 1 | ||||||||||
East — Commodity Margin in our East segment increased by $14 million for the year ended December 31, 2016 compared to the year ended December 31, 2015, primarily due to the net year-over-year effect of our portfolio management activities, including the acquisition of our 695 MW Granite Ridge Energy Center on February 5, 2016, the commencement of commercial operations at our 309 MW Garrison Energy Center in June 2015, partially offset by the sale of our 375 MW Mankato Power Plant in October 2016. Also contributing to the year-over-year increase in Commodity Margin was the positive effect of a new PPA associated with our Morgan Energy Center, which became effective in February 2016, and higher contribution from our retail hedging activity during 2016 following the acquisitions of Champion Energy and Calpine Solutions in October 2015 and December 2016, respectively. The increase in Commodity Margin was partially offset by lower contribution from hedges in 2016 compared to 2015 and lower regulatory capacity revenue in PJM. Generation increased 17% primarily due to the acquisition of our 695 MW Granite Ridge Energy Center and the commencement of commercial operation at our 309 MW Garrison Energy Center.
Commodity Margin by Segment for the Years Ended December 31, 2015 and 2014
The following tables show our Commodity Margin and related operating performance metrics by segment for the years ended December 31, 2015 and 2014 (exclusive of the noncontrolling interest). In the comparative tables below, favorable variances are shown without brackets while unfavorable variances are shown with brackets. The MWh generated by segment below represent generation from power plants that we both consolidated and operate. Generation, average availability and Steam Adjusted Heat Rate exclude power plants and units that are inactive.
West: | 2015 | 2014 | Change | % Change | ||||||||||
Commodity Margin (in millions) | $ | 1,106 | $ | 1,050 | $ | 56 | 5 | |||||||
Commodity Margin per MWh generated | $ | 31.75 | $ | 30.71 | $ | 1.04 | 3 | |||||||
MWh generated (in thousands) | 34,836 | 34,195 | 641 | 2 | ||||||||||
Average availability | 89.2 | % | 92.9 | % | (3.7 | )% | (4 | ) | ||||||
Average total MW in operation | 7,475 | 7,524 | (49 | ) | (1 | ) | ||||||||
Average capacity factor, excluding peakers | 56.8 | % | 55.4 | % | 1.4 | % | 3 | |||||||
Steam Adjusted Heat Rate | 7,320 | 7,314 | (6 | ) | — | |||||||||
57
West — Commodity Margin in our West segment increased by $56 million, or 5%, for the year ended December 31, 2015 compared to the year ended December 31, 2014, primarily due to higher contribution from hedges, a 2% increase in generation from our power plants resulting from a decrease in hydroelectric generation in the Pacific Northwest and higher contractual REC revenues associated with our Geysers Assets resulting from more favorable REC pricing in 2015. The increase in Commodity Margin was partially offset by lower power prices and on-peak Spark Spreads resulting from lower natural gas prices, a wildfire in northern California in September 2015 which negatively affected our Geysers Assets and the expiration of the operating lease related to the Greenleaf power plants in June 2015.
Texas: | 2015 | 2014 | Change | % Change | ||||||||||
Commodity Margin (in millions) | $ | 736 | $ | 760 | $ | (24 | ) | (3 | ) | |||||
Commodity Margin per MWh generated | $ | 15.37 | $ | 19.65 | $ | (4.28 | ) | (22 | ) | |||||
MWh generated (in thousands) | 47,873 | 38,678 | 9,195 | 24 | ||||||||||
Average availability | 89.4 | % | 90.5 | % | (1.1 | )% | (1 | ) | ||||||
Average total MW in operation | 9,191 | 8,856 | 335 | 4 | ||||||||||
Average capacity factor, excluding peakers | 59.5 | % | 49.9 | % | 9.6 | % | 19 | |||||||
Steam Adjusted Heat Rate | 7,089 | 7,203 | 114 | 2 | ||||||||||
Texas — Commodity Margin in our Texas segment decreased by $24 million, or 3%, for the year ended December 31, 2015 compared to the year ended December 31, 2014, primarily due to lower contribution from summer hedges partially offset by the positive effect from hedging through our Champion Energy retail subsidiary beginning in the fourth quarter of 2015. Also contributing to the year-over-year decrease in Commodity Margin was lower on-peak Spark Spreads despite higher Market Heat Rates resulting from lower natural gas prices. The decrease in Commodity Margin was partially offset by a 24% increase in generation from our power plants resulting from higher off-peak Spark Spreads and lower natural gas prices that drove lower system-wide coal-fired generation from our competitors and a full year of operation in 2015 of our 1,000 MW Guadalupe Energy Center (which was acquired in February 2014) and our Deer Park and Channel Energy Center expansions (which were completed in June 2014).
East: | 2015 | 2014 | Change | % Change | ||||||||||
Commodity Margin (in millions) | $ | 944 | $ | 949 | $ | (5 | ) | (1 | ) | |||||
Commodity Margin per MWh generated | $ | 32.06 | $ | 34.21 | $ | (2.15 | ) | (6 | ) | |||||
MWh generated (in thousands) | 29,441 | 27,744 | 1,697 | 6 | ||||||||||
Average availability | 89.0 | % | 89.2 | % | (0.2 | )% | — | |||||||
Average total MW in operation | 9,119 | 10,272 | (1,153 | ) | (11 | ) | ||||||||
Average capacity factor, excluding peakers | 48.8 | % | 40.0 | % | 8.8 | % | 22 | |||||||
Steam Adjusted Heat Rate | 7,663 | 7,721 | 58 | 1 | ||||||||||
East — Commodity Margin in our East segment increased by $76 million for the year ended December 31, 2015 compared to the year ended December 31, 2014, after excluding a decrease of $81 million resulting from the sale of six power plants with a total capacity of 3,498 MW on July 3, 2014, primarily due to higher contribution from hedges, a full year of operation in 2015 of our 731 MW Fore River Energy Center which was acquired in November 2014 and the commencement of commercial operations at our 309 MW Garrison Energy Center in June 2015. Also contributing to the year-over-year increase in Commodity Margin was a 6% increase in generation resulting from lower natural gas prices that drove lower system-wide coal-fired generation from our competitors and the positive effect of a new contract for our Osprey Energy Center which became effective in the fourth quarter of 2014. The increase in Commodity Margin was partially offset by a significant decrease in power and natural gas prices in the first quarter of 2015 compared to the prior year period, given the unusually high price levels experienced during the polar vortex events in the first quarter of 2014 and lower regulatory capacity revenue in PJM during the first five months of 2015, partially offset by higher regulatory capacity revenue in PJM during the remaining seven months of 2015.
Adjusted EBITDA
We define Adjusted EBITDA, a non-GAAP financial measure, as EBITDA adjusted for certain items described below and presented in the accompanying reconciliation. Adjusted EBITDA is not a measure calculated in accordance with U.S. GAAP, and should be viewed as a supplement to, and not a substitute for, our results of operations presented in accordance with U.S.
58
GAAP. Adjusted EBITDA is not intended to represent cash flows from operations or net income (loss) as defined by U.S. GAAP as an indicator of operating performance. Furthermore, Adjusted EBITDA is not necessarily comparable to similarly-titled measures reported by other companies.
We believe Adjusted EBITDA is useful to investors and other users of our financial statements in evaluating our operating performance because it provides them with an additional tool to compare business performance across companies and across periods. We believe that EBITDA is widely used by investors to measure a company’s operating performance without regard to items such as interest expense, taxes, depreciation and amortization, which can vary substantially from company to company depending upon accounting methods and book value of assets, capital structure and the method by which assets were acquired.
Additionally, we believe that investors commonly adjust EBITDA information to eliminate the effect of restructuring and other expenses, which vary widely from company to company and impair comparability. As we define it, Adjusted EBITDA represents EBITDA adjusted for the effects of impairment losses, gains or losses on sales, dispositions or retirements of assets, any mark-to-market gains or losses from accounting for derivatives, adjustments to exclude the Adjusted EBITDA related to the noncontrolling interest, stock-based compensation expense, operating lease expense, non-cash gains and losses from foreign currency translations, major maintenance expense, gains or losses on the repurchase, modification or extinguishment of debt, non-cash GAAP-related adjustments to levelize revenues from tolling agreements and any unusual or non-recurring items plus adjustments to reflect the Adjusted EBITDA from our unconsolidated investments. We adjust for these items in our Adjusted EBITDA as our management believes that these items would distort their ability to efficiently view and assess our core operating trends.
In summary, our management uses Adjusted EBITDA as a measure of operating performance to assist in comparing performance from period to period on a consistent basis and to readily view operating trends, as a measure for planning and forecasting overall expectations and for evaluating actual results against such expectations, and in communications with our Board of Directors, shareholders, creditors, analysts and investors concerning our financial performance.
59
The tables below provide a reconciliation of Adjusted EBITDA to our income from operations on a segment basis and to net income attributable to Calpine on a consolidated basis for years ended December 31, 2016, 2015 and 2014 (in millions).
2016 | |||||||||||||||||||
West | Texas | East | Consolidation and Elimination | Total | |||||||||||||||
Net income attributable to Calpine | $ | 92 | |||||||||||||||||
Net income attributable to the noncontrolling interest | 19 | ||||||||||||||||||
Income tax expense | 48 | ||||||||||||||||||
Debt modification and extinguishment costs and other (income) expense, net | 49 | ||||||||||||||||||
Interest expense | 631 | ||||||||||||||||||
Income from operations | $ | 322 | $ | 37 | $ | 480 | $ | — | $ | 839 | |||||||||
Add: | |||||||||||||||||||
Adjustments to reconcile income from operations to Adjusted EBITDA: | |||||||||||||||||||
Depreciation and amortization expense, excluding debt issuance costs(1) | 219 | 213 | 224 | — | 656 | ||||||||||||||
Major maintenance expense | 70 | 88 | 93 | — | 251 | ||||||||||||||
Operating lease expense | — | — | 26 | — | 26 | ||||||||||||||
Mark-to-market (gain) loss on commodity derivative activity | 38 | (22 | ) | (15 | ) | — | 1 | ||||||||||||
Impairment losses | 13 | — | — | — | 13 | ||||||||||||||
(Gain) on sale of assets, net | — | — | (157 | ) | — | (157 | ) | ||||||||||||
Adjustments to reflect Adjusted EBITDA from unconsolidated investments and exclude the noncontrolling interest(2) | (27 | ) | — | 36 | — | 9 | |||||||||||||
Stock-based compensation expense | 11 | 11 | 9 | — | 31 | ||||||||||||||
Loss (gain) on dispositions of assets | 3 | 5 | (5 | ) | — | 3 | |||||||||||||
Contract amortization | 4 | 74 | 44 | — | 122 | ||||||||||||||
Other | 16 | 3 | 2 | — | 21 | ||||||||||||||
Total Adjusted EBITDA | $ | 669 | $ | 409 | $ | 737 | $ | — | $ | 1,815 | |||||||||
60
2015 | |||||||||||||||||||
West | Texas | East | Consolidation and Elimination | Total | |||||||||||||||
Net income attributable to Calpine | $ | 235 | |||||||||||||||||
Net income attributable to the noncontrolling interest | 14 | ||||||||||||||||||
Income tax benefit | (76 | ) | |||||||||||||||||
Debt modification and extinguishment costs and other (income) expense, net | 54 | ||||||||||||||||||
Interest expense | 628 | ||||||||||||||||||
Income from operations | $ | 528 | $ | 2 | $ | 324 | $ | 1 | $ | 855 | |||||||||
Add: | |||||||||||||||||||
Adjustments to reconcile income from operations to Adjusted EBITDA: | |||||||||||||||||||
Depreciation and amortization expense, excluding debt issuance costs(1) | 244 | 204 | 184 | — | 632 | ||||||||||||||
Major maintenance expense | 86 | 103 | 79 | — | 268 | ||||||||||||||
Operating lease expense | 4 | — | 26 | — | 30 | ||||||||||||||
Mark-to-market (gain) loss on commodity derivative activity | (121 | ) | 147 | 87 | — | 113 | |||||||||||||
Adjustments to reflect Adjusted EBITDA from unconsolidated investments and exclude the noncontrolling interest(2) | (24 | ) | — | 34 | — | 10 | |||||||||||||
Stock-based compensation expense | 10 | 10 | 6 | — | 26 | ||||||||||||||
Loss on dispositions of assets | 3 | 9 | 4 | — | 16 | ||||||||||||||
Contract amortization | — | 4 | 16 | — | 20 | ||||||||||||||
Other | 5 | 2 | — | (1 | ) | 6 | |||||||||||||
Total Adjusted EBITDA | $ | 735 | $ | 481 | $ | 760 | $ | — | $ | 1,976 | |||||||||
61
2014 | |||||||||||||||||||
West | Texas | East(3) | Consolidation and Elimination | Total | |||||||||||||||
Net income attributable to Calpine | $ | 946 | |||||||||||||||||
Net income attributable to the noncontrolling interest | 15 | ||||||||||||||||||
Income tax expense | 22 | ||||||||||||||||||
Debt extinguishment costs and other (income) expense, net | 361 | ||||||||||||||||||
Interest expense | 645 | ||||||||||||||||||
Income from operations | $ | 549 | $ | 329 | $ | 1,111 | $ | — | $ | 1,989 | |||||||||
Add: | |||||||||||||||||||
Adjustments to reconcile income from operations to Adjusted EBITDA: | |||||||||||||||||||
Depreciation and amortization expense, excluding debt issuance costs(1) | 240 | 191 | 167 | — | 598 | ||||||||||||||
Major maintenance expense | 64 | 91 | 79 | — | 234 | ||||||||||||||
Operating lease expense | 8 | — | 26 | — | 34 | ||||||||||||||
Mark-to-market gain on commodity derivative activity | (172 | ) | (114 | ) | (56 | ) | — | (342 | ) | ||||||||||
Impairment losses | — | — | 123 | — | 123 | ||||||||||||||
(Gain) on sale of assets, net | — | — | (753 | ) | — | (753 | ) | ||||||||||||
Adjustments to reflect Adjusted EBITDA from unconsolidated investments and exclude the noncontrolling interest(2) | (24 | ) | — | 29 | — | 5 | |||||||||||||
Stock-based compensation expense | 12 | 14 | 10 | — | 36 | ||||||||||||||
Loss on dispositions of assets | 1 | — | — | — | 1 | ||||||||||||||
Contract amortization | — | — | 14 | — | 14 | ||||||||||||||
Other | — | 3 | 7 | — | 10 | ||||||||||||||
Total Adjusted EBITDA | $ | 678 | $ | 514 | $ | 757 | $ | — | $ | 1,949 | |||||||||
_____________
(1) | Excludes depreciation and amortization expense attributable to the noncontrolling interest. |
(2) | Adjustments to reflect Adjusted EBITDA from unconsolidated investments include (gain) loss on mark-to-market activity of nil for each of the years ended December 31, 2016, 2015 and 2014, respectively. |
(3) | Our East segment includes Adjusted EBITDA of $43 million for the year ended December 31, 2014 related to the six power plants in our East segment that were sold in July 2014. |
62
LIQUIDITY AND CAPITAL RESOURCES
We maintain a strong focus on liquidity. We manage our liquidity to help provide access to sufficient funding to meet our business needs and financial obligations throughout business cycles.
Our business is capital intensive. Our ability to successfully implement our strategy is dependent on the continued availability of capital on attractive terms. In addition, our ability to successfully operate our business is dependent on maintaining sufficient liquidity. We believe that we have adequate resources from a combination of cash and cash equivalents on hand and cash expected to be generated from future operations to continue to meet our obligations as they become due.
Liquidity
The following table provides a summary of our liquidity position at December 31, 2016 and 2015 (in millions):
2016 | 2015 | ||||||
Cash and cash equivalents, corporate(1) | $ | 345 | $ | 850 | |||
Cash and cash equivalents, non-corporate | 73 | 56 | |||||
Total cash and cash equivalents | 418 | 906 | |||||
Restricted cash | 188 | 228 | |||||
Corporate Revolving Facility availability(2) | 1,255 | 1,184 | |||||
CDHI letter of credit facility availability | 50 | 59 | |||||
Total current liquidity availability(3) | $ | 1,911 | $ | 2,377 | |||
____________
(1) | Includes $16 million and $35 million of margin deposits posted with us by our counterparties at December 31, 2016 and 2015, respectively. See Note 9 of the Notes to Consolidated Financial Statements for further information related to our collateral. On January 3, 2017, we received $162 million in cash proceeds from the sale of Osprey Energy Center. See Note 3 of the Notes to Consolidated Financial Statements for further information related to our sale of Osprey Energy Center. |
(2) | Our ability to use availability under our Corporate Revolving Facility is unrestricted. On February 8, 2016, we amended our Corporate Revolving Facility, extending the maturity by two years to June 27, 2020, and increasing the capacity by an additional $178 million to $1,678 million through June 27, 2018, reverting back to $1,520 million through the maturity date. Further, we increased the letter of credit sublimit by $250 million to $1.0 billion and extended the maturity by two years to June 27, 2020. On December 1, 2016, we amended our Corporate Revolving Facility, increasing the capacity by $112 million to $1,790 million for the full term through June 27, 2020. |
(3) | Our ability to use corporate cash and cash equivalents is unrestricted. See Note 2 of the Notes to Consolidated Financial Statements for a description of the restrictions on our use of non-corporate cash and cash equivalents and restricted cash. Our $300 million CDHI letter of credit facility is restricted to support certain obligations under PPAs and power transmission and natural gas transportation agreements. |
Our principal source for future liquidity is cash flows generated from our operations. We believe that cash on hand and expected future cash flows from operations will be sufficient to meet our liquidity needs for our operations, both in the near and longer term. See “Cash Flow Activities” below for a further discussion of our change in cash and cash equivalents.
Our principal uses of liquidity and capital resources, outside of those required for our operations, include, but are not limited to, collateral requirements to support our commercial hedging and optimization activities, debt service obligations including principal and interest payments, capital expenditures for construction, project development and other growth initiatives and opportunistically repaying debt to manage our balance sheet. In addition, we may use capital resources to opportunistically repurchase our shares of common stock. The ultimate decision to allocate capital to share repurchases will be based upon the expected returns compared to alternative uses of capital.
Cash Management — We manage our cash in accordance with our cash management system subject to the requirements of our Corporate Revolving Facility and requirements under certain of our project debt and lease agreements or by regulatory agencies. Our cash and cash equivalents, as well as our restricted cash balances, are invested in money market funds that are not FDIC insured. We place our cash, cash equivalents and restricted cash in what we believe to be creditworthy financial institutions.
We have never paid cash dividends on our common stock. Future cash dividends, if any, may be authorized at the discretion of our Board of Directors and will depend upon, among other things, our future operations and earnings, capital requirements,
63
general financial condition, contractual and financing restrictions and such other factors as our Board of Directors may deem relevant.
Liquidity Sensitivity
Significant changes in commodity prices and Market Heat Rates can affect our liquidity as we use margin deposits, cash prepayments and letters of credit as credit support (collateral) with and from our counterparties for commodity procurement and risk management activities. Utilizing our portfolio of transactions subject to collateral exposure, we estimate that as of December 31, 2016, an increase of $1/MMBtu in natural gas prices would result in a decrease of collateral required by approximately $89 million. If natural gas prices decreased by $1/MMBtu, we estimate that our collateral requirements would increase by approximately $242 million. Changes in Market Heat Rates also affect our liquidity. For example, as demand increases, less efficient generation is dispatched, which increases the Market Heat Rate and results in increased collateral requirements. Historical relationships of natural gas and Market Heat Rate movements for our portfolio of assets have been volatile over time and are influenced by the absolute price of natural gas and the regional characteristics of each power market. We estimate that at December 31, 2016, an increase of 500 Btu/KWh in the Market Heat Rate would result in an increase in collateral required by approximately $25 million. If Market Heat Rates were to fall at a similar rate, we estimate that our collateral required would increase by $7 million. These amounts are not necessarily indicative of the actual amounts that could be required, which may be higher or lower than the amounts estimated above, and also exclude any correlation between the changes in natural gas prices and Market Heat Rates that may occur concurrently. These sensitivities will change as new contracts or hedging activities are executed.
In order to effectively manage our future Commodity Margin, we have economically hedged a portion of our expected generation and natural gas portfolio as well as retail load supply obligations, where appropriate, mostly through power and natural gas forward physical and financial transactions including retail power sales; however, we currently remain susceptible to significant price movements for 2017 and beyond. In addition to the price of natural gas, our Commodity Margin is highly dependent on other factors such as:
• | the level of Market Heat Rates; |
• | our continued ability to successfully hedge our Commodity Margin; |
• | changes in U.S. macroeconomic conditions; |
• | maintaining acceptable availability levels for our fleet; |
• | the effect of current and pending environmental regulations in the markets in which we participate; |
• | improving the efficiency and profitability of our operations; |
• | increasing future contractual cash flows; and |
• | our significant counterparties performing under their contracts with us. |
Additionally, scheduled outages related to the life cycle of our power plant fleet in addition to unscheduled outages may result in maintenance expenditures that are disproportionate in differing periods. In order to manage such liquidity requirements, we maintain additional liquidity availability in the form of our Corporate Revolving Facility (noted in the table above), letters of credit and the ability to issue first priority liens for collateral support. It is difficult to predict future developments and the amount of credit support that we may need to provide should such conditions occur, we experience another economic recession or energy commodity prices increase significantly.
Letter of Credit Facilities
The table below represents amounts issued under our letter of credit facilities at December 31, 2016 and 2015 (in millions):
2016 | 2015 | ||||||
Corporate Revolving Facility(1) | $ | 535 | $ | 316 | |||
CDHI | 250 | 241 | |||||
Various project financing facilities | 206 | 198 | |||||
Total | $ | 991 | $ | 755 | |||
____________
(1) | The Corporate Revolving Facility represents our primary revolving facility. |
64
Major Maintenance and Capital Spending
Our major maintenance and capital spending remains an important part of our business. Our expected expenditures for 2017 are as follows (in millions):
2017 | |||
Major maintenance expense | $ | 315 | |
Maintenance capital expenditures | 120 | ||
Growth related capital expenditures | 220 | ||
Total major maintenance expense and capital spending | $ | 655 | |
Wildfire at our Geysers Assets
In September 2015, a wildfire spread to our Geysers Assets in Lake and Sonoma counties, California. The wildfire affected several of our geothermal power plants in the region, which sustained damage to ancillary structures such as cooling towers and communication/electric deliverability infrastructure. Repairs have been completed and our Geysers Assets are currently generating renewable power for our customers at pre-fire levels. The repair and replacement costs, as well as our net revenue losses relating to the wildfire, were limited to our insurance deductibles of approximately $36 million, all of which was recognized in 2015. The losses incurred in 2016 related to the wildfire were primarily offset by insurance proceeds. We record insurance proceeds in the same financial statement line as the related loss is incurred and recorded approximately $24 million and $2 million in business interruption proceeds in operating revenues during the years ended December 31, 2016 and 2015, respectively. The wildfire and insurance proceeds recovery did not have a material effect on our financial condition, results of operations or cash flows.
Operating Event at our Delta Energy Center
On January 29, 2017, we experienced an operating event at our Delta Energy Center that resulted in an emergency shutdown of the power plant, the duration of which has yet to be determined. We are currently assessing the damage to the plant, in particular the steam turbine and steam turbine generator. Based on preliminary information, we anticipate that insurance will cover a significant portion of our losses, after applicable deductibles.
NOLs
We have significant NOLs that will provide future tax deductions when we generate sufficient taxable income during the applicable carryover periods. At December 31, 2016, our consolidated federal NOLs totaled approximately $6.7 billion. See Note 10 of the Notes to Consolidated Financial Statements for further discussion of our NOLs.
Cash Flow Activities
The following table summarizes our cash flow activities for the years ended December 31, 2016, 2015 and 2014 (in millions):
2016 | 2015 | 2014 | |||||||||
Beginning cash and cash equivalents | $ | 906 | $ | 717 | $ | 941 | |||||
Net cash provided by (used in): | |||||||||||
Operating activities | 1,030 | 876 | 870 | ||||||||
Investing activities | (1,919 | ) | (841 | ) | (84 | ) | |||||
Financing activities | 401 | 154 | (1,010 | ) | |||||||
Net (decrease) increase in cash and cash equivalents | (488 | ) | 189 | (224 | ) | ||||||
Ending cash and cash equivalents | $ | 418 | $ | 906 | $ | 717 | |||||
2016 — 2015
Net Cash Provided By Operating Activities
Cash provided by operating activities for the year ended December 31, 2016, was $1,030 million compared to $876 million for the year ended December 31, 2015. The increase was primarily due to:
• | Income from operations — Income from operations, adjusted for non-cash items, decreased by $136 million for the year ended December 31, 2016, compared to the same period in 2015. Non-cash items consist primarily of depreciation |
65
and amortization, income from unconsolidated subsidiaries, gain on sale of assets and mark-to-market activity. The decrease in income from operations was primarily driven by a $186 million decrease in Commodity revenue, net of Commodity expense, excluding non-cash amortization, partially offset by a $41 million decrease in plant operating expense. See “Results of Operations for the Year Ended December 31, 2016 and 2015” above for further discussion of these changes.
• | Working capital employed — Working capital employed decreased by $202 million for the year ended December 31, 2016, compared to the same period in 2015, after adjusting for changes in debt, restricted cash and mark-to-market related balances which did not affect cash provided by operating activities. The decrease was primarily due to the recovery of cash margin posted by Calpine Solutions through position netting and letter of credit conversion opportunities. |
• | Interest paid — Cash paid for interest decreased by $36 million to $584 million for the year ended December 31, 2016, from $620 million for the year ended December 31, 2015. The decrease was primarily due to our refinancing activities and timing of interest payments. |
• | Debt modification & extinguishment payments — During the year ended December 31, 2016, we made cash payments of $5 million related to the repurchase penalties for a portion of the 2023 First Lien Notes and the refinancing and upsizing of Steamboat project debt as compared to $34 million during the year ended December 31, 2015, associated with the repurchase penalties for a portion of the 2023 First Lien Notes and debt modification costs related to the issuance of the 2024 First Lien Term Loan. |
Net Cash Used In Investing Activities
Cash used in investing activities for the year ended December 31, 2016, was $1,919 million compared to $841 million for the year ended December 31, 2015. The increase was primarily due to:
• | Purchase of Calpine Solutions and Champion Energy — During the year ended December 31, 2016, we purchased the retail electric provider Calpine Solutions, formerly Noble Solutions, for $1.15 billion compared to the purchase of Champion Energy for $296 million during the year ended December 31, 2015. |
• | Purchase of Granite Ridge Energy Center — During the year ended December 31, 2016, we purchased a natural gas-fired combined-cycle power plant located in Londonderry, New Hampshire for $526 million. There were no similar acquisitions during the year ended December 31, 2015. |
• | Proceeds from the sale of Mankato Power Plant — During the year ended December 31, 2016, we received net proceeds after the pay-down of Steamboat project debt of approximately $164 million for the sale of Mankato Power Plant. There were no power plants sold during the year ended December 31, 2015. |
• | Capital expenditures — Capital expenditures for the year ended December 31, 2016, were $489 million, a decrease of $76 million, compared to expenditures of $565 million for the year ended December 31, 2015. The decrease was primarily due to lower expenditures on construction projects and outages. |
Net Cash Provided By Financing Activities
Cash provided by financing activities for the year ended December 31, 2016, was $401 million compared to $154 million for the year ended December 31, 2015. The increase was primarily due to:
• | First Lien Term Loans, First Lien Notes and Senior Unsecured Notes — During the year ended December 31, 2016, we received proceeds of $545 million from the issuance of the 2017 First Lien Term Loan used to partially fund the purchase of Calpine Solutions and redeemed $120 million of the 2023 First Lien Notes. In addition, we utilized proceeds from the issuance of the New 2023 First Lien Term Loan and the 2026 First Lien Notes to repay the 2019 and 2020 First Lien Term Loans of $1.2 billion. During the year ended December 31, 2015, we received proceeds of $650 million from the issuance of the 2024 Senior Unsecured Notes, proceeds of $545 million from the issuance of 2023 First Lien Term Loan used to fund the purchase of Granite Ridge Energy Center and repurchased $267 million of the 2023 First Lien Notes. In addition, we utilized proceeds from the issuance of the 2024 First Lien Term Loan to repay the 2018 First Lien Term Loan of $1.6 billion. |
• | Stock repurchases — During the year ended December 31, 2016, we repurchased an immaterial amount of common stock as compared to $529 million paid to repurchase our common stock during the year ended December 31, 2015. |
66
• | Project financing, notes payable and other — During the year ended December 31, 2016, we refinanced and upsized Steamboat project debt following the sale of Mankato Power Plant. The refinancing resulted in net proceeds received of $20 million after the noncash pay-down of the debt in the amount of $243 million in conjunction with the sale of Mankato and proceeds received from the upsizing and refinancing in the amount of $263 million. There were no similar activities during the year ended December 31, 2015. |
2015 — 2014
Net Cash Provided By Operating Activities
Cash provided by operating activities for the year ended December 31, 2015, was $876 million compared to $870 million for the year ended December 31, 2014. The increase was primarily due to:
• | Income from operations — Income from operations, adjusted for non-cash items, increased by $59 million for the year ended December 31, 2015, compared to the year ended December 31, 2014. Non-cash items consist primarily of depreciation and amortization, income from unconsolidated subsidiaries, impairment losses, gain on sale of assets, net and mark-to-market activity. The increase in income from operations was primarily driven by a $94 million increase in Commodity revenue, net of Commodity expense, excluding non-cash amortization of purchased intangible assets, partially offset by a $49 million increase in plant operating expense for the year ended December 31, 2015 compared to the year ended December 31, 2014. See “Results of Operations for the Years Ended December 31, 2015 and 2014” above for further discussion of these changes. |
• | Working capital employed — Working capital employed increased by $331 million for the year ended December 31, 2015, compared to the year ended December 31, 2014, after adjusting for changes in debt, restricted cash and mark-to-market related balances which did not affect cash provided by operating activities. The increase was primarily due to the change in net margining requirements for the year ended December 31, 2015, compared to the year ended December 31, 2014. |
• | Debt modification and extinguishment payments — Cash paid for debt modification and extinguishment decreased $276 million to $34 million during the year ended December 31, 2015, from $310 million for the year ended December 31, 2014. During the year ended December 31, 2015, we made cash payments of $13 million related to issuance costs associated with our 2024 First Lien Term Loan and cash payments of $21 million related to the repayment of a portion of our 2023 First Lien Notes, as compared to $310 million during the year ended December 31, 2014, which was associated with the repayment of our 2019 First Lien Notes, 2020 First Lien Notes and 2021 First Lien Notes and a portion of our 2023 First Lien Notes. |
Net Cash Used In Investing Activities
Cash used in investing activities for the year ended December 31, 2015, was $841 million compared to $84 million for the year ended December 31, 2014. The increase was primarily due to:
• | Proceeds from the sale of power plants and other — During the year ended December 31, 2014, we received proceeds of approximately $1.57 billion related to the completion of the sale of six power plants in our East segment. There was no similar activity during the year ended December 31, 2015. |
• | Purchase of Champion Energy, Fore River and Guadalupe Energy Centers — During the year ended December 31, 2015, we purchased the retail electric provider Champion Energy for $296 million compared to the purchase of two natural gas-fired, combined-cycle power plants located in North Weymouth, Massachusetts and Guadalupe County, Texas for $541 million and $656 million, respectively, during the year ended December 31, 2014. |
• | Capital expenditures — Capital expenditures for the year ended December 31, 2015, were $565 million, an increase of $73 million, compared to expenditures of $492 million for the year ended December 31, 2014. The increase was primarily due to higher expenditures on construction projects and outages during the year ended December 31, 2015, as compared to the year ended December 31, 2014. |
Net Cash Provided By (Used In) Financing Activities
Cash provided by financing activities for the year ended December 31, 2015, was $154 million compared to cash used in financing activities of $1,010 million for the year ended December 31, 2014. The increase was primarily due to:
• | First Lien Term Loans — During the year ended December 31, 2015, we received proceeds of approximately $1.6 billion from the issuance of the 2024 First Lien Term Loan which was used to repay the 2018 First Lien Term Loan of $1.6 billion. In addition, we received proceeds of approximately $545 million from the issuance of the 2023 First Lien Term Loan which is intended to be used, together with operating cash on hand, to fund the acquisition of Granite |
67
Ridge Energy Center, to repay project and corporate debt and for general corporate purposes. There was no similar activity during the year ended December 31, 2014.
• | CCFC refinancing — During the year ended December 31, 2014, we received proceeds of $420 million under the CCFC Term Loans, which were used to fund a portion of the purchase price paid in connection with the acquisition of the Guadalupe Energy Center. There was no similar activity during the year ended December 31, 2015. |
• | First Lien Notes and Senior Unsecured Notes — During the year ended December 31, 2015, we received proceeds of $650 million from the issuance of the 2024 Senior Unsecured Notes which were used to replenish cash on hand used for the acquisition of Fore River Energy Center in the fourth quarter of 2014, to repurchase $147 million of our 2023 First Lien Notes and for general corporate purposes. In addition, we redeemed $120 million of our 2023 First Lien Notes. During the year ended December 31, 2014, we received proceeds of $2.8 billion from the issuance of Senior Unsecured Notes, which were used to repurchase our 2019 First Lien Notes, 2020 First Lien Notes and 2021 First Lien Notes of $2.8 billion and we repurchased $120 million of our 2023 First Lien Notes. |
• | Stock repurchases — During the year ended December 31, 2015, we made payments of $529 million to repurchase our common stock compared to $1.1 billion during the year ended December 31, 2014. The decrease is primarily due to the repurchase of $311 million of common stock from a shareholder in a private transaction during the year ended December 31, 2014. |
Counterparties and Customers
Our counterparties and customers primarily consist of four categories of entities who participate in the energy markets: financial institutions and trading companies; regulated utilities, municipalities, cooperatives, ISOs and other retail power suppliers; oil, natural gas, chemical and other energy-related industrial companies; and commercial, industrial and residential retail customers. We have exposure to trends within the energy industry, including declines in the creditworthiness of our counterparties and customers. We have concentrations of credit risk with a few of our wholesale counterparties relating to our sales of power and steam and our hedging, optimization and trading activities. Currently, certain of our counterparties and customers within the energy industry have below investment grade credit ratings. We believe that our credit policies and portfolio of transactions adequately monitor and diversify our credit risk. Currently, our wholesale counterparties and retail customers are performing and financially settling timely according to their respective agreements with the exception of certain retail customers where our credit exposure is not material.
Credit Considerations
Our credit rating has, among other things, generally required us to post significant collateral with our hedging counterparties. Our collateral is generally in the form of cash deposits, letters of credit or first liens on our assets. See also Note 9 of the Notes to Consolidated Financial Statements for our use of collateral. Our credit rating reduces the number of hedging counterparties willing to extend credit to us and reduces our ability to negotiate more favorable terms with them. However, we believe that we will continue to be able to work with our hedging counterparties to execute beneficial hedging transactions and provide adequate collateral. At December 31, 2016, our First Lien Notes, First Lien Term Loans, Corporate Revolving Facility, Senior Unsecured Notes and our corporate rating had the following ratings and commentary from Standard and Poor’s and Moody’s Investors Service:
Standard and Poor’s | Moody’s Investors Service | ||
First Lien Notes, First Lien Term Loans and Corporate Revolving Facility rating | BB | Ba2 | |
Senior Unsecured Notes | B | B2 | |
Corporate rating | B+ | Ba3 | |
Commentary | Stable | Stable | |
Off Balance Sheet Arrangements
Our power plant operating lease is not reflected on our Consolidated Balance Sheets and contains customary restrictions on dividends up to Calpine Corporation, additional debt and further encumbrances similar to those typically found in project finance debt instruments. See Note 15 of the Notes to Consolidated Financial Statements for the future minimum lease payments under our power plant operating lease.
Some of our unconsolidated equity method investments have debt that is not reflected on our Consolidated Balance Sheets. As of December 31, 2016, our investments in Greenfield LP and Whitby had aggregate debt outstanding of $259 million. Based on our pro rata share of each of the investments, our share of such debt would be approximately $130 million. All such debt is non-recourse to us.
68
Guarantee Commitments — As part of our normal business operations, we enter into various agreements providing, or otherwise arranging, financial or performance assurance to third parties on behalf of our subsidiaries in the ordinary course of such subsidiaries’ respective business. Such arrangements include guarantees, standby letters of credit and surety bonds for power and natural gas purchase and sale arrangements, retail contracts, contracts associated with the development, construction, operation and maintenance of our fleet of power plants and our Accounts Receivable Sales Program. See Note 15 of the Notes to Consolidated Financial Statements for further information on our guarantee commitments.
Contractual Obligations — Our contractual obligations as of December 31, 2016, are as follows (in millions):
Total | Less than 1 Year | 1-3 Years | 3-5 Years | More than 5 Years | |||||||||||||||
Operating lease obligations(1) | $ | 364 | $ | 48 | $ | 103 | $ | 37 | $ | 176 | |||||||||
Purchase obligations: | |||||||||||||||||||
Commodity purchase obligations(2) | $ | 1,302 | $ | 285 | $ | 319 | $ | 159 | $ | 539 | |||||||||
LTSA(3) | 247 | 34 | 72 | 52 | 89 | ||||||||||||||
Water agreements(4) | 393 | 25 | 50 | 52 | 266 | ||||||||||||||
Other purchase obligations(5) | 491 | 201 | 119 | 94 | 77 | ||||||||||||||
Total purchase obligations | $ | 2,433 | $ | 545 | $ | 560 | $ | 357 | $ | 971 | |||||||||
Debt | $ | 12,369 | $ | 762 | $ | 723 | $ | 1,267 | $ | 9,617 | |||||||||
Other contractual obligations: | |||||||||||||||||||
Interest payments on debt(6) | $ | 3,985 | $ | 592 | $ | 1,181 | $ | 1,106 | $ | 1,106 | |||||||||
Liability for uncertain tax positions | 28 | 17 | 9 | 2 | — | ||||||||||||||
Interest rate hedging instruments(6) | 59 | 29 | 24 | 5 | 1 | ||||||||||||||
Total other contractual obligations | $ | 4,072 | $ | 638 | $ | 1,214 | $ | 1,113 | $ | 1,107 | |||||||||
___________
(1) | Included in the total are future minimum payments for power plant, office, land and other operating leases. See Note 15 of the Notes to Consolidated Financial Statements for more information. |
(2) | The amounts presented here include contracts for the purchase, transportation or storage of commodities accounted for as executory contracts and therefore not recognized as liabilities on our Consolidated Balance Sheet. |
(3) | The amounts presented here are based on the stated payment terms in the contracts at the time of execution, subject to an annual inflationary adjustment. |
(4) | The amounts presented here are based on contractually obligated amounts over the life of the contract. |
(5) | The amounts presented here include costs to complete construction projects, turbine commitments, parts supply agreements, maintenance agreements, information technology agreements and other purchase obligations. |
(6) | Amounts are projected based upon interest rates at December 31, 2016. |
Special Purpose Subsidiaries
Pursuant to applicable transaction agreements, we have established certain of our entities separate from Calpine Corporation and our other subsidiaries. In accordance with applicable accounting standards, we consolidate these entities with the exception of Calpine Receivables (see Note 5 of the Notes to Consolidated Financial Statements for further information related to Calpine Receivables). As of the date of filing of this Report, these entities included: Calpine King City Cogen, LLC, Calpine Securities Company, L.P. (a parent company of Calpine King City Cogen, LLC), Calpine King City, LLC (an indirect parent company of Calpine Securities Company, L.P.), Russell City Energy Company, LLC, OMEC and Calpine Receivables.
69
RISK MANAGEMENT AND COMMODITY ACCOUNTING
Our commercial hedging and optimization strategies are designed to maximize our risk-adjusted Commodity Margin by leveraging our knowledge, experience and fundamental views on natural gas and power. A description of risk management activities is included under Item 1. “Business — Marketing, Hedging and Optimization Activities.” See Note 8 of the Notes to Consolidated Financial Statements for further discussion of our derivative instruments.
The primary factors affecting our market risk and the fair value of our derivatives at any point in time are the volume of open derivative positions (MMBtu, MWh and $ notional amounts); changing commodity market prices, primarily for power and natural gas; our credit standing and that of our counterparties for energy commodity derivatives; and prevailing interest rates for our interest rate hedging instruments. Since prices for power and natural gas and interest rates are volatile, there may be material changes in the fair value of our derivatives over time, driven both by price volatility and the changes in volume of open derivative transactions. Our derivative assets have increased to approximately $2.3 billion at December 31, 2016, when compared to approximately $2.0 billion at December 31, 2015, and our derivative liabilities have decreased to approximately $2.1 billion at December 31, 2016, when compared to approximately $2.2 billion at December 31, 2015. The fair value of our level 3 derivative assets and liabilities at December 31, 2016 represents approximately 14% and 3% of our total assets and liabilities measured at fair value, respectively, with the majority of that value attributable to the fair value of retail sales contracts acquired in the acquisition of Calpine Solutions, formerly Noble Solutions, in December 2016. See Note 7 of the Notes to Consolidated Financial Statements for further information related to our level 3 derivative assets and liabilities.
The change in fair value of our outstanding commodity and interest rate hedging instruments from January 1, 2016, through December 31, 2016, is summarized in the table below (in millions):
Commodity Instruments | Interest Rate Hedging Instruments | Total | |||||||||
Fair value of contracts outstanding at January 1, 2016 | $ | (107 | ) | $ | (89 | ) | $ | (196 | ) | ||
Items recognized or otherwise settled during the period(1)(2) | (13 | ) | 46 | 33 | |||||||
Fair value attributable to new contracts | 44 | 24 | 68 | ||||||||
Changes in fair value attributable to price movements | 32 | (10 | ) | 22 | |||||||
Changes in fair value attributable to nonperformance risk | (3 | ) | — | (3 | ) | ||||||
Other changes in fair value(3) | 238 | — | 238 | ||||||||
Fair value of contracts outstanding at December 31, 2016(4) | $ | 191 | $ | (29 | ) | $ | 162 | ||||
__________
(1) | Commodity contract settlements consist of the realization of previously recognized gains on contracts not designated as hedging instruments of $102 million (represents a portion of Commodity revenue and Commodity expense as reported on our Consolidated Statements of Operations) and $89 million related to current period gains from other changes in derivative assets and liabilities not reflected in OCI or earnings. |
(2) | Interest rate settlements consist of $33 million related to realized losses from settlements of designated cash flow hedges and $5 million related to realized losses from settlements of undesignated interest rate hedging instruments (represents a portion of interest expense as reported on our Consolidated Statements of Operations) and $8 million of losses on interest rate hedging instruments that were terminated as a result of the repayment and refinancing of debt in fourth quarter of 2016. |
(3) | Consist of $238 million in gains related to hedges acquired from the acquisition of Calpine Solutions, formerly Noble Solutions. |
(4) | Net commodity and interest rate derivative assets and liabilities reported in Notes 7 and 8 of the Notes to Consolidated Financial Statements. |
Commodity Price Risk — Commodity price risks result from exposure to changes in spot prices, forward prices, price volatilities and correlations between the price of power, steam and natural gas. We manage the commodity price risk and the variability in future cash flows from forecasted sales of power and purchases of natural gas of our entire portfolio of generating assets and contractual positions by entering into various derivative and non-derivative instruments.
70
The net fair value of outstanding derivative commodity instruments at December 31, 2016, based on price source and the period during which the instruments will mature, are summarized in the table below (in millions):
Fair Value Source | 2017 | 2018-2019 | 2020-2021 | After 2021 | Total | |||||||||||||||
Prices actively quoted | $ | 16 | $ | (38 | ) | $ | (5 | ) | $ | (1 | ) | $ | (28 | ) | ||||||
Prices provided by other external sources | (40 | ) | (107 | ) | (17 | ) | — | (164 | ) | |||||||||||
Prices based on models and other valuation methods | 143 | 190 | 46 | 4 | 383 | |||||||||||||||
Total fair value | $ | 119 | $ | 45 | $ | 24 | $ | 3 | $ | 191 | ||||||||||
We measure the energy commodity price risk in our portfolio on a daily basis using a VAR model to estimate the potential one-day risk of loss based upon historical experience resulting from potential market movements. Our VAR is calculated for our entire portfolio comprising energy commodity derivatives, expected generation and natural gas consumption from our power plants, PPAs, and other physical and financial transactions. We measure VAR using a variance/covariance approach based on a confidence level of 95%, a one-day holding period and actual observed historical correlation. While we believe that our VAR assumptions and approximations are reasonable, different assumptions and/or approximations could produce materially different estimates.
The table below presents the high, low and average of our daily VAR for the years ended December 31, 2016 and 2015 (in millions):
2016 | 2015 | ||||||
Year ended December 31: | |||||||
High | $ | 39 | $ | 51 | |||
Low | $ | 14 | $ | 17 | |||
Average | $ | 23 | $ | 26 | |||
As of December 31 | $ | 20 | $ | 19 | |||
Due to the inherent limitations of statistical measures such as VAR, the VAR calculation may not capture the full extent of our commodity price exposure. As a result, actual changes in the value of our energy commodity portfolio could be different from the calculated VAR, and could have a material effect on our financial results. In order to evaluate the risks of our portfolio on a comprehensive basis and augment our VAR analysis, we also measure the risk of the energy commodity portfolio using several analytical methods including sensitivity analysis, non-statistical scenario analysis, including stress testing, and daily position report analysis.
We utilize the forward commodity markets to hedge price risk associated with our power plant portfolio. Our ability to hedge relies in part on market liquidity and the number of counterparties with which to transact. While the number of counterparties in these markets has decreased, to date this occurrence has not had a material adverse effect on our results of operations or financial condition. However, should these conditions persist or increase, it could decrease our ability to hedge our forward commodity price risk and create incremental volatility in our earnings. The effects of declining liquidity in the forward commodity markets is also mitigated by our retail subsidiaries which provides us with an additional outlet to transact hedging activities related to our wholesale power plant portfolio.
Liquidity Risk — Liquidity risk arises from the general funding requirements needed to manage our activities and assets and liabilities. Increasing natural gas prices or Market Heat Rates can cause increased collateral requirements. Our liquidity management framework is intended to maximize liquidity access and minimize funding costs during times of rising prices. See further discussion regarding our uses of collateral as they relate to our commodity procurement and risk management activities in Note 9 of the Notes to Consolidated Financial Statements.
Credit Risk — Credit risk relates to the risk of loss resulting from nonperformance or non-payment by our counterparties or customers related to their contractual obligations with us. Risks surrounding counterparty and customer performance and credit could ultimately affect the amount and timing of expected cash flows. We also have credit risk if counterparties or customers are unable to provide collateral or post margin. We monitor and manage our credit risk through credit policies that include:
• | credit approvals; |
• | routine monitoring of counterparties’ and customer’s credit limits and their overall credit ratings; |
• | limiting our marketing, hedging and optimization activities with high risk counterparties; |
• | margin, collateral, or prepayment arrangements; and |
71
• | payment netting arrangements, or master netting arrangements that allow for the netting of positive and negative exposures of various contracts associated with a single counterparty. |
We have concentrations of credit risk with a few of our wholesale counterparties and retail customers relating to our sales of power and steam and our hedging, optimization and trading activities. We believe that our credit policies and portfolio of transactions adequately monitor and diversify our credit risk, and currently our counterparties and customers are performing and financially settling timely according to their respective agreements. We monitor and manage our total comprehensive credit risk associated with all of our contracts irrespective of whether they are accounted for as an executory contract, a normal purchase normal sale or whether they are marked-to-market and included in our derivative assets and liabilities on our Consolidated Balance Sheets. Our counterparty and customer credit quality associated with the net fair value of outstanding derivative commodity instruments is included in our derivative assets and (liabilities) at December 31, 2016, and the period during which the instruments will mature are summarized in the table below (in millions):
Credit Quality (Based on Standard & Poor’s Ratings as of December 31, 2016) | 2017 | 2018-2019 | 2020-2021 | After 2021 | Total | |||||||||||||||
Investment grade | $ | 101 | $ | 23 | $ | 25 | $ | 2 | $ | 151 | ||||||||||
Non-investment grade | 23 | 31 | 3 | 3 | 60 | |||||||||||||||
No external ratings | (5 | ) | (9 | ) | (4 | ) | (2 | ) | (20 | ) | ||||||||||
Total fair value | $ | 119 | $ | 45 | $ | 24 | $ | 3 | $ | 191 | ||||||||||
Interest Rate Risk — We are exposed to interest rate risk related to our variable rate debt. Interest rate risk represents the potential loss in earnings arising from adverse changes in market interest rates. Our variable rate financings are indexed to base rates, generally LIBOR. The following table summarizes the contract terms as well as the fair values of our debt instruments exposed to interest rate risk as of December 31, 2016. All outstanding balances and fair market values are shown gross of applicable premium or discount, if any (in millions):
2017 | 2018 | 2019 | 2020 | 2021 | Thereafter | Total | Fair Value December 31, 2016 | ||||||||||||||||||||||||
Debt by Maturity Date: | |||||||||||||||||||||||||||||||
Fixed Rate | $ | 7 | $ | 7 | $ | 8 | $ | 8 | $ | 7 | $ | 5,799 | $ | 5,836 | $ | 5,776 | |||||||||||||||
Average Interest Rate | 6.5 | % | 6.5 | % | 6.6 | % | 6.5 | % | 6.1 | % | 5.8 | % | |||||||||||||||||||
Variable Rate | $ | 727 | $ | 177 | $ | 463 | $ | 1,015 | $ | 181 | $ | 3,700 | $ | 6,263 | $ | 6,270 | |||||||||||||||
Average Interest Rate(1) | 3.1 | % | 3.7 | % | 3.9 | % | 4.6 | % | 4.5 | % | 5.3 | % | |||||||||||||||||||
____________
(1) | Projection based upon forward LIBOR rates inferred from spot rates at December 31, 2016. |
Our variable rate financings are indexed to base rates, generally LIBOR. Interest rate risk represents the potential loss in earnings arising from adverse changes in market interest rates. The fair value of our interest rate hedging instruments are validated based upon external quotes. Our interest rate hedging instruments are with counterparties we believe are primarily high quality institutions, and we do not believe that our interest rate hedging instruments expose us to any significant credit risk. Holding all other factors constant, we estimate that a 10% decrease in interest rates would result in a change in the fair value of our interest rate hedging instruments hedging our variable rate debt of approximately $(15) million at December 31, 2016.
APPLICATION OF CRITICAL ACCOUNTING POLICIES
The preparation of financial statements in accordance with U.S. GAAP requires management to make certain estimates and assumptions which are inherently imprecise and may differ significantly from actual results achieved. We believe the following are our more critical accounting policies due to the significance, subjectivity and judgment involved in determining our estimates used in preparing our Consolidated Financial Statements. See Note 2 of the Notes to Consolidated Financial Statements for a discussion of the application of these and other accounting policies. We evaluate our estimates and assumptions used in preparing our Consolidated Financial Statements on an ongoing basis utilizing historic experience, anticipated future events or trends, consultation with third party advisors or other methods that involve judgment as determined appropriate under the circumstances. The resulting effects of changes in our estimates are recorded in our Consolidated Financial Statements in the period in which the facts and circumstances that give rise to the change in estimate become known.
72
Revenue Recognition
We routinely enter into physical commodity contracts for sales of our generated power to manage risk and capture the value inherent in our generation. Determining the proper accounting for our power contracts can require significant judgment and affect how we recognize revenue. In addition, we determine whether the contract should be accounted for on a gross or net basis. Determining the proper accounting treatment involves the evaluation of quantitative, as well as qualitative factors, to determine if the contract should be accounted for as one of the following:
• | a contract that qualifies as a lease; |
• | a derivative; |
• | a contract that meets the definition of a derivative but is eligible for the normal purchase normal sale exemption; or |
• | a contract that is a physical or executory contract. |
Lease Accounting — Revenue from contracts accounted for as operating leases, such as certain tolling agreements, with minimum lease rentals (capacity payments) which vary over time must be levelized. Generally, we levelize these contract revenues on a straight-line basis over the term of the contract.
Executory and Physical Contracts Exempt from Derivative Accounting — We generally recognize revenue from the sale of power or thermal energy for sale to our customers for use in industrial or other heating operations, upon transmission and delivery to the customer at the contractual price. In addition to revenues from power, host steam revenues and RECs from our Geysers Assets related to generation, our operating revenues also include:
• | power and steam revenue consisting of fixed and variable capacity payments, including capacity payments received from PJM and ISO-NE capacity auctions which are not related to generation; |
• | other revenues such as RMR Contracts, resource adequacy and certain ancillary service revenues; and |
• | other service revenues. |
Capacity payments, RMR Contracts, RECs, resource adequacy and other ancillary revenues, unless qualified as a lease, are recognized when contractually earned and consist of revenues received from our customers either at the market price or a contract price.
See “ — Accounting for Derivative Instruments” directly below for a discussion of the significant judgments and estimates related to accounting for derivative instruments. We apply lease accounting to contracts that meet the definition of a lease and accrual accounting treatment to those contracts that are either exempt from derivative accounting or do not meet the definition of a derivative instrument.
Gross vs. Net Accounting — We determine whether the financial statement presentation of revenues should be on a gross or net basis. Where we act as principal, we record settlement of our physical commodity contracts on a gross or net basis dependent upon whether the contract results in physical delivery of the underlying product. With respect to our physical executory contracts, where we do not take title to the commodities but receive a variable payment to convert natural gas into power and steam in a tolling operation, we record revenues on a net basis.
Fair Value Measurements
We use fair value to measure certain of our assets, liabilities and expenses in our financial statements. Fair value is the amount that would be received to sell an asset or paid to transfer a liability in an orderly transaction between market participants at the measurement date (i.e., the exit price). Generally, the determination of fair value requires the use of significant judgment and different approaches and models under varying circumstances. Under a market based approach, we consider prices of similar assets, consult with brokers and experts or employ other valuation techniques. Under an income based approach, we generally estimate future cash flows and then discount them at a risk adjusted rate.
Accordingly, the determination of fair value represents a critical accounting policy. Our most significant fair value measurements represent the valuation of our derivative assets and liabilities, which are measured on a recurring basis (each reporting period) and measurements of impairments and acquired assets on a nonrecurring basis. We primarily apply the market approach and income approach for recurring fair value measurements (primarily our derivative assets and liabilities) using the best available information. We primarily utilize the income approach for nonrecurring fair value measurements such as impairments of our assets as market prices for similar assets may not be readily available and may not incorporate the expected future returns from our assets. We utilize valuation techniques that seek to maximize the use of observable inputs and minimize the use of unobservable inputs. We classify fair value balances based on the observability of those inputs. U.S. GAAP establishes a fair value hierarchy which classifies fair value measurements from level 1 through level 3 based upon the inputs used to measure fair value:
73
Level 1 — Quoted prices (unadjusted) are available in active markets for identical assets or liabilities as of the reporting date. Active markets are those in which transactions for the asset or liability occur in sufficient frequency and volume to provide pricing information on an ongoing basis.
Level 2 — Pricing inputs include quoted prices for similar assets and liabilities in active markets, and inputs other than quoted prices that are observable for the asset or liability, either directly or indirectly, for substantially the full term of the financial instrument.
Level 3 — Pricing inputs include significant inputs that are generally less observable or from unobservable sources. These inputs may be used with internally developed methodologies that result in management’s best estimate of fair value.
Derivative Instruments and Valuation Techniques
The primary factors affecting the fair value of our derivative instruments at any point in time are the volume of open derivative positions (MMBtu, MWh and $ notional amounts); changing commodity market prices, primarily for power and natural gas; our credit standing and that of our counterparties and customers for energy commodity derivatives; and prevailing interest rates for our interest rate hedging instruments. Prices for power and natural gas and interest rates are volatile, which can result in material changes in the fair value measurements reported in our financial statements in the future. Derivative contracts can be exchange-traded or OTC. For OTC derivatives that trade in liquid markets, model inputs can generally be verified and model selection does not involve significant management judgment. Certain OTC derivatives trade in less liquid markets with limited pricing information, and the determination of fair value for these derivatives is inherently more difficult.
For our level 2 and level 3 derivative instruments, we utilize models to measure fair value. Where models are used, the selection of a particular model to value an asset or liability depends upon the contractual terms and specific risks, as well as the availability of pricing information in the market. We generally use similar models to value similar instruments. Valuation models require a variety of inputs, including contractual terms, market prices, yield curves, credit curves and measures of volatility. These models are primarily industry-standard models, including the Black-Scholes option-pricing model. Substantially all of these assumptions are observable in the marketplace throughout the full term of the instrument, can be derived from observable data or are supported by observable levels at which transactions are executed in the marketplace. In cases where there is no corroborating market information available to support significant model inputs, we initially use the transaction price as the best estimate of fair value.
Our derivative instruments that are traded on the NYMEX or Intercontinental Exchange primarily consist of natural gas swaps, futures and options and are classified as level 1 fair value measurements.
Our derivative instruments that primarily consist of interest rate hedging instruments and OTC power and natural gas forwards for which market-based pricing inputs in the principal or most advantageous market are representative of executable prices for market participants are classified as level 2 fair value measurements. These inputs are observable at commonly quoted intervals for substantially the full term of the instruments.
Our OTC power and natural gas forwards and options where pricing inputs are unobservable, as well as other complex and structured transactions primarily for the sale of power to both wholesale counterparties and retail customers are classified as level 3 fair value measurements. Complex or structured transactions are tailored to our customers’ needs and can introduce the need for internally-developed model inputs which might not be observable in or corroborated by the market. When such inputs have a significant effect on the measurement of fair value, the instrument is categorized in level 3. At each balance sheet date, we perform an analysis of all instruments subject to fair value measurement and include in level 3 all of those whose fair value is based on significant unobservable inputs.
The determination of fair value of our derivatives also includes consideration of our credit standing, the credit standing of our counterparties and customers and the effect of credit enhancements, if any. We assess non-performance risk by adjusting the fair value of our derivatives based on our credit standing or the credit standing of our counterparties and customers involved and the effect of credit enhancements, if any. Such valuation adjustments represent the amount of probable loss due to default either by us or a third party. Our credit valuation methodology is based on a quantitative approach which allocates a credit adjustment to the fair value of derivative transactions based on the net exposure of each counterparty or customer. We develop our credit reserve based on our expectation of the market participants’ perspective of potential credit exposure. Our calculation of the credit reserve on net asset positions is based on available market information including credit default swap rates, credit ratings and historical default information. We also incorporate non-performance risk in net liability positions based on an assessment of our potential risk of default.
74
Impairments
When we determine that an impairment exists, we determine fair value using valuation techniques such as the present value of expected future cash flows. In order to estimate future cash flows, we consider historical cash flows, existing and future contracts and PPAs and changes in the market environment and other factors that may affect future cash flows. To the extent applicable, the assumptions we use are consistent with forecasts that we are otherwise required to make (for example, in preparing our other earnings forecasts). The use of this method involves inherent uncertainty. We use our best estimates in making these evaluations and consider various factors, including forward price curves for power and fuel costs and forecasted operating costs. However, actual future market prices and project costs could vary from the assumptions used in our estimates, and the effect of such variations could be material.
We also discount the estimated future cash flows associated with the asset using a single interest rate representative of the risk involved with such an investment including contract terms, tenor and credit risk of counterparts. We may also consider prices of similar assets, consult with brokers, or employ other valuation techniques. We use our best estimates in making these evaluations; however, actual future market prices and project costs could vary from the assumptions used in our estimates, and the effect of such variations could be material.
Acquisitions of Assets and Liabilities
U.S. GAAP requires that the purchase price for an acquisition, such as the acquisitions of Granite Ridge Energy Center and Calpine Solutions, formerly Noble Solutions, be assigned and allocated to the individual assets and liabilities based upon their fair value. Generally, the amount recorded in the financial statements for an acquisition is the purchase price (value of the consideration paid), but a purchase price that exceeds the fair value of the assets acquired can result in the recognition of goodwill. In addition to the potential for the recognition of goodwill, differing fair values will affect the allocations of the purchase price to the individual assets and liabilities and can affect the gross amount and classification of assets and liabilities recorded on our Consolidated Balance Sheet and can affect the timing and the amount of depreciation expense recorded in any given period. We utilize our best effort to make our determinations and review all information available including estimated future cash flows and prices of similar assets when making our best estimate. We also may hire independent appraisers to help us make this determination as we deem appropriate under the circumstances.
Accounting for Derivative Instruments
We recognize all derivative instruments that qualify for derivative accounting treatment as either assets or liabilities and measure those instruments at fair value unless they qualify for, and we elect, the normal purchase normal sale exemption. For transactions in which we elect the normal purchase normal sale exemption, gains and losses are not reflected on our Consolidated Statements of Operations until the period of delivery. Revenues and expenses derived from instruments that qualified for hedge accounting or represent an economic hedge are recorded in the same financial statement line item as the item being hedged. Hedge accounting requires us to formally document, designate and assess the effectiveness of transactions that receive hedge accounting. We present the cash flows from our derivatives in the same category as the item being hedged (or economically hedged) within operating activities on our Consolidated Statements of Cash Flows unless they contain an other-than-insignificant financing element in which case their cash flows are classified within financing activities.
Hedge Accounting — Revenues and expenses derived from derivative instruments that qualify for hedge accounting are recorded in the period and same financial statement line item as the hedged item. Hedge accounting requires us to formally document, designate and assess the effectiveness of transactions that receive hedge accounting. We present the cash flows from hedging derivatives in the same category as the item being hedged within operating activities on our Consolidated Statements of Cash Flows unless they contain an other-than-insignificant financing element in which case their cash flows are classified within financing activities.
Cash Flow Hedges — We only apply hedge accounting to our interest rate hedging instruments. We report the effective portion of the mark-to-market gain or loss on our interest rate hedging instruments designated and qualifying as a cash flow hedging instrument as a component of OCI and reclassify such gains and losses into earnings in the same period during which the hedged forecasted transaction affects earnings. Gains and losses due to ineffectiveness on interest rate hedging instruments are recognized currently in earnings as a component of interest expense. If it is determined that the forecasted transaction is no longer probable of occurring, then hedge accounting will be discontinued prospectively and future changes in fair value are recorded in earnings. If the hedging instrument is terminated or de-designated prior to the occurrence of the hedged forecasted transaction, the net accumulated gain or loss associated with the changes in fair value of the hedge instrument remains deferred in AOCI until such time as the forecasted transaction affects earnings or until it is determined that the forecasted transaction is probable of not occurring.
Derivatives Not Designated as Hedging Instruments — We enter into power, natural gas, interest rate, environmental product and fuel oil transactions that primarily act as economic hedges to our asset and interest rate portfolio, but either do not
75
qualify as hedges under the hedge accounting guidelines or qualify under the hedge accounting guidelines and the hedge accounting designation has not been elected. Changes in fair value of commodity derivatives not designated as hedging instruments are recognized currently in earnings and are separately stated on our Consolidated Statements of Operations in mark-to-market gain/loss as a component of operating revenues (for physical and financial power and Heat Rate and commodity option activity) and fuel and purchased energy expense (for physical and financial natural gas, power, environmental product and fuel oil activity). Changes in fair value of interest rate derivatives not designated as hedging instruments are recognized currently in earnings as interest expense.
See Notes 7 and 8 of the Notes to Consolidated Financial Statements for further discussion of our derivative instruments.
Accounting for VIEs and Financial Statement Consolidation Criteria
We consolidate all VIEs where we determined that we have both the power to direct the activities of a VIE that most significantly affect the VIE’s economic performance and the obligation to absorb losses or receive benefits from the VIE. We have determined that we hold the obligation to absorb losses and receive benefits in all of our VIEs where we hold the majority equity interest. Therefore, our determination of whether to consolidate is based upon which variable interest holder has the power to direct the most significant activities of the VIE (the primary beneficiary). Our analysis includes consideration of the following primary activities which we believe to have a significant effect on a power plant’s financial performance: operations and maintenance, plant dispatch, and fuel strategy as well as our ability to control or influence contracting and overall plant strategy. Our approach to determining which entity holds the powers and rights is based on powers held as of the balance sheet date. Contractual terms that may change the powers held in future periods, such as a purchase or sale option, are not considered in our analysis. Based on our analysis, we believe that we hold the power and rights to direct the most significant activities of all our majority owned VIEs.
Under our consolidation policy and under U.S. GAAP we also:
• | perform an ongoing reassessment each reporting period of whether we are the primary beneficiary of our VIEs; and |
• | evaluate if an entity is a VIE and whether we are the primary beneficiary whenever any changes in facts and circumstances occur such that the holders of the equity investment at risk, as a group, lose the power from voting rights or similar rights of those investments to direct the activities of a VIE that most significantly affect the VIE’s economic performance or when there are other changes in the powers held by individual variable interest holders. |
Because we are required to perform ongoing reassessments of whether we are the primary beneficiary, future changes in our assessments of whether we are the primary beneficiary could require us to consolidate our VIEs that are currently not consolidated or deconsolidate our VIEs that are currently consolidated based upon our reassessments in future periods. Making these determinations can require the use of significant judgment to determine which variable interest holder has the power to direct the most significant activities of the VIE (the primary beneficiary) and can directly affect amounts reported on our Consolidated Financial Statements.
Disclosure Requirements
U.S. GAAP requires separate disclosure on the face of our Consolidated Balance Sheets of the significant assets of a consolidated VIE that can be used only to settle obligations of the consolidated VIE and the significant liabilities of a consolidated VIE for which creditors (or beneficial interest holders) do not have recourse to the general credit of the primary beneficiary. In determining which assets of our VIEs meet the separate disclosure criteria, we consider that this separate disclosure requirement is met where Calpine Corporation is substantially limited or prohibited from access to assets (primarily cash and cash equivalents, restricted cash and property, plant and equipment), and where our VIEs had project financing that prohibits the VIE from providing guarantees on the debt of others. In determining which liabilities of our VIEs meet the separate disclosure criteria, we consider that this separate disclosure requirement is met where there are agreements that prohibit the debt holders of the VIEs from recourse to the general credit of Calpine Corporation and where the amounts were material to our financial statements.
Unconsolidated VIEs
We have a 50% partnership interest in Greenfield LP and in Whitby. Greenfield LP and Whitby are also VIEs; however, we do not have the power to direct the most significant activities of these entities and therefore do not consolidate them. We account for these entities under the equity method of accounting and include our net equity interest in investments in unconsolidated subsidiaries on our Consolidated Balance Sheets. Our equity interest in the net income from Greenfield LP and Whitby for the years ended December 31, 2016, 2015 and 2014, are recorded in (income) from unconsolidated subsidiaries.
76
We have a 100% membership interest in Calpine Receivables, a bankruptcy remote entity created for the special purpose of purchasing trade accounts receivable from Calpine Solutions under the Accounts Receivable Sales Program. Calpine Receivables is a VIE as we have determined that we do not have the power to direct the activities of the VIE that most significantly affect the VIE’s economic performance nor the obligation to absorb losses or receive benefits from the VIE. Accordingly, we have determined that we are not the primary beneficiary of Calpine Receivables as we do not have the power to affect its financial performance as the unaffiliated financial institutions that purchase the receivables from Calpine Receivables control the selection criteria of the receivables sold and appoint the servicer of the receivables which controls management of default. Thus, we do not consolidate Calpine Receivables in our Consolidated Financial Statements and we use the equity method of accounting to record our net interest in Calpine Receivables.
We hold a call option to purchase the Inland Empire Energy Center (a 775 MW natural gas-fired power plant located in California) from GE that may be exercised between years 2017 and 2024. GE holds a put option whereby they can require us to purchase the power plant, if certain plant performance criteria are met by 2025. We determined that we are not the primary beneficiary of the Inland Empire power plant, and we do not consolidate it due to the fact that GE directs the most significant activities of the power plant including operations and maintenance.
Long-Lived Assets and Depreciation Expense
Determination of the appropriate depreciation method, proper useful lives and salvage values involves significant judgment, estimates, assumptions and historical experience. Changes in our estimates and methods can result in a significant change in the amounts and timing of when we recognize depreciation expense and therefore significantly affect our financial condition and results of operations from period to period. Different depreciation methods can affect the timing and amount of depreciation expense affecting our results of operations and could result in different net book values of assets at a particular time during the useful life of the asset affecting our financial position. Estimates of useful lives also significantly affect the timing and amounts of depreciation expense and include significant estimates. If useful lives are too short, then the asset is depreciated too quickly and depreciation expense is overstated. Estimated useful lives can significantly decrease if routine maintenance or certain upgrades are not performed, premature mechanical failure of the asset occurs, significant increases in the planned level of usage occur, advances in technology make the asset obsolete, or if there are adverse changes in environmental regulations. Our depreciable cost basis of our assets is reduced by the assets’ estimated salvage values. Dependent upon our ability to accurately estimate salvage values and the timing of disposal, the salvage values actually realized for our assets could significantly increase or decrease resulting in additional gains or losses in the year of disposal.
We depreciate our assets under the straight-line method over the shorter of their estimated useful lives or lease term. For our natural gas-fired power plants, we assume an estimated salvage value which approximates 10% of the depreciable cost basis where we own the power plant or have a favorable option to purchase the power plant or take ownership of the power plant at conclusion of the lease term and approximately 0.15% of the depreciable costs basis for rotable equipment. For our Geysers Assets, we typically assume no salvage values. We use the component depreciation method for our natural gas-fired power plant rotable parts and our information technology equipment and the composite depreciation method for most of all of the other natural gas-fired power plant asset groups and Geysers Assets.
Impairment Evaluation of Long-Lived Assets (Including Goodwill, Intangibles and Investments)
We evaluate our long-lived assets, such as property, plant and equipment, equity method investments, turbine equipment and specifically identified intangibles, on an annual basis or when events or changes in circumstances indicate that the carrying value of such assets may not be recoverable. Examples of such events or changes in circumstances are:
• | a significant decrease in the market price of a long-lived asset; |
• | a significant adverse change in the manner an asset is being used or its physical condition; |
• | an adverse action by a regulator or legislature or an adverse change in the business climate; |
• | an accumulation of costs significantly in excess of the amount originally expected for the construction or acquisition of an asset; |
• | a current-period loss combined with a history of losses or the projection of future losses; or |
• | a change in our intent about an asset from an intent to hold to a greater than 50% likelihood that an asset will be sold or disposed of before the end of its previously estimated useful life. |
When we believe an impairment condition on long-lived assets such as property, plant and equipment may have occurred, we are required to estimate the undiscounted future cash flows associated with a long-lived asset or group of long-lived assets at the lowest level for which identifiable cash flows are largely independent of the cash flows of other assets and liabilities for long-lived assets that are expected to be held and used. We use a fundamental long-term view of the power market which is based on
77
long-term production volumes, price curves and operating costs together with the regulatory and environmental requirements within each individual market to prepare our multi-year forecast. Since we manage and market our power sales as a portfolio rather than at the individual power plant level or customer level within each designated market, pool or segment, we group our power plants based upon the corresponding market for valuation purposes. If we determine that the undiscounted cash flows from an asset or group of assets to be held and used are less than the associated carrying amount, or if we have classified an asset as held for sale, we must estimate fair value to determine the amount of any impairment loss.
We have temporarily suspended operations at our Sutter Energy Center. While the long-term market forecasted cash flows continue to support the carrying value of the asset, if the forecasted cash flows were to materially deteriorate, this could result in a permanent shut down of the facility and in the recognition of an impairment of our Sutter Energy Center and other plants within the respective market.
When we believe an impairment condition may exist on specifically identifiable finite-lived intangibles or an investment, we must estimate their fair value to determine the amount of any impairment loss. Significant judgment is required in determining fair value as discussed above in “— Fair Value Measurements.”
We test goodwill and all intangible assets not subject to amortization for impairments at least annually, or more frequently whenever an event or change in circumstances occurs that would more likely than not reduce the fair value of a reporting unit below its carrying amount. We test goodwill for impairment at the reporting unit level, which is identified one level below the Company’s operating segments for which discrete financial information is available and management regularly reviews the operating results. We perform an annual impairment assessment in the third quarter of each year, or more frequently if indicators of potential impairment exist, to determine whether it is more likely than not that the fair value of a reporting unit in which goodwill resides is less than its carrying value. For reporting units in which this assessment concludes that it is more likely than not that the fair value is more than its carrying value, goodwill is not considered impaired and we are not required to perform the two-step goodwill impairment test. Qualitative factors considered in this assessment include industry and market considerations, overall financial performance, and other relevant events and factors affecting the reporting unit.
For reporting units in which the impairment assessment concludes that it is more likely than not that the fair value is less than its carrying value, we perform the first step of the goodwill impairment test, which compares the fair value of the reporting unit to its carrying value. If the fair value of the reporting unit exceeds the carrying value of the net assets assigned to that unit, goodwill is not considered impaired and we are not required to perform additional analysis. If the carrying value of the net assets assigned to the reporting unit exceeds the fair value of the reporting unit, then we must perform the second step of the goodwill impairment test to determine the implied fair value of the reporting unit’s goodwill. If we determine during the second step that the carrying value of a reporting unit’s goodwill exceeds its implied fair value, we record an impairment loss equal to the difference.
All construction and development projects are reviewed for impairment whenever there is an indication of potential reduction in fair value. If it is determined that it is no longer probable that the projects will be completed and all capitalized costs recovered through future operations, the carrying values of the projects would be written down to their fair value. When we determine that our assets meet the assets held-for-sale criteria, they are reported at the lower of the carrying amount or fair value less the cost to sell. We are also required to evaluate our equity method investments to determine whether or not they are impaired when the value is considered an “other than a temporary” decline in value.
See Note 2 of the Notes to Consolidated Financial Statements for further discussion of our impairment evaluation of long-lived assets.
Accounting for Income Taxes
To arrive at our consolidated income tax provision and other tax balances, significant judgment and estimates are required. Although we believe that our estimates are reasonable, no assurance can be given that the final tax outcome of these matters will not be different than that which is reflected in our historical tax provisions and accruals. Such differences could have a material effect on our income tax provision, other tax accounts and net income in the period in which such determination is made.
As of December 31, 2016, our NOL carryforwards consisted primarily of federal NOL carryforwards of approximately $6.7 billion, which expire between 2024 and 2033, and NOL carryforwards in 21 states and the District of Columbia totaling approximately $3.7 billion, which expire between 2017 and 2036, substantially all of which are offset with a full valuation allowance. We also have approximately $647 million in foreign NOLs, which expire between 2025 and 2033, of which a portion is offset with a valuation allowance. The NOL carryforwards available are subject to limitations on their annual usage. Under federal and applicable state income tax laws, a corporation is generally permitted to deduct from taxable income in any year NOLs carried forward from prior years subject to certain time limitations as prescribed by the taxing authorities.
78
In the ordinary course of business, there are many transactions and calculations where the ultimate tax outcome is uncertain. Some of these uncertainties arise as a consequence of the treatment of capital assets, financing transactions, multistate taxation of operations and segregation of foreign and domestic income and expense to avoid double taxation. We recognize the financial statement effects of a tax position when it is more likely than not, based on the technical merits, that the position will be sustained upon examination. A tax position that meets the more-likely-than-not recognition threshold is measured as the largest amount of tax benefit that is greater than 50% likely of being realized upon ultimate settlement with a taxing authority. We reverse a previously recognized tax position in the first period in which it is no longer more likely than not that the tax position would be sustained upon examination. The determination and calculation of uncertain tax positions involves significant judgment in the application of complex tax laws. Resolution of these uncertainties in a manner inconsistent with our expectations could have a material effect on our financial condition or results of operations. As of December 31, 2016, we had $59 million of unrecognized tax benefits from uncertain tax positions.
See Note 10 of the Notes to Consolidated Financial Statements for further discussion of our accounting for income taxes.
New Accounting Standards and Disclosure Requirements
See Note 2 of the Notes to Consolidated Financial Statements for a discussion of new accounting standards and disclosure requirements.
Item 7A. | Quantitative and Qualitative Disclosures about Market Risk |
The information required hereunder is set forth under Item 7. “Management’s Discussion and Analysis of Financial Condition and Results of Operations — Risk Management and Commodity Accounting.”
Item 8. | Financial Statements and Supplementary Data |
The information required hereunder is set forth under “Report of Independent Registered Public Accounting Firm,” “Consolidated Statements of Operations,” “Consolidated Statements of Comprehensive Income,” “Consolidated Balance Sheets,” “Consolidated Statements of Stockholders’ Equity,” “Consolidated Statements of Cash Flows,” and “Notes to Consolidated Financial Statements” included in the Consolidated Financial Statements that are a part of this Report. Other financial information and schedules are included in the Consolidated Financial Statements that are a part of this Report.
Item 9. | Changes in and Disagreements with Accountants on Accounting and Financial Disclosure |
None.
Item 9A. | Controls and Procedures |
Disclosure Controls and Procedures
We maintain disclosure controls and procedures that are designed to ensure that information required to be disclosed in our Exchange Act reports is recorded, processed, summarized and reported within the time periods specified in the SEC’s rules and forms, and that such information is accumulated and communicated to our management, including our Chief Executive Officer and Chief Financial Officer, as appropriate, to allow timely decisions regarding required financial disclosure.
As of the end of the period covered by this Report, we carried out an evaluation, under the supervision and with the participation of our management, including our Chief Executive Officer and Chief Financial Officer, of the effectiveness of the design and operation of our disclosure controls and procedures as defined in Rule 13a-15(e) or Rule 15d-15(e) of the Exchange Act. Based upon, and as of the date of, this evaluation, the Chief Executive Officer and the Chief Financial Officer concluded that our disclosure controls and procedures were effective such that the information required to be disclosed in our SEC reports is recorded, processed, summarized and reported within the time periods specified in SEC rules and forms, and is accumulated and communicated to our management, including our Chief Executive Officer and Chief Financial Officer, as appropriate to allow timely decisions regarding required disclosure.
Management’s Report on Internal Control over Financial Reporting
Our management is responsible for establishing and maintaining adequate internal control over financial reporting (as defined in Rules 13a-15(f) and 15d-15(f) under the Exchange Act). Our internal control over financial reporting is a process designed to provide reasonable assurance regarding the reliability of financial reporting and the preparation of financial statements for external purposes in accordance with U.S. GAAP.
79
Our internal control over financial reporting includes those policies and procedures that:
• | pertain to the maintenance of records that, in reasonable detail, accurately and fairly reflect the transactions and dispositions of our assets; |
• | provide reasonable assurance that transactions are recorded as necessary to permit preparation of financial statements in accordance with U.S. GAAP, and that our receipts and expenditures are being made only in accordance with authorizations of our management and directors; and |
• | provide reasonable assurance regarding prevention or timely detection of unauthorized acquisition, use, or disposition of our assets that could have a material effect on our financial statements. |
Management has assessed the effectiveness of our internal control over financial reporting as of December 31, 2016. In making its assessment of internal control over financial reporting, management used the criteria described in Internal Control — Integrated Framework (2013) issued by the Committee of Sponsoring Organizations of the Treadway Commission.
Based on management’s assessment, management has concluded that our internal control over financial reporting was effective as of December 31, 2016 to provide reasonable assurance regarding the reliability of financial reporting and the preparation of consolidated financial statements for external reporting purposes in accordance with U.S. GAAP.
In accordance with guidance issued by the SEC, companies are permitted to exclude acquisitions from their final assessment of internal control over financial reporting for the first fiscal year in which the acquisition occurred. On December 1, 2016 and as further discussed in Note 3 of the Notes to Consolidated Financial Statements, we completed the acquisition of Calpine Solutions, formerly Noble Solutions, which represented approximately 7% of total assets and 2% of revenues of our related consolidated financial statement amounts as of and for the year ended December 31, 2016. We have elected to exclude Calpine Solutions’ operations from our assessment of internal control over financial reporting as of December 31, 2016.
The effectiveness of our internal control over financial reporting as of December 31, 2016, has been audited by PricewaterhouseCoopers LLP, an independent registered public accounting firm, as stated in their report which appears herein.
Changes in Internal Control Over Financial Reporting
During the fourth quarter of 2016, there were no changes in our internal control over financial reporting (as defined in Rules 13a-15(f) and 15d-15(f) under the Exchange Act) that materially affected, or are reasonably likely to materially affect, our internal control over financial reporting.
Item 9B. | Other Information |
Effective February 9, 2017, Trey Griggs, formerly our Executive Vice President and Chief Commercial Officer, will assume a new role as Executive Vice President and President, Calpine Retail, leading the integration and expansion of our retail platform. Andrew Novotny, Senior Vice President of Commercial Operations, and Caleb Stephenson, Senior Vice President of Wholesale Origination and Commercial Analytics, will oversee our wholesale business and report directly to Thad Hill, our President and Chief Executive Officer.
80
PART III
Item 10. | Directors, Executive Officers and Corporate Governance |
Identification of Executive Officers
Set forth in the table below is a list of our executive officers, together with certain biographical information, including their ages as of the date of this Report:
Name | Age | Position | |||
John B. (Thad) Hill III | 49 | President and Chief Executive Officer | |||
Zamir Rauf | 57 | Executive Vice President and Chief Financial Officer | |||
W. Thaddeus Miller | 66 | Executive Vice President, Chief Legal Officer and Secretary | |||
W.G. (Trey) Griggs III | 46 | Executive Vice President and President, Calpine Retail | |||
Charles M. Gates | 65 | Executive Vice President, Power Operations | |||
Jeff Koshkin | 42 | Senior Vice President and Chief Accounting Officer | |||
John B. (Thad) Hill III has served as our President and Chief Executive Officer and as a member of our Board of Directors since May 14, 2014. He previously served as our President and Chief Operating Officer from December 2012, as our Executive Vice President and Chief Operating Officer from November 2010 to December 2012 and as our Executive Vice President and Chief Commercial Officer from September 2008 to November 2010. Prior to joining the Company, Mr. Hill served as Executive Vice President of NRG Energy, Inc. from February 2006 to September 2008 and President of NRG Texas LLC from December 2006 to September 2008. Prior to joining NRG Energy, Inc., Mr. Hill was Executive Vice President of Strategy and Business Development at Texas Genco LLC from 2005 to 2006. From 1995 to 2005, Mr. Hill was with Boston Consulting Group, Inc., where he rose to Partner and Managing Director and led the North American energy practice, serving companies in the power and natural gas sectors with a focus on commercial and strategic issues. Mr. Hill received his Bachelor of Arts degree from Vanderbilt University and a Master of Business Administration degree from the Amos Tuck School of Dartmouth College.
Zamir Rauf has served as our Executive Vice President and Chief Financial Officer since December 17, 2008, after serving as Interim Chief Financial Officer from June 4, 2008. Previously, he served as our Senior Vice President, Finance and Treasurer from September 2007 until his appointment as Interim Chief Financial Officer. Since joining the Company in February 2000, Mr. Rauf has served as Manager, Finance from February 2000 to April 2001, Director, Finance from April 2001 to December 2002, Vice President, Finance from December 2002 to July 2005 and Senior Vice President, Finance from July 2005 to September 2007. Prior to joining the Company, Mr. Rauf held various accounting and finance roles with Enron North America and Dynegy Inc., as well as credit and lending roles with Comerica Bank. Mr. Rauf earned his Bachelor of Arts degree in Business and Commerce and Masters in Business Administration – Finance degree from the University of Houston.
W. Thaddeus Miller has served as our Executive Vice President, Chief Legal Officer and Secretary since August 12, 2008. Prior to joining the Company, Mr. Miller served as Executive Vice President and Chief Legal Officer of Texas Genco LLC from December 2004 until February 2006. From 2002 to 2004, Mr. Miller was a consultant to Texas Pacific Group, a private equity firm. From 1999 to 2002, he served as Executive Vice President and Chief Legal Officer of Orion Power Holdings, Inc., an independent power producer. From 1994 to 1999, Mr. Miller was a Vice President of Goldman Sachs & Co., where he focused on wholesale electric and other energy commodity trading. Before joining Goldman Sachs & Co., Mr. Miller was a partner in a New York law firm. Mr. Miller earned his Bachelor of Science degree from the U.S. Merchant Marine Academy and his Juris Doctor degree from St. John’s School of Law. In addition, Mr. Miller was an officer in the U.S. Coast Guard from 1973 through 1976.
W.G. (Trey) Griggs III has served as our Executive Vice President and President, Calpine Retail since February 2017, after serving as our Executive Vice President and Chief Commercial Officer since June 2015. As President, Calpine Retail, he oversees our retail subsidiaries comprising Calpine Solutions, Champion Energy and North American Power. Before joining Calpine, Mr. Griggs was a Managing Director at Goldman Sachs & Co., leading its North American Energy Risk Management Franchise activities and its Houston Trading Office beginning in 2011. Prior to that, he served in various roles with Goldman Sachs’ commodities group in New York. From 1995-2000, he was an attorney at law firms in Houston and Greenville, S.C. Mr. Griggs holds an MBA from the Wharton School of the University of Pennsylvania, a Juris Doctorate from University of Houston School of Law, and a Bachelor of Arts degree from Vanderbilt University.
81
Charles M. Gates joined Calpine as Executive Vice President of Power Operations in April 2016. Previously, Mr. Gates had served as Senior Vice President and Chief Fossil/Hydro Officer for Duke Energy Corporation (“Duke”) since August 2014. He had been Duke’s Senior Vice President of Power Generation Operations since July 2012, when Progress Energy, Inc. merged with Duke. Mr. Gates had served in a similar capacity for Progress Energy, Inc. since January 2012 after being promoted from Vice President of Fossil Generation for Progress Energy, Inc. for the Carolinas and Florida. He was previously General Manager of Progress Energy Florida from the time the company merged with Carolina Power & Light Company in 2001 to 2006. Mr. Gates began his power industry career with Carolina Power & Light in 1982 as an associate engineer and moved up through increasingly responsible positions to become General Manager of five fossil fuel plants in 2000. Mr. Gates’ other industry leadership roles include serving as Chairman of the Generation Council for the Electric Power Research Institute. He earned bachelor’s degrees in chemical engineering from North Carolina State University and in political science from the University of North Carolina.
Jeff Koshkin has served as Calpine’s Senior Vice President and Chief Accounting Officer since August 1, 2015. He joined Calpine in December 2008 and has served in a number of leadership roles including the Controller of Commercial Operations and Controller of Corporate and Plant Accounting, as well as in interim roles heading Financial Planning and Analysis and as Chief Risk Officer. Prior to Calpine, Mr. Koshkin was a Senior Manager in the Regulatory and Capital Markets practice for Deloitte and Touche, LLP. He holds a master’s degree in Professional Accounting from the University of Texas at Austin. Mr. Koshkin is a Certified Public Accountant and a member of the American Institute of Certified Public Accountants and the Texas Society of Certified Public Accountants.
The remaining information required by this Item is incorporated herein by reference to the sections entitled “Board Meetings and Board Committee Information — Committees and Committee Charters” and “ — Audit Committee,” “Proposal 1 — Election of Directors,” “Section 16(a) Beneficial Ownership Reporting Compliance,” and “Corporate Governance Matters — Code of Conduct and Ethics” in our proxy statement for the 2017 annual meeting of stockholders to be held on May 10, 2017 (the “Proxy Statement”).
Item 11. | Executive Compensation |
Information required by this Item is incorporated herein by reference to the sections entitled “Compensation Discussion and Analysis,” “Executive Compensation,” “Director Compensation” and “Board Meeting and Board Committee Information — Compensation Committee Interlocks and Insider Participation” in the Proxy Statement.
Item 12. | Security Ownership of Certain Beneficial Owners and Management and Related Stockholder Matters |
Information required by this Item is incorporated herein by reference to the sections entitled “Executive Compensation — Securities Authorized for Issuance Under Equity Compensation Plans” and “Security Ownership of Certain Beneficial Owners and Management and Related Shareholder Matters” in the Proxy Statement.
Item 13. | Certain Relationships and Related Transactions, and Director Independence |
Information required by this Item is incorporated herein by reference to the sections entitled “Certain Relationships and Related Transactions,” “Corporate Governance Matters — Director Independence” and “Corporate Governance Matters — Business Relationships and Related Party Transactions Policy” in the Proxy Statement.
Item 14. | Principal Accounting Fees and Services |
Information required by this Item is incorporated herein by reference to the sections entitled “Proposal 2 — To Ratify the Selection of PricewaterhouseCoopers LLP as the Company’s Independent Registered Public Accounting Firm for the Year Ending December 31, 2017” in the Proxy Statement.
82
PART IV
Item 15. | Exhibits, Financial Statement Schedule |
Page | |
(a)-1. Financial Statements and Other Information | |
Calpine Corporation and Subsidiaries | |
(a)-2. Financial Statement Schedule | |
Calpine Corporation and Subsidiaries | |
(b) Exhibits | |
83
Exhibit Number | Description | |
2.1 | Debtors’ Sixth Amended Joint Plan of Reorganization Pursuant to Chapter 11 of the United States Bankruptcy Code (incorporated by reference to Exhibit 2.1 to Calpine’s Current Report on Form 8-K, filed with the SEC on December 27, 2007). | |
2.2 | Findings of Fact, Conclusions of Law, and Order Confirming Sixth Amended Joint Plan of Reorganization Pursuant to Chapter 11 of the U.S. Bankruptcy Code (incorporated by reference to Exhibit 2.2 to Calpine’s Current Report on Form 8-K, filed with the SEC on December 27, 2007). | |
2.3 | Purchase and Sale Agreement, dated April 17, 2014, among Calpine Corporation, Calpine Project Holdings, Inc., Calgen Expansion Company, LLC and NatGen Southeast Power LLC (incorporated by reference to Exhibit 10.1 to the Company’s Current Report on Form 8-K filed with the Securities and Exchange Commission on July 8, 2014). | |
3.1 | Amended and Restated Certificate of Incorporation of the Company, as amended (incorporated by reference to Exhibit 3.1 to Calpine’s Current Report on Form 8-K, filed with the SEC on February 1, 2008). | |
3.2 | Amended and Restated Bylaws of the Company (as amended through May 13, 2015) (incorporated by reference to Exhibit 3.1 to the Company’s Current Report on Form 8-K filed with the SEC on May 13, 2015). | |
4.1 | Indenture, dated January 14, 2011, among Calpine Corporation, the guarantors party thereto and Wilmington Trust Company, as trustee, including the form of the 7.875% senior secured notes due 2023 (incorporated by reference to Exhibit 4.1 to Calpine’s Current Report on Form 8-K, filed with the SEC on January 14 , 2011). | |
4.2 | First Supplemental Indenture dated as of April 26, 2011, among each of New Development Holdings, LLC, Calpine Mid-Atlantic Energy, LLC, Calpine Mid-Atlantic Operating, LLC, Calpine Bethlehem, LLC, Calpine New Jersey Generation, LLC, Calpine Mid-Atlantic Generation, LLC, Calpine Solar, LLC, Calpine Vineland Solar, LLC and Calpine Mid-Atlantic Marketing, LLC and Wilmington Trust Company, as trustee under the indenture, dated as of January 14, 2011, providing for the issuance of 7.875% senior secured notes due 2023 (incorporated by reference to Exhibit 4.6 to Calpine’s Quarterly Report on Form 10-Q for the quarter ended March 31, 2011, filed with the SEC on April 29, 2011). | |
4.3 | Second Supplemental Indenture dated as of July 22, 2011, among each of Deer Park Energy Center LLC, Deer Park Holdings, LLC, Metcalf Energy Center, LLC, Metcalf Holdings, LLC and Wilmington Trust Company, as trustee under the indenture, dated as of January 14, 2011, providing for the issuance of 7.875% senior secured notes due 2023 (incorporated by reference to Exhibit 4.5 to Calpine’s Quarterly Report on Form 10-Q for the quarter ended June 30, 2011, filed with the SEC on July 29, 2011). | |
4.4 | Third Supplemental Indenture dated as of August 20, 2012, among each of Calpine Energy Services GP, LLC and Calpine Energy Services LP, LLC and Wilmington Trust Company, as trustee under the indenture, dated as of January 14, 2011, providing for the issuance of 7.875% senior secured notes due 2023 (incorporated by reference to Exhibit 4.5 to Calpine’s Quarterly Report on Form 10-Q for the quarter ended September 30, 2012, filed with the SEC on November 6, 2012). | |
4.5 | Fourth Supplemental Indenture dated as of November 26, 2012, among each of South Point Holdings, LLC, South Point Energy Center, LLC, Broad River Energy LLC, South Point OL-1, LLC, South Point OL-2, LLC, South Point OL-3, LLC, South Point OL-4, LLC, Broad River OL-1, LLC, Broad River OL-2, LLC, Broad River OL-3, LLC and Broad River OL-4, LLC and Wilmington Trust Company, as trustee under the indenture, dated as of January 14, 2011, providing for the issuance of 7.875% senior secured notes due 2023 (incorporated by reference to Exhibit 4.28 to Calpine’s Annual Report on Form 10-K for the year ended December 31, 2012, filed with the SEC on February 13, 2013). | |
4.6 | Indenture dated as of October 31, 2013, for the senior secured notes due 2022 among each of Calpine Corporation, the guarantors party thereto and Wilmington Trust Company, National Association, as trustee (incorporated by reference to Exhibit 4.1 to Calpine’s Current Report on Form 8-K, filed with the SEC on October 31, 2013). | |
4.7 | Indenture dated as of October 31, 2013, for the senior secured notes due 2024 among each of Calpine Corporation, the guarantors party thereto and Wilmington Trust Company, National Association, as trustee (incorporated by reference to Exhibit 4.2 to Calpine’s Current Report on Form 8-K, filed with the SEC on October 31, 2013). | |
4.8 | Indenture, dated July 8, 2014, between the Company and Wilmington Trust, National Association, as trustee (the “Trustee”) (incorporated by reference to Exhibit 4.1 to the Company’s Form S-3ASR filed with the SEC on July 8, 2014). | |
84
Exhibit Number | Description | |
4.9 | First Supplemental Indenture, dated as of July 22, 2014, between the Company and the Trustee, governing the 2023 Notes (incorporated by reference to Exhibit 4.4 to the Company’s Current Report on Form 8-K filed with the SEC on July 22, 2014). | |
4.10 | Second Supplemental Indenture, dated as of July 22, 2014, between the Company and the Trustee, governing the 2025 Notes (incorporated by reference to Exhibit 4.5 to the Company’s Current Report on Form 8-K filed with the SEC on July 22, 2014). | |
4.11 | Form of 2023 Note (incorporated by reference to Exhibit 4.6 to the Company’s Current Report on Form 8-K filed with the SEC on July 22, 2014). | |
4.12 | Form of 2025 Note (incorporated by reference to Exhibit 4.7 to the Company’s Current Report on Form 8-K filed with the SEC on July 22, 2014). | |
4.13 | Third Supplemental Indenture, dated as of February 3, 2015, between the Company and the Trustee, governing the 2024 Notes (incorporated by reference to Exhibit 4.2 to the Company’s Current Report on Form 8-K filed with the SEC on February 3, 2015). | |
4.14 | Form of 2024 Note (incorporated by reference to Exhibit 4.3 to the Company’s Current Report on Form 8-K filed with the SEC on February 3, 2015). | |
4.15 | Indenture, dated as of May 31, 2016, for the senior secured notes due 2026 among each of the Company, the guarantors party thereto and Wilmington Trust, National Association, as trustee (the “Trustee”) (incorporated by reference to Exhibit 4.1 to the Company’s Current Report on Form 8-K filed with the SEC on June 1, 2016). | |
10.1 | Financing Agreements. | |
10.1.1 | Credit Agreement, dated as of December 10, 2010, among Calpine Corporation, Goldman Sachs Bank USA, as administrative agent, Goldman Sachs Credit Partners L.P., as collateral agent, the lenders party thereto and other parties thereto (incorporated by reference to Exhibit 10.1 to Calpine’s Current Report on Form 8-K, filed with the SEC on December 13, 2010). | |
10.1.2 | Amended and Restated Guarantee and Collateral Agreement, dated as of December 10, 2010, made by the Company and certain of the Company's subsidiaries party thereto in favor of Goldman Sachs Credit Partners, L.P., as collateral agent (incorporated by reference to Exhibit 10.1 to Calpine’s Quarterly Report on Form 10-Q for the quarter ended June 30, 2011, filed with the SEC on July 29, 2011). | |
10.1.3 | Credit Agreement, dated May 3, 2013 among Calpine Construction Finance Company as borrower and the lenders party thereto, and Goldman Sachs Lending Partners, LLC (“GSLP”) as administrative agent and as collateral agent, CoBank ACB, ING Capital LLC., Royal Bank of Canada, and The Royal Bank of Scotland PLC as co-documentation agents, GSLP, Deutsche Bank Securities Inc., Credit Suisse Securities (USA) LLC, Merrill Lynch, Pierce Fenner and Smith Incorporated and Union Bank, N.A., as joint lead arrangers, joint bookrunners and co-syndication agents, and the lenders party thereto (incorporated by reference to Exhibit 10.1 to the Company’s Current Report on Form 8-K, filed with the SEC on May 3, 2013). | |
10.1.4 | Amendment No. 1 to the December 10, 2010 Credit Agreement, dated as of June 27, 2013, among Calpine Corporation, as borrower, Goldman Sachs Bank USA, as administrative agent, Goldman Sachs Credit Partners L.P., as collateral agent, and the lenders party thereto (incorporated by reference to Exhibit 10.1 to the Company’s Current Report on Form 8-K, filed with the SEC on July 1, 2013). | |
10.1.5 | Amendment to the Credit Agreement, dated February 20, 2014, among Calpine Construction Finance Company, L.P. as borrower and the lenders party thereto, and Goldman Sachs Lending Partners, LLC (“GSLP”) as administrative agent and as collateral agent, CoBank ACB, ING Capital LLC., Royal Bank of Canada, and The Royal Bank of Scotland PLC as co-documentation agents, GSLP, Deutsche Bank Securities Inc., Credit Suisse Securities (USA) LLC, Merrill Lynch, Pierce Fenner and Smith Incorporated and Union Bank, N.A., as joint lead arrangers, joint bookrunners and co-syndication agents, and the lenders party thereto (incorporated by reference to Exhibit 10.1 to the Calpine’s Quarterly Report on Form 10-Q for the quarter ended March 31, 2014, filed with the SEC on May 1, 2014). | |
10.1.6 | Incremental Term B-2 Loan Commitment Supplement to the Credit Agreement, dated February 26, 2014, among Calpine Construction Finance Company, L.P. as borrower and the lenders party thereto, and Goldman Sachs Lending Partners, LLC as administrative agent and as collateral agent under the Credit Agreement, dated as of May 3, 2013 and as amended on February 20, 2014 (incorporated by reference to Exhibit 10.2 to the Calpine’s Quarterly Report on Form 10-Q for the quarter ended March 31, 2014, filed with the SEC on May 1, 2014). | |
85
Exhibit Number | Description | |
10.1.7 | Calpine Guarantee, dated April 17, 2014 (incorporated by reference to Exhibit 10.2 to the Company’s Current Report on Form 8-K filed with the Securities and Exchange Commission on July 8, 2014). | |
10.1.8 | LS Power Equity Partners Guarantee, dated April 17, 2014 (incorporated by reference to Exhibit 10.3 to the Company’s Current Report on Form 8-K filed with the Securities and Exchange Commission on July 8, 2014). | |
10.1.9 | Confidentiality and Non-Disclosure Agreement, dated February 19, 2014 (incorporated by reference to Exhibit 10.4 to the Company’s Current Report on Form 8-K filed with the Securities and Exchange Commission on July 8, 2014). | |
10.1.10 | Amendment to Confidentiality and Non-disclosure Agreement, dated April 17, 2014 (incorporated by reference to Exhibit 10.5 to the Company’s Current Report on Form 8-K filed with the Securities and Exchange Commission on July 8, 2014). | |
10.1.11 | Amendment No. 2 to the Credit Agreement, dated as of July 30, 2014, among Calpine Corporation, as borrower, Goldman Sachs Bank USA, as administrative agent, Goldman Sachs Credit Partners L.P., as collateral agent, and the lenders party thereto (incorporated by reference to Exhibit 10.1 to the Company’s Current Report on Form 8-K filed with the SEC on July 31, 2014). | |
10.1.12 | Credit Agreement, dated as of May 28, 2015 among Calpine Corporation, as borrower, the lenders party thereto, Morgan Stanley Senior Funding, Inc., as administrative agent, Goldman Sachs Credit Partners L.P., as collateral agent, and Goldman Sachs Bank USA, MUFG Union Bank, N.A., Barclays Bank Plc and Royal Bank of Canada, as co-documentation agents (incorporated by reference to Exhibit 10.1 to the Company’s Current Report on Form 8-K filed with the SEC on May 28, 2015). | |
10.1.13 | Credit Agreement, dated December 15, 2015 among Calpine Corporation, as borrower, the lenders party thereto, Morgan Stanley Senior Funding, Inc., as administrative agent, and Goldman Sachs Credit Partners L.P., as collateral agent (incorporated by reference to Exhibit 10.1 to the Company’s Current Report on Form 8-K filed with the SEC on December 18, 2015). | |
10.1.14 | Amendment No. 3 to the Credit Agreement, dated as of February 8, 2016, among Calpine Corporation, as borrower, the guarantors party thereto, Goldman Sachs Bank USA, as administrative agent, Goldman Sachs Credit Partners L.P., as collateral agent, The Bank of Tokyo-Mitsubishi UFJ Ltd, as successor administrative agent, MUFG Union Bank, N.A., as successor collateral agent, and the lenders party thereto (incorporated by reference to Exhibit 10.1.19 to the Company’s Annual Report on Form 10-K for the year ended December 31, 2015, filed with the SEC on February 12, 2016). | |
10.1.15 | Credit Agreement, dated May 31, 2016 among Calpine Corporation, as borrower, the lenders party thereto, Citibank, N.A., as administrative agent, MUFG Union Bank, N.A., as collateral agent (incorporated by reference to Exhibit 10.1 to the Company’s Current Report on Form 8-K filed with the SEC on June 1, 2016). | |
10.1.16 | Credit Agreement, dated December 1, 2016 among Calpine Corporation, as borrower, the lenders party thereto, Morgan Stanley Senior Funding, Inc., as administrative agent, MUFG Union Bank, N.A., as collateral agent (incorporated by reference to Exhibit 10.1 to the Company’s Current Report on Form 8-K filed with the SEC on December 2, 2016). | |
10.1.17 | Amendment No. 4 to the Credit Agreement, dated as of December 1, 2016, among Calpine Corporation, as borrower, the guarantors party thereto, Goldman Sachs Bank USA, as administrative agent, Goldman Sachs Credit Partners L.P., as collateral agent, The Bank of Tokyo-Mitsubishi UFJ Ltd, as successor administrative agent, MUFG Union Bank, N.A., as successor collateral agent, and the lenders party thereto (incorporated by reference to Exhibit 10.2 to the Company’s Current Report on Form 8-K filed with the SEC on December 2, 2016). | |
10.1.18 | Amendment No. 1 to Credit Agreement, dated as of December 21, 2016, among Calpine Corporation, as borrower, the guarantors, Credit Suisse AG, as the initial new lender and Morgan Stanley Senior Funding, Inc., as administrative agent, and amends the Credit Agreement dated as of May 28, 2015 entered into among the borrower, the institutions from time to time party thereto as lenders, the administrative agent and MUFG Union Bank, N.A., as collateral agent.* | |
10.1.19 | Amendment No. 1 to Credit Agreement, dated as of December 21, 2016, among Calpine Corporation, as borrower, the guarantors, Credit Suisse AG, as the initial new lender and Morgan Stanley Senior Funding, Inc., as administrative agent, and amends the Credit Agreement dated as of December 15, 2015 entered into among the borrower, the institutions from time to time party thereto as lenders, the administrative agent and MUFG Union Bank, N.A., as collateral agent.* | |
86
Exhibit Number | Description | |
10.1.20 | Amendment No. 1 to Credit Agreement, dated as of December 21, 2016, among Calpine Corporation, as borrower, the guarantors, Credit Suisse AG, as the initial new lender and CITIBANK, N.A., as administrative agent, and amends the Credit Agreement dated as of May 31, 2016 entered into among the borrower, the institutions from time to time party thereto as lenders, the administrative agent and MUFG Union Bank, N.A., as collateral agent.* | |
10.2 | Management Contracts or Compensatory Plans, Contracts or Arrangements. | |
10.2.1.1 | Letter Agreement, dated September 1, 2008, between the Company and John B. (Thad) Hill (incorporated by reference to Exhibit 10.1 to Calpine’s Current Report on Form 8-K, filed with the SEC on September 4, 2008).† | |
10.2.1.2 | Non-Qualified Stock Option Agreement between the Company and John B. (Thad) Hill, dated November 3, 2010 (incorporated by reference to Exhibit 10.1 to Calpine’s Current Report on Form 8-K, filed with the SEC on November 8, 2010).† | |
10.2.1.3 | Employment Agreement, dated November 6, 2013, between the Company and John B. (Thad) Hill (incorporated by reference to Exhibit 10.2.3.7 to Calpine’s Annual Report on Form 10-K for the year ended December 31, 2013, filed with the SEC on February 13, 2014).† | |
10.2.1.4 | Restricted Stock Agreement Pursuant to the Amended and Restated 2008 Equity Incentive Plan, dated May 13, 2014 among John B. (Thad) Hill and Calpine Corporation (incorporated by reference to Exhibit 10.1 to the Company’s Current Report on Form 8-K filed with the Securities and Exchange Commission on May 15, 2014).† | |
10.2.2 | Letter Agreement, dated December 17, 2008, between the Company and Zamir Rauf (incorporated by reference to Exhibit 10.1 to Calpine’s Current Report on Form 8-K, filed with the SEC on December 19, 2008).† | |
10.2.3.1 | Employment Agreement, dated August 11, 2008, between the Company and W. Thaddeus Miller (incorporated by reference to Exhibit 10.2.7 to Calpine’s Quarterly Report on Form 10-Q for the quarter ended September 30, 2008, filed with the SEC on November 7, 2008).† | |
10.2.3.2 | Amended and Restated Executive Employment Agreement between the Company and W. Thaddeus Miller, dated December 18, 2015 (incorporated by reference to Exhibit 10.3 to Calpine’s Current Report on Form 8-K, filed with the SEC on December 18, 2015).† | |
10.2.4 | Calpine Corporation 2010 Calpine Incentive Plan (incorporated by reference to Exhibit 10.6 to Calpine’s Quarterly Report on Form 10-Q for the quarter ended June 30, 2010, filed with the SEC on July 30, 2010).† | |
10.2.5 | Amended and Restated Calpine Corporation 2008 Equity Incentive Plan, dated February 26, 2014 (incorporated by reference to Exhibit 10.3 to Calpine’s Quarterly Report on Form 10-Q for the quarter ended March 31, 2014, filed with the SEC on May 1, 2014). † | |
10.2.6 | Form of Non-Qualified Stock Option Agreement (Pursuant to the 2008 Equity Incentive Plan) (incorporated by reference to Exhibit 10.4.3 to Calpine’s Quarterly Report on Form 10-Q for the quarter ended March 31, 2008, filed with the SEC on May 12, 2008).† | |
10.2.7 | Amended and Restated Calpine Corporation 2008 Director Incentive Plan (incorporated by reference to Annex A to Calpine’s Definitive Proxy Statement on Schedule 14A filed with the SEC on April 5, 2010).† | |
10.2.8 | Calpine Corporation Amended and Restated Change in Control and Severance Benefits Plan.†* | |
10.2.9 | Form of Restricted Stock Award Agreement between the Company and John B. (Thad) Hill and Zamir Rauf (Pursuant to the Amended and Restated Calpine Corporation 2008 Equity Incentive Plan, dated February 26, 2014) (incorporated by reference to Exhibit 10.5 to the Calpine’s Quarterly Report on Form 10-Q for the quarter ended March 31, 2014, filed with the SEC on May 1, 2014). † | |
10.2.10 | Form of Performance Share Unit Award Agreement between the Company and Jack A. Fusco and W. Thaddeus Miller (Pursuant to the Amended and Restated Calpine Corporation 2008 Equity Incentive Plan, dated February 26, 2014) (incorporated by reference to Exhibit 10.6 to the Calpine’s Quarterly Report on Form 10-Q for the quarter ended March 31, 2014, filed with the SEC on May 1, 2014). † | |
10.2.11 | Form of Performance Share Unit Award Agreement between the Company and John B. (Thad) Hill and Zamir Rauf (Pursuant to the Amended and Restated Calpine Corporation 2008 Equity Incentive Plan, dated February 26, 2014) (incorporated by reference to Exhibit 10.7 to the Calpine’s Quarterly Report on Form 10-Q for the quarter ended March 31, 2014, filed with the SEC on May 1, 2014). † | |
87
Exhibit Number | Description | |
10.2.12 | Form of Performance Share Unit Award Agreement Under Amended and Restated Calpine Corporation 2008 Equity Incentive Plan between the Company and W. Thaddeus Miller (incorporated by reference to Exhibit 10.1 to the Calpine’s Quarterly Report on Form 10-Q for the quarter ended March 31, 2016, filed with the SEC on April 29, 2016). † | |
10.2.13 | Form of Performance Share Unit Award Agreement Under Amended and Restated Calpine Corporation 2008 Equity Incentive Plan between the Company and Certain Designated Senior Employees (incorporated by reference to Exhibit 10.2 to the Calpine’s Quarterly Report on Form 10-Q for the quarter ended March 31, 2016, filed with the SEC on April 29, 2016). † | |
10.2.14 | Form of Performance Share Unit Award Agreement Under Amended and Restated Calpine Corporation 2008 Equity Incentive Plan between the Company and Certain Designated Senior Employees. †* | |
10.2.15 | Form of Performance Share Unit Award Agreement Under Amended and Restated Calpine Corporation 2008 Equity Incentive Plan between the Company and W. Thaddeus Miller. †* | |
12.1 | Computation of ratio of earnings to fixed charges.* | |
18.1 | Letter of preferability regarding change in accounting principle from PricewaterhouseCoopers LLP, Independent Registered Public Accounting Firm (incorporated by reference to Exhibit 18.1 to Calpine’s Annual Report on Form 10-K for the year ended December 31, 2009, filed with the SEC on February 25, 2010). | |
21.1 | Subsidiaries of the Company.* | |
23.1 | Consent of PricewaterhouseCoopers LLP, Independent Registered Public Accounting Firm.* | |
24.1 | Power of Attorney of Officers and Directors of Calpine Corporation (set forth on the signature pages of this Form 10-K).* | |
31.1 | Certification of the Chief Executive Officer Pursuant to Section 302 of the Sarbanes-Oxley Act of 2002.* | |
31.2 | Certification of the Chief Financial Officer Pursuant to Section 302 of the Sarbanes-Oxley Act of 2002.* | |
32.1 | Certification of Chief Executive Officer and Chief Financial Officer Pursuant to 18 U.S.C. Section 1350, as Adopted Pursuant to Section 906 of the Sarbanes-Oxley Act of 2002.‡ | |
101.INS | XBRL Instance Document.* | |
101.SCH | XBRL Taxonomy Extension Schema.* | |
101.CAL | XBRL Taxonomy Extension Calculation Linkbase.* | |
101.DEF | XBRL Taxonomy Extension Definition Linkbase.* | |
101.LAB | XBRL Taxonomy Extension Label Linkbase.* | |
101.PRE | XBRL Taxonomy Extension Presentation Linkbase.* | |
______________________________
* | Filed herewith. |
‡ | Furnished herewith. |
† | Management contract or compensatory plan, contract or arrangement. |
Item 16. Form 10-K Summary
None.
88
SIGNATURES
Pursuant to the requirements of Section 13 or 15(d) of the Securities Exchange Act of 1934, the registrant has duly caused this Report to be signed on its behalf by the undersigned thereunto duly authorized.
CALPINE CORPORATION | ||
By: | /s/ ZAMIR RAUF | |
Zamir Rauf Executive Vice President and Chief Financial Officer (Principal Financial Officer) | ||
Date: February 9, 2017
89
POWER OF ATTORNEY
KNOW ALL PERSONS BY THESE PRESENT: That the undersigned officers and directors of Calpine Corporation do hereby constitute and appoint W. Thaddeus Miller the lawful attorney and agent with power and authority to do any and all acts and things and to execute any and all instruments which said attorney and agent determines may be necessary or advisable or required to enable Calpine Corporation to comply with the Securities and Exchange Act of 1934, as amended, and any rules or regulations or requirements of the Securities and Exchange Commission in connection with this Report. Without limiting the generality of the foregoing power and authority, the powers granted include the power and authority to sign the names of the undersigned officers and directors in the capacities indicated below to this Report or amendments or supplements thereto, and each of the undersigned hereby ratifies and confirms all that said attorneys and agents, or either of them, shall do or cause to be done by virtue hereof. This Power of Attorney may be signed in several counterparts.
IN WITNESS WHEREOF, each of the undersigned has executed this Power of Attorney as of the date indicated opposite the name.
Pursuant to the requirements of the Securities Exchange Act of 1934, this Report has been signed below by the following persons on behalf of the registrant and in the capacities and on the dates indicated.
Signature | Title | Date | ||
/s/ JOHN B. (Thad) HILL | President, Chief Executive Officer and Director (principal executive officer) | February 9, 2017 | ||
John B. (Thad) Hill | ||||
/s/ ZAMIR RAUF | Executive Vice President and Chief Financial Officer (principal financial officer) | February 9, 2017 | ||
Zamir Rauf | ||||
/s/ JEFF KOSHKIN | Chief Accounting Officer (principal accounting officer) | February 9, 2017 | ||
Jeff Koshkin | ||||
/s/ MARY L. BRLAS | Director | February 9, 2017 | ||
Mary L. Brlas | ||||
/s/ FRANK CASSIDY | Chairman | February 9, 2017 | ||
Frank Cassidy | ||||
/s/ JACK A. FUSCO | Director | February 9, 2017 | ||
Jack A. Fusco | ||||
/s/ MICHAEL W. HOFMANN | Director | February 9, 2017 | ||
Michael W. Hofmann | ||||
/s/ DAVID C. MERRITT | Director | February 9, 2017 | ||
David C. Merritt | ||||
/s/ W. BENJAMIN MORELAND | Director | February 9, 2017 | ||
W. Benjamin Moreland | ||||
/s/ ROBERT MOSBACHER, JR. | Director | February 9, 2017 | ||
Robert Mosbacher, Jr. | ||||
/s/ DENISE M. O'LEARY | Director | February 9, 2017 | ||
Denise M. O’Leary | ||||
90
CALPINE CORPORATION AND SUBSIDIARIES
INDEX TO CONSOLIDATED FINANCIAL STATEMENTS
December 31, 2016
Page | |
91
Report of Independent Registered Public Accounting Firm
To the Board of Directors
and Stockholders of Calpine Corporation
In our opinion, the consolidated financial statements listed in the index appearing under Item 15(a)-1 present fairly, in all material respects, the financial position of Calpine Corporation and its subsidiaries at December 31, 2016 and 2015, and the results of their operations and their cash flows for each of the three years in the period ended December 31, 2016 in conformity with accounting principles generally accepted in the United States of America. In addition, in our opinion, the financial statement schedule listed in the index appearing under Item 15(a)-2 presents fairly, in all material respects, the information set forth therein when read in conjunction with the related consolidated financial statements. Also in our opinion, the Company maintained, in all material respects, effective internal control over financial reporting as of December 31, 2016, based on criteria established in Internal Control - Integrated Framework (2013) issued by the Committee of Sponsoring Organizations of the Treadway Commission (COSO). The Company's management is responsible for these financial statements and financial statement schedule, for maintaining effective internal control over financial reporting and for its assessment of the effectiveness of internal control over financial reporting, included in Management's Report on Internal Control over Financial Reporting, appearing under Item 9A. Our responsibility is to express opinions on these financial statements, on the financial statement schedule, and on the Company's internal control over financial reporting based on our integrated audits. We conducted our audits in accordance with the standards of the Public Company Accounting Oversight Board (United States). Those standards require that we plan and perform the audits to obtain reasonable assurance about whether the financial statements are free of material misstatement and whether effective internal control over financial reporting was maintained in all material respects. Our audits of the financial statements included examining, on a test basis, evidence supporting the amounts and disclosures in the financial statements, assessing the accounting principles used and significant estimates made by management, and evaluating the overall financial statement presentation. Our audit of internal control over financial reporting included obtaining an understanding of internal control over financial reporting, assessing the risk that a material weakness exists, and testing and evaluating the design and operating effectiveness of internal control based on the assessed risk. Our audits also included performing such other procedures as we considered necessary in the circumstances. We believe that our audits provide a reasonable basis for our opinions.
A company’s internal control over financial reporting is a process designed to provide reasonable assurance regarding the reliability of financial reporting and the preparation of financial statements for external purposes in accordance with generally accepted accounting principles. A company’s internal control over financial reporting includes those policies and procedures that (i) pertain to the maintenance of records that, in reasonable detail, accurately and fairly reflect the transactions and dispositions of the assets of the company; (ii) provide reasonable assurance that transactions are recorded as necessary to permit preparation of financial statements in accordance with generally accepted accounting principles, and that receipts and expenditures of the company are being made only in accordance with authorizations of management and directors of the company; and (iii) provide reasonable assurance regarding prevention or timely detection of unauthorized acquisition, use, or disposition of the company’s assets that could have a material effect on the financial statements.
Because of its inherent limitations, internal control over financial reporting may not prevent or detect misstatements. Also, projections of any evaluation of effectiveness to future periods are subject to the risk that controls may become inadequate because of changes in conditions, or that the degree of compliance with the policies or procedures may deteriorate.
As described in Management's Report on Internal Control Over Financial Reporting, management has excluded Calpine Energy Solutions LLC from its assessment of internal control over financial reporting as of December 31, 2016 because it was acquired by the Company in a purchase business combination during 2016. We have also excluded Calpine Energy Solutions LLC from our audit of internal control over financial reporting. Calpine Energy Solutions LLC is a wholly-owned subsidiary whose total assets and total revenues represent 7% and 2%, respectively, of the related consolidated financial statement amounts as of and for the year ended December 31, 2016.
/s/ PricewaterhouseCoopers LLP
Houston, Texas
February 9, 2017
92
CALPINE CORPORATION AND SUBSIDIARIES
CONSOLIDATED STATEMENTS OF OPERATIONS
For the Years Ended December 31, 2016, 2015 and 2014
(in millions, except share and per share amounts)
2016 | 2015 | 2014 | |||||||||
Operating revenues: | |||||||||||
Commodity revenue | $ | 6,943 | $ | 6,389 | $ | 7,595 | |||||
Mark-to-market gain (loss) | (245 | ) | 65 | 419 | |||||||
Other revenue | 18 | 18 | 16 | ||||||||
Operating revenues | 6,716 | 6,472 | 8,030 | ||||||||
Operating expenses: | |||||||||||
Fuel and purchased energy expense: | |||||||||||
Commodity expense | 4,431 | 3,589 | 4,815 | ||||||||
Mark-to-market (gain) loss | (244 | ) | 178 | 77 | |||||||
Fuel and purchased energy expense | 4,187 | 3,767 | 4,892 | ||||||||
Plant operating expense | 977 | 1,018 | 969 | ||||||||
Depreciation and amortization expense | 662 | 638 | 603 | ||||||||
Sales, general and other administrative expense | 140 | 138 | 144 | ||||||||
Other operating expenses | 79 | 80 | 88 | ||||||||
Total operating expenses | 6,045 | 5,641 | 6,696 | ||||||||
Impairment losses | 13 | — | 123 | ||||||||
(Gain) on sale of assets, net | (157 | ) | — | (753 | ) | ||||||
(Income) from unconsolidated subsidiaries | (24 | ) | (24 | ) | (25 | ) | |||||
Income from operations | 839 | 855 | 1,989 | ||||||||
Interest expense | 631 | 628 | 645 | ||||||||
Debt modification and extinguishment costs | 25 | 40 | 346 | ||||||||
Other (income) expense, net | 24 | 14 | 15 | ||||||||
Income before income taxes | 159 | 173 | 983 | ||||||||
Income tax expense (benefit) | 48 | (76 | ) | 22 | |||||||
Net income | 111 | 249 | 961 | ||||||||
Net income attributable to the noncontrolling interest | (19 | ) | (14 | ) | (15 | ) | |||||
Net income attributable to Calpine | $ | 92 | $ | 235 | $ | 946 | |||||
Basic earnings per common share attributable to Calpine: | |||||||||||
Weighted average shares of common stock outstanding (in thousands) | 354,006 | 362,033 | 404,837 | ||||||||
Net income per common share attributable to Calpine — basic | $ | 0.26 | $ | 0.65 | $ | 2.34 | |||||
Diluted earnings per common share attributable to Calpine: | |||||||||||
Weighted average shares of common stock outstanding (in thousands) | 356,110 | 364,886 | 409,360 | ||||||||
Net income per common share attributable to Calpine — diluted | $ | 0.26 | $ | 0.64 | $ | 2.31 | |||||
The accompanying notes are an integral part of these Consolidated Financial Statements.
93
CALPINE CORPORATION AND SUBSIDIARIES
CONSOLIDATED STATEMENTS OF COMPREHENSIVE INCOME
For the Years Ended December 31, 2016, 2015 and 2014
(in millions)
2016 | 2015 | 2014 | ||||||||||
Net income | $ | 111 | $ | 249 | $ | 961 | ||||||
Cash flow hedging activities: | ||||||||||||
Loss on cash flow hedges before reclassification adjustment for cash flow hedges realized in net income | (2 | ) | (24 | ) | (48 | ) | ||||||
Reclassification adjustment for loss on cash flow hedges realized in net income | 43 | 47 | 46 | |||||||||
Unrealized actuarial losses arising during period | — | — | (4 | ) | ||||||||
Foreign currency translation gain (loss) | 5 | (23 | ) | (13 | ) | |||||||
Income tax expense | (1 | ) | — | — | ||||||||
Other comprehensive income (loss) | 45 | — | (19 | ) | ||||||||
Comprehensive income | 156 | 249 | 942 | |||||||||
Comprehensive (income) attributable to the noncontrolling interest | (22 | ) | (15 | ) | (14 | ) | ||||||
Comprehensive income attributable to Calpine | $ | 134 | $ | 234 | $ | 928 | ||||||
The accompanying notes are an integral part of these Consolidated Financial Statements.
94
CALPINE CORPORATION AND SUBSIDIARIES
CONSOLIDATED BALANCE SHEETS
December 31, 2016 and 2015
(in millions, except share and per share amounts)
2016 | 2015 | ||||||
ASSETS | |||||||
Current assets: | |||||||
Cash and cash equivalents ($79 and $118 attributable to VIEs) | $ | 418 | $ | 906 | |||
Accounts receivable, net of allowance of $6 and $2 | 839 | 644 | |||||
Inventories | 581 | 475 | |||||
Margin deposits and other prepaid expense | 441 | 137 | |||||
Restricted cash, current ($109 and $132 attributable to VIEs) | 173 | 216 | |||||
Derivative assets, current | 1,725 | 1,698 | |||||
Current assets held for sale ($134 and nil attributable to VIEs) | 210 | — | |||||
Other current assets | 45 | 19 | |||||
Total current assets | 4,432 | 4,095 | |||||
Property, plant and equipment, net ($3,979 and $4,062 attributable to VIEs) | 13,013 | 13,012 | |||||
Restricted cash, net of current portion ($14 and $11 attributable to VIEs) | 15 | 12 | |||||
Investments in unconsolidated subsidiaries | 99 | 79 | |||||
Long-term derivative assets | 543 | 313 | |||||
Long-term assets held for sale (nil and $130 attributable to VIEs) | — | 130 | |||||
Other assets ($63 and $119 attributable to VIEs) | 1,215 | 1,040 | |||||
Total assets | $ | 19,317 | $ | 18,681 | |||
LIABILITIES & STOCKHOLDERS’ EQUITY | |||||||
Current liabilities: | |||||||
Accounts payable | $ | 671 | $ | 552 | |||
Accrued interest payable | 125 | 129 | |||||
Debt, current portion ($176 and $166 attributable to VIEs) | 748 | 221 | |||||
Derivative liabilities, current | 1,630 | 1,734 | |||||
Other current liabilities | 528 | 412 | |||||
Total current liabilities | 3,702 | 3,048 | |||||
Debt, net of current portion ($2,944 and $3,096 attributable to VIEs) | 11,431 | 11,716 | |||||
Long-term derivative liabilities | 476 | 473 | |||||
Other long-term liabilities | 369 | 277 | |||||
Total liabilities | 15,978 | 15,514 | |||||
Commitments and contingencies (see Note 15) | |||||||
Stockholders’ equity: | |||||||
Preferred stock, $0.001 par value per share; authorized 100,000,000 shares, none issued and outstanding at December 31, 2016 and 2015 | — | — | |||||
Common stock, $0.001 par value per share; authorized 1,400,000,000 shares, 359,627,113 shares issued and 359,061,764 shares outstanding at December 31, 2016, and 356,755,747 shares issued and 356,662,004 shares outstanding at December 31, 2015 | — | — | |||||
Treasury stock, at cost, 565,349 and 93,743 shares, respectively | (7 | ) | (1 | ) | |||
Additional paid-in capital | 9,625 | 9,594 | |||||
Accumulated deficit | (6,213 | ) | (6,305 | ) | |||
Accumulated other comprehensive loss | (137 | ) | (179 | ) | |||
Total Calpine stockholders’ equity | 3,268 | 3,109 | |||||
Noncontrolling interest | 71 | 58 | |||||
Total stockholders’ equity | 3,339 | 3,167 | |||||
Total liabilities and stockholders’ equity | $ | 19,317 | $ | 18,681 | |||
The accompanying notes are an integral part of these Consolidated Financial Statements.
95
CALPINE CORPORATION AND SUBSIDIARIES
CONSOLIDATED STATEMENTS OF
STOCKHOLDERS’ EQUITY
For the Years Ended December 31, 2016, 2015 and 2014
(in millions)
Common Stock | Treasury Stock | Additional Paid-In Capital | Accumulated Deficit | Accumulated Other Comprehensive Loss | Noncontrolling Interest | Total Stockholders’ Equity | |||||||||||||||||||||
Balance, December 31, 2013 | $ | 1 | $ | (1,230 | ) | $ | 12,389 | $ | (7,486 | ) | $ | (160 | ) | $ | 54 | $ | 3,568 | ||||||||||
Treasury stock transactions | — | (1,115 | ) | — | — | — | — | (1,115 | ) | ||||||||||||||||||
Stock-based compensation expense | — | — | 31 | — | — | — | 31 | ||||||||||||||||||||
Option exercises | — | — | 20 | — | — | — | 20 | ||||||||||||||||||||
Distribution to the noncontrolling interest | — | — | — | — | — | (15 | ) | (15 | ) | ||||||||||||||||||
Net income | — | — | — | 946 | — | 15 | 961 | ||||||||||||||||||||
Other comprehensive loss | — | — | — | — | (18 | ) | (1 | ) | (19 | ) | |||||||||||||||||
Balance, December 31, 2014 | $ | 1 | $ | (2,345 | ) | $ | 12,440 | $ | (6,540 | ) | $ | (178 | ) | $ | 53 | $ | 3,431 | ||||||||||
Treasury stock transactions | — | (541 | ) | — | — | — | — | (541 | ) | ||||||||||||||||||
Retirement of shares held in treasury | (1 | ) | 2,885 | (2,885 | ) | — | — | — | (1 | ) | |||||||||||||||||
Stock-based compensation expense | — | — | 31 | — | — | — | 31 | ||||||||||||||||||||
Option exercises | — | — | 8 | — | — | — | 8 | ||||||||||||||||||||
Distribution to the noncontrolling interest | — | — | — | — | — | (10 | ) | (10 | ) | ||||||||||||||||||
Net income | — | — | — | 235 | — | 14 | 249 | ||||||||||||||||||||
Other comprehensive income (loss) | — | — | — | — | (1 | ) | 1 | — | |||||||||||||||||||
Balance, December 31, 2015 | $ | — | $ | (1 | ) | $ | 9,594 | $ | (6,305 | ) | $ | (179 | ) | $ | 58 | $ | 3,167 | ||||||||||
Treasury stock transactions | — | (6 | ) | — | — | — | — | (6 | ) | ||||||||||||||||||
Stock-based compensation expense | — | — | 30 | — | — | — | 30 | ||||||||||||||||||||
Option exercises | — | — | 1 | — | — | — | 1 | ||||||||||||||||||||
Distribution to the noncontrolling interest | — | — | — | — | — | (9 | ) | (9 | ) | ||||||||||||||||||
Net income | — | — | — | 92 | — | 19 | 111 | ||||||||||||||||||||
Other comprehensive income | — | — | — | — | 42 | 3 | 45 | ||||||||||||||||||||
Balance, December 31, 2016 | $ | — | $ | (7 | ) | $ | 9,625 | $ | (6,213 | ) | $ | (137 | ) | $ | 71 | $ | 3,339 | ||||||||||
The accompanying notes are an integral part of these Consolidated Financial Statements.
96
CALPINE CORPORATION AND SUBSIDIARIES
CONSOLIDATED STATEMENTS OF CASH FLOWS
For the Years Ended December 31, 2016, 2015 and 2014
(in millions)
2016 | 2015 | 2014 | |||||||||
Cash flows from operating activities: | |||||||||||
Net income | $ | 111 | $ | 249 | $ | 961 | |||||
Adjustments to reconcile net income to net cash provided by operating activities: | |||||||||||
Depreciation and amortization(1) | 910 | 757 | 649 | ||||||||
Debt extinguishment costs | 20 | 6 | 36 | ||||||||
Deferred income taxes | 43 | (87 | ) | 5 | |||||||
Impairment losses | 13 | — | 123 | ||||||||
(Gain) on sale of assets, net | (157 | ) | — | (753 | ) | ||||||
Mark-to-market activity, net | (1 | ) | 110 | (353 | ) | ||||||
(Income) from unconsolidated subsidiaries | (24 | ) | (24 | ) | (25 | ) | |||||
Return on investments from unconsolidated subsidiaries | 21 | 25 | 13 | ||||||||
Stock-based compensation expense | 31 | 26 | 36 | ||||||||
Other | 8 | 7 | (4 | ) | |||||||
Change in operating assets and liabilities, net of effects of acquisitions: | |||||||||||
Accounts receivable | (128 | ) | 169 | (87 | ) | ||||||
Derivative instruments, net | (82 | ) | (183 | ) | (63 | ) | |||||
Other assets | 150 | (120 | ) | 151 | |||||||
Accounts payable and accrued expenses | (6 | ) | (208 | ) | 201 | ||||||
Other liabilities | 121 | 149 | (20 | ) | |||||||
Net cash provided by operating activities | 1,030 | 876 | 870 | ||||||||
Cash flows from investing activities: | |||||||||||
Purchases of property, plant and equipment | (489 | ) | (565 | ) | (492 | ) | |||||
Proceeds from sale of power plants and other(2) | 179 | — | 1,573 | ||||||||
Purchase of Granite Ridge, Fore River and Guadalupe Energy Centers | (526 | ) | — | (1,197 | ) | ||||||
Purchases of Calpine Solutions and Champion Energy, net of cash acquired(3) | (1,150 | ) | (296 | ) | — | ||||||
Decrease in restricted cash | 40 | 18 | 28 | ||||||||
Other | 27 | 2 | 4 | ||||||||
Net cash used in investing activities | (1,919 | ) | (841 | ) | (84 | ) | |||||
Cash flows from financing activities: | |||||||||||
Borrowings under CCFC Term Loans and First Lien Term Loans | 1,101 | 2,137 | 420 | ||||||||
Repayments of CCFC Term Loans and First Lien Term Loans | (1,231 | ) | (1,635 | ) | (45 | ) | |||||
Borrowings under Senior Unsecured Notes | — | 650 | 2,800 | ||||||||
Borrowings under First Lien Notes | 625 | — | — | ||||||||
Repurchases of First Lien Notes | (120 | ) | (267 | ) | (2,920 | ) | |||||
Borrowings from project financing, notes payable and other | 458 | 79 | 79 | ||||||||
Repayments of project financing, notes payable and other | (364 | ) | (232 | ) | (178 | ) | |||||
Distribution to noncontrolling interest holder | (9 | ) | (10 | ) | (15 | ) | |||||
Financing costs | (58 | ) | (34 | ) | (56 | ) | |||||
Stock repurchases | — | (529 | ) | (1,100 | ) | ||||||
Proceeds from exercises of stock options | 1 | 8 | 20 | ||||||||
Shares repurchased for tax withholding on stock-based awards | (6 | ) | (12 | ) | (15 | ) | |||||
Other | 4 | (1 | ) | — | |||||||
Net cash provided by (used in) financing activities | 401 | 154 | (1,010 | ) | |||||||
Net (decrease) increase in cash and cash equivalents | (488 | ) | 189 | (224 | ) | ||||||
Cash and cash equivalents, beginning of period | 906 | 717 | 941 | ||||||||
Cash and cash equivalents, end of period | $ | 418 | $ | 906 | $ | 717 | |||||
The accompanying notes are an integral part of these Consolidated Financial Statements.
97
CALPINE CORPORATION AND SUBSIDIARIES CONSOLIDATED STATEMENTS OF CASH FLOWS — (Continued) (in millions) | |||||||||||
2016 | 2015 | 2014 | |||||||||
Cash paid during the period for: | |||||||||||
Interest, net of amounts capitalized | $ | 584 | $ | 620 | $ | 610 | |||||
Income taxes | $ | 12 | $ | 21 | $ | 23 | |||||
Supplemental disclosure of non-cash investing and financing activities: | |||||||||||
Change in capital expenditures included in accounts payable | $ | (37 | ) | $ | 13 | $ | 3 | ||||
Additions to property, plant and equipment through capital leases | $ | — | $ | 9 | $ | 19 | |||||
Reduction of debt due to sale of Mankato Power Plant(2) | $ | 243 | $ | — | $ | — | |||||
Retirement of shares held in treasury | $ | — | $ | 2,885 | $ | — | |||||
(1) | Includes amortization included in Commodity revenue and Commodity expense associated with intangible assets and amortization recorded in interest expense associated with debt issuance costs and discounts. |
(2) | On October 26, 2016, we completed the sale of Mankato Power Plant for $407 million, including working capital and other adjustments. We received net proceeds of $164 million after the non-cash reduction of Steamboat project debt of $243 million as the funds were provided directly to the lender in conjunction with the sale of the power plant. |
(3) | On December 1, 2016, we completed the purchase of Calpine Solutions, formerly Noble Solutions, along with a swap contract for approximately $800 million plus approximately $350 million of net working capital at closing. We recovered approximately $250 million in cash subsequent to closing and prior to year end December 31, 2016. |
The accompanying notes are an integral part of these Consolidated Financial Statements.
98
CALPINE CORPORATION AND SUBSIDIARIES
NOTES TO CONSOLIDATED FINANCIAL STATEMENTS
For the Years Ended December 31, 2016, 2015 and 2014
1. | Organization and Operations |
We are a power generation company engaged in the ownership and operation of primarily natural gas-fired and geothermal power plants in North America. We have a significant presence in major competitive wholesale power markets in California (included in our West segment), Texas (included in our Texas segment) and the Northeast and Mid-Atlantic regions (included in our East segment) of the U.S. We sell power, steam, capacity, renewable energy credits and ancillary services to our customers, which include utilities, independent electric system operators, industrial and agricultural companies, retail power providers, municipalities and other governmental entities, power marketers as well as retail commercial, industrial, governmental and residential customers. We continue to focus on getting closer to our customers through expansion of our retail platform which began with the acquisition of Champion Energy in 2015 and was followed by the acquisitions of Calpine Solutions in late 2016 and North American Power in early 2017. We purchase primarily natural gas and some fuel oil as fuel for our power plants and engage in related natural gas transportation and storage transactions. We also purchase power for sale to our customers and purchase electric transmission rights to deliver power to our customers. Additionally, consistent with our Risk Management Policy, we enter into natural gas, power, environmental product, fuel oil and other physical and financial commodity contracts to hedge certain business risks and optimize our portfolio of power plants.
2. | Summary of Significant Accounting Policies |
Basis of Presentation and Principles of Consolidation
Our Consolidated Financial Statements have been prepared in accordance with U.S. GAAP and include the accounts of all majority-owned subsidiaries that are not VIEs and all VIEs where we have determined we are the primary beneficiary. Intercompany transactions have been eliminated in consolidation.
Equity Method Investments — We use the equity method of accounting to record our net interests in VIEs where we have determined that we are not the primary beneficiary, which include Greenfield LP, a 50% partnership interest, Whitby, a 50% partnership interest and Calpine Receivables, a 100% membership interest. Our share of net income (loss) is calculated according to our equity ownership percentage or according to the terms of the applicable partnership agreement or limited liability company operating agreement. See Note 5 for further discussion of our VIEs and unconsolidated investments.
Jointly-Owned Plants — Certain of our subsidiaries own undivided interests in jointly-owned plants. These plants are maintained and operated pursuant to their joint ownership participation and operating agreements. We are responsible for our subsidiaries’ share of operating costs and direct expenses and include our proportionate share of the facilities and related revenues and direct expenses in these jointly-owned plants in the corresponding balance sheet and income statement captions of our Consolidated Financial Statements. The following table summarizes our proportionate ownership interest in jointly-owned power plants:
As of December 31, 2016 | Ownership Interest | Property, Plant & Equipment | Accumulated Depreciation | Construction in Progress | |||||||||||
(in millions, except percentages) | |||||||||||||||
Freestone Energy Center | 75.0 | % | $ | 382 | $ | (150 | ) | $ | — | ||||||
Hidalgo Energy Center | 78.5 | % | $ | 255 | $ | (115 | ) | $ | — | ||||||
Use of Estimates in Preparation of Financial Statements
The preparation of financial statements in conformity with U.S. GAAP requires management to make estimates and assumptions that affect the reported amounts of assets, liabilities, revenues, expenses and related disclosures included in our Consolidated Financial Statements. Actual results could differ from those estimates.
Fair Value of Financial Instruments and Derivatives
The carrying values of accounts receivable, accounts payable and other receivables and payables approximate their respective fair values due to their short-term maturities. See Note 6 for disclosures regarding the fair value of our debt instruments and Note 7 for disclosures regarding the fair values of our derivative instruments and margin deposits and certain of our cash balances.
99
Concentrations of Credit Risk
Financial instruments that potentially subject us to credit risk consist of cash and cash equivalents, restricted cash, accounts and notes receivable and derivative financial instruments. Certain of our cash and cash equivalents, as well as our restricted cash balances, are invested in money market accounts with investment banks that are not FDIC insured. We place our cash and cash equivalents and restricted cash in what we believe to be creditworthy financial institutions and certain of our money market accounts invest in U.S. Treasury securities or other obligations issued or guaranteed by the U.S. Government, its agencies or instrumentalities. Additionally, we actively monitor the credit risk of our counterparties and customers, including our receivable, commodity and derivative transactions. Our accounts and notes receivable are concentrated within entities engaged in the energy industry, mainly within the U.S. We generally have not collected collateral for accounts receivable from utilities and end-user customers; however, we may require collateral in the future. For financial and commodity derivative counterparties and customers, we evaluate the net accounts receivable, accounts payable and fair value of commodity contracts and may require security deposits, cash margin or letters of credit to be posted if our exposure reaches a certain level or their credit rating declines.
Our counterparties and customers primarily consist of four categories of entities who participate in the energy markets:
• | financial institutions and trading companies; |
• | regulated utilities, municipalities, cooperatives, ISOs and other retail power suppliers; |
• | oil, natural gas, chemical and other energy-related industrial companies; and |
• | commercial, industrial and residential retail customers. |
We have concentrations of credit risk with a few of our wholesale counterparties and retail customers relating to our sales of power and steam and our hedging, optimization and trading activities. We have exposure to trends within the energy industry, including declines in the creditworthiness of our counterparties and customers for our commodity and derivative transactions. Currently, certain of our counterparties and customers within the energy industry have below investment grade credit ratings. Our risk control group manages counterparty and customer credit risk and monitors our net exposure with each counterparty or customer on a daily basis. The analysis is performed on a mark-to-market basis using forward curves. The net exposure is compared against a credit risk threshold which is determined based on each counterparties’ and customer’s credit rating and evaluation of their financial statements. We utilize these thresholds to determine the need for additional collateral or restriction of activity with the counterparty or customer. We believe that our credit policies and portfolio of transactions adequately monitor and diversify our credit risk. Currently, our wholesale counterparties and retail customers are performing and financially settling timely according to their respective agreements with the exception of certain retail customers where our credit exposure is not material.
Cash and Cash Equivalents
We consider all highly liquid investments with an original maturity of three months or less to be cash equivalents. We have cash and cash equivalents held in non-corporate accounts relating to certain project finance facilities and lease agreements that require us to establish and maintain segregated cash accounts. These accounts have been pledged as security in favor of the lenders under such project finance facilities, and the use of certain cash balances on deposit in such accounts is limited, at least temporarily, to the operations of the respective projects.
Restricted Cash
Certain of our debt agreements, lease agreements or other operating agreements require us to establish and maintain segregated cash accounts, the use of which is restricted, making these cash funds unavailable for general use. These amounts are held by depository banks in order to comply with the contractual provisions requiring reserves for payments such as for debt service, rent and major maintenance or with applicable regulatory requirements. Funds that can be used to satisfy obligations due during the next 12 months are classified as current restricted cash, with the remainder classified as non-current restricted cash. Restricted cash is generally invested in accounts earning market rates; therefore, the carrying value approximates fair value. Such cash is excluded from cash and cash equivalents on our Consolidated Condensed Balance Sheets and Statements of Cash Flows.
100
The table below represents the components of our restricted cash as of December 31, 2016 and 2015 (in millions):
2016 | 2015 | ||||||||||||||||||||||
Current | Non-Current | Total | Current | Non-Current | Total | ||||||||||||||||||
Debt service | $ | 11 | $ | 8 | $ | 19 | $ | 28 | $ | 8 | $ | 36 | |||||||||||
Construction/major maintenance | 45 | 6 | 51 | 50 | 2 | 52 | |||||||||||||||||
Security/project/insurance | 114 | — | 114 | 136 | — | 136 | |||||||||||||||||
Other | 3 | 1 | 4 | 2 | 2 | 4 | |||||||||||||||||
Total | $ | 173 | $ | 15 | $ | 188 | $ | 216 | $ | 12 | $ | 228 | |||||||||||
Business Interruption Proceeds
We record business interruption insurance proceeds when they are realizable and recorded approximately $24 million and $2 million of business interruption proceeds in operating revenues for the years ended December 31, 2016 and 2015, respectively. We did not record any business interruption proceeds during the year ended December 31, 2014.
Accounts Receivable and Payable
Accounts receivable and payable represent amounts due from customers and owed to vendors, respectively. Accounts receivable are recorded at invoiced amounts, net of reserves and allowances, and do not bear interest. Receivable balances greater than 30 days past due are reviewed for collectability, depending upon the nature of the customer, and if deemed uncollectible, are charged off against the allowance account after all means of collection have been exhausted and the potential for recovery is considered remote. We use our best estimate to determine the required allowance for doubtful accounts based on a variety of factors, including the length of time receivables are past due, economic trends and conditions affecting our customer base, significant one-time events and historical write-off experience. Specific provisions are recorded for individual receivables when we become aware of a customer’s inability to meet its financial obligations.
The accounts receivable and payable balances also include settled but unpaid amounts relating to our marketing, hedging and optimization activities. Some of these receivables and payables with individual counterparties are subject to master netting arrangements whereby we legally have a right of offset and settle the balances net. However, for balance sheet presentation purposes and to be consistent with the way we present the majority of amounts related to marketing, hedging and optimization activities on our Consolidated Statements of Operations, we present our receivables and payables on a gross basis. We do not have any significant off balance sheet credit exposure related to our customers.
Accounts Receivable Sales Program
On December 1, 2016, in conjunction with our acquisition of Calpine Solutions, we entered into the Accounts Receivable Sales Program which allows us to sell, at a discount, up to $250 million in certain trade accounts receivable, arising from the sale of power and natural gas, from Calpine Solutions to Calpine Receivables which in turn sells 100% of the receivables to an unaffiliated financial institution, subject to certain contractual limitations. The Accounts Receivable Sales Program, which supersedes a similar program by the previous owner, expires on December 1, 2017. Calpine Solutions continues to service the receivables sold in exchange for a servicing fee which was not material for the year ended December 31, 2016. We are not the primary beneficiary of Calpine Receivables and, accordingly, do not consolidate this entity in our Consolidated Financial Statements. See Note 5 for a further discussion of our unconsolidated VIEs. Any portion of the purchase price for the sold receivables which is not paid in cash is recorded as a note receivable. The note receivable is recorded at fair value and does not materially differ from the carrying value of the trade accounts receivable held prior to sale due to the short-term nature of the receivables and high credit quality of the retail customers involved. Receivables sold under the Accounts Receivable Sales Program are accounted for as sales and excluded from accounts receivable on our Consolidated Balance Sheets and reflected as cash provided by operating activities on our Consolidated Statements of Cash Flows. Calpine has guaranteed the performance of Calpine Solutions under the Accounts Receivable Sales Program. See Note 15 for a further description of our guarantees.
At December 31, 2016, we had $211 million in trade accounts receivable outstanding that were sold under the Accounts Receivable Sales Program and $32 million in notes receivable which was recorded on our Consolidated Balance Sheet. We sold an aggregate of approximately $165 million in trade accounts receivable during the year ended December 31, 2016 and recorded proceeds of approximately $165 million during the year ended December 31, 2016. Any losses incurred on the sale of trade accounts receivable are recorded in other (income) expense, net on our Consolidated Statements of Operations which were not material during the year ended December 31, 2016.
101
Inventory
Inventory primarily consists of spare parts, stored natural gas and fuel oil, environmental products and natural gas exchange imbalances. Inventory, other than spare parts, is stated primarily at the lower of cost or market value under the weighted average cost method. Spare parts inventory is valued at weighted average cost and is expensed to plant operating expense or capitalized to property, plant and equipment as the parts are utilized and consumed.
Collateral
We use margin deposits, prepayments and letters of credit as credit support with and from our counterparties and customers for commodity procurement and risk management activities. In addition, we have granted additional first priority liens on the assets previously subject to first priority liens under our First Lien Notes, First Lien Term Loans and Corporate Revolving Facility as collateral under certain of our power and natural gas agreements. These agreements qualify as “eligible commodity hedge agreements” under our First Lien Notes, First Lien Term Loans and Corporate Revolving Facility. The first priority liens have been granted in order to reduce the cash collateral and letters of credit that we would otherwise be required to provide to our counterparties under such agreements. The counterparties under such agreements would share the benefits of the collateral subject to such first priority liens ratably with the lenders under our First Lien Notes, First Lien Term Loans and Corporate Revolving Facility. Our interest rate hedging instruments relate to hedges of certain of our project financings collateralized by first priority liens on the underlying assets. See Note 9 for a further discussion on our amounts and use of collateral.
Property, Plant and Equipment, Net
Property, plant, and equipment items are recorded at cost. We capitalize costs incurred in connection with the construction of power plants, the development of geothermal properties and the refurbishment of major turbine generator equipment. When capital improvements to leased power plants meet our capitalization criteria they are capitalized as leasehold improvements and amortized over the shorter of the term of the lease or the economic life of the capital improvement. We expense maintenance when the service is performed for work that does not meet our capitalization criteria. Our current capital expenditures at our Geysers Assets are those incurred for proven reserves and reservoir replenishment (primarily water injection), pipeline and power generation assets and drilling of “development wells” as all drilling activity has been performed within the known boundaries of the steam reservoir. We have capitalized costs incurred during ownership consisting of additions, certain replacements or repairs when the repairs appreciably extend the life, increase the capacity or improve the efficiency or safety of the property. Such costs are expensed when they do not meet the above criteria. We purchased our Geysers Assets as a proven steam reservoir and all well costs, except well workovers and routine repairs and maintenance, have been capitalized since our purchase date.
We depreciate our assets under the straight-line method over the shorter of their estimated useful lives or lease term. For our natural gas-fired power plants, we assume an estimated salvage value which approximates 10% of the depreciable cost basis where we own the power plant or have a favorable option to purchase the power plant or take ownership of the power plant at conclusion of the lease term and approximately 0.15% of the depreciable costs basis for rotable equipment. For our Geysers Assets, we typically assume no salvage values. We use the component depreciation method for our natural gas-fired power plant rotable parts and our information technology equipment and the composite depreciation method for most of all of the other natural gas-fired power plant asset groups and Geysers Assets.
Generally, upon normal retirement of assets under the composite depreciation method, the costs of such assets are retired against accumulated depreciation and no gain or loss is recorded. For the retirement of assets under the component depreciation method, generally, the costs and related accumulated depreciation of such assets are removed from our Consolidated Balance Sheets and a gain or loss is recorded as plant operating expense.
Goodwill and Intangible Assets
Goodwill represents the excess of the purchase price over the fair value of the net assets acquired at the time of an acquisition. We assess the carrying amount of our goodwill annually during the third quarter and whenever the events or changes in circumstances indicate that the carrying value may not be recoverable. As of December 31, 2016 and 2015, our goodwill was $187 million and $29 million, respectively and is reflected in other assets on our Consolidated Balance Sheets.
We record intangible assets, such as acquired contracts, customer relationships and trademark and trade name at their estimated fair values. We use all information available to estimate fair values including quoted market prices, if available, and other widely accepted valuation techniques. Certain estimates and judgments are required in the application of the techniques used to measure fair value of our intangible assets, including estimates of future cash flows, selling prices, replacement costs, economic lives and the selection of a discount rate, which are not observable in the market and represent a Level 3 measurement. All recognized intangible assets consist of contractual rights and obligations with finite lives.
102
As of December 31, 2016 and 2015, the components of our intangible assets are reflected in other assets on our Consolidated Balance Sheets and were as follows (in millions):
2016 | 2015 | Lives | |||||||
Acquired contracts | $ | 531 | $ | 521 | 0 – 9 Years | ||||
Customer relationships | 420 | 69 | 7 – 14 Years | ||||||
Trademark and trade name | 40 | 41 | 15 Years | ||||||
Other | 88 | 88 | 17 – 23 Years | ||||||
1,079 | 719 | ||||||||
Less: Accumulated amortization | 429 | 211 | |||||||
Intangible assets, net | $ | 650 | $ | 508 | |||||
Amortization expense related to our intangible assets for the years ended December 31, 2016, 2015 and 2014 was $218 million, $91 million and $20 million, respectively.
The estimated aggregate amortization expense of our intangible assets for the next five years is as follows (in millions):
2017 | $ | 155 | |
2018 | $ | 90 | |
2019 | $ | 63 | |
2020 | $ | 44 | |
2021 | $ | 39 | |
Impairment Evaluation of Long-Lived Assets (Including Goodwill, Intangibles and Investments)
We evaluate our long-lived assets, such as property, plant and equipment, equity method investments and definite-lived intangible assets for impairment, when events or changes in circumstances indicate that the carrying value of such assets may not be recoverable. Equipment assigned to each power plant is not evaluated for impairment separately; instead, we evaluate our operating power plants and related equipment as a whole unit. When we believe an impairment condition may have occurred, we are required to estimate the undiscounted future cash flows associated with a long-lived asset or group of long-lived assets at the lowest level for which identifiable cash flows are largely independent of the cash flows of other assets and liabilities for long-lived assets that are expected to be held and used. We use a fundamental long-term view of the power market which is based on long-term production volumes, price curves and operating costs together with the regulatory and environmental requirements within each individual market to prepare our multi-year forecast. Since we manage and market our power sales as a portfolio rather than at the individual power plant level or customer level within each designated market, pool or segment, we group our power plants based upon the corresponding market for valuation purposes. If we determine that the undiscounted cash flows from an asset or group of assets to be held and used are less than the associated carrying amount, or if we have classified an asset as held for sale, we must estimate fair value to determine the amount of any impairment loss.
We test goodwill and all intangible assets not subject to amortization for impairments at least annually, or more frequently whenever an event or change in circumstances occurs that would more likely than not reduce the fair value of a reporting unit below its carrying amount. We test goodwill for impairment at the reporting unit level, which is identified one level below the Company’s operating segments for which discrete financial information is available and management regularly reviews the operating results. We perform an annual impairment assessment in the third quarter of each year, or more frequently if indicators of potential impairment exist, to determine whether it is more likely than not that the fair value of a reporting unit in which goodwill resides is less than its carrying value. For reporting units in which this assessment concludes that it is more likely than not that the fair value is more than its carrying value, goodwill is not considered impaired and we are not required to perform the two-step goodwill impairment test. Qualitative factors considered in this assessment include industry and market considerations, overall financial performance, and other relevant events and factors affecting the reporting unit.
For reporting units in which the impairment assessment concludes that it is more likely than not that the fair value is less than its carrying value, we perform the first step of the goodwill impairment test, which compares the fair value of the reporting unit to its carrying value. If the fair value of the reporting unit exceeds the carrying value of the net assets assigned to that unit, goodwill is not considered impaired and we are not required to perform additional analysis. If the carrying value of the net assets assigned to the reporting unit exceeds the fair value of the reporting unit, then we must perform the second step of the goodwill impairment test to determine the implied fair value of the reporting unit’s goodwill. If we determine during the second step that
103
the carrying value of a reporting unit’s goodwill exceeds its implied fair value, we record an impairment loss equal to the difference. We did not record an impairment of our goodwill during the years ended December 31, 2016 and 2015. We did not have goodwill recorded on our Consolidated Balance Sheet during the year ended December 31, 2014.
All construction and development projects are reviewed for impairment whenever there is an indication of potential reduction in fair value. If it is determined that a construction or development project is no longer probable of completion and the capitalized costs will not be recovered through future operations, the carrying value of the project will be written down to its fair value.
In order to estimate future cash flows, we consider historical cash flows, existing contracts, capacity prices and PPAs, changes in the market environment and other factors that may affect future cash flows. To the extent applicable, the assumptions we use are consistent with forecasts that we are otherwise required to make (for example, in preparing our earnings forecasts). The use of this method involves inherent uncertainty. We use our best estimates in making these evaluations and consider various factors, including forward price curves for power and fuel costs and forecasted operating costs. However, actual future market prices and project costs could vary from the assumptions used in our estimates, and the effect of such variations could be material.
When we determine that our assets meet the assets held-for-sale criteria, they are reported at the lower of their carrying amount or fair value less the cost to sell. We are also required to evaluate our equity method investments to determine whether or not they are impaired when the value is considered an “other than a temporary” decline in value.
Generally, fair value will be determined using valuation techniques such as the present value of expected future cash flows. We will also discount the estimated future cash flows associated with the asset using a single interest rate representative of the risk involved with such an investment including contract terms, tenor and credit risk of counterparties. We may also consider prices of similar assets, consult with brokers, or employ other valuation techniques. We use our best estimates in making these evaluations and consider various factors, including forward price curves for power and fuel costs and forecasted operating costs. However, actual future market prices and project costs could vary from the assumptions used in our estimates, and the effect of such variations could be material.
In August 2014, we executed a term sheet with Duke Energy Florida, Inc. related to our Osprey Energy Center for a new PPA with a term of 27 months, after which Duke Energy Florida, Inc. would purchase our Osprey Energy Center subject to an asset sale agreement that was executed in the fourth quarter of 2014. As a result, we conducted an impairment review of our Osprey Energy Center during the third quarter of 2014. We estimated fair value of our Osprey Energy Center under a modified market approach using the discounted cash flows under the PPA and the sale proceeds to be received, which incorporated a market participant's fair value of the power plant. We recorded an impairment loss of approximately $123 million which was recorded as a separate line item on our Consolidated Statements of Operations for the year ended December 31, 2014. We recorded an impairment loss of $13 million during the year ended December 31, 2016 related to a power plant in our West segment. During the year ended December 31, 2015, we did not record any impairment losses.
Asset Retirement Obligation
We record all known asset retirement obligations for which the liability’s fair value can be reasonably estimated. Over time, the liability is accreted to its present value each period and the capitalized cost is depreciated over the useful life of the related asset. At December 31, 2016 and 2015, our asset retirement obligation liabilities were $53 million and $47 million, respectively, primarily relating to land leases upon which our power plants are built and the requirement that the property meet specific conditions upon its return.
Debt Issuance Costs
Costs incurred related to the issuance of debt instruments are deferred and amortized over the term of the related debt using a method that approximates the effective interest rate method. However, when the timing of debt transactions involve contemporaneous exchanges of cash between us and the same creditor(s) in connection with the issuance of a new debt obligation and satisfaction of an existing debt obligation, debt issuance costs are accounted for depending on whether the transaction qualifies as an extinguishment or modification, which requires us to either write-off the original debt issuance costs and capitalize the new issuance costs, or continue to amortize the original debt issuance costs and immediately expense the new issuance costs. We retrospectively adopted Accounting Standards Update 2015-03 in the first quarter of 2016. As a result, our debt issuance costs related to a recognized debt liability are presented as a direct deduction from the carrying amount of the related debt liability, which is consistent with the presentation of debt discounts.
104
Revenue Recognition
Our operating revenues are comprised of the following:
• | power and steam revenue consisting of fixed and variable capacity payments, which are not related to generation including capacity payments received from RTO and ISO capacity auctions, variable payments for power and steam, which are related to generation, retail power revenues, host steam and RECs from our Geysers Assets, other revenues such as RMR Contracts, resource adequacy and certain ancillary service revenues and realized settlements from our marketing, hedging, optimization and trading activities; |
• | mark-to-market revenues from derivative instruments as a result of our marketing, hedging, optimization and trading activities; and |
• | other service revenues. |
Power and Steam
Physical Commodity Contracts — We recognize revenue primarily from the sale of power and steam thermal energy for sale to our customers for use in industrial or other heating operations upon transmission and delivery to the customer.
We routinely enter into physical commodity contracts for sales of our generated power to manage risk and capture the value inherent in our generation. We apply lease accounting to contracts that meet the definition of a lease and accrual accounting treatment to those contracts that are either exempt from derivative accounting or do not meet the definition of a derivative instrument. Additionally, we determine whether the financial statement presentation of revenues should be on a gross or net basis.
With respect to our physical executory contracts, where we act as a principal, we take title of the commodities and assume the risks and rewards of ownership by receiving the natural gas and using the natural gas in our operations to generate and deliver the power. Where we act as principal, we record settlement of our physical commodity contracts on a gross basis. Where we do not take title of the commodities but receive a net variable payment to convert natural gas into power and steam in a tolling operation, we record the variable payment as revenue but do not record any fuel and purchased energy expense.
Capacity payments, RMR Contracts, RECs, resource adequacy and other ancillary revenues, unless qualified as a lease, are recognized when contractually earned and consist of revenues received from our customers either at the market price or a contract price.
Revenues from sales of power to retail customers are recognized upon delivery under the accrual method, unless we apply derivative accounting treatment to the retail contract. See Note 8 for further discussion on our accounting for derivatives. Unbilled retail revenues are based upon estimates of customer usage since the date of the last meter reading provided by the ISOs or electric distribution companies by applying the estimated revenue per KWh by customer class to the estimated number of KWhs delivered but not yet billed. Estimated amounts are adjusted when actual usage is known and billed.
Realized and Mark-to-Market Revenues from Commodity Derivative Instruments
Realized Settlements of Commodity Derivative Instruments — The realized value of power commodity sales and purchase contracts that are net settled or settled as gross sales and purchases, but could have been net settled, are reflected on a net basis and are included in Commodity revenue on our Consolidated Statements of Operations.
Mark-to-Market Gain (Loss) — The changes in the mark-to-market value of power-based commodity derivative instruments are reflected on a net basis as a separate component of operating revenues.
105
Leases — We have contracts, such as certain tolling agreements, which we account for as operating leases under U.S. GAAP. Generally, we levelize certain components of these contract revenues on a straight-line basis over the term of the contract. The total contractual future minimum lease rentals for our contracts accounted for as operating leases at December 31, 2016, are as follows (in millions):
2017 | $ | 397 | |
2018 | 360 | ||
2019 | 320 | ||
2020 | 261 | ||
2021 | 257 | ||
Thereafter | 604 | ||
Total | $ | 2,199 | |
Accounting for Derivative Instruments
We enter into a variety of derivative instruments including both exchange traded and OTC power and natural gas forwards, options as well as instruments that settle on the power price to natural gas price relationships (Heat Rate swaps and options) and interest rate hedging instruments. We recognize all derivative instruments that qualify for derivative accounting treatment as either assets or liabilities and measure those instruments at fair value unless they qualify for and are designated under the normal purchase normal sale exemption. Accounting for derivatives at fair value requires us to make estimates about future prices during periods for which price quotes are not available from sources external to us, in which case we rely on internally developed price estimates. See Note 8 for further discussion on our accounting for derivatives.
Fuel and Purchased Energy Expense
Fuel and purchased energy expense is comprised of the cost of natural gas and fuel oil purchased from third parties for the purposes of consumption in our power plants as fuel, the cost of power purchased from third parties for sale to retail customers, the cost of power and natural gas purchased from third parties for our marketing, hedging and optimization activities and realized settlements and mark-to-market gains and losses resulting from general market price movements against certain derivative natural gas and power contracts including financial natural gas transactions economically hedging anticipated future power sales that either do not qualify as hedges under the hedge accounting guidelines or qualify under the hedge accounting guidelines and the hedge accounting designation has not been elected.
Realized and Mark-to-Market Expenses from Commodity Derivative Instruments
Realized Settlements of Commodity Derivative Instruments — The realized value of natural gas purchase and sales commodity contracts that are net settled are reflected on a net basis and included in Commodity expense on our Consolidated Statements of Operations. Power purchase commodity contracts that result in the physical delivery of power, and that also supplement our power generation, are reflected on a gross basis and are included in Commodity expense on our Consolidated Statements of Operations.
Mark-to-Market (Gain) Loss — The changes in the mark-to-market value of natural gas-based and certain power-based commodity derivative instruments are reflected on a net basis as a separate component of fuel and purchased energy expense.
Plant Operating Expense
Plant operating expense primarily includes employee expenses, utilities, chemicals, repairs and maintenance (including equipment failure and major maintenance), insurance and property taxes. We recognize these expenses when the service is performed or in the period to which the expense relates.
Income Taxes
Income taxes are accounted for under the asset and liability method. Deferred tax assets and liabilities are recognized for the future tax consequences attributable to differences between the financial statement carrying values of existing assets and liabilities and their respective tax basis and tax credit and NOL carryforwards. Deferred tax assets and liabilities are measured using enacted tax rates expected to apply to taxable income in the years in which temporary differences are expected to be recovered or settled. The effect on deferred tax assets and liabilities due to a change in tax rates is recognized in income in the period that includes the enactment date.
106
We recognize the financial statement effects of a tax position when it is more-likely-than-not, based on the technical merits, that the position will be sustained upon examination. A tax position that meets the more-likely-than-not recognition threshold is measured as the largest amount of tax benefit that is greater than 50% likely of being realized upon ultimate settlement with a taxing authority. We reverse a previously recognized tax position in the first period in which it is no longer more-likely-than-not that the tax position would be sustained upon examination. See Note 10 for a further discussion on our income taxes.
Earnings per Share
Basic earnings per share is calculated using the weighted average shares outstanding during the period and includes restricted stock units for which no future service is required as a condition to the delivery of the underlying common stock. Diluted earnings per share is calculated by adjusting the weighted average shares outstanding by the dilutive effect of share-based awards using the treasury stock method. See Note 11 for a further discussion of our earnings per share.
Stock-Based Compensation
For our restricted stock and restricted stock units, we use our closing stock price on the date of grant, or the last trading day preceding the grant date for restricted stock granted on non-trading days, as the fair value for measuring compensation expense. Our performance share units are measured at fair value using a Monte Carlo simulation model at each reporting date until settlement. We include estimated forfeitures in the calculation of stock-based compensation expense. See Note 12 for a further discussion of our stock-based compensation.
Treasury Stock
Treasury stock purchases are accounted for under the cost method whereby the entire cost of the acquired stock is recorded as treasury stock. Upon retirement of treasury stock, the amounts in excess of par value are charged entirely to additional paid-in capital. See Note 14 for a further discussion of treasury stock.
New Accounting Standards and Disclosure Requirements
Revenue Recognition — In May 2014, the FASB issued Accounting Standards Update 2014-09, “Revenue from Contracts with Customers.” The comprehensive new revenue recognition standard will supersede all existing revenue recognition guidance. The core principle of the standard is that a company should recognize revenue to depict the transfer of promised goods or services to customers in an amount that reflects the consideration to which the entity expects to be entitled in exchange for those goods or services. The standard also requires expanded disclosures surrounding revenue recognition. The standard allows for either full retrospective or modified retrospective adoption. In August 2015, the FASB deferred the effective date of Accounting Standards Update 2014-09 for public entities by one year, such that the standard will become effective for fiscal years and interim periods within those fiscal years beginning after December 15, 2017. The standard permits entities to adopt early, but only as of the original effective date. In March 2016, the FASB issued Accounting Standards Update 2016-08 “Principal versus Agent Considerations (Reporting Revenue Gross versus Net)” which clarifies implementation guidance for principal versus agent considerations in the new revenue recognition standard. In May 2016, the FASB issued Accounting Standards Update 2016-12 “Narrow-Scope Improvements and Practical Expedients” which addresses assessing the collectability of a contract, the presentation of sales taxes and other taxes collected from customers, non-cash consideration and completed contracts and contract modifications at transition. We are currently evaluating the effect the revenue recognition standard will have on our revenue contracts such as our PPAs and tolling agreements; however, we do not anticipate the adoption of this standard will have a material effect on our financial condition, results of operations or cash flows.
Consolidation — In February 2015, the FASB issued Accounting Standards Update 2015-02, “Amendments to the Consolidation Analysis.” The standard amends the consolidation model used in determining whether a reporting entity should consolidate the financial results of certain of its partially- and wholly-owned subsidiaries. All of our subsidiaries are subject to reevaluation under the revised consolidation model. Specifically, the amendments (i) modify the evaluation of whether limited partnerships and similar legal entities are voting interest entities or VIEs, (ii) eliminate the presumption that a general partner should consolidate the financial results of a limited partnership, (iii) affect the consolidation analysis of reporting entities that are involved with VIEs, particularly those that have fee arrangements and related party relationships and (iv) provide an exception for certain types of entities. This standard became effective for fiscal periods beginning after December 15, 2015, including interim periods within that reporting period. We adopted Accounting Standards Update 2015-02 in the first quarter of 2016 which did not have a material effect on our financial condition, results of operations or cash flows.
Debt Issuance Costs — In April 2015, the FASB issued Accounting Standards Update 2015-03, “Simplifying the Presentation of Debt Issuance Costs.” The standard requires debt issuance costs related to a recognized debt liability to be presented in the balance sheet as a direct deduction from the carrying amount of that debt liability, which is consistent with the presentation
107
of debt discounts. In August 2015, the FASB issued Accounting Standards Update 2015-15, “Presentation and Subsequent Measurement of Debt Issuance Costs Associated with Line-of-Credit Arrangements” which allows an entity to present debt issuance costs associated with a line-of-credit arrangement as an asset regardless of whether there are any outstanding borrowings on the line-of-credit arrangement. The standards became effective for fiscal years beginning after December 15, 2015, including interim periods within that reporting period. We retrospectively adopted Accounting Standard Updates 2015-03 and 2015-15 in the first quarter of 2016 which resulted in a $152 million reclassification of debt issuance costs from other assets to debt, net of current portion on our Consolidated Condensed Balance Sheet at December 31, 2015.
Cloud Computing Arrangements — In April 2015, the FASB issued Accounting Standards Update 2015-05, “Customer’s Accounting for Fees Paid in a Cloud Computing Arrangement.” The standard provides guidance regarding whether a cloud computing arrangement represents a software license or a service contract. The standard became effective for fiscal years beginning after December 15, 2015, including interim periods. We adopted Accounting Standards Update 2015-05 in the first quarter of 2016 which did not have a material effect on our financial condition, results of operations or cash flows.
Inventory — In July 2015, the FASB issued Accounting Standards Update 2015-11, “Simplifying the Measurement of Inventory.” The standard changes the inventory valuation method from the lower of cost or market to the lower of cost or net realizable value for inventory valued under the first-in, first-out or average cost methods. The standard is effective for fiscal years beginning after December 15, 2016, including interim periods and requires prospective adoption with early adoption permitted. We do not anticipate a material effect on our financial condition, results of operations or cash flows as a result of adopting this standard.
Leases — In February 2016, the FASB issued Accounting Standards Update 2016-02, “Leases.” The comprehensive new lease standard will supersede all existing lease guidance. The standard requires that a lessee should recognize a right-to-use asset and a lease liability for substantially all operating leases based on the present value of the minimum rental payments. Entities may make an accounting policy election to not recognize lease assets and liabilities for leases with a term of 12 months or less. For lessors, the accounting for leases remains substantially unchanged. The standard also requires expanded disclosures surrounding leases. The standard is effective for fiscal periods beginning after December 15, 2018, including interim periods within that reporting period and requires modified retrospective adoption with early adoption permitted. We have completed our initial evaluation of the standard and believe that the key changes that will affect us relate to our accounting for operating leases that are currently off-balance sheet and tolling contracts which we currently account for as operating leases. Additionally, we are evaluating the potential effects of the removal of the real estate guidance currently applicable to lessors that will be abrogated under Accounting Standards Update 2014-09, “Revenue from Contracts with Customers.” We are also considering electing the practical expedient in our implementation of the standard.
Stock-Based Compensation — In March 2016, the FASB issued Accounting Standards Update 2016-09, “Improvements to Employee Share-Based Payment Accounting.” The standard applies to several aspects of accounting for stock-based compensation including the recognition of excess tax benefits and deficiencies and their related presentation in the statement of cash flows as well as accounting for forfeitures. The standard also requires that shares withheld to satisfy tax withholding obligations associated with the vesting of restricted stock awarded to employees be presented as a financing activity in the statement of cash flows. The standard is effective for fiscal years beginning after December 15, 2016, including interim periods and allows for prospective, retrospective or modified retrospective adoption, depending on the area covered in the standard, with early adoption permitted. We early adopted Accounting Standards Update 2016-09 in the third quarter of 2016. The cumulative-effect adjustment to accumulated deficit for all excess tax benefits not previously recognized as of the beginning of the year is substantially offset by a corresponding change in the valuation allowance. The implementation of Accounting Standards Update 2016-09 did not have a material effect on our financial condition, results of operations or cash flows.
Statement of Cash Flows — In August 2016, the FASB issued Accounting Standards Update 2016-15, “Classification of Certain Cash Receipts and Cash Payments.” The standard addresses several matters of diversity in practice in how certain cash receipts and cash payments are presented and classified in the statement of cash flows including the presentation of debt extinguishment costs and distributions received from equity method investments. The standard is effective for fiscal years beginning after December 15, 2017, including interim periods and allows for retrospective adoption with early adoption permitted. We do not anticipate a material effect on our financial condition, results of operations or cash flows as a result of adopting this standard.
Restricted Cash — In November 2016, the FASB issued Accounting Standards Update 2016-18, “Restricted Cash.” The standard requires restricted cash to be included with cash and cash equivalents when reconciling the beginning and ending amounts in the statement of cash flows and also requires disclosures regarding the nature of restrictions on cash, cash equivalents and restricted cash. The standard is effective for fiscal years beginning after December 15, 2017, including interim periods and requires
108
for retrospective adoption with early adoption permitted. We do not anticipate a material effect on our financial condition, results of operations or cash flows as a result of adopting this standard.
Intangibles — Goodwill and Other — In January 2017, the FASB issued Accounting Standards Update 2017-04, “Simplifying the Test for Goodwill Impairment.” The standard eliminates the second step in the goodwill impairment test which requires an entity to determine the implied fair value of the reporting unit’s goodwill. Instead, an entity should recognize an impairment loss if the carrying value of the net assets assigned to the reporting unit exceeds the fair value of the reporting unit, with the impairment loss not to exceed the amount of goodwill allocated to the reporting unit. The standard is effective for annual and interim goodwill impairment tests conducted in fiscal years beginning after December 15, 2019, with early adoption permitted. We do not anticipate a material effect on our financial condition, results of operations or cash flows as a result of adopting this standard.
3. | Acquisitions and Divestitures |
Acquisition of Calpine Solutions, formerly Noble Solutions
On December 1, 2016, through our indirect, wholly-owned subsidiaries Calpine Energy Services Holdco II, LLC and Calpine Energy Financial Holdings, LLC, we completed the purchase of Calpine Solutions, formerly Noble Solutions, along with a swap contract from Noble Americas Gas & Power Corp. and Noble Group Limited for approximately $800 million plus approximately $350 million of net working capital. We recovered approximately $250 million in cash subsequent to closing and expect to recover an additional approximately $200 million through collateral synergies and the runoff of acquired legacy hedges, substantially within the first year. Calpine Solutions is a commercial and industrial retail electricity provider with customers in 19 states in the U.S., including presence in California, Texas, the Mid-Atlantic and Northeast, where our wholesale power generation fleet is primarily concentrated. The acquisition of this large direct energy sales platform is consistent with our stated goal of getting closer to our end-use customers and expands our retail customer base, complementing our existing retail business while providing us a valuable sales channel for reaching a much greater portion of the load we seek to serve. We funded the acquisition with a combination of cash on hand and debt financing. The results of Calpine Solutions are reflected in the segment which corresponds with the geographic area in which the retail sales occur.
The following table summarizes the consideration paid for Calpine Solutions as well as the preliminary determination of the identifiable assets acquired and liabilities assumed at the December 1, 2016 acquisition date (in millions):
Consideration | $ | 1,150 | |
Identifiable assets acquired and liabilities assumed: | |||
Assets: | |||
Current assets | 141 | ||
Margin deposits and other prepaid expense | 518 | ||
Derivative assets, current(1) | 365 | ||
Property, plant and equipment, net | 7 | ||
Intangible assets(2) | 360 | ||
Goodwill | 162 | ||
Long-term derivative assets(1) | 359 | ||
Total assets acquired | 1,912 | ||
Liabilities: | |||
Current liabilities | 276 | ||
Derivative liabilities, current(1) | 270 | ||
Long-term derivative liabilities(1) | 216 | ||
Total liabilities assumed | 762 | ||
Net assets acquired | $ | 1,150 | |
____________
(1) | Consists of acquired customer and wholesale contracts which will be substantially amortized over the next 5 years. |
(2) | Consists primarily of customer relationships that are being amortized over 14 years. See Note 2 for a further description of our intangible assets. |
109
We recorded goodwill of $162 million, all of which is deductible for tax purposes, in connection with the acquisition of Calpine Solutions which represent the excess of the purchase price over the fair values of Calpine Solution’s assets and liabilities. For the goodwill acquired, we allocated $68 million to our West segment, $15 million to our Texas segment and $79 million to our East segment.
The revenue and earnings of Calpine Solutions since its acquisition on December 1, 2016 are not material to our Consolidated Statement of Operations for the year ended December 31, 2016.
The following table summarizes the unaudited pro forma operating revenues and net income attributable to Calpine for the periods presented as if Calpine Solutions was acquired on January 1, 2015. The unaudited pro forma information has been prepared by adding the preliminary, unaudited historical results of Calpine Solutions, as adjusted for amortization of intangible assets and acquired contracts (using the preliminary values assigned to the net assets acquired from Calpine Solutions disclosed above) and interest expense from our 2017 First Lien Term Loan which funded a portion of the purchase price, to our results for the periods indicated below (in millions, except per share amounts).
2016 | 2015 | ||||||
(Unaudited) | |||||||
Operating revenues | $ | 8,324 | $ | 8,308 | |||
Net income attributable to Calpine | $ | 105 | $ | 132 | |||
Net income per share attributable to Calpine - basic | $ | 0.30 | $ | 0.36 | |||
Net income per share attributable to Calpine - diluted | $ | 0.29 | $ | 0.36 | |||
Acquisition of North American Power
On January 17, 2017, we, through an indirect, wholly-owned subsidiary, completed the purchase of 100% of the outstanding limited liability company membership interests in North American Power for approximately $105 million, excluding working capital and other adjustments. North American Power is a growing retail energy supplier for homes and small businesses and is primarily concentrated in the Northeast U.S. where Calpine has a substantial power generation presence and where Champion Energy has a substantial retail sales footprint that will be enhanced by the addition of North American Power, which will be integrated into our Champion Energy retail platform. We funded the acquisition with cash on hand and the purchase price will be primarily allocated to goodwill and intangible assets. The pro forma incremental effect of North American Power on our results of operations for each of the years ended December 31, 2016 and 2015 is not material.
Acquisition of Granite Ridge Energy Center
On February 5, 2016, we, through our indirect, wholly-owned subsidiary Calpine Granite Holdings, LLC, completed the purchase of Granite Ridge Energy Center, a power plant with a nameplate capacity of 745 MW (summer peaking capacity of 695 MW), from Granite Ridge Holdings, LLC, for approximately $500 million, excluding working capital and other adjustments. The addition of this modern, efficient, natural gas-fired, combined-cycle power plant increased capacity in our East segment, specifically the constrained New England market. Beginning operations in 2003, Granite Ridge Energy Center is located in Londonderry, New Hampshire and features two combustion turbines, two heat recovery steam generators and one steam turbine. We funded the acquisition with a combination of cash on hand and our 2023 First Lien Term Loan obtained in the fourth quarter of 2015, and the purchase price was primarily allocated to property, plant and equipment. The pro forma incremental effect of Granite Ridge Energy Center on our results of operations for each of the years ended December 31, 2016 and 2015 is not material.
Acquisition of Champion Energy
On October 1, 2015, we, through our indirect, wholly-owned subsidiary Calpine Energy Services Holdco, LLC, completed the purchase of Champion Energy Marketing, LLC from a subsidiary of Crane Champion Holdco, LLC, which owned a 75% interest, and EDF Trading North America, LLC, which owned a 25% interest, for approximately $240 million, excluding working capital adjustments. The addition of this well-established retail sales organization is consistent with our stated goal of getting closer to our end-use customers and provides us a valuable sales channel for directly reaching a much greater portion of the load we seek to serve. The purchase price was funded with cash on hand and any excess of the purchase price over the fair values of Champion Energy’s assets and liabilities was recorded as goodwill; however, the goodwill we recorded as a result of this acquisition was immaterial. The purchase price allocation was finalized during the third quarter of 2016 which did not result in any material adjustments. The pro forma incremental effect of Champion Energy on our results of operations for each of the years ended December 31, 2015 and 2014 is not material.
110
Acquisition of Fore River Energy Center
On November 7, 2014, we, through our indirect, wholly-owned subsidiary Calpine Fore River Energy Center, LLC, completed the purchase of Fore River Energy Center, a power plant with a capacity of 731 MW, and related plant inventory from a subsidiary of Exelon Corporation, for approximately $530 million, excluding working capital adjustments. The addition of this modern, efficient, natural gas-fired, combined-cycle power plant increased capacity in our East segment, specifically the constrained New England market. Built in 2003, Fore River Energy Center is located in North Weymouth, Massachusetts and features two combustion turbines, two heat recovery steam generators and one steam turbine. Both turbines feature dual-fuel capability that will enable them to run on either natural gas or fuel oil, depending on market conditions. The purchase price was funded with cash on hand and primarily allocated to property, plant and equipment. The purchase price allocation was finalized during the third quarter of 2015 which did not result in any material adjustments or the recognition of goodwill. The pro forma incremental effect of Fore River Energy Center on our results of operations for the year ended December 31, 2014 is not material.
Acquisition of Guadalupe Energy Center
On February 26, 2014, we, through our indirect, wholly-owned subsidiary Calpine Guadalupe GP, LLC, completed the purchase of a power plant owned by MinnTex Power Holdings, LLC with a capacity of 1,000 MW, for approximately $625 million, excluding working capital adjustments. The addition of this modern, natural gas-fired, combined-cycle power plant increased capacity in our Texas segment, which is one of our core markets. The 110-acre site, located in Guadalupe County, Texas, which is northeast of San Antonio, Texas, includes two 525 MW generation blocks, each consisting of two GE 7FA combustion turbines, two heat recovery steam generators and one GE steam turbine. We also paid $15 million to acquire rights to an advanced development opportunity for an approximately 400 MW quick-start, natural gas-fired peaker. We funded the acquisition with $425 million in incremental CCFC Term Loans and cash on hand. See Note 6 for a further description of the incremental CCFC Term Loans. The purchase price was primarily allocated to property, plant and equipment and was finalized during the third quarter of 2014 which did not result in any material adjustments to the preliminary purchase price allocation nor the recognition of any goodwill. The pro forma incremental effect of Guadalupe Energy Center on our results of operations for the year ended December 31, 2014 is not material.
Sale of Osprey Energy Center
On January 3, 2017, we completed the sale of our Osprey Energy Center to Duke Energy Florida, Inc. for approximately $166 million, excluding working capital and other adjustments. This transaction supports our effort to divest non-core assets outside our strategic concentration.
Sale of Mankato Power Plant
On October 26, 2016, we, through our indirect, wholly-owned subsidiaries, New Steamboat Holdings, LLC and Mankato Holdings, LLC, completed the sale of our Mankato Power Plant, a 375 MW natural gas-fired, combined-cycle power plant and 345 MW expansion project under advanced development located in Minnesota, to Southern Power Company, a subsidiary of Southern Company, for $396 million, excluding working capital and other adjustments. This transaction supports our effort to divest non-core assets outside our strategic concentration. We used the proceeds from the sale to partially fund the Calpine Solutions, formerly Noble Solutions, acquisition and for other corporate purposes. We recorded a gain on sale of assets, net of approximately $157 million during the fourth quarter of 2016, and our federal and state NOLs almost entirely offset the projected taxable gain from the sale.
Sale of South Point Energy Center
On April 1, 2016, we entered into an asset sale agreement for the sale of substantially all of the assets comprising our South Point Energy Center to Nevada Power Company d/b/a NV Energy for approximately $76 million plus the assumption by the purchaser of existing transmission capacity contracts with a future net present value payment obligation of approximately $112 million, approximately $9 million in remaining tribal lease costs and approximately $21 million in near-term repairs, maintenance and capital improvements to restore the power plant to full capacity. The sale is subject to certain conditions precedent, as well as federal and state regulatory approvals. The natural gas-fired, combined-cycle plant is located on the Fort Mojave Indian Reservation in Mohave Valley, Arizona, and features a summer peaking capacity of 504 MW. This transaction supports our effort to divest non-core assets outside our strategic concentration. In December 2016, the Nevada Public Utility Commission issued an order rejecting the asset sale agreement. In January 2017, Nevada Power Company filed a motion for reconsideration of this order. In February 2017, the FERC approved Nevada Power Company’s acquisition of the South Point Energy Center. However, on February 8, 2017, the Nevada Public Utility Commission denied Nevada Power Company’s purchase of the South Point Energy Center. Nevada Power Company has the right to appeal this decision. We are also currently assessing our options; however, we
111
do not anticipate that the denial of the sale by the Nevada Public Utility Commission will have a material effect on our financial condition, results of operations or cash flows.
Sale of Six Power Plants
On July 3, 2014, we completed the sale of six of our power plants in our East segment to NatGen Southeast Power LLC, a wholly-owned subsidiary of LS Power Equity Partners III. The purchase and sale agreement, dated April 17, 2014, stipulates the sale of 100% of the limited liability company interests in (i) Mobile Energy LLC, (ii) Santa Rosa Energy Center, LLC, (iii) Carville Energy, LLC, (iv) Decatur Energy Center, LLC, (v) Columbia Energy LLC and (vi) Calpine Oneta Power, LLC and thereby sell assets comprising 3,498 MW of combined-cycle generation capacity in Oklahoma, Louisiana, Alabama, Florida and South Carolina for a sale price of approximately $1.57 billion in cash, plus approximately $2 million for working capital and other adjustments at closing. The divestiture of these power plants has better aligned our asset base with our strategic focus on competitive wholesale markets.
We recorded a gain on sale of assets, net of approximately $753 million during the third quarter of 2014 and used existing federal and state NOLs to almost entirely offset the projected taxable gains from the sale. The sale of the six power plants did not meet the criteria for treatment as discontinued operations.
The six power plants included in the transaction are as follows:
Plant Name | Plant Capacity | Location | ||||
Oneta Energy Center | 1,134 | MW | Coweta, OK | |||
Carville Energy Center(1) | 501 | MW | St. Gabriel, LA | |||
Decatur Energy Center | 795 | MW | Decatur, AL | |||
Hog Bayou Energy Center | 237 | MW | Mobile, AL | |||
Santa Rosa Energy Center | 225 | MW | Pace, FL | |||
Columbia Energy Center(1) | 606 | MW | Calhoun County, SC | |||
Total | 3,498 | MW | ||||
___________
(1) | Indicates combined-cycle cogeneration power plant. |
Assets Held for Sale
The assets of Osprey Energy Center and South Point Energy Center, which are part of our East and West segments, respectively, are reported as current assets held for sale on our Consolidated Balance Sheet at December 31, 2016 and primarily consist of property, plant and equipment, net. The assets of Osprey Energy Center are reported as long-term assets held for sale on our Consolidated Balance Sheet at December 31, 2015.
4. | Property, Plant and Equipment, Net |
As of December 31, 2016 and 2015, the components of property, plant and equipment are stated at cost less accumulated depreciation as follows (in millions):
2016 | 2015 | Depreciable Lives | |||||||
Buildings, machinery and equipment | $ | 16,468 | $ | 16,294 | 3 – 46 Years | ||||
Geothermal properties | 1,377 | 1,319 | 13 – 58 Years | ||||||
Other | 259 | 208 | 3 – 46 Years | ||||||
18,104 | 17,821 | ||||||||
Less: Accumulated depreciation | 5,865 | 5,377 | |||||||
12,239 | 12,444 | ||||||||
Land | 116 | 120 | |||||||
Construction in progress | 658 | 448 | |||||||
Property, plant and equipment, net | $ | 13,013 | $ | 13,012 | |||||
112
Total depreciation expense, including amortization of leased assets, recorded for the years ended December 31, 2016, 2015 and 2014, was $628 million, $595 million and $591 million, respectively.
We have various debt instruments that are collateralized by our property, plant and equipment. See Note 6 for a discussion of such instruments.
Buildings, Machinery and Equipment
This component primarily includes power plants and related equipment. Included in buildings, machinery and equipment are assets under capital leases. See Note 6 for further information regarding these assets under capital leases.
Geothermal Properties
This component primarily includes power plants and related equipment associated with our Geysers Assets.
Other
This component primarily includes software and emission reduction credits that are power plant specific and not available to be sold.
Capitalized Interest
The total amount of interest capitalized was $21 million, $15 million and $19 million for the years ended December 31, 2016, 2015 and 2014, respectively.
5. | Variable Interest Entities and Unconsolidated Investments |
We consolidate all of our VIEs where we have determined that we are the primary beneficiary. There were no changes to our determination of whether we are the primary beneficiary of our VIEs for the year ended December 31, 2016. We have the following types of VIEs consolidated in our financial statements:
Subsidiaries with Project Debt — All of our subsidiaries with project debt not guaranteed by Calpine have PPAs that provide financial support and are thus considered VIEs. We retain ownership and absorb the full risk of loss and potential for reward once the project debt is paid in full. Actions by the lender to assume control of collateral can occur only under limited circumstances such as upon the occurrence of an event of default, which we have determined to be unlikely. See Note 6 for further information regarding our project debt and Note 2 for information regarding our restricted cash balances.
Subsidiaries with PPAs — Certain of our majority owned subsidiaries have PPAs that limit the risk and reward of our ownership and thus constitute a VIE.
VIE with a Purchase Option — OMEC has an agreement that provides a third party a fixed price option to purchase power plant assets exercisable in the year 2019. This purchase option limits the risk and reward of our ownership and, thus, constitutes a VIE.
Consolidation of VIEs
We consolidate our VIEs where we determine that we have both the power to direct the activities of a VIE that most significantly affect the VIE’s economic performance and the obligation to absorb losses or receive benefits from the VIE. We have determined that we hold the obligation to absorb losses and receive benefits in almost all of our VIEs where we hold the majority equity interest. Therefore, our determination of whether to consolidate is based upon which variable interest holder has the power to direct the most significant activities of the VIE (the primary beneficiary). Our analysis includes consideration of the following primary activities which we believe to have a significant effect on a power plant’s financial performance: operations and maintenance, plant dispatch, and fuel strategy as well as our ability to control or influence contracting and overall plant strategy. Our approach to determining which entity holds the powers and rights is based on powers held as of the balance sheet date. Contractual terms that may change the powers held in future periods, such as a purchase or sale option, are not considered in our analysis. Based on our analysis, we believe that we hold the power and rights to direct the most significant activities of almost all our majority-owned VIEs.
Under our consolidation policy and under U.S. GAAP we also:
• | perform an ongoing reassessment each reporting period of whether we are the primary beneficiary of our VIEs; and |
113
• | evaluate if an entity is a VIE and whether we are the primary beneficiary whenever any changes in facts and circumstances occur such that the holders of the equity investment at risk, as a group, lose the power from voting rights or similar rights of those investments to direct the activities of a VIE that most significantly affect the VIE’s economic performance or when there are other changes in the powers held by individual variable interest holders. |
Noncontrolling Interest — We own a 75% interest in Russell City Energy Company, LLC, one of our VIEs, which is also 25% owned by a third party. We fully consolidate this entity in our Consolidated Financial Statements and account for the third party ownership interest as a noncontrolling interest.
VIE Disclosures
Our consolidated VIEs include natural gas-fired power plants with an aggregate capacity of 9,491 MW and 10,266 MW, at December 31, 2016 and 2015, respectively. For these VIEs, we may provide other operational and administrative support through various affiliate contractual arrangements among the VIEs, Calpine Corporation and its other wholly-owned subsidiaries whereby we support the VIE through the reimbursement of costs and/or the purchase and sale of energy. Other than amounts contractually required, we provided support to these VIEs in the form of cash and other contributions of $115 million, $4 million and $47 million for the years ended December 31, 2016, 2015 and 2014, respectively.
U.S. GAAP requires separate disclosure on the face of our Consolidated Balance Sheets of the significant assets of a consolidated VIE that can be used only to settle obligations of the consolidated VIE and the significant liabilities of a consolidated VIE for which creditors (or beneficial interest holders) do not have recourse to the general credit of the primary beneficiary. In determining which assets of our VIEs meet the separate disclosure criteria, we consider that this separate disclosure requirement is met where Calpine Corporation is substantially limited or prohibited from access to assets (primarily cash and cash equivalents, restricted cash and property, plant and equipment), and where our VIEs had project financing that prohibits the VIE from providing guarantees on the debt of others. In determining which liabilities of our VIEs meet the separate disclosure criteria, we consider that this separate disclosure requirement is met where there are agreements that prohibit the debt holders of the VIEs from recourse to the general credit of Calpine Corporation and where the amounts were material to our financial statements.
Unconsolidated VIEs and Investments in Unconsolidated Subsidiaries
We have a 50% partnership interest in Greenfield LP and in Whitby. Greenfield LP and Whitby are VIEs; however, we do not have the power to direct the most significant activities of these entities and therefore do not consolidate them. Greenfield LP is a limited partnership between certain subsidiaries of ours and of Mitsui & Co., Ltd., which operates the Greenfield Energy Centre, a 1,038 MW natural gas-fired, combined-cycle power plant located in Ontario, Canada. We and Mitsui & Co., Ltd. each hold a 50% interest in Greenfield LP. Whitby is a limited partnership between certain of our subsidiaries and Atlantic Packaging Ltd., which operates the Whitby facility, a 50 MW natural gas-fired, simple-cycle cogeneration power plant located in Ontario, Canada. We and Atlantic Packaging Ltd. each hold a 50% partnership interest in Whitby.
In December 2016, we acquired Calpine Receivables, a bankruptcy remote entity created for the special purpose of purchasing trade accounts receivable from Calpine Solutions under the Accounts Receivable Sales Program. Calpine Receivables is a VIE as we have determined that we do not have the power to direct the activities of the VIE that most significantly affect the VIE’s economic performance nor the obligation to absorb losses or receive benefits from the VIE. Accordingly, we have determined that we are not the primary beneficiary of Calpine Receivables as we do not have the power to affect its financial performance as the unaffiliated financial institutions that purchase the receivables from Calpine Receivables control the selection criteria of the receivables sold and appoint the servicer of the receivables which controls management of default. Thus, we do not consolidate Calpine Receivables in our Consolidated Financial Statements and use the equity method of accounting to record our net interest in Calpine Receivables.
We account for these entities under the equity method of accounting and include our net equity interest in investments in unconsolidated subsidiaries on our Consolidated Balance Sheets. At December 31, 2016 and 2015, our equity method investments included on our Consolidated Balance Sheets were comprised of the following (in millions):
Ownership Interest as of December 31, 2016 | 2016 | 2015 | |||||||
Greenfield LP | 50% | $ | 73 | $ | 65 | ||||
Whitby | 50% | 16 | 14 | ||||||
Calpine Receivables | 100% | 10 | — | ||||||
Total investments in unconsolidated subsidiaries | $ | 99 | $ | 79 | |||||
114
Our risk of loss related to our investments in Greenfield LP, Whitby and Calpine Receivables is limited to our investment balance. Holders of the debt of our unconsolidated investments do not have recourse to Calpine Corporation and its other subsidiaries; therefore, the debt of our unconsolidated investments is not reflected on our Consolidated Balance Sheets. At December 31, 2016 and 2015, Greenfield LP’s debt was approximately $259 million and $269 million, respectively, and based on our pro rata share of our investment in Greenfield LP, our share of such debt would be approximately $130 million and $135 million at December 31, 2016 and 2015, respectively.
Our equity interest in the net income from our investments in unconsolidated subsidiaries for the years ended December 31, 2016, 2015 and 2014, is recorded in (income) from unconsolidated subsidiaries. We did not have any income or receive any distributions from our investment in Calpine Receivables for the year ended December 31, 2016. The following table sets forth details of our (income) from unconsolidated subsidiaries and distributions for the years indicated (in millions):
(Income) from Unconsolidated Subsidiaries | Distributions | ||||||||||||||||||||||
2016 | 2015 | 2014 | 2016 | 2015 | 2014 | ||||||||||||||||||
Greenfield LP | $ | (10 | ) | $ | (12 | ) | $ | (10 | ) | $ | 8 | $ | 12 | $ | — | ||||||||
Whitby | (14 | ) | (12 | ) | (15 | ) | 13 | 13 | 13 | ||||||||||||||
Total | $ | (24 | ) | $ | (24 | ) | $ | (25 | ) | $ | 21 | $ | 25 | $ | 13 | ||||||||
Inland Empire Energy Center Put and Call Options — We hold a call option to purchase the Inland Empire Energy Center (a 775 MW natural gas-fired power plant located in California) from GE that may be exercised between years 2017 and 2024. GE holds a put option whereby they can require us to purchase the power plant, if certain plant performance criteria are met by 2025. We determined that we are not the primary beneficiary of the Inland Empire power plant, and we do not consolidate it due to the fact that GE directs the most significant activities of the power plant including operations and maintenance.
6. | Debt |
We retrospectively adopted Accounting Standards Update 2015-03 in the first quarter of 2016. As a result, we recast our Consolidated Balance Sheet at December 31, 2015 resulting in a $152 million reclassification of debt issuance costs from other assets to debt, net of current portion. Our debt at December 31, 2016 and 2015, was as follows (in millions):
2016 | 2015 | ||||||
Senior Unsecured Notes | $ | 3,412 | $ | 3,406 | |||
First Lien Term Loans | 3,165 | 3,277 | |||||
First Lien Notes | 2,290 | 1,789 | |||||
Project financing, notes payable and other | 1,597 | 1,715 | |||||
CCFC Term Loans | 1,553 | 1,565 | |||||
Capital lease obligations | 162 | 185 | |||||
Subtotal | 12,179 | 11,937 | |||||
Less: Current maturities | 748 | 221 | |||||
Total long-term debt | $ | 11,431 | $ | 11,716 | |||
Our debt agreements contain covenants which could permit lenders to accelerate the repayment of our debt by providing notice, the lapse of time, or both, if certain events of default remain uncured after any applicable grace period. We were in compliance with all of the covenants in our debt agreements at December 31, 2016.
115
Annual Debt Maturities
Contractual annual principal repayments or maturities of debt instruments as of December 31, 2016, are as follows (in millions):
2017 | $ | 762 | |
2018 | 225 | ||
2019 | 498 | ||
2020 | 1,050 | ||
2021 | 217 | ||
Thereafter | 9,617 | ||
Subtotal | 12,369 | ||
Less: Debt issuance costs | 154 | ||
Less: Discount | 36 | ||
Total debt | $ | 12,179 | |
Senior Unsecured Notes
Our Senior Unsecured Notes are summarized in the table below (in millions, except for interest rates):
Outstanding at December 31, | Weighted Average Effective Interest Rates(1) | ||||||||||||
2016 | 2015 | 2016 | 2015 | ||||||||||
2023 Senior Unsecured Notes | $ | 1,237 | $ | 1,235 | 5.5 | % | 5.6 | % | |||||
2024 Senior Unsecured Notes | 643 | 641 | 5.6 | 5.7 | |||||||||
2025 Senior Unsecured Notes | 1,532 | 1,530 | 5.9 | 6.0 | |||||||||
Total Senior Unsecured Notes | $ | 3,412 | $ | 3,406 | |||||||||
____________
(1) | Our weighted average interest rate calculation includes the amortization of debt issuance costs. |
In February 2015, we issued $650 million in aggregate principal amount of 5.5% senior unsecured notes due 2024 in a public offering. The 2024 Senior Unsecured Notes bear interest at 5.5% per annum with interest payable semi-annually on February 1 and August 1 of each year, beginning on August 1, 2015. The 2024 Senior Unsecured Notes were issued at par, mature on February 1, 2024 and contain substantially similar covenant, qualifications, exceptions and limitations as our 2023 Senior Unsecured Notes and 2025 Senior Unsecured Notes. We used the net proceeds received from the issuance of our 2024 Senior Unsecured Notes to replenish cash on hand used for the acquisition of Fore River Energy Center in the fourth quarter of 2014, to repurchase approximately $147 million of our 2023 First Lien Notes and for general corporate purposes. We recorded approximately $9 million in debt issuance costs related to the issuance of our 2024 Senior Unsecured Notes and approximately $19 million in debt extinguishment costs during the first quarter of 2015 related to the partial repurchase of our 2023 First Lien Notes.
On July 22, 2014, we issued $1.25 billion in aggregate principal amount of 5.375% senior unsecured notes due 2023 and $1.55 billion in aggregate principal amount of 5.75% senior unsecured notes due 2025 in a public offering. The 2023 Senior Unsecured Notes bear interest at 5.375% per annum and the 2025 Senior Unsecured Notes bear interest at 5.75% per annum, in each case payable semi-annually on April 15 and October 15 of each year, beginning on April 15, 2015. The 2023 Senior Unsecured Notes mature on January 15, 2023 and the 2025 Senior Unsecured Notes mature on January 15, 2025. Our Senior Unsecured Notes were issued at par.
Our Senior Unsecured Notes are:
• | general unsecured obligations of Calpine; |
• | rank equally in right of payment with all of Calpine’s existing and future senior indebtedness; |
• | effectively subordinated to Calpine’s secured indebtedness to the extent of the value of the collateral securing such indebtedness; |
• | structurally subordinated to any existing and future indebtedness and other liabilities of Calpine’s subsidiaries; and |
116
• | senior in right of payment to any of Calpine’s subordinated indebtedness. |
We used the net proceeds received from the issuance of our 2023 Senior Unsecured Notes and 2025 Senior Unsecured Notes, together with cash on hand, to repurchase our outstanding 2019 First Lien Notes, 2020 First Lien Notes and 2021 First Lien Notes during the third quarter of 2014. We recorded approximately $42 million in debt issuance costs and approximately $340 million in debt extinguishment costs during the third quarter of 2014 related to the repayment of our 2019 First Lien Notes, 2020 First Lien Notes and 2021 First Lien Notes.
First Lien Term Loans
Our First Lien Term Loans are summarized in the table below (in millions, except for interest rates):
Outstanding at December 31, | Weighted Average Effective Interest Rates(1) | ||||||||||||
2016 | 2015 | 2016 | 2015 | ||||||||||
2017 First Lien Term Loan | $ | 537 | $ | — | 5.0 | % | — | % | |||||
2019 First Lien Term Loan | — | 795 | — | 4.6 | |||||||||
2020 First Lien Term Loan | — | 378 | — | 4.4 | |||||||||
2023 First Lien Term Loan(2) | 528 | 533 | 4.7 | 4.7 | |||||||||
New 2023 First Lien Term Loan(2) | 543 | — | 4.3 | — | |||||||||
2024 First Lien Term Loan(2) | 1,557 | 1,571 | 3.8 | 3.8 | |||||||||
Total First Lien Term Loans | $ | 3,165 | $ | 3,277 | |||||||||
____________
(1) | Our weighted average interest rate calculation includes the amortization of debt issuance costs and debt discount. |
(2) | On December 21, 2016, we repriced our 2023 First Lien Term Loans by lowering the margin over LIBOR by 0.25% to 2.75% and extended the maturity of our 2024 First Lien Term Loan From May 2022 to January 2024. |
On May 31, 2016, we entered into a $562 million first lien senior secured term loan which bears interest, at our option, at either (i) the Base Rate, equal to the highest of (a) the Federal Funds Effective Rate plus 0.50% per annum, (b) the Prime Rate or (c) the Eurodollar Rate for a one month interest period plus 1.0% (in each case, as such terms are defined in the New 2023 First Lien Term Loan credit agreement), plus an applicable margin of 2.00%, or (ii) LIBOR plus 2.75% per annum (with no LIBOR floor) and matures on May 31, 2023. An aggregate amount equal to 0.25% of the aggregate principal amount of the New 2023 First Lien Term Loans is payable at the end of each quarter with the remaining balance payable on the maturity date. We paid an upfront fee of an amount equal to 1.0% of the aggregate principal amount of the New 2023 First Lien Term Loan, which is structured as original issue discount and recorded approximately $11 million in debt issuance costs during the second quarter of 2016 related to the issuance of our New 2023 First Lien Term Loan. The New 2023 First Lien Term Loan contains substantially similar covenants, qualifications, exceptions and limitations as other First Lien Term Loans and the First Lien Notes. We used the proceeds from the New 2023 First Lien Term Loan and the 2026 First Lien Notes, discussed below, to repay the 2019 and 2020 First Lien Term Loans and recorded $15 million in debt extinguishment costs during the second quarter of 2016 associated with the repayment.
On December 1, 2016, we entered into a $550 million first lien senior secured term loan which bears interest, at our option, at either (i) the Base Rate, equal to the highest of (a) the Federal Funds Effective Rate plus 0.50% per annum, (b) the Prime Rate or (c) the Eurodollar Rate for a one month interest period plus 1.0% (in each case, as such terms are defined in the 2017 First Lien Term Loan credit agreement), plus an applicable margin of 0.75%, or (ii) LIBOR plus 1.75% per annum (with no LIBOR floor) and matures on November 30, 2017. An aggregate amount equal to 0.25% of the aggregate principal amount of the 2017 First Lien Term Loans is payable on June 30, 2017 with the remaining balance payable on the maturity date. We paid an upfront fee of an amount equal to 1.0% of the aggregate principal amount of the 2017 First Lien Term Loan, which is structured as original issue discount and recorded approximately $9 million in debt issuance costs during the fourth quarter of 2016 related to the issuance of our 2017 First Lien Term Loan. The 2017 First Lien Term Loan contains substantially similar covenants, qualifications, exceptions and limitations as other First Lien Term Loans and the First Lien Notes. We used the proceeds from the 2017 First Lien Term Loan to partially fund the acquisition of Calpine Solutions, formerly Noble Solutions.
On May 28, 2015, we entered into a $1.6 billion first lien senior secured term loan which bears interest, at our option, at either (i) the base rate, equal to the highest of (a) the Federal Funds Effective Rate plus 0.5% per annum, (b) the Prime Rate or (c) the Eurodollar Rate for a one month interest period plus 1.0% (in each case, as such terms are defined in the 2024 First Lien Term Loan credit agreement, plus an applicable margin of 1.75%, or (ii) LIBOR plus 2.75% per annum subject to a LIBOR floor
117
of 0.75% and matures on January 15, 2024. An aggregate amount equal to 0.25% of the aggregate principal amount of the 2024 First Lien Term Loan is payable at the end of each quarter with the remaining balance payable on the maturity date. The 2024 First Lien Term Loan contains substantially similar covenants, qualifications, exceptions and limitations as other First Lien Term Loans and the First Lien Notes. We used the net proceeds received, together with operating cash on hand, to repay the 2018 First Lien Term Loans.
We accounted for this transaction as a debt modification rather than an extinguishment of debt and, accordingly, did not record any debt extinguishment costs associated with the repayment of our 2018 First Lien Term Loans. However, in accordance with the accounting guidance for debt modification and extinguishment, we recorded approximately $13 million in debt modification costs associated with issuance costs and approximately $6 million in debt issuance costs related to the 2024 First Lien Term Loan during the second quarter of 2015.
On December 15, 2015, we entered into a $550 million first lien senior secured term loan which bears interest, at our option, at either (i) the Base Rate, equal to the highest of (a) the Federal Funds Effective Rate plus 0.50% per annum, (b) the Prime Rate or (c) the Eurodollar Rate for a one month interest period plus 1.0% (in each case, as such terms are defined in the 2023 First Lien Term Loan credit agreement), plus an applicable margin of 2.00%, or (ii) LIBOR plus 2.75% per annum with no LIBOR floor and matures on January 15, 2023. An aggregate amount equal to 0.25% of the aggregate principal amount of the 2023 First Lien Term Loans is payable at the end of each quarter with the remaining balance payable on the maturity date. We paid an upfront fee of an amount equal to 1.0% of the aggregate principal amount of the 2023 First Lien Term Loan, which is structured as original issue discount and recorded approximately $12 million in debt issuance costs during the fourth quarter of 2015 related to the issuance of our 2023 First Lien Term Loan. The 2023 First Lien Term Loan contains substantially similar covenants, qualifications, exceptions and limitations as other First Lien Term Loans and the First Lien Notes. We utilized $325 million of the proceeds received, together with cash on hand, to purchase Granite Ridge Energy Center and used the remaining proceeds to repay project and corporate debt and for general corporate purposes. The 2019 First Lien Term Loan and 2020 First Lien Term Loan carried substantially similar terms, covenants, qualifications, exceptions and limitations as our 2023 First Lien Term Loan.
On February 3, 2017, we entered into a $400 million first lien senior secured term loan which bears interest, at our option, at either (i) the Base Rate, equal to the highest of (a) the Federal Funds Effective Rate plus 0.50% per annum, (b) the Prime Rate or (c) the Eurodollar Rate for a one month interest period plus 1.0% (in each case, as such terms are defined in the New 2019 First Lien Term Loan credit agreement), plus an applicable margin of 0.75%, or (ii) LIBOR plus 1.75% per annum (with no LIBOR floor) and matures on December 31, 2019. An aggregate amount equal to 0.25% of the aggregate principal amount of the New 2019 First Lien Term Loans is payable at the end of each quarter (beginning with the quarter ending June 2017) with the remaining balance payable on the maturity date. We paid an upfront fee of an amount equal to 1.0% of the aggregate principal amount of the New 2019 First Lien Term Loan, which is structured as original issue discount and expect to record approximately $8 million in debt issuance costs during the first quarter of 2017 related to the issuance of our New 2019 First Lien Term Loan. The New 2019 First Lien Term Loan contains substantially similar covenants, qualifications, exceptions and limitations as other First Lien Term Loans and the First Lien Notes. We used the proceeds from the New 2019 First Lien Term Loan, together with cash on hand, to redeem the remaining outstanding 2023 First Lien Notes and expect to record approximately $21 million in debt extinguishment costs during the first quarter of 2017 associated with the redemption of the 2023 First Lien Notes.
First Lien Notes
Our First Lien Notes are summarized in the table below (in millions, except for interest rates):
Outstanding at December 31, | Weighted Average Effective Interest Rates(1) | ||||||||||||
2016 | 2015 | 2016 | 2015 | ||||||||||
2022 First Lien Notes | $ | 739 | $ | 737 | 6.4 | % | 6.4 | % | |||||
2023 First Lien Notes(2)(3) | 450 | 568 | 8.1 | 8.1 | |||||||||
2024 First Lien Notes | 485 | 484 | 6.1 | 6.1 | |||||||||
2026 First Lien Notes | 616 | — | 5.4 | — | |||||||||
Total First Lien Notes | $ | 2,290 | $ | 1,789 | |||||||||
____________
(1) | Our weighted average interest rate calculation includes the amortization of debt issuance costs and debt discount. |
118
(2) | In December 2016, we used cash on hand to redeem 10% of the original aggregate principal amount of our 2023 First Lien Notes, plus accrued and unpaid interest. During the fourth quarter of 2016, we recorded approximately $5 million in debt extinguishment costs related to the partial repurchase of our 2023 First Lien Notes. |
(3) | On February 3, 2017, we issued a notice of redemption to repay the remaining $453 million of our outstanding 2023 First Lien Notes using cash on hand along with the proceeds from the New 2019 First Lien Term Loan which contains a substantially lower variable rate of LIBOR plus 1.75% per annum. |
On May 31, 2016, we issued $625 million in aggregate principal amount of 5.25% senior secured notes due 2026 in a private placement. Our 2026 First Lien Notes bear interest at 5.25% payable semi-annually on June 1 and December 1 of each year, beginning on December 1, 2016. Our 2026 First Lien Notes mature on June 1, 2026 and contain substantially similar covenants, qualifications, exceptions and limitations as our First Lien Notes. We recorded approximately $9 million in debt issuance costs during the second quarter of 2016 related to the issuance of our 2026 First Lien Notes.
Our First Lien Notes are secured equally and ratably with indebtedness incurred under our First Lien Term Loans and Corporate Revolving Facility, subject to certain exceptions and permitted liens, on substantially all of our and certain of the guarantors’ existing and future assets. Additionally, our First Lien Notes rank equally in right of payment with all of our and the guarantors’ other existing and future senior indebtedness, and will be effectively subordinated in right of payment to all existing and future liabilities of our subsidiaries that do not guarantee our First Lien Notes.
Subject to certain qualifications and exceptions, our First Lien Notes will, among other things, limit our ability and the ability of the guarantors to:
• | incur or guarantee additional first lien indebtedness; |
• | enter into certain types of commodity hedge agreements that can be secured by first lien collateral; |
• | enter into sale and leaseback transactions; |
• | create or incur liens; and |
• | consolidate, merge or transfer all or substantially all of our assets and the assets of our restricted subsidiaries on a combined basis. |
Project Financing, Notes Payable and Other
The components of our project financing, notes payable and other are (in millions, except for interest rates):
Outstanding at December 31, | Weighted Average Effective Interest Rates(1) | ||||||||||||
2016 | 2015 | 2016 | 2015 | ||||||||||
Russell City due 2023(2) | $ | 462 | $ | 522 | 6.5 | % | 6.4 | % | |||||
Steamboat due 2025(3) | 444 | 448 | 5.4 | 6.8 | |||||||||
OMEC due 2019 | 303 | 313 | 7.2 | 7.1 | |||||||||
Los Esteros due 2023 | 217 | 242 | 3.7 | 3.1 | |||||||||
Pasadena(4) | 91 | 107 | 8.9 | 8.9 | |||||||||
Bethpage Energy Center 3 due 2020-2025(5) | 66 | 73 | 7.2 | 7.2 | |||||||||
Other | 14 | 10 | — | — | |||||||||
Total | $ | 1,597 | $ | 1,715 | |||||||||
_____________
(1) | Our weighted average interest rate calculation includes the amortization of debt issuance costs and debt discount. |
(2) | We refinanced our Russell City project debt during the fourth quarter of 2016 which lowered the interest rate. |
(3) | We refinanced and upsized our Steamboat project debt during the fourth quarter of 2016 which extended the maturity to November 14, 2025. |
(4) | Represents a failed sale-leaseback transaction that is accounted for as financing transaction under U.S. GAAP. |
(5) | Represents a weighted average of first and second lien loans for the weighted average effective interest rates. |
119
Our project financings are collateralized solely by the capital stock or partnership interests, physical assets, contracts and/or cash flows attributable to the entities that own the power plants. The lenders’ recourse under these project financings is limited to such collateral.
CCFC Term Loans
Our CCFC Term Loans are summarized in the table below (in millions, except for interest rates):
Outstanding at December 31, | Weighted Average Effective Interest Rates(1) | ||||||||||||
2016 | 2015 | 2016 | 2015 | ||||||||||
CCFC Term Loans | $ | 1,553 | $ | 1,565 | 3.5 | % | 3.5 | % | |||||
____________
(1) | Our weighted average interest rate calculation includes the amortization of debt issuance costs and debt discount. |
On May 3, 2013, CCFC entered into a credit agreement providing for a first lien senior secured term loan facility comprised of (i) a $900 million 7-year term loan and (ii) a $300 million 8.5-year term loan. The CCFC Term Loans bear interest, at CCFC’s option, at either (i) the Base Rate, equal to the higher of the Federal Funds Effective Rate plus 0.50% per annum or the Prime Rate (as such terms are defined in the Credit Agreement), plus an applicable margin of (a) 1.25% per annum with respect to the 7-year term loan and (b) 1.50% per annum with respect to the 8.5-year term loan, or (ii) LIBOR plus (a) 2.25% per annum with respect to the 7-year term loan and (b) 2.50% per annum with respect to the 8.5-year term loan (in each case subject to a LIBOR floor of 0.75%). The term loans were offered to investors at an issue price equal to 99.75% of face value.
An amount equal to 0.25% of the aggregate principal amount of the CCFC Term Loans are payable at the end of each quarter commencing in September 2013, with the remaining balance payable on the relevant maturity date (May 3, 2020 with respect to the 7-year term loan and January 31, 2022 with respect to the 8.5-year term loan). CCFC may elect from time to time to convert all or a portion of the CCFC Term Loans from LIBOR loans to Base Rate loans or vice versa. In addition, CCFC may at any time, and from time to time, prepay the term loans, in whole or in part, without premium or penalty, upon irrevocable notice to the administrative agent.
In February 2014, we executed an amendment to the credit agreement associated with the CCFC Term Loans, which allowed us to issue $425 million in incremental CCFC Term Loans to fund a portion of the purchase price paid in connection with the closing of our acquisition of Guadalupe Energy Center on February 26, 2014. Guadalupe Energy Center was purchased by Calpine Guadalupe GP, LLC, a wholly-owned subsidiary of CCFC. The incremental term loans carry substantially the same terms and conditions as the $300 million in aggregate principal amount of CCFC Term Loans issued in June 2013. The incremental term loans were offered to investors at an issue price equal to 98.75% of face value.
The CCFC Term Loans are secured by certain real and personal property of CCFC consisting primarily of seven natural gas-fired power plants. The CCFC Term Loans are not guaranteed by Calpine Corporation and are without recourse to Calpine Corporation or any of our non-CCFC subsidiaries or assets; however, CCFC generates the majority of its cash flows from an intercompany tolling agreement with Calpine Energy Services, L.P. and has various service agreements in place with other subsidiaries of Calpine Corporation.
120
Capital Lease Obligations
The following is a schedule by year of future minimum lease payments under capital leases and a failed sale-leaseback transaction related to our Pasadena Power Plant together with the present value of the net minimum lease payments as of December 31, 2016 (in millions):
Sale-Leaseback Transactions(1) | Capital Lease | Total | |||||||||
2017 | $ | 17 | $ | 40 | $ | 57 | |||||
2018 | 21 | 40 | 61 | ||||||||
2019 | 21 | 21 | 42 | ||||||||
2020 | 21 | 19 | 40 | ||||||||
2021 | 21 | 19 | 40 | ||||||||
Thereafter | 42 | 117 | 159 | ||||||||
Total minimum lease payments | 143 | 256 | 399 | ||||||||
Less: Amount representing interest | 52 | 94 | 146 | ||||||||
Present value of net minimum lease payments | $ | 91 | $ | 162 | $ | 253 | |||||
____________
(1) | Amounts are accounted for as financing transactions under U.S. GAAP and are included in our project financing, notes payable and other amounts above. |
The primary types of property leased by us are power plants and related equipment. The leases generally provide for the lessee to pay taxes, maintenance, insurance, and certain other operating costs of the leased property. The remaining lease terms range up to 35 years (including lease renewal options). Some of the lease agreements contain customary restrictions on dividends up to Calpine Corporation, additional debt and further encumbrances similar to those typically found in project financing agreements. At December 31, 2016 and 2015, the asset balances for the leased assets totaled approximately $864 million and $877 million with accumulated amortization of $404 million and $390 million, respectively. Amortization of assets under capital leases is recorded in depreciation and amortization expense on our Consolidated Statements of Operations. See Note 15 for discussion of capital leases guaranteed by Calpine Corporation.
Corporate Revolving Facility and Other Letters of Credit Facilities
The table below represents amounts issued under our letter of credit facilities at December 31, 2016 and 2015 (in millions):
2016 | 2015 | ||||||
Corporate Revolving Facility | $ | 535 | $ | 316 | |||
CDHI | 250 | 241 | |||||
Various project financing facilities | 206 | 198 | |||||
Total | $ | 991 | $ | 755 | |||
On February 8, 2016, we amended our Corporate Revolving Facility, extending the maturity by two years to June 27, 2020, and increasing the capacity by an additional $178 million to $1,678 million through June 27, 2018, reverting back to $1,520 million through the maturity date. Further, we increased the letter of credit sublimit by $250 million to $1.0 billion and extended the maturity by two years to June 27, 2020.
On December 1, 2016, we amended our Corporate Revolving Facility, increasing the capacity by $112 million to $1,790 million for the full term through June 27, 2020.
The Corporate Revolving Facility represents our primary revolving facility. Borrowings under the Corporate Revolving Facility bear interest, at our option, at either a base rate or LIBOR rate. Base rate borrowings shall be at the base rate, plus an applicable margin ranging from 1.00% to 1.25% as provided in the Corporate Revolving Facility credit agreement. Base rate is defined as the higher of (i) the Federal Funds Effective Rate, as published by the Federal Reserve Bank of New York, plus 0.50% and (ii) the rate the administrative agent announces from time to time as its prime per annum rate. LIBOR rate borrowings shall be at the British Bankers’ Association Interest Settlement Rates for the interest period as selected by us as a one, two, three, six or, if agreed by all relevant lenders, nine or twelve month interest period, plus an applicable margin ranging from 2.00% to 2.25%. Interest payments are due on the last business day of each calendar quarter for base rate loans and the earlier of (i) the last day of the interest period selected or (ii) each day that is three months (or a whole multiple thereof) after the first day for the interest
121
period selected for LIBOR rate loans. Letter of credit fees for issuances of letters of credit include fronting fees equal to that percentage per annum as may be separately agreed upon between us and the issuing lenders and a participation fee for the lenders equal to the applicable interest margin for LIBOR rate borrowings. Drawings under letters of credit shall be repaid within two business days or be converted into borrowings as provided in the Corporate Revolving Facility credit agreement. We incur an unused commitment fee ranging from 0.25% to 0.50% on the unused amount of commitments under the Corporate Revolving Facility.
The Corporate Revolving Facility does not contain any requirements for mandatory prepayments, except in the case of certain designated asset sales in excess of $3.0 billion in the aggregate. However, we may voluntarily repay, in whole or in part, the Corporate Revolving Facility, together with any accrued but unpaid interest, with prior notice and without premium or penalty. Amounts repaid may be reborrowed, and we may also voluntarily reduce the commitments under the Corporate Revolving Facility without premium or penalty.
The Corporate Revolving Facility is guaranteed and secured by certain of our current domestic subsidiaries and will also be additionally guaranteed by our future domestic subsidiaries that are required to provide such a guarantee in accordance with the terms of the Corporate Revolving Facility. The Corporate Revolving Facility ranks equally in right of payment with all of our and the guarantors’ other existing and future senior indebtedness and will be effectively subordinated in right of payment to all existing and future liabilities of our subsidiaries that do not guarantee the Corporate Revolving Facility. The Corporate Revolving Facility also requires compliance with financial covenants that include a minimum cash interest coverage ratio and a maximum net leverage ratio.
CDHI
We have a $300 million letter of credit facility related to CDHI which matures on January 2, 2018.
Fair Value of Debt
We record our debt instruments based on contractual terms, net of any applicable premium or discount. The following table details the fair values and carrying values of our debt instruments at December 31, 2016 and 2015 (in millions):
2016 | 2015 | ||||||||||||||
Fair Value | Carrying Value | Fair Value | Carrying Value | ||||||||||||
Senior Unsecured Notes | $ | 3,343 | $ | 3,412 | $ | 3,063 | $ | 3,406 | |||||||
First Lien Term Loans | 3,244 | 3,165 | 3,197 | 3,277 | |||||||||||
First Lien Notes | 2,349 | 2,290 | 1,885 | 1,789 | |||||||||||
Project financing, notes payable and other(1) | 1,543 | 1,506 | 1,653 | 1,608 | |||||||||||
CCFC Term Loans | 1,567 | 1,553 | 1,494 | 1,565 | |||||||||||
Total | $ | 12,046 | $ | 11,926 | $ | 11,292 | $ | 11,645 | |||||||
____________
(1) | Excludes a lease that is accounted for as a failed sale-leaseback transaction under U.S. GAAP. |
We measure the fair value of our Senior Unsecured Notes, First Lien Term Loans, First Lien Notes and CCFC Term Loans using market information, including quoted market prices or dealer quotes for the identical liability when traded as an asset (categorized as level 2). We measure the fair value of our project financing, notes payable and other debt instruments using discounted cash flow analyses based on our current borrowing rates for similar types of borrowing arrangements (categorized as level 3). We do not have any debt instruments with fair value measurements categorized as level 1 within the fair value hierarchy.
7. | Assets and Liabilities with Recurring Fair Value Measurements |
Cash Equivalents — Highly liquid investments which meet the definition of cash equivalents, primarily investments in money market accounts and other interest-bearing accounts, are included in both our cash and cash equivalents and our restricted cash on our Consolidated Balance Sheets. Certain of our money market accounts invest in U.S. Treasury securities or other obligations issued or guaranteed by the U.S. Government, its agencies or instrumentalities. We do not have any cash equivalents invested in institutional prime money market funds which require use of a floating net asset value and are subject to liquidity fees and redemption restrictions. Our cash equivalents are classified within level 1 of the fair value hierarchy.
122
Margin Deposits and Margin Deposits Posted with Us by Our Counterparties — Margin deposits and margin deposits posted with us by our counterparties represent cash collateral paid between our counterparties and us to support our commodity contracts. Our margin deposits and margin deposits posted with us by our counterparties are generally cash and cash equivalents and are classified within level 1 of the fair value hierarchy.
Derivatives — The primary factors affecting the fair value of our derivative instruments at any point in time are the volume of open derivative positions (MMBtu, MWh and $ notional amounts); changing commodity market prices, primarily for power and natural gas; our credit standing and that of our counterparties and customers for energy commodity derivatives; and prevailing interest rates for our interest rate hedging instruments. Prices for power and natural gas and interest rates are volatile, which can result in material changes in the fair value measurements reported in our financial statements in the future.
We utilize market data, such as pricing services and broker quotes, and assumptions that we believe market participants would use in pricing our assets or liabilities including assumptions about the risks inherent to the inputs in the valuation technique. These inputs can be either readily observable, market corroborated or generally unobservable. The market data obtained from broker pricing services is evaluated to determine the nature of the quotes obtained and, where accepted as a reliable quote, used to validate our assessment of fair value. We use other qualitative assessments to determine the level of activity in any given market. We primarily apply the market approach and income approach for recurring fair value measurements and utilize what we believe to be the best available information. We utilize valuation techniques that seek to maximize the use of observable inputs and minimize the use of unobservable inputs. We classify fair value balances based on the observability of those inputs.
The fair value of our derivatives includes consideration of our credit standing, the credit standing of our counterparties and customers and the effect of credit enhancements, if any. We have also recorded credit reserves in the determination of fair value based on our expectation of how market participants would determine fair value. Such valuation adjustments are generally based on market evidence, if available, or our best estimate.
Our level 1 fair value derivative instruments primarily consist of power and natural gas swaps, futures and options traded on the NYMEX or Intercontinental Exchange.
Our level 2 fair value derivative instruments primarily consist of interest rate hedging instruments and OTC power and natural gas forwards for which market-based pricing inputs in the principal or most advantageous market are representative of executable prices for market participants. These inputs are observable at commonly quoted intervals for substantially the full term of the instruments. In certain instances, our level 2 derivative instruments may utilize models to measure fair value. These models are industry-standard models that incorporate various assumptions, including quoted interest rates, correlation, volatility, as well as other relevant economic measures. Substantially all of these assumptions are observable in the marketplace throughout the full term of the instrument, can be derived from observable data or are supported by observable levels at which transactions are executed in the marketplace.
Our level 3 fair value derivative instruments may consist of OTC power and natural gas forwards and options where pricing inputs are unobservable, as well as other complex and structured transactions primarily for the sale of power to both wholesale counterparties and retail customers. Complex or structured transactions are tailored to our customers’ needs and can introduce the need for internally-developed model inputs which might not be observable in or corroborated by the market. When such inputs have a significant effect on the measurement of fair value, the instrument is categorized in level 3. Our valuation models may incorporate historical correlation information and extrapolate available broker and other information to future periods. OTC options are valued using industry-standard models, including the Black-Scholes option-pricing model. At each balance sheet date, we perform an analysis of all instruments subject to fair value measurement and include in level 3 all of those whose fair value is based on significant unobservable inputs.
For a definition of the different levels in the fair value hierarchy, see Item 7 “Management’s Discussion and Analysis of Financial Condition and Results of Operations — Application of Critical Accounting Policies — Fair Value Measurements”.
123
Financial assets and liabilities are classified in their entirety based on the lowest level of input that is significant to the fair value measurement. Our assessment of the significance of a particular input to the fair value measurement requires judgment and may affect our estimate of the fair value of our assets and liabilities and their placement within the fair value hierarchy levels. The following tables present our financial assets and liabilities that were accounted for at fair value on a recurring basis as of December 31, 2016 and 2015, by level within the fair value hierarchy:
Assets and Liabilities with Recurring Fair Value Measures as of December 31, 2016 | |||||||||||||||
Level 1 | Level 2 | Level 3 | Total | ||||||||||||
(in millions) | |||||||||||||||
Assets: | |||||||||||||||
Cash and cash equivalents(1) | $ | 606 | $ | — | $ | — | $ | 606 | |||||||
Margin deposits | 350 | — | — | 350 | |||||||||||
Commodity instruments: | |||||||||||||||
Commodity exchange traded futures and swaps contracts | 1,542 | — | — | 1,542 | |||||||||||
Commodity forward contracts(2) | — | 231 | 466 | 697 | |||||||||||
Interest rate hedging instruments | — | 29 | — | 29 | |||||||||||
Total assets | $ | 2,498 | $ | 260 | $ | 466 | $ | 3,224 | |||||||
Liabilities: | |||||||||||||||
Margin deposits posted with us by our counterparties | $ | 16 | $ | — | $ | — | $ | 16 | |||||||
Commodity instruments: | |||||||||||||||
Commodity exchange traded futures and swaps contracts | 1,570 | — | — | 1,570 | |||||||||||
Commodity forward contracts(2) | — | 411 | 67 | 478 | |||||||||||
Interest rate hedging instruments | — | 58 | — | 58 | |||||||||||
Total liabilities | $ | 1,586 | $ | 469 | $ | 67 | $ | 2,122 | |||||||
Assets and Liabilities with Recurring Fair Value Measures as of December 31, 2015 | |||||||||||||||
Level 1 | Level 2 | Level 3 | Total | ||||||||||||
(in millions) | |||||||||||||||
Assets: | |||||||||||||||
Cash and cash equivalents(1) | $ | 1,134 | $ | — | $ | — | $ | 1,134 | |||||||
Margin deposits | 89 | — | — | 89 | |||||||||||
Commodity instruments: | |||||||||||||||
Commodity exchange traded futures and swaps contracts | 1,736 | — | — | 1,736 | |||||||||||
Commodity forward contracts(2) | — | 220 | 54 | 274 | |||||||||||
Interest rate hedging instruments | — | 1 | — | 1 | |||||||||||
Total assets | $ | 2,959 | $ | 221 | $ | 54 | $ | 3,234 | |||||||
Liabilities: | |||||||||||||||
Margin deposits posted with us by our counterparties | $ | 35 | $ | — | $ | — | $ | 35 | |||||||
Commodity instruments: | |||||||||||||||
Commodity exchange traded futures and swaps contracts | 1,604 | — | — | 1,604 | |||||||||||
Commodity forward contracts(2) | — | 413 | 100 | 513 | |||||||||||
Interest rate hedging instruments | — | 90 | — | 90 | |||||||||||
Total liabilities | $ | 1,639 | $ | 503 | $ | 100 | $ | 2,242 | |||||||
___________
(1) | As of December 31, 2016 and 2015, we had cash and cash equivalents of $418 million and $906 million included in cash and cash equivalents and $188 million and $228 million included in restricted cash, respectively. |
124
(2) | Includes OTC swaps and options. |
At December 31, 2016 and 2015, the derivative instruments classified as level 3 primarily included commodity contracts, which are classified as level 3 because the contract terms relate to a delivery location or tenor for which observable market rate information is not available. The fair value of the net derivative position classified as level 3 is predominantly driven by market commodity prices. The following table presents quantitative information for the unobservable inputs used in our most significant level 3 fair value measurements at December 31, 2016 and 2015:
Quantitative Information about Level 3 Fair Value Measurements | ||||||||||
December 31, 2016 | ||||||||||
Fair Value, Net Asset | Significant Unobservable | |||||||||
(Liability) | Valuation Technique | Input | Range | |||||||
(in millions) | ||||||||||
Power Contracts | $ | 360 | Discounted cash flow | Market price (per MWh) | $9.60 — $86.34/MWh | |||||
Power Congestion Products | $ | 12 | Discounted cash flow | Market price (per MWh) | $(7.52) — $13.62/MWh | |||||
Natural Gas Contracts | $ | 17 | Discounted cash flow | Market price (per MMBtu) | $1.95 — $5.66/MMBtu | |||||
Quantitative Information about Level 3 Fair Value Measurements | ||||||||||
December 31, 2015 | ||||||||||
Fair Value, Net Asset | Significant Unobservable | |||||||||
(Liability) | Valuation Technique | Input | Range | |||||||
(in millions) | ||||||||||
Power Contracts | $ | (54 | ) | Discounted cash flow | Market price (per MWh) | $6.72 — $83.25/MWh | ||||
Power Congestion Products | $ | 8 | Discounted cash flow | Market price (per MWh) | $(11.47) — $12.19/MWh | |||||
The following table sets forth a reconciliation of changes in the fair value of our net derivative assets (liabilities) classified as level 3 in the fair value hierarchy for the years ended December 31, 2016, 2015 and 2014 (in millions):
2016 | 2015 | 2014 | |||||||||
Balance, beginning of period | $ | (46 | ) | $ | 85 | $ | 14 | ||||
Realized and mark-to-market gains (losses): | |||||||||||
Included in net income: | |||||||||||
Included in operating revenues(1) | (46 | ) | 218 | 70 | |||||||
Included in fuel and purchased energy expense(2) | 7 | (7 | ) | 5 | |||||||
Purchases and settlements: | |||||||||||
Purchases(3) | 426 | (70 | ) | 6 | |||||||
Settlements | (21 | ) | (29 | ) | (10 | ) | |||||
Transfers in and/or out of level 3(4): | |||||||||||
Transfers into level 3(5) | 4 | — | — | ||||||||
Transfers out of level 3(6) | 75 | (243 | ) | — | |||||||
Balance, end of period | $ | 399 | $ | (46 | ) | $ | 85 | ||||
Change in unrealized gains (losses) relating to instruments still held at end of period | $ | (39 | ) | $ | 211 | $ | 75 | ||||
___________
(1) | For power contracts and other power-related products, included on our Consolidated Statements of Operations. |
(2) | For natural gas and power contracts, swaps and options, included on our Consolidated Statements of Operations. |
(3) | During December 2016, we had $421 million in purchases related to the acquisition of Calpine Solutions, formerly Noble Solutions. |
125
(4) | We transfer amounts among levels of the fair value hierarchy as of the end of each period. There were no transfers into or out of level 1 during the years ended December 31, 2016, 2015 and 2014. |
(5) | We had $4 million in gains transfers out of level 2 into level 3 for the year ended December 31, 2016. There were no transfers out of level 2 into level 3 for the years ended December 31, 2015 and 2014. |
(6) | We had $(75) million in losses and $4 million in gains transferred out of level 3 into level 2 during the years ended December 31, 2016 and 2015, respectively, due to changes in market liquidity in various power markets and $239 million in gains transferred out of level 3 during the year ended December 31, 2015 to other assets following the election of the normal purchase normal sales exemption and the discontinuance of derivative accounting treatment as of the date of this election. There were no transfers out of level 3 for the year ended December 31, 2014. |
8. | Derivative Instruments |
Types of Derivative Instruments and Volumetric Information
Commodity Instruments — We are exposed to changes in prices for the purchase and sale of power, natural gas, fuel oil, environmental products and other energy commodities. We use derivatives, which include physical commodity contracts and financial commodity instruments such as OTC and exchange traded swaps, futures, options, forward agreements and instruments that settle on the power price to natural gas price relationships (Heat Rate swaps and options) or instruments that settle on power price relationships between delivery points for the purchase and sale of power and natural gas to attempt to maximize the risk-adjusted returns by economically hedging a portion of the commodity price risk associated with our assets. By entering into these transactions, we are able to economically hedge a portion of our Spark Spread at estimated generation and prevailing price levels.
We also engage in limited trading activities related to our commodity derivative portfolio as authorized by our Board of Directors and monitored by our Chief Risk Officer and Risk Management Committee of senior management. These transactions are executed primarily for the purpose of providing improved price and price volatility discovery, greater market access, and profiting from our market knowledge, all of which benefit our asset hedging activities. Our trading results were not material for the years ended December 31, 2016, 2015 and 2014.
Interest Rate Hedging Instruments — A portion of our debt is indexed to base rates, primarily LIBOR. We have historically used interest rate hedging instruments to adjust the mix between fixed and variable rate debt to hedge our interest rate risk for potential adverse changes in interest rates. As of December 31, 2016, the maximum length of time over which we were hedging using interest rate hedging instruments designated as cash flow hedges was 9 years.
As of December 31, 2016 and 2015, the net forward notional buy (sell) position of our outstanding commodity derivative instruments that did not qualify or were not designated under the normal purchase normal sale exemption and our interest rate hedging instruments were as follows (in millions):
Derivative Instruments | Notional Amounts | |||||||
2016 | 2015 | |||||||
Power (MWh) | (13 | ) | (41 | ) | ||||
Natural gas (MMBtu) | 613 | 996 | ||||||
Environmental credits (Tonnes) | 16 | 8 | ||||||
Interest rate hedging instruments | $ | 3,721 | (1) | $ | 1,320 | |||
___________
(1) | We entered into interest rate hedging instruments during the second quarter of 2016 to hedge approximately $2.5 billion of variable rate corporate debt for 2017 through 2019 which effectively places a ceiling on LIBOR at rates varying from 1.44% to 1.8125% for hedged interest payments. See Note 6 for a further discussion of our First Lien Term Loans. |
Certain of our derivative instruments contain credit risk-related contingent provisions that require us to maintain collateral balances consistent with our credit ratings. If our credit rating were to be downgraded, it could require us to post additional collateral or could potentially allow our counterparty to request immediate, full settlement on certain derivative instruments in liability positions. Currently, we do not believe that it is probable that any additional collateral posted as a result of a one credit notch downgrade from its current level would be material. The aggregate fair value of our derivative liabilities with credit risk-related contingent provisions as of December 31, 2016, was $24 million for which we have posted collateral of $5 million by posting margin deposits or granting additional first priority liens on the assets currently subject to first priority liens under our First Lien Notes, First Lien Term Loans and Corporate Revolving Facility. However, if our credit rating were downgraded by one notch from
126
its current level, we estimate that additional collateral of $6 million would be required and that no counterparty could request immediate, full settlement.
Accounting for Derivative Instruments
We recognize all derivative instruments that qualify for derivative accounting treatment as either assets or liabilities and measure those instruments at fair value unless they qualify for, and we elect, the normal purchase normal sale exemption. For transactions in which we elect the normal purchase normal sale exemption, gains and losses are not reflected on our Consolidated Statements of Operations until the period of delivery. Revenues and expenses derived from instruments that qualified for hedge accounting or represent an economic hedge are recorded in the same financial statement line item as the item being hedged. Hedge accounting requires us to formally document, designate and assess the effectiveness of transactions that receive hedge accounting. We present the cash flows from our derivatives in the same category as the item being hedged (or economically hedged) within operating activities on our Consolidated Statements of Cash Flows unless they contain an other-than-insignificant financing element in which case their cash flows are classified within financing activities.
Cash Flow Hedges — We only apply hedge accounting to our interest rate hedging instruments. We report the effective portion of the mark-to-market gain or loss on our interest rate hedging instruments designated and qualifying as a cash flow hedging instrument as a component of OCI and reclassify such gains and losses into earnings in the same period during which the hedged forecasted transaction affects earnings. Gains and losses due to ineffectiveness on interest rate hedging instruments are recognized currently in earnings as a component of interest expense. If it is determined that the forecasted transaction is no longer probable of occurring, then hedge accounting will be discontinued prospectively and future changes in fair value are recorded in earnings. If the hedging instrument is terminated or de-designated prior to the occurrence of the hedged forecasted transaction, the net accumulated gain or loss associated with the changes in fair value of the hedge instrument remains deferred in AOCI until such time as the forecasted transaction affects earnings or until it is determined that the forecasted transaction is probable of not occurring.
Derivatives Not Designated as Hedging Instruments — We enter into power, natural gas, interest rate, environmental product and fuel oil transactions that primarily act as economic hedges to our asset and interest rate portfolio, but either do not qualify as hedges under the hedge accounting guidelines or qualify under the hedge accounting guidelines and the hedge accounting designation has not been elected. Changes in fair value of commodity derivatives not designated as hedging instruments are recognized currently in earnings and are separately stated on our Consolidated Statements of Operations in mark-to-market gain/loss as a component of operating revenues (for physical and financial power and Heat Rate and commodity option activity) and fuel and purchased energy expense (for physical and financial natural gas, power, environmental product and fuel oil activity). Changes in fair value of interest rate derivatives not designated as hedging instruments are recognized currently in earnings as interest expense.
Derivatives Included on Our Consolidated Balance Sheets
The following tables present the fair values of our derivative instruments recorded on our Consolidated Balance Sheets by location and hedge type at December 31, 2016 and 2015 (in millions):
December 31, 2016 | |||||||||||
Commodity Instruments | Interest Rate Hedging Instruments | Total Derivative Instruments | |||||||||
Balance Sheet Presentation | |||||||||||
Current derivative assets | $ | 1,724 | $ | 1 | $ | 1,725 | |||||
Long-term derivative assets | 515 | 28 | 543 | ||||||||
Total derivative assets | $ | 2,239 | $ | 29 | $ | 2,268 | |||||
Current derivative liabilities | $ | 1,602 | $ | 28 | $ | 1,630 | |||||
Long-term derivative liabilities | 446 | 30 | 476 | ||||||||
Total derivative liabilities | $ | 2,048 | $ | 58 | $ | 2,106 | |||||
Net derivative assets (liabilities) | $ | 191 | $ | (29 | ) | $ | 162 | ||||
127
December 31, 2015 | |||||||||||
Commodity Instruments | Interest Rate Hedging Instruments | Total Derivative Instruments | |||||||||
Balance Sheet Presentation | |||||||||||
Current derivative assets | $ | 1,698 | $ | — | $ | 1,698 | |||||
Long-term derivative assets | 312 | 1 | 313 | ||||||||
Total derivative assets | $ | 2,010 | $ | 1 | $ | 2,011 | |||||
Current derivative liabilities | $ | 1,697 | $ | 37 | $ | 1,734 | |||||
Long-term derivative liabilities | 420 | 53 | 473 | ||||||||
Total derivative liabilities | $ | 2,117 | $ | 90 | $ | 2,207 | |||||
Net derivative assets (liabilities) | $ | (107 | ) | $ | (89 | ) | $ | (196 | ) | ||
December 31, 2016 | December 31, 2015 | ||||||||||||||
Fair Value of Derivative Assets | Fair Value of Derivative Liabilities | Fair Value of Derivative Assets | Fair Value of Derivative Liabilities | ||||||||||||
Derivatives designated as cash flow hedging instruments: | |||||||||||||||
Interest rate hedging instruments | $ | 29 | $ | 58 | $ | 1 | $ | 90 | |||||||
Total derivatives designated as cash flow hedging instruments | $ | 29 | $ | 58 | $ | 1 | $ | 90 | |||||||
Derivatives not designated as hedging instruments: | |||||||||||||||
Commodity instruments | $ | 2,239 | $ | 2,048 | $ | 2,010 | $ | 2,117 | |||||||
Total derivatives not designated as hedging instruments | $ | 2,239 | $ | 2,048 | $ | 2,010 | $ | 2,117 | |||||||
Total derivatives | $ | 2,268 | $ | 2,106 | $ | 2,011 | $ | 2,207 | |||||||
We elected not to offset fair value amounts recognized as derivative instruments on our Consolidated Balance Sheets that are executed with the same counterparty under master netting arrangements or other contractual netting provisions negotiated with the counterparty. Our netting arrangements include a right to set off or net together purchases and sales of similar products in the margining or settlement process. In some instances, we have also negotiated cross commodity netting rights which allow for the net presentation of activity with a given counterparty regardless of product purchased or sold. We also post cash collateral in support of our derivative instruments which may also be subject to a master netting arrangement with the same counterparty.
128
The tables below set forth our net exposure to derivative instruments after offsetting amounts subject to a master netting arrangement with the same counterparty at December 31, 2016 and 2015 (in millions):
December 31, 2016 | ||||||||||||||||
Gross Amounts Not Offset on the Consolidated Balance Sheets | ||||||||||||||||
Gross Amounts Presented on our Consolidated Balance Sheets | Derivative Asset (Liability) not Offset on the Consolidated Balance Sheets | Margin/Cash (Received) Posted (1) | Net Amount | |||||||||||||
Derivative assets: | ||||||||||||||||
Commodity exchange traded futures and swaps contracts | $ | 1,542 | $ | (1,521 | ) | $ | (21 | ) | $ | — | ||||||
Commodity forward contracts | 697 | (165 | ) | (11 | ) | 521 | ||||||||||
Interest rate hedging instruments | 29 | — | — | 29 | ||||||||||||
Total derivative assets | $ | 2,268 | $ | (1,686 | ) | $ | (32 | ) | $ | 550 | ||||||
Derivative (liabilities): | ||||||||||||||||
Commodity exchange traded futures and swaps contracts | $ | (1,570 | ) | $ | 1,521 | $ | 49 | $ | — | |||||||
Commodity forward contracts | (478 | ) | 165 | 55 | (258 | ) | ||||||||||
Interest rate hedging instruments | (58 | ) | — | — | (58 | ) | ||||||||||
Total derivative (liabilities) | $ | (2,106 | ) | $ | 1,686 | $ | 104 | $ | (316 | ) | ||||||
Net derivative assets (liabilities) | $ | 162 | $ | — | $ | 72 | $ | 234 | ||||||||
December 31, 2015 | ||||||||||||||||
Gross Amounts Not Offset on the Consolidated Balance Sheets | ||||||||||||||||
Gross Amounts Presented on our Consolidated Balance Sheets | Derivative Asset (Liability) not Offset on the Consolidated Balance Sheets | Margin/Cash (Received) Posted (1) | Net Amount | |||||||||||||
Derivative assets: | ||||||||||||||||
Commodity exchange traded futures and swaps contracts | $ | 1,736 | $ | (1,602 | ) | $ | (134 | ) | $ | — | ||||||
Commodity forward contracts | 274 | (202 | ) | (3 | ) | 69 | ||||||||||
Interest rate hedging instruments | 1 | — | — | 1 | ||||||||||||
Total derivative assets | $ | 2,011 | $ | (1,804 | ) | $ | (137 | ) | $ | 70 | ||||||
Derivative (liabilities): | ||||||||||||||||
Commodity exchange traded futures and swaps contracts | $ | (1,604 | ) | $ | 1,602 | $ | 2 | $ | — | |||||||
Commodity forward contracts | (513 | ) | 202 | 3 | (308 | ) | ||||||||||
Interest rate hedging instruments | (90 | ) | — | — | (90 | ) | ||||||||||
Total derivative (liabilities) | $ | (2,207 | ) | $ | 1,804 | $ | 5 | $ | (398 | ) | ||||||
Net derivative assets (liabilities) | $ | (196 | ) | $ | — | $ | (132 | ) | $ | (328 | ) | |||||
____________
(1) | Negative balances represent margin deposits posted with us by our counterparties related to our derivative activities that are subject to a master netting arrangement. Positive balances reflect margin deposits and natural gas and power prepayments posted by us with our counterparties related to our derivative activities that are subject to a master netting arrangement. See Note 9 for a further discussion of our collateral. |
129
Derivatives Included on Our Consolidated Statements of Operations
Changes in the fair values of our derivative instruments (both assets and liabilities) are reflected either in cash for option premiums paid or collected and for the acquisition of derivative instruments in connection with the acquisition of Calpine Solutions, in OCI, net of tax, for the effective portion of derivative instruments which qualify for and we have elected cash flow hedge accounting treatment, or on our Consolidated Statements of Operations as a component of mark-to-market activity within our earnings.
The following tables detail the components of our total activity for both the net realized gain (loss) and the net mark-to-market gain (loss) recognized from our derivative instruments in earnings and where these components were recorded on our Consolidated Statements of Operations for the years ended December 31, 2016, 2015 and 2014 (in millions):
2016 | 2015 | 2014 | |||||||||
Realized gain (loss)(1)(2) | |||||||||||
Commodity derivative instruments | $ | 235 | $ | 450 | $ | 110 | |||||
Total realized gain (loss) | $ | 235 | $ | 450 | $ | 110 | |||||
Mark-to-market gain (loss)(3) | |||||||||||
Commodity derivative instruments | $ | (1 | ) | $ | (113 | ) | $ | 342 | |||
Interest rate hedging instruments | 2 | 3 | 11 | ||||||||
Total mark-to-market gain (loss) | $ | 1 | $ | (110 | ) | $ | 353 | ||||
Total activity, net | $ | 236 | $ | 340 | $ | 463 | |||||
___________
(1) | Does not include the realized value associated with derivative instruments that settle through physical delivery. |
(2) | Includes amortization of acquisition date fair value of financial derivative activity related to the acquisition of Champion Energy and Calpine Solutions, formerly Noble Solutions. |
(3) | In addition to changes in market value on derivatives not designated as hedges, changes in mark-to-market gain (loss) also includes hedge ineffectiveness and adjustments to reflect changes in credit default risk exposure. |
2016 | 2015 | 2014 | |||||||||
Realized and mark-to-market gain (loss)(1) | |||||||||||
Derivatives contracts included in operating revenues(2)(3) | $ | 109 | $ | 528 | $ | 384 | |||||
Derivatives contracts included in fuel and purchased energy expense(2)(3) | 125 | (191 | ) | 68 | |||||||
Interest rate hedging instruments included in interest expense(4) | 2 | 3 | 11 | ||||||||
Total activity, net | $ | 236 | $ | 340 | $ | 463 | |||||
___________
(1) | In addition to changes in market value on derivatives not designated as hedges, changes in mark-to-market gain (loss) also includes adjustments to reflect changes in credit default risk exposure. |
(2) | Does not include the realized value associated with derivative instruments that settle through physical delivery. |
(3) | Includes amortization of acquisition date fair value of financial derivative activity related to the acquisition of Champion Energy and Calpine Solutions, formerly Noble Solutions. |
(4) | In addition to changes in market value on interest rate hedging instruments not designated as hedges, changes in mark-to-market gain (loss) also includes hedge ineffectiveness. |
130
Derivatives Included in OCI and AOCI
The following table details the effect of our net derivative instruments that qualified for hedge accounting treatment and are included in OCI and AOCI for the years ended December 31, 2016, 2015 and 2014 (in millions):
Gains (Loss) Recognized in OCI (Effective Portion) | Gain (Loss) Reclassified from AOCI into Income (Effective Portion)(3)(4) | ||||||||||||||||||||||||
2016 | 2015 | 2014 | 2016 | 2015 | 2014 | Affected Line Item on the Consolidated Statements of Operations | |||||||||||||||||||
Interest rate hedging instruments(1)(2) | $ | 41 | $ | 23 | $ | (2 | ) | $ | (43 | ) | $ | (47 | ) | $ | (46 | ) | Interest expense | ||||||||
____________
(1) | We did not record any material gain (loss) on hedge ineffectiveness related to our interest rate hedging instruments designated as cash flow hedges during the years ended December 31, 2016, 2015 and 2014. |
(2) | We recorded income tax expense of $1 million, nil and nil for the years ended December 31, 2016, 2015 and 2014, respectively, in AOCI related to our cash flow hedging activities. |
(3) | Cumulative cash flow hedge losses attributable to Calpine, net of tax, remaining in AOCI were $90 million, $127 million and $149 million at December 31, 2016, 2015 and 2014, respectively. Cumulative cash flow hedge losses attributable to the noncontrolling interest, net of tax, remaining in AOCI were $8 million, $11 million and $12 million at December 31, 2016, 2015 and 2014, respectively. |
(4) | Includes losses of $3 million, nil and $10 million that were reclassified from AOCI to interest expense for the years ended December 31, 2016, 2015 and 2014, respectively, where the hedged transactions became probable of not occurring. |
We estimate that pre-tax net losses of $40 million would be reclassified from AOCI into interest expense during the next 12 months as the hedged transactions settle; however, the actual amounts that will be reclassified will likely vary based on changes in interest rates. Therefore, we are unable to predict what the actual reclassification from AOCI into earnings (positive or negative) will be for the next 12 months.
9. | Use of Collateral |
We use margin deposits, prepayments and letters of credit as credit support with and from our counterparties for commodity procurement and risk management activities. In addition, we have granted additional first priority liens on the assets currently subject to first priority liens under various debt agreements as collateral under certain of our power and natural gas agreements and certain of our interest rate hedging instruments in order to reduce the cash collateral and letters of credit that we would otherwise be required to provide to the counterparties under such agreements. The counterparties under such agreements share the benefits of the collateral subject to such first priority liens pro rata with the lenders under our various debt agreements.
131
The table below summarizes the balances outstanding under margin deposits, natural gas and power prepayments, and exposure under letters of credit and first priority liens for commodity procurement and risk management activities as of December 31, 2016 and 2015 (in millions):
2016 | 2015 | ||||||
Margin deposits(1) | $ | 350 | $ | 89 | |||
Natural gas and power prepayments | 25 | 34 | |||||
Total margin deposits and natural gas and power prepayments with our counterparties(2) | $ | 375 | $ | 123 | |||
Letters of credit issued | $ | 798 | $ | 600 | |||
First priority liens under power and natural gas agreements(3) | 206 | 382 | |||||
First priority liens under interest rate hedging instruments | 55 | 92 | |||||
Total letters of credit and first priority liens with our counterparties | $ | 1,059 | $ | 1,074 | |||
Margin deposits posted with us by our counterparties(1)(4) | $ | 16 | $ | 35 | |||
Letters of credit posted with us by our counterparties | 43 | 24 | |||||
Total margin deposits and letters of credit posted with us by our counterparties | $ | 59 | $ | 59 | |||
___________
(1) | Balances are subject to master netting arrangements and presented on a gross basis on our Consolidated Balance Sheets. We do not offset fair value amounts recognized for derivative instruments executed with the same counterparty under a master netting arrangement for financial statement presentation, and we do not offset amounts recognized for the right to reclaim, or the obligation to return, cash collateral with corresponding derivative instrument fair values. See Note 8 for further discussion of our derivative instruments subject to master netting arrangements. |
(2) | At December 31, 2016 and 2015, $366 million and $101 million, respectively, were included in margin deposits and other prepaid expense and $9 million and $22 million, respectively, were included in other assets on our Consolidated Balance Sheets. |
(3) | Includes $185 million and $345 million related to first priority liens under power supply contracts associated with our retail hedging activities at December 31, 2016 and 2015, respectively. |
(4) | Included in other current liabilities on our Consolidated Balance Sheets. |
Future collateral requirements for cash, first priority liens and letters of credit may increase or decrease based on the extent of our involvement in hedging and optimization contracts, movements in commodity prices, and also based on our credit ratings and general perception of creditworthiness in our market.
10. | Income Taxes |
Income Tax Expense (Benefit)
The jurisdictional components of income from continuing operations before income tax expense (benefit), attributable to Calpine, for the years ended December 31, 2016, 2015 and 2014, are as follows (in millions):
2016 | 2015 | 2014 | |||||||||
U.S. | $ | 116 | $ | 133 | $ | 942 | |||||
International | 24 | 26 | 26 | ||||||||
Total | $ | 140 | $ | 159 | $ | 968 | |||||
132
The components of income tax expense (benefit) from continuing operations for the years ended December 31, 2016, 2015 and 2014, consisted of the following (in millions):
2016 | 2015 | 2014 | |||||||||
Current: | |||||||||||
Federal | $ | (10 | ) | $ | (1 | ) | $ | (1 | ) | ||
State | 14 | 10 | 19 | ||||||||
Foreign | 1 | 2 | (1 | ) | |||||||
Total current | 5 | 11 | 17 | ||||||||
Deferred: | |||||||||||
Federal | 10 | (21 | ) | — | |||||||
State | 27 | 1 | (1 | ) | |||||||
Foreign | 6 | (67 | ) | 6 | |||||||
Total deferred | 43 | (87 | ) | 5 | |||||||
Total income tax expense (benefit) | $ | 48 | $ | (76 | ) | $ | 22 | ||||
For the years ended December 31, 2016, 2015 and 2014, our income tax rates did not bear a customary relationship to statutory income tax rates, primarily as a result of the effect of our NOLs, valuation allowances and state income taxes. A reconciliation of the federal statutory rate of 35% to our effective rate from continuing operations for the years ended December 31, 2016, 2015 and 2014, is as follows:
2016 | 2015 | 2014 | ||||||
Federal statutory tax expense (benefit) rate | 35.0 | % | 35.0 | % | 35.0 | % | ||
State tax expense, net of federal benefit | 19.4 | 5.1 | 1.9 | |||||
Valuation allowances against future tax benefits | (25.0 | ) | (46.0 | ) | (35.8 | ) | ||
Valuation allowance related to foreign taxes | (0.1 | ) | (49.4 | ) | — | |||
Distributions from foreign affiliates and foreign taxes | (0.6 | ) | 3.1 | 1.2 | ||||
Change in unrecognized tax benefits | (0.1 | ) | 1.2 | (0.4 | ) | |||
Disallowed compensation | 0.9 | 3.1 | 0.1 | |||||
Stock-based compensation | 2.2 | 0.6 | 0.1 | |||||
Equity earnings | 2.0 | (0.5 | ) | — | ||||
Other differences | 0.6 | — | 0.2 | |||||
Effective income tax expense (benefit) rate | 34.3 | % | (47.8 | )% | 2.3 | % | ||
133
Deferred Tax Assets and Liabilities
The components of deferred income taxes as of December 31, 2016 and 2015, are as follows (in millions):
2016 | 2015 | ||||||
Deferred tax assets: | |||||||
NOL and credit carryforwards | $ | 2,728 | $ | 2,842 | |||
Taxes related to risk management activities and derivatives | 38 | 53 | |||||
Reorganization items and impairments | 222 | 212 | |||||
Deferred tax assets before valuation allowance | 2,988 | 3,107 | |||||
Valuation allowance | (1,581 | ) | (1,637 | ) | |||
Total deferred tax assets | 1,407 | 1,470 | |||||
Deferred tax liabilities: | |||||||
Property, plant and equipment | (1,266 | ) | (1,377 | ) | |||
Other differences | (93 | ) | (3 | ) | |||
Total deferred tax liabilities | (1,359 | ) | (1,380 | ) | |||
Net deferred tax asset | 48 | 90 | |||||
Less: Non-current deferred tax liability | (14 | ) | — | ||||
Deferred income tax asset, non-current | $ | 62 | $ | 90 | |||
Intraperiod Tax Allocation — In accordance with U.S. GAAP, intraperiod tax allocation provisions require allocation of a tax expense (benefit) to continuing operations due to current OCI gains (losses) with a partial offsetting amount recognized in OCI. The intraperiod tax allocation included in continuing operations is not material for the years ended December 31, 2016, 2015 and 2014.
NOL Carryforwards — As of December 31, 2016, our NOL carryforwards consisted primarily of federal NOL carryforwards of approximately $6.7 billion, which expire between 2024 and 2033, and NOL carryforwards in 21 states and the District of Columbia totaling approximately $3.7 billion, which expire between 2017 and 2036, substantially all of which are offset with a full valuation allowance. We also have approximately $647 million in foreign NOLs, which expire between 2025 and 2033, of which a portion is offset with a valuation allowance. The NOL carryforwards available are subject to limitations on their annual usage. Under federal and applicable state income tax laws, a corporation is generally permitted to deduct from taxable income in any year NOLs carried forward from prior years subject to certain time limitations as prescribed by the taxing authorities.
Income Tax Audits — We remain subject to periodic audits and reviews by taxing authorities; however, we do not expect these audits will have a material effect on our tax provision. Any NOLs we claim in future years to reduce taxable income could be subject to IRS examination regardless of when the NOLs occurred. Any adjustment of state or federal returns would likely result in a reduction of deferred tax assets rather than a cash payment of income taxes in tax jurisdictions where we have NOLs.
Valuation Allowance — U.S. GAAP requires that we consider all available evidence, both positive and negative, and tax planning strategies to determine whether, based on the weight of that evidence, a valuation allowance is needed to reduce the value of deferred tax assets. Future realization of the tax benefit of an existing deductible temporary difference or carryforward ultimately depends on the existence of sufficient taxable income of the appropriate character within the carryback or carryforward periods available under the tax law. Due to our history of losses, we were unable to assume future profits; however, we are able to consider available tax planning strategies.
As of December 31, 2016, we have provided a valuation allowance of approximately $1.6 billion on certain federal, state and foreign tax jurisdiction deferred tax assets to reduce the amount of these assets to the extent necessary to result in an amount that is more likely than not to be realized. The net change in our valuation allowance was a decrease of $56 million for the year ended December 31, 2016, $199 million for the year ended December 31, 2015 and $410 million for the year ended December 31, 2014, respectively; all primarily related to income generated in these periods.
In the normal course of business, we evaluate our existing corporate structure and continue to simplify where possible. In 2015, we implemented an internal restructuring of certain of our international entities by moving certain foreign subsidiaries under a different foreign parent. This restructuring resulted in our ability to further utilize foreign NOLs that were previously unavailable to offset the income tax obligation on future earnings and, thus, resulted in a release of approximately $69 million of valuation allowance against our NOLs. This reorganization did not have a material effect on our financial condition or cash flows.
134
Unrecognized Tax Benefits
At December 31, 2016, we had unrecognized tax benefits of $59 million. If recognized, $19 million of our unrecognized tax benefits could affect the annual effective tax rate and $40 million, related to deferred tax assets, could be offset against the recorded valuation allowance resulting in no effect to our effective tax rate. We had accrued interest and penalties of $12 million and $12 million for income tax matters at December 31, 2016 and 2015, respectively. We recognize interest and penalties related to unrecognized tax benefits in income tax expense (benefit) on our Consolidated Statements of Operations and recorded nil, $1 million and $(2) million for the years ended December 31, 2016, 2015 and 2014, respectively. We believe that it is reasonably possible that a decrease within the range of nil and $17 million in unrecognized tax benefits could occur within the next twelve months primarily related to foreign tax issues.
A reconciliation of the beginning and ending amounts of our unrecognized tax benefits for the years ended December 31, 2016, 2015 and 2014, is as follows (in millions):
2016 | 2015 | 2014 | |||||||||
Balance, beginning of period | $ | (58 | ) | $ | (56 | ) | $ | (68 | ) | ||
Increases related to prior year tax positions | — | — | (4 | ) | |||||||
Decreases related to prior year tax positions | 1 | 3 | 8 | ||||||||
Increases related to current year tax positions | (2 | ) | (5 | ) | — | ||||||
Decreases related to settlements | — | — | 8 | ||||||||
Balance, end of period | $ | (59 | ) | $ | (58 | ) | $ | (56 | ) | ||
11. | Earnings per Share |
We include restricted stock units for which no future service is required as a condition to the delivery of the underlying common stock in our calculation of weighted average shares outstanding. Reconciliations of the amounts used in the basic and diluted earnings per common share computations for the years ended December 31, 2016, 2015 and 2014, are as follows (shares in thousands):
2016 | 2015 | 2014 | ||||||
Diluted weighted average shares calculation: | ||||||||
Weighted average shares outstanding (basic) | 354,006 | 362,033 | 404,837 | |||||
Share-based awards | 2,104 | 2,853 | 4,523 | |||||
Weighted average shares outstanding (diluted) | 356,110 | 364,886 | 409,360 | |||||
We excluded the following items from diluted earnings per common share for the years ended December 31, 2016, 2015 and 2014, because they were anti-dilutive (shares in thousands):
2016 | 2015 | 2014 | ||||||
Share-based awards | 1,659 | 5,340 | 2,859 | |||||
12. | Stock-Based Compensation |
Calpine Equity Incentive Plans
The Calpine Equity Incentive Plans provide for the issuance of equity awards to all non-union employees as well as the non-employee members of our Board of Directors. The equity awards may include incentive or non-qualified stock options, restricted stock, restricted stock units, stock appreciation rights, performance compensation awards and other share-based awards. The equity awards granted under the Calpine Equity Incentive Plans include both graded and cliff vesting awards which vest over periods between one and five years, contain contractual terms between approximately five and ten years and are subject to forfeiture provisions under certain circumstances, including termination of employment prior to vesting. At December 31, 2016, there were 567,000 and 40,533,000 shares of our common stock authorized for issuance to participants under the Director Plan and the Equity Plan, respectively. At December 31, 2016, 84,221 shares and 7,214,539 shares remain available for future issuance under the Director Plan and the Equity Plan, respectively.
135
Equity Classified Share-Based Awards
We use the Black-Scholes option-pricing model or the Monte Carlo simulation model, as appropriate, to estimate the fair value of our employee stock options on the grant date, which takes into account the exercise price and expected term of the stock option, the current price of the underlying stock and its expected volatility, expected dividends on the stock and the risk-free interest rate for the expected term of the stock option as of the grant date. For our restricted stock and restricted stock units, we use our closing stock price on the date of grant, or the last trading day preceding the grant date for restricted stock granted on non-trading days, as the fair value for measuring compensation expense. Stock-based compensation expense is recognized over the period in which the related employee services are rendered. The service period is generally presumed to begin on the grant date and end when the equity award is fully vested. We use the graded vesting attribution method to recognize fair value of the equity award over the service period. For example, the graded vesting attribution method views one three-year restricted stock grant with annual graded vesting as three separate sub-grants, each representing 33 1/3% of the total number of shares of restricted stock granted. The first sub-grant vests over one year, the second sub-grant vests over two years and the third sub-grant vests over three years. A three-year restricted stock grant with cliff vesting is viewed as one grant vesting over three years.
Stock-based compensation expense recognized for our equity classified share-based awards was $30 million, $31 million and $31 million for the years ended December 31, 2016, 2015 and 2014, respectively. We did not record any significant tax benefits related to stock-based compensation expense in any period as we are not benefiting from a significant portion of our deferred tax assets, including deductions related to stock-based compensation expense. In addition, we did not capitalize any stock-based compensation expense as part of the cost of an asset for the years ended December 31, 2016, 2015 and 2014. At December 31, 2016, there was unrecognized compensation cost of $24 million related to restricted stock which is expected to be recognized over a weighted average period of 1.2 years. We issue new shares from our share reserves set aside for the Calpine Equity Incentive Plans when stock options are exercised and for other share-based awards.
There were no stock option grants during the years ended December 31, 2016, 2015 and 2014. A summary of all of our non-qualified stock option activity for the Calpine Equity Incentive Plans for the year ended December 31, 2016, is as follows:
Number of Shares | Weighted Average Exercise Price | Weighted Average Remaining Term (in years) | Aggregate Intrinsic Value (in millions) | |||||||||
Outstanding — December 31, 2015 | 3,055,172 | $ | 13.62 | 3.9 | $ | 5 | ||||||
Exercised | 156,758 | $ | 11.64 | |||||||||
Expired | 201,278 | $ | 15.62 | |||||||||
Outstanding — December 31, 2016 | 2,697,136 | $ | 13.59 | 3.0 | $ | 2 | ||||||
Exercisable — December 31, 2016 | 2,697,136 | $ | 13.59 | 3.0 | $ | 2 | ||||||
Vested and expected to vest – December 31, 2016 | 2,697,136 | $ | 13.59 | 3.0 | $ | 2 | ||||||
The total intrinsic value of our employee stock options exercised was $1 million, $6 million and $21 million for the years ended December 31, 2016, 2015 and 2014, respectively. The total cash proceeds received from our employee stock options exercised was $1 million, $8 million and $20 million for the years ended December 31, 2016, 2015 and 2014, respectively.
A summary of our restricted stock and restricted stock unit activity for the Calpine Equity Incentive Plans for the year ended December 31, 2016, is as follows:
Number of Restricted Stock Awards | Weighted Average Grant-Date Fair Value | |||||
Nonvested — December 31, 2015 | 3,528,270 | $ | 19.91 | |||
Granted | 2,994,292 | $ | 12.39 | |||
Forfeited | 248,282 | $ | 16.12 | |||
Vested | 1,404,632 | $ | 18.70 | |||
Nonvested — December 31, 2016 | 4,869,648 | $ | 15.83 | |||
The total fair value of our restricted stock and restricted stock units that vested during the years ended December 31, 2016, 2015 and 2014, was approximately $17 million, $39 million and $35 million, respectively.
136
Liability Classified Share-Based Awards
During the first quarter of 2016, our Board of Directors approved the award of performance share units to certain senior management employees. These performance share units will be settled in cash with payouts based on the relative performance of Calpine’s TSR over the three-year performance period of January 1, 2016 through December 31, 2018 compared with the TSR performance of the S&P 500 companies over the same period, as modified by the IPP Sector Modifier which may either increase or decrease the payout based on Calpine’s TSR within its IPP Peers. The performance share units vest on the last day of the performance period and will be settled in cash; thus, these awards are liability classified and are measured at fair value using a Monte Carlo simulation model at each reporting date until settlement. Stock-based compensation expense recognized related to our liability classified share-based awards was $1 million, $(5) million and $5 million for the years ended December 31, 2016, 2015 and 2014, respectively.
A summary of our performance share unit activity for the year ended December 31, 2016, is as follows:
Number of Performance Share Units | Weighted Average Grant-Date Fair Value | |||||
Nonvested — December 31, 2015 | 517,906 | $ | 23.36 | |||
Granted | 657,807 | $ | 14.81 | |||
Vested | 285,126 | $ | 20.70 | |||
Nonvested — December 31, 2016 | 890,587 | $ | 17.90 | |||
There were no payments made associated with our performance share units for the years ended December 31, 2016, 2015 and 2014.
13. | Defined Contribution and Defined Benefit Plans |
We maintain two defined contribution savings plans that are intended to be tax exempt under Sections 401(a) and 501(a) of the IRC. Our non-union plan generally covers employees who are not covered by a collective bargaining agreement, and our union plan covers employees who are covered by a collective bargaining agreement. We recorded expenses for these plans of approximately $11 million, $12 million and $12 million for the years ended December 31, 2016, 2015 and 2014, respectively. Employer matching contributions are 100% of the first 5% of compensation a participant defers for the non-union plan. The employee deferral limit is 75% of eligible compensation under both plans.
We also maintain a defined benefit pension plan whereby retirement benefits are primarily a function of age attained, years of participation, years of service, vesting and level of compensation. Only approximately 3% of our employees are eligible to participate in a defined benefit pension plan. As of December 31, 2016 and 2015, our pension assets, liabilities and related costs were not material to us. As of December 31, 2016 and 2015, there were approximately $18 million and $14 million in plan assets and approximately $26 million and $23 million in pension liabilities, respectively. Our net pension liability recorded on our Consolidated Balance Sheets as of December 31, 2016 and 2015, was approximately $8 million and $9 million, respectively. For the years ended December 31, 2016, 2015 and 2014, we recognized net periodic benefit costs of approximately $2 million, $2 million and $1 million, respectively. Our net periodic benefit cost is included in plant operating expense on our Consolidated Statements of Operations. As of December 31, 2016 and 2015, the total amount recognized in AOCI for actuarial losses related to pension obligation was approximately $5 million and $5 million, respectively.
In making our estimates of our pension obligation and related costs, we utilize discount rates, rates of compensation increases and rates of return on our assets that we believe are reasonable. Due to the relatively small size of our pension liability (which is not considered material), significant changes in these assumptions would not have a material effect on our pension liability. During 2016 and 2015, we made contributions of approximately $3 million and $2 million, respectively, and estimated contributions to the pension plan are expected to be approximately $2 million in 2016. Estimated future benefit payments to participants in each of the next five years are expected to be approximately $1 million in each year.
14. | Capital Structure |
Common Stock
Our authorized common stock consists of 1.4 billion shares of Calpine Corporation common stock. Common stock issued as of December 31, 2016 and 2015, was 359,627,113 shares and 356,755,747 shares, respectively, at a par value of $0.001 per
137
share. Common stock outstanding as of December 31, 2016 and 2015, was 359,061,764 shares and 356,662,004 shares, respectively. The table below summarizes our common stock activity for the years ended December 31, 2016, 2015 and 2014.
Shares Issued | Shares Held in Treasury | Shares Outstanding | ||||||
Balance, December 31, 2013 | 497,841,056 | (68,802,068 | ) | 429,038,988 | ||||
Shares issued under Calpine Equity Incentive Plans | 4,445,966 | (1,879,167 | ) | 2,566,799 | ||||
Share repurchase program | — | (49,684,523 | ) | (49,684,523 | ) | |||
Balance, December 31, 2014 | 502,287,022 | (120,365,758 | ) | 381,921,264 | ||||
Shares issued under Calpine Equity Incentive Plans | 2,431,236 | (1,089,328 | ) | 1,341,908 | ||||
Share repurchase program | — | (26,601,168 | ) | (26,601,168 | ) | |||
Retirement of shares held in treasury | (147,962,511 | ) | 147,962,511 | — | ||||
Balance, December 31, 2015 | 356,755,747 | (93,743 | ) | 356,662,004 | ||||
Shares issued under Calpine Equity Incentive Plans | 2,871,366 | (449,079 | ) | 2,422,287 | ||||
Share repurchase program | — | (22,527 | ) | (22,527 | ) | |||
Balance, December 31, 2016 | 359,627,113 | (565,349 | ) | 359,061,764 | ||||
Treasury Stock
As of December 31, 2016 and 2015, we had treasury stock of 565,349 shares and 93,743 shares, respectively, with a cost of $7 million and $1 million, respectively. Our treasury stock consists of shares repurchased as well as our common stock withheld to satisfy federal, state and local income tax withholding requirements for vested employee restricted stock awards and net share employee stock options exercises under the Equity Plan. All treasury stock is held at cost.
15. | Commitments and Contingencies |
Long-Term Service Agreements
As of December 31, 2016, the total estimated commitments for LTSAs associated with turbines were approximately $247 million. These commitments are payable over the terms of the respective agreements, which range from 1 to 15 years. LTSA future commitment estimates are based on the stated payment terms in the contracts at the time of execution and are subject to an annual inflationary adjustment. Certain of these agreements have terms that allow us to cancel the contracts for a fee. If we cancel such contracts, the estimated commitments remaining for LTSAs would be reduced.
Power Plant, Land and Other Operating Leases
We have entered into a long-term operating lease for one of our power plants, extending through 2020, which includes renewal options or purchase options at fair value and contain customary restrictions on dividends up to Calpine Corporation, additional debt and further encumbrances similar to those typically found in project finance agreements. Payments on our operating lease, which may contain escalation clauses or step rent provisions, are recognized on a straight-line basis. Certain capital improvements associated with our leased power plant may be deemed to be leasehold improvements and are amortized over the shorter of the term of the lease or the economic life of the capital improvement. We have also entered into various land and other operating leases for ground facilities and operations, which extend through 2073. Future minimum rent payments under these lease agreements, including renewal options and rent escalation clauses, are as follows (in millions):
Initial Year | 2017 | 2018 | 2019 | 2020 | 2021 | Thereafter | Total | ||||||||||||||||||||||
Land and other operating leases | various | $ | 13 | $ | 13 | $ | 13 | $ | 12 | $ | 12 | $ | 176 | $ | 239 | ||||||||||||||
Power plant operating lease | 2000 | 22 | 22 | 30 | — | — | — | 74 | |||||||||||||||||||||
Total leases | $ | 35 | $ | 35 | $ | 43 | $ | 12 | $ | 12 | $ | 176 | $ | 313 | |||||||||||||||
During the years ended December 31, 2016, 2015 and 2014, rent expense for power plant, land and other operating leases amounted to $38 million, $43 million and $46 million, respectively.
138
Production Royalties and Leases
We are obligated under numerous geothermal leases and right-of-way, easement and surface agreements. The geothermal leases generally provide for royalties based on production revenue with reductions for property taxes paid. The right-of-way, easement and surface agreements are based on flat rates or adjusted based on consumer price index changes and are not material. Under the terms of most geothermal leases, the royalties accrue as a percentage of power revenues. Certain properties also have net profits and overriding royalty interests that are in addition to the land base lease royalties. Some lease agreements contain clauses providing for minimum lease payments to lessors if production temporarily ceases or if production falls below a specified level. Production royalties for geothermal power plants for the years ended December 31, 2016, 2015 and 2014, were $22 million, $23 million and $28 million, respectively.
Office Leases
We lease our corporate and regional offices under noncancellable operating leases extending through 2022. Future minimum lease payments under these leases are as follows (in millions):
2017 | $ | 13 | |
2018 | 13 | ||
2019 | 12 | ||
2020 | 12 | ||
2021 | 1 | ||
Thereafter | — | ||
Total | $ | 51 | |
Lease payments are subject to adjustments for our pro rata portion of annual increases or decreases in building operating costs. During the years ended December 31, 2016, 2015 and 2014, rent expense for noncancelable operating leases was $9 million, $11 million and $11 million, respectively.
Commodity Purchases
We enter into commodity purchase contracts of various terms with third parties to supply fuel to our natural gas-fired power plants and power to our retail customers. The majority of our purchases are made in the spot market or under index-priced contracts. These contracts are accounted for as executory contracts and therefore not recognized as liabilities on our Consolidated Balance Sheet. At December 31, 2016, we had future commitments for the purchase, transportation, or storage of commodities as detailed below (in millions):
2017 | $ | 285 | |
2018 | 201 | ||
2019 | 118 | ||
2020 | 89 | ||
2021 | 70 | ||
Thereafter | 539 | ||
Total | $ | 1,302 | |
Guarantees and Indemnifications
As part of our normal business operations, we enter into various agreements providing, or otherwise arranging, financial or performance assurance to third parties on behalf of our subsidiaries in the ordinary course of such subsidiaries’ respective business. Such arrangements include guarantees, standby letters of credit and surety bonds for power and natural gas purchase and sale arrangements, retail contracts, contracts associated with the development, construction, operation and maintenance of our fleet of power plants and our Accounts Receivable Sales Program. These arrangements are entered into primarily to support or enhance the creditworthiness otherwise attributed to a subsidiary on a stand-alone basis, thereby facilitating the extension of sufficient credit to accomplish the subsidiaries’ intended commercial purposes.
139
At December 31, 2016, guarantees of subsidiary debt, standby letters of credit and surety bonds to third parties and the guarantee under our Account Receivable Sales Program and their respective expiration dates were as follows (in millions):
Guarantee Commitments | 2017 | 2018 | 2019 | 2020 | 2021 | Thereafter | Total | |||||||||||||||||||||
Guarantee of subsidiary debt(1) | $ | 26 | $ | 31 | $ | 30 | $ | 30 | $ | 29 | $ | 90 | $ | 236 | ||||||||||||||
Standby letters of credit(2)(3)(4) | 855 | 98 | — | — | — | 38 | 991 | |||||||||||||||||||||
Surety bonds(4)(5)(6) | 15 | — | — | — | — | 11 | 26 | |||||||||||||||||||||
Guarantee under Accounts Receivable Sales Program(7) | 211 | — | — | — | — | — | 211 | |||||||||||||||||||||
Total | $ | 1,107 | $ | 129 | $ | 30 | $ | 30 | $ | 29 | $ | 139 | $ | 1,464 | ||||||||||||||
____________
(1) | Represents Calpine Corporation guarantees of certain power plant capital leases and related interest. All guaranteed capital leases are recorded on our Consolidated Balance Sheets. |
(2) | The standby letters of credit disclosed above represent those disclosed in Note 6. |
(3) | Letters of credit are renewed annually and as such all amounts are reflected in the year of letter of credit expiration. The related commercial obligations extend for multiple years, therefore, renewal of the letter of credit will likely follow the term of the associated commercial obligation. |
(4) | These are contingent off balance sheet obligations. |
(5) | The majority of surety bonds do not have expiration or cancellation dates. |
(6) | As of December 31, 2016, no cash collateral is outstanding related to these bonds. |
(7) | Calpine has guaranteed the performance of Calpine Solutions under the Accounts Receivable Sales Program. The Accounts Receivable Sales Program expires on December 1, 2017. |
We routinely arrange for the issuance of letters of credit and various forms of surety bonds to third parties in support of our subsidiaries’ contractual arrangements of the types described above and may guarantee the operating performance of some of our partially-owned subsidiaries up to our ownership percentage. The letters of credit issued under various credit facilities support risk management and other operational and construction activities. In the event a subsidiary were to fail to perform its obligations under a contract supported by such a letter of credit or surety bond, and the issuing bank or surety were to make payment to the third party, we would be responsible for reimbursing the issuing bank or surety within an agreed timeframe, typically a period of one to five days. To the extent liabilities are incurred as a result of activities covered by letters of credit or the surety bonds, such liabilities are included on our Consolidated Balance Sheets.
Commercial Agreements — In connection with the purchase and sale of power, natural gas, environmental products and fuel oil to and from third parties with respect to the operation of our power plants and our retail subsidiaries, we may be required to guarantee a portion of the obligations of certain of our subsidiaries. We may also be required to guarantee performance obligations associated with our marketing, hedging, optimization and trading activities to manage our exposure to changes in prices for energy commodities. These guarantees may include future payment obligations and effectively guarantee our future performance under certain agreements.
Asset Acquisition and Disposition Agreements — In connection with our purchase and sale agreements, we have frequently provided for indemnification to the counterparty for liabilities incurred as a result of a breach of a representation, warranty or covenant by the indemnifying party. These indemnification obligations generally have a discrete term and are intended to protect the parties against risks that are difficult to predict or impossible to quantify at the time of the consummation of a particular transaction.
Other — Additionally, we and our subsidiaries from time to time assume other guarantee and indemnification obligations in conjunction with other transactions such as parts supply agreements, construction agreements, maintenance and service agreements and equipment lease agreements. These guarantee and indemnification obligations may include indemnification from personal injury or other claims by our employees as well as future payment obligations and effectively guarantee our future performance under certain agreements.
Our potential exposure under guarantee and indemnification obligations can range from a specified amount to an unlimited dollar amount, depending on the nature of the claim and the particular transaction. Our total maximum exposure under our guarantee and indemnification obligations is not estimable due to uncertainty as to whether claims will be made or how any potential claim
140
will be resolved. As of December 31, 2016, there are no material outstanding claims related to our guarantee and indemnification obligations and we do not anticipate that we will be required to make any material payments under our guarantee and indemnification obligations.
Litigation
We are party to various litigation matters, including regulatory and administrative proceedings arising out of the normal course of business. At the present time, we do not expect that the outcome of any of these proceedings, individually or in the aggregate, will have a material adverse effect on our financial condition, results of operations or cash flows.
On a quarterly basis, we review our litigation activities and determine if an unfavorable outcome to us is considered “remote,” “reasonably possible” or “probable” as defined by U.S. GAAP. Where we determine an unfavorable outcome is probable and is reasonably estimable, we accrue for potential litigation losses. The liability we may ultimately incur with respect to such litigation matters, in the event of a negative outcome, may be in excess of amounts currently accrued, if any; however, we do not expect that the reasonably possible outcome of these litigation matters would, individually or in the aggregate, have a material adverse effect on our financial condition, results of operations or cash flows. Where we determine an unfavorable outcome is not probable or reasonably estimable, we do not accrue for any potential litigation loss. The ultimate outcome of these litigation matters cannot presently be determined, nor can the liability that could potentially result from a negative outcome be reasonably estimated. As a result, we give no assurance that such litigation matters would, individually or in the aggregate, not have a material adverse effect on our financial condition, results of operations or cash flows.
Environmental Matters
We are subject to complex and stringent environmental laws and regulations related to the operation of our power plants. On occasion, we may incur environmental fees, penalties and fines associated with the operation of our power plants. At the present time, we do not have environmental violations or other matters that would have a material effect on our financial condition, results of operations or cash flows or that would significantly change our operations.
California Air Resources Board. On November 8, 2016, Russell City Energy Center, LLC received a notice of violation for an exceedance of CARB’s annual emission limits for Sulfur Hexafluoride (“SF6”) due to a leak of SF6 experienced for reporting year 2015 from one of the high voltage circuit breakers located in the Russell City Energy Center switchyard. SF6 is a gas used as an electrical insulator in high voltage circuit breakers and is a GHG. A monetary penalty has not yet been imposed by CARB. The liability we may ultimately incur with respect to this matter has not been determined, but it is not expected to be material.
141
16. | Segment and Significant Customer Information |
We assess our business on a regional basis due to the effect on our financial performance of the differing characteristics of these regions, particularly with respect to competition, regulation and other factors affecting supply and demand. At December 31, 2016, our reportable segments were West (including geothermal), Texas and East (including Canada). The results of our retail subsidiaries are reflected in the segment which corresponds with the geographic area in which the retail sales occur. We continue to evaluate the optimal manner in which we assess our performance including our segments and future changes may result in changes to the composition of our geographic segments.
Commodity Margin is a key operational measure reviewed by our chief operating decision maker to assess the performance of our segments. The tables below show our financial data for our segments for the periods indicated (in millions).
Year Ended December 31, 2016 | |||||||||||||||||||
West | Texas | East | Consolidation and Elimination | Total | |||||||||||||||
Revenues from external customers | $ | 1,562 | $ | 2,801 | $ | 2,353 | $ | — | $ | 6,716 | |||||||||
Intersegment revenues | 7 | 14 | 11 | (32 | ) | — | |||||||||||||
Total operating revenues | $ | 1,569 | $ | 2,815 | $ | 2,364 | $ | (32 | ) | $ | 6,716 | ||||||||
Commodity Margin | $ | 991 | $ | 655 | $ | 958 | $ | — | $ | 2,604 | |||||||||
Add: Mark-to-market commodity activity, net and other(1) | (3 | ) | (23 | ) | (20 | ) | (29 | ) | (75 | ) | |||||||||
Less: | |||||||||||||||||||
Plant operating expense | 357 | 317 | 332 | (29 | ) | 977 | |||||||||||||
Depreciation and amortization expense | 225 | 213 | 224 | — | 662 | ||||||||||||||
Sales, general and other administrative expense | 39 | 56 | 45 | — | 140 | ||||||||||||||
Other operating expenses | 32 | 9 | 38 | — | 79 | ||||||||||||||
Impairment losses | 13 | — | — | — | 13 | ||||||||||||||
(Gain) on sale of assets, net | — | — | (157 | ) | — | (157 | ) | ||||||||||||
(Income) from unconsolidated subsidiaries | — | — | (24 | ) | — | (24 | ) | ||||||||||||
Income from operations | 322 | 37 | 480 | — | 839 | ||||||||||||||
Interest expense | 631 | ||||||||||||||||||
Debt modification and extinguishment costs and other (income) expense, net | 49 | ||||||||||||||||||
Income before income taxes | $ | 159 | |||||||||||||||||
142
Year Ended December 31, 2015 | |||||||||||||||||||
West | Texas | East | Consolidation and Elimination | Total | |||||||||||||||
Revenues from external customers | $ | 2,089 | $ | 2,344 | $ | 2,039 | $ | — | $ | 6,472 | |||||||||
Intersegment revenues | 5 | 15 | 8 | (28 | ) | — | |||||||||||||
Total operating revenues | $ | 2,094 | $ | 2,359 | $ | 2,047 | $ | (28 | ) | $ | 6,472 | ||||||||
Commodity Margin | $ | 1,106 | $ | 736 | $ | 944 | $ | — | $ | 2,786 | |||||||||
Add: Mark-to-market commodity activity, net and other(1) | 160 | (120 | ) | (92 | ) | (29 | ) | (81 | ) | ||||||||||
Less: | |||||||||||||||||||
Plant operating expense | 416 | 338 | 292 | (28 | ) | 1,018 | |||||||||||||
Depreciation and amortization expense | 250 | 204 | 184 | — | 638 | ||||||||||||||
Sales, general and other administrative expense | 35 | 63 | 40 | — | 138 | ||||||||||||||
Other operating expenses | 37 | 9 | 36 | (2 | ) | 80 | |||||||||||||
(Income) from unconsolidated subsidiaries | — | — | (24 | ) | — | (24 | ) | ||||||||||||
Income from operations | 528 | 2 | 324 | 1 | 855 | ||||||||||||||
Interest expense | 628 | ||||||||||||||||||
Debt modification and extinguishment costs and other (income) expense, net | 54 | ||||||||||||||||||
Income before income taxes | $ | 173 | |||||||||||||||||
Year Ended December 31, 2014 | |||||||||||||||||||
West | Texas | East | Consolidation and Elimination | Total | |||||||||||||||
Revenues from external customers | $ | 2,352 | $ | 3,229 | $ | 2,449 | $ | — | $ | 8,030 | |||||||||
Intersegment revenues | 6 | 23 | 47 | (76 | ) | — | |||||||||||||
Total operating revenues | $ | 2,358 | $ | 3,252 | $ | 2,496 | $ | (76 | ) | $ | 8,030 | ||||||||
Commodity Margin(2) | $ | 1,050 | $ | 760 | $ | 949 | $ | — | $ | 2,759 | |||||||||
Add: Mark-to-market commodity activity, net and other(1) | 220 | 142 | 48 | (31 | ) | 379 | |||||||||||||
Less: | |||||||||||||||||||
Plant operating expense | 385 | 313 | 302 | (31 | ) | 969 | |||||||||||||
Depreciation and amortization expense | 245 | 191 | 168 | (1 | ) | 603 | |||||||||||||
Sales, general and other administrative expense | 41 | 64 | 39 | — | 144 | ||||||||||||||
Other operating expenses | 50 | 5 | 32 | 1 | 88 | ||||||||||||||
Impairment losses | — | — | 123 | — | 123 | ||||||||||||||
(Gain) on sale of assets, net | — | — | (753 | ) | — | (753 | ) | ||||||||||||
(Income) from unconsolidated subsidiaries | — | — | (25 | ) | — | (25 | ) | ||||||||||||
Income from operations | 549 | 329 | 1,111 | — | 1,989 | ||||||||||||||
Interest expense | 645 | ||||||||||||||||||
Debt extinguishment costs and other (income) expense, net | 361 | ||||||||||||||||||
Income before income taxes | $ | 983 | |||||||||||||||||
__________
(1) | Includes $(2) million, $(2) million and $(5) million of lease levelization and $122 million, $20 million and $14 million of amortization expense for the years ended December 31, 2016, 2015 and 2014, respectively. |
143
(2) | Our East segment includes Commodity Margin of $81 million for the year ended December 31, 2014 related to the six power plants in our East segment that were sold in July 2014. |
Significant Customers
For the year ended December 31, 2016, we had no significant customer that individually accounted for more than 10% of our annual consolidated revenues. For the year ended December 31, 2015, we had two significant customers, PJM Settlement, Inc. and PG&E, that individually accounted for more than 10% of our annual consolidated revenues. For the year ended December 31, 2014, we had one significant customer, PJM Settlement, Inc. that individually accounted for more than 10% of our annual consolidated revenues. Our revenues from PJM Settlement, Inc. for the years ended December 31, 2015 and 2014 were approximately $724 million and $1.0 billion, respectively, and were attributed to our East segment. Our revenues from PG&E for the year ended December 31, 2015 was approximately $642 million, which was attributed to our West segment.
17. | Quarterly Consolidated Financial Data (unaudited) |
Our quarterly operating results have fluctuated in the past and may continue to do so in the future as a result of a number of factors, including, but not limited to, our restructuring activities (including asset sales and dispositions), the completion of development projects, the timing and amount of curtailment of operations under the terms of certain PPAs, the degree of risk management and marketing, hedging, optimization and trading activities, energy commodity market prices and variations in levels of production. Furthermore, the majority of the dollar value of capacity payments under certain of our PPAs are received during the months of May through October.
Quarter Ended | |||||||||||||||
December 31 | September 30 | June 30 | March 31 | ||||||||||||
(in millions, except per share amounts) | |||||||||||||||
2016 | |||||||||||||||
Operating revenues | $ | 1,582 | $ | 2,355 | $ | 1,164 | $ | 1,615 | |||||||
Income from operations(1) | $ | 234 | $ | 462 | $ | 140 | $ | 3 | |||||||
Net income (loss) attributable to Calpine | $ | 24 | $ | 295 | $ | (29 | ) | $ | (198 | ) | |||||
Net income (loss) per common share attributable to Calpine — Basic | $ | 0.07 | $ | 0.83 | $ | (0.08 | ) | $ | (0.56 | ) | |||||
Net income (loss) per common share attributable to Calpine — Diluted | $ | 0.07 | $ | 0.83 | $ | (0.08 | ) | $ | (0.56 | ) | |||||
2015 | |||||||||||||||
Operating revenues | $ | 1,436 | $ | 1,948 | $ | 1,442 | $ | 1,646 | |||||||
Income from operations | $ | 22 | $ | 466 | $ | 201 | $ | 166 | |||||||
Net income (loss) attributable to Calpine | $ | (47 | ) | $ | 273 | $ | 19 | $ | (10 | ) | |||||
Net income (loss) per common share attributable to Calpine — Basic | $ | (0.13 | ) | $ | 0.77 | $ | 0.05 | $ | (0.03 | ) | |||||
Net income (loss) per common share attributable to Calpine — Diluted | $ | (0.13 | ) | $ | 0.76 | $ | 0.05 | $ | (0.03 | ) | |||||
____________
(1) | We recorded a gain on sale of assets, net of $(157) million in connection with the sale of the Mankato Power Plant which is included in income from operations on our Consolidated Statement of Operations for the year ended December 31, 2016. |
144
CALPINE CORPORATION AND SUBSIDIARIES
SCHEDULE II VALUATION AND QUALIFYING ACCOUNTS
Description | Balance at Beginning of Year | Charged to Expense | Charged to Other Accounts | Deductions | Balance at End of Year | ||||||||||||||
(in millions) | |||||||||||||||||||
Year Ended December 31, 2016 | |||||||||||||||||||
Allowance for doubtful accounts | $ | 2 | $ | 4 | $ | — | $ | — | $ | 6 | |||||||||
Deferred tax asset valuation allowance | 1,637 | (56 | ) | — | — | 1,581 | |||||||||||||
Year Ended December 31, 2015 | |||||||||||||||||||
Allowance for doubtful accounts | $ | 4 | $ | (2 | ) | $ | — | $ | — | $ | 2 | ||||||||
Deferred tax asset valuation allowance | 1,836 | (199 | ) | — | — | 1,637 | |||||||||||||
Year Ended December 31, 2014 | |||||||||||||||||||
Allowance for doubtful accounts | $ | 5 | $ | (1 | ) | $ | — | $ | — | $ | 4 | ||||||||
Deferred tax asset valuation allowance | 2,246 | (410 | ) | — | — | 1,836 | |||||||||||||
145