Attached files
Table of Contents
Index to Financial Statements
UNITED STATES SECURITIES AND EXCHANGE COMMISSION
Washington, D.C. 20549
Form 10-K
| [X] | ANNUAL REPORT PURSUANT TO SECTION 13 OR 15(d) OF THE SECURITIES EXCHANGE ACT OF 1934 | |||
| For the fiscal year ended December 31, 2009 | ||||
| [ ] | TRANSITION REPORT PURSUANT TO SECTION 13 OR 15(d) OF THE SECURITIES EXCHANGE ACT OF 1934 | |||
| For the transition period from to | ||||
Commission File No. 001-12079
Calpine Corporation
(A Delaware Corporation)
I.R.S. Employer Identification No. 77-0212977
717 Texas Avenue, Suite 1000, Houston, Texas 77002
Telephone: (713) 830-8775
Not Applicable
(Former Address)
Securities registered pursuant to Section 12(b) of the Act:
Calpine Corporation Common Stock, $.001 Par Value
Securities registered pursuant to Section 12(g) of the Act:
None
Indicate by check mark if the registrant is a well-known seasoned issuer, as defined in Rule 405 of the Securities Act. Yes [X] No [ ]
Indicate by check mark if the registrant is not required to file reports pursuant to Section 13 or Section 15(d) of the Act. Yes [ ] No [X]
Indicate by check mark whether the registrant (1) has filed all reports required to be filed by Section 13 or 15(d) of the Securities Exchange Act of 1934 during the preceding 12 months (or for such shorter period that the registrant was required to file such reports), and (2) has been subject to such filing requirements for the past 90 days. Yes [X] No [ ]
Indicate by check mark whether the registrant has submitted electronically and posted on its corporate Website, if any, every Interactive Data File required to be submitted and posted pursuant to Rule 405 of Regulation S-T during the preceding 12 months (or for such shorter period that the registrant was required to submit and post such files). Yes [ ] No [ ]
Indicate by check mark if disclosure of delinquent filers pursuant to Item 405 of Regulation S-K is not contained herein, and will not be contained, to the best of registrant’s knowledge, in definitive proxy or information statements incorporated by reference in Part III of this Form 10-K or any amendment to this Form 10-K. [ ]
Indicate by check mark whether the registrant is a large accelerated filer, an accelerated filer, a non-accelerated filer, or a smaller reporting company. See definitions of “large accelerated filer,” “accelerated filer,” and “smaller reporting company” in Rule 12b-2 of the Exchange Act. (Check one):
| Large accelerated filer [X] |
Accelerated filer [ ] | |
| Non-accelerated filer [ ] |
Smaller reporting company [ ] | |
| (Do not check if a smaller reporting company) |
Indicate by check mark whether the registrant is a shell company (as defined in Rule 12b-2 of the Act). Yes [ ] No [X]
State the aggregate market value of the voting and non-voting common equity held by non-affiliates of the registrant as of June 30, 2009, the last business day of the registrant’s most recently completed second fiscal quarter: approximately $2,018 million.
Indicate by check mark whether the registrant has filed all documents and reports required to be filed by Section 12, 13 or 15(d) of the Securities Exchange Act of 1934 subsequent to the distribution of securities under a plan confirmed by a court. Yes [X] No [ ]
Indicate the number of shares outstanding of each of the registrant’s classes of common stock, as of the latest practicable date: Calpine Corporation: 442,890,684 shares of common stock, par value $.001, were outstanding as of February 22, 2010.
DOCUMENTS INCORPORATED BY REFERENCE
Portions of the documents listed below have been incorporated by reference into the indicated parts of this report, as specified in the responses to the item numbers involved.
Designated portions of the Proxy Statement relating to the 2010 Annual Meeting of Shareholders are incorporated by reference into Part III (Items 11, 12, 13, 14 and portions of Item 10)
Table of Contents
Index to Financial Statements
CALPINE CORPORATION AND SUBSIDIARIES
FORM 10-K
ANNUAL REPORT
For the Year Ended December 31, 2009
i
Table of Contents
Index to Financial Statements
DEFINITIONS
As used in this Report, the following abbreviations and terms have the meanings as listed below. Additionally, the terms “Calpine,” “we,” “us” and “our” refer to Calpine Corporation and its consolidated subsidiaries, unless the context clearly indicates otherwise. For clarification, for the period from December 20, 2005, through February 7, 2008, such terms do not include the Canadian Debtors and other foreign subsidiaries that were deconsolidated as of the Petition Date. The term “Calpine Corporation” refers only to Calpine Corporation and not to any of its subsidiaries. Unless and as otherwise stated, any references in this Report to any agreement means such agreement and all schedules, exhibits and attachments in each case as amended, restated, supplemented or otherwise modified to the date of filing this Report.
| ABBREVIATION |
DEFINITION | |
| Acadia PP | Acadia Power Partners, LLC | |
| Adjusted EBITDA | EBITDA as adjusted for the effects of (a) impairment charges, (b) reorganization items, (c) major maintenance expense, (d) operating lease expense, (e) any non-cash realized gains on derivatives and any unrealized gains or losses on commodity derivative mark-to-market activity, (f) adjustments to reflect only the Adjusted EBITDA from our unconsolidated investments, (g) claim settlement income, (h) stock-based compensation expense (income), (i) non-cash gains or losses on sales or dispositions of assets, (j) non-cash gains and losses from intercompany foreign currency translations, (k) any gains or losses on the repurchase or extinguishment of debt and (l) any other extraordinary, unusual or non-recurring items | |
| Aircraft Services | Aircraft Services Corporation, an affiliate of General Electric Capital Corporation | |
| AOCI | Accumulated Other Comprehensive Income | |
| Aries Power Plant | MEP Pleasant Hill, LLC | |
| Auburndale | Auburndale Holdings, LLC | |
| Average availability | Represents the total hours during the period that our plants were in-service or available for service as a percentage of the total hours in the period | |
| Average capacity factor (excluding peakers) |
The average capacity factor (excluding peakers) is a measure of total actual generation as a percent of total potential generation. It is calculated by dividing (a) total MWh generated by our power plants (excluding peakers) by (b) the product of multiplying (i) the average total MW in operation during the period by (ii) the total hours in the period | |
| Bankruptcy Code | U.S. Bankruptcy Code | |
| BLM | Bureau of Land Management of the U.S. Department of the Interior | |
| Blue Spruce | Blue Spruce Energy Center LLC | |
| Btu | British thermal unit(s), a measure of heat content | |
| CAA | Federal Clean Air Act, U.S. Code Title 42, Chapter 85 | |
| CAISO | California ISO | |
| CalGen | Calpine Generating Company, LLC |
ii
Table of Contents
Index to Financial Statements
| ABBREVIATION |
DEFINITION | |
| CalGen Secured Debt | Collectively the: CalGen First Lien Debt comprised of (a) $235,000,000 First Priority Secured Floating Rate Notes Due 2009, (b) $600,000,000 First Priority Secured Institutional Term Loans Due 2009, and (c) $200,000,000 First Priority Revolving Loans issued on or about March 23, 2004; CalGen Second Lien Debt comprised of (a) $640,000,000 Second Priority Secured Floating Rate Notes Due 2010, and (b) $100,000,000 Second Priority Secured Institutional Term Loans Due 2010; and CalGen Third Lien Debt. In each case, issued by CalGen or CalGen and CalGen Finance Corp. and repaid on March 29, 2007 | |
| CalGen Third Lien Debt | Together, the $680,000,000 Third Priority Secured Floating Rate Notes Due 2011, issued by CalGen and CalGen Finance Corp.; and the $150,000,000 11 1/2% Third Priority Secured Notes Due 2011, issued by CalGen and CalGen Finance Corp., in each case repaid on March 29, 2007 | |
| Calpine Debtors | The U.S. Debtors and the Canadian Debtors | |
| Calpine Equity Incentive Plans | Collectively, the MEIP and the DEIP, which provide for grants of equity awards to Calpine employees and non-employee members of Calpine’s Board of Directors | |
| Canadian Court | The Court of Queen’s Bench of Alberta, Judicial District of Calgary | |
| Canadian Debtors | The subsidiaries and affiliates of Calpine Corporation that were granted creditor protection under the CCAA in the Canadian Court | |
| Canadian Effective Date | February 8, 2008, the date on which the Canadian Court ordered and declared that the Canadian Debtors’ proceedings under the CCAA were terminated | |
| Canadian Settlement Agreement | Settlement Agreement dated as of July 24, 2007, by and between Calpine Corporation, on behalf of itself and its U.S. subsidiaries, Calpine Canada Energy Ltd., Calpine Canada Power Ltd., Calpine Canada Energy Finance ULC, Calpine Energy Services Canada Ltd., Calpine Canada Resources Company, Calpine Canada Power Services Ltd., Calpine Canada Energy Finance II ULC, Calpine Natural Gas Services Limited, 3094479 Nova Scotia Company, Calpine Energy Services Canada Partnership, Calpine Canada Natural Gas Partnership, Calpine Canadian Saltend Limited Partnership and HSBC Bank USA, National Association, as successor indenture trustee | |
| Cap-and-trade | A government imposed GHG emissions reduction program that would place a cap on the amount of GHG emissions that can be emitted from certain sources, such as power plants. In its simplest form, the cap amount is set as a reduction from the total emissions during a base year and for each year over a period of years the cap amount would be reduced to achieve the targeted overall reduction by the end of the period. Allowances or credits for emissions in an amount equal to the cap would be issued or auctioned to companies with facilities, permitting them to emit up to a certain amount of GHG during each applicable period. After allowances have been distributed or auctioned, they can be transferred, or traded | |
| Cash Collateral Order | Second Amended Final Order of the U.S. Bankruptcy Court Authorizing Use of Cash Collateral and Granting Adequate Protection, dated February 24, 2006 as modified by orders of the U.S. Bankruptcy Court dated June 21, 2006, July 12, 2006, October 25, 2006, November 15, 2006, December 20, 2006, December 28, 2006, January 17, 2007, and March 1, 2007 |
iii
Table of Contents
Index to Financial Statements
| ABBREVIATION |
DEFINITION | |
| CCAA | Companies’ Creditors Arrangement Act (Canada) | |
| CCFC | Calpine Construction Finance Company, L.P. | |
| CCFC Finance | CCFC Finance Corp. | |
| CCFC Guarantors | Hermiston Power LLC and Brazos Valley Energy LLC, wholly owned subsidiaries of CCFC | |
| CCFC New Notes | The $1.0 billion aggregate principal amount of 8.0% Senior Secured Notes due 2016 issued May 19, 2009, by CCFC and CCFC Finance | |
| CCFC Old Notes | The $415 million total aggregate principal amount of Second Priority Senior Secured Floating Rate Notes Due 2011 issued by CCFC and CCFC Finance, comprising $365 million aggregate principal amount issued August 14, 2003, and $50 million aggregate principal amount issued September 25, 2003, and redeemed on June 18, 2009 | |
| CCFC Refinancing | The issuance of the CCFC New Notes on May 19, 2009, pursuant to Rule 144A and Regulation S under the Securities Act, and the related transactions including repayment of the CCFC Term Loans and the redemption of the CCFC Old Notes and CCFCP Preferred Shares | |
| CCFC Term Loans | The $385 million First Priority Senior Secured Institutional Term Loans due 2009 borrowed by CCFC under the Credit and Guarantee Agreement, dated as of August 14, 2003, among CCFC, the guarantors party thereto, and Goldman Sachs Credit Partners L.P., as sole lead arranger, sole bookrunner, administrative agent and syndication agent, and repaid on May 19, 2009 | |
| CCFCP | CCFC Preferred Holdings, LLC | |
| CCFCP Preferred Shares | The $300 million of six-year redeemable preferred shares due 2011 issued by CCFCP and redeemed on or before July 1, 2009 | |
| CDWR | California Department of Water Resources | |
| CES | Calpine Energy Services, L.P. | |
| CFTC | U.S. Commodities Futures Trading Commission | |
| Chapter 11 | Chapter 11 of the Bankruptcy Code | |
| CO2 | Carbon dioxide | |
| Cogeneration | Using a portion or all of the steam generated in the power generating process to supply a customer with steam for use in the customer’s operations | |
| Commodity Collateral Revolver | Commodity Collateral Revolving Credit Agreement, dated as of July 8, 2008, among Calpine Corporation as borrower, Goldman Sachs Credit Partners L.P., as payment agent, sole lead arranger and sole bookrunner, and the lenders from time to time party thereto | |
| Commodity expense | The sum of our expenses from fuel and purchased energy expense, fuel transportation expense, transmission expense and cash settlements from our marketing, hedging and optimization activities that are included in our mark-to-market activity in fuel and purchased energy expense, but excludes the unrealized portion of our mark-to-market activity |
iv
Table of Contents
Index to Financial Statements
| ABBREVIATION |
DEFINITION | |
| Commodity Margin | Non-GAAP financial measure that includes power and steam revenues, sales of purchased power and natural gas, capacity revenue, REC revenue, sales of surplus emission allowances, transmission revenue and expenses, fuel and purchased energy expense, RGGI compliance costs, and cash settlements from our marketing, hedging and optimization activities that are included in mark-to-market activity, but excludes the unrealized portion of our mark-to-market activity and other revenues | |
| Commodity revenue | The sum of our revenues from power and steam sales, sales of purchased power and natural gas, capacity revenue, REC revenue, sales of surplus emission allowances, transmission revenue, and cash settlements from our marketing, hedging and optimization activities that are included in our mark-to-market activity in operating revenues but excludes the unrealized portion of our mark-to-market activity | |
| Company | Calpine Corporation, a Delaware corporation, and subsidiaries | |
| Confirmation Order | The order of the U.S. Bankruptcy Court entitled “Findings of Fact, Conclusions of Law, and Order Confirming Sixth Amended Joint Plan of Reorganization Pursuant to Chapter 11 of the Bankruptcy Code,” entered December 19, 2007, confirming the Plan of Reorganization pursuant to section 1129 of the Bankruptcy Code | |
| Convertible Senior Notes | Collectively, Calpine Corporation’s 4% Contingent Convertible Notes Due 2006, Contingent Convertible Notes Due 2014, 7 3/4% Contingent Convertible Notes Due 2015 and 4 3/4% Contingent Convertible Senior Notes Due 2023, all of which were terminated and settled with reorganized Calpine Corporation common stock on the Effective Date | |
| CPUC | California Public Utilities Commission | |
| Creed | Creed Energy Center, LLC | |
| Deer Park | Deer Park Energy Center Limited Partnership | |
| DEIP | Calpine Corporation 2008 Director Incentive Plan, which provides for grants of equity awards to non-employee members of Calpine’s Board of Directors | |
| DIP | Debtor-in-possession | |
| DIP Facility | The Revolving Credit, Term Loan and Guarantee Agreement, dated as of March 29, 2007, among Calpine Corporation, as borrower, certain of Calpine Corporation’s subsidiaries, as guarantors, the lenders party thereto, and Credit Suisse, as administrative agent and collateral agent, and the other agents, arrangers and bookrunners named therein | |
| Disclosure Statement | Disclosure Statement for the U.S. Debtors’ Joint Plan of Reorganization Pursuant to Chapter 11 of the Bankruptcy Code filed by the U.S. Debtors with the U.S. Bankruptcy Court on June 20, 2007, as amended, modified or supplemented through the filing of this Report pursuant to the Plan of Reorganization | |
| EBITDA | Earnings before interest, taxes, depreciation and amortization | |
| Effective Date | January 31, 2008, the date on which the conditions precedent enumerated in the Plan of Reorganization were satisfied or waived and the Plan of Reorganization became effective | |
| EIA | Energy Information Administration of the U.S. Department of Energy |
v
Table of Contents
Index to Financial Statements
| ABBREVIATION |
DEFINITION | |
| Emergence Date Market Capitalization |
The weighted average trading price of Calpine Corporation’s common stock over the 30-day period following the date on which it emerged from Chapter 11 bankruptcy protection, as defined in and calculated pursuant to Calpine Corporation’s amended and restated certificate of incorporation and reported in its Current Report on Form 8-K filed with the SEC on March 25, 2008 | |
| EPA | U.S. Environmental Protection Agency | |
| ERCOT | Electric Reliability Council of Texas | |
| EWG(s) | Exempt wholesale generator(s) | |
| Exchange Act | U.S. Securities Exchange Act of 1934, as amended | |
| FDIC | U.S. Federal Deposit Insurance Corporation | |
| FERC | U.S. Federal Energy Regulatory Commission | |
| First Lien Credit Facility | Credit Agreement, dated as of January 31, 2008, as amended by the First Amendment to Credit Agreement and Second Amendment to Collateral Agency and Intercreditor Agreement, dated as of August 20, 2009, among Calpine Corporation, as borrower, certain subsidiaries of the Company named therein, as guarantors, the lenders party thereto, Goldman Sachs Credit Partners L.P., as administrative agent and collateral agent, and the other agents named therein | |
| First Lien Facilities | Together, our First Lien Credit Facility and $300 million Bridge Loan Agreement dated January 31, 2008 repaid on March 6, 2008 | |
| First Lien Notes | $1.2 billion aggregate principal amount of 7 1/4% senior secured notes due 2017 issued October 21, 2009, in exchange for a like principal amount of term loans under the First Lien Credit Facility | |
| First Priority Notes | 9 5/8% First Priority Senior Secured Notes Due 2014, repaid in May and June 2006 | |
| FRCC | Florida Reliability Coordinating Council | |
| Fremont | Fremont Energy Center, LLC | |
| GAAP | Generally accepted accounting principles | |
| GE | General Electric International, Inc. | |
| GEC | Collectively, Gilroy Energy Center, LLC, Creed and Goose Haven | |
| Geysers Assets | Our geothermal power plant assets, including our steam extraction and gathering assets, located in northern California consisting of 15 operating power plants and one plant not in operation | |
| GHG(s) | Greenhouse gas(es), primarily CO2, and including methane (CH4), nitrous oxide (N2O), sulfur hexafluoride (SF6), hydrofluorocarbons (HFCs) and perfluorocarbons (PFCs) | |
| Gilroy | Calpine Gilroy Cogen, L.P. | |
| Goose Haven | Goose Haven Energy Center, LLC | |
| Greenfield LP | Greenfield Energy Centre LP | |
| Heat Rate(s) | A measure of the amount of fuel required to produce a unit of power | |
| Hg | Mercury | |
| Hillabee | Hillabee Energy Center, LLC | |
| IRC | Internal Revenue Code |
vi
Table of Contents
Index to Financial Statements
| ABBREVIATION |
DEFINITION | |
| ISO(s) | Independent System Operator(s) | |
| ISO NE | ISO New England | |
| Knock-in Facility | Letter of Credit Facility Agreement, dated as of June 25, 2008, among Calpine Corporation as borrower and Morgan Stanley Capital Services Inc., as issuing bank which matured on June 30, 2009 | |
| KWh | Kilowatt hour(s), a measure of power produced | |
| LIBOR | London Inter-Bank Offered Rate | |
| LSTC | Liabilities subject to compromise | |
| LTSA(s) | Long-Term Service Agreement(s) | |
| Market Capitalization | As of any date, Calpine Corporation’s then market capitalization calculated using the rolling 30-day weighted average trading price of Calpine Corporation’s common stock, as defined in and calculated in accordance with the Calpine Corporation amended and restated certificate of incorporation | |
| Market Heat Rate(s) | The regional power price divided by the corresponding regional natural gas price | |
| MEIP | Calpine Corporation 2008 Equity Incentive Plan, which provides for grants of equity awards to Calpine employees and non-employee members of Calpine’s Board of Directors | |
| Metcalf | Metcalf Energy Center, LLC | |
| MISO | Midwest ISO | |
| MMBtu | Million Btu | |
| MRO | Midwest Reliability Organization | |
| MW | Megawatt(s), a measure of plant capacity | |
| MWh | Megawatt hour(s), a measure of power produced | |
| NERC | North American Electric Reliability Council | |
| NOL(s) | Net operating loss(es) | |
| NOx | Nitrogen oxide | |
| NPCC | Northeast Power Coordinating Council | |
| NYISO | New York ISO | |
| NYMEX | New York Mercantile Exchange | |
| NYSE | New York Stock Exchange | |
| OCI | Other Comprehensive Income | |
| OMEC | Otay Mesa Energy Center, LLC | |
| Original DIP Facility | The Revolving Credit, Term Loan and Guarantee Agreement, dated as of December 22, 2005, as amended on January 26, 2006, and as amended and restated by the Amended and Restated Revolving Credit, Term Loan and Guarantee Agreement, dated as of February 23, 2006, among Calpine Corporation, as borrower, the guarantors party thereto, the lenders from time to time party thereto, Deutsche Bank Trust Company Americas, as administrative agent for the First Priority Lenders, General Electric Capital Corporation, as Sub-Agent for the Revolving Lenders, Credit Suisse, as administrative agent for the Second Priority Term Lenders and the other agents named therein, refinanced in March 2007 with the DIP Facility |
vii
Table of Contents
Index to Financial Statements
| ABBREVIATION |
DEFINITION | |
| OTC | Over-the-Counter | |
| Panda | Panda Energy International, Inc., and related party PLC II, LLC | |
| PCF | Power Contract Financing, L.L.C. | |
| PCF III | Power Contract Financing III, LLC | |
| Petition Date | December 20, 2005 | |
| PG&E | Pacific Gas & Electric Company | |
| PJM | Pennsylvania-New Jersey-Maryland Interconnection | |
| Plan of Reorganization | Sixth Amended Joint Plan of Reorganization Pursuant to Chapter 11 of the Bankruptcy Code filed by the U.S. Debtors with the U.S. Bankruptcy Court on December 19, 2007, as amended, modified or supplemented through the filing of this Report | |
| Pomifer | Pomifer Power Funding, LLC, a subsidiary of Arclight Energy Partners Fund I, L.P. | |
| PPA(s) | Any term power purchase agreement or other contract for a physically settled sale (as distinguished from a financially settled future, option or other derivative or hedge transaction) of any power product, including power, capacity and/or ancillary services, in the form of a bilateral agreement or a written or oral confirmation of a transaction between two parties to a master agreement, including sales related to a tolling transaction in which the purchaser provides the fuel required by us to generate such power and we receive a variable payment to convert the fuel into power and steam | |
| PSM | Power Systems Manufacturing, LLC | |
| PUCT | Public Utility Commission of Texas | |
| PUHCA 1935 | U.S. Public Utility Holding Company Act of 1935 | |
| PUHCA 2005 | U.S. Public Utility Holding Company Act of 2005 | |
| PURPA | U.S. Public Utility Regulatory Policies Act of 1978 | |
| QF(s) | Qualifying facility(ies), which are cogeneration facilities and certain small power production facilities eligible to be “qualifying facilities” under PURPA, provided that they meet certain power and thermal energy production requirements and efficiency standards. QF status provides an exemption from PUHCA 2005 and grants certain other benefits to the QF | |
| REC(s) | Renewable energy credit(s) | |
| Reserve margin(s) | The measure of how much the total generating capacity installed in a region exceeds the peak demand for power in that region | |
| RFC | ReliabilityFirst Corporation | |
| RGGI | Regional Greenhouse Gas Initiative | |
| RMR Contract(s) | Reliability Must Run contract(s) | |
| RockGen | RockGen Energy LLC | |
| RockGen Owner Lessors | Collectively, RockGen OL-1, LLC; RockGen OL-2, LLC; RockGen OL-3, LLC and RockGen OL-4, LLC | |
| Rosetta | Rosetta Resources Inc. | |
| RPS | Renewable Portfolio Standards | |
| SDG&E | San Diego Gas & Electric Company |
viii
Table of Contents
Index to Financial Statements
| ABBREVIATION |
DEFINITION | |
| SEC | U.S. Securities and Exchange Commission | |
| Second Circuit | U.S. Court of Appeals for the Second Circuit | |
| Second Priority Debt | Collectively, Calpine Corporation’s Second Priority Senior Secured Floating Rate Notes Due 2007, 8 1/2% Second Priority Senior Secured Notes Due 2010, 8 3/4% Second Priority Senior Secured Notes Due 2013 and 9 7/8% Second Priority Senior Secured Notes Due 2011 and Second Priority Senior Secured Term Loans Due 2007; all of which were repaid on the Effective Date | |
| Securities Act | U.S. Securities Act of 1933, as amended | |
| SERC | Southeastern Electric Reliability Council | |
| SO2 | Sulfur dioxide | |
| Spark spread(s) | The difference between the sales price of power per MWh and the cost of fuel to produce it | |
| SPP | Southwest Power Pool | |
| Steam Adjusted Heat Rate | The adjusted Heat Rate for our natural gas-fired power plants, excluding peakers, calculated by dividing (a) the fuel consumed in Btu reduced by the net equivalent Btu in steam exported to a third party by (b) the KWh generated. Steam Adjusted Heat Rate is a measure of fuel efficiency, so the lower our Steam Adjusted Heat Rate, the lower our cost of generation | |
| Steamboat | Calpine Steamboat Holdings, LLC, an indirect, wholly owned subsidiary of Calpine Corporation | |
| Steamboat Amended Credit Facility |
The Amended and Restated Credit Agreement dated November 24, 2009 between Steamboat, as borrower, the lenders named therein, Calyon New York Branch as lead arranger, co-book runner, administrative agent, collateral agent and Security Fund LC issuer and the other agents, bookrunners and agents named therein amending and restating the Credit Agreement, dated as of February 25, 2005, among the parties as defined therein | |
| TRE | Texas Regional Entity | |
| ULC I | Calpine Canada Energy Finance ULC | |
| ULC II | Calpine Canada Energy Finance II ULC | |
| Unsecured Notes | Collectively, Calpine Corporation’s 7 7/8% Senior Notes due 2008, 7 3/4% Senior Notes due 2009, 8 5/8% Senior Notes due 2010 and 8 1/2% Senior Notes due 2011, which constitute a portion of Calpine Corporation’s Unsecured Senior Notes all of which were terminated and settled with Calpine Corporation common stock on the Effective Date | |
| Unsecured Senior Notes | Collectively, Calpine Corporation’s 7 5/8% Senior Notes due 2006, 10 1/2% Senior Notes due 2006, 8 3/4% Senior Notes due 2007, 7 7/8% Senior Notes due 2008, 7 3/4% Senior Notes due 2009, 8 5/8% Senior Notes due 2010 and 8 1/2% Senior Notes due 2011, all of which were terminated and settled with Calpine Corporation common stock on the Effective Date | |
| U.S. Bankruptcy Court | U.S. Bankruptcy Court for the Southern District of New York |
ix
Table of Contents
Index to Financial Statements
| ABBREVIATION |
DEFINITION | |
| U.S. Debtor(s) | Calpine Corporation and each of its subsidiaries and affiliates that have filed voluntary petitions for reorganization under Chapter 11 of the Bankruptcy Code in the U.S. Bankruptcy Court, which matters are being jointly administered in the U.S. Bankruptcy Court under the caption In re Calpine Corporation, et al., Case No. 05-60200 (BRL) | |
| VAR | Value-at-risk | |
| VIE(s) | Variable interest entity(ies) | |
| WECC | Western Electricity Coordinating Council | |
| Whitby | Whitby Cogeneration Limited Partnership | |
| WP&L | Wisconsin Power & Light Company |
x
Table of Contents
Index to Financial Statements
Forward-Looking Statements
In addition to historical information, this Report contains “forward-looking statements” within the meaning of Section 27A of the Securities Act and Section 21E of the Exchange Act. We use words such as “believe,” “intend,” “expect,” “anticipate,” “plan,” “may,” “will,” “should,” “estimate,” “potential,” “project” and similar expressions to identify forward-looking statements. Such statements include, among others, those concerning our expected financial performance and strategic and operational plans, as well as all assumptions, expectations, predictions, intentions or beliefs about future events. You are cautioned that any such forward-looking statements are not guarantees of future performance and that a number of risks and uncertainties could cause actual results to differ materially from those anticipated in the forward-looking statements. Such risks and uncertainties include, but are not limited to:
| • | The uncertain length and severity of the current general financial and economic downturn, the timing and strength of an economic recovery, if any, and their impacts on our business including demand for our power and steam products, the ability of customers, suppliers, service providers and other contractual counterparties to perform under their contracts with us and the cost and availability of capital and credit; |
| • | Financial results that may be volatile and may not reflect historical trends due to, among other things, fluctuations in prices for commodities such as natural gas and power, fluctuations in liquidity and volatility in the energy commodities markets and our ability to hedge risks; |
| • | Our ability to manage our customer and counterparty exposure and credit risk, including our commodity positions; |
| • | Our ability to manage our significant liquidity needs and to comply with covenants under our First Lien Credit Facility, our First Lien Notes and other existing financing obligations; |
| • | Competition, including risks associated with marketing and selling power in the evolving energy markets; |
| • | Regulation in the markets in which we participate and our ability to effectively respond to changes in laws and regulations or the interpretation thereof including changing market rules and evolving federal, state and regional laws and regulations including those related to GHG emissions and derivative transactions; |
| • | Natural disasters, such as hurricanes, earthquakes and floods, or acts of terrorism that may impact our power plants or the markets our power plants serve; |
| • | Seasonal fluctuations of our results and exposure to variations in weather patterns; |
| • | Disruptions in or limitations on the transportation of natural gas and transmission of power; |
| • | Our ability to attract, retain and motivate key employees; |
| • | Our ability to implement our business plan and strategy; |
| • | Risks related to our geothermal resources, including the adequacy of our steam reserves, unusual or unexpected steam field well and pipeline maintenance requirements, variables associated with the injection of wastewater to the steam reservoir and potential regulations or other requirements related to seismicity concerns that may delay or increase the cost of developing or operating geothermal resources; |
| • | Risks associated with the operation, construction and development of power plants including unscheduled outages or delays and plant efficiencies; |
1
Table of Contents
Index to Financial Statements
| • | Present and possible future claims, litigation and enforcement actions; |
| • | The expiration or termination of our PPAs and the related results on revenues; and |
| • | Other risks identified in this Report. |
Given the risks and uncertainties surrounding forward-looking statements, you should not place undue reliance on these statements. Many of these factors are beyond our ability to control or predict. Our forward-looking statements speak only as of the date of this Report. Other than as required by law, we undertake no obligation to update or revise forward-looking statements, whether as a result of new information, future events, or otherwise.
Where You Can Find Other Information
Our website is www.calpine.com. Information contained on our website is not part of this Report. Information that we furnish or file with the SEC, including our Annual Reports on Form 10-K, Quarterly Reports on Form 10-Q, Current Reports on Form 8-K and any amendments to or exhibits included in these reports are available for download, free of charge, on our website soon after such reports are filed with or furnished to the SEC. Our SEC filings, including exhibits filed therewith, are also available at the SEC’s website at www.sec.gov. You may obtain and copy any document we furnish or file with the SEC at the SEC’s public reference room at 100 F Street, NE, Room 1580, Washington, D.C. 20549-1004. You may obtain information on the operation of the SEC’s public reference facilities by calling the SEC at 1-800-SEC-0330. You may request copies of these documents, upon payment of a duplicating fee, by writing to the SEC at its principal office at 100 F Street, NE, Room 1580, Washington, D.C. 20549-1004.
2
Table of Contents
Index to Financial Statements
BUSINESS AND STRATEGY
Business
We aspire to be recognized as the premier independent power producer in the U.S. We seek to achieve this objective by delivering operational excellence, effectively executing our hedging strategy, reinvigorating our customer origination program, completing, on schedule and budget, our growth capital projects, and strengthening our balance sheet. We are the largest independent wholesale power company in the U.S. measured by power produced. We own and operate natural gas-fired and geothermal power plants in North America and have a significant presence in major competitive power markets in the U.S., including California and Texas, and to a lesser extent, in the competitive PJM, ISO NE and NYISO markets. Since our inception in 1984, we have been a leader in environmental stewardship and have invested exclusively in clean power generation to become a recognized leader in developing, constructing, owning and operating an environmentally responsible portfolio of power plants. Our portfolio is comprised of two types of power generation technologies: natural gas-fired combustion turbines, which are primarily combined-cycle plants, and renewable geothermal conventional steam turbines. We are among the world’s largest owners and operators of industrial gas turbines as well as cogeneration power plants. Our Geysers Assets located in northern California represent the largest geothermal power generation portfolio in the U.S. and produced approximately 21% of all renewable energy produced in the state of California during 2008. We sell wholesale power, steam, capacity, renewable energy credits and ancillary services to our customers, including utilities, independent electric system operators, industrial and agricultural companies, retail power providers, municipalities, power marketers and others. We purchase natural gas as fuel for our power plants, engage in related natural gas transportation and storage transactions and we purchase electric transmission rights to deliver power to our customers. We also enter into natural gas and power-related commodity and derivative transactions to financially hedge certain business risks and optimize our portfolio of power plants.
Our portfolio, including partnership interests, consists of 77 operating power plants, located throughout 16 states and Canada, with an aggregate generation capacity of approximately 24,802 MW. In addition, we are actively pursuing the development of our Russell City Energy Center, in which we have a net interest of approximately 400 MW, and an upgrade of 120 MW to our Los Esteros Critical Energy Facility, both located in the San Francisco Bay Area. We also have begun geothermal exploration to increase our generation capability at our Geysers Assets.
The environmental profile of our power plants reflects our commitment to environmental leadership and stewardship. We have invested the necessary capital to develop a power generation portfolio that has the lowest GHG footprint per MWh of any major independent power producer in the U.S. The combination of our Geysers Assets and our high efficiency portfolio of natural gas-fired power plants results in substantially lower emissions of these gases compared to our competitors’ power plants using other fossil fuels, such as coal. In addition, we strive to preserve our nation’s valuable water and land resources. To condense steam, we use cooling towers with a closed water cooling system, or air cooled condensers and do not employ “once-through” water cooling, which uses large quantities of water from adjacent waterways negatively impacting aquatic life. Since our plants are modern and efficient and utilize clean burning natural gas, we do not require large areas of land for our power plants nor do we require large specialized landfills for the disposal of coal ash or nuclear plant waste. We believe that we will be less adversely impacted by cap-and-trade limits, carbon taxes or required environmental upgrades as a result of future potential regulation or legislation addressing GHG, other air emissions, as well as water use or emissions, than compared to our competitors who use other fossil fuels or steam condensation technologies.
We remain focused on increasing our earnings and generating cash flow sufficient to maintain adequate levels of liquidity in order to service our debt, meet our collateral needs and fund our operations and growth. We
3
Table of Contents
Index to Financial Statements
will continue to pursue opportunities to improve our fleet performance and reduce operating costs. In order to manage our various physical assets and contractual obligations, we will continue to execute commodity hedging agreements within the guidelines of our commodity risk policy. Our fleet of natural gas-fired turbines is the youngest in the U.S. among large independent power producers and utilities, with a weighted average age, based upon MW capacities in operation, of about eight years. As a result, in the near term we do not expect that it will be necessary to invest significant expenditures for environmental retrofits or repowering projects to comply with current or reasonably anticipated GHG, other air emissions or water regulations. Our power plants taken as a whole or by region, have an effective Heat Rate lower than that of our major competitors, which we believe gives us a competitive edge in markets such as Texas, California and some northeastern states where natural gas-fired generation generally sets the market price for power.
We sell a substantial portion of our power and other products under PPAs with a duration greater than one year. The contracted sale of power, steam and capacity from our cogeneration power plants, combustion turbine power plants and geothermal power plants, as well as the sale of renewable energy credits, or RECs, from geothermal power plants, provide a stable source of revenue. Our portfolio also affords us the flexibility to sell power and other products forward for shorter terms or on a merchant basis into the spot markets, where we are able to realize attractive pricing particularly during peak demand periods. Additionally, we sell capacity or similar products to retail power providers, utilities, municipalities and others required to acquire capacity and similar products by regulatory or market rules and we sell ancillary services to independent system operators and utilities to support power transmission system reliability. We believe we have substantially hedged our Commodity Margin for 2010. By contrast, we remain exposed to significant commodity price movements for 2011 and beyond.
Our principal offices are located in Houston, Texas with a regional office in Dublin, California, an engineering office in La Porte, Texas and representative offices in Washington D.C., Sacramento, California and Austin, Texas. We operate our business through a variety of divisions, subsidiaries and affiliates.
Strategy
Our goal is to be recognized as the premier independent power company in the U.S. as measured by our customers, regulators, shareholders and communities in which our power plants reside. We seek to achieve sustainable growth through financially disciplined power plant development, construction, operations and ownership. Our strategy to achieve this is reflected in the six major initiatives described below:
| 1. | Premier Operating Company — Our objective is to be the “best-in-class” in regards to certain operational performance metrics, such as safety, availability, reliability, efficiency and outage management. Throughout 2009, our plant operating personnel exceeded the first quartile performance for employee lost time incident rate for fossil fuel electric power generation companies with 1,000 or more employees. In addition, for the past nine consecutive years, our Geysers Assets have continued to generate approximately 6 million MWh per year and achieved an exceptional equivalent availability factor of over 97% in 2009. Our natural gas-fired fleet achieved exceptional performance during 2009, with an equivalent forced outage factor of 2.7%, an improvement of 35% over full year 2008. Lastly, we completed 14 major inspections and 13 hot gas path inspections on schedule and on budget during 2009 and completed one of several planned natural gas-fired turbine upgrades and two steam turbine upgrades, which not only added incremental capacity but improved the efficiency of the entire turbines. |
| 2. | Leader in Environmental Responsibility — Our focus is to utilize our modern, efficient fleet to deliver lower carbon energy solutions. We continue to actively participate in legislative and regulatory processes addressing environmental concerns and support legislative and regulatory action to address GHG and other emissions from fossil fuel generation. We intend to leverage our baseload geothermal expertise to grow our renewable energy portfolio. Our strong and continuing commitment to environmental responsibility and leadership is exemplified by our development of the Russell City Energy Center. On |
4
Table of Contents
Index to Financial Statements
| February 4, 2010, we received the Prevention of Significant Deterioration, or PSD, air permit, the final permit necessary, to begin construction of our Russell City Energy Center. Russell City Energy Center is intended to become the first power plant in the U.S. with a federal limit on GHG emissions, and will be designed to operate in a way that produces 25% fewer GHG emissions than the CPUC standard. The power plant will use 100% reclaimed water from the City of Hayward’s Water Pollution Control Facility for cooling and boiler makeup, which will prevent nearly four million gallons of wastewater per day from being discharged into the San Francisco Bay. We initiated and agreed to accept the GHG permit limit and designed the plant to benefit local water resources. |
| 3. | Leverage our Scale with our Existing Portfolio of Power Plants — Our goal is to continue to grow our presence in our core markets, particularly, our two largest markets, California and Texas, with an emphasis on expansions or upgrades of existing power plants. We will consider selective acquisitions or additions of new capacity supported by long-term hedging programs, including PPAs and natural gas tolling agreements, particularly where limited or non-recourse project financing is available. We intend to take an opportunistic approach to continue to design, develop, construct and operate the next generation of highly efficient, operationally flexible and environmentally responsible power plants. During 2009, we had the following notable achievements related to this initiative: |
| • | OMEC, located in San Diego, California, achieved commercial operations on October 3, 2009, adding 608 MW of capacity to our fleet. OMEC is a state-of-the-art, environmentally friendly power plant that operates one of the world’s largest air-cooled condenser thereby minimizing our water usage at the site. OMEC operates under a ten-year tolling agreement with SDG&E. |
| • | Under a new ten-year power contract with PG&E, we will modernize and upgrade our Los Esteros Critical Energy Facility to add 120 MW by converting it from simple-cycle (peaking) to combined-cycle technology, increasing the efficiency and environmental performance of the power plant. |
| • | We received the Russell City Energy Center PSD air permit. We hope to complete financing and break ground for this new state-of-the-art power plant during 2010 with commercial operations scheduled to begin in 2013. |
| • | Turbine Upgrades — During the fourth quarter of 2009, we completed a natural gas-fired turbine upgrade at our Deer Park Energy Center, and have an additional ten natural gas-fired turbine upgrades scheduled. We have also upgraded the steam turbines at our McCabe and Ridgeline geothermal power plants that improved the overall turbine efficiency. We have two additional steam turbine upgrades scheduled for 2011 and 2012, and are considering others. |
| 4. | Three Scale Regions — We intend to grow our presence in the mid-Atlantic and northeast regions of the U.S. through opportunistic and financially disciplined purchase of existing power plant assets as well as new build projects. We believe this market will result in continued diversification of our asset portfolio, significant near-term growth opportunity and accretive financial strengthening and value. |
| 5. | Customer-Oriented Origination Business — Our focus is to maximize and stabilize our Commodity Margin through the utilization of physical forward sales and purchases, and financial tools such as collars, swaps and options. During 2009, we reorganized our customer origination function to allow our dedicated group of professionals to more effectively help manage this function. Their charter is to understand our customer’s wants and needs and to rally our organization to develop unique, cost-effective solutions that benefit us and our customers. This effort is beginning to deliver real, tangible results. For example, we entered into new PPAs and amended certain PPAs with PG&E, and also entered into a new PPA with Southern California Edison related to certain of our power plants in California. The amended and new PPAs are all on mutually beneficial terms, many are subject to regulatory approvals and, among other things, provide for the following: |
| • | We and PG&E have agreed to an extension of the term and an increase in the volume under the existing contracts for delivery of power from our Geysers Assets. Our Geysers Assets currently |
5
Table of Contents
Index to Financial Statements
| provide PG&E 375 MW of power under two contracts. We have agreed to increase the volume to 425 MW through 2017, and from 2018 through the end of 2021, our Geysers Assets will supply PG&E 250 MW of renewable energy. |
| • | Our wholly owned subsidiaries, Gilroy Energy Center, LLC, Creed and Goose Haven, have entered into a replacement contract with PG&E, whereby PG&E will have greater dispatch flexibility for all 11 of our peaking units in California through 2017 and for seven of our peaking units through 2021. |
| • | We and PG&E negotiated a new agreement to replace the existing CDWR contract and facilitate the upgrade of our Los Esteros Critical Energy Facility from a 188 MW simple-cycle generation power plant to a 308 MW combined-cycle generation power plant. In addition to the increase in capacity, the upgrade will increase the efficiency and environmental performance of the power plant by lowering the Heat Rate. While the upgrade is under construction, we will provide capacity to PG&E from our Gilroy Cogeneration Plant. Upon completion of the upgrade, PG&E will purchase all of the capacity from our Los Esteros Critical Energy Facility for a term of ten years. |
| • | We have entered into a new tolling arrangement with PG&E for all of the capacity from our Delta Energy Center from 2011 through 2013. |
| • | We executed a resource adequacy agreement for all of the capacity from our Pastoria Energy Center with Southern California Edison for 2012 and 2013. |
| • | We executed a contract for 500 MW of capacity from our Morgan Energy Center with the Tennessee Valley Authority through 2011. |
| • | We executed a contract for 485 MW of capacity from our Carville Energy Center with Entergy Corporation through May 2012. |
| • | We executed a contract for 200 MW of capacity from our Oneta Energy Center with American Electric Power through 2010. |
| • | In addition to the suite of products we plan to supply through the agreements described above, our commercial operations team is also identifying creative opportunities to match our capabilities with the needs of our customers. During 2009, we entered into a PPA with the Los Angeles Department of Water and Power to provide integration services of up to 270 MW, leveraging our quick-responding natural gas-fired Hermiston Power Project located in Hermiston, Oregon, as well as its contracted transmission resources in the northwest as back up for wind generated power. |
The last transaction is an indication of the need our customers and more generally the market will have to utilize flexible natural gas-fired generation to assure reliability of supply while integrating intermittent and variable renewable resources, such as wind and solar power, that they are required to procure as part of a renewable energy portfolio.
| 6. | Continued Strengthening of Our Balance Sheet — We have opportunistically completed several financing transactions for a total of approximately $3.0 billion to improve our flexibility and management of our balance sheet. Significant transactions in 2009 include, but are not limited to, the following: |
| • | On November 24, 2009, we amended and extended our Steamboat project debt which extended the maturity date from December 2011 to November 24, 2017. |
| • | On December 11, 2009, we amended the letter of credit facility related to our subsidiary, Calpine Development Holdings, Inc., to extend the maturity from January 31, 2010 to December 11, 2012, with an option to increase the letters of credit available from $150 million to $200 million by satisfying certain conditions. |
6
Table of Contents
Index to Financial Statements
| • | On August 20, 2009, we amended our First Lien Credit Facility and related collateral agency and intercreditor agreement in several respects to give us greater flexibility, including allowing us to exchange First Lien Credit Facility term loans for First Lien Notes. |
| • | On October 21, 2009, we issued approximately $1.2 billion aggregate principal amount of First Lien Notes in a private placement as a permitted debt exchange pursuant to our First Lien Credit Facility, which retired an aggregate principal amount of term loans under our First Lien Credit Facility equal to the aggregate principal amount of First Lien Notes issued. As a result of the issuance of the First Lien Notes, we were able to extend the maturities of approximately $1.2 billion in debt to 2017, at the same time converting it from a variable to a fixed interest rate. |
| • | On May 19, 2009, our wholly owned subsidiaries, CCFC and CCFC Finance, issued approximately $1.0 billion aggregate principal amount of CCFC New Notes in a private placement. The net proceeds were used to repay the CCFC Term Loans, CCFC Old Notes and CCFCP Preferred Shares. As a result of the CCFC Refinancing transactions, we were able to extend the maturities of approximately $1.0 billion of debt by several years, at the same time converting it from a variable to a fixed interest rate and lowering our effective interest rates. |
| • | On January 21, 2009, we closed on our Deer Park $156 million senior secured credit facilities, which included a $150 million term facility and a $6 million letter of credit facility. Proceeds received were used to settle an existing commodity contract of approximately $79 million, pay financing and legal fees, fund additional restricted cash and for general corporate purposes. |
THE MARKET FOR POWER
Overview
The power industry represents one of the largest industries in the U.S. and impacts nearly every aspect of our economy, with an estimated end-user market of $357.1 billion in power sales in 2009 based on information published by the EIA. Historically, vertically integrated power utilities with monopolistic control over franchised territories dominated the power generation industry in the U.S. Over the last 25 years, industry trends and regulatory initiatives, culminating with the deregulation trend of the late 1990’s and early 2000’s, provided opportunities for independent wholesale power producers to compete to provide the power needed by customers in many states. Although different regions of the country have very different models and rules of competition, all of the markets in which we operate have some form of wholesale market competition. California (included in our West segment) and Texas, which are two of our largest markets, have emerged as among the most competitive wholesale markets in the U.S. We also operate, to a lesser extent, in the competitive PJM, ISO NE and NYISO markets.
We produce several products for sale to our customers.
| • | First, we produce power for sale to utilities, municipalities, retail power providers, independent electric system operators, large end-use industrial or agricultural processing customers or power marketers. |
| • | Second, we produce steam for sale to customers for use in industrial or other heating, ventilation and air conditioning operations. |
| • | Third, we sell regulatory capacity. In various regional markets, retail power providers are required to demonstrate adequate resources to meet their power sales commitments. To meet this obligation, they procure a market product known as capacity, which allows them to attribute the approved capacity of existing power plants to satisfy the obligation. Electricity market administrators have acknowledged |
7
Table of Contents
Index to Financial Statements
| that the markets for generating capacity do not provide sufficient revenues to enable existing merchant generators to recover all of their costs or to encourage new generating capacity to be constructed. Capacity auctions have been implemented in the northeast, mid-Atlantic and some mid-west regional markets to address this issue. California has a bilateral capacity program. Texas does not have a capacity market and there is no concrete proposal under consideration by the regulators. |
| • | Fourth, we provide ancillary service products to wholesale power markets. These products include the right for the purchaser to call on our generation units to provide flexibility to the market. As an example, we are sometimes paid to reserve a portion of some capacity at some of our power plants that could be deployed quickly should there be an unexpected increase in load. |
| • | Fifth, we sell RECs from our Geysers Assets in northern California. California has an RPS that requires load serving entities to have RECs for a certain percentage of their demand for the purpose of guaranteeing a certain level of renewable generation in the state. Because geothermal is a renewable source of energy, we receive a REC for each MWh we produce and are able to sell our RECs to load serving entities. |
Although all of the products mentioned above contribute to our financial performance, the most important is our sale of wholesale power whether by contract for some term or on a merchant basis into the spot market.
Our Power Market Economics
The market spark spread, sales of RECs, revenues from our steam sales and the results from our marketing, hedging and optimization activities are the primary components of our Commodity Margin and contribute significantly to our financial results. Our Commodity Margin from power and steam sales is largely determined by the pricing associated with our customer contracts. For power that is not sold under customer contracts, the short-term and spot market supply and demand fundamentals determine the sale price for our power. All of our steam production is sold under long-term contracts with industrial customers or steam hosts.
For sales of power from our natural gas-fired fleet into the short-term or spot markets, we attempt to maximize our operations when the market spark spread is positive. Assuming economic behavior by market participants, generating units generally are dispatched in order of their variable costs, with units with lower costs being dispatched first and units with higher costs dispatched as demand, or “load,” grows beyond the capacity of the lower cost units. For this reason, in a competitive market, the price of power typically is related to the variable operating costs of the marginal generator, which is the last unit to be dispatched in order to meet demand. Our fleet is modern and more efficient than the average generation fleet; accordingly, we run more and earn incremental margin in markets in which less efficient natural gas units frequently set the power price. In such cases, our margin is positively correlated with how much more efficient our fleet is than our competitors’ fleets and with higher natural gas prices. Much of our generating capacity is in our West and Texas segments, which are regional markets where natural gas-fired units set prices during most hours, although incremental renewable generation has moderated this dynamic somewhat in off-peak hours over the last year. Due to natural gas prices generally (although not always) being higher than most other input fuels for power production per MMBtu, these regions generally have higher power prices than regions where coal-fired units set power prices. Outside of the California (included in our West segment) and Texas markets (and some northeast markets), other generating technologies, typically coal-fired power plants, tend to set power prices more often, reducing average prices and our Commodity Margin.
Reserve Margins — Reserve margin, a measure of how much excess generation capacity is present in a market, is a key indicator of the competitive conditions in the markets in which we operate. For example, a reserve margin of 15% indicates that supply is 115% of expected peak power demand. Holding other factors constant, lower reserve margins typically lead to higher power prices because the less efficient capacity in the
8
Table of Contents
Index to Financial Statements
region would be needed to satisfy power demand. Markets with tight demand and supply conditions often display price spikes and improved bilateral contract opportunities. Typically, the market price impact of reserve margins, as well as other supply/demand factors, is reflected in the “Market Heat Rate” calculated as the local market power price divided by the local natural gas price.
Natural Gas Prices and Supply — Our fuel requirements are predominantly met with natural gas. We procure natural gas from multiple suppliers and transportation sources. Although availability is generally not an issue, localized shortages, transportation availability and supplier financial stability issues can and do occur.
In markets where natural gas is often the price-setting fuel, such as in Texas and California, increases in natural gas prices may increase our unhedged Commodity Margin in any given year because our combined-cycle power plants in those markets are more fuel-efficient than conventional gas-fired technologies and peaker power plants. Conversely, decreases in natural gas prices tend to decrease our unhedged Commodity Margin. In other cases, changes in natural gas prices can have a neutral impact on us in the short term, such as where we have entered into tolling agreements under which the customer provides the natural gas and in return we convert it to power for a fee, or where we enter into indexed-based agreements with a contractual Heat Rate at or near our actual Heat Rate for a monthly payment. Changes in natural gas prices may also affect our liquidity as we could be required to post additional cash collateral or letters of credit during periods of increasing natural gas prices. Despite some of these short-term dynamics, over the long run, more moderate natural gas prices may actually enhance the competitiveness of our modern, natural gas-fired fleet by making investment in other technologies such as coal, nuclear, or renewables less economic.
Weather Patterns and Natural Events — Weather could have a significant short-term impact on supply and demand for power and natural gas. Historically, demand for and the price of power is higher in the summer and winter seasons when temperatures are more extreme, and therefore, our revenues and Commodity Margin could be negatively impacted by relatively cool summers or mild winters. Additionally, a disproportionate amount of our total revenue is usually realized during our third fiscal quarter during the summer months. We expect this trend to continue in the future as U.S. demand for power generally peaks during this time.
Operating Heat Rate and Availability — Efficient operation of our fleet creates the opportunity to capture Commodity Margin in a cost effective manner. However, unplanned outages during periods of positive Commodity Margin can result in a loss of that opportunity. We generally measure our fleet performance based on our operating Heat Rate and availability factors. The higher our availability factor, the better positioned we are to capture Commodity Margin. The less natural gas we must consume for each MWh of power generated, the lower our Heat Rate. The lower our operating Heat Rate compared to the Market Heat Rate, the more favorable the impact on our Commodity Margin.
Market Fundamentals
For much of the 1990’s, utilities invested relatively sparingly in new generating capacity. As a result, by the late 1990’s, many regional markets had low reserve margins and were in need of new capacity to meet growing power demand. Prices rose due to capacity shortages, and the emerging merchant power industry responded by constructing significant amounts of new capacity. Between 2000 and 2003, more than 175,000 MW of new generating capacity came “on line” in the U.S. In most regions, these capacity additions far outpaced the growth of demand, resulting in “overbuilt” markets, that is, markets with excess capacity. In the West, for example, approximately 24,000 MW of new generating capacity was added between 2000 and 2003, while demand only increased by approximately 8,000 MW. This surge of generation investment subsided after 2003. Recent investment in new generation capacity over the last several years has occurred, but on a smaller scale.
During 2009, the general supply and demand fundamentals were negatively impacted by the combination of recent new generation investment coming on line and a general decline in weather adjusted load year-over-year due to the economic recession. Lower weather adjusted demand and higher supply would, in a normal
9
Table of Contents
Index to Financial Statements
weather year, lead to higher reserve margins and lower Market Heat Rates. While Texas and California experienced very hot weather at certain times during 2009, which somewhat compensated for these fundamental demand shifts, this was not the case across the U.S. Although it appears that the load is now returning in several markets with the beginning of an economic recovery, it remains early in the recovery and it remains unclear from current data sources how our future supply and demand fundamentals will be impacted. Reserve margins by NERC region in 2009 for each of our segments are listed below:
| West: |
|||
| WECC |
28.2 | % | |
| Texas: |
|||
| TRE |
15.8 | % | |
| Southeast: |
|||
| SERC |
23.9 | % | |
| SPP |
14.7 | % | |
| North: |
|||
| NPCC |
25.5 | % | |
| MRO |
21.8 | % | |
| RFC |
27.0 | % |
Lower natural gas prices represent one of the biggest factors impacting the power industry in 2009. Monthly average natural gas prices (NYMEX, Henry Hub) generally fluctuated between $6/MMBtu —$8/MMBtu in 2007 and $6/MMBtu — $13/MMBtu in 2008 with spikes during the months of April through July of $10/MMBtu — $13/MMBtu. In 2009, we experienced a significant decrease in monthly average natural gas prices from a high of $5.35/MMBtu in December 2009 to a low of $3.31/MMBtu in August 2009.
Natural gas prices in some parts of the country in 2009 were low enough that modern combined-cycle natural gas-fired generation became less expensive on a marginal basis than coal-fired generation. The result was that natural gas displaced coal as a less expensive generation resource resulting in what the industry describes as coal-to-gas switching. Owners of modern combined-cycle natural gas-fired fleets, like ours, experienced significantly increased production in the southeast and some other parts of the eastern U.S.
Although some of this lower pricing dynamic can certainly be attributed to the recent economic recession (power load and natural gas demand fell off with the economic recession even while new resources were coming on line), there is a growing school of thought that the availability of non-conventional natural gas supplies, in particular shale gas, could have a longer-term and more profound impact on natural gas markets. The U.S. Department of Energy estimates that shale gas production has the potential of 3 trillion to 4 trillion cubic feet per year and may be sustainable for decades with enough natural gas reserves to supply the U.S. for the next 90 years. Accordingly, there is an emerging view of potentially lower priced natural gas for the medium to long-term future.
In addition to the immediate effects of weather and lower priced natural gas on our supply and demand fundamentals, several other key factors, especially regulatory factors, are emerging that could impact the wholesale power market fundamentals. We believe that we will be favorably impacted by these factors based upon the characteristics of our power plant portfolio. These factors include, but are not limited to:
| • | increased penetration of power generated from renewable sources; |
| • | increasing environmental pressures on generation, especially pressures on high GHG, NOx and Hg emitting resources. A significant portion of the capacities within the regions we operate include capacities from older, less efficient fossil-fuel power plants that emit much higher amounts of GHG, NOx and Hg which we anticipate will be more negatively impacted by future potential GHG or other |
10
Table of Contents
Index to Financial Statements
| air emission legislation. The estimated amounts of MW capacity for plants which are older than 50 years by NERC region are as follows: |
| West: |
||
| WECC |
3,981 MW | |
| Texas: |
||
| TRE |
1,354 MW | |
| Southeast: |
||
| SERC |
17,362 MW | |
| SPP |
3,581 MW | |
| North: |
||
| NPCC |
4,543 MW | |
| MRO |
3,015 MW | |
| RFC |
18,943 MW |
| • | an increasing focus in some markets, including California, on limiting the impact of using once-through cooling technology that can be harmful to aquatic life; |
| • | an increasing focus by utilities on demand side management – managing the absolute level and timing of power usage such as “smart grid” technologies that improve the efficiencies, dispatch usage and reliability of electric grids; and |
| • | increasingly onerous permitting requirements, including those in California, one of our major markets. |
With the exception of demand side management, many of these trends are generally positive for the economic outlook of a modern, flexible natural gas-fired fleet. For a discussion of federal, state and regional legislative and regulatory initiatives and how they might affect us, see “— Governmental and Regulatory Matters.”
Ultimately, it is very difficult to predict the continued evolution of our markets due to the uncertainty of the following:
| • | number of market participants buying and selling; |
| • | amount of power normally available in the market; |
| • | fluctuations in power supply due to planned and unplanned outages of generators; |
| • | fluctuations in power demand due to weather and other factors; |
| • | cost of fuel used by generators, which could be impacted by the efficiency of generation technology and fluctuations in fuel supply or interruptions in natural gas transportation; |
| • | relative ease or difficulty of developing and constructing new power plants; |
| • | availability and cost of power transmission; |
| • | creditworthiness and other risks associated with counterparties; |
| • | bidding behavior of market participants; |
| • | regulatory and ISO guidelines and rules; |
11
Table of Contents
Index to Financial Statements
| • | structure of the commercial products transacted; and |
| • | ability to optimize the market’s mix of alternative sources of power such as renewable and hydroelectric power. |
Hedging
We seek to actively manage the commodity price risk to our economic performance with a variety of tools, including the use of PPAs and other long-term contracts for the sale of both power and steam. We also pursue other long-term sales opportunities, as well as shorter term market transactions, including bilateral originated sales contracts, and purchase and sale of exchange-traded instruments. We actively monitor key commodity price risks such as Market Heat Rate and natural gas price exposure, as well as other risks related to the value of our generation such as regulatory capacity, REC and emission credit pricing. The relative quantity of our products sold under longer term contracts compared to the quantity subject to shorter term price fluctuations is determined by our need to manage our liquidity, the availability of forward product sales opportunities, and our view of the attractiveness of the pricing available for forward sales. It is our strategy to seek stronger bilateral relationships and longer term contracts with load serving entities that can benefit us and our customers.
We provide more detail on our hedging programs in “— Marketing, Hedging and Optimization Activities” below.
COMPETITION
Wholesale power generation is a capital-intensive, commodity-driven business with numerous industry participants. We compete against other independent power producers, power marketers or trading companies, including those owned by financial institutions, retail load aggregators, municipalities, retail power providers, cooperatives and regulated utilities to supply power and power-related products to our customers in major markets in the U.S. In addition, in some markets, we compete against some of our customers.
In less regulated markets, such as California and Texas, our natural gas-fired power plants compete directly with all other sources of power. Even though most new power plants are fueled by natural gas, the EIA estimates that in 2009 only 24% of the power generated in the U.S. was fueled by natural gas and that approximately 65% of power generated in the U.S. was still produced by coal and nuclear facilities, which generated approximately 45% and 20%, respectively. The EIA estimates that the remaining 11% of power generated in the U.S. was fueled by hydroelectric, fuel oil and other energy sources. We are subject to complex and stringent energy, environmental and other governmental laws and regulations at the federal, state and local levels in connection with the development, ownership and operation of our power plants. Federal and state legislative and regulatory actions continue to change how our business is regulated. The federal government is expected to take action on climate change legislation, as well as other air pollutant emissions, and many states and regions in the U.S. have implemented or are considering implementing regulations to reduce GHG emissions. Although we cannot predict the ultimate effect any future climate change legislation or regulations could have on our business, as a clean energy provider, we believe that we are well positioned on a net basis for potential regulation of GHG emissions. We are actively participating in these debates at the federal, regional and state levels. For a further discussion of the environmental and other governmental regulations that affect us, see “— Governmental and Regulatory Matters.”
As environmental regulations continue to evolve, the proportion of power generated by natural gas and other low emissions resources is expected to increase in most markets. As a result, many of the existing coal-fired power plants will likely have to install costly emission control devices or limit their operations. Meanwhile, the federal government and many states are considering or have already mandated that certain percentages of power delivered to end users in their jurisdictions be produced from renewable resources, such as geothermal, wind and solar energy.
12
Table of Contents
Index to Financial Statements
Competition from other sources of power, such as nuclear energy and renewables, is expected to increase in the future. The combination of emerging air emissions regulations, federal and state financial incentives and RPS requirements for renewables are expected to result in increased investment in cleaner sources of generation, which could also cause some coal-fired power plants to be retired, thereby allowing a greater proportion of power to be produced by power plants fueled by natural gas, nuclear, wind, solar, hydroelectric, geothermal or other resources that have a less adverse environmental impact. Generation quantities from nuclear power plants and renewable sources are not available in the quantities needed to meet energy demand. There are permitting hurdles, long lead times and general resistance to nuclear generation and there are concerns over the reliability and adequacy of transmission infrastructure to transmit certain renewable generation from its source to where it is needed. Consequently, longer-term, natural gas is still needed as baseload and “back-up” generation.
We believe our ability to compete effectively in our environment will be substantially driven by the extent to which we are able to accomplish the following:
| • | maintain excellence in operations; |
| • | achieve and maintain a lower cost of production, primarily by maintaining unit availability and efficiency; |
| • | benefit from future environmental regulation and legislation; |
| • | effectively manage and accurately assess our risk; and |
| • | provide reliable service to our customers. |
MARKETING, HEDGING AND OPTIMIZATION ACTIVITIES
The majority of our marketing, hedging and optimization activities are related to risk exposures that arise from our ownership and operation of power plants. Most of the power generated by our power plants is sold, scheduled and settled by our energy marketing unit, which sells to entities such as utilities, municipalities and cooperatives, as well as to retail power providers, commercial and industrial end users, financial institutions, power trading and marketing companies and other third parties. We enter into physical and financial purchase and sale transactions as part of our marketing, hedging and optimization activities. Our marketing, hedging and optimization activities endeavor to protect and enhance our Commodity Margin.
We are one of the largest consumers of natural gas in the U.S. having consumed approximately 650 Bcf (billion cubic feet) during 2009. We employ a variety of market transactions to satisfy most of our natural gas fuel requirements. We enter into long-term, short-term and spot natural gas purchase agreements, as well as storage and transport agreements, to achieve delivery flexibility and to enhance our optimization capabilities. We continually evaluate our natural gas needs, adjusting our natural gas position in an effort to minimize the delivered cost of natural gas, while adjusting for risk within the limitations prescribed in our commodity risk policy.
We are exposed to commodity price volatility in the markets in which our power plants operate. Natural gas prices and power prices are generally correlated in our two primary markets, California and Texas, because power plants using natural gas-fired technology tend to be the marginal or price-setting generation units in these regions. We actively seek to manage the commodity risks of our portfolio, using multiple strategies of buying and selling power or natural gas to manage our spark spread, or selling Heat Rate transactions. We use derivative instruments, which include physical commodity contracts and financial commodity instruments such as OTC and exchange traded swaps, futures, options, forward agreements and instruments that settle on the power price to natural gas price relationships (Heat Rate swaps and options) for the purchase and sale of power, natural gas, and emission allowances to manage commodity price risk and to maximize the risk-adjusted returns from our power
13
Table of Contents
Index to Financial Statements
and natural gas assets. We also use interest rate swaps to manage the interest rate risk of our variable rate debt. We conduct these hedging and optimization activities within a structured risk management framework based on controls, policies and procedures. We monitor these activities through active and ongoing management, oversight, defined roles and responsibilities, and daily risk measurement and reporting. Additionally, we seek to manage the associated risks through diversification, by controlling position sizes, by using portfolio position limits and by entering into offsetting positions that lock in a margin.
Along with our portfolio of hedging transactions, we enter into power and natural gas positions that often act as hedges to our asset portfolio, but do not qualify as hedges under hedge accounting guidelines, such as commodity options transactions and instruments that settle on power price to natural gas price relationships (Heat Rate swaps and options). While our selling and purchasing of power and natural gas is mostly physical in nature, we also engage in marketing, hedging and optimization activities, particularly in natural gas, that are financial in nature.
While we enter into these transactions primarily to provide us with improved price and price volatility transparency, as well as greater market access, which benefits our hedging activities, we also are exposed to commodity price movements (both profits and losses) in connection with these transactions. These positions are included in and subject to our consolidated risk management portfolio position limits and controls structure. Changes in fair value of commodity positions that do not qualify for either hedge accounting or the normal purchase normal sale exemption are recognized currently in earnings in mark-to- market activity within operating revenues in the case of power transactions, and within fuel and purchased energy expense in the case of natural gas transactions.
We have VAR limits that govern the overall risk of our portfolio of power plants, energy contracts, financial hedging transactions and other contracts. Our VAR limits, transaction approval limits and other risk related controls, are dictated by our commodity risk policy which is approved by our Board of Directors and by our Risk Management Committee comprised of members of our senior management and administered by our Chief Risk Officer and his organization. The Chief Risk Officer’s organization is segregated from the commercial operations unit and reports directly to our Audit Committee and Chief Executive Officer. Our risk management policies limit our hedging activities to protect and optimize the value of our physical assets. While this policy limits our potential upside from hedging activities, it is primarily intended to provide us with a degree of protection from significant downside energy commodity price exposure to our cash flows.
We actively monitor and hedge our portfolio exposure to future market risks. As of December 31, 2009, we have economically hedged a substantial portion of our generation and natural gas portfolio mostly through power and natural gas forward physical and financial transactions for 2010; however, we remain susceptible to significant price movements for 2011 and beyond. By entering into these transactions, we are able to economically hedge a portion of our spark spread at pre-determined generation and price levels. Our future hedged status and marketing and optimization activities are subject to change as determined by our commercial operations group, Chief Risk Officer, Risk Management Committee of senior management and Board of Directors.
Seasonality and weather can have a significant impact on our results of operations and are also considered in our hedging and optimization activities. Most of our power plants are located in regional power markets where the greatest demand for power occurs during the summer months, which is our fiscal third quarter. Depending on existing contract obligations and forecasted weather and power demands, we may maintain either a larger or smaller open position on fuel supply and committed generation during the summer months in order to protect and enhance our Commodity Margin accordingly.
SEGMENT AND SIGNIFICANT CUSTOMER INFORMATION
See Note 18 of the Notes to Consolidated Financial Statements for a discussion of financial information by reportable segment and sales in excess of 10% of our annual consolidated revenues to one of our customers.
14
Table of Contents
Index to Financial Statements
DESCRIPTION OF OUR POWER PLANTS
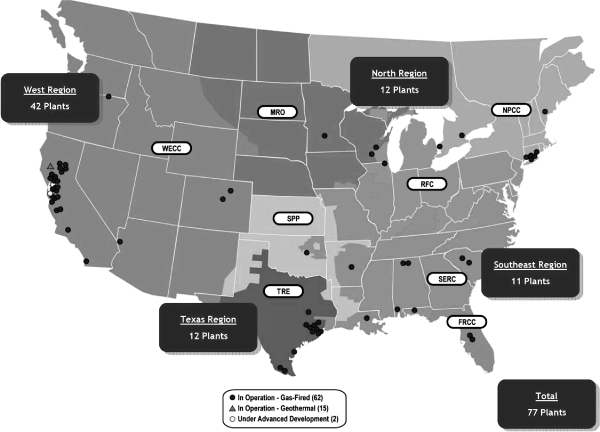
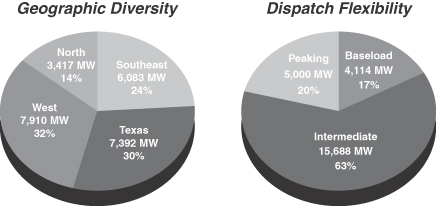
15
Table of Contents
Index to Financial Statements
Power Plants in Operation at December 31, 2009
We operate 77 power plants, with an aggregate operating generation capacity of approximately 24,802 MW.
Natural Gas-Fired Fleet
Our natural gas-fired power plants utilize two types of design: 3,216 MW of simple-cycle combustion turbines and 20,861 MW of combined-cycle combustion turbines. Simple-cycle combustion turbines burn natural gas to spin a single turbine to generate power. A combined-cycle combusts as a simple-cycle and also uses the exhaust heat from the simple-cycle combustion to help create steam which can then spin a steam turbine. Simple-cycle turbines are easier to maintain, but combined-cycle turbines operate with much higher efficiency. Our “all in” Steam Adjusted Heat Rate for 2009 for the power plants we operate was 7,263 Btu/KWh which results in a power conversion efficiency of approximately 47%. The power conversion efficiency is a measure of how efficiently a fossil fuel power plant converts thermal energy to electrical energy. Our “all in” Heat Rate includes all fuel required to dispatch our power plants including “start-up” and “shut-down” fuel, as well as all non-steady state operations. Once our power plants achieve steady state operations, our combined-cycle power plants achieve an average power conversion efficiency of approximately 50%. Additionally, we also sell steam from our cogeneration power plants, which improves our power conversion efficiency in steady state operations from these power plants to an average of approximately 53%. Due to our modern combustion turbine fleet, our power conversion efficiency is significantly better than that of older technology natural gas-fired power plants and coal-fired power plants, which typically have power conversion efficiencies that range from 31% to 36%.
Each of our power plants currently in operation is capable of producing power for sale to a utility, other third-party end user or an intermediary such as a marketing company. At some of our power plants we also produce thermal energy (primarily steam and chilled water), which can be sold to industrial and governmental users.
Our natural gas fleet is relatively young with a weighted average age, based upon MW capacities in operation, of approximately eight years. Taken as a portfolio, our natural gas power plants are among the most efficient in converting natural gas to power and emit far fewer pollutants than most typical utility fleets. The age, scale, efficiency and cleanliness of our power plants is a unique profile in the independent power sector.
The majority of the combustion turbines in our fleet are one of two technologies: GE 7FA or Siemens 501FD turbines. We maintain our fleet through a regular and rigorous maintenance program. As units reach certain targets recommended by the original equipment manufacturer, which are typically based upon service hours, we perform the maintenance that is required for that unit at that stage in its life. Our large fleet of similar technologies has enabled us to build significant technical and engineering experience with these units. We leverage this experience by performing much of our major maintenance ourselves with our Turbine Maintenance Group subsidiary.
Geothermal
Our Geysers Assets are a 725 MW fleet of 15 operating power plants in northern California. Geothermal power is considered a renewable energy because the steam harnessed to power our turbines is produced inside the Earth and does not require burning fuel. The steam is produced below the Earth’s surface from reservoirs of hot water, both naturally occurring and injected. The steam is piped directly from the underground production wells to the power plants and used to spin turbines to make power. For the past nine consecutive years, our Geysers Assets have continued to generate approximately 6 million MWh per year. Unlike other renewable resources such as wind or sunlight, which depend on intermittent sources to generate power, making them less reliable, geothermal power provides a consistent source of energy as evidenced by our Geysers Assets’ availability record of 97% in 2009.
We inject water back into the steam reservoir, which extends the useful life of the resource and helps to maintain the output of our Geysers Assets. The water we inject comes from the condensate associated with the steam extracted to generate power, wells and creeks, as well as water purchase agreements for reclaimed
16
Table of Contents
Index to Financial Statements
wastewater from the City of Santa Rosa Recharge Project and from Lake County. We currently receive an average of 15 million gallons of reclaimed wastewater a day which is injected into the steam reservoir to replenish the natural steam withdrawn for the production of power. As a result, steam flow decline rates have become very small. We expect that, as a result of the water injection program, the reservoir at our Geysers Assets will be able to supply economic quantities of steam for the foreseeable future.
We periodically obtain independent geothermal studies to help us assess the economic life of our geothermal reserves. Our most recent independent geothermal reserve study was conducted in 2006. Our evaluations of our geothermal reserves, including our review of any applicable independent studies conducted, indicate that our Geysers Assets should continue to supply sufficient steam to generate positive cash flows at least through 2050. In reaching this conclusion, our evaluation, consistent with the 2006 study, assumes that defined “proved reserves” are those quantities of geothermal energy which, by analysis of geological and engineering data, can be estimated with reasonable certainty to be commercially recoverable, from a given date forward, from known reservoirs and under current economic conditions, operating methods, and government regulations. We used as our “given date forward” our projected schedule of development, operation and investment for the period 2006 to 2050.
We lease the geothermal steam fields from which we extract steam for our Geysers Assets. We have leasehold mineral interests in 110 leases comprising approximately 29,019 acres of federal, state and private geothermal resource lands in The Geysers region of northern California. Our leases cover one contiguous area of property that comprises approximately 45 square miles in the northwest corner of Sonoma County and southeast corner of Lake County. The approximate breakout by volume of steam removed under the above leases for the year ended 2009 is:
| • | 29% related to leases with the federal government via the Minerals Management Service, |
| • | 27% related to leases with the California State Lands Commission, and |
| • | 44% related to leases with private landowners/leaseholders. |
In general, our geothermal leases grant us the exclusive right to drill for, produce and sell geothermal resources from these properties and the right to use the surface for all related purposes. Each lease requires the payment of annual rent until commercial quantities of geothermal resources are established. After such time, the leases require the payment of minimum advance royalties or other payments until production commences, at which time production royalties are payable on a monthly basis from 10 to 31 days (depending upon the lease terms) following the close of the production month. Such royalties and other payments are payable to landowners, state and federal agencies and others, and vary widely as to the particular lease. In general, royalties payable are calculated based upon a percentage of total gross revenue received by us associated with our geothermal leases. Each lease’s royalty calculation is based upon its percentage of revenue as calculated by its steam generated to the total steam generated by our Geysers Assets as a whole.
Our geothermal leases are generally for initial terms varying from 10 to 20 years or for so long as geothermal resources are produced and sold. A few of our geothermal leases were signed in excess of 30 years ago. Our federal leases are, in general, for an initial 10-year period with renewal clauses for an additional 40 years for a maximum of 50 years. The 50-year term expires in 2024 for the majority of our federal leases. However, our federal leases allow for a preferential right to renewal for a second 40-year term on such terms and conditions as the lessor deems appropriate if, at the end of the initial 40-year term, geothermal steam is being produced or utilized in commercial quantities. The majority of our other leases run through the economic life of our Geysers Assets and provide for renewals so long as geothermal resources are being produced or utilized, or are capable of being produced or utilized, in commercial quantities from the leased land or from land unitized with the leased land. Although we believe that we will be able to renew our leases through the economic life of our Geysers Assets on terms that are acceptable to us, it is possible that certain of our leases may not be renewed, or may be renewable only on less favorable terms.
17
Table of Contents
Index to Financial Statements
In addition, we hold 40 geothermal leases comprising approximately 43,840 acres of federal geothermal resource lands in the Glass Mountain area in northern California, which is separate from The Geysers region. Four test production wells were drilled prior to our acquisition of these leases and we have drilled one test well since their acquisition, which produced commercial quantities of steam during flow tests. However, the properties subject to these leases have not been developed and there can be no assurance that these leases will ultimately be developed. We are currently involved in litigation concerning our Glass Mountain leases and expect further developments related to this litigation in 2010. See Note 17 of the Notes to Consolidated Financial Statements for a description of litigation relating to our Glass Mountain area leases.
Table of Operating Power Plants and Projects Under Advanced Development
Set forth below is certain information regarding our operating power plants and projects under advanced development as of December 31, 2009.
| SEGMENT / Power Plant |
NERC Region |
U.S. State or Canadian Province |
Technology | Calpine Interest Percentage |
Calpine Net Interest Baseload (MW)(1)(3) |
Calpine Net Interest With Peaking (MW)(2)(3) |
2009 Total MWh Generated(4) | ||||||||
| WEST |
|||||||||||||||
| Geothermal |
|||||||||||||||
| McCabe #5 & #6 |
WECC | CA | Geothermal | 100 | % | 78 | 78 | 689,757 | |||||||
| Ridge Line #7 & #8 |
WECC | CA | Geothermal | 100 | % | 69 | 69 | 589,538 | |||||||
| Calistoga |
WECC | CA | Geothermal | 100 | % | 66 | 66 | 493,338 | |||||||
| Eagle Rock |
WECC | CA | Geothermal | 100 | % | 66 | 66 | 524,822 | |||||||
| Quicksilver |
WECC | CA | Geothermal | 100 | % | 53 | 53 | 407,495 | |||||||
| Cobb Creek |
WECC | CA | Geothermal | 100 | % | 52 | 52 | 425,813 | |||||||
| Lake View |
WECC | CA | Geothermal | 100 | % | 52 | 52 | 402,385 | |||||||
| Sulphur Springs |
WECC | CA | Geothermal | 100 | % | 51 | 51 | 420,978 | |||||||
| Socrates |
WECC | CA | Geothermal | 100 | % | 50 | 50 | 394,322 | |||||||
| Big Geysers |
WECC | CA | Geothermal | 100 | % | 48 | 48 | 484,393 | |||||||
| Grant |
WECC | CA | Geothermal | 100 | % | 43 | 43 | 341,975 | |||||||
| Sonoma |
WECC | CA | Geothermal | 100 | % | 42 | 42 | 299,430 | |||||||
| West Ford Flat |
WECC | CA | Geothermal | 100 | % | 24 | 24 | 222,485 | |||||||
| Aidlin |
WECC | CA | Geothermal | 100 | % | 17 | 17 | 144,098 | |||||||
| Bear Canyon |
WECC | CA | Geothermal | 100 | % | 14 | 14 | 108,608 | |||||||
| Natural Gas-Fired |
|||||||||||||||
| Delta Energy Center |
WECC | CA | Natural Gas | 100 | % | 835 | 857 | 5,032,618 | |||||||
| Pastoria Energy Center |
WECC | CA | Natural Gas | 100 | % | 750 | 729 | 4,979,649 | |||||||
| Rocky Mountain Energy Center |
WECC | CO | Natural Gas | 100 | % | 479 | 621 | 3,543,289 | |||||||
| Hermiston Power Project |
WECC | OR | Natural Gas | 100 | % | 547 | 616 | 3,466,313 | |||||||
| Metcalf Energy Center |
WECC | CA | Natural Gas | 100 | % | 564 | 605 | 2,797,458 | |||||||
| Sutter Energy Center |
WECC | CA | Natural Gas | 100 | % | 542 | 578 | 2,315,457 | |||||||
| Los Medanos Energy Center |
WECC | CA | Natural Gas | 100 | % | 506 | 560 | 3,391,651 | |||||||
| South Point Energy Center |
WECC | AZ | Natural Gas | 100 | % | 520 | 530 | 2,076,629 | |||||||
| Blue Spruce Energy Center |
WECC | CO | Natural Gas | 100 | % | — | 310 | 419,361 | |||||||
| Los Esteros Critical Energy Facility |
WECC | CA | Natural Gas | 100 | % | — | 188 | 73,098 | |||||||
| Gilroy Energy Center |
WECC | CA | Natural Gas | 100 | % | — | 141 | 59,523 | |||||||
| Gilroy Cogeneration Plant |
WECC | CA | Natural Gas | 100 | % | 117 | 128 | 262,270 | |||||||
| King City Cogeneration Plant |
WECC | CA | Natural Gas | 100 | % | 120 | 120 | 629,617 | |||||||
| Pittsburg Power Plant |
WECC | CA | Natural Gas | 100 | % | 64 | 64 | 125,190 | |||||||
| Greenleaf 1 Power Plant |
WECC | CA | Natural Gas | 100 | % | 50 | 50 | 223,474 | |||||||
| Greenleaf 2 Power Plant |
WECC | CA | Natural Gas | 100 | % | 49 | 49 | 234,211 | |||||||
| Wolfskill Energy Center |
WECC | CA | Natural Gas | 100 | % | — | 48 | 19,186 | |||||||
| Yuba City Energy Center |
WECC | CA | Natural Gas | 100 | % | — | 47 | 31,083 | |||||||
| Feather River Energy Center |
WECC | CA | Natural Gas | 100 | % | — | 47 | 27,255 | |||||||
| Creed Energy Center |
WECC | CA | Natural Gas | 100 | % | — | 47 | 12,283 | |||||||
| Lambie Energy Center |
WECC | CA | Natural Gas | 100 | % | — | 47 | 13,696 | |||||||
| Goose Haven Energy Center |
WECC | CA | Natural Gas | 100 | % | — | 47 | 11,791 | |||||||
| Riverview Energy Center |
WECC | CA | Natural Gas | 100 | % | — | 47 | 18,471 | |||||||
| King City Peaking Energy Center |
WECC | CA | Natural Gas | 100 | % | — | 44 | 16,316 | |||||||
| Watsonville (Monterey) Cogeneration Plant |
WECC | CA | Natural Gas | 100 | % | 29 | 29 | 153,505 | |||||||
| Agnews Power Plant |
WECC | CA | Natural Gas | 100 | % | 28 | 28 | 150,060 | |||||||
| Otay Mesa Energy Center(5) |
WECC | CA | Natural Gas | 100 | % | 513 | 608 | 774,104 | |||||||
| Subtotal |
6,438 | 7,910 | 36,806,995 |
18
Table of Contents
Index to Financial Statements
| SEGMENT / Power Plant |
NERC Region |
U.S. State or Canadian Province |
Technology | Calpine Interest Percentage |
Calpine Net Interest Baseload (MW)(1)(3) |
Calpine Net Interest With Peaking (MW)(2)(3) |
2009 Total MWh Generated(4) | ||||||||
| TEXAS |
|||||||||||||||
| Freestone Energy Center |
TRE | TX | Natural Gas | 100 | % | 1,038 | 994 | 3,263,701 | |||||||
| Deer Park Energy Center |
TRE | TX | Natural Gas | 100 | % | 799 | 970 | 5,686,340 | |||||||
| Baytown Energy Center |
TRE | TX | Natural Gas | 100 | % | 740 | 800 | 3,893,026 | |||||||
| Pasadena Power Plant |
TRE | TX | Natural Gas | 100 | % | 753 | 771 | 2,929,281 | |||||||
| Magic Valley Generating Station |
TRE | TX | Natural Gas | 100 | % | 662 | 692 | 3,057,649 | |||||||
| Brazos Valley Power Plant |
TRE | TX | Natural Gas | 100 | % | 508 | 594 | 2,374,891 | |||||||
| Channel Energy Center |
TRE | TX | Natural Gas | 100 | % | 463 | 608 | 2,645,794 | |||||||
| Corpus Christi Energy Center |
TRE | TX | Natural Gas | 100 | % | 426 | 500 | 2,316,051 | |||||||
| Texas City Power Plant |
TRE | TX | Natural Gas | 100 | % | 400 | 453 | 1,451,085 | |||||||
| Clear Lake Power Plant |
TRE | TX | Natural Gas | 100 | % | 344 | 400 | 508,920 | |||||||
| Hidalgo Energy Center |
TRE | TX | Natural Gas | 78.5 | % | 392 | 374 | 1,560,341 | |||||||
| Freeport Energy Center(6) |
TRE | TX | Natural Gas | 100 | % | 210 | 236 | 1,404,067 | |||||||
| Subtotal |
6,735 | 7,392 | 31,091,146 | ||||||||||||
| SOUTHEAST |
|||||||||||||||
| Broad River Energy Center |
SERC | SC | Natural Gas | 100 | % | — | 847 | 351,868 | |||||||
| Morgan Energy Center |
SERC | AL | Natural Gas | 100 | % | 720 | 807 | 4,250,780 | |||||||
| Decatur Energy Center |
SERC | AL | Natural Gas | 100 | % | 782 | 795 | 3,043,345 | |||||||
| Columbia Energy Center |
SERC | SC | Natural Gas | 100 | % | 455 | 606 | 43,660 | |||||||
| Carville Energy Center |
SERC | LA | Natural Gas | 100 | % | 449 | 501 | 2,443,567 | |||||||
| Santa Rosa Energy Center |
SERC | FL | Natural Gas | 100 | % | 235 | 225 | 168,387 | |||||||
| Hog Bayou Energy Center |
SERC | AL | Natural Gas | 100 | % | 235 | 237 | 262,423 | |||||||
| Pine Bluff Energy Center |
SERC | AR | Natural Gas | 100 | % | 184 | 215 | 1,340,696 | |||||||
| Oneta Energy Center |
SPP | OK | Natural Gas | 100 | % | 980 | 1,134 | 2,981,783 | |||||||
| Osprey Energy Center |
FRCC | FL | Natural Gas | 100 | % | 537 | 599 | 2,459,755 | |||||||
| Auburndale Peaking Energy Center |
FRCC | FL | Natural Gas | 100 | % | — | 117 | 24,167 | |||||||
| Subtotal |
4,577 | 6,083 | 17,370,431 | ||||||||||||
| NORTH |
|||||||||||||||
| Riverside Energy Center |
MRO | WI | Natural Gas | 100 | % | 518 | 603 | 974,899 | |||||||
| RockGen Energy Center |
MRO | WI | Natural Gas | 100 | % | — | 503 | 147,930 | |||||||
| Mankato Power Plant |
MRO | MN | Natural Gas | 100 | % | 280 | 375 | 337,542 | |||||||
| Westbrook Energy Center |
NPCC | ME | Natural Gas | 100 | % | 537 | 537 | 2,485,501 | |||||||
| Kennedy International Airport Power Plant |
NPCC | NY | Natural Gas | 100 | % | 110 | 121 | 503,650 | |||||||
| Bethpage Energy Center 3 |
NPCC | NY | Natural Gas | 100 | % | 60 | 80 | 288,799 | |||||||
| Bethpage Power Plant |
NPCC | NY | Natural Gas | 100 | % | 55 | 56 | 108,362 | |||||||
| Bethpage Peaker |
NPCC | NY | Natural Gas | 100 | % | — | 48 | 37,662 | |||||||
| Stony Brook Power Plant |
NPCC | NY | Natural Gas | 100 | % | 45 | 47 | 251,868 | |||||||
| Whitby Cogeneration(7) |
NPCC | ON | Natural Gas | 50 | % | 25 | 25 | 86,057 | |||||||
| Greenfield Energy Centre(8) |
NPCC | ON | Natural Gas | 50 | % | 422 | 519 | 1,326,829 | |||||||
| Zion Energy Center |
RFC | IL | Natural Gas | 100 | % | — | 503 | 112,894 | |||||||
| Subtotal |
2,052 | 3,417 | 6,661,993 | ||||||||||||
| Total operating power plants (77) |
19,802 | 24,802 | 91,930,565 | ||||||||||||
| Projects under advanced development |
|||||||||||||||
| Russell City Energy Center |
WECC | CA | Natural Gas | 65 | % | 362 | 390 | n/a | |||||||
| Los Esteros Critical Energy Facility (Upgrade) |
WECC | CA | Natural Gas | 100 | % | 120 | 120 | n/a | |||||||
| Total operating power plants and projects |
20,284 | 25,312 | |||||||||||||
| (1) | Natural gas-fired fleet capacities are derived on as-built as-designed outputs, including upgrades, based on site specific annual average temperatures and average process steam flows for cogeneration power plants, as applicable. Geothermal capacities are derived from historical generation output and steam reservoir modeling under average ambient conditions (temperatures and rainfall). |
| (2) | Natural gas-fired fleet peaking capacities are primarily derived on as-built as-designed peaking outputs based on site specific average summer temperatures and include power enhancement features such as heat recovery steam generator duct-firing, gas turbine power augmentation, and/or other power augmentation features. For certain power plants with definitive contracts, capacities at contract conditions have been included. |
19
Table of Contents
Index to Financial Statements
| (3) | These outputs do not factor in the typical MW loss and recovery profiles over time, which natural gas-fired turbine power plants display associated with their planned major maintenance schedules. |
| (4) | MWh generation is shown here as our net operating interest. |
| (5) | Otay Mesa Energy Center began commercial operation on October 3, 2009, and is an unconsolidated subsidiary (see Note 4 of the Notes to Consolidated Financial Statements). |
| (6) | Freeport Energy Center is owned by us; however, it is contracted and operated by The Dow Chemical Company. |
| (7) | We hold a less-than-majority owned (50%) equity interest in Whitby Cogeneration; however, it is operated by Atlantic Packaging Products Ltd., and is an unconsolidated subsidiary (see Note 4 of the Notes to Consolidated Financial Statements). |
| (8) | We hold a 50% joint venture interest in Greenfield Energy Centre; however, it is operated by a third party, and is an unconsolidated subsidiary (see Note 4 of the Notes to Consolidated Financial Statements). |
We provide operations and maintenance services for all but three of the power plants in which we have an interest. Such services include the operation of power plants, geothermal steam fields, wells and well pumps and natural gas pipelines. We also supervise maintenance, materials purchasing and inventory control, manage cash flow, train staff and prepare operations and maintenance manuals for each power plant that we operate. As a power plant develops an operating history, we analyze its operation and may modify or upgrade equipment, or adjust operating procedures or maintenance measures to enhance the power plant’s reliability or profitability.
Certain power plants in which we have an interest have been financed primarily with project financing that is structured to be serviced out of the cash flows derived from the sale of power (and, if applicable, thermal energy and capacity) produced by such power plants and generally provides that the obligations to pay interest and principal on the loans and are secured solely by the capital stock or partnership interests, physical assets, contracts and/or cash flows attributable to the entities that own the power plants. The lenders under these project financings generally have no recourse for repayment against us or any of our assets or the assets of any other entity other than foreclosure on pledges of stock or partnership interests and the assets attributable to the entities that own the power plants. However, defaults under some project financings may result in cross-defaults to certain of our other debt, and under certain of our debt instruments, including our First Lien Credit Facility and First Lien Notes. Acceleration of the maturity of a project financing following a default may also result in a cross-acceleration of such other debt.
Substantially all of the power plants in which we have an interest are located on sites which we own or lease on a long-term basis.
Projects Under Advanced Development and Planned Upgrades at December 31, 2009
The development and construction of power generation projects involves numerous elements, including evaluating and selecting development opportunities, designing and engineering the project, obtaining PPAs, acquiring necessary land rights, permits and fuel resources, obtaining financing, procuring equipment and managing construction. We generally expect to start development or construction on new projects only in cases where power contracts and financing are available and attractive returns are expected.
Russell City Energy Center — This is a proposed 600 MW, natural gas-fired power plant to be located in Hayward, California. In September 2006, we sold a 35% equity interest in the project to Aircraft Services for approximately $44 million and Aircraft Services’ obligation to post a $37 million letter of credit. We own the
20
Table of Contents
Index to Financial Statements
remaining 65% interest. Under the LLC agreement with Aircraft Services, Aircraft Services’ equity is to be applied toward completion of development and construction of the power plant, and Aircraft Services is also to provide related credit support for the project.
Russell City Energy Center remains under advanced development. The Russell City Energy Center is currently contracted to deliver its full output to PG&E under a PPA, which was executed in December 2006 and approved by the CPUC in January 2007. The PPA was amended in 2008 and was approved by the CPUC on April 16, 2009. On February 4, 2010, we received the PSD air permit, the final permit necessary, to begin construction of our Russell City Energy Center. Russell City Energy Center is intended to become the first power plant in the U.S. with a federal limit on GHG emissions, and will be designed to operate in a way that produces 25% fewer GHG emissions than the CPUC standard. The power plant will use 100% reclaimed water from the City of Hayward’s Water Pollution Control Facility for cooling and boiler makeup, which will prevent nearly four million gallons of wastewater per day from being discharged into the San Francisco Bay. We hope to complete financing and break ground for this new state-of-the-art power plant during 2010 with commercial operations scheduled to begin in 2013. Upon completion, this project would bring on line approximately 362 MW of net interest baseload capacity (390 MW with peaking capacity) representing our 65% interest.
Los Esteros Critical Energy Facility Upgrade — We and PG&E negotiated a new agreement, subject to regulatory approval, to replace the existing CDWR contract and facilitate the upgrade of our Los Esteros Critical Energy Facility from a 188 MW simple-cycle generation power plant to a 308 MW combined-cycle generation power plant. In addition to the increase in capacity, the upgrade will increase the efficiency and environmental performance of the power plant by lowering the operating Heat Rate. While the upgrade is under construction, we will provide capacity to PG&E from our Gilroy Cogeneration Plant. Upon completion of the upgrade, PG&E will purchase all of the capacity from our Los Esteros Critical Energy Facility for a term of ten years.
Turbine Upgrades — We are in the process of upgrading certain of our Siemens natural gas-fired turbines to increase our generation capacity by approximately 180 MW and operating efficiencies, which began in the fourth quarter of 2009 and are scheduled through 2014. We have also upgraded the steam turbines at our McCabe and Ridgeline geothermal power plants that improved the overall turbine efficiency. We have two additional steam turbine upgrades scheduled for 2011 and 2012, and are considering others.
ENVIRONMENTAL PROFILE
A founding principle of our Company at its inception in 1984 and continuing today is our commitment to the generation of power in a cost effective and environmentally responsible manner. To achieve this we have assembled the largest fleet of combined-cycle natural gas-fired power plants and the largest fleet of geothermal power plants in North America.
We are committed to maintaining our fleet of clean, cost-effective and efficient power plants and to reducing the environmental impact through water conservation and the reduction of CO2 emissions as well as emissions of other air pollutants. We are also committed to supporting policymakers on legislation to reduce CO2 emissions and other air emission policies, and have been actively involved in the discussions and debates within the industry and with policymakers as GHG policies are developed. We were involved in the development and enactment of Assembly Bill 32 in California, and we have publicly supported the Regional Greenhouse Gas Initiative (known as RGGI) in the northeast. In 2006, we were one of only two power generating companies to file a brief of amicus curiae in support of the petitioners in the landmark case of Commonwealth of Massachusetts, et al. v. U.S. Environmental Protection Agency, in which the U.S. Supreme Court held that CO2 was a pollutant potentially subject to the CAA. Our environmental record has been widely recognized: we are an EPA Climate Leaders Partner with a stated goal to reduce GHG emissions, we became the first power producer to earn the distinction of Climate Action Leader™, and we have certified our CO2 emissions inventory with the California Climate Action Registry every year since 2003.
21
Table of Contents
Index to Financial Statements
Natural Gas-Fired Generation — Our fleet consumes significantly less fuel to generate power than conventional boiler/steam turbine power plants and emits less air pollution into the environment per MWh of power produced as compared to coal-fired or oil-fired power plants. All of our natural gas-fired power plants have air emissions controls and most have selective catalytic reduction to further reduce emissions of nitrogen oxides, a precursor of atmospheric ozone. In addition, we have implemented a program of proprietary operating procedures to reduce natural gas consumption and lower air pollutant emissions per MWh of power generated. The table below summarizes approximate air pollutant emission rates from our natural gas-fired power plants compared to the average emission rates from U.S. coal-, oil- and gas-fired power plants as a group, based on the most recent statistics available to us.
| Air Pollutant Emission Rates — Pounds of Pollutant Emitted Per MWh of Power Generated | ||||||
| Air Pollutants |
Average U.S. Coal-, Oil-, and Natural Gas-Fired Power Plant(1) |
Calpine Natural Gas-Fired, Combined-Cycle Power Plant(2) |
Compared to Average U.S. Coal-, Oil-, and Natural Gas-Fired Power Plant | |||
| Nitrogen Oxide, NOx |
2.54 | 0.13 | 94.9% less | |||
| Acid rain, smog and fine particulate formation |
||||||
| Sulfur Dioxide, SO2 |
5.90 | 0.0047 | 99.9% less | |||
| Acid rain and fine particulate formation |
||||||
| Mercury Compounds(3) |
0.000030 | — | 100.0% less | |||
| Neurotoxin |
||||||
| Carbon Dioxide, CO2 |
1,873 | 869 | 53.6% less | |||
| Principal GHG—contributor to climate change |
||||||
| (1) | The average U.S. coal-, oil- and natural gas-fired power plant’s emission rates were obtained from the U.S. Department of Energy’s Electric Power Annual Report for 2008. Emission rates are based on 2008 emissions and net generation. The U.S. Department of Energy has not yet released 2009 information. |
| (2) | Our natural gas-fired power plant estimated emission rates are based on our 2008 emissions and power generation data from our natural gas-fired combined-cycle power plants (excluding combined heat and power plants) as measured under the EPA reporting requirements. |
| (3) | The U.S. coal-, oil- and natural gas-fired power plant air emissions of mercury compounds were obtained from the U.S. EPA Toxics Release Inventory for 2008. Emission rates are based on 2008 emissions and net generation from U.S. Department of Energy’s Electric Power Annual Report for 2008. |
Geothermal Generation — Our 725 MW fleet of geothermal power plants utilizes a natural, clean and renewable energy source, steam from the Earth’s interior, to generate power. Since these power plants do not burn fossil fuel, they are able to produce power with negligible CO2 (the principal GHG), NOx and SO2 emissions. Compared to the average U.S. coal-, oil- and gas-fired power plant, our Geysers Assets emit 99.9% less NOx, 100% less SO2 and 94.8% less CO2.
There are 18 active geothermal power plants located in The Geysers region of northern California. We own and operate 15 of them. We recognize the importance of our Geysers Assets and we are committed to extending and expanding, this renewable geothermal resource through the addition of new steam wells and wastewater recharge projects where clean, reclaimed wastewater from local municipalities is recycled into the geothermal resource where it is converted by the Earth’s heat into steam for power production.
Climate Change and CO2 Emissions — Our combined-cycle, natural gas-fired power plants emit less than half the CO2 per unit of power generated than a traditional coal-fired power plant. Although our Geysers Assets
22
Table of Contents
Index to Financial Statements
do produce some emissions due to a natural geological process, the compliance burden compared to both coal-fired and natural gas-fired generation is expected to be minimal. In 2008, our emissions of CO2 amounted to about 39 million tons. For a more complete discussion of federal, state and regional climate change legislative and regulatory initiatives and how they might affect us, see “— Governmental and Regulatory Matters — Climate Change and Related Legislation and Regulations.”
Water Conservation and Reclamation — We have also invested substantially in technologies and systems that reduce the impact of our operations on water as a natural resource:
| • | We receive and inject an average of approximately 15 million gallons of reclaimed wastewater per day into the geothermal steam reservoir at The Geysers where the water is naturally heated by the Earth, creating additional steam to fuel our Geysers Assets. Approximately 11 million gallons is received from the Santa Rosa Geysers Recharge Project, developed by us and the City of Santa Rosa, which was previously being discharged into the Russian River and we receive, on average, approximately 4 million gallons a day from The Lake County Recharge Project from Lake County. |
| • | We use cooling towers, which utilize a closed-circuit water cooling system, or air cooled condensers to condense steam and do not employ once-through water cooling. Once-through water cooling, unlike our towers and condensers, uses large quantities of water from adjacent waterways, negatively impacting aquatic life. |
| • | Through separate agreements with several municipalities where we use cooling towers, we use treated wastewater for cooling at several of our power plants. This eliminates the need to consume valuable surface and/or groundwater supplies, in the amount of three to four million gallons per day for an average power plant. |
GOVERNMENTAL AND REGULATORY MATTERS
We are subject to complex and stringent energy, environmental and other governmental laws and regulations at the federal, state and local levels in connection with the development, ownership and operation of our power plants. Federal and state legislative and regulatory actions continue to change how our business is regulated. Such changes could have positive or negative impacts on our existing business.
Climate Change and Related Legislation and Regulations
As a clean energy provider, we believe that we are well positioned on a net basis for potential regulation of GHG emissions. The federal government is expected to take action on climate change legislation, and many states and regions in the U.S. have implemented or are considering implementing regulations to reduce GHG emissions. Although we cannot predict the ultimate effect any future climate change legislation or regulations could have on our business, we believe we face a lower compliance burden than some of our competitors due to the relatively low GHG emission rates of our fleet.
Proposed Federal Climate Change Legislation
On June 26, 2009, the U.S. House of Representatives passed “The American Clean Energy and Security Act of 2009,” a climate change and clean energy bill. The legislation includes, among other provisions:
| • | An economy-wide carbon cap-and-trade program that: |
| i. | sets reduction targets for carbon emissions from capped sources in several sectors of the economy, including the power sector, starting at a 3% reduction from 2005 levels by 2012, increasing to 17% by 2020, 42% by 2030 and 83% by 2050; |
23
Table of Contents
Index to Financial Statements
| ii. | starts in 2012 for the power sector and establishes the point of regulation at the power plant; |
| iii. | distributes 85% of emissions allowances for free, with 35.85% going to the power sector, including 1.5% to eligible generation facilities with qualifying long-term power and steam sales contracts; |
| iv. | requires an auction of the remaining 15% of emissions allowances with the proceeds of such auctions distributed to low- and moderate-income families; and |
| v. | delegates authority to FERC to regulate the cash market in emissions allowances and offsets and to the CFTC to regulate the associated derivatives market. |
| • | A federal energy efficiency and renewable electricity standard which requires retail electricity suppliers to meet the needs of a specific percentage of their load from renewable energy resources and electricity savings. |
If this bill were to become law, we would have the obligation to obtain emissions allowances for the operation of our fossil-fuel power plants. While we expect the costs to acquire allowances to be a factor that will impact the market price of power, there can be no assurance that market price will fully reflect these costs. With respect to our existing long-term steam and power contracts under which we would not be able to recover costs to acquire allowances from our customers, the bill allocates a pool of free allowances to generators with qualifying contracts to mitigate such costs. However, there can be no assurance there will be a sufficient number of free allowances in the pool to fully cover emissions related to generation under such contracts.
On November 5, 2009, the Senate Environment and Public Works Committee passed climate change legislation entitled the Clean Energy Jobs and American Power Act. The legislation is similar to the legislation passed in the House of Representatives, though its focus is primarily on climate change, not energy. The legislation sets reduction targets for carbon emissions of 20% by 2020; distributes a substantial portion of emission allowances for free, though a lower amount than in The American Clean Energy and Security Act of 2009, with some emission allowances going to the power sector, including to eligible power plants with qualifying long-term power and steam sales contracts; requires an auction of 25% of emissions allowances with the proceeds dedicated for consumer protections and deficit reduction; states that there will be one regulatory body that has market oversight authority; directs the administrator of the EPA to establish an incentive payment program that promotes generation projects that have lower GHG emissions; and provides grants for research and development for advanced natural gas-fired generation technology.
The Senate is expected to continue considering legislation addressing climate change; however, it is becoming less likely that such legislation will be enacted in 2010. Although we cannot predict the effect and ultimate content of final climate change legislation and regulations, if any, on our business, we continue to monitor and actively participate in the process where we anticipate an impact on our business.
Federal Regulation of GHG under Existing Law
On April 2, 2007, the U.S. Supreme Court ruled that the EPA has the authority to regulate GHG issues under language included in the CAA, and due to this ruling, the EPA is moving forward to regulate GHG emissions pursuant to its existing authority under the CAA. On December 7, 2009, the EPA determined that current and projected concentrations of the six key GHG emissions endanger the public health and welfare of current and future generations. Additionally, on September 30, 2009, the EPA announced a proposal (the “Tailoring Rule”) to require facilities emitting over 25,000 tons per year of GHG emissions to undergo major new source review when such facilities make modifications that would increase their GHG emissions by an additional 10,000 to 25,000 tons. Such modifications, or new construction, would be subject to the EPA’s prevention of significant deterioration rules and subject to best available control technology for GHGs, as well as public review and notice. The EPA expects to finalize the proposed rule by the end of March 2010, and if finalized, these requirements would be applicable to power generators such as us.
24
Table of Contents
Index to Financial Statements
The federal courts have also been active on GHG emission issues. Recent federal court decisions are divided as to whether large emitters of GHGs may be sued under common law theories of nuisance and negligence.
On September 21, 2009, the Second Circuit issued a ruling in State of Connecticut, et al. v. American Electric Power Company Inc., et al., reversing a lower court’s dismissal of two public nuisance claims filed by various states, municipalities and private entities against operators of coal-fired power plants. Plaintiffs argued that the power plant defendants contribute to global warming by emitting 650 million tons per year of CO2 and these emissions are causing and will continue to cause serious harms affecting human health and natural resources. The lower court held that plaintiffs’ claims presented a non-legal political question and dismissed the complaints. The Second Circuit vacated the lower court’s ruling and remanded the cases to the lower court for further proceedings. On October 16, 2009, the U.S. Court of Appeals for the Fifth Circuit made a similar ruling, finding that private property owners may bring claims of public and private nuisance against GHG-emitting oil and chemical companies.
Conversely, on September 30, 2009, in the case Native Village of Kivalina v. ExxonMobil, a federal district court in California sided with the defendants, 24 oil, energy and utility companies against the Village of Kivalina, a small, self-governing tribe of Inupiat people who reside north of the Arctic Circle. The residents of Kivalina had sued the defendants for damages under federal nuisance law arguing that, as a result of global warming, Kivalina is subject to coastal storm waves and surges. The court ruled in favor of the defendants finding that the plaintiff’s global warming claim was based upon the emission of GHGs from innumerable sources located throughout the world affecting the entire planet and its atmosphere and that no federal standards limit the discharge of GHGs.
We cannot predict the outcome of these cases or what impact the precedent of these cases could have on our business. However, these contrasting outcomes show that the federal courts are sharply divided over climate change litigation; thus, increasing the likelihood that Congress will take action on GHG regulations at some point in the future.
Regional and State Climate Change Activities
Several states and regional organizations are developing, or already have developed, state-specific or regional initiatives to reduce GHG emissions through mandatory programs. The most advanced programs include the RGGI in the northeast states and California’s implementation of its own GHG policy pursuant to Assembly Bill 32, as well as its RPS. The evolution of these programs could have a material impact on our business.
On January 1, 2009, ten northeast and mid-Atlantic states implemented a cap-and-trade program, RGGI, that affects our power plants in Maine, New York and New Jersey (together emitting about 1.8 million tons of CO2 annually). RGGI caps regional CO2 emissions and requires generators to acquire one allowance for every ton of CO2 emitted over a three-year compliance period. Apart from state-specific set-asides and other factors, the vast majority of the region’s CO2 allowances are distributed to the market via public auction. RGGI auctions have recently cleared at approximately $2.00 per ton. We are required to purchase allowances by buying them in RGGI public auctions or via the secondary market, or by investment in qualified offsets, to cover CO2 emissions from our power plants in the RGGI region. We received an allocation from New York’s long-term contract set-aside pool to cover some of the CO2 emissions attributable to our PPAs at both the Kennedy International Airport Power Plant and Stony Brook Power Plant. We do not anticipate any significant business impact from RGGI, given the efficiency of our power plants in RGGI states.
California’s Assembly Bill 32 and Senate Bill 1368 were signed into law in September 2006. Assembly Bill 32 creates a statewide cap on GHG emissions and requires the state to return to 1990 emission levels by 2020. As part of Assembly Bill 32 implementation, California’s cap-and-trade program is slated to begin in 2012. Other GHG regulatory policies promulgated under Assembly Bill 32 are ongoing. California regulators and industry participants continue to work on the regulations to implement Assembly Bill 32. We are an active participant in the development of these regulations.
25
Table of Contents
Index to Financial Statements
California is in the process of determining how allowances will be allocated under its cap-and-trade program. A committee of outside academic advisors to the California Air and Resources Board, or CARB, has recommended that all allowances be auctioned. CARB will take the committee’s recommendation under advisement and will develop and approve its allowance allocation regulations over the course of 2010. Under a full auction methodology, certain of our contracts may not allow GHG costs to be passed through to the customers.
Our other power plants may also become subject to state or regional CO2 compliance requirements. The Western Climate Initiative, launched in February 2007, is a collaboration of seven U.S. Governors and four Canadian Premiers to reduce GHG emissions and could affect our power plants in California, Arizona, Oregon and Ontario. The Western Climate Initiative’s goal is to establish a multi-sector cap-and-trade program effective for most sectors of the economy by 2012 and regulation of the transportation sector by 2015. Some partner states, such as Arizona, have indicated their participation will be delayed or dependent on further economic analysis and recovery. To date, California is the only state that has reaffirmed its commitment to its participation and a 2012 start. In the Midwest, our power plants in Illinois, Wisconsin and Minnesota may become subject to CO2 compliance requirements depending on the ultimate outcome of the Midwestern Greenhouse Gas Reduction Accord. This regional planning effort is not expected to lead to binding regulations; however, compliance requirements will be subject to prospective individual regulatory and/or legislative action by the participating states.
Renewable Portfolio Standards
Policymakers have been considering RPS at the federal and state level. Generally, a RPS requires each retail seller of electricity to include in its resource portfolio (the resources procured by the retail seller to supply its retail customers) a certain amount of power generated from renewable energy resources by a certain date. Although there is currently no national RPS, President Obama has stated his goal is to have 10% of the nation’s electricity provided from renewable sources by 2012, and 25% by 2025, and U.S. Congressional leaders have committed to pass legislation to enact a national RPS in this Congress. It is too early to determine whether or not the enactment of a national RPS will have a positive or negative impact on us. Depending on the RPS structure, an RPS could enhance the value of our existing Geysers Assets. However, an RPS would likely initially drive up the number of wind and solar resources, which could negatively impact the dispatch of our natural gas assets, primarily in Texas and California. Conversely, our natural gas power plants could benefit by providing complementary/back-up service for these intermittent renewable resources.
California is currently considering a range of options for a new and higher RPS. California’s existing RPS requires certain retail power providers to generate or procure 20% of the power they sell to retail customers from renewable resources by 2010. At the end of the 2009 California legislative session, the California state legislature passed a bill to increase the state’s RPS to 33% by 2020. The governor of California vetoed the bill, but, in a separate move, the governor signed an executive order directing CARB under its authority granted by Assembly Bill 32 to adopt regulations consistent with a 33% RPS by 2020. Implementation details of the executive order are yet to be determined; however, it directs CARB to adopt regulations by July 31, 2010. The executive order directed CARB to develop implementation details by January 1, 2010, a deadline which was not met. CARB is now actively working to release the initial draft regulation in late February or early March.
Currently, California does not allow RECs and power to be sold separately. The role of tradable renewable energy credits, or TRECs, in California’s RPS remains uncertain. TRECs are claims to the renewable aspect of the energy that is produced by a renewable resource and are traded separately from the underlying generic energy. The CPUC is considering whether to allow retail power providers to use TRECs to meet RPS requirements and what types of limits to place on their use in the event that they are allowed. We cannot predict at this time whether the CPUC will allow the use of TRECs or what impact, if any, TRECs could have on our business.
A number of additional states have a RPS in place. These include Maine, Minnesota, New York, Texas and Wisconsin. Individual programs vary widely. Maine has the most stringent RPS, requiring retail providers to supply no less than 30% of their needs with qualified renewable resources. Other states, such as Texas, have a
26
Table of Contents
Index to Financial Statements
capacity-based standard that requires a specific amount of new renewable generation to be installed by certain dates. Existing state-specific RPS requirements may change due to regulatory and/or legislative initiatives, and other states may consider implementing enforceable RPS in the future.
Other Environmental Regulations
Our power plants and the equipment necessary to support them are subject to extensive federal, state and local laws and regulations adopted for the protection of the environment and to regulate land use. The laws and regulations applicable to us primarily involve the discharge of emissions into the water and air, and the use of water, but can also include wetlands preservation, endangered species, hazardous materials handling and disposal, waste disposal and noise regulations. Noncompliance with environmental laws and regulations can result in the imposition of civil or criminal fines or penalties. In some instances, environmental laws may also impose clean-up or other remedial obligations in the event of a release of pollutants or contaminants into the environment. The following federal laws are among the more significant environmental laws that apply to us. In most cases, analogous state laws also exist that may impose similar and, in some cases, more stringent requirements on us than those discussed below. Our general policy with respect to these laws attempts to take advantage of our relatively clean portfolio of power plants as compared to our competitors.
Clean Air Act
The CAA provides for the regulation of air quality and air emissions, largely through state implementation of federal requirements. We believe that all of our operating power plants comply with federal and state performance standards mandated under the CAA. Several CAA programs that affect our power plants and/or our competitors are discussed below.
Section 185 Fees — Section 185 of the CAA requires major stationary sources of NOx and volatile organic compounds, or VOC(s), such as power plants and refineries, in areas that fail to attain the National Ambient Air Quality Standards, or NAAQS, for ozone by the attainment date to pay a fee to the state or in the absence of state action, the EPA. The fee was set by Congress in the CAA at $5,000 per ton of NOx or VOC (adjusted for inflation or approximately $8,750 per ton in 2008) and is payable on emissions that exceed 80% of each individual power plant’s baseline emissions, which were established in the year before the attainment date; however, the EPA is considering alternative baseline calculations. The fee will remain in effect until the designated area achieves attainment. We operate 13 power plants that are located within designated nonattainment areas in Texas, New York and Louisiana, which are subject to this fee. On January 5, 2010, the EPA issued guidance on developing fee programs required under Section 185 of the CAA. Texas issued a draft rulemaking to collect the fees in late 2009 and we provided comments on the draft in January 2010. We estimate that compliance with this fee could result in additional costs of approximately $3 million to $5 million on an annual basis and our financial statements include accruals for our estimated Section 185 fees. Our estimate is dependent upon a number of factors that could change in the future dependent upon, among other things: implementation by the states of guidance from the EPA, state rulemakings, the designation of nonattainment status, our number of power plants located in these areas and our level of NOx emissions.
Hazardous Air Pollutants — On October 22, 2009, the EPA signed a consent decree that was lodged in the U. S. District Court for the District of Columbia by the EPA in settlement of a suit brought by several environmental groups alleging that the EPA failed to promulgate final maximum achievable control technology emissions standards for hazardous air pollutants from coal- and oil-fired power plants, pursuant to Section 112(d) of the CAA, by the statutorily-mandated deadline. The consent decree requires the EPA to promulgate final maximum achievable control technology standards by November 2011 that will likely require mercury and acid gas control retrofits on marginal coal-fired power plants to be operational by 2014.
On November 16, 2009, the EPA issued a proposal to increase the NAAQS for SO2. The proposal seeks to replace the current annual and 24-hour standards with a new 1-hour standard at a level between 50 and 100 parts per billion. Final ruling is expected in June of 2010. We emit little SO2 and do not expect to experience significant operating costs, or retrofit obligations, from the new standards. Should coal-fired power plants in our regional markets be forced to retrofit or retire, the new standards could benefit our competitive position.
27
Table of Contents
Index to Financial Statements
Houston/Galveston Nonattainment — Pursuant to authority granted under the CAA, regulations adopted by the Texas Commission on Environmental Quality, or TCEQ, to attain the one-hour and eight-hour NAAQS for ozone included the establishment of a cap-and-trade program for NOx emitted by power generating facilities in the Houston/Galveston ozone nonattainment area. We own and operate seven power plants that participate in this program, all of which received free NOx allowances based on historical operating profiles. At this time, our Houston-area power plants have sufficient NOx allowances to meet forecasted obligations under the program. However, the EPA revised downward the eight-hour NAAQS for ozone in 2008 from 0.080 parts per million (ppm) to 0.075 ppm. The EPA subsequently announced on September 16, 2009, that the protectiveness of this standard would be reconsidered and a new standard was proposed in December 2009 leading to the implementation of control measures as early as 2014 for existing and newly designated areas under the revised ozone standard. The dynamic nature of the ozone standard creates further uncertainty in the timing and nature of future controls, but should allowance shortfalls occur, we would be required to purchase NOx allowances or install emissions control equipment on certain power plants.
Acid Rain Program — As a result of the 1990 CAA amendments, the EPA established a cap-and-trade program for SO2 emissions from power plants throughout the U.S. Starting with Phase II of the program in 2000, a permanent ceiling (or cap) was set at 10 million tons per year, declining to 8.95 million tons per year by 2010. The EPA allocated SO2 allowances to power plants. Each allowance permits a unit to emit one ton of SO2 during or after a specified year, and allowances may be bought, sold or banked. All but a small percentage of allowances were allocated to power plants placed into service before 1990. None of our power plants receive free SO2 allowances. Accordingly, we must purchase allowances to cover all SO2 emissions from our affected power plants and satisfy our compliance obligations. Since our entire fleet emits about 200 tons of SO2 per year, we believe that our compliance expense for this program will be relatively insignificant compared to many of our competitors.
Multi-Pollutant Programs — Pursuant to authority granted under the CAA, the EPA promulgated the Clean Air Interstate Rule, or CAIR, regulations in March 2005, applicable to 28 eastern states and the District of Columbia, to facilitate attainment of its ozone and fine particulates standards issued in 1997. When fully implemented, CAIR’s goal is to reduce SO2 emissions in these states by over 70%, and NOx emissions by over 60% from 2003 levels by 2015. CAIR establishes annual cap-and-trade programs for SO2 and NOx as well as a seasonal program for NOx. On July 11, 2008, a panel of the U.S. Court of Appeals for the D.C. Circuit invalidated CAIR, stating that the “EPA’s approach – region-wide caps with no state specific quantitative contribution determinations or emission requirements – is fundamentally flawed.” The court did not overturn the existing cap-and-trade program for SO2 reductions under the Acid Rain Program or the existing ozone season cap-and-trade program under the NOx State Implementation Plan Call. On September 25, 2008, the EPA petitioned the court for rehearing. On December 23, 2008, the court remanded CAIR without vacatur for the EPA to conduct further proceedings consistent with the July 11, 2008 opinion. As a result of the court’s decision, CAIR was left intact and went into effect as planned on January 1, 2009, for many of our power plants located throughout the eastern and central U.S. Due to favorable allowance allocations, particularly in Texas, we have a net surplus of annual NOx allowances and the net financial impact of the program to our operations will be positive. The court did not set a definitive deadline for re-promulgation of a new rule, but the EPA has indicated that it will be issuing a CAIR replacement rule proposal in April 2010. At this time, we cannot predict what impact this proposal will have on us, if any.
On February 4, 2010, bipartisan multi-pollutant legislation, the Clean Air Act Amendments of 2010, was introduced in the Senate. The legislation, which replaces the Clean Air Interstate Rule and the Clean Air Mercury Rule, sets forth new regulations for SO2, NOx and Hg calling for: 80% reduction in SO2 emissions by 2018; 53% reduction in NOx emissions by 2015; and reductions in Hg emission of at least 90% by 2015. It establishes nationwide trading programs for SO2 and NOx, and requires maximum achievable control technology for Hg reductions. While sponsors of the legislation hope to move this bill with comprehensive climate change and energy legislation, they also plan to push it independently if such legislation does not move forward this year. At this time, we are unsure of the timing for movement of this bill.
28
Table of Contents
Index to Financial Statements
Clean Water Act
The federal Clean Water Act establishes rules regulating the discharge of pollutants into waters of the U.S. We are required to obtain wastewater and storm water discharge permits for wastewater and runoff, respectively, for certain of our power plants. We are required to maintain a spill prevention control and countermeasure plan with respect to certain of our natural gas power plants. We believe that we are in material compliance with applicable discharge requirements of the federal Clean Water Act.
Safe Drinking Water Act
Part C of the Safe Drinking Water Act establishes the underground injection control program that regulates the disposal of wastes by means of deep well injection. Although geothermal production wells, which are wells that bring steam to the surface, are exempt under the Energy Policy Act of 2005, or EPAct 2005, we use geothermal re-injection wells to inject reclaimed wastewater back into the steam reservoir, which are subject to this regulation. We believe that we are in material compliance with Part C of this Act.
Resource Conservation and Recovery Act
The Resource Conservation and Recovery Act, or RCRA, regulates the management of solid and hazardous waste. With respect to our solid waste disposal practices at our power plants and steam fields located in The Geysers region of northern California, we are also subject to certain solid waste requirements under applicable California laws. We believe that our operations are in material compliance with RCRA and all such laws.
Comprehensive Environmental Response, Compensation and Liability Act
The Comprehensive Environmental Response, Compensation and Liability Act, or CERCLA, also referred to as Superfund, requires cleanup of sites from which there has been a release or threatened release of hazardous substances, and authorizes the EPA to take any necessary response action at Superfund sites, including ordering potentially responsible parties liable for the release to pay for such actions. Potentially responsible parties are broadly defined under CERCLA to include past and present owners and operators of, as well as generators of, wastes sent to a site. As of the filing of this Report, we are not subject to any material liability for any Superfund matters. However, we generate certain wastes, including hazardous wastes, and send certain of our wastes to third party waste disposal sites. As a result, there can be no assurance that we will not incur a liability under CERCLA in the future.
Federal Regulation of Power
FERC Jurisdiction
Electric utilities have been highly regulated by the federal government since the 1930s, principally under the Federal Power Act, or FPA, and PUHCA 1935. These statutes have been amended and supplemented by subsequent legislation, including PURPA and EPAct 2005. These particular statutes and regulations are discussed in more detail below.
The FPA grants the federal government broad authority over electric utilities and independent power producers, and vests its authority in FERC. Unless otherwise exempt, any person that owns or operates facilities used for the wholesale sale or transmission of power in interstate commerce is a public utility subject to FERC’s jurisdiction. FERC governs, among other things, the disposition of certain utility property, the issuance of securities by public utilities, the rates, the terms and conditions for the transmission or wholesale sale of power in interstate commerce, the interlocking directorates, and the uniform system of accounts and reporting requirements for public utilities.
29
Table of Contents
Index to Financial Statements
The majority of our power plants are subject to FERC’s jurisdiction; however, certain power plants qualify for available exemptions. FERC’s jurisdiction over EWGs under the FPA applies to the majority of our power plants because they are EWGs or are owned by EWGs, except our EWGs located in ERCOT. Power plants located in ERCOT are exempt from many FERC regulations under the FPA. Many of our power plants that are not EWGs are operated as QFs under PURPA. Several of our affiliates have been granted authority to engage in sales at market-based rates and blanket authority to issue securities, and have also been granted certain waivers of FERC reporting and accounting regulations available to non-traditional public utilities; however, we cannot assure that such authorities or waivers will not be revoked for these affiliates or will be granted in the future to other affiliates.
FERC has the right to review books and records of “holding companies,” as defined in PUHCA 2005, that are determined by FERC to be relevant to the companies’ respective FERC-jurisdictional rates. We are considered a holding company, as defined in PUHCA 2005, by virtue of our control of the outstanding voting securities of our subsidiaries that own or operate power plants used for the generation of power for sale, or that are themselves holding companies. However, we are exempt from FERC’s inspection rights pursuant to one of the limited exemptions under PUHCA 2005 as we are a holding company due solely to our owning one or more QFs, EWGs and Foreign Utility Companies, or FUCOs. If any single Calpine entity were not a QF, EWG or FUCO, then we and our holding company subsidiaries would be subject to the books and records access requirement.
FERC’s policies and proposals will continue to evolve, and FERC may amend or revise them, or may introduce new policies or proposals in the future. The impact of such policies and proposals on our business is uncertain and cannot be predicted at this time.
FERC Regulation of Market-Based Rates
Under the FPA and FERC’s regulations, the wholesale sale of power at market-based or cost-based rates requires that the seller have authorization issued by FERC to sell power at wholesale pursuant to a FERC-accepted rate schedule. FERC grants market-based rate authorization based on several criteria, including a showing that the seller and its affiliates lack market power in generation and transmission, that the seller and its affiliates cannot erect other barriers to market entry and that there is no opportunity for abusive transactions involving regulated affiliates of the seller. All of our affiliates that own domestic power plants, except for certain of those power plants that are QFs under PURPA or that are located in ERCOT, as well as our market-based rate companies, are currently authorized by FERC to make wholesale sales of power at market-based rates. This authorization could possibly be revoked for any of our market-based rate companies if they fail to continue to satisfy FERC’s current or future criteria, or if FERC eliminates or restricts the ability of wholesale sellers of power to make sales at market-based rates. If market-based rate authority were revoked or restricted, affected power plants could be required to make wholesale sales of power based on cost-of-service rates, which could negatively impact their revenues.
FERC’s regulations specifically prohibit the manipulation of the power markets by making it unlawful for any entity in connection with the purchase or sale of power, or the purchase or sale of power transmission service under FERC’s jurisdiction, to engage in fraudulent or deceptive practices.
To ward against market manipulation, FERC requires us and other sellers making sales pursuant to their market-based rate authority to file certain reports, including quarterly reports of contract and transaction data, notices of any change in status and triennial updated market power analyses. If a seller does not timely file these reports or notices, FERC can revoke the seller’s market-based rate authority. FERC’s regulations also contain four market behavior rules that apply to sellers with market-based rate authority. These rules address such matters as compliance with organized Regional Transmission Organization or ISO market rules, communication of accurate information, price reporting to publishers of power or natural gas price indices, and record retention. Failure to comply with these regulations can lead to sanctions by FERC, including penalties and suspension or revocation of market-based rate authority.
30
Table of Contents
Index to Financial Statements
FERC Regulation of Transfers of Jurisdictional Facilities
Dispositions of our jurisdictional facilities or certain types of financing arrangements may require prior FERC approval, which could result in revised terms or impose additional costs, or cause a transaction to be delayed or terminated. Pursuant to Section 203 of the FPA, as amended by EPAct 2005, a public utility must obtain authorization from FERC before the public utility is permitted to: sell, lease or dispose of FERC-jurisdictional facilities with a value in excess of $10 million; merge or consolidate facilities with those of another entity; or acquire any security or securities with a value in excess of $10 million issued by another public utility. FERC’s prior approval is also required for transactions involving certain transfers of existing generation facilities and certain holding companies’ acquisitions of facilities with a value in excess of $10 million. FERC’s regulations implementing Section 203 of the FPA provide blanket authorizations for certain types of transactions, including acquisitions by holding companies that are holding companies solely due to their ownership, directly or indirectly, of one or more QFs, EWGs and FUCOs, to acquire additional QFs, EWGs or FUCOs, or the securities of additional QFs, EWGs and FUCOs without prior FERC approval.
FERC Regulation of Qualifying Facilities
Cogeneration and certain small power production facilities are eligible to be QFs under PURPA, provided that they meet certain power and thermal energy production requirements, and efficiency standards. QF status provides an exemption from PUHCA 2005 and grants certain other benefits to the QF, including, in some cases, the right to sell power to utilities at the utilities’ avoided cost. Certain types of sales by QFs are also exempt from FERC regulation of wholesale sales of the QFs’ power output. QFs are also exempt from most state laws and regulations. To be a QF, a Cogeneration power plant must produce power and useful thermal energy for an industrial or commercial process, or heating or cooling applications in certain proportions to the power plant’s total energy output, and must meet certain efficiency standards.
An electric utility may be relieved of the mandatory purchase obligation to purchase power from QFs at the utility’s avoided cost if FERC determines that such QFs have access to a competitive wholesale power market. Some entities maintain that the launch of CAISO’s Market Redesign and Technology Upgrade provides the access that should obviate the California utilities’ mandatory purchase obligation, and triggers changes in energy pricing for California QFs pursuant to existing QF contracts. These issues remain the topic of extensive stakeholder negotiation.
FERC Enforcement Authority
FERC has civil penalty authority over violations of any provision of Part II of the FPA, as well as any rule or order issued thereunder. FERC is authorized to assess a maximum civil penalty of $1 million per violation for each day that the violation continues. The FPA also provides for the assessment of criminal fines and imprisonment for violations under Part II of the FPA. This penalty authority was enhanced in EPAct 2005. With this expanded enforcement authority, violations of the FPA and FERC’s regulations could potentially have more serious consequences than in the past.
NERC Compliance Requirements
Pursuant to EPAct 2005, NERC has been certified by FERC as the Electric Reliability Organization to develop and oversee the enforcement of electric system reliability standards applicable throughout the U.S., which are subject to FERC review and approval. FERC approved reliability standards may be enforced by FERC independently, or, alternatively, by the Electric Reliability Organization and regional reliability organizations with frontline responsibility for auditing, investigating and otherwise ensuring compliance with reliability standards, subject to FERC oversight. Monetary penalties of up to $1 million per day per violation may be assessed for violations of the reliability standards. Certain electric reliability standards which apply to us as a generator owner, generator operator or marketer of power (purchasing and selling entity) are effective and
31
Table of Contents
Index to Financial Statements
mandatory. In addition, the regional reliability organizations have the ability to formulate supplemental reliability standards to apply in their specific regions, which may be more stringent than the NERC reliability standards. We must comply with different reliability standards, requirements and procedural rules in each region in which we operate. It is expected that additional or modified NERC and regional reliability standards will be approved by FERC in the coming years, requiring us to take additional steps to remain fully compliant.
Regional and State Regulation of Power
The following summaries of the regional rules and regulations affecting our business focus on the West and Texas because these are the regions in which we have the most significant portfolios of power plants. While we provide a brief overview of the primary regional rules and regulations affecting our power plants located in other regions of the country, we do not provide an in-depth discussion of these rules and regulations because our asset portfolio in those regions is not as significant. All power plant and MW data is reported as of December 31, 2009.
West
We have 27 natural gas-fired power plants, excluding one under advanced development, with the capacity to generate a total of 7,185 MW in the WECC NERC region, which extends from the Rocky Mountains westward. In addition, we own and operate 15 geothermal power plants located in northern California capable of producing a total of 725 MW. The majority of these power plants are located in California, in the CAISO region; however, we also own power plants in Arizona, Colorado and Oregon.
CAISO is responsible for ensuring the safe and reliable operation of the transmission grid within California and providing open, nondiscriminatory transmission services. Pursuant to a FERC-approved tariff, CAISO has certain abilities to impose penalties on market participants for violations of its rules. CAISO maintains various markets for wholesale sales of power, differentiated by time and type of electrical service, into which our subsidiaries may sell power from time to time. These markets are subject to various controls, such as price caps and mitigation of bids when reference prices are exceeded. The controls and the markets themselves are subject to regulatory change at any time. CAISO runs integrated day-ahead and real-time markets for energy and ancillary services. The energy markets include centralized, day-ahead and real-time markets for energy, a nodal transmission congestion management model that results in locational marginal pricing at each generation location, financial congestion hedging instruments, a centralized day-ahead commitment process and current bid caps of $500 per MWh, which are scheduled to increase to $750 per MWh on April 1, 2010. The locational marginal pricing market design is intended to reward and encourage generation resources on favorable grid locations, such as some of the locations of our power plants.
Our power plants located outside of California either sell power into the markets administered by CAISO or sell power through bilateral transactions outside CAISO. Those transactions occurring outside CAISO are subject to FERC regulation and oversight, but they are not subject to CAISO rules and regulations.
Texas
We have 12 natural gas-fired power plants in the TRE NERC region with the capacity to generate a total of 7,392 MW, all of which are physically located in the ERCOT market. ERCOT is the ISO that manages approximately 85% of Texas’ load and an electric grid covering about 75% of the state, overseeing transactions associated with Texas’ competitive wholesale and retail power markets. FERC does not regulate wholesale sales of power in ERCOT. The PUCT exercises regulatory jurisdiction over the rates and services of any electric utility conducting business within Texas. Our subsidiaries that own power plants in Texas have power generation company status at the PUCT, and are either EWGs or QFs and are exempt from PUCT rate regulation. ERCOT is largely a bilateral wholesale power market, which allows buyers and sellers to competitively negotiate contracts for energy, capacity and ancillary services. ERCOT meets its system needs by using ancillary service capacity and running a balancing energy service. ERCOT manages transmission congestion with zonal and intra-zonal type methods. ERCOT ensures resource adequacy through an energy-only model rather than the capacity-based resource adequacy model that is more common among Regional Transmission Organizations or ISOs in the
32
Table of Contents
Index to Financial Statements
Eastern Interconnect. In ERCOT there is a market price cap for energy and capacity purchased by ERCOT. Under certain market conditions, the offer cap could be lower. Our subsidiaries are subject to the offer cap rules, but only for sales of power and capacity services to ERCOT.
ERCOT’s implementation of a nodal market structure was scheduled to have been implemented in late 2008. However, in 2008, ERCOT announced that it would delay implementation. The PUCT initiated an effort to refresh the original cost-benefit study analysis that had justified moving to a nodal design. Based on the refreshed analysis, ERCOT states that it intends to implement nodal design at the end of 2010, which ERCOT’s latest progress report on the nodal project indicates that it remains on schedule for a December 2010 implementation date. We anticipate a neutral business impact on us, but we are not able to rule out other impacts.
The Sunset Review Process, implemented by the Texas Legislature in 1977, is the regular assessment of the need for a state agency to exist and to consider new and innovative changes to improve each agency’s operations and activities. The Sunset Review Process works by setting a date on which an agency will be abolished unless legislation is passed to continue its functions. The Sunset Review Process began in September 2009 for the PUCT and ERCOT. It is expected to be concluded by April 2010. The Texas Commission on Environmental Quality, or TCEQ, review will begin in April 2010 and is scheduled to be completed by November 2010 when the compliance phase for all agencies will begin. We will monitor the Sunset Review Process of these entities and will seek to participate in these processes where we anticipate an impact on our business.
On July 17, 2008, the PUCT tentatively approved a transmission build plan, the Competitive Renewable Energy Zones, or CREZ, to expand the delivery of wind-generated power from western Texas to service approximately 18,500 MW of planned wind generation. Wind generation tends to supply more power during off-peak hours and shoulder months, and is unpredictable. The PUCT’s selection of transmission providers to build the transmission lines was challenged in Texas state court, and on January 15, 2010 the court reversed and remanded the PUCT’s order selecting certain companies to build the CREZ lines, finding that the PUCT erred in its selection process. As a consequence of the state court’s ruling, the PUCT established a new docket to reconsider its order selecting the transmission providers. We do not know what, if any, delay the court’s decision will have on any CREZ project. If completed as currently approved, the impact of the transmission upgrades and associated wind generation on our Texas plants is unknown.
Southeast
We have one operating natural gas-fired power plant with the capacity to generate 1,134 MW located in the SPP NERC region. SPP is a Regional Transmission Organization approved by FERC that provides independent administration of the electric power grid. SPP manages an energy-only locationally based real-time wholesale energy market. This market provides both nominal load-following and transmission constraint relief. SPP stakeholders are considering the creation of a day-ahead market and ancillary service markets.
We have ten natural gas-fired power plants with the capacity to generate a total of 4,949 MW operating within the SERC and the FRCC NERC regions. Opportunities to negotiate bilateral, individual contracts and long-term transactions with investor owned utilities, municipalities and cooperatives exist within these regions. In addition to entering into bilateral transactions, there is a limited opportunity to sell into the short-term market. In the Entergy sub-region, SPP has been designated as the Independent Coordinator of Transmission. In this capacity, the Independent Coordinator of Transmission provides oversight of the Entergy transmission system.
North
We have a total of eight natural gas-fired power plants with the capacity to generate a total of 1,433 MW located in the NPCC NERC region. Five of these power plants are located in New York. NYISO manages the transmission system in New York and operates the state’s wholesale power markets. NYISO manages both day-ahead and real-time energy markets using a locationally based marginal pricing mechanism that pays each generator the zonal marginally accepted bid price for the energy it produces.
33
Table of Contents
Index to Financial Statements
Our remaining U.S.-based power plant in the NPCC NERC region is located in Maine. ISO NE is the Regional Transmission Organization for Connecticut, Maine, Massachusetts, New Hampshire, Rhode Island and Vermont. ISO NE has broad authority over the day-to-day operation of the transmission system and operates a day-ahead and real-time wholesale energy market, a forward capacity market and ancillary services markets. ISO NE also provides for regional transmission planning.
We also have 50% ownership in two power plants, which includes a 50% interest and a 50% joint venture, with the total capacity to generate 1,088 MW, located in the NPCC NERC region in Ontario, Canada. The Independent Electricity System Operator, or IESO, of Ontario operates the Province’s wholesale power markets and directs the operation and ensures reliability of the IESO controlled grid. Hydro-One owns and operates the transmission system in Ontario, which is regulated by the Ontario Energy Board. Effective December 2009, the IESO implemented several rule changes that are expected to impact the financial performance in 2010 and beyond for Greenfield Energy Centre, our joint venture. Greenfield Energy Centre’s power supply contract with the Ontario Power Authority, or OPA, provides it with a right to recovery for financial consequences of market rule changes that negatively impact Greenfield Energy Centre. OPA has not yet agreed to accept responsibility for the changes and discussions continue between the parties.
We have one operating power plant, with the capacity to generate 503 MW, located in PJM, which is located in the RFC NERC region. However, it is partially committed to load in MISO. PJM operates wholesale power markets, a locationally based capacity market, a forward capacity market and ancillary service markets. PJM also performs transmission planning for the region.
We have three natural gas-fired power plants with the capacity to generate a total of 1,481 MW operating within the MRO NERC region. MISO manages competitive locationally based wholesale day-ahead, real-time energy and ancillary services markets. MISO’s Resource Adequacy model requires load serving entities to account for capacity obligations under Module E of the MISO tariff. MISO implemented a monthly voluntary capacity auction to help purchasers find suppliers with capacity to meet their incremental capacity needs.
Other State Regulation of Power
State Public Utility Commissions, or PUC(s), have historically had broad authority to regulate both the rates charged by, and the financial activities of, electric utilities operating in their states and to promulgate regulation for implementation of PURPA. Since all of our affiliates are either QFs or EWGs, none of our affiliates are currently subject to direct rate regulation by a state PUC. However, states may assert jurisdiction over the siting and construction of power generating facilities including QFs and EWGs and, with the exception of QFs, over the issuance of securities and the sale or other transfer of assets by these facilities. In California, for example, the CPUC was required by statute to adopt and enforce maintenance and operation standards for power plants “located in the state,” including EWGs but excluding QFs, for the purpose of ensuring their reliable operation. As the owner and operator of power plants in California, our subsidiaries are subject to the power plant maintenance and operation standards and the general duty standards that are enforced by the CPUC.
State PUCs also maintain extensive control over the procurement of wholesale power by the utilities that they regulate. Many of these utilities are our customers, and agreements between us and these counterparties often require approval by state PUCs. For example, in California, the CPUC determines how much new generation can be purchased by the California Investor Owned Utilities, or IOUs, and shapes the rules of the IOUs’ requests for offers. In addition, the CPUC determines the rules of California’s Resource Adequacy program. The Resource Adequacy program is currently based on a loosely structured year- and month-ahead bilateral capacity market. The CPUC is in the process of considering modifications to the Resource Adequacy program, including the potential introduction of a multi-year forward centralized capacity markets, similar to those that exist in ISO NE and PJM.
Regulation of Transportation and Sale of Natural Gas
Since the majority of our power generating capacity is derived from natural gas-fired power plants, we are broadly impacted by federal regulation of natural gas transportation and sales. Furthermore, our two natural gas
34
Table of Contents
Index to Financial Statements
transportation pipelines in Texas are subject to dual jurisdiction by FERC and the Texas Railroad Commission. These pipelines are intrastate pipelines within the meaning of Section 2(16) of the Natural Gas Policy Act, or NGPA. FERC regulates the rates charged by these pipelines for transportation services performed under Section 311 of the NGPA, and the Texas Railroad Commission regulates the rates and services provided by these pipelines as gas utilities in Texas. Additionally, under the Natural Gas Act, or NGA, the NGPA and the Outer Continental Shelf Lands Act, FERC is authorized to regulate pipeline, storage and liquefied natural gas, or LNG, facility construction; the transportation of natural gas in interstate commerce; the abandonment of facilities; and the rates for services. FERC is also authorized under the NGA to regulate the sale of natural gas at wholesale. FERC also has the authority to regulate the quality of LNG deliveries into the pipeline system. Unless appropriate natural gas specifications are implemented, LNG supplies could impact in the future our power plant operations and the ability to meet emission limits.
FERC has civil penalty authority for violations of the NGA and NGPA, as well as any rule or order issued thereunder. FERC’s regulations specifically prohibit the manipulation of the natural gas markets by making it unlawful for any entity in connection with the purchase or sale of natural gas, or the purchase or sale of transportation service under FERC’s jurisdiction, to engage in fraudulent or deceptive practices. Similar to its penalty authority under the FPA described above, FERC is authorized to assess a maximum civil penalty of $1 million per violation for each day that the violation continues. The NGA and NGPA also provide for the assessment of criminal fines and imprisonment time for violations.
We also operate proprietary pipelines in California, which are regulated by the California Department of Transportation with regard to safety matters but are otherwise not regulated.
CFTC Regulation of Power and Natural Gas and Possible Derivatives Legislation
The CFTC has regulatory oversight of the futures markets, including trading on NYMEX for energy, and licensed futures professionals such as brokers, clearing members and large traders. In connection with its oversight of the futures markets and NYMEX, the CFTC regularly investigates market irregularities and potential manipulation of those markets. Recent laws also give the CFTC certain powers with respect to broker-type markets referred to as “exempt commercial markets” or ECMs, including the Intercontinental Exchange. The CFTC monitors activities in the OTC, ECM, and physical markets that may be undertaken for the purpose of influencing futures prices. With respect to ECMs, the CFTC exercises only light-handed regulation primarily related to price reporting and record retention. Thus, transactions executed on an ECM generally are not regulated directly by the CFTC. However, ECM transactions have come under the CFTC’s scrutiny during investigations of fraud and manipulation in which the CFTC has broadly applied its statutory authority to punish persons who are alleged to have manipulated, or attempted to manipulate, the price of any commodity in interstate commerce or for future delivery.
On December 11, 2009, the House of Representatives passed the Wall Street Financial Reform and Consumer Protection Act of 2009. The legislation includes provisions to regulate certain types of OTC derivatives that we use. Included in the bill is a provision which clarifies the definition of a “major swap participant” that would otherwise have left it to future CFTC interpretation and definition which could have put more end users, such as us, under mandatory clearing, position limits and margin despite an end user exemption in the underlying bill.
The Senate Banking Committee is attempting to work in a bipartisan manner to craft comprehensive financial reform legislation. The committee has organized bipartisan working groups to address various aspects of reform. The Senate Agriculture Committee also continues to work on drafting bipartisan legislation.
Geothermal Operations
In 2009, as part of a joint private and federally funded geothermal technology research project, a company unrelated to us commenced deepening an existing geothermal well on a property neighboring our
35
Table of Contents
Index to Financial Statements
Geysers Assets. The company was reportedly attempting to drill into the hot, low or non-permeable base rock that underlies the existing geothermal steam reservoir at The Geysers to engineer or create a “multilayered heat extraction system” below the reservoir by injecting water under very high pressure, fracturing the rock. This process has spawned public and political concern regarding increased seismicity risk. As a consequence, in July 2009, the Department of Energy halted funding of its portion of that research project pending further seismicity studies. In addition, the Department of Energy and residents located near our Geysers Assets have expressed concern regarding induced seismicity associated with geothermal operations. Also, we have become aware of a letter and petition to the Board of Supervisors County of Lake from a local community homeowners association located near our Geysers Assets entitled a “Complaint and Petition” and signed by “109 residents and property owners.” The letter asks for county intervention to abate alleged public nuisance arising from induced seismicity by governmental legal action, including litigation, regulation and ordinances to prevent induced seismicity; however, the letter also states it is not their intent to suspend our geothermal operations. In response to those concerns, it is possible that government entities or agencies will seek to more stringently regulate the exploration, development, and operation of geothermal power plants, including our Geysers Assets, in order to mitigate induced seismicity resulting from geothermal operations.
EMPLOYEES
As of December 31, 2009, we employed 2,046 full-time employees, of whom 46 were represented by collective bargaining agreements. We have never experienced a work stoppage or strike.
Operations
A prolonged economic downturn could result in a reduction in our revenue, operating cash flows or result in our customers, counterparties, vendors or other service providers failing to perform under their contracts with us.
To the extent that the current economic downturn continues to affect the markets in which we operate, demand for power and power prices may remain depressed, our revenues and operating cash flows could be negatively impacted. In addition, challenges currently affecting the economy could cause our customers, counterparties, vendors and service providers to experience deteriorating credit and serious cash flow problems. As a result, these conditions could cause counterparties in the natural gas and power markets, particularly in the power derivative markets that we rely on for our hedging activities, to be unable to perform under existing contracts, or to withdraw from participation in those markets. If multiple parties withdraw from those markets, market liquidity may be threatened, which in turn could adversely impact our business. Additionally, these conditions may cause our counterparties to seek bankruptcy protection under Chapter 11 or liquidation under Chapter 7 of the Bankruptcy Code.
Our financial performance is impacted by price fluctuations in the wholesale power and natural gas markets and other market factors that are beyond our control.
Market prices for power, generation capacity, ancillary services and natural gas are unpredictable and fluctuate substantially. Unlike most other commodities, power can only be stored on a very limited basis and generally must be produced concurrently with its use. As a result, power prices are subject to significant volatility due to supply and demand imbalances, especially in the day-ahead and spot markets. Long- and short-term power and natural gas prices may also fluctuate substantially due to other factors outside of our control, including:
| • | increases and decreases in generation capacity in our markets, including the addition of new supplies of power as a result of the development of new power plants, expansion of existing power plants or additional transmission capacity; |
36
Table of Contents
Index to Financial Statements
| • | changes in power transmission or fuel transportation capacity constraints or inefficiencies; |
| • | power supply disruptions, including power plant outages and transmission disruptions; |
| • | Heat Rate risk; |
| • | weather conditions; |
| • | changes in the demand for power or in patterns of power usage, including the potential development of demand-side management tools and practices; |
| • | development of new fuels or new technologies for the production of power; |
| • | regulations and actions of the ISOs; and |
| • | federal and state power market and environmental regulation and legislation, including mandating a RPS or creating financial incentives, each resulting in new renewable energy generation capacity creating oversupply. |
These factors have caused our operating results to fluctuate in the past and will continue to cause them to do so in the future.
Our ability to manage our counterparty credit risk could adversely affect us.
Our customer and supplier counterparties may experience deteriorating credit. These conditions could cause counterparties in the natural gas and power markets, particularly in the power derivative markets that we rely on for our hedging activities, to withdraw from participation in those markets. If multiple parties withdraw from those markets, market liquidity may be threatened, which in turn could adversely impact our business. Additionally, these conditions may cause our counterparties to seek bankruptcy protection under Chapter 11 or liquidation under Chapter 7 of the Bankruptcy Code. Our credit risk may be exacerbated to the extent collateral held by us cannot be realized or is liquidated at prices not sufficient to recover the full amount of the derivative exposure due to us. There can be no assurance that any such losses or impairments to the carrying value of our financial assets would not materially and adversely affect our financial condition, results of operations and cash flows.
Accounting for our hedging activities may increase the volatility in our quarterly and annual financial results.
We engage in commodity-related marketing and price-risk management activities in order to economically hedge our exposure to market risk with respect to power sales from our power plants, fuel utilized by those assets and emission allowances. We generally attempt to balance our fixed-price physical and financial purchases, and sales commitments in terms of contract volumes and the timing of performance and delivery obligations through the use of financial and physical derivative contracts. These derivatives are accounted for in accordance with GAAP, which requires us to record all derivatives on the balance sheet at fair value unless they qualify for the normal purchase normal sale exemption. Changes in the fair value resulting from fluctuations in the underlying commodity prices are immediately recognized in earnings, unless the derivative qualifies for, and is designated as, cash flow hedge accounting treatment. Sudden commodity price movements could create financial losses. Whether a derivative qualifies for cash flow hedge accounting treatment depends upon it meeting specific criteria used to determine if the cash flow hedge is and will remain effective for the term of the derivative. Economic hedges will not necessarily qualify for cash flow hedge accounting treatment, or for economic hedges that currently qualify for cash flow hedge accounting treatment; we may lose cash flow hedge accounting treatment in the future if the forecasted transactions are no longer considered probable of occurring. As a result, we may be unable to accurately predict the impact that our risk management decisions may have on our quarterly and annual financial results.
37
Table of Contents
Index to Financial Statements
The use of hedging agreements may not work as planned or fully protect us and could result in financial losses.
We typically enter into hedging agreements, including contracts to purchase or sell commodities at future dates and at fixed prices, in order to manage our commodity price risks. These activities, although intended to mitigate price volatility, expose us to other risks. When we sell power forward, we may be required to post significant amounts of cash collateral or other credit support to our counterparties and we give up the opportunity to sell power at higher prices if spot prices are higher in the future. Further, if the values of the financial contracts change in a manner that we do not anticipate, or if a counterparty fails to perform under a contract, it could harm our financial condition, results of operations and cash flows.
We do not typically hedge the entire exposure of our operations against commodity price volatility. To the extent we do not hedge against commodity price volatility, our financial condition, results of operations and cash flows may be diminished based upon adverse movement in commodity prices.
Our results are subject to quarterly and seasonal fluctuations.
Our quarterly operating results have fluctuated in the past and may continue to do so in the future as a result of a number of factors (see Note 19 of the Notes to Consolidated Financial Statements for our 2009 and 2008 quarterly operating results), including:
| • | seasonal variations in power and natural gas prices and capacity payments; |
| • | seasonal fluctuations in weather, in particular unseasonable weather conditions; |
| • | production levels of hydroelectric power in the West; |
| • | variations in levels of production, including from both planned and unplanned outages; |
| • | availability of emissions credits; |
| • | natural disasters, wars, sabotage, terrorist acts, earthquakes, hurricanes and other catastrophic events; and |
| • | the completion of development and construction projects. |
In particular, a disproportionate amount of our total revenue has historically been realized during the third fiscal quarter and we expect this trend to continue in the future as demand for power in our markets peaks in our third fiscal quarter. If our total revenue were below seasonal expectations during that quarter, by reason of power plant operational performance issues, cool summers, or other factors, it could have a disproportionate effect on our annual operating results.
We rely on power transmission and natural gas distribution facilities owned and operated by other companies.
We depend on facilities and assets that we do not own or control for the transmission to our customers of the power produced by our power plants and the distribution of natural gas fuel to our power plants. If these transmission and distribution systems are disrupted or capacity on those systems is inadequate, our ability to sell and deliver power products or obtain fuel may be hindered. ISOs that oversee transmission systems in regional power markets have imposed price limitations and other mechanisms to address volatility in their power markets. Existing congestion, as well as expansion of transmission systems, could affect our performance.
38
Table of Contents
Index to Financial Statements
We may be unable to obtain an adequate supply of natural gas in the future at prices acceptable to us.
We obtain substantially all of our physical natural gas supply from third parties pursuant to arrangements that vary in term, pricing structure, firmness and delivery flexibility. Our physical natural gas supply arrangements must be coordinated with transportation agreements, balancing agreements, storage services, financial hedging transactions and other contracts so that the natural gas is delivered to our power plants at the times, in the quantities and otherwise in a manner that meets the needs of our generation portfolio and our customers. We must also comply with laws and regulations governing natural gas transportation.
While adequate supplies of natural gas are currently available to us at prices we believe are reasonable for each of our power plants, we are exposed to increases in the price of natural gas and it is possible that sufficient supplies to operate our portfolio profitably may not continue to be available to us. In addition, we face risks with regard to the delivery to and the use of natural gas by our power plants including the following:
| • | transportation may be unavailable if pipeline infrastructure is damaged or disabled; |
| • | pipeline tariff changes may adversely affect our ability to, or cost to, deliver natural gas supply; |
| • | third-party suppliers may default on natural gas supply obligations and we may be unable to replace supplies currently under contract; |
| • | market liquidity for physical natural gas or availability of natural gas services (e.g. storage) may be insufficient or available only at prices that are not acceptable to us; |
| • | natural gas quality variation may adversely affect our power plant operations; and |
| • | our natural gas operations capability may be compromised due to various events such as natural disaster, loss of key personnel or loss of critical infrastructure. |
Our revenues and results of operations depend on market rules, regulation and other forces beyond our control.
Our revenues and results of operations are influenced by factors that are beyond our control, including:
| • | rate caps, price limitations and bidding rules imposed by ISOs, Regional Transmission Organizations and other market regulators that may impair our ability to recover our costs and limit our return on our capital investments; and |
| • | some of our competitors’ (mainly utilities) entitlement-guaranteed rates of return on their capital investments, which returns may in some instances exceed market returns, may impact our ability to sell our power at economical rates. |
Our power generating operations performance involves significant risks and hazards and may be below expected levels of output or efficiency.
The operation of power plants involves risks, including the breakdown or failure of power generation equipment, transmission lines, pipelines or other equipment or processes, performance below expected levels of output or efficiency and risks related to the creditworthiness of our contract counterparties and the creditworthiness of our counterparties’ customers or other parties, such as steam hosts, with whom our counterparties have contracted. From time to time our power plants have experienced unplanned outages, including extensions of scheduled outages due to equipment breakdowns, failures or other problems and are an inherent risk of our business. Unplanned outages typically can result in lost revenues, increase our maintenance expenses and may reduce our profitability, which could have a material adverse effect on our financial condition, results of operations and cash flows.
39
Table of Contents
Index to Financial Statements
In addition, an unplanned outage may prevent the affected power plant from performing under any applicable PPAs, commodity contracts or other contractual arrangements. Such failure may allow a counterparty to terminate an agreement and/or seek liquidated damages. Although insurance is maintained to partially protect against operating risks, the proceeds of insurance may not be adequate to cover lost revenues or increased expenses. As a result, we could be unable to service principal and interest payments under, or may otherwise breach, our financing obligations, particularly with respect to the affected power plant, which could result in losing our interest in the affected power plant or, possibly, one or more other power plants.
Our power generating operations are inherently hazardous and may lead to catastrophic events, including loss of life, personal injury and destruction of property, and subject us to litigation.
Natural gas is highly explosive and power generation involves hazardous activities, including acquiring, transporting and delivering fuel, operating large pieces of rotating equipment and delivering power to transmission and distribution systems. These and other hazards can cause severe damage to and destruction of property, plant and equipment and suspension of operations. In the worst circumstances, catastrophic events can cause significant personal injury or loss of life. Further, the occurrence of any one of these events may result in us being named as a defendant in lawsuits asserting claims for substantial damages. We maintain an amount of insurance protection that we consider adequate; however, we cannot provide any assurance that the insurance will be sufficient or effective under all circumstances and against all hazards or liabilities to which we are subject. A successful claim against us that is not fully insured could have a material adverse effect on our financial condition, results of operations and cash flows.
Our power plants and development projects are subject to impairments.
If we were to experience a significant reduction in our expected revenues and operating cash flows for an extended period of time from a prolonged economic downturn or from advances or changes in technologies, we could experience future impairments of our power plant assets as a result. There can be no assurance that any such losses or impairments to the carrying value of our financial assets would not materially and adversely affect our financial condition, results of operations and cash flows.
Our power project development and construction activities involve risk and may not be successful.
The development and construction of power plants is subject to substantial risks. In connection with the development of a power plant, we must generally obtain:
| • | necessary power generation equipment; |
| • | governmental permits and approvals including environmental permits and approvals; |
| • | fuel supply and transportation agreements; |
| • | sufficient equity capital and debt financing; |
| • | power transmission agreements; |
| • | water supply and wastewater discharge agreements or permits; and |
| • | site agreements and construction contracts. |
To the extent that our development and construction activities continue or expand, we may be unsuccessful on a timely and profitable basis. Although we may attempt to minimize the financial risks of these activities by securing a favorable PPA and arranging adequate financing prior to the commencement of
40
Table of Contents
Index to Financial Statements
construction, the development of a power project may require us to expend significant cash sums for preliminary engineering, permitting, legal and other expenses before we can determine whether a project is feasible, economically attractive or financeable. The process for obtaining governmental permits and approvals is complicated and lengthy, often taking more than one year, and is subject to significant uncertainties. We may be unable to obtain all necessary licenses, permits, approvals and certificates for proposed projects, and completed power plants may not comply with all applicable permit conditions, statutes or regulations. In addition, regulatory compliance for the construction and operation of our power plants can be a costly and time-consuming process. Intricate and changing environmental and other regulatory requirements may necessitate substantial expenditures to obtain and maintain permits. If a project is unable to function as planned due to changing requirements, loss of required permits or regulatory status or local opposition, it may create expensive delays, extended periods of non-operation or significant loss of value in a project resulting in potential impairments.
Our geothermal power reserves may be inadequate for our operations.
In connection with each geothermal power plant, we estimate the productivity of the geothermal resource and the expected decline in productivity. The productivity of a geothermal resource may decline more than anticipated, resulting in insufficient reserves being available for sustained generation of the power capacity desired. In addition, we may not be able to successfully manage the development and operation of our geothermal reservoirs or accurately estimate the quantity or productivity of our steam reserves. An incorrect estimate or inability to manage our geothermal reserves, or a decline in productivity could adversely affect our results of operations or financial condition. In addition, the development and operation of geothermal power resources are subject to substantial risks and uncertainties. The successful exploitation of a geothermal power resource ultimately depends upon many factors including the following:
| • | the heat content of the extractable steam or fluids; |
| • | the geology of the reservoir; |
| • | the total amount of recoverable reserves; |
| • | operating expenses relating to the extraction of steam or fluids; |
| • | price levels relating to the extraction of steam, fluids or power generated; and |
| • | capital expenditure requirements relating primarily to the drilling of new wells. |
Claims that some geothermal power plants cause increased risk of seismic activity could impact our operating procedures and increase our operating costs or, delay or increase the cost of further development at The Geysers.
In 2009, as part of a joint private and federally-funded geothermal technology research project, a company unrelated to us commenced deepening an existing geothermal well on a property neighboring our Geysers Assets. The company was reportedly attempting to drill into the hot, low or non-permeable base rock that underlies the existing geothermal steam reservoir at The Geysers to engineer or create a “multilayered heat extraction system” below the reservoir by injecting water under very high pressure, fracturing the rock. This process has spawned public and political concern regarding increased seismicity risk. As a consequence, in July 2009, the Department of Energy temporarily halted funding of its portion of that research project pending further seismicity studies. Although our geothermal operations do not include attempts to engineer or create new reservoirs from hot, low or non-permeable rock, the concerns regarding induced seismicity from geothermal operations could delay or otherwise adversely impact our Department of Energy grant applications. Also, we have become aware of a letter and petition to the Board of Supervisors County of Lake from a local community homeowners association located near our Geysers Assets entitled a “Complaint and Petition” and signed by “109
41
Table of Contents
Index to Financial Statements
residents and property owners.” The letter asks for county intervention to abate alleged public nuisance arising from induced seismicity by governmental legal action, including litigation, regulation and ordinances to prevent induced seismicity; however, the letter also states it is not their intent to suspend our geothermal operations. It is possible that government entities or agencies will seek to more stringently regulate the exploration, development and operation of geothermal power plants, including operations of our Geysers Assets, in order to mitigate induced seismicity resulting from geothermal operations, or that operators of geothermal power plants could be subject to property damage claims resulting from increased seismic activity. Any of these events could increase the cost of operating the existing Geysers Assets and may delay or increase further exploration and any further development of our Geysers Assets.
Competition could adversely affect our performance.
The power generation industry is characterized by intense competition, and we encounter competition from utilities, industrial companies, marketing and trading companies, and other independent power producers. In addition, many states are implementing or considering regulatory initiatives designed to increase competition in the domestic power industry. This competition has put pressure on power utilities to lower their costs, including the cost of purchased power, and increasing competition in the supply of power in the future could increase this pressure. In addition, construction during the last decade has created excess power supply and higher reserve margins, which has led to tight liquidity in the power trading markets, putting downward pressure on prices.
Significant events beyond our control, such as natural disasters or acts of terrorism, could damage our power plants or our corporate offices and may impact us in unpredictable ways.
Certain of our geothermal and natural gas-fired power plants, particularly in the West, are subject to frequent low-level seismic disturbances. More significant seismic disturbances are possible. In addition, other areas in which we operate, particularly in Texas and the Southeast, experience tornados and hurricanes. Similarly, operations at our corporate offices in Houston, Texas could be substantially affected by a hurricane. Such events could damage or shut down our power plants, power transmission or the fuel supply facilities upon which our generation business is dependent. Our existing power plants are built to withstand relatively significant levels of seismic and other disturbances, and we believe we maintain adequate insurance protection. However, earthquake, property damage or business interruption insurance may be inadequate to cover all potential losses sustained in the event of serious damages or disturbances to our power plants or our operations due to natural disasters.
In addition to physical damage to our power plants, the risk of future terrorist activity could result in adverse changes in the insurance markets and disruptions in the power and fuel markets. These events could also adversely affect the U.S. economy, create instability in the financial markets and, as a result, have an adverse effect on our ability to access capital on terms and conditions acceptable to us.
We depend on our management and employees.
Our success is largely dependent on the skills, experience and efforts of our people. The loss of the services of one or more members of our senior management or of numerous employees with critical skills could have a negative effect on our business, financial condition and results of operations and future growth if we were unable to replace them. In addition, approximately 46 employees are represented by collective bargaining agreements.
In certain situations, our PPAs and other contractual arrangements, including construction agreements, commodity contracts, maintenance agreements and other arrangements, may be terminated by the counterparty and/or may allow the counterparty to seek liquidated damages.
The situations that could allow a counterparty to terminate the contract and/or seek liquidated damages include:
| • | the cessation or abandonment of the development, construction, maintenance or operation of a power plant; |
42
Table of Contents
Index to Financial Statements
| • | failure of a power plant to achieve construction milestones or commercial operation by agreed-upon deadlines; |
| • | failure of a power plant to achieve certain output or efficiency minimums; |
| • | our failure to make any of the payments owed to the counterparty or to establish, maintain, restore, extend the term of, or increase any required collateral; |
| • | failure of a power plant to obtain material permits and regulatory approvals by agreed-upon deadlines; |
| • | a material breach of a representation or warranty or our failure to observe, comply with or perform any other material obligation under the contract; or |
| • | events of liquidation, dissolution, insolvency or bankruptcy. |
Revenue may be reduced significantly upon expiration or termination of our PPAs.
Some of the power we generate from our existing portfolio is sold under long-term PPAs that expire at various times. We also sell power under short- to intermediate-term (one day to five years) PPAs. Our uncontracted capacity is generally sold on the spot market at current market prices as merchant energy. When the terms of each of our various PPAs expire, it is possible that the price paid to us for the generation of power under subsequent arrangements or on the spot market may be significantly less than the price that had been paid to us under the PPA. Power plants without long-term PPAs involve risk and uncertainty in forecasting future demand load for merchant sales because they are exposed to market fluctuations for some or all of their generating capacity and output. A significant under- or over-estimation of load requirements may increase our operating costs. Without the benefit of long-term PPAs, we may not be able to sell any or all of the power generated by these power plants at commercially attractive rates and these power plants may not be able to operate profitably.
Certain of our PPAs have values in excess of current market prices (measured over the next five years). The aggregate notional value of these PPAs is approximately $3.2 billion at December 31, 2009. Values for our long-term commodity contracts are calculated using discounted cash flows derived as the difference between contractually based cash flows and the cash flows to buy or sell similar amounts of the commodity on market terms. Inherent in these valuations are significant assumptions regarding future prices, correlations and volatilities, as applicable. The aggregate value of such contracts could decrease in response to changes in the market. We are at risk of loss in margins to the extent that these contracts expire or are terminated and we are unable to replace them on comparable terms. Additionally, our PPAs contain termination provisions standard to contracts in our industry such as negligence, performance default or prolonged events of force majeure.
We may be subject to claims that were not discharged in our Chapter 11 cases, which could have a material adverse effect on our results of operations and profitability.
On December 20, 2005 (the Petition Date), Calpine Corporation and 274 of its wholly owned U.S. subsidiaries filed for voluntary petitions of relief under Chapter 11 of the Bankruptcy Code. From the Petition Date through our emergence from Chapter 11 on the Effective Date (January 31, 2008), we operated as a debtor-in-possession under the protection of the U.S. Bankruptcy Court. In general, all claims that arose prior to the Petition Date and before confirmation of our Plan of Reorganization were discharged in accordance with the Bankruptcy Code and the terms of our Plan of Reorganization; however, there are certain exceptions. Circumstances in which claims and other obligations, that arose prior to the Petition Date, were not discharged primarily relate to certain actions by governmental units under police power authority or where we have agreed to preserve a claimant’s claims or a claimant has received court approval to proceed with their claim such as the settlement of the CalGen Third Lien Debt claims. The ultimate resolution of such claims and other obligations may have a material adverse effect on our results of operations and profitability.
43
Table of Contents
Index to Financial Statements
We depend on computer and telecommunications systems we do not own or control.
We have entered into agreements with third parties for hardware, software, telecommunications, and database services in connection with the operation of our power plants. In addition, we have developed proprietary software systems, management techniques and other information technologies incorporating software licensed from third parties. Any interruptions to our arrangements with third parties, to our computing and communications infrastructure, or our information systems could significantly disrupt our business operations.
Capital Resources; Liquidity
We have substantial liquidity needs and could face liquidity pressure.
As of December 31, 2009, our consolidated debt outstanding was $9.5 billion, of which approximately $4.7 billion was outstanding under our First Lien Credit Facility and $1.2 billion was outstanding under our First Lien Notes. In addition we had $412 million issued in letters of credit and our pro rata share of unconsolidated subsidiary debt was approximately $624 million. Although we have reduced our debt as a result of our reorganization, we could face liquidity challenges as we continue to have substantial debt and substantial liquidity needs in the operation of our business. Our ability to make payments on our indebtedness, to meet margin requirements and to fund planned capital expenditures and development efforts will depend on our ability to generate cash in the future from our operations and our ability to access the capital markets. This, to a certain extent, is dependent upon industry conditions, as well as general economic, financial, competitive, legislative, regulatory and other factors that are beyond our control, as discussed further in “— Operations” above. Our borrowing capacity under our existing credit facilities remains limited. Although we are permitted to enter into new project financing credit facilities to fund our development and construction activities and we are allowed to offer first lien notes in exchange for term loans under our First Lien Credit Facility under certain circumstances, there can be no assurance that we will not face liquidity pressure in the future. See additional discussion regarding our capital resources and liquidity in Item 7. “Management’s Discussion and Analysis of Financial Condition and Results of Operations — Liquidity and Capital Resources.”
Our substantial indebtedness could adversely impact our financial health and limit our operations.
Our level of indebtedness has important consequences, including:
| • | limiting our ability to borrow additional amounts for working capital, capital expenditures, debt service requirements, potential growth or other purposes; |
| • | limiting our ability to use operating cash flows in other areas of our business because we must dedicate a substantial portion of these funds to service our debt; |
| • | increasing our vulnerability to general adverse economic and industry conditions; |
| • | limiting our ability to capitalize on business opportunities, and to react to competitive pressures and adverse changes in governmental regulation; |
| • | limiting our ability or increasing the costs to refinance indebtedness or to repurchase equity issued by certain of our subsidiaries to third parties; and |
| • | limiting our ability to enter into marketing, hedging and optimization activities by reducing the number of counterparties with whom we can transact as well as the volume of those transactions. |
The soundness of financial institutions could adversely affect us.
We have exposure to many different financial institutions and counterparties including those under our First Lien Credit Facility and other credit and financing arrangements as we routinely execute transactions in
44
Table of Contents
Index to Financial Statements
connection with our hedging and optimization activities, including brokers and dealers, commercial banks, investment banks and other institutions and industry participants. Many of these transactions expose us to credit risk in the event that any of our lenders or counterparties are unable to honor their commitments or otherwise defaults under a financing agreement.
We may be unable to obtain additional financing or access the credit and capital markets in the future at prices that are beneficial to us or at all.
If our available cash, including future cash flows generated from operations, is not sufficient in the near term to finance our operations, post collateral or satisfy or refinance our obligations as they become due, we may need to access the capital and credit markets. Our ability to arrange financing (including any extension or refinancing) and the cost of the financing are dependent upon numerous factors, including general economic and capital market conditions. Market disruptions such as those experienced in the U.S. and abroad in 2008 and 2009, may increase our cost of borrowing or adversely affect our ability to access capital. In addition, we believe these conditions have and may continue to have an adverse effect on the price of our common stock, which in turn may also reduce our ability to access capital or credit markets. These disruptions may continue throughout 2010 or longer. Other factors include:
| • | low credit ratings may prevent us from obtaining any material amount of additional debt financing; |
| • | our restrictions against additional borrowing in our First Lien Credit Facility may limit additional indebtedness other than through refinancing outstanding debt, or through project financings where we are able to pledge the project assets as security; |
| • | conditions in power markets; |
| • | regulatory developments; |
| • | credit availability from banks or other lenders for us and our industry peers; |
| • | investor confidence in the industry and in us; |
| • | the continued reliable operation of our current power plants; and |
| • | provisions of tax, regulatory and securities laws that are conducive to raising capital. |
While we have utilized non-recourse or lease financing when appropriate, market conditions and other factors may prevent us from completing similar financings in the future. It is possible that we may be unable to obtain the financing required to develop, construct, acquire or expand power plants on terms satisfactory to us. We have financed our existing power plants using a variety of leveraged financing structures, including senior secured and unsecured indebtedness, construction financing, project financing, term loans and lease obligations. In the event of a default under a financing agreement which we do not cure, the lenders or lessors would generally have rights to the power plant and any related assets. In the event of foreclosure after a default, we may not be able to retain any interest in the power plant or other collateral supporting such financing. In addition, any such default or foreclosure may trigger cross default provisions in our other financing agreements.
Our First Lien Credit Facility, First Lien Notes and our other debt instruments impose significant restrictions on us and any failure to comply with these restrictions could have a material adverse effect on our liquidity and our operations.
The restrictions under our First Lien Credit Facility and First Lien Notes could adversely affect us by limiting our ability to plan for or react to market conditions or to meet our capital needs and, if we were unable to comply with these restrictions, could result in an event of default under our First Lien Credit Facility. These
45
Table of Contents
Index to Financial Statements
restrictions require us to meet certain financial performance tests on a quarterly basis and limit or prohibit our ability, subject to certain exceptions to, among other things:
| • | incur additional indebtedness and issue certain stock; |
| • | make prepayments on or purchase certain indebtedness in whole or in part; |
| • | pay dividends and other distributions with respect to our stock, or repurchase our stock or make other restricted payments; |
| • | use money borrowed under our First Lien Credit Facility for non-guarantors (including foreign subsidiaries); |
| • | make certain investments; |
| • | create or incur liens; |
| • | consolidate or merge with another entity, or allow one of our subsidiaries to do so; |
| • | lease, transfer or sell assets and use proceeds of permitted asset leases, transfers or sales; |
| • | pay dividends or make other distributions from certain subsidiaries up to Calpine Corporation; |
| • | make capital expenditures beyond specified limits; |
| • | engage in certain business activities; |
| • | enter into certain transactions with our affiliates; and |
| • | acquire power plants or other businesses. |
Our First Lien Credit Facility, First Lien Notes and our other debt instruments contain events of default customary for financings of their type, including a cross default to debt other than non-recourse project financing debt, a cross-acceleration to non-recourse project financing debt and certain change of control events. If we fail to comply with the covenants and are unable to obtain a waiver or amendment, or a default exists and is continuing under such debt, the lenders could give notice and declare outstanding borrowings and other obligations under such debt immediately due and payable.
Our ability to comply with these covenants may be affected by events beyond our control, and any material deviations from our forecasts could require us to seek waivers or amendments of covenants or alternative sources of financing or to reduce expenditures. We may not be able to obtain such waivers, amendments or alternative financing, or if obtainable, it could be on terms that are not acceptable to us. If we are unable to comply with the terms of our First Lien Credit Facility, First Lien Notes and our other debt instruments, or if we fail to generate sufficient cash flows from operations, or if it becomes necessary to obtain such waivers, amendments or alternative financing, it could adversely impact our financial condition, results of operations and cash flows.
A significant portion of our indebtedness contains floating rate interest provisions, which could impact our financial health if interest rates were to rise significantly.
A significant portion of our indebtedness contains floating rate interest, which we pay on a current basis. If we are unable to satisfy our obligations under our floating rate debt, particularly on our First Lien Credit
46
Table of Contents
Index to Financial Statements
Facility, it could result in defaults under our First Lien Credit Facility and other debt instruments. We manage our interest rate risk through the use of derivative instruments, including interest rate swaps. See also Item 7. “Management’s Discussion and Analysis of Financial Condition and Results of Operations — Risk Management and Commodity Accounting — Interest Rate Risk.”
Our credit status is below investment grade, which may restrict our operations, increase our liquidity requirements and restrict financing opportunities.
Our corporate and debt credit ratings are below investment grade. There is no assurance that our credit ratings will improve in the future, which may restrict the financing opportunities available to us or may increase the cost of any available financing. Our current credit rating has resulted in the requirement that we provide additional collateral in the form of letters of credit or cash for credit support obligations, and has had certain adverse impacts on our subsidiaries’ and our financial position and results of operations.
Certain of our obligations are required to be secured by letters of credit or cash, which increase our costs; if we are unable to provide such security it may restrict our ability to conduct our business.
Companies using derivatives, which include many commodity contracts, are subject to the inherent risks of such transactions. Consequently, many companies, including us, may be required to post cash collateral for certain commodity transactions; and, the level of collateral will increase as a company increases its hedging activities. We use margin deposits, prepayments and letters of credit as credit support for commodity procurement and risk management activities. Future cash collateral requirements may increase based on the extent of our involvement in standard contracts and movements in commodity prices, and also based on our credit ratings and general perception of creditworthiness in this market. Certain of our financing arrangements for our power plants have required us to post letters of credit which are at risk of being drawn down in the event we, or the applicable subsidiary, default on our obligations.
These letter of credit and cash collateral requirements increase our cost of doing business and could have an adverse impact on our overall liquidity, particularly if there was a call for a large amount of additional cash or letter of credit collateral due to an unexpectedly large movement in the market price of a commodity. As of December 31, 2009, we had $412 million issued in letters of credit under our First Lien Credit Facility and other facilities, with $794 million remaining available for borrowing or for letter of credit support under our First Lien Credit Facility. In addition, we have ratably secured our obligations under certain of our power and natural gas agreements that qualify as eligible commodity hedge agreements under our First Lien Credit Facility with the assets currently subject to liens under our First Lien Credit Facility.
We may not have sufficient liquidity to hedge market risks effectively.
We are exposed to market risks through our sale of power, capacity and related products and the purchase and sale of fuel, transmission services and emission allowances. These market risks include, among other risks, volatility arising from location and timing differences that may be associated with buying and transporting fuel, converting fuel into power and delivering the power to a buyer.
We undertake these activities through agreements with various counterparties, many of which require us to provide guarantees, offset or netting arrangements, letters of credit, a second lien on assets and/or cash collateral to protect the counterparties against the risk of our default or insolvency. The amount of such credit support that must be provided typically is based on the difference between the price of the commodity in a given contract and the market price of the commodity. Significant movements in market prices can result in our being required to provide cash collateral and letters of credit in very large amounts. The effectiveness of our strategy may be dependent on the amount of collateral available to enter into or maintain these contracts, and liquidity requirements may be greater than we anticipate or will be able to meet. Without a sufficient amount of working capital to post as collateral in support of performance guarantees or as a cash margin, we may not be able to
47
Table of Contents
Index to Financial Statements
manage price volatility effectively or to implement our strategy. An increase in the amount of letters of credit or cash collateral required to be provided to our counterparties may negatively affect our liquidity and financial condition.
Further, if any of our power plants experience unplanned outages, we may be required to procure replacement power at spot market prices in order to fulfill contractual commitments. Without adequate liquidity to meet margin and collateral requirements, we may be exposed to significant losses, may miss significant opportunities and may have increased exposure to the volatility of spot markets.
Our ability to receive future cash flows generated from the operation of our subsidiaries may be limited.
Almost all of our operations are conducted through our subsidiaries and other affiliates. As a result, we depend almost entirely upon their earnings and cash flows to service our indebtedness, post collateral and finance our ongoing operations. Certain of our project debt and other agreements restrict our ability to receive dividends and other distributions from our subsidiaries. Some of these limitations are subject to a number of significant exceptions (including exceptions permitting such restrictions in connection with certain subsidiary financings). Accordingly, the financing agreements of certain of our subsidiaries and other affiliates generally restrict their ability to pay dividends, make distributions, or otherwise transfer funds to us prior to the payment of their other obligations, including their outstanding debt, operating expenses, lease payments and reserves, or during the existence of a default.
We may utilize project financing, preferred equity and other types of subsidiary financing transactions when appropriate in the future, which could increase our debt and may be structurally senior to other debt such as our First Lien Credit Facility and our First Lien Notes.
Our ability and the ability of our subsidiaries to incur additional indebtedness are limited in some cases by existing indentures, debt instruments or other agreements. Our subsidiaries may incur additional construction/project financing indebtedness, issue preferred equity to finance the acquisition and development of new power plants and engage in certain types of non-recourse financings to the extent permitted by existing agreements, and may continue to do so in order to fund our ongoing operations. Any such newly incurred subsidiary preferred equity would be added to our current consolidated debt levels and would likely be structurally senior to our debt, which could also intensify the risks associated with our already substantial leverage.
Our First Lien Credit Facility, First Lien Notes and other parent-company debt is effectively subordinated to certain project indebtedness.
Certain of our subsidiaries and other affiliates are separate and distinct legal entities and, except in limited circumstances, have no obligation to pay any amounts due with respect to our indebtedness or indebtedness of other subsidiaries or affiliates, and do not guarantee the payment of interest on or principal of such indebtedness. In the event of our bankruptcy, liquidation or reorganization (or the bankruptcy, liquidation or reorganization of a subsidiary or affiliate), such subsidiaries’ or other affiliates’ creditors, including trade creditors and holders of debt issued by such subsidiaries or affiliates, will generally be entitled to payment of their claims from the assets of those subsidiaries or affiliates before any assets are made available for distribution to us or the holders of our indebtedness. As a result, holders of our indebtedness will be effectively subordinated to all present and future debts and other liabilities (including trade payables) of certain of our subsidiaries. As of December 31, 2009, our subsidiaries had approximately $1.6 billion of secured project financing and approximately $1.0 billion in debt from our CCFC subsidiary, which are effectively senior to our First Lien Credit Facility, First Lien Notes and other parent-company debt. We may incur additional project financing indebtedness in the future, which will be effectively senior to our other secured and unsecured debt.
48
Table of Contents
Index to Financial Statements
Governmental Regulation
Existing and future anticipated GHG/Carbon legislation could adversely affect our operations.
Environmental laws and regulations have generally become more stringent over time, and this trend is likely to continue. In particular, there is growing likelihood that carbon tax or limits on carbon, CO2 and other GHG emissions will be implemented at the federal or expanded at the state or regional levels.
In 2009, ten states in the northeast began the compliance period of a cap-and-trade program, RGGI, to regulate CO2 emissions from power plants. California is in the process of creating implementation plans for Assembly Bill 32 which places a statewide cap on GHG emissions and requires the state to return to 1990 emission levels by 2020.
In 2008, there were several bills introduced in the U.S. Congress concerning climate change. On June 26, 2009, the House of Representatives passed The American Clean Energy and Security Act of 2009, a climate change and clean energy bill, which, among other provisions, would establish an economy-wide carbon cap-and-trade program and set carbon emission reduction targets in several sectors of the economy, including the power sector. For the power sector, 2012 is set as the initial year for compliance. On October 23, 2009, draft climate change legislation entitled the Clean Energy Jobs and American Power Act, was released in the Senate. The legislation is similar to The American Clean Energy and Security Act of 2009 in that it also includes, among other provisions, an economy-wide carbon cap-and-trade program.
If either bill were to become law, we would have the obligation to obtain emissions allowances for the operation of our fossil-fuel power plants. While we expect the costs to acquire allowances to be a factor that will impact market price, there can be no assurance that market price will fully reflect these costs which could adversely affect our Commodity Margin. With respect to our existing long-term steam and power contracts under which we would not be able to recover costs to acquire allowances from our customers, the bill allocates a pool of free allowances to generators with qualifying contracts to mitigate such costs. However, there can be no assurance there will be a sufficient number of free allowances in the pool to fully cover emissions related to generation under such contracts which could adversely impact our Commodity Margin.
Although we cannot predict the effect and ultimate content of final climate change legislation and regulations, if any, on our business, we continue to expect climate change legislation efforts to proceed at the federal level, and that proposed legislation will take the form of a cap-and-trade program, although it is possible that legislation may take other forms, such as a carbon tax on each unit of CO2 or GHG emitted in excess of mandated limits. As a result of requirements for GHG emissions reduction, we could be required under any climate change legislation or related regulations ultimately enacted to purchase allowances or offsets to emit GHGs or other regulated pollutants or to pay taxes on such emissions. These requirements, as well as the possibility that market or contract prices will not fully reflect costs of compliance, or that we may not be able to obtain free allowances or recoup our costs to obtain allowances or to reduce emissions, could have a material impact on our financial condition, results of operations and cash flows.
Existing and proposed federal and state RPS and energy efficiency, as well as economic support for renewable sources of power under the U.S economic stimulus legislation could adversely impact our operations.
Federal policymakers have been considering imposing a national RPS on retail power providers. California already has an RPS in effect and is currently considering new and higher RPS. A number of additional states, including Maine, Minnesota, New York, Texas and Wisconsin, have an array of different RPS in place. Existing state-specific RPS requirements may change due to regulatory and/or legislative initiatives, and other states may consider implementing enforceable RPS in the future. A national RPS or more robust RPS in states in which we are active, coupled with economic incentives provided under the federal stimulus package, would
49
Table of Contents
Index to Financial Statements
likely initially drive up the number of wind and solar resources, increasing power supply to various markets which could negatively impact the dispatch of our natural gas assets, primarily in Texas and California.
Similarly, federal legislators are considering national energy efficiency initiatives. Several states already have energy efficiency initiatives in place while others are considering imposing them. Improved energy efficiency when mandated by law or promoted by government sponsored incentives can decrease demand for power which could negatively impact the dispatch of our gas assets, primarily in Texas and California.
Proposed financial reform relating to derivative transactions, as well as certain financial institutions, could have an adverse impact on our ability to hedge risks associated with our business.
The CFTC has regulatory oversight of the futures markets, including trading on NYMEX for energy, and licensed futures professionals such as brokers, clearing members and large traders. In connection with its oversight of the futures markets and NYMEX, the CFTC regularly investigates market irregularities and potential manipulation of those markets. Recent laws also give the CFTC certain powers with respect to broker-type markets referred to as “exempt commercial markets” or ECMs, including the Intercontinental Exchange. The CFTC monitors activities in the OTC, ECM, and physical markets that may be undertaken for the purpose of influencing futures prices. With respect to ECMs, the CFTC exercises only light-handed regulation primarily related to price reporting and record retention. Thus, transactions executed on an ECM generally are not regulated directly by the CFTC. However, ECM transactions have come under the CFTC’s scrutiny during investigations of fraud and manipulation in which the CFTC has broadly applied its statutory authority to punish persons who are alleged to have manipulated, or attempted to manipulate, the price of any commodity in interstate commerce or for future delivery.
On December 11, 2009, the House of Representatives passed the Wall Street Financial Reform and Consumer Protection Act of 2009. The legislation includes provisions to regulate certain types of OTC derivatives that we use. Included in the bill is a provision which clarifies the definition of a “major swap participant” that would otherwise have left it to future CFTC interpretation and definition which could have put more end users, such as us, under mandatory clearing, position limits and margin despite an end user exemption in the underlying bill.
The Senate Banking Committee is attempting to work in a bipartisan manner to craft comprehensive financial reform legislation. The committee has organized bipartisan working groups to address various aspects of reform. The Senate Agriculture Committee also continues to work on drafting bipartisan legislation.
In January 2010, the Obama Administration requested Congress to place new restrictions on financial institutions as part of comprehensive financial reform legislation. Specifically, the Obama Administration is requesting that “no bank or financial institution that contains a bank will own, invest in or sponsor a hedge fund or a private equity fund, or proprietary trading operations unrelated to serving customers for its own profit.” If enacted into law, banks would be banned from owning trading operations that trade in physical and financial derivative energy products. As several major financial institutions own such trading operations and provide significant liquidity to the energy markets in which we participate, if this or similar legislation is enacted the pricing and availability of derivative transactions related to our hedging activity could be adversely impacted.
Changes in the regulation of the power markets in which we operate could negatively impact us.
We have a significant presence in the major competitive power markets for California and Texas. While these markets are largely de-regulated, these markets continue to evolve. In 2009, implementation of CAISO’s Market Redesign and Technology Upgrade in California had a neutral to slightly positive impact on our operations. Existing regulations within the markets in which we operate may be revised or reinterpreted and new laws or regulations may be issued. We cannot predict the future development of regulation or legislation nor the ultimate effect such changes in these markets could have on our business; however, we could be negatively impacted.
50
Table of Contents
Index to Financial Statements
We are subject to other complex governmental regulation which could adversely affect our operations.
Generally, in the U.S., we are subject to regulation by FERC regarding the terms and conditions of wholesale service and the sale and transportation of natural gas, as well as by state agencies regarding physical aspects of the power plants. The majority of our generation is sold at market prices under the market-based rate authority granted by the FERC. If certain conditions are not met, FERC has the authority to withhold or rescind market-based rate authority and require sales to be made based on cost-of-service rates. A loss of our market-based rate authority could have a materially negative impact on our generation business. FERC could also impose fines or other restrictions or requirements on us under certain circumstances.
The construction and operation of power plants require numerous permits, approvals and certificates from the appropriate foreign, federal, state and local governmental agencies, as well as compliance with numerous environmental laws and regulations of federal, state and local authorities. Should we fail to comply with any environmental requirements that apply to power plant construction or operations, we could be subject to administrative, civil and/or criminal liability and fines, and regulatory agencies could take other actions to curtail our operations.
Furthermore, certain environmental laws impose strict, joint and several liability for costs required to clean up and restore sites where hazardous substances have been disposed or otherwise released. We are generally responsible for all liabilities associated with the environmental condition of our power plants, including any soil or groundwater contamination that may be present, regardless of when the liabilities arose and whether the liabilities are known or unknown, or arose from the activities of predecessors or third parties.
If we were deemed to have market power in certain markets as a result of the ownership of our stock by certain significant shareholders, we could lose FERC authorization to sell power at wholesale at market-based rates in such markets or be required to engage in mitigation in those markets.
Certain of our significant shareholder groups own power generating assets, or own significant equity interests in entities with power generating assets, in markets where we currently own power plants. FERC has ruled that we do not have market power as a consequence of their ownership of our common stock. However, we could be determined to have market power if these existing significant shareholders acquire additional significant ownership or equity interest in other entities with power generating assets in the same markets where we generate and sell power.
If FERC makes the determination that we have market power, FERC could, among other things, revoke market-based rate authority for the affected market-based companies or order them to mitigate that market power. If market-based rate authority were revoked for any of our market-based rate companies, those companies would be required to make wholesale sales of power based on cost-of-service rates, which could negatively impact their revenues. If we are required to mitigate market power, we could be required to sell certain power plants in regions where we are determined to have market power. A loss of our market-based rate authority or required sales of power plants, particularly if it affected several of our power plants or was in a significant market such as California, could have a material negative impact on our financial condition, results of operations and cash flows.
Risks Relating to Our Common Stock
Our principal shareholders own a significant amount of our common stock, giving them influence over corporate transactions and other matters.
Four holders (or related groups of holders) of our common stock have made filings with the SEC reporting beneficial ownership, directly or indirectly, individually or as members of a group, of 5% or more of the shares of our common stock. These shareholders, who together beneficially owned approximately 53% of our common stock at December 31, 2009, may be able to exercise substantial influence over all matters requiring
51
Table of Contents
Index to Financial Statements
shareholder approval, including the election of directors and approval of significant corporate action, such as mergers and other business combination transactions. If two or more of these shareholders (or groups of shareholders) vote their shares in the same manner, their combined stock ownership may effectively give significant influence over the election of our entire Board of Directors and significant influence over our management, operations and affairs. Currently, two members of our Board of Directors, including the Chairman of our Board, are affiliated, directly or indirectly, with SPO Advisory Corp., one of these shareholders.
Circumstances may occur in which the interests of these shareholders could be in conflict with the interests of other shareholders. This concentration of ownership may also have the effect of delaying or preventing a change in control over us unless it is supported by these shareholders. Accordingly, your ability to influence us through voting your shares may be limited or the market price of our common stock may be adversely affected. Additionally, we have filed a registration statement on Form S-3 registering the resale of the common stock held by certain members of two of the four groups of these shareholders, which permits them to sell a large portion of their shares of common stock without being subject to the “trickle out” or other restrictions of Rule 144 under the Securities Act. During 2009, one of these shareholders, who had reported holdings of greater than 10% of our securities as of January 1, 2009, elected to sell approximately 67 million shares in a series of offerings and market transactions during 2009, bringing its shareholdings below 10% of our common stock. These sales, and additional sales by the other three shareholders of all or a substantial portion of their shares within a short period of time, could adversely affect the market price of our common stock or could further concentrate holdings of our common stock in the remaining three shareholders who hold more than 5% of our common stock.
Transfers of our equity, or issuances of equity, may impair our ability to utilize our federal income tax NOL carryforwards in the future.
Under federal income tax law, our NOL carryforwards can be utilized to reduce future taxable income subject to certain limitations, including if we were to undergo an ownership change as defined by Section 382 of the IRC. We experienced an ownership change on the Effective Date as a result of the cancellation of our old common stock and the distribution of our new common stock pursuant to our Plan of Reorganization. However, this ownership change and resulting annual limitations are not expected to result in the expiration of our NOL carryforwards if we are able to generate sufficient future taxable income within the carryforward periods. If a subsequent ownership change were to occur as a result of future transactions in our stock, accompanied by a significant reduction in our market value immediately prior to the ownership change, our ability to utilize the NOL carryforwards may be significantly limited.
To manage the risk of significant limitations on our ability to utilize our tax NOL carryforwards, our amended and restated certificate of incorporation permits our Board of Directors to meet to determine whether to impose certain transfer restrictions on our common stock in the following circumstances: if, prior to February 1, 2013, our Market Capitalization declines by at least 35% from our Emergence Date Market Capitalization of approximately $8.6 billion (in each case, as defined in and calculated pursuant to our amended and restated certificate of incorporation) and at least 25 percentage points of shift in ownership has occurred with respect to our equity for purposes of Section 382 of the IRC. We believe, as of the filing of this Report, we have experienced declines in our stock price of more than 35% from our Emergence Date Market Capitalization. While we don’t believe an ownership change of 25 percentage points has occurred, the change in ownership is only slighty less than 25%. Accordingly, the transfer restrictions have not been put in place by our Board of Directors; however, if both of the foregoing events were to occur together and our Board of Directors were to elect to impose them, they could become operative in the future. There can be no assurance that the circumstances will not be met in the future, or in the event that they are met, that our Board of Directors would choose to impose these restrictions or that, if imposed, such restrictions would prevent an ownership change from occurring.
52
Table of Contents
Index to Financial Statements
Item 1B. Unresolved Staff Comments
None.
Our principal executive offices are located in Houston, Texas. This facility is leased until 2013. We also have a regional office in Dublin, California, an engineering office in La Porte, Texas and representative offices in Washington D.C., Sacramento, California and Austin, Texas.
We either lease or own the land upon which our power plants are built. We believe that our properties are adequate for our current operations. A description of our power plants is included under Item 1. “Business —Description of Our Power Plants.”
See Note 17 of the Notes to Consolidated Financial Statements for a description of our legal proceedings.
Item 4. Submission of Matters to a Vote of Security Holders
None.
53
Table of Contents
Index to Financial Statements
Item 5. Market for Registrant’s Common Equity, Related Stockholder Matters and Issuer Purchases of Equity Securities
Market Information and Stockholder Matters
On January 31, 2008, pursuant to our Plan of Reorganization, our previously outstanding common stock was canceled and we authorized and began issuance of 485 million shares of reorganized Calpine Corporation common stock to settle unsecured claims pursuant to our Plan of Reorganization. On January 16, 2008, the shares of reorganized Calpine Corporation common stock were admitted to listing on the NYSE and began “when issued” trading under the symbol “CPN-WI.” The reorganized Calpine Corporation common stock began “regular way” trading on the NYSE under the symbol “CPN” on February 7, 2008.
The following table sets forth the high and low bid prices for our common stock for each quarter of the calendar years 2009 and 2008, as reported on the NYSE.
| High | Low | |||||
| 2009 |
||||||
| First Quarter |
$ | 9.34 | $ | 4.76 | ||
| Second Quarter |
14.95 | 6.64 | ||||
| Third Quarter |
13.75 | 10.10 | ||||
| Fourth Quarter |
12.25 | 10.14 | ||||
| 2008 |
||||||
| First Quarter |
$ | 19.51 | $ | 15.00 | ||
| Second Quarter |
23.36 | 17.77 | ||||
| Third Quarter |
22.83 | 12.08 | ||||
| Fourth Quarter |
13.48 | 6.35 | ||||
As of December 31, 2009, there were 114 stockholders on record of our common stock. See Note 16 of the Notes to Consolidated Financial Statements for a discussion of the effects of emergence from Chapter 11 on our capital structure.
To manage the risk of significant limitations on our ability to utilize our tax NOL carryforwards, our amended and restated certificate of incorporation permits our Board of Directors to meet to determine whether to impose certain transfer restrictions on our common stock in the following circumstances: if, prior to February 1, 2013, our Market Capitalization declines by at least 35% from our Emergence Date Market Capitalization of approximately $8.6 billion (in each case as defined and calculated pursuant to our amended and restated certificate of incorporation) and at least 25 percentage points of shift in ownership has occurred with respect to our equity for purposes of Section 382 of the IRC. We believe, as of the filing of this Report, we have experienced declines in our stock price of more than 35% from our Emergence Date Market Capitalization. While we don’t believe an ownership change of 25 percentage points has occurred, the change in ownership is only slightly less than 25%. Accordingly, the transfer restrictions have not been put in place by our Board of Directors; however, if both of the foregoing events were to occur together and our Board of Directors were to elect to impose them, they could become operative in the future. There can be no assurance that the circumstances will not be met in the future, or in the event that they are met, that our Board of Directors would choose to impose these restrictions or that, if imposed, such restrictions would prevent an ownership change from occurring.
Should our Board of Directors elect to impose these restrictions, they shall have the authority and discretion to determine and establish the definitive terms of the transfer restrictions provided that they apply to purchases by owners of 5% or more of our common stock including any owners who would become owners of 5% or more of our common stock via such purchase. The transfer restrictions will not apply to the disposition of
54
Table of Contents
Index to Financial Statements
shares provided they are not purchased by a 5% or more owner. If these transfer restrictions are imposed, any increase in the value of our common stock shall not result in the lapse of the transfer restrictions unless the increase in value of our common stock (determined on a weighted average 30-day trading period) shall be at least 10% greater than the trigger price. Our Board of Directors’ ability to impose transfer restrictions will terminate on the fifth anniversary of our Emergence Date; however, any transfer restrictions imposed prior to such fifth anniversary will remain in effect until one of the trigger provisions is no longer satisfied.
We have never paid cash dividends on our common stock. As our ability to pay cash dividends on our common stock is restricted under our First Lien Credit Facility and certain of our other debt agreements, it is not anticipated that any cash dividends will be paid on our common stock in the near future. Future cash dividends, if any, will be at the discretion of our Board of Directors and will depend upon, among other things, our future operations and earnings, capital requirements, general financial condition, contractual and financing restrictions and such other factors as our Board of Directors may deem relevant. See Item 1A. “Risk Factors,” including “— Risks Relating to Our Common Stock” for a discussion of additional risks related to an investment in our common stock.
Repurchase of Equity Securities — Upon vesting of restricted stock awarded by us to employees, we withhold shares to cover employees’ tax withholding obligations, other than for employees who have chosen to make tax withholding payments in cash. We withheld a total of 262,540 shares during 2009 that are included in treasury stock. We do not have a stock repurchase program. As set forth in the table below, we withheld 240 shares during the fourth quarter of 2009.
| Period |
(a) Total Number of Shares Purchased |
(b) Average Price Paid Per Share |
(c) Total Number of Shares Purchased as Part of Publicly Announced Plans or Programs |
(d) Maximum Number of Shares That May Yet Be Purchased Under the Plans or Programs | |||||
| November |
100 | $ | 10.97 | — | n/a | ||||
| December |
140 | $ | 11.23 | — | n/a | ||||
| Total |
240 | $ | 11.12 | — | n/a | ||||
55
Table of Contents
Index to Financial Statements
Stock Performance Graph
The performance graph below compares cumulative return on our common stock for the period February 7, 2008 through December 31, 2009, with the cumulative return of Standard & Poor’s 500 Index (S&P 500) and the S&P 500 Utility Index. Since the reorganized Calpine Corporation common stock began “regular way” trading on the NYSE on February 7, 2008, stock performance prior to February 7, 2008 does not provide meaningful comparison and has not been provided.
The graph below compares each period assuming that $100 was invested on February 7, 2008 in our common stock and each of above indices and that all dividends are reinvested. The returns shown below may not be indicative of future performance.
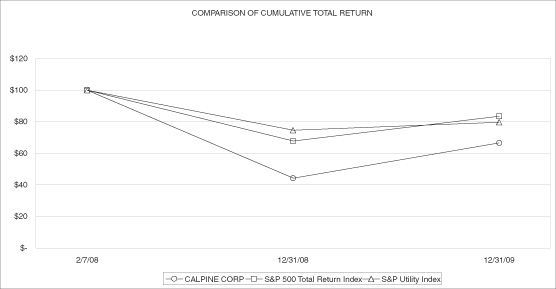
| Company / Index |
February 7, 2008 | December 31, 2008 | December 31, 2009 | ||||||
| Calpine Corporation |
$ | 100 | $ | 43.86 | $ | 66.27 | |||
| S&P 500 Index |
100 | 67.56 | 83.41 | ||||||
| S&P Utility Index |
100 | 74.38 | 79.44 | ||||||
Copyright© 2010 Standard & Poor’s, Inc., Zacks Investments Research, Inc., All rights reserved
56
Table of Contents
Index to Financial Statements
Item 6. Selected Financial Data
SELECTED CONSOLIDATED FINANCIAL DATA
| Years Ended December 31, | ||||||||||||||||||
| 2009 | 2008 | 2007 | 2006 | 2005 | ||||||||||||||
| (in millions, except earnings (loss) per share) | ||||||||||||||||||
| Statement of Operations data: |
||||||||||||||||||
| Operating revenues |
$ | 6,564 | $ | 9,937 | $ | 7,970 | $ | 6,937 | $ | 10,302 | ||||||||
| Income (loss) before discontinued operations attributable to Calpine(1) |
$ | 149 | $ | (13 | ) | $ | 2,693 | $ | (1,765 | ) | $ | (9,881 | ) | |||||
| Discontinued operations, net of tax, attributable to Calpine |
— | 23 | — | — | (58 | ) | ||||||||||||
| Net income (loss) attributable to Calpine(1) |
$ | 149 | $ | 10 | $ | 2,693 | $ | (1,765 | ) | $ | (9,939 | ) | ||||||
| Basic earnings (loss) per common share(2): |
||||||||||||||||||
| Income (loss) before discontinued operations attributable to Calpine (1) |
$ | 0.31 | $ | (0.03 | ) | $ | 5.62 | $ | (3.68 | ) | $ | (21.32 | ) | |||||
| Discontinued operations, net of tax, attributable to Calpine |
— | 0.05 | — | — | (0.12 | ) | ||||||||||||
| Net income (loss) per common share attributable to Calpine(1) |
$ | 0.31 | $ | 0.02 | $ | 5.62 | $ | (3.68 | ) | $ | (21.44 | ) | ||||||
| Diluted earnings (loss) per common share(2): |
||||||||||||||||||
| Income (loss) before discontinued operations attributable to Calpine (1) |
$ | 0.31 | $ | (0.03 | ) | $ | 5.62 | $ | (3.68 | ) | $ | (21.32 | ) | |||||
| Discontinued operations, net of tax, attributable to Calpine |
— | 0.05 | — | — | (0.12 | ) | ||||||||||||
| Net income (loss) per common share attributable to Calpine(1) |
$ | 0.31 | $ | 0.02 | $ | 5.62 | $ | (3.68 | ) | $ | (21.44 | ) | ||||||
| Balance Sheet data(3): |
||||||||||||||||||
| Total assets |
$ | 16,650 | $ | 20,738 | $ | 19,050 | $ | 18,590 | $ | 20,545 | ||||||||
| Short-term debt and capital lease obligations(4) |
463 | 716 | 1,710 | 4,569 | 5,414 | |||||||||||||
| Long-term debt and capital lease obligations(4)(5) |
8,996 | 9,756 | 9,946 | 3,352 | 2,462 | |||||||||||||
| Liabilities subject to compromise(5) |
— | — | 8,788 | 14,757 | 14,610 | |||||||||||||
| (1) | As a result of our Chapter 11 and CCAA filings, for the year ended December 31, 2005, we recorded $5.0 billion of reorganization items primarily related to the provisions for expected allowed claims, impairment of our Canadian subsidiaries, guarantees, write-off of unamortized deferred financing costs and losses on terminated contracts. During 2007, we were released from a portion of our direct and indirect Canadian guarantee of the ULC I notes, ULC II notes and redundant Canadian claims and recorded a $4.1 billion credit for the reversal of these redundant claims. |
| (2) | Although earnings (loss) per share information for the years ended December 31, 2007, 2006 and 2005 is presented, it is not comparable to the information presented for the years ended December 31, 2009 and 2008, due to the changes in our capital structure on the Effective Date, which also included termination of all outstanding convertible securities. |
| (3) | See Note 16 of the Notes to Consolidated Financial Statements regarding certain “plan effect” adjustments to our Consolidated Balance Sheet as of the Effective Date. |
| (4) | As a result of our Chapter 11 filings, we reclassified approximately $5.1 billion of long-term debt and capital lease obligations to short-term at December 31, 2006 and 2005, as our Chapter 11 filings constituted |
57
Table of Contents
Index to Financial Statements
| events of default or otherwise triggered repayment obligations for the Calpine Debtors and certain Non-Debtor entities. We classified our long-term debt and capital lease obligations at December 31, 2007, based upon the refinanced terms of our First Lien Facilities. |
| (5) | LSTC included unsecured and under secured liabilities incurred prior to the Petition Date and excluded liabilities that are fully secured or liabilities of our subsidiaries or affiliates that did not make Chapter 11 filings and other approved payments such as taxes and payroll. As a result of our Chapter 11 filings, we reclassified approximately $7.5 billion of long-term debt to LSTC at December 31, 2005. We subsequently reclassified $3.7 billion from LSTC back to long-term debt based upon the terms of our Plan of Reorganization at December 31, 2007. See Note 16 of the Notes to Consolidated Financial Statements for more information. |
Item 7. Management’s Discussion and Analysis of Financial Condition and Results of Operations
Forward-Looking Information
This Management’s Discussion and Analysis of Financial Condition and Results of Operations should be read in conjunction with our accompanying Consolidated Financial Statements and related notes. See the cautionary statement regarding forward-looking statements on page 1 of this Report for a description of important factors that could cause actual results to differ from expected results. See also Item 1A. “Risk Factors.”
INTRODUCTION AND OVERVIEW
Our Business
We are the largest independent wholesale power company in the U.S. measured by power produced. We own and operate natural gas-fired and geothermal power plants in North America and have a significant presence in major competitive power markets in the U.S., including California and Texas, and to a lesser extent, in the competitive PJM, ISO NE and NYISO markets. We sell wholesale power, steam, capacity, renewable energy credits and ancillary services to our customers, including utilities, independent electric system operators, industrial and agricultural companies, retail power providers, municipalities, power marketers and others. We purchase natural gas as fuel for our power plants, engage in related natural gas transportation and storage transactions and we purchase electric transmission rights to deliver power to our customers. We also enter into natural gas and power-related commodity and derivative transactions to financially hedge certain business risks and optimize our portfolio of power plants. Our goal is to be recognized as the premier independent power company in the U.S. as measured by our customers, regulators, shareholders and communities in which our power plants reside. We seek to achieve sustainable growth through financially disciplined power plant development, construction, operations and ownership.
Our portfolio, including partnership interests, consists of 77 operating power plants, located throughout 16 states and Canada, with an aggregate generation capacity of approximately 24,802 MW. It is comprised of two types of power generation technologies: natural gas-fired combustion turbines, which are primarily combined-cycle plants, and renewable geothermal conventional steam turbines. We are among the world’s largest owners and operators of industrial gas turbines as well as cogeneration power plants. Our Geysers Assets located in northern California represent the largest geothermal power generation portfolio in the U.S. and produced approximately 21% of all renewable energy produced in the state of California during 2008. Geothermal energy is one of the only baseload renewable energy supplies that exists today.
We assess our business on a regional basis due to the impact on our financial performance of the differing characteristics of these regions, particularly with respect to competition, regulation and other factors impacting supply and demand. Our reportable segments are West (including geothermal), Texas, Southeast and North (including Canada). In these segments we have an aggregate generation capacity of 7,910 MW in the West, 7,392 MW in Texas, 6,083 MW in the Southeast and 3,417 MW in the North. Our Geysers Assets, included in our West segment, have generation capacity of approximately 725 MW from 15 operating power plants.
58
Table of Contents
Index to Financial Statements
We remain focused on increasing our earnings and generating cash flow sufficient to maintain adequate levels of liquidity in order to service our debt, meet our collateral needs and fund our operations and growth. We will continue to pursue opportunities to improve our fleet performance and reduce operating costs. In order to manage our various physical assets and contractual obligations, we will continue to execute commodity hedging agreements within the guidelines of our commodity risk policy.
Our Regulatory and Environmental Profile
We are subject to complex and stringent energy, environmental and other governmental laws and regulations at the federal, state and local levels in connection with the development, ownership and operation of our power plants. Federal and state legislative and regulatory actions continue to change how our business is regulated. The federal government is expected to take action on climate change legislation, as well as other air pollutant emissions, and many states and regions in the U.S. have implemented or are considering implementing regulations to reduce GHG emissions. We are actively participating in these debates at the federal, regional and state levels. For a further discussion of the environmental and other governmental regulations that affect us, see “— Governmental and Regulatory Matters” in Item 1. of this Report. Although we cannot predict the ultimate effect future climate change legislation or regulations could have on our business, we believe that we will be less adversely impacted by potential cap-and-trade limits, carbon taxes or required environmental upgrades as a result of future potential regulation or legislation addressing GHG, other air emissions, as well as water use or emissions, than compared to our competitors who use other fossil fuels or steam condensation technologies.
Since our inception in 1984, we have been a leader in environmental stewardship and have invested exclusively in clean power generation to become a recognized leader in developing, constructing, owning and operating an environmentally responsible portfolio of power plants. The combination of our Geysers Assets and our high efficiency portfolio of natural gas-fired power plants results in substantially lower emissions of these gases compared to our competitors’ power plants using other fossil fuels, such as coal. Consequently, our power generation portfolio has the lowest GHG footprint per MWh of any major independent power producer in the U.S. In addition, we strive to preserve our nation’s valuable water and land resources. To condense steam, we use cooling towers with a closed water cooling system, or air cooled condensers and do not employ “once-through” water cooling, which uses large quantities of water from adjacent waterways negatively impacting aquatic life. Since our plants are modern and efficient and utilize clean burning natural gas, we do not require large areas of land for our power plants nor do we require large specialized landfills for the disposal of coal ash or nuclear plant waste.
Our Market and Our Key Financial Performance Drivers
The market spark spread, sales of RECs, revenues from our steam sales and the results from our marketing, hedging and optimization activities are the primary components of our Commodity Margin and contribute significantly to our financial results. The market spark spread is primarily impacted by natural gas prices, weather and reserve margins, which impact both our supply and demand fundamentals. Those factors, plus the relationship between our operating Heat Rate compared to the Market Heat Rate, our power plant operating performance and availability are key to our financial performance.
Depending upon our hedge levels and holding other factors constant, increases in natural gas prices tend to increase our Commodity Margin and decreases in natural gas prices tend to decrease our Commodity Margin because we generally have lower Heat Rates and are more efficient than our competitors. Efficient operation of our fleet creates the opportunity to capture Commodity Margin in a cost effective manner. However, unplanned outages during periods of positive Commodity Margin could result in a loss of that opportunity. We generally measure our fleet performance based on our availability factors, Heat Rate and plant operating expense. The higher our availability factor, the better positioned we are to capture Commodity Margin. The less natural gas we must consume for each MWh of power generated, the lower our Heat Rate. The lower our operating Heat Rate compared to the Market Heat Rate, the more favorable the impact on our Commodity Margin. Holding all other factors constant, our Commodity Margin increases when we are able to lower our operating Heat Rate compared
59
Table of Contents
Index to Financial Statements
to the Market Heat Rate and conversely decreases when our operating Heat Rate increases compared to the Market Heat Rate. See also “— The Market for Power — Our Power Market Economics” in Item 1. of this Report for additional information on how these factors impact our Commodity Margin.
Current Year Operational Developments
During 2009, we have continued to implement our strategy to become the premier independent power company in the U.S. and achieve sustainable growth through financially disciplined power plant development, construction, operations and ownership. We have made some notable achievements that are listed below:
| • | On February 4, 2010, we received the Prevention of Significant Deterioration, or PSD, air permit, the final permit necessary, to begin construction of our Russell City Energy Center. We hope to complete financing and break ground for this new state-of-the-art power plant during 2010 with commercial operations scheduled to begin in 2013. Russell City Energy Center is intended to become the first power plant in the U.S. with a federal limit on GHG emissions, and will be designed to operate in a way that produces 25% fewer GHG emissions than the CPUC standard. |
| • | Throughout 2009, our plant operating personnel exceeded the first quartile performance for employee lost time incident rate for fossil fuel electric power generation companies with 1,000 or more employees. |
| • | Our Geysers Assets generated approximately 6 million MWh and achieved an exceptional equivalent availability factor of over 97%. Our natural gas-fired fleet achieved exceptional performance during 2009, with an equivalent forced outage factor of 2.7%, an improvement of 35% over full year 2008. |
| • | We completed 14 major inspections and 13 hot gas path inspections on schedule and on budget during 2009 and completed one of several planned natural gas-fired turbine upgrades and two steam turbine upgrades, which not only added incremental capacity but improved the efficiency of the entire turbines. |
| • | OMEC, located in San Diego, California, achieved commercial operations on October 3, 2009, adding 608 MW of capacity to our fleet. |
| • | Under one of our new PPAs, we will modernize and upgrade our Los Esteros Critical Energy Facility to add 120 MW by converting it from simple-cycle (peaking) to combined-cycle technology, increasing the efficiency and environmental performance of the power plant. |
| • | We successfully restructured and streamlined our power and commercial operations, as well as our corporate functions, to more effectively manage our business and reduce expenses. |
Customer-Oriented Origination Business
During 2009, we reorganized our customer origination function to allow our dedicated group of professionals to more effectively help manage this function. This effort is beginning to deliver real, tangible results and we, through certain of our wholly owned subsidiaries, entered into new PPAs and amended certain PPAs, which are all on mutually beneficial terms and many are subject to regulatory approvals. They include the following:
| • | We and PG&E have agreed to an extension of the term and an increase in the volume under the existing contracts for delivery of power from our Geysers Assets. Our Geysers Assets currently provide PG&E 375 MW of power under two contracts. We have agreed to increase the volume to 425 MW through 2017, and from 2018 through the end of 2021, our Geysers Assets will supply PG&E 250 MW of renewable energy. |
60
Table of Contents
Index to Financial Statements
| • | Our wholly owned subsidiaries, Gilroy Energy Center, LLC, Creed and Goose Haven, have entered into a replacement contract with PG&E, whereby PG&E will have greater dispatch flexibility for all 11 of our peaking units in California through 2017 and for seven of our peaking units through 2021. |
| • | We and PG&E negotiated a new agreement to replace the existing CDWR contract and facilitate the upgrade of our Los Esteros Critical Energy Facility from a 188 MW simple-cycle generation power plant to a 308 MW combined-cycle generation power plant. In addition to the increase in capacity, the upgrade will increase the efficiency and environmental performance of the power plant by lowering the Heat Rate. While the upgrade is under construction, we will provide capacity to PG&E from our Gilroy Cogeneration Plant. Upon completion of the upgrade, PG&E will purchase all of the capacity from our Los Esteros Critical Energy Facility for a term of ten years. |
| • | We have entered into a new tolling arrangement with PG&E for all of the capacity from our Delta Energy Center from 2011 through 2013. |
| • | We executed a resource adequacy agreement for all of the capacity from our Pastoria Energy Center with Southern California Edison for 2012 and 2013. |
| • | We executed a contract for 500 MW of capacity from our Morgan Energy Center with the Tennessee Valley Authority through 2011. |
| • | We executed a contract for 485 MW of capacity from our Carville Energy Center with Entergy Corporation through May 2012. |
| • | We executed a contract for 200 MW of capacity from our Oneta Energy Center with American Electric Power through 2010. |
| • | In addition to the suite of products we plan to supply through the agreements described above, our commercial operations team is also identifying creative opportunities to match our capabilities with the needs of our customers. During 2009, we entered into a PPA with the Los Angeles Department of Water and Power to provide integration services of up to 270 MW, leveraging our quick-responding natural gas-fired Hermiston Power Project located in Hermiston, Oregon, as well as its contracted transmission resources in the northwest as back up for wind generated power. |
The last transaction is an indication of the need our customers and more generally the market will have to utilize flexible natural gas-fired generation to assure reliability of supply while integrating intermittent and variable renewable resources, such as wind and solar power, that they are required to procure as part of a renewable energy portfolio.
Capital Management
We have opportunistically completed several financing transactions for a total of approximately $3.0 billion to improve our flexibility and management of our balance sheet. Significant transactions in 2009 include, but are not limited to, the following:
| • | On November 24, 2009, we amended and extended our Steamboat project debt which extended the maturity date from December 2011 to November 24, 2017. |
| • | On December 11, 2009, we amended the letter of credit facility related to our subsidiary, Calpine Development Holdings, Inc., to extend the maturity from January 31, 2010 to December 11, 2012, with an option to increase the letters of credit available from $150 million to $200 million by satisfying certain conditions. |
61
Table of Contents
Index to Financial Statements
| • | On August 20, 2009, we amended our First Lien Credit Facility and related collateral agency and intercreditor agreement in several respects to give us greater flexibility, including allowing us to exchange First Lien Credit Facility term loans for First Lien Notes. |
| • | On October 21, 2009, we issued approximately $1.2 billion aggregate principal amount of First Lien Notes in a private placement as a permitted debt exchange pursuant to our First Lien Credit Facility, which retired an aggregate principal amount of term loans under our First Lien Credit Facility equal to the aggregate principal amount of First Lien Notes issued. As a result of the issuance of the First Lien Notes, we were able to extend the maturities of approximately $1.2 billion in debt to 2017, at the same time converting it from a variable to a fixed interest rate. |
| • | On May 19, 2009, our wholly owned subsidiaries, CCFC and CCFC Finance, issued approximately $1.0 billion aggregate principal amount of CCFC New Notes in a private placement. The net proceeds were used to repay the CCFC Term Loans, CCFC Old Notes and CCFCP Preferred Shares. As a result of the CCFC Refinancing transactions, we were able to extend the maturities of approximately $1.0 billion of debt by several years, at the same time converting it from a variable to a fixed interest rate and lowering our effective interest rates. |
| • | On January 21, 2009, we closed on our Deer Park $156 million senior secured credit facilities, which included a $150 million term facility and a $6 million letter of credit facility. Proceeds received were used to settle an existing commodity contract of approximately $79 million, pay financing and legal fees, fund additional restricted cash and for general corporate purposes. |
For a further discussion of our 2009 significant financing transactions, see “— Liquidity and Capital Resources.”
62
Table of Contents
Index to Financial Statements
RESULTS OF OPERATIONS FOR THE YEARS ENDED DECEMBER 31, 2009 AND 2008
Below are our results of operations for the year ended December 31, 2009, as compared to the same period in 2008 (in millions, except for percentages and operating performance metrics). We have modified our presentation of commodity revenue and commodity expense to include cash settlements from our commodity marketing, hedging and optimization activities that were previously included in mark-to-market activity. Our 2008 commodity revenue and commodity expense information has been reclassified to conform to the current year presentation. In the comparative tables below, increases in revenue/income or decreases in expense (favorable variances) are shown without brackets while decreases in revenue/income or increases in expense (unfavorable variances) are shown with brackets in the “Change” and “% Change” columns.
| 2009 | 2008 | Change | % Change | ||||||||||||
| Operating revenues: |
|||||||||||||||
| Commodity revenue |
$ | 6,463 | 9,876 | $ | (3,413) | (35 | )% | ||||||||
| Mark-to-market activity(1) |
80 | 4 | 76 | # | |||||||||||
| Other revenue |
21 | 57 | (36 | ) | (63 | ) | |||||||||
| Operating revenues |
6,564 | 9,937 | (3,373 | ) | (34 | ) | |||||||||
| Cost of revenue: |
|||||||||||||||
| Fuel and purchased energy expense: |
|||||||||||||||
| Commodity expense |
3,896 | 7,352 | 3,456 | 47 | |||||||||||
| Mark-to-market activity(1) |
1 | (71 | ) | (72 | ) | # | |||||||||
| Fuel and purchased energy expense |
3,897 | 7,281 | 3,384 | 46 | |||||||||||
| Plant operating expense |
897 | 918 | 21 | 2 | |||||||||||
| Depreciation and amortization expense |
467 | 433 | (34 | ) | (8 | ) | |||||||||
| Operating asset impairments |
4 | 33 | 29 | 88 | |||||||||||
| Other cost of revenue(2) |
84 | 114 | 30 | 26 | |||||||||||
| Total cost of revenue |
5,349 | 8,779 | 3,430 | 39 | |||||||||||
| Gross profit |
1,215 | 1,158 | 57 | 5 | |||||||||||
| Sales, general and other administrative expense |
183 | 215 | 32 | 15 | |||||||||||
| (Income) loss from unconsolidated investments in power plants |
(50 | ) | 229 | 279 | # | ||||||||||
| Other operating expense |
18 | 26 | 8 | 31 | |||||||||||
| Income from operations |
1,064 | 688 | 376 | 55 | |||||||||||
| Interest expense |
829 | 1,071 | 242 | 23 | |||||||||||
| Interest (income) |
(16 | ) | (47 | ) | (31 | ) | (66 | ) | |||||||
| Debt extinguishment costs |
76 | 13 | (63 | ) | # | ||||||||||
| Other (income) expense, net |
16 | 14 | (2 | ) | (14 | ) | |||||||||
| Income (loss) before reorganization items, income taxes and discontinued operations |
159 | (363 | ) | 522 | # | ||||||||||
| Reorganization items |
(1 | ) | (302 | ) | (301 | ) | # | ||||||||
| Income (loss) before income taxes and discontinued operations |
160 | (61 | ) | 221 | # | ||||||||||
| Income tax expense (benefit) |
15 | (47 | ) | (62 | ) | # | |||||||||
| Income (loss) before discontinued operations |
145 | (14 | ) | 159 | # | ||||||||||
| Discontinued operations, net of tax expense of $14 in 2008 |
— | 23 | (23 | ) | # | ||||||||||
| Net income |
145 | 9 | 136 | # | |||||||||||
| Net loss attributable to the noncontrolling interest |
4 | 1 | 3 | # | |||||||||||
| Net income attributable to Calpine |
$ | 149 | $ | 10 | $ | 139 | # | ||||||||
| 2009 | 2008 | Change | % Change | ||||||||||||
| Operating Performance Metrics: |
|||||||||||||||
| MWh generated (in thousands)(3) |
88,339 | 87,762 | 577 | 1 | % | ||||||||||
| Average availability |
92.1 | % | 90.5 | % | 1.6 | 2 | |||||||||
| Average total MW in operation |
23,414 | 23,037 | 377 | 2 | |||||||||||
| Average capacity factor, excluding peakers |
48.7 | % | 47.9 | % | 0.8 | 2 | |||||||||
| Steam Adjusted Heat Rate |
7,263 | 7,231 | (32 | ) | — | ||||||||||
| # | Variance of 100% or greater |
63
Table of Contents
Index to Financial Statements
| (1) | Amount represents the unrealized portion of our commodity mark-to-market activity as well as a non-cash gain from amortization of prepaid power sales agreements. |
| (2) | Includes $5 million and nil of RGGI compliance costs for the years ended December 31, 2009 and 2008, respectively, which is a component of Commodity Margin. |
| (3) | Represents generation from power plants that we both consolidate and operate. |
Commodity revenue and commodity expense decreased for the year ended December 31, 2009 compared to 2008, largely due to lower natural gas prices which decreased 53% in 2009 compared to 2008; however, commodity revenue, net of commodity expense, increased $43 million for the year ended December 31, 2009 compared to 2008, primarily due to:
| • | higher average hedge margins in 2009 compared to 2008; |
| • | average annual Market Heat Rates were relatively unchanged for the year ended December 31, 2009 compared to 2008, with the exception of our Southeast segment which experienced a 35% increase in generation in 2009 compared to 2008 largely due to higher natural gas generation displacement of coal generation in certain sub-markets in our Southeast segment caused by lower natural gas prices resulting in higher Market Heat Rates; partially offset by |
| • | lower natural gas prices in 2009 compared to 2008 and the resulting negative impact on our open positions. |
These factors were also positively impacted by our operational performance where we experienced a 1% increase in generation as well as a 2% increase in both our average availability and average capacity factor, excluding peakers, for the year ended December 31, 2009 compared to 2008.
Revenues from mark-to-market activity increased for the year ended December 31, 2009 compared to 2008, which is consistent with a falling commodity price environment. Expenses from mark-to-market activity increased for the year ended December 31, 2009 compared to 2008, due to the impact of natural gas market price volatility on our natural gas hedge position for our generation portfolio.
Other revenue decreased for the year ended December 31, 2009 compared to 2008, primarily related to a $14 million decrease in revenue from operation and maintenance contracts and a $7 million decrease in revenue from construction management projects completed in 2008. Also contributing to the decrease was an $11 million decrease in other revenue related to royalty income on oil and gas producing properties.
Normal, recurring plant operating expenses decreased by $24 million for the year ended December 31, 2009 compared to 2008, after accounting for $29 million in reimbursements for insurance claims from prior periods that reduced our 2008 and, to a much lesser extent, 2009 expenses. Additionally, major maintenance costs resulting from our plant outage schedule decreased $16 million and plant personnel costs related to stock-based compensation expense decreased $9 million for the year ended December 31, 2009 compared to 2008.
Depreciation and amortization expense increased for the year ended December 31, 2009 compared to 2008, primarily resulting from an increase of $25 million in the fourth quarter of 2009 related to a revision in the estimated useful lives and salvage values of our power plants and related equipment and changing our Geysers Assets depreciation from the units of production method to the straight line method as well as a $9 million increase resulting from an upward revision in the rate used to depreciate our Geysers Assets due to changes in our estimate of our future development costs for the first nine months of 2009. See Note 3 of the Notes to Consolidated Financial Statements for further information regarding our change in useful lives and salvage values as well as our change from the units of production method to the straight line depreciation method for our Geysers Assets.
64
Table of Contents
Index to Financial Statements
Our operating asset impairments decreased for the year ended December 31, 2009 compared to 2008, primarily from a $33 million impairment recorded in 2008 relating to our Auburndale Peaking Energy Center resulting from lower forecasted future cash flows.
Other cost of revenue decreased for the year ended December 31, 2009 compared to 2008, as a result of a decrease of $17 million related to the discontinuation of the amortization of other assets associated with the deconsolidation and subsequent sale of Auburndale in 2008 as well as an $11 million decrease in royalty expense due to lower revenues from our Geysers Assets resulting from lower spot market power prices in the year ended December 31, 2009 compared to 2008. The decrease was partially offset by an increase of $5 million in expenses related to RGGI compliance costs in the Northeast which was initiated in 2009.
Sales, general and other administrative expense decreased for the year ended December 31, 2009 compared to 2008, due to a $10 million decrease in personnel costs and stock-based compensation expense resulting primarily from a lower headcount in 2009 as well as a $13 million decrease in legal and consulting expenses. In addition, we experienced a $5 million favorable year over year change in our bad debt expense.
Our (income) loss from unconsolidated investments in power plants increased for the year ended December 31, 2009 compared to 2008, primarily due to an impairment loss of $180 million related to our equity interest in Auburndale recorded during the year ended December 31, 2008. Also contributing to the increase was income from our investment in Greenfield LP of $16 million for the year ended December 31, 2009 compared to a loss of $5 million for the year ended December 31, 2008, which is due to Greenfield LP achieving commercial operations in October 2008. We also had income of $32 million related to our investment of OMEC, of which, $4 million related to OMEC achieving commercial operation in October 2009 and a $28 million gain related to mark-to-market activities from interest rate swap contracts compared to a loss of $55 million incurred for the year ended December 31, 2008, related to unrealized mark-to-market losses from interest rate swap contracts. See Note 4 of the Notes to Consolidated Financial Statements for further information regarding our unconsolidated investments.
Other operating expense decreased for the year ended December 31, 2009 compared to 2008, due to impairments of $13 million related to development projects recorded in 2008 which was partially offset by an increase of $6 million in project development expense for the year ended December 31, 2009 compared to 2008, related to Russell City Energy Center which is under advanced development.
Due to the changes in our capital structure on the Effective Date, our interest expense for the years ended December 31, 2009 and 2008, is not directly comparable. Interest expense decreased primarily due to $135 million in post-petition interest related to pre-emergence debt recorded in the first quarter of 2008 and $27 million for settlement obligations related to the Canadian Debtors and other deconsolidated foreign entities recorded prior to their reconsolidation in February 2008. In addition, interest expense decreased for the year ended December 31, 2009 compared to 2008, due to lower average interest rates on our variable rate debt resulting from a decrease in LIBOR over the same periods. The annualized effective interest rates on our consolidated debt, excluding the impacts of capitalized interest and unrealized mark-to-market gains (losses) on interest rate swaps, after amortization of deferred financing costs and debt discounts, were 8.0% and 8.8% for the year ended December 31, 2009 and 2008, respectively. The decrease in interest expense was partially offset by the negative period over period impact of $153 million related to interest rate swap settlements resulting from a decrease in LIBOR.
Interest income decreased for the year ended December 31, 2009 compared to 2008, largely resulting from lower average interest rates earned on our cash balances which were primarily invested in U.S. Treasury securities or government-backed securities for the year ended December 31, 2009 compared to primarily invested in institutional-backed money market accounts for the year ended December 31, 2008.
65
Table of Contents
Index to Financial Statements
Debt extinguishment costs increased for the year ended December 31, 2009 compared to 2008, primarily due to $76 million in debt extinguishment costs associated with the retirement of the term loans under the First Lien Credit Facility in October 2009, the refinancing of our CCFC Old Notes and CCFC Term Loans in May and June 2009 and the CCFCP Preferred Shares that were redeemed on or before July 1, 2009. This increase was partially offset by $13 million in debt extinguishment costs for the write-off of unamortized deferred financing costs and other costs associated with the refinancing of all outstanding indebtedness under the existing Blue Spruce term loan facility in February 2008 as well as the refinancing of our Metcalf term loan facility and preferred interests in June 2008.
During the year ended December 31, 2009, reorganization items primarily consisted of settlements of various disputed claims. During the year ended December 31, 2008, reorganization items primarily consisted of $206 million in gains on asset sales, a $71 million gain on the reconsolidation of the Canadian Debtors and other deconsolidated foreign entities, a $62 million credit related to the settlement of claims with the Canadian Debtors and other deconsolidated foreign entities, a $34 million credit for RockGen related to a prior period which we determined was not material to any period, a $12 million credit related to the settlement with Rosetta of our fraudulent conveyance claim and $85 million in professional and trustee fees related to activity managed by our third party advisors for our Chapter 11 and CCAA cases.
For the year ended December 31, 2009, we recorded tax expense of $15 million before discontinued operations compared to a benefit of $47 million for the year ended December 31, 2008. Due to the valuation allowances recorded against certain deferred tax assets, our effective tax rate differs considerably from the federal statutory rate. Our tax structure is comprised primarily of two taxable groups, CCFC and its subsidiaries and Calpine Corporation and its subsidiaries other than CCFC. CCFC and its subsidiaries no longer have a valuation allowance recorded against its deferred tax assets due to its ability to generate sufficient income to utilize its NOLs. Our 2009 income tax expense primarily relates to a foreign tax expense of $2 million and $43 million expense relating to the reversal of prior years intraperiod tax allocation due to OCI gains partially offset by a $30 million tax benefit from the CCFC group. Our 2008 benefit for income taxes before discontinued operations primarily relates to a foreign tax benefit of $70 million recorded as a result of the Canadian Settlement Agreement, and intraperiod tax allocation benefit of $90 million, which was comprised of a $76 million tax benefit to continuing operations due to current OCI gains and a $14 million tax benefit in income from discontinued operations, offset by tax expense of approximately $100 million on CCFC’s income. See Note 11 of the Notes to Consolidated Financial Statements for further information.
During the year ended December 31, 2008, we recorded $23 million in discontinued operations, net of taxes of $14 million, related to the settlement with Rosetta of all of our outstanding claims related to our domestic oil and gas assets we sold to Rosetta for $1.1 billion in 2005. See Note 6 of the Notes to Consolidated Financial Statements for further information.
66
Table of Contents
Index to Financial Statements
RESULTS OF OPERATIONS FOR THE YEARS ENDED DECEMBER 31, 2008 AND 2007
Below are our results of operations for the year ended December 31, 2008, as compared to the same period in 2007 (in millions, except for percentages and operating performance metrics). We have modified our presentation of commodity revenue and commodity expense to include cash settlements from our commodity marketing, hedging and optimization activities that were previously included in mark-to-market activity. Our 2008 and 2007 commodity revenue and commodity expense information has been reclassified to conform to the current year presentation. In the comparative tables below, increases in revenue/income or decreases in expense (favorable variances) are shown without brackets while decreases in revenue/income or increases in expense (unfavorable variances) are shown with brackets in the “Change” and “% Change” columns.
| 2008 | 2007 | Change | % Change | ||||||||||||
| Operating revenues: |
|||||||||||||||
| Commodity revenue |
$ | 9,876 | 7,903 | $ | 1,973 | 25 | % | ||||||||
| Mark-to-market activity(1) |
4 | 10 | (6 | ) | (60 | ) | |||||||||
| Other revenue |
57 | 57 | — | — | |||||||||||
| Operating revenues |
9,937 | 7,970 | 1,967 | 25 | |||||||||||
| Cost of revenue: |
|||||||||||||||
| Fuel and purchased energy expense: |
|||||||||||||||
| Commodity expense |
7,352 | 5,692 | (1,660 | ) | (29 | ) | |||||||||
| Mark-to-market activity(1) |
(71 | ) | (9 | ) | 62 | # | |||||||||
| Fuel and purchased energy expense |
7,281 | 5,683 | (1,598 | ) | (28 | ) | |||||||||
| Plant operating expense |
918 | 749 | (169 | ) | (23 | ) | |||||||||
| Depreciation and amortization expense |
433 | 463 | 30 | 6 | |||||||||||
| Operating asset impairments |
33 | 44 | 11 | 25 | |||||||||||
| Other cost of revenue |
114 | 136 | 22 | 16 | |||||||||||
| Total cost of revenue |
8,779 | 7,075 | (1,704 | ) | (24 | ) | |||||||||
| Gross profit |
1,158 | 895 | 263 | 29 | |||||||||||
| Sales, general and other administrative expense |
215 | 146 | (69 | ) | (47 | ) | |||||||||
| Loss from unconsolidated investments in power plants |
229 | 21 | (208 | ) | # | ||||||||||
| Other operating expense |
26 | 23 | (3 | ) | (13 | ) | |||||||||
| Income from operations |
688 | 705 | (17 | ) | (2 | ) | |||||||||
| Interest expense |
1,071 | 2,019 | 948 | 47 | |||||||||||
| Interest (income) |
(47 | ) | (64 | ) | (17 | ) | (27 | ) | |||||||
| Debt extinguishment costs |
13 | (1 | ) | (14 | ) | # | |||||||||
| Other (income) expense, net |
14 | (138 | ) | (152 | ) | # | |||||||||
| Loss before reorganization items, income taxes and discontinued operations |
(363 | ) | (1,111 | ) | 748 | 67 | |||||||||
| Reorganization items |
(302 | ) | (3,258 | ) | (2,956 | ) | (91 | ) | |||||||
| Income (loss) before income taxes and discontinued operations |
(61 | ) | 2,147 | (2,208 | ) | # | |||||||||
| Income tax benefit |
(47 | ) | (546 | ) | (499 | ) | (91 | ) | |||||||
| Income (loss) before discontinued operations |
(14 | ) | 2,693 | (2,707 | ) | # | |||||||||
| Discontinued operations, net of tax expense of $14 in 2008 |
23 | — | 23 | — | |||||||||||
| Net income |
9 | 2,693 | (2,684 | ) | # | ||||||||||
| Net loss attributable to the noncontrolling interest |
1 | — | 1 | — | |||||||||||
| Net income attributable to Calpine |
$ | 10 | $ | 2,693 | $ | (2,683 | ) | # | |||||||
| 2008 | 2007 | Change | % Change | ||||||||||||
| Operating Performance Metrics: |
|||||||||||||||
| MWh generated (in thousands)(2) |
87,762 | 90,811 | (3,049 | ) | (3 | )% | |||||||||
| Average availability |
90.5 | % | 90.8 | % | (0.3 | ) | — | ||||||||
| Average total MW in operation |
23,037 | 24,679 | (1,642 | ) | (7 | ) | |||||||||
| Average capacity factor, excluding peakers |
47.9 | % | 46.9 | % | 1.0 | 2 | |||||||||
| Steam Adjusted Heat Rate |
7,231 | 7,190 | (41 | ) | (1 | ) | |||||||||
| # | Variance of 100% or greater |
67
Table of Contents
Index to Financial Statements
| (1) | Amount represents the unrealized portion of our mark-to-market activity as well as a non-cash gain from amortization of prepaid power sales agreements. |
| (2) | Represents generation from power plants that we both consolidate and operate. |
Commodity revenue and commodity expense increased for the year ended December 31, 2008 compared to 2007, largely due to higher natural gas prices which increased 25% in 2008 compared to 2007. In addition, commodity revenue, net of commodity expense, increased $313 million for the year ended December 31, 2008, compared to 2007 primarily due to:
| • | higher market spark spreads on open positions due to higher natural gas prices throughout the first three quarters of 2008 in our key Texas and West markets which benefited our power plants in these regions as they operated more efficiently against corresponding Market Heat Rates; |
| • | higher Market Heat Rates in the second quarter of 2008, particularly in Texas which resulted from higher temperatures and transmission congestion in the South and Houston zones; |
| • | higher realized spark spreads for our generally higher levels of hedging in all regions; and |
| • | earnings from settlement of dedesignated hedges, the value for which was previously reflected in OCI. |
Generation decreased 3% despite a 2% increase in our average capacity factor, excluding peakers, due to a 7%, or 1,642 MW, decrease in our average total MW in operation for the year ended December 31, 2008, compared to 2007. The generation decrease primarily resulted from power plant sales in 2007, the deconsolidation and subsequent sale of Auburndale in 2008 and an increase in the number of unscheduled outages in 2008 compared to 2007.
Results of net unrealized mark-to-market activity are driven primarily from our commodity hedging activities that do not qualify for hedge accounting. The $56 million increase for the year ended December 31, 2008 compared to 2007, is largely due to a decrease in expenses from mark-to-market activity primarily driven by the impact of natural gas market price volatility on our natural gas hedge position for our generation portfolio.
Plant operating expense increased during the year ended December 31, 2008, compared to the year ended December 31, 2007, primarily as a result of a $92 million increase in expense for major maintenance for scheduled outages related to the life cycle of our power plant fleet and an increase of $25 million in plant personnel costs related to stock-based compensation expense for equity awards issued in 2008. The increase in major maintenance is driven by the fact that we placed 23 power plants in service in the 2001-2002 time frame and many have reached their 24,000 or 48,000 hour major inspection operating intervals. Routine operating and repair costs also contributed $31 million to the increase in plant operating expense which related to increases in chemical costs and other consumables, and increases in routine repairs. A $16 million increase in expense for outages, many of which occurred in 2007 and equipment repairs made in 2008, caused by equipment failures, net of insurance recoveries, also contributed to the increase in plant operating expense for the year ended December 31, 2008, compared to 2007.
Depreciation and amortization expense decreased for the year ended December 31, 2008, compared to the year ended December 31, 2007, primarily due to an upward revision in the estimated useful life of our Geysers Assets as well as the sale of Acadia PP in September 2007. The upward revision in the estimated useful life of our Geysers Assets relates to our reservoir replenishment activities which extends the estimated economic life of our Geysers Assets from 2034 to 2050.
68
Table of Contents
Index to Financial Statements
Our operating asset impairments for the year ended December 31, 2008, consisted of a $33 million impairment relating to our Auburndale Peaking Energy Center resulting from lower forecasted future cash flows. Operating asset impairments of $44 million during the year ended December 31, 2007, were recorded primarily for the Bethpage Power Plant resulting from the expected adverse impact on power pricing of new power transmission capacity from the PJM market into Long Island.
Other cost of revenue decreased for the year ended December 31, 2008, compared to the year ended December 31, 2007, as a result of an $8 million decrease for the sale of PSM in March 2007, a $10 million decrease in operating lease expense due to the termination of the lease associated with our purchase of the RockGen Energy Center in January 2008 and a decrease of $8 million related to the discontinuation of the amortization of other assets associated with the deconsolidation and subsequent sale of Auburndale in 2008. These decreases were partially offset by a $5 million increase in royalty expense due to higher spot market power prices in 2008 compared to 2007.
Sales, general and other administrative expense was higher for the year ended December 31, 2008, compared to the same period in 2007 due to a $42 million increase in personnel costs resulting primarily from higher stock-based compensation expense arising from the grant of equity awards during the first quarter of 2008 and a $15 million increase in legal and consulting expenses.
Our loss from unconsolidated investments in power plants increased in 2008 compared to 2007 primarily due to an impairment loss of $180 million related to our equity interest in Auburndale during the year ended December 31, 2008. We also incurred an increase of $47 million in unrealized mark-to-market losses from interest rate swap contracts related to our investment in OMEC. The increase was partially offset by $9 million in income from our investment in RockGen and an $8 million reduction in losses related to our investment in Greenfield LP for the year ended December 31, 2008, compared to 2007. See Note 4 of the Notes to Consolidated Financial Statements for further information regarding our unconsolidated investments.
Due to the changes in our capital structure on the Effective Date, our interest expense for the years ended December 31, 2008 and 2007, is not directly comparable. Interest expense decreased primarily due to $376 million in post-petition interest related to pre-emergence debt recorded in 2007, resulting from the Canadian Settlement Agreement as well as $347 million in post-petition interest related to other pre-petition obligations recorded during the year ended December 31, 2007, which was partially offset by $135 million in post-petition interest recorded during the year ended December 31, 2008. In addition, interest expense decreased for the year ended December 31, 2008, compared to the year ended December 31, 2007, due to lower average debt balances and lower average interest rates. During the first quarter of 2008, we settled a portion of our debt through payment of cash and issuance of reorganized Calpine Corporation common stock pursuant to our Plan of Reorganization. Additionally, interest rates on our variable rate debt were lower for the year ended December 31, 2008, compared to 2007, due to a decrease in LIBOR over the same periods. The annualized effective interest rates on our consolidated debt, excluding the impacts of items not directly attributed to the cost of the debt instruments, after amortization of deferred financing costs and debt discounts, were 8.8% and 11.0% for the years ended December 31, 2008 and 2007, respectively. The decrease was partially offset by the negative period over period impact of $89 million related to interest rate swap settlements resulting from a decrease in LIBOR as well as $27 million for settlement obligations related to our Canadian subsidiaries recorded prior to their reconsolidation in February 2008.
Interest income decreased primarily due to lower average cash balances for the year ended December 31, 2008, compared to the same period in 2007 resulting from the distribution of cash pursuant to our Plan of Reorganization in the first quarter of 2008, and due to lower average interest rates.
Other (income) expense, net had an unfavorable variance primarily as a result of the non-recurrence of $135 million in income pertaining to a claim settlement with a customer which received court approval and was recorded during the third quarter of 2007. The claim related to the customer’s rejection of our energy services
69
Table of Contents
Index to Financial Statements
agreement following the customer’s bankruptcy filing and was unrelated to our Chapter 11 cases. Also contributing to the decrease was a loss of $13 million incurred during 2008 related to our settlement with Panda.
Debt extinguishment costs increased for the year ended December 31, 2008 compared to 2007, primarily due to $13 million in debt extinguishment costs for the write-off of unamortized deferred financing costs and other costs associated with the refinancing of all outstanding indebtedness under the existing Blue Spruce term loan facility in February 2008 as well as the refinancing of our Metcalf term loan facility and preferred interests in June 2008.
The table below lists the significant components of reorganization items for the years ended December 31, 2008 and 2007 (in millions):
| 2008 | 2007 | Change | % Change | ||||||||||||
| Provision for expected allowed claims |
$ | (95 | ) | $ | (3,687 | ) | $ | (3,592 | ) | (97 | )% | ||||
| Professional and trustee fees |
85 | 217 | 132 | 61 | |||||||||||
| Gains on asset sales |
(206) | (285 | ) | (79 | ) | (28 | ) | ||||||||
| Asset impairments |
— | 120 | 120 | # | |||||||||||
| Gain on reconsolidation of Canadian Debtors and other deconsolidated foreign entities |
(71) | — | 71 | — | |||||||||||
| DIP Facility and First Lien Facilities financing and CalGen Secured Debt repayment costs |
(4) | 202 | 206 | # | |||||||||||
| Interest (income) on accumulated cash |
(7) | (59 | ) | (52 | ) | (88 | ) | ||||||||
| Other |
(4) | 234 | 238 | # | |||||||||||
| Total reorganization items |
$ | (302) | $ | (3,258 | ) | $ | (2,956 | ) | (91 | ) | |||||
| # | Variance of 100% or greater |
Provision for Expected Allowed Claims — During the year ended December 31, 2008, our provision for expected allowed claims consisted primarily of a $62 million credit related to the settlement of claims with the Canadian Debtors and other deconsolidated foreign entities, a $12 million credit related to the settlement with Rosetta of our fraudulent conveyance claim and a $34 million credit for RockGen related to a prior period which we determined was not material to any period. During the year ended December 31, 2007, our provision for expected allowed claims consisted primarily of a $4.1 billion credit related to the settlement of claims related to Calpine Corporation’s guarantee of the ULC I notes and the release of our guarantee of the ULC II notes following repayment of those notes in September 2007, accruals totaling $275 million for make whole premiums and/or damages related to the First Priority Notes, Second Priority Debt and Unsecured Notes settlements, $141 million resulting from the termination of the RockGen operating lease agreement and write-off of the related prepaid lease expense, $98 million resulting from settlements and repudiation of certain natural gas transportation and PPA contracts, and an additional accrual of $79 million resulting from the rejection of certain leases and other agreements related to the Rumford and Tiverton power plants for which we agreed to allow general unsecured claims in the aggregate of $190 million.
Professional and Trustee Fees — The decrease in professional fees for the year ended December 31, 2008, over the comparable period in 2007 resulted primarily from a decrease in activity managed by our third party advisors related to our Chapter 11 and CCAA cases.
Gains on Asset Sales — During the year ended December 31, 2008, gains on asset sales primarily resulted from the sales of the Hillabee and Fremont development project assets. During the year ended December 31, 2007, gains on asset sales primarily resulted from the sale of the Aries Power Plant, Goldendale Energy Center, PSM and Parlin Power Plant during 2007. See Note 6 of the Notes to Consolidated Financial Statements for further information.
70
Table of Contents
Index to Financial Statements
Asset Impairments — During the year ended December 31, 2007, asset impairment charges were primarily due to a pre-tax impairment charge of approximately $89 million to record our interest in Acadia PP at fair value less cost to sell.
Gain on Reconsolidation of Canadian Debtors and Other Deconsolidated Foreign Entities — During the year ended December 31, 2008, we recorded a gain of $71 million related to the reconsolidation of our Canadian subsidiaries. See Note 2 of the Notes to Consolidated Financial Statements for further information.
DIP Facility and First Lien Facilities Financing and CalGen Secured Debt Repayment Costs — During the year ended December 31, 2008, we recorded a $4 million credit related to a valuation revision for secured shortfall claims related to our Second Priority Debt. During the year ended December 31, 2007, we recorded costs related to the refinancing of our Original DIP Facility and repayment of the CalGen Secured Debt consisting of $52 million of DIP Facility transaction costs, the write-off of $32 million in unamortized discount and deferred financing costs related to the CalGen Secured Debt, and $76 million as our estimate of the expected allowed claims resulting from the unsecured claims for damages granted to the holders of the CalGen Secured Debt. We also recorded transaction costs of $22 million related to the execution of a commitment letter to fund our First Lien Facilities as well as $13 million for secured shortfall claims relating to settlements for the First Priority Notes and the CalGen First Lien Debt during the year ended December 31, 2007.
Interest (Income) on Accumulated Cash — The decrease in interest income on accumulated cash for the year ended December 31, 2008, over the comparable period in 2007 related to our emergence from Chapter 11 at which time we ceased allocating a portion of interest income to reorganization items.
Other — Other reorganization items decreased primarily due to recording a gain of $4 million during the year ended December 31, 2008, versus a loss of $164 million in the year ended December 31, 2007, related to foreign exchange movements on LSTC denominated in a foreign currency and the non-recurrence of a charge of $14 million during the year ended December 31, 2007, resulting from debt pre-payment and make whole premium fees to the project lenders related to the sale of the Aries Power Plant. Also contributing to the decrease was $53 million in emergence incentive cost accruals related to our emergence from Chapter 11 recorded during the year ended December 31, 2007, while no such accruals were recorded in 2008.
For the year ended December 31, 2008, we recorded a tax benefit of $47 million before discontinued operations compared to a benefit of $546 million for the year ended December 31, 2007. Due to the valuation allowances recorded against certain deferred tax assets, our effective tax rate differs considerably from the federal statutory rate. Our tax structure is comprised primarily of two taxable groups, CCFC and its subsidiaries and Calpine Corporation and its subsidiaries other than CCFC. CCFC and its subsidiaries no longer have a valuation allowance recorded against its deferred tax assets due to its ability to generate sufficient income to utilize its NOLs. Our 2008 benefit for income taxes before discontinued operations primarily relates to a foreign tax benefit of $70 million recorded as a result of the Canadian Settlement Agreement, and intraperiod tax allocation benefit of $90 million, which was comprised of a $76 million tax benefit to continuing operations due to current OCI gains and a $14 million tax benefit in income from discontinued operations, offset by tax expense of approximately $100 million on CCFC’s income. Our 2007 benefit for income taxes consisting primarily of $485 million related to the release of valuation allowance in 2007. See Note 11 of the Notes to Consolidated Financial Statements for further information.
During the year ended December 31, 2008, we recorded $23 million in discontinued operations, net of taxes of $14 million, related to the settlement with Rosetta of all of our outstanding claims related to our domestic oil and gas assets we sold to Rosetta for $1.1 billion in 2005. See Note 6 of the Notes to Consolidated Financial Statements for further information.
71
Table of Contents
Index to Financial Statements
COMMODITY MARGIN AND ADJUSTED EBITDA
Management’s Discussion and Analysis of Financial Condition and Results of Operations includes financial information prepared in accordance with GAAP, as well as the non-GAAP financial measures, Commodity Margin and Adjusted EBITDA, discussed below, which we use as a measure of our performance. Generally, a non-GAAP financial measure is a numerical measure of financial performance, financial position or cash flows that excludes (or includes) amounts that are included in (or excluded from) the most directly comparable measure calculated and presented in accordance with GAAP.
Commodity Margin by Segment for the Years Ended December 31, 2009 and 2008
We use the non-GAAP financial measure “Commodity Margin” to assess our performance by our reportable segments. Commodity Margin includes our power and steam revenues, sales of purchased power and natural gas, capacity revenue, REC revenue, sales of surplus emission allowances, transmission revenue and expenses, fuel and purchased energy expense, RGGI compliance costs, and cash settlements from our marketing, hedging and optimization activities that are included in mark-to-market activity, but excludes the unrealized portion of our mark-to-market activity and other revenues. We believe that Commodity Margin is a useful tool for assessing the performance of our core operations and is a key operational measure reviewed by our chief operating decision maker. Commodity Margin is not a measure calculated in accordance with GAAP, and should be viewed as a supplement to and not a substitute for our results of operations presented in accordance with GAAP. Commodity Margin does not intend to represent gross profit (loss), the most comparable GAAP measure, as an indicator of operating performance and is not necessarily comparable to similarly-titled measures reported by other companies. See Note 18 of the Notes to Consolidated Financial Statements for a reconciliation of Commodity Margin to income (loss) from operations by segment.
The following tables show our Commodity Margin and related operating performance metrics by segment for the years ended December 31, 2009 and 2008. During the first quarter of 2009, we began assessing the performance of our regional segments to include the allocation (based upon each regional segment’s MWh) of revenues and expenses from our fuel management, Turbine Maintenance Group and certain non-region specific natural gas marketing and optimization and other corporate activities, which had formerly been separately reported as our “Other” segment. Additionally, we have modified our definition of Commodity Margin to include cash settlements from our marketing, hedging and optimization activities that were previously included in mark-to-market activity. Our 2008 Commodity Margin by segment information has been recast to conform to the current year presentation. In the “Change” and “% Change” columns below, favorable variances are shown without brackets while unfavorable variances are shown with brackets. The MWh generated by segment below represents generation from power plants that we both consolidated and operate.
| West: | 2009 | 2008 | Change | % Change | ||||||||||
| Commodity Margin (in millions) |
$ | 1,346 | $ | 1,255 | $ | 91 | 7 | % | ||||||
| Commodity Margin per MWh generated |
$ | 37.35 | $ | 33.79 | $ | 3.56 | 11 | |||||||
| MWh generated (in thousands) |
36,033 | 37,137 | (1,104) | (3) | ||||||||||
| Average availability |
92.3 | % | 89.1 | % | 3.2 | 4 | ||||||||
| Average total MW in operation |
7,302 | 7,295 | 7 | — | ||||||||||
| Average capacity factor, excluding peakers |
64.1 | % | 65.9 | % | (1.8) | (3) | ||||||||
| Steam Adjusted Heat Rate |
7,304 | 7,267 | (37) | (1) | ||||||||||
West — Commodity Margin in our West segment increased by $91 million, or 7%, for the year ended December 31, 2009 compared to the year ended December 31, 2008. The increase was primarily a result of higher hedge levels and prices, sales of surplus emission allowances in the first quarter of 2009 and higher resource adequacy and REC revenues in 2009 compared to 2008. Market Heat Rates remained relatively
72
Table of Contents
Index to Financial Statements
unchanged across periods, and lower natural gas prices resulted in lower market spark spreads for the year ended December 31, 2009 compared to 2008. In addition, the current period benefited from the non-recurrence in 2009 of an unfavorable natural gas storage inventory price adjustment in September 2008. Consistent with the weaker price conditions, generation decreased 3% for the year ended December 31, 2009 compared to 2008, despite a 4% increase in our average availability. Commodity Margin per MWh generated increased 11% due in part to the effect of our positive portfolio hedge value being allocated across a reduced number of generated MWh for the year ended December 31, 2009 as compared to 2008.
| Texas: | 2009 | 2008 | Change | % Change | |||||||||||
| Commodity Margin (in millions) |
$ | 644 | $ | 726 | $ | (82 | ) | (11 | )% | ||||||
| Commodity Margin per MWh generated |
$ | 21.69 | $ | 22.40 | $ | (0.71 | ) | (3 | ) | ||||||
| MWh generated (in thousands) |
29,687 | 32,408 | (2,721 | ) | (8 | ) | |||||||||
| Average availability |
90.0 | % | 88.8 | % | 1.2 | 1 | |||||||||
| Average total MW in operation |
7,156 | 7,147 | 9 | — | |||||||||||
| Average capacity factor, excluding peakers |
47.4 | % | 51.6 | % | (4.2 | ) | (8 | ) | |||||||
| Steam Adjusted Heat Rate |
7,142 | 7,082 | (60 | ) | (1 | ) | |||||||||
Texas — Commodity Margin in our Texas segment decreased by $82 million, or 11%, for the year ended December 31, 2009 compared to 2008. This decrease is primarily attributable to weaker natural gas prices that were 56% lower in 2009 compared to 2008. Overall, Market Heat Rates were relatively unchanged in 2009 compared to 2008; however, Market Heat Rates were higher in the third quarter of 2009 compared to the same period in 2008 due to warmer than average weather and lower in the second quarter of 2009 compared to the same period in 2008 due to the congestion-driven pricing environment of the second quarter of 2008. Also contributing to the overall decrease in Commodity Margin was lower steam sales resulting from weaker industrial demand in 2009 compared to 2008. Despite a 1% increase in average availability, generation decreased 8% on softer demand in the first half of 2009 and weaker Market Heat Rates in the second quarter of 2009. We experienced a 1% increase in our Steam Adjusted Heat Rate for the year ended December 31, 2009 compared to 2008, resulting from lower steam sales in 2009 compared to 2008.
| Southeast: | 2009 | 2008 | Change | % Change | |||||||||||
| Commodity Margin (in millions) |
$ | 304 | $ | 264 | $ | 40 | 15 | % | |||||||
| Commodity Margin per MWh generated |
$ | 17.50 | $ | 20.59 | $ | (3.09 | ) | (15 | ) | ||||||
| MWh generated (in thousands) |
17,370 | 12,820 | 4,550 | 35 | |||||||||||
| Average availability |
93.2 | % | 93.6 | % | (0.4 | ) | — | ||||||||
| Average total MW in operation |
6,083 | 6,183 | (100 | ) | (2 | ) | |||||||||
| Average capacity factor, excluding peakers |
37.9 | % | 26.6 | % | 11.3 | 42 | |||||||||
| Steam Adjusted Heat Rate |
7,299 | 7,388 | 89 | 1 | |||||||||||
Southeast — Commodity Margin in our Southeast segment increased by $40 million, or 15%, for the year ended December 31, 2009 compared to 2008. The increase was driven by a 35% increase in generation which resulted from higher natural gas generation displacement of coal generation in certain sub-markets in our Southeast segment primarily caused by lower natural gas prices resulting in higher Market Heat Rates in 2009 compared to 2008. Commodity Margin in the Southeast was also positively affected in 2009 compared to 2008, by the favorable impact of an off-take agreement at one of our power plants and incremental natural gas hedges. The benefit from these positive performance factors was partially offset by the negative impact from the settlement of a disputed steam contract, which adversely impacted operating revenues in 2009. In addition, a gain of $21 million related to the temporary assignment of a transmission capacity contract in the second quarter of 2008 led to a reduction in relative year over year performance. We experienced a 1% decrease in our Steam Adjusted Heat Rate in 2009 compared to 2008, resulting from increased generation. The 100 MW, or 2%, decrease in our average total MW in operation for the year ended December 31, 2009 compared to 2008, was due to the deconsolidation of Auburndale in the third quarter of 2008.
73
Table of Contents
Index to Financial Statements
| North: | 2009 | 2008 | Change | % Change | |||||||||||
| Commodity Margin (in millions) |
$ | 268 | $ | 279 | $ | (11 | ) | (4 | )% | ||||||
| Commodity Margin per MWh generated |
$ | 51.06 | $ | 51.70 | $ | (0.64 | ) | (1 | ) | ||||||
| MWh generated (in thousands) |
5,249 | 5,397 | (148 | ) | (3 | ) | |||||||||
| Average availability |
94.7 | % | 92.6 | % | 2.1 | 2 | |||||||||
| Average total MW in operation |
2,873 | 2,412 | 461 | 19 | |||||||||||
| Average capacity factor, excluding peakers |
31.1 | % | 32.8 | % | (1.7 | ) | (5 | ) | |||||||
| Steam Adjusted Heat Rate |
7,614 | 7,584 | (30 | ) | — | ||||||||||
North — Commodity Margin in our North segment decreased by $11 million, or 4%, for the year ended December 31, 2009 compared to 2008. Although market spark spreads were lower in 2009 compared to 2008, the impact was largely mitigated by our hedge position as well as the favorable impact of the reconsolidation of RockGen in December 2008. In addition, despite a 2% increase in our average availability, generation decreased 3% due primarily to lower Market Heat Rates in certain sub-markets in our North segment for the year ended December 31, 2009 compared to 2008. The 461 MW, or 19%, increase in our average total MW in operation for the year ended December 31, 2009 compared to 2008, was due to the reconsolidation of RockGen in December 2008.
Commodity Margin by Segment for the Years Ended December 31, 2008 and 2007
The following tables show our Commodity Margin and related operating performance metrics by segment for the years ended December 31, 2008 and 2007. Our 2008 and 2007 Commodity Margin by segment information has been recast to conform to the current year presentation. In the “Change” and “% Change” columns below, favorable variances are shown without brackets while unfavorable variances are shown with brackets. The MWh generated by segment below represents generation from power plants that we both consolidated and operate.
| West: | 2008 | 2007 | Change | % Change | |||||||||||
| Commodity Margin (in millions) |
$ | 1,255 | $ | 1,172 | $ | 83 | 7 | % | |||||||
| Commodity Margin per MWh generated |
$ | 33.79 | $ | 31.82 | $ | 1.97 | 6 | ||||||||
| MWh generated (in thousands) |
37,137 | 36,837 | 300 | 1 | |||||||||||
| Average availability |
89.1 | % | 90.8 | % | (1.7 | ) | (2 | ) | |||||||
| Average total MW in operation |
7,295 | 7,320 | (25 | ) | — | ||||||||||
| Average capacity factor, excluding peakers |
65.9 | % | 65.2 | % | 0.7 | 1 | |||||||||
| Steam Adjusted Heat Rate |
7,267 | 7,336 | 69 | 1 | |||||||||||
West — Commodity Margin in our West segment increased by $83 million, or 7%, for the year ended December 31, 2008, compared to the year ended December 31, 2007. The increase resulted primarily from higher on-peak market spark spreads driven by higher natural gas prices and the favorable impact of new and renegotiated power contracts for 2008. The Commodity Margin increase associated with the much stronger commodity price environment was largely reflected in an $88 million year over year increase in the realized value of non-region specific gas hedges and the settlement of commodity derivative instruments. The increase in Commodity Margin was partially offset by lower realized margins in the fourth quarter of 2008 as compared to the same period in 2007, and a negative year on year variance associated with natural gas storage inventory. In 2008, we recorded a loss on natural gas storage resulting from the decrease in market natural gas prices in late summer through the fourth quarter of 2008, while in the fourth quarter of 2007 we recognized a positive impact from sales of natural gas storage inventory.
74
Table of Contents
Index to Financial Statements
| Texas: | 2008 | 2007 | Change | % Change | |||||||||||
| Commodity Margin (in millions) |
$ | 726 | $ | 505 | $ | 221 | 44 | % | |||||||
| Commodity Margin per MWh generated |
$ | 22.40 | $ | 15.23 | $ | 7.17 | 47 | ||||||||
| MWh generated (in thousands) |
32,408 | 33,154 | (746 | ) | (2 | ) | |||||||||
| Average availability |
88.8 | % | 90.8 | % | (2.0 | ) | (2 | ) | |||||||
| Average total MW in operation |
7,147 | 7,146 | 1 | — | |||||||||||
| Average capacity factor, excluding peakers |
51.6 | % | 53.0 | % | (1.4 | ) | (3 | ) | |||||||
| Steam Adjusted Heat Rate |
7,082 | 6,830 | (252 | ) | (4 | ) | |||||||||
Texas — Commodity Margin in our Texas segment increased by $221 million, or 44%, for the year ended December 31, 2008, compared to 2007, due primarily to higher market spark spreads driven by higher natural gas prices during the second and third quarters of 2008 and congestion pricing in the South and Houston zones in the second quarter of 2008. Commodity Margin was also improved by higher realized spark spreads on hedged positions in the fourth quarter of 2008 despite lower market spark spreads during the same period. Market spark spreads decreased in September 2008 as compared to the same period in 2007 due to the impact of Hurricane Ike; however, we were able to purchase replacement power at prices below our generation cost and hedged prices during the same period, which had a favorable impact in September 2008. Included in the favorable year on year comparison is a decrease in Commodity Margin as a result of an unfavorable year over year impact of $94 million from the allocation of non-region specific natural gas hedges and the settlement of commodity derivative instruments. Generation in our Texas segment decreased by 2% due to an increase in planned outages for major maintenance for the year ended December 31, 2008 compared to 2007. We experienced a 4% increase in our Steam Adjusted Heat Rate for the year ended December 31, 2008 compared to 2007, resulting from the loss of steam load due to the impact of Hurricane Ike, an extended outage at our Baytown power plant in the first and second quarters of 2008 and lower steam demand from our customers during the second half of 2008.
| Southeast: | 2008 | 2007 | Change | % Change | |||||||||||
| Commodity Margin (in millions) |
$ | 264 | $ | 256 | $ | 8 | 3 | % | |||||||
| Commodity Margin per MWh generated |
$ | 20.59 | $ | 17.30 | $ | 3.29 | 19 | ||||||||
| MWh generated (in thousands) |
12,820 | 14,795 | (1,975 | ) | (13 | ) | |||||||||
| Average availability |
93.6 | % | 92.1 | % | 1.5 | 2 | |||||||||
| Average total MW in operation |
6,183 | 7,204 | (1,021 | ) | (14 | ) | |||||||||
| Average capacity factor, excluding peakers |
26.6 | % | 25.6 | % | 1.0 | 4 | |||||||||
| Steam Adjusted Heat Rate |
7,388 | 7,544 | 156 | 2 | |||||||||||
75
Table of Contents
Index to Financial Statements
Southeast — Commodity Margin in our Southeast segment increased by $8 million, or 3%, for the year ended December 31, 2008 compared to 2007, resulting from the impact of more favorable hedge pricing, the favorable impact of new power contracts and a gain of $21 million during the second quarter of 2008 related to the temporary assignment of a transmission capacity contract. These increases were partially offset by a decrease in market spark spreads realized on open positions for 2008 compared to 2007 and an unfavorable year over year impact of $24 million from the allocation of non-region specific natural gas hedges and the settlement of commodity derivative instruments. We experienced a 4% increase in our average capacity factor, excluding peakers, and a 2% increase in our average availability for the year ended December 31, 2008 compared to 2007. Despite higher availability, generation decreased 13% due to a 1,021 MW decrease in our average total MW in operation following the sale of our interest in Acadia PP in 2007, the sale of Auburndale in 2008 and an unplanned outage at our Carville power plant due to Hurricane Gustav during the third quarter of 2008.
| North: | 2008 | 2007 | Change | % Change | |||||||||||
| Commodity Margin (in millions) |
$ | 279 | $ | 278 | $ | 1 | — | % | |||||||
| Commodity Margin per MWh generated |
$ | 51.70 | $ | 46.14 | $ | 5.56 | 12 | ||||||||
| MWh generated (in thousands) |
5,397 | 6,025 | (628 | ) | (10 | ) | |||||||||
| Average availability |
92.6 | % | 87.4 | % | 5.2 | 6 | |||||||||
| Average total MW in operation |
2,412 | 3,009 | (597 | ) | (20 | ) | |||||||||
| Average capacity factor, excluding peakers |
32.8 | % | 33.2 | % | (0.4 | ) | (1 | ) | |||||||
| Steam Adjusted Heat Rate |
7,584 | 7,646 | 62 | 1 | |||||||||||
North — Commodity Margin in our North segment increased by $1 million resulting from higher hedged levels at more favorable pricing during the third quarter of 2008 compared to the same period in 2007 and a $4 million favorable year over year impact from the allocation of non-region specific natural gas hedges and the settlement of commodity derivative hedging instruments. These gains were largely offset by lower realized spark spreads during the fourth quarter of 2008 compared to the same period in 2007 and the deconsolidation of RockGen in January 2008. Generation in the North decreased 10% due primarily to lower generation at power plants whose generation is contracted and controlled by third parties and outages at our Westbrook Energy Center power plant during the second quarter of 2008.
Adjusted EBITDA
We define Adjusted EBITDA as EBITDA adjusted for certain items described below and presented in the accompanying reconciliation. Adjusted EBITDA is not a measure calculated in accordance with GAAP, and should be viewed as a supplement to and not a substitute for our results of operations presented in accordance with GAAP. Our First Lien Credit Facility and certain of our other debt instruments, including the Commodity Collateral Revolver, include a similar measure as a basis for our material covenants under those debt agreements that excludes our net interest in our unconsolidated subsidiaries and includes distributions received from unconsolidated investments. However, we believe that inclusion of our share of the Adjusted EBITDA of our unconsolidated subsidiaries is useful in evaluating our overall performance and therefore we include Adjusted EBITDA from our unconsolidated investments and exclude distributions received from our unconsolidated investments in our definition of Adjusted EBITDA. Adjusted EBITDA is not intended to represent cash flows from operations or net income (loss) as defined by GAAP as an indicator of operating performance. Furthermore, Adjusted EBITDA is not necessarily comparable to similarly-titled measures reported by other companies.
We believe Adjusted EBITDA is also used by and is useful to investors and other users of our financial statements in evaluating our operating performance because it provides them with an additional tool to compare business performance across companies and across periods. We believe that EBITDA is widely used by investors to measure a company’s operating performance without regard to items such as interest expense, taxes, depreciation and amortization, which can vary substantially from company to company depending upon accounting methods and book value of assets, capital structure and the method by which assets were acquired.
76
Table of Contents
Index to Financial Statements
Additionally, we believe that investors commonly adjust EBITDA information to eliminate the effect of restructuring and other expenses, which vary widely from company to company and impair comparability. As we define it, Adjusted EBITDA represents EBITDA adjusted for the income effects of impairment charges, non-cash gains or losses on sales or dispositions of assets, any unrealized gains or losses and any non-cash realized gains or losses from accounting for derivatives, stock-based compensation expense, operating lease expense, non-cash gains and losses from intercompany foreign currency translations, reorganization items, major maintenance expense, gains or losses on the repurchase or extinguishment of debt and any other extraordinary, unusual or non-recurring items plus adjustments to reflect the Adjusted EBITDA from our unconsolidated investments. We exclude these items from Adjusted EBITDA as our management believes that these items would distort their ability to efficiently view and assess our core operating trends.
In summary, our management uses Adjusted EBITDA as a measure of operating performance to assist in comparing performance from period to period on a consistent basis and to readily view operating trends, as a measure for planning and forecasting overall expectations and for evaluating actual results against such expectations, and in communications with our Board of Directors, shareholders, creditors, analysts and investors concerning our financial performance.
The tables below provide a reconciliation of Adjusted EBITDA to our income (loss) from operations on a segment basis and to net income attributable to Calpine on a consolidated basis for years ended December 31, 2009, 2008 and 2007 (in millions).
| 2009 | ||||||||||||||||||||||
| West | Texas | Southeast | North | Consolidation and Elimination |
Total | |||||||||||||||||
| Net income attributable to Calpine |
$ | 149 | ||||||||||||||||||||
| Net loss attributable to noncontrolling interest |
(4 | ) | ||||||||||||||||||||
| Income tax expense |
15 | |||||||||||||||||||||
| Reorganization items |
(1 | ) | ||||||||||||||||||||
| Other (income) expense and debt extinguishment costs, net |
92 | |||||||||||||||||||||
| Interest expense, net |
813 | |||||||||||||||||||||
| Income from operations |
$ | 732 | $ | 166 | $ | 47 | $ | 126 | $ | (7 | ) | $ | 1,064 | |||||||||
| Add: |
||||||||||||||||||||||
| Adjustments to reconcile income from operations to Adjusted EBITDA: |
||||||||||||||||||||||
| Depreciation and amortization expense, excluding deferred financing costs(1) |
207 | 130 | 84 | 67 | (8 | ) | 480 | |||||||||||||||
| Impairment loss |
4 | — | — | — | — | 4 | ||||||||||||||||
| Major maintenance expense |
88 | 49 | 32 | 5 | — | 174 | ||||||||||||||||
| Operating lease expense |
21 | — | — | 26 | — | 47 | ||||||||||||||||
| Unrealized (gains) losses on commodity derivative mark-to-market activity |
(110 | ) | 59 | 14 | (42 | ) | — | (79 | ) | |||||||||||||
| Adjustments to reflect Adjusted EBITDA from unconsolidated investments(2)(3) |
(16 | ) | — | — | 33 | — | 17 | |||||||||||||||
| Stock-based compensation expense |
17 | 12 | 6 | 3 | — | 38 | ||||||||||||||||
| Non-cash loss on dispositions of assets |
11 | 14 | 5 | 2 | — | 32 | ||||||||||||||||
| Other |
5 | — | — | — | — | 5 | ||||||||||||||||
| Adjusted EBITDA |
$ | 959 | $ | 430 | $ | 188 | $ | 220 | $ | (15 | ) | $ | 1,782 | |||||||||
77
Table of Contents
Index to Financial Statements
| 2008(4) | ||||||||||||||||||||||||
| West | Texas | Southeast | North | Consolidation and Elimination |
Total | |||||||||||||||||||
| Net income attributable to Calpine |
$ | 10 | ||||||||||||||||||||||
| Net loss attributable to noncontrolling interest |
(1 | ) | ||||||||||||||||||||||
| Discontinued operations, net of tax expense |
(23 | ) | ||||||||||||||||||||||
| Income tax benefit |
(47 | ) | ||||||||||||||||||||||
| Reorganization items |
(302 | ) | ||||||||||||||||||||||
| Other (income) expense and debt extinguishment costs, net |
27 | |||||||||||||||||||||||
| Interest expense, net |
1,024 | |||||||||||||||||||||||
| Income (loss) from operations |
$ | 374 | $ | 427 | $ | (168 | ) | $ | 37 | $ | 18 | $ | 688 | |||||||||||
| Add: |
||||||||||||||||||||||||
| Adjustments to reconcile income (loss) from operations to Adjusted EBITDA: |
||||||||||||||||||||||||
| Depreciation and amortization expense, excluding deferred financing costs(1) |
195 | 129 | 92 | 56 | (5 | ) | 467 | |||||||||||||||||
| Impairment loss |
13 | — | 213 | — | — | 226 | ||||||||||||||||||
| Major maintenance expense |
95 | 62 | 20 | 14 | (1 | ) | 190 | |||||||||||||||||
| Operating lease expense |
21 | — | — | 25 | — | 46 | ||||||||||||||||||
| Non-cash realized gains on derivatives |
— | (40 | ) | — | — | — | (40 | ) | ||||||||||||||||
| Unrealized (gains) losses on commodity derivative mark-to-market activity |
86 | (138 | ) | (27 | ) | 44 | — | (35 | ) | |||||||||||||||
| Adjustments to reflect Adjusted EBITDA from unconsolidated investments(2)(3) |
55 | — | 6 | 15 | — | 76 | ||||||||||||||||||
| Stock-based compensation expense |
23 | 16 | 8 | 3 | — | 50 | ||||||||||||||||||
| Non-cash loss on dispositions of assets |
10 | 12 | 10 | 3 | (1 | ) | 34 | |||||||||||||||||
| Other |
(5 | ) | 3 | — | (1 | ) | — | (3 | ) | |||||||||||||||
| Adjusted EBITDA |
$ | 867 | $ | 471 | $ | 154 | $ | 196 | $ | 11 | $ | 1,699 | ||||||||||||
78
Table of Contents
Index to Financial Statements
| 2007(4) | ||||||||||||||||||||||||
| West | Texas | Southeast | North | Consolidation and Elimination |
Total | |||||||||||||||||||
| Net income attributable to Calpine |
$ | 2,693 | ||||||||||||||||||||||
| Net loss attributable to noncontrolling interest |
— | |||||||||||||||||||||||
| Income tax benefit |
(546 | ) | ||||||||||||||||||||||
| Reorganization items |
(3,258 | ) | ||||||||||||||||||||||
| Other (income) expense and debt extinguishment costs, net |
(139 | ) | ||||||||||||||||||||||
| Interest expense, net |
1,955 | |||||||||||||||||||||||
| Income (loss) from operations |
$ | 507 | $ | 175 | $ | (12 | ) | $ | 38 | $ | (3 | ) | $ | 705 | ||||||||||
| Add: |
||||||||||||||||||||||||
| Adjustments to reconcile income (loss) from operations to Adjusted EBITDA: |
||||||||||||||||||||||||
| Depreciation and amortization expense, excluding deferred financing costs(1) |
213 | 129 | 113 | 55 | (3 | ) | 507 | |||||||||||||||||
| Impairment loss |
10 | — | 2 | 34 | — | 46 | ||||||||||||||||||
| Major maintenance expense |
35 | 38 | 14 | 12 | (1 | ) | 98 | |||||||||||||||||
| Operating lease expense |
20 | — | — | 34 | — | 54 | ||||||||||||||||||
| Non-cash realized (gains) losses on derivatives |
4 | (62 | ) | 3 | 1 | — | (54 | ) | ||||||||||||||||
| Unrealized (gains) losses on commodity derivative mark-to-market activity |
15 | 16 | 2 | 2 | — | 35 | ||||||||||||||||||
| Adjustments to reflect Adjusted EBITDA from unconsolidated investments(2)(3) |
8 | — | — | 13 | — | 21 | ||||||||||||||||||
| Stock-based compensation expense (income) |
(1 | ) | — | — | — | — | (1 | ) | ||||||||||||||||
| Non-cash loss on dispositions of assets |
12 | 11 | 5 | 5 | — | 33 | ||||||||||||||||||
| Other |
— | (5 | ) | 9 | (3 | ) | — | 1 | ||||||||||||||||
| Adjusted EBITDA |
$ | 823 | $ | 302 | $ | 136 | $ | 191 | $ | (7 | ) | $ | 1,445 | |||||||||||
| (1) | Depreciation and amortization expense in the income (loss) from operations calculation on our Consolidated Statements of Operations excludes amortization of other assets and amounts classified as sales, general and other administrative expenses. |
| (2) | Included in our Consolidated Statements of Operations in (income) loss from unconsolidated investments in power plants. |
| (3) | Adjustments to reflect Adjusted EBITDA from unconsolidated investments include $(47) million, $55 million and $17 million in unrealized (gains) losses on mark-to-market activity for the years ended December 31, 2009, 2008 and 2007, respectively. |
| (4) | Adjusted EBITDA for years ended December 31, 2008 and 2007, has been recast to conform to the current year presentation. |
LIQUIDITY AND CAPITAL RESOURCES
Our business is capital intensive. Our ability to successfully implement our strategy is dependent on the continued availability of capital on attractive terms. In addition, our ability to successfully operate our business and to meet certain near-term debt repayment obligations is dependent on maintaining sufficient liquidity.
79
Table of Contents
Index to Financial Statements
Liquidity
As of December 31, 2009, we had $989 million in cash and cash equivalents and $562 million of restricted cash. Our availability under our First Lien Credit Facility revolver as of December 31, 2009, is $794 million for future letters of credit or cash borrowings. The following table provides a summary of our liquidity position at December 31, 2009 and 2008 (in millions):
| 2009 | 2008 | |||||
| Cash and cash equivalents, corporate(1) |
$ | 725 | $ | 1,361 | ||
| Cash and cash equivalents, non-corporate |
264 | 296 | ||||
| Total cash and cash equivalents |
989 | 1,657 | ||||
| Restricted cash |
562 | 503 | ||||
| Letter of credit availability(2) |
34 | 2 | ||||
| Revolver availability(3) |
794 | 16 | ||||
| Total current liquidity availability(4) |
$ | 2,379 | $ | 2,178 | ||
| (1) | Includes $9 million and $169 million of margin deposits held by us posted by our counterparties as of December 31, 2009 and 2008, respectively. |
| (2) | Additional available balances for Calpine Development Holdings, Inc. As of December 31, 2009, we have the option to increase our availability by an additional $50 million under this letter of credit facility by satisfying certain conditions. |
| (3) | We repaid $725 million previously drawn on our First Lien Credit Facility revolver on September 28, 2009. |
| (4) | Excludes contingent amounts of $150 million under the Knock-in Facility and $200 million under the Commodity Collateral Revolver as of December 31, 2008. |
Volatility in the financial markets in late 2008 and continuing into 2009, including the failure or merger of certain financial institutions and continued uncertainty surrounding the stability of others continues to constrict access to capital and credit markets in the U.S. and worldwide, including within our industry, for us and for our counterparties. As a result, we and the industry have experienced increased credit and liquidity risk over the past year. Although there have been some signs of economic recovery, we are unable to predict the timing, strength or related impacts that a recovery, if any, will have on us, our counterparties or the current volatility in the financial markets. Additionally, while we have been successful in completing significant financing transactions in 2009, we cannot provide any assurance that we will continue to be successful in the future. Consequently, current uncertain economic conditions and volatile financial markets may persist during 2010 or possibly longer. Even if we are not impacted directly, we could be impacted indirectly in the event our counterparties are unable to perform under their contractual obligations with us. We actively monitor our exposure to our counterparties including their credit status.
Downward pressure on our Commodity Margin continues to be a risk as a result of the current economic conditions. As of December 31, 2009, we have economically hedged a substantial portion of our generation and natural gas portfolio mostly through power and natural gas forward physical and financial transactions for 2010; however, we remain susceptible to significant price movements for 2011 and beyond. The future impact on our Commodity Margin, primarily beyond 2010, is highly dependent on the severity and duration of the economic downturn, the speed, strength and duration of an economic recovery, if any, and our continued ability to successfully hedge our Commodity Margin. During pronounced recessionary periods, there can be a decrease in power demand primarily driven by decreased usage by the industrial and manufacturing sectors. This “softening” of demand typically results in more demand satisfied by baseload and intermediate units using lower variable cost fuel sources, such as coal and nuclear fuel, and less demand served by higher variable cost units such as
80
Table of Contents
Index to Financial Statements
natural gas-fired peaker power plants. Additionally, a recessionary environment can result in lower natural gas prices, which may adversely impact our Commodity Margin as our cost of production advantage relative to less efficient natural gas-fired generation is diminished on an absolute basis.
Liquidity Sensitivity — Significant changes in commodity prices and Market Heat Rates can have an impact on our liquidity as we use margin deposits, cash prepayments and letters of credit as credit support (collateral) with and from our counterparties for commodity procurement and risk management activities. Utilizing our portfolio of transactions subject to collateral exposure, we estimate that as of February 5, 2010, an increase of $1/MMBtu in natural gas prices would result in an increase of collateral required by approximately $46 million. If natural gas prices decreased by $1/MMBtu, we estimate that our collateral requirements would decrease by approximately $19 million. Changes in Market Heat Rates also affect our liquidity. For example, as demand increases, less efficient generation is dispatched, which increases the Market Heat Rate and results in increased collateral requirements. Historical relationships of natural gas and Market Heat Rate movements for our portfolio of assets have been volatile over time; therefore, we derived a statistical analysis that implies that a change of $1/MMBtu in natural gas approximates an average Market Heat Rate change of 170 Btu/KWh. We estimate that as of February 5, 2010, an increase of 170 Btu/KWh in the Market Heat Rate would result in an increase in collateral required by approximately $23 million. If Market Heat Rates were to fall at a similar rate, we estimate that our collateral required would decrease by $23 million. These amounts are not necessarily indicative of the actual amounts that could be required, which may be higher or lower than the amounts estimated above.
In order to reduce the cash collateral and letters of credit that we would otherwise be required to provide to our counterparties, we have granted additional liens on the assets currently subject to liens under our First Lien Credit Facility to collateralize our obligations under certain of our power and natural gas agreements that qualify as “eligible commodity hedge agreements” under our First Lien Credit Facility and First Lien Notes, and certain of our interest rate swap agreements. The counterparties under such agreements will share the benefits of the collateral subject to such liens ratably with the lenders under our First Lien Credit Facility. During 2009, we have increased our usage of these additional liens in order to help manage cash collateral that would otherwise be required. See Note 10 of the Notes to Consolidated Financial Statements for further information on our margin deposits and collateral used for commodity procurement and risk management activities.
It is difficult to predict future developments and the amount of credit support that we may need to provide as part of our business operations should financial market and commodity price volatility and the economic downturn persist for a significant period of time; however, we believe that we have adequate resources from a combination of cash and cash equivalents on hand and cash expected to be generated from future operations to continue to meet our obligations as they become due. Our ability to generate sufficient cash is dependent upon, among other things:
| • | improving the profitability of our operations; |
| • | continued compliance with the covenants under our First Lien Credit Facility, First Lien Notes and other existing financing obligations; |
| • | stabilizing and increasing future contractual cash flows; and |
| • | our significant counterparties performing under their contracts with us. |
Capital Resources and Management
During 2009, we have opportunistically completed several financing transactions to strengthen our balance sheet and improve our flexibility and management of our capital structure. For a more detailed discussion of our 2009 financing transactions, our debt and related terms, see Note 7 of the Notes to Consolidated Financial Statements. Significant 2009 financing transactions are summarized below.
81
Table of Contents
Index to Financial Statements
Steamboat Amended Credit Facility — On November 24, 2009, Steamboat amended and extended the terms of its credit agreement. The Steamboat Amended Credit Facility increases the amount of term loans outstanding by $17 million from $448 million to $465 million. The increase in the borrowing was used to pay accrued and unpaid interest, breakage costs and other fees in connection with closing the Steamboat Amended Credit Facility. The Steamboat Amended Credit Facility also provides for a “security fund” letter of credit facility of up to $11 million and a “DSR” letter of credit facility of up to approximately $23 million. The maturity date of the term loans has been extended from December 2011 to November 24, 2017. The security fund letter of credit facility matures on November 24, 2017 with the term loans and the DSR letter of credit facility matures on September 29, 2017.
Amendment of First Lien Credit Facility and Issuance of First Lien Notes due 2017 — We executed the First Amendment to Credit Agreement and Second Amendment to Collateral Agency and Intercreditor Agreement dated as of August 20, 2009, which amended both the First Lien Credit Facility Credit Agreement and the First Lien Credit Facility Collateral Agency and Intercreditor Agreement. The amendment provides additional flexibility with our capital structure and First Lien Credit Facility by granting us the option, subject to certain conditions, to buy back debt at a discount using cash on hand via an auction process; to offer first lien bonds in exchange for or to retire First Lien Credit Facility term loans; to issue up to $2.0 billion of first lien bonds in lieu of issuing first lien term loans under the accordion provision of our First Lien Credit Facility; and to extend all or a portion of the revolver and term loan maturities, on revised terms, subject to acceptance by applicable lenders. In addition, the amendment provides for the aggregation of various investment and capital expenditure baskets for covenant purposes. We subsequently issued approximately $1.2 billion aggregate principal amount of First Lien Notes in a private placement on October 21, 2009. We received no net cash proceeds from the transaction. The offer and sale of our First Lien Notes was consummated as a permitted debt exchange pursuant to our First Lien Credit Facility in exchange for a like principal amount of First Lien Credit Facility term loans. Upon their exchange for First Lien Notes, such term loans were canceled and may not be redrawn.
CCFC Refinancing — On May 19, 2009, our wholly owned subsidiaries, CCFC and CCFC Finance, issued approximately $1.0 billion aggregate principal amount of CCFC New Notes in a private placement. The CCFC New Notes mature on June 1, 2016. The CCFC New Notes are not guaranteed by Calpine Corporation and are without recourse to Calpine Corporation or any of our other non-CCFC or CCFC Finance subsidiaries or assets. The net proceeds received of $939 million, together with CCFC cash on hand of $271 million, were used to:
| • | repay the $364 million outstanding under the CCFC Term Loans on May 19, 2009; |
| • | redeem the $415 million outstanding principal amount of CCFC Old Notes on June 18, 2009; |
| • | distribute $327 million to CCFC’s indirect parent, CCFCP, which was used by CCFCP to redeem its $300 million CCFCP Preferred Shares on or before July 1, 2009; and |
| • | in each case, pay any interest, prepayment penalties and other amounts due through the date of such repayment or redemption. |
As a result of the CCFC Refinancing transactions, we were able to extend the maturities of approximately $1.0 billion of debt by several years, at the same time converting it from a floating to a fixed interest rate and lowering our effective interest rate on such debt to 8.0% from a current weighted average interest rate of approximately 9.4% with respect to the CCFC Term Loans, CCFC Old Notes and CCFCP Preferred Shares.
Concurrent with the CCFC Refinancing, we replaced various intercompany agreements with our CCFC subsidiaries for the related sales and purchases of power, natural gas and the operation and maintenance of our CCFC power plants, which did not materially impact our results of operations, financial condition or cash flows on a consolidated basis. While there is no direct recourse by holders of the CCFC New Notes to Calpine Corporation, a substantial portion of the commodity price risk related to CCFC’s power generation is absorbed by Calpine Corporation as an indirect wholly owned subsidiary of Calpine Corporation purchases the power generated by CCFC under an intercompany tolling agreement, which is also guaranteed by Calpine Corporation.
82
Table of Contents
Index to Financial Statements
Deer Park Financing — On January 21, 2009, Deer Park, our indirect wholly owned subsidiary, closed on $156 million of senior secured credit facilities, which include a $150 million term facility and a $6 million letter of credit facility. Proceeds received were used to settle an existing commodity contract of approximately $79 million, pay financing and legal fees of approximately $8 million and fund approximately $22 million in restricted cash. The remainder was distributed to Calpine Corporation for general corporate purposes. The senior term loan facility matures on January 21, 2012.
Letter of Credit Facilities — The table below represents amounts issued under our letter of credit facilities as of December 31, 2009 (in millions):
| 2009 | |||
| First Lien Credit Facility |
$ | 206 | |
| Calpine Development Holdings, Inc. |
116 | ||
| Various project financing facilities |
90 | ||
| Total |
$ | 412 | |
Cash Management — We manage our cash in accordance with our intercompany cash management system subject to the requirements of our First Lien Credit Facility and requirements under certain of our project debt and lease agreements or by regulatory agencies. Our cash and cash equivalents, as well as our restricted cash balances, generally exceed FDIC insured limits or are invested in money market accounts with investment banks that are not FDIC insured. We place our cash, cash equivalents and restricted cash in what we believe to be credit-worthy financial institutions and certain of our money market accounts invest in U.S. Treasury securities or other obligations issued or guaranteed by the U.S. government, its agencies or instrumentalities.
We do not expect to pay any cash dividends on our common stock for the foreseeable future because we are currently prohibited under our First Lien Credit Facility and certain of our other debt agreements from paying cash dividends. Future cash dividends, if any, will be at the discretion of our Board of Directors and will depend upon, among other things, our future operations and earnings, capital requirements, general financial condition, contractual and financing restrictions and such other factors as our Board of Directors may deem relevant.
NOLs — We have significant NOLs that will provide future tax deductions if we generate sufficient taxable income, and do not become subject to significant limitations under Section 382 of the IRC during the applicable carryover periods. Our federal and state income tax reporting group is comprised primarily of two groups, CCFC and its subsidiaries, which we refer to as the CCFC group and Calpine Corporation and its subsidiaries other than CCFC, which we refer to as the Calpine group. As of December 31, 2009, our consolidated federal NOLs totaled approximately $7.5 billion, which consists of approximately $7.0 billion from the Calpine group and approximately $513 million from the CCFC group. Approximately $5.5 billion of our NOLs have annual limitations under Section 382 of the IRC. Subject to limitations, Section 382 amounts not used can be carried forward to succeeding years. In addition, as of December 31, 2009, we have approximately $1.1 billion in foreign NOLs and $4.6 billion in state NOLs on a consolidated basis. The Calpine group has recorded a valuation allowance against the deferred taxes related to most of their NOLs as we determined it is more likely than not that they will expire unutilized.
Project Development, Upgrades and Growth Initiatives
We continue to review development opportunities, which were put on hold during the pendency of our Chapter 11 cases, to determine whether future actions are appropriate and we may pursue new opportunities that arise, particularly if power contracts and financing are available and attractive returns are expected.
OMEC — OMEC began commercial operations on October 3, 2009. The completion of OMEC added approximately 608 MW of baseload (with peaking) capacity representing our unconsolidated net interest in the power plant.
83
Table of Contents
Index to Financial Statements
Russell City Energy Center — Russell City Energy Center remains under advanced development. The Russell City Energy Center is currently contracted to deliver its full output to PG&E under a PPA, which was executed in December 2006 and approved by the CPUC in January 2007. The PPA was amended in 2008 and was approved by the CPUC on April 16, 2009. On February 4, 2010, we received the PSD air permit, the final permit necessary, to begin construction of our Russell City Energy Center. We hope to complete financing and break ground for this new state-of-the-art power plant during 2010 with commercial operations scheduled to begin in 2013. We do not expect the costs to complete the Russell City Energy Center to be material to us on a consolidated basis. Upon completion, this project would bring on line approximately 362 MW of net interest baseload capacity (390 MW with peaking capacity) representing our 65% interest.
Los Esteros Critical Energy Center — During 2009, we and PG&E negotiated a new agreement to replace the existing CDWR contract and facilitate the upgrade of our Los Esteros Critical Energy Facility from a 188 MW simple-cycle generation power plant to a 308 MW combined-cycle generation power plant. In addition to the increase in capacity, the upgrade will increase the efficiency and environmental performance of the power plant by lowering the Heat Rate.
Geysers Development and Investment Tax Credits — We are currently seeking to take advantage of certain incentives under the American Recovery and Reinvestment Act of 2009, also referred to as the Stimulus Bill, that could impact our growth and development of our Geysers Assets. Specifically, the Stimulus Bill:
| • | extends the placed-in-service deadline through 2013 for geothermal projects to qualify for “production tax credits”; |
| • | allows geothermal developers to elect to receive a 30% “investment tax credit” in lieu of production tax credits with respect to certain new construction of “qualified property” placed in service during 2009 or 2010 (or, in certain cases, after 2010), or 10% on re-powering of existing power plants or a cash grant in lieu of investment tax credits or production tax credits with respect to such qualified property (subject to satisfying certain procedural and other requirements mandated by recently-issued Department of Treasury guidance); and |
| • | designates $6.0 billion in funds to serve as a loss reserve and source of funding for a federal loan guarantee program anticipated to backstop renewable energy project financing. |
In December 2009, we filed for cash grants of approximately $2 million in lieu of the 10% investment tax credit on two of our re-power projects. We expect that any new geothermal power plant development of our Geysers Assets will qualify for the 30% investment tax credit from the U.S. Internal Revenue Service, and our additional projects for the re-powering of our existing power plants will qualify for the 10% investment tax credit.
Major Maintenance and Capital Spending — Our major maintenance and capital spending remains an important part of our business. Our expected expenditures for 2010 are the following (in millions):
| 2010 | |||
| Major maintenance expense |
$ | 178 | |
| Capital expenditures, operations |
112 | ||
| Total |
290 | ||
| Turbine upgrades and Geysers Assets expansion |
50 | ||
| Total major maintenance expense and capital spending |
$ | 340 | |
We believe that upgrades and expansions to our current assets offer proven and financially disciplined opportunities to improve our operations, capacity and efficiencies. We are in the process of upgrading certain of
84
Table of Contents
Index to Financial Statements
our Siemens turbines to increase our generation capacity by approximately 180 MW. These upgrades began in the fourth quarter of 2009 and are scheduled through 2014 with estimated remaining capital expenditures of approximately $87 million as of December 31, 2009. Our expected capital expenditures for each of the next five years for major maintenance and for operations are expected to average approximately $300 million.
These amounts do not include approximately $85 million, which we expect to incur in 2010 for the new construction for Russell City Energy Center and upgrade of the Los Esteros Critical Energy Facility.
Prior Asset Sales and Purchase — A significant component of our restructuring activities was to return our focus to our core strategic assets. As a result of the review of our asset portfolio performed during our Chapter 11 restructuring, during 2008 and 2007, we have sold or otherwise disposed of the Fremont and Hillabee development projects, our equity interests in Auburndale and Acadia PP and our assets related to the Parlin Power Plant, PSM, Goldendale Energy Center and the Aries Power Plant. In addition, we purchased the assets of the RockGen Energy Center in 2008. See Notes 4 and 6 of the Notes to Consolidated Financial Statements for additional discussion of these asset sales and purchase. While we have made no significant asset dispositions or purchases in 2009, we continually evaluate our portfolio of assets and may take such actions in the future if we believe they will optimize our existing assets.
Cash Flow Activities
The following table summarizes our cash flow activities for the years ended December 31, 2009, 2008 and 2007 (in millions):
| 2009 | 2008 | 2007 | |||||||||
| Beginning cash and cash equivalents |
$ | 1,657 | $ | 1,915 | $ | 1,077 | |||||
| Net cash provided by (used in): |
|||||||||||
| Operating activities |
761 | 494 | 187 | ||||||||
| Investing activities |
(250 | ) | 516 | 473 | |||||||
| Financing activities |
(1,179 | ) | (1,268 | ) | 178 | ||||||
| Net (decrease) increase in cash and cash equivalents |
(668 | ) | (258 | ) | 838 | ||||||
| Ending cash and cash equivalents |
$ | 989 | $ | 1,657 | $ | 1,915 | |||||
2009 — 2008
Net Cash Provided By Operating Activities
Cash provided by operating activities for the year ended December 31, 2009, improved to $761 million compared to $494 million for the year ended December 31, 2008. Our improvement in cash provided by operating activities was primarily due to:
| • | Gross profit — Gross profit, excluding changes in unrealized mark-to-market activity, depreciation expense and loss on asset disposals, increased by $26 million for the year ended December 31, 2009, as compared to 2008. This was attributable to higher Commodity Margin and lower cash operating costs in 2009. |
| • | Interest paid — Cash paid for interest decreased by $299 million to $761 million for the year ended December 31, 2009, as compared to $1,060 million for 2008, primarily due to the repayment of the Second Priority Debt, and, to a lesser extent, lower interest rates for the comparable period in 2009. |
| • | Reorganization items — Cash payments for reorganization items decreased by $115 million. |
| • | Cash taxes — Net cash received for taxes increased by $33 million. |
85
Table of Contents
Index to Financial Statements
Our improvements in cash provided by operating activities were partially offset by the following:
| • | Working capital — Working capital employed, after adjusting for debt related balances and derivative activities which did not impact cash provided by operating activities, increased by approximately $152 million for the year ended December 31, 2009 compared to 2008. The increase was primarily due to the sale during 2008 of assets previously reflected as assets held for sale at December 31, 2007 offset by a net reduction in working capital employed in 2009 for margins and net accounts receivable and payable. |
| • | Debt extinguishment costs — Cash payments for debt extinguishment costs in 2009 were $39 million related to the CCFC Refinancing, compared to cash payments of $6 million related to the refinancing of Blue Spruce and Metcalf in 2008. |
Net Cash Provided By (Used In) Investing Activities
Cash flows used in investing activities for the year ended December 31, 2009, were $250 million compared to cash flows provided by investing activities of $516 million for the year ended December 31, 2008. The decrease in cash flows from investing activities was primarily due to:
| • | Sales of power plants, turbines and investments — We had no significant asset sales in 2009 compared to $413 million of cash received primarily from the sales of the Fremont and Hillabee development projects in 2008. |
| • | Sales of discontinued operations — We had no significant asset sales in 2009 compared to $79 million of cash received from the sale of Rosetta in 2008. |
| • | Reconsolidation of our Canadian Debtors and other deconsolidated foreign entities — In 2008, we had a favorable cash effect of $64 million from the reconsolidation of our Canadian Debtors and other deconsolidated foreign entities. |
| • | Contributions to unconsolidated investments — Contributions increased by $2 million in 2009 primarily due to the funding of OMEC offset by reduced contributions to Greenfield LP. |
| • | Return of investment from unconsolidated investments — For the year ended December 31, 2009, we received distributions of $9 million compared to $27 million for the year ended December 31, 2008. |
| • | Capital expenditures — Capital expenditures increased by $36 million resulting from our maintenance programs and turbine upgrades. |
| • | Increase in restricted cash — Restricted cash increased $59 million in 2009 compared to a $78 million decrease in 2008 primarily due to our refinancing activities. |
Net Cash Used In Financing Activities
Due to our emergence from Chapter 11 during the first quarter of 2008, our financing activities are not directly comparable. Cash used in financing activities for the year ended December 31, 2009, resulted in a net outflow of $1.2 billion compared to a net outflow of $1.3 billion for the same period in 2008. Our significant cash flows from our 2009 and 2008 financing transactions are described below:
| • | During the year ended December 31, 2009, we repaid approximately $725 million previously drawn on our First Lien Credit Facility revolver and we made a net pay down of approximately $119 million when we refinanced the CCFC Old Notes, CCFC Term Loans and CCFC Preferred Shares with the |
86
Table of Contents
Index to Financial Statements
| CCFC New Notes. We also made scheduled repayments of approximately $60 million under our First Lien Credit Facility term loans and $280 million on notes payable, other project debt and capital lease obligations. |
| • | During 2008, we borrowed approximately $4.2 billion under our First Lien Facilities and used that borrowing and cash on hand to repay approximately $3.7 billion of the Second Priority Debt, $1.1 billion on the senior secured revolver, $300 million on the bridge facility, and $143 million of First Lien Credit Facility term loans. In addition, we received proceeds of $355 million from refinancing Metcalf and Blue Spruce and repaid $585 million of other project debt, capital leases and notes payable. |
| • | We incurred finance costs of $65 million in 2009 to facilitate an amendment to our First Lien Credit Facility term loans and to refinance CCFC, Deer Park and other project debt. During the year ended December 31, 2008, we incurred $207 million of finance costs primarily related to closing on our First Lien Facilities. |
| • | We received $64 million from the settlement of derivatives with an other-than-insignificant financing element for the year ended December 31, 2008. |
2008 — 2007
Net Cash Provided By Operating Activities
Cash flows provided by operating activities for the year ended December 31, 2008, resulted in net inflows of $494 million as compared to net inflows of $187 million for the same period in 2007. Cash flows from operating activities were primarily due to increases in:
| • | Gross profit — Gross profit, excluding changes in depreciation and impairments, increased by $222 million in 2008 primarily due to higher spark spreads resulting from high gas prices during the first half of the year. The favorable margins were partially offset by higher plant operating expenses. |
| • | Interest paid — Cash paid for interest decreased by $83 million to $1,060 million for the year ended December 31, 2008, as compared to $1,143 million in 2007, primarily due to additional adequate protection payments required while in Chapter 11 to holders of our Second Priority Debt in 2007. |
| • | Working capital — Working capital employed relating to operating assets and liabilities changed by approximately $53 million during the year, after adjusting for actual cash flows from derivative activities that are included in net derivative assets and liabilities. This increase in 2008 was primarily the result of a slight increase in inventory levels as compared to 2007. |
Net Cash Provided By Investing Activities
Cash flows provided by investing activities for the year ended December 31, 2008, increased by $43 million to $516 million from $473 million for the year ended December 31, 2007. The difference was primarily due to:
| • | Capital expenditures — Purchases for property, plant and equipment decreased by $53 million in 2008 as compared to 2007. |
| • | Sales of power plants, turbines and investments — Proceeds from asset sales decreased by $128 million in 2008 compared to 2007. See Note 6 of the Notes to Consolidated Financial Statements for a list of assets sold during 2008 and 2007. |
87
Table of Contents
Index to Financial Statements
| • | Sale of discontinued operations — Proceeds of $79 million were received in 2008 from the sale of Rosetta. |
| • | Deconsolidation and reconsolidation — We experienced a favorable effect on cash of $64 million from the reconsolidation of our Canadian Debtors and other deconsolidated foreign entities in 2008, as compared to an unfavorable effect on cash of $29 million for the deconsolidation of OMEC in 2007. |
| • | Contributions to unconsolidated investments — Contributions decreased by $51 million in 2008 primarily due to the completion of the Greenfield LP project financing in May 2007. |
| • | Return of investment from unconsolidated investments — For the year ended December 31, 2008, we received cash of $27 million as a partial return of investment compared to $104 million received from Greenfield LP and $75 million related to the Canadian Debtors and other deconsolidated foreign entities for the year ended December 31, 2007. |
| • | Decrease in restricted cash — The net reduction in restricted cash was $78 million, compared to a $37 million decrease in 2007. Restricted cash decreased in 2008 mainly due to paying down debt and refinancing activities. |
Net Cash Provided By (Used In) Financing Activities
Cash flows used in financing activities for the year ended December 31, 2008, resulted in net outflows of approximately $1.3 billion, as compared to cash provided by financing activities of $178 million for the year ended December 31, 2007; because of our emergence from Chapter 11 in 2008, our cash flows provided by (used in) our financing activities are not directly comparable to 2007. The significant transactions and changes in our financing activities as compared to 2007 are described below:
| • | Borrowings and repayments under our First Lien Facilities — On and subsequent to the Effective Date, we borrowed $4.2 billion under our First Lien Facilities and used cash on hand to repay a portion of the Second Priority Debt and to fund other cash payment obligations under our Plan of Reorganization, working capital and other general corporate purposes. In addition, for the year ended December 31, 2008, we repaid approximately $1.5 billion of borrowings under our First Lien Facilities consisting of the repayment of the $300 million bridge facility, with the remainder applied to repayments under our First Lien Credit Facility, primarily the revolving facility thereunder, and $725 million of which amount was subsequently reborrowed in October 2008. For the year ended December 31, 2007, borrowings under our DIP Facility resulted in cash inflows of $614 million. |
| • | Repayment of debt obligations — During 2008 we repaid $275 million for project financing, which primarily related to the Metcalf and Blue Spruce refinancings. During 2007, the repayment of debt obligations, in general, related to only those project finance facilities and other borrowings associated with our subsidiaries and affiliates that were not Calpine Debtors, except as otherwise ordered by the U.S. Bankruptcy Court or the Canadian Court such as the repayment of $224 million of CalGen Secured Debt pursuant to a settlement approved by the U.S. Bankruptcy Court. |
| • | Financing costs — We incurred financing costs of $207 million, primarily related to closing on our First Lien Facilities in 2008, as compared to financing costs incurred in 2007 of $81 million primarily related to the refinancing in March 2007 of the Original DIP Facility with the DIP Facility. |
| • | Preferred interests — For the year ended December 31, 2008, we paid $166 million for the redemption or repayment of preferred interests primarily consisting of the repayment of $155 million in preferred interests related to Metcalf, as compared to $9 million for the year ended December 31, 2007. |
88
Table of Contents
Index to Financial Statements
| • | Derivative contracts — We received $64 million from the settlement of derivatives with an other-than-insignificant financing element for the year ended December 31, 2008. |
Emergence from Chapter 11 and Implementation of Our Plan of Reorganization
We emerged from Chapter 11 on January 31, 2008. At the Petition Date, we carried $17.4 billion of debt with an average interest rate of 10.3%. As a result of retiring unsecured debt with reorganized Calpine Corporation common stock, proceeds received from the sale of certain of our assets and the repayment or refinancing of certain of our project debt, we reduced our pre-petition debt by approximately $7.0 billion. Upon our emergence from Chapter 11, we carried $10.4 billion of debt with an average interest rate of 8.1%.
In connection with our emergence from Chapter 11, we recorded certain “plan effect” adjustments to our Consolidated Balance Sheet as of the Effective Date in order to reflect certain provisions of our Plan of Reorganization. These adjustments included the distribution of approximately $4.1 billion in cash and the authorized issuance of 485 million shares of reorganized Calpine Corporation common stock primarily for the discharge of LSTC, repayment of the Second Priority Debt and for various other administrative and other post-petition claims. As a result, our equity increased by approximately $8.9 billion. We borrowed approximately $6.4 billion under our First Lien Facilities, which was used to repay the outstanding term loan balance of $3.9 billion (excluding the unused portion under the $1.0 billion revolver) under our DIP Facility. The remaining net proceeds of approximately $2.5 billion were used to fund cash payment obligations under our Plan of Reorganization including the repayment of a portion of the Second Priority Debt and the payment of administrative claims. The reorganization items on our Consolidated Statements of Operations are primarily driven by our financing and restructuring activities. Our historical financial performance during the pendency of our Chapter 11 cases and CCAA proceedings is likely not indicative of our future financial performance.
See Note 16 of the Notes to Consolidated Financial Statements for further information regarding our Chapter 11 proceedings and our emergence from Chapter 11.
Counterparties and Customers
Our counterparties primarily consist of three categories of entities who participate in the wholesale energy markets: financial institutions and trading companies; regulated utilities, municipalities, cooperatives and other retail power suppliers; and oil, natural gas, chemical and other energy-related industrial companies. We have exposure to trends within the energy industry, including declines in the creditworthiness of our marketing counterparties. Currently, certain of our marketing counterparties within the energy industry have below investment grade credit ratings. However, we do not currently have any significant exposures to counterparties that are not paying on a current basis.
Credit Considerations
Our credit rating has, among other things, generally required us to post significant collateral with our hedging counterparties. Our collateral is generally in the form of cash deposits, letters of credit or first liens on our assets. See also Note 10 of the Notes to Consolidated Financial Statements for our use of collateral. Our credit rating has also reduced the number of hedging counterparties willing to extend credit to us and reduced our ability to negotiate more favorable terms with them. However, we believe that we will continue to be able to work with our hedging counterparties to execute beneficial hedging transactions and provide adequate collateral.
As of December 31, 2009, our First Lien Credit Facility and our corporate rating had the following ratings and commentary from Standard and Poor’s and Moody’s Investors Service:
| Standard and Poor’s | Moody’s Investors Service | |||
| First Lien Credit Facility rating |
B+ | B2 | ||
| Corporate rating |
B | B2 | ||
| Commentary |
Stable | Positive Watch |
89
Table of Contents
Index to Financial Statements
Off Balance Sheet Commitments of Our Power Plant Operating Leases and Our Unconsolidated Subsidiaries
Some of our power plant operating leases include certain sale/leaseback transactions that are not reflected on our balance sheet. All counterparties in these transactions are third parties that are unrelated to us. The sale/leaseback transactions utilize special purpose entities formed by the equity investors with the sole purpose of owning a power plant. Some of these operating leases contain customary restrictions on dividends, additional debt and further encumbrances similar to those typically found in project finance debt instruments. We have no ownership or other interest in any of these special purpose entities. See Note 17 of the Notes to Consolidated Financial Statements for the future minimum lease payments under our power plant operating leases.
Some of our unconsolidated equity method investments have debt that is not reflected on our Consolidated Balance Sheets. As of December 31, 2009, our equity method investees (Greenfield LP, OMEC and Whitby) had aggregate debt outstanding of $873 million. Based on our pro rata share of each of the investments, our share of such debt would be approximately $624 million. All such debt is non-recourse to us. See Note 4 of the Notes to Consolidated Financial Statements for additional information on our investments.
Guarantee Commitments — As part of our normal business operations, we enter into various agreements providing, or otherwise arranging, financial or performance assurance to third parties on behalf of our subsidiaries in the ordinary course of such subsidiaries’ respective business. Such arrangements include guarantees, standby letters of credit and surety bonds for power and natural gas purchase and sale arrangements and contracts associated with the development, construction, operation and maintenance of our fleet of power plants. These arrangements are entered into primarily to support or enhance the creditworthiness otherwise attributed to a subsidiary on a stand-alone basis, thereby facilitating the extension of sufficient credit to accomplish the subsidiaries’ intended commercial purposes. Our primary commercial obligations as of December 31, 2009, are as follows (in millions):
| Amounts of Commitment Expiration per Period | |||||||||||||||||||||
| Guarantee Commitments |
2010 | 2011 | 2012 | 2013 | 2014 | Thereafter | Total Amounts Committed | ||||||||||||||
| Guarantee of subsidiary debt(1) |
$ | 73 | $ | 72 | $ | 70 | $ | 66 | $ | 54 | $ | 647 | $ | 982 | |||||||
| Standby letters of credit(2)(4) |
384 | 28 | — | — | — | — | 412 | ||||||||||||||
| Surety bonds(3)(4)(5) |
— | — | — | — | — | 4 | 4 | ||||||||||||||
| Guarantee of subsidiary operating lease payments(4) |
10 | 67 | 5 | 5 | 5 | 216 | 308 | ||||||||||||||
| Total |
$ | 467 | $ | 167 | $ | 75 | $ | 71 | $ | 59 | $ | 867 | $ | 1,706 | |||||||
| (1) | Represents Calpine Corporation guarantees of certain power plant capital leases and related interest. All guaranteed capital leases are recorded on our Consolidated Balance Sheets. |
| (2) | The standby letters of credit disclosed above represent those disclosed in Note 7 of the Notes to Consolidated Financial Statements. |
| (3) | The majority of surety bonds do not have expiration or cancellation dates. |
| (4) | These are off balance sheet obligations. |
| (5) | As of December 31, 2009, $4 million of cash collateral is outstanding related to these bonds. |
90
Table of Contents
Index to Financial Statements
Contractual Obligations — Our contractual obligations related to continuing operations as of December 31, 2009, are as follows (in millions):
| 2010 | 2011 | 2012 | 2013 | 2014 | Thereafter | Total | ||||||||||||||||||
| Total operating lease obligations(1) |
$ | 58 | $ | 112 | $ | 48 | $ | 47 | $ | 33 | $ | 335 | $ | 633 | ||||||||||
| Debt(2) |
$ | 464 | $ | 627 | $ | 259 | $ | 138 | $ | 4,448 | $ | 3,508 | $ | 9,444 | ||||||||||
| Interest payments on debt(3) |
$ | 438 | $ | 436 | $ | 417 | $ | 448 | $ | 288 | $ | 779 | $ | 2,806 | ||||||||||
| Interest rate swap agreement payments(3) |
$ | 202 | $ | 96 | $ | 43 | $ | (3 | ) | $ | (5 | ) | $ | (14 | ) | $ | 319 | |||||||
| Purchase obligations: |
||||||||||||||||||||||||
| Turbine commitments |
23 | 46 | 15 | 16 | 16 | — | 116 | |||||||||||||||||
| Commodity purchase obligations(4) |
502 | 428 | 418 | 361 | 271 | 2,722 | 4,702 | |||||||||||||||||
| Land leases |
7 | 7 | 7 | 6 | 6 | 346 | 379 | |||||||||||||||||
| LTSAs |
13 | 9 | 10 | 4 | 6 | 42 | 84 | |||||||||||||||||
| Other purchase obligations |
56 | 81 | 90 | 50 | 50 | 1,005 | 1,332 | |||||||||||||||||
| Total purchase obligations(5) |
$ | 601 | $ | 571 | $ | 540 | $ | 437 | $ | 349 | $ | 4,115 | $ | 6,613 | ||||||||||
| Liability for uncertain tax positions |
$ | 1 | $ | 13 | $ | 18 | $ | — | $ | — | $ | 25 | $ | 57 | ||||||||||
| Other contractual obligations(6) |
$ | 37 | $ | — | $ | 5 | $ | — | $ | — | $ | 8 | $ | 50 | ||||||||||
| (1) | Included in the total are future minimum payments for power plant operating leases and office and equipment leases. See Note 17 of the Notes to Consolidated Financial Statements for more information. |
| (2) | A note payable totaling $77 million associated with the sale of the PG&E note receivable to a third party is excluded from debt for this purpose as it is a non-cash liability. |
| (3) | Amounts are projected based upon interest rates at December 31, 2009. |
| (4) | The amounts presented here are primarily the notional volumes for indexed fuel purchase contracts for the purchase, transportation, or storage of commodities accounted for as executory contracts or as a normal purchase normal sale and, therefore, not recognized as liabilities on our Consolidated Balance Sheets. See “— Risk Management and Commodity Accounting” for a discussion of our commodity derivative contracts recorded at fair value on our Consolidated Balance Sheets. |
| (5) | The amounts included above for purchase obligations include the minimum requirements under contract. |
| (6) | Represents cash obligations included in other current liabilities and long-term liabilities on our Consolidated Balance Sheet as of December 31, 2009. |
Special Purpose Subsidiaries
Pursuant to applicable transaction agreements, we have established certain of our entities legally separate from Calpine and our other subsidiaries. In accordance with GAAP, we consolidate these entities. As of the date of filing this Report, these entities included: Rocky Mountain Energy Center, LLC, Riverside Energy Center, LLC, Calpine Riverside Holdings, LLC, PCF, PCF III, GEC Holdings, LLC, Gilroy Energy Center, LLC, Creed, Goose Haven, Calpine Gilroy Cogen, L.P., Calpine Gilroy 1, Inc., Calpine King City Cogen, LLC, Calpine Securities Company, L.P. (a parent company of Calpine King City Cogen, LLC), Calpine King City, LLC (an indirect parent company of Calpine Securities Company, L.P.), CCFCP and Russell City Energy Company, LLC. The following disclosures are required under certain applicable agreements and pertain to some of these entities. The financial information provided below represents the assets, liabilities, and results of operations for each of the special purpose subsidiaries as reflected on our Consolidated Financial Statements. These amounts may differ
91
Table of Contents
Index to Financial Statements
materially from the assets, liabilities, and results of operations for these entities that present individual financial statements on a stand-alone basis to their project lenders.
On June 13, 2003, PCF, our wholly owned stand-alone subsidiary, completed an offering of two tranches of senior secured notes due 2006 and 2010 with original principal amounts totaling $802 million. PCF’s senior secured notes due 2006 were paid in accordance with their terms upon maturity in 2006 and are no longer outstanding. PCF’s 6.256% senior secured notes due 2010 were paid in accordance with their terms upon maturity in February 2010 and are no longer outstanding. Pursuant to the applicable agreements relating to the issuance of PCF’s senior secured notes, we are required to report the following information in this Form 10-K (in millions):
| 2009 | |||
| Assets |
$ | 203 | |
| Liabilities |
90 | ||
See Note 7 of the Notes to Consolidated Financial Statements for further information.
In accordance with the terms thereof, the PCF III notes were repaid in accordance with their terms upon maturity in February 2010 and are no longer outstanding. Pursuant to the applicable agreements relating to the issuance of the PCF III notes, we are required to report the following information in this Form 10-K (in millions):
| 2009 | |||
| Assets |
$ | 114 | |
| Liabilities |
85 | ||
See Note 7 of the Notes to Consolidated Financial Statements for further information.
GEC, a wholly owned subsidiary of GEC Holdings, LLC, has been established as an entity with its existence separate from us and other subsidiaries of ours. On September 30, 2003, GEC completed an offering of $302 million of 4% senior secured notes due 2011. In connection with the issuance of the secured notes, we received funding on a third party preferred equity investment in GEC Holdings, LLC totaling $74 million. This preferred interest meets the criteria of a mandatorily redeemable financial instrument and has been classified as debt due to certain preferential distributions to the third party. The preferential distributions are due semi-annually beginning in March 2004 through September 2011 and total approximately $113 million over the eight-year period. As of December 31, 2009 and 2008, there was $25 million and $35 million, respectively, outstanding under the preferred interest.
A long-term PPA between CES and CDWR was acquired by GEC by means of a series of capital contributions by CES and certain of its affiliates and is an asset of GEC, and the secured notes and the preferred interest are liabilities of GEC, separate from the assets and liabilities of us and other subsidiaries of ours. In addition to the PPA and nine peaker power plants (including Creed and Goose Haven) owned directly or indirectly by GEC, GEC’s assets include cash and a 100% equity interest in each of Creed and Goose Haven, each of which is a wholly owned subsidiary of GEC and a guarantor of the 4% senior secured notes due 2011 issued by GEC. Each of GEC, Creed and Goose Haven has been established as an entity with its existence separate from us and other subsidiaries of ours. Creed and Goose Haven each have assets consisting of a peaker power plant and other assets. The following table sets forth selected financial information of GEC for the year ended December 31, 2009 (in millions):
| 2009 | |||
| Assets |
$ | 505 | |
| Liabilities |
89 | ||
On December 4, 2003, we announced that we had sold to a group of institutional investors our right to receive payments from PG&E under an agreement between PG&E and Gilroy regarding the termination and buy-out of a standard offer contract between PG&E and Gilroy for $133 million in cash. Since the transaction did
92
Table of Contents
Index to Financial Statements
not satisfy the criteria for sales treatment in accordance with GAAP, it was recorded on our Consolidated Financial Statements as a secured financing, with a note payable of $133 million. The notes receivable balance and note payable balance are both reduced as PG&E makes payments to the buyers of the notes receivable. The $24 million difference between the $157 million net book value of the notes receivable at the transaction date and the $133 million cash received is recognized as additional interest expense over the repayment term. We will continue to record interest income over the repayment term, and interest expense will be accreted on the amortizing note payable balance.
Pursuant to the applicable transaction agreements, each of Gilroy and Calpine Gilroy 1, Inc. (the general partner of Gilroy), has been established as an entity with its existence separate from us and other subsidiaries of ours. The following table sets forth the assets and liabilities of Gilroy and Calpine Gilroy I, Inc. as of December 31, 2009 (in millions):
| 2009 | |||
| Assets |
$ | 394 | |
| Liabilities |
78 | ||
See Notes 5 and 7 of the Notes to Consolidated Financial Statements for further information.
On June 29, 2004, Rocky Mountain Energy Center, LLC and Riverside Energy Center, LLC, wholly owned subsidiaries of our Calpine Riverside Holdings, LLC subsidiary, received funding in the aggregate amount of $661 million comprising $633 million of first priority secured floating rate term loans due 2011 and a $28 million letter of credit-linked deposit facility.
Pursuant to the applicable transaction agreements, each of Rocky Mountain Energy Center, LLC, Riverside Energy Center, LLC and Calpine Riverside Holdings, LLC has been established as an entity with its existence separate from us. The following table sets forth the assets and liabilities of these entities as of December 31, 2009 (in millions):
| Rocky Mountain Energy Center, LLC 2009 |
Riverside Energy Center, LLC 2009 |
Calpine Riverside Holdings, LLC 2009 | |||||||
| Assets |
$ | 390 | $ | 724 | $ | 404 | |||
| Liabilities |
152 | 320 | — | ||||||
See Note 7 of the Notes to Consolidated Financial Statements for further information.
On October 14, 2005, our indirect subsidiary CCFCP issued $300 million of six-year redeemable preferred shares. The CCFCP Preferred Shares were mandatorily redeemable on the maturity date of October 31, 2011; however, these preferred shares were redeemed on or before July 1, 2009, and are no longer outstanding. Pursuant to the applicable agreements relating to the issuance of the CCFCP Preferred Shares, we are required to report the following information in this Form 10-K (in millions):
| 2009 | |||
| Assets |
$ | 1,829 | |
| Liabilities |
1,007 | ||
93
Table of Contents
Index to Financial Statements
RISK MANAGEMENT AND COMMODITY ACCOUNTING
We actively seek to manage the commodity risks of our portfolio, utilizing multiple strategies of buying and selling power or natural gas to manage our spark spread, or selling Heat Rate transactions.
We use derivative instruments, which include physical commodity contracts and financial commodity instruments such as OTC and exchange traded swaps, futures, options, forward agreements and instruments that settle on the power price to natural gas price relationships (Heat Rate swaps and options) for the purchase and sale of power, natural gas, and emission allowances to manage commodity price risk and to maximize the risk-adjusted returns from our power and natural gas assets. We also use interest rate swaps to manage the interest rate risk of our variable rate debt. We conduct these hedging and optimization activities within a structured risk management framework based on controls, policies and procedures. We monitor these activities through active and ongoing management and oversight, defined roles and responsibilities, and daily risk measurement and reporting. Additionally, we seek to manage the associated risks through diversification, by controlling position sizes, by using portfolio position limits, and by entering into offsetting positions that lock in a margin.
Along with our portfolio of hedging transactions, we enter into power and natural gas positions that often act as hedges to our asset portfolio, but do not qualify as hedges under hedge accounting guidelines, such as commodity options transactions and instruments that settle on power price to natural gas price relationships (Heat Rate swaps and options). While our selling and purchasing of power and natural gas is mostly physical in nature, we also engage in marketing, hedging and optimization activities, particularly in natural gas, that are financial in nature. While we enter into these transactions primarily to provide us with improved price and price volatility transparency, as well as greater market access, which benefits our hedging activities, we also are exposed to commodity price movements (both profits and losses) in connection with these transactions. These positions are included in and subject to our consolidated risk management portfolio position limits and controls structure. Changes in fair value of commodity positions that do not qualify for either hedge accounting or the normal purchase normal sale exemption are recognized currently in earnings in mark-to-market activity within operating revenues in the case of power transactions, and within fuel and purchased energy expense, in the case of natural gas transactions. Our future hedged status, and marketing and optimization activities are subject to change as determined by our commercial operations group, Chief Risk Officer, Risk Management Committee of senior management and Board of Directors.
We have economically hedged a substantial portion of our generation and natural gas portfolio mostly through power and natural gas forward physical and financial transactions for 2010. By entering into these transactions, we are able to economically hedge a portion of our spark spread at pre-determined generation and price levels. We use a combination of PPAs and other hedging instruments to manage our variability in future cash flows. As of December 31, 2009, the maximum length of our PPAs extends 22 years into the future and the maximum length of time over which we were hedging using commodity and interest rate derivative instruments was 3 and 16 years, respectively. Assuming constant December 31, 2009, power and natural gas prices and interest rates, we estimate that pre-tax net losses of $94 million would be reclassified from AOCI into earnings during the next 12 months as the hedged transactions settle; however, the actual amounts that will be reclassified will likely vary based on changes in natural gas and power prices as well as interest rates. Therefore, we are unable to predict what the actual reclassification from AOCI into earnings (positive or negative) will be for the next 12 months.
We enter into a variety of derivative instruments, which include physical commodity contracts and financial commodity instruments such as OTC and exchange traded swaps, futures, options, forward agreements and instruments that settle on the power price to natural gas price relationships (Heat Rate swaps and options) for the purchase and sale of power, natural gas, and emission allowances as well as interest rate swaps. Derivative contracts are measured at their fair value and recorded as either assets or liabilities unless they qualify for, and we elect, the normal purchase normal sale exemption. All changes in the fair value of contracts accounted for as derivatives are recognized currently in earnings (as a component of our operating revenues, fuel and purchased
94
Table of Contents
Index to Financial Statements
energy expense, or interest expense) unless specific hedge criteria are met. The hedge criteria require us to formally document, designate and assess the effectiveness of transactions that receive hedge accounting. The actual amounts that will ultimately be settled will likely vary based on changes in natural gas prices and power prices as well as changes in interest rates. Such variances could be material.
The primary factors affecting our market risk and the fair value of our derivatives at any point in time are the volume of open derivative positions (MMBtu and MWh), changing commodity market prices, principally for power and natural gas, liquidity risk, counterparty and our credit risk and changes in interest rates. Since prices for power and natural gas are among the most volatile of all commodity prices, there may be material changes in the fair value of our derivatives over time, driven both by price volatility and the changes in volume of open derivative transactions. Our derivative assets and liabilities have decreased to approximately $1.3 billion and $(1.6) billion at December 31, 2009, compared to $4.1 billion and $(4.5) billion at December 31, 2008, respectively. As of December 31, 2009, the fair value of our level 3 derivative assets and liabilities represent only a small portion of our total assets and liabilities (less than 1%). See Note 8 of the Notes to Consolidated Financial Statements for further information related to our level 3 derivative assets and liabilities. There is a substantial amount of volatility inherent in accounting for the fair value of these derivatives, and our results during the years ended December 31, 2009 and 2008 have reflected this as discussed below.
The change in fair value of our outstanding commodity and interest rate derivative instruments from January 1, 2009, through December 31, 2009, is summarized in the table below (in millions):
| Interest Rate Swaps |
Commodity Instruments |
Total | ||||||||||
| Fair value of contracts outstanding at January 1, 2009 |
$ | (452 | ) | $ | 12 | $ | (440 | ) | ||||
| Losses recognized or otherwise settled during the period(1)(2) |
198 | 5 | 203 | |||||||||
| Fair value attributable to new contracts |
4 | 2 | 6 | |||||||||
| Changes in fair value attributable to price movements |
(15 | ) | (11 | ) | (26 | ) | ||||||
| Changes in fair value attributable to nonperformance risk |
(54 | ) | — | (54 | ) | |||||||
| Fair value of contracts outstanding at December 31, 2009(3) |
$ | (319 | ) | $ | 8 | $ | (311 | ) | ||||
| (1) | Interest rate settlements consist of recognized losses from interest rate cash flow hedges of $184 million and recognized losses from undesignated interest rate swaps of $14 million (represents a portion of interest expense as reported on our Consolidated Statements of Operations). |
| (2) | Settlement of commodity contracts not designated as hedging instruments of $(92) million (represents a portion of operating revenues and fuel and purchased energy expense as reported on our Consolidated Statements of Operations) and $87 million related to recognition of gains from cash flow hedges, previously reflected in OCI, offset by other changes in derivative assets and liabilities not reflected in OCI or net income. |
| (3) | Net commodity and interest rate derivative assets and liabilities reported in Notes 8 and 9 of the Notes to Consolidated Financial Statements. |
The change since the last balance sheet date in the total value of the derivatives (both assets and liabilities) is reflected either in cash for option premiums paid or collected, in OCI, net of tax for cash flow hedges, or on our Consolidated Statements of Operations as a component (gain or loss) in current earnings.
95
Table of Contents
Index to Financial Statements
The following tables detail the components of our total mark-to-market activity for both the net realized gain (loss) and the net unrealized gain (loss) recognized from our derivative instruments not designated as hedging instruments and where these components were recorded on our Consolidated Statements of Operations for the years ended December 31, 2009, 2008 and 2007 (in millions):
| 2009 | 2008 | 2007 | ||||||||||
| Realized gain (loss) |
||||||||||||
| Interest rate swaps |
$ | (35 | ) | $ | (11 | ) | $ | 5 | ||||
| Commodity derivative instruments(1) |
37 | (146 | ) | 40 | ||||||||
| Total realized gain (loss) |
$ | 2 | $ | (157 | ) | $ | 45 | |||||
| Unrealized gain (loss) |
||||||||||||
| Interest rate swaps |
$ | 10 | $ | (11 | ) | $ | (17 | ) | ||||
| Commodity derivative instruments |
79 | 35 | (35 | ) | ||||||||
| Total unrealized gain (loss) |
$ | 89 | $ | 24 | $ | (52 | ) | |||||
| Total mark-to-market activity |
$ | 91 | $ | (133 | ) | $ | (7 | ) | ||||
| (1) | Balance includes a non-cash gain from amortization of prepaid power sales agreements of approximately nil, $40 million and $54 million for the years ended December 31, 2009, 2008 and 2007, respectively. |
| 2009 | 2008 | 2007 | ||||||||||
| Power contracts included in operating revenues |
$ | 7 | $ | 232 | $ | 252 | ||||||
| Natural gas contracts included in fuel and purchased energy expense |
109 | (343 | ) | (247 | ) | |||||||
| Interest rate swaps included in interest expense |
(25 | ) | (22 | ) | (12 | ) | ||||||
| Total mark-to-market activity |
$ | 91 | $ | (133 | ) | $ | (7 | ) | ||||
Our change in AOCI from an accumulated loss of $158 million at December 31, 2008, to an accumulated loss of $266 million at December 31, 2009, was primarily driven by reclassification adjustments for cash flow hedges realized in net income and a decrease in interest rates, which were partially offset by decreases in commodity prices and the effect of income taxes, which includes a net $43 million tax expense reclassified from OCI to continuing operations related to the intraperiod tax allocation provisions under GAAP.
Commodity Price Risk — Commodity price risks result from exposure to changes in spot prices, forward prices, price volatilities and correlations between the price of power, steam and natural gas. We manage the commodity price risk and the variability in future cash flows from forecasted sales of power and purchases of natural gas of our entire portfolio of generating assets and contractual positions by entering into various derivative and non-derivative instruments.
The net fair value of outstanding derivative commodity instruments at December 31, 2009, based on price source and the period during which the instruments will mature, are summarized in the table below (in millions):
| Fair Value Source |
2010 | 2011-2012 | 2013-2014 | After 2014 | Total | |||||||||||||
| Prices actively quoted |
$ | (165 | ) | $ | 9 | $ | — | $ | — | $ | (156 | ) | ||||||
| Prices provided by other external sources |
115 | 20 | (1 | ) | — | 134 | ||||||||||||
| Prices based on models and other valuation methods |
10 | 19 | — | 1 | 30 | |||||||||||||
| Total fair value |
$ | (40 | ) | $ | 48 | $ | (1 | ) | $ | 1 | $ | 8 | ||||||
We measure the commodity price risks in our portfolio on a daily basis using a VAR model to estimate the maximum potential one-day risk of loss based upon historical experience resulting from market movements in comparison to internally established thresholds. Our VAR is calculated for our entire portfolio which is comprised of commodity derivatives, power plants, PPAs, and other physical and financial transactions. The
96
Table of Contents
Index to Financial Statements
portfolio VAR calculation incorporates positions for the remaining portion of the current calendar year plus the following two calendar years. We measure VAR using a variance/covariance approach based on a confidence level of 95%, a one-day holding period, and actual observed historical correlation. While we believe that our VAR assumptions and approximations are reasonable, different assumptions and/or approximations could produce materially different estimates.
The table below presents the high, low and average of our daily VAR for the years ended December 31, 2009 and 2008 (in millions):
| 2009 | 2008 | |||||
| Year ended December 31: |
||||||
| High |
$ | 59 | $ | 70 | ||
| Low |
$ | 28 | $ | 29 | ||
| Average |
$ | 47 | $ | 49 | ||
| As of December 31 |
$ | 51 | $ | 45 | ||
Liquidity Risk — Liquidity risk arises from the general funding requirements needed to manage our activities and assets and liabilities. Increasing natural gas prices or Market Heat Rates can cause increased collateral requirements. Our liquidity management framework is intended to maximize liquidity access and minimize funding costs during times of rising prices. See further discussion regarding our uses of collateral as they relate to our commodity procurement and risk management activities in Note 10 of the Notes to Consolidated Financial Statements.
Credit Risk — Credit risk relates to the risk of loss resulting from non-performance or non-payment by our counterparties related to their contractual obligations with us. Risks surrounding counterparty performance and credit could ultimately impact the amount and timing of expected cash flows. We also have credit risk if counterparties are unable to provide collateral or post margin. We monitor and manage our credit risk through credit policies that include:
| • | credit approvals; |
| • | routine monitoring of counterparties’ credit limits and their overall credit ratings; |
| • | limiting our marketing, hedging and optimization activities with high risk counterparties; |
| • | margin, collateral, or prepayment arrangements; and |
| • | payment netting arrangements, or master netting arrangements that allow for the netting of positive and negative exposures of various contracts associated with a single counterparty. |
We believe that our credit policies adequately monitor and diversify our credit risk. We currently have no individual significant concentrations of credit risk to a single counterparty; however a series of defaults or events of nonperformance by several of our individual counterparties could impact our liquidity and future results of operations. We monitor and manage our total comprehensive credit risk associated with all of our contracts and PPAs irrespective of whether they are accounted for as an executory contract, a normal purchase normal sale or whether they are marked-to-market and included in our derivative assets and liabilities on our Consolidated Balance Sheets. Our counterparty credit quality associated with the net fair value of outstanding derivative commodity instruments is included in our derivative assets and liabilities at December 31, 2009, and the period during which the instruments will mature are summarized in the table below (in millions):
| Credit Quality (Based on Standard & Poor’s Ratings as of December 31, 2009) |
2010 | 2011-2012 | 2013-2014 | After 2014 | Total | ||||||||||||||
| Investment grade |
$ | (39 | ) | $ | 49 | $ | (1 | ) | $ | — | $ | 9 | |||||||
| Non-investment grade |
— | — | — | — | — | ||||||||||||||
| No external ratings |
(1 | ) | (1 | ) | — | 1 | (1 | ) | |||||||||||
| Total fair value |
$ | (40 | ) | $ | 48 | $ | (1 | ) | $ | 1 | $ | 8 | |||||||
97
Table of Contents
Index to Financial Statements
The fair value of our interest rate swaps are validated based upon external quotes. See further discussion of our interest rate swaps in the “— Interest Rate Risk” section below.
Interest Rate Risk — We are exposed to interest rate risk related to our variable rate debt. Interest rate risk represents the potential loss in earnings arising from adverse changes in market interest rates. Our variable rate financings are indexed to base rates, generally LIBOR.
Our fixed rate debt instruments do not expose us to the risk of loss in earnings due to changes in market interest rates. In general, such a change in fair value would impact earnings and cash flows only if we were to reacquire all or a portion of the fixed rate debt in the open market prior to their maturity.
The following table summarizes the contract terms as well as the fair values of our financial instruments exposed to interest rate risk as of December 31, 2009. All outstanding balances and fair market values are shown gross of applicable premium or discount, if any (in millions):
| 2010 | 2011 | 2012 | 2013 | 2014 | Thereafter | Total | Fair Value December 31, 2009 | |||||||||||||||||||||||
| Debt by Maturity Date: |
||||||||||||||||||||||||||||||
| Fixed Rate |
$ | 218 | $ | 71 | $ | 21 | $ | 24 | $ | 21 | $ | 2,312 | $ | 2,667 | $ | 2,609 | ||||||||||||||
| Average Interest Rate |
6.5 | % | 6.9 | % | 9.6 | % | 9.6 | % | 9.4 | % | 7.6 | % | ||||||||||||||||||
| Variable Rate |
$ | 223 | $ | 528 | $ | 210 | $ | 88 | $ | 4,410 | $ | 688 | $ | 6,147 | $ | 5,863 | ||||||||||||||
| Average Interest Rate(1) |
3.1 | % | 4.5 | % | 3.9 | % | 4.2 | % | 4.9 | % | 6.8 | % | ||||||||||||||||||
| (1) | Projection based upon anticipated LIBOR rates. |
Currently, we use interest rate swaps to adjust the mix between fixed and floating rate debt as a hedge of our interest rate risk. We do not use interest rate derivative instruments for trading purposes. The majority of our interest rate swaps mature in years 2010 through 2012. To the extent eligible, our interest rate swaps have been designated as cash flow hedges, and changes in fair value are recorded in OCI to the extent they are effective. Holding all other factors constant, we estimate that a 10% adverse change in interest rates would result in a change in the fair value of our interest rate swaps of approximately $(37) million.
APPLICATION OF CRITICAL ACCOUNTING POLICIES
The preparation of financial statements in accordance with GAAP requires management to make certain estimates and assumptions which are inherently imprecise and may differ significantly from actual results achieved. We believe the following are our more critical accounting policies due to the significance, subjectivity and judgment involved in determining our estimates used in preparing our Consolidated Financial Statements. See Note 2 of the Notes to Consolidated Financial Statements for a discussion of the application of these and other accounting policies. We evaluate our estimates and assumptions used in preparing our Consolidated Financial Statements on an ongoing basis utilizing historic experience, anticipated future events or trends, consultation with third party advisors or other methods that involve judgment as determined appropriate under the circumstances. The resulting effects of changes in our estimates are recorded in our Consolidated Financial Statements in the period in which the facts and circumstances that give rise to the change in estimate become known.
Revenue Recognition
We routinely enter into physical commodity contracts for sales of our generated power to manage risk and capture the value inherent in our generation. Determining the proper accounting for our power contracts can require significant judgment and impact how we recognize revenue. In addition, we determine whether the
98
Table of Contents
Index to Financial Statements
contract should be accounted for on a gross or net basis. Determining the proper accounting treatment involves the evaluation of quantitative, as well as qualitative factors, to determine if the contract should be accounted for as one of the following:
| • | a derivative; |
| • | a contract that meets the definition of a derivative but is eligible for the normal purchase normal sale exemption; |
| • | a contract that is a physical or executory contract; or |
| • | a contract that qualifies as a lease. |
See “ — Accounting for Derivative Instruments” directly below for a discussion of the significant judgments and estimates related to accounting for derivative instruments. We apply lease or traditional accrual accounting to contracts that are exempt from derivative accounting or do not meet the definition of a derivative instrument.
Executory and Physical Contracts Exempt from Derivative Accounting — We generally recognize revenue from the sale of power or host steam, thermal energy for sale to our customers for use in industrial or other heating operations, upon transmission and delivery to the customer at the contractual price. In addition to revenues from power, host steam revenues and RECs from our Geysers Assets related to generation, our operating revenues also include:
| • | power and steam revenue consisting of fixed capacity payments, which are not related to generation; |
| • | other revenues such as RMR Contracts, resource adequacy and certain ancillary service revenues; and |
| • | other service revenues including revenue related to the sales of combustion turbine component parts and services from PSM prior to its sale in March 2007. |
RMR Contracts, resource adequacy and other ancillary revenues are recognized when contractually earned and consist of revenues received from our customer either at the market price or a contract price.
Lease Accounting — Contracts accounted for as operating leases, such as certain tolling agreements, with minimum lease rentals which vary over time must be levelized. Generally, we levelize these contract revenues on a straight-line basis over the term of the contract.
Gross vs. Net Accounting — We determine whether the financial statement presentation of revenues should be on a gross or net basis. Where we act as principal, we record settlement of our physical commodity contracts on a gross basis. With respect to our physical executory contracts, where we do not take title of the commodities but receive a variable payment to convert natural gas into power and steam in a tolling operation, we record revenues on a net basis. Our physical commodity contracts are not entered into for the purpose of settling on a net basis with another counterparty.
Accounting for Derivative Instruments
We enter into a variety of derivative instruments such as OTC and exchange traded swaps, futures, options, forward agreements and instruments that settle on the power price to natural gas price relationships (Heat Rate swaps and options) for the purchase and sale of power, natural gas, and emission allowances. We also use interest rate swaps to manage the interest rate risk of our variable rate debt. The majority of this activity is related to the fuel and power price risk associated with our generation assets and our contractual obligations. We
99
Table of Contents
Index to Financial Statements
recognize all derivative instruments that qualify for derivative accounting treatment as either assets or liabilities and measure those instruments at fair value unless they qualify for the normal purchase normal sale exemption.
Hedge Accounting — Revenues and expenses derived from derivative instruments that qualify for hedge accounting are recorded in the period and same financial statement line item as the hedged item. Hedge accounting requires us to formally document, designate and assess the effectiveness of transactions that receive hedge accounting. We present the cash flows from our derivatives in the same category as the item being hedged within operating activities on our Consolidated Statements of Cash Flows unless they contain an other-than-insignificant financing element in which case their cash flows are classified within financing activities.
Cash Flow Hedges — We report the effective portion of the unrealized gain or loss on a derivative instrument designated and qualifying as a cash flow hedging instrument as a component of OCI and reclassify such gains and losses into earnings in the same period during which the hedged forecasted transaction affects earnings. Gains and losses due to ineffectiveness on commodity hedging instruments are included in unrealized mark-to-market gains and losses and are recognized currently in earnings as a component of operating revenues (for power contracts), fuel and purchased energy expense (for natural gas contracts) and interest expense (for interest rate swaps). If it is determined that the forecasted transaction is no longer probable of occurring, then hedge accounting will be discontinued prospectively. If the hedging instrument is terminated or de-designated prior to the occurrence of the hedged forecasted transaction, the gain or loss associated with the hedge instrument remains deferred in OCI until such time as the forecasted transaction impacts earnings, or until it is determined that the forecasted transaction is probable of not occurring.
Fair Value Hedges — Changes in fair value of derivatives designated as fair value hedges and the corresponding changes in the fair value of the hedged risk attributable to a recognized asset or liability, or unrecognized firm commitment are recorded in earnings. If the fair value hedge is effective, the amounts recorded will offset in earnings. If the underlying asset, liability or firm commitment being hedged is disposed of or otherwise terminated, the gain or loss associated with the underlying hedged item is recognized currently in earnings. If the hedging instrument is terminated or de-designated prior to the settlement of the hedged asset, liability or firm commitment, the carrying amount of the hedged item is adjusted by any gain or loss from the hedging instrument and remains until the hedged item is recognized in earnings. As of December 31, 2009, we had no fair value hedges; however, we had one fair value hedge at December 31, 2008 related to PCF.
Derivatives Not Designated as Hedging Instruments — Along with our portfolio of hedging transactions, we enter into power, natural gas and interest rate transactions that primarily act as economic hedges to our asset portfolio, but either do not qualify as hedges under hedge accounting guidelines or qualify under the hedge accounting guidelines and the hedge accounting designation has not been elected, such as commodity futures, forwards, options, fixed for floating swaps and instruments that settle on power price to natural gas price relationships (Heat Rate swaps and options). Changes in fair value of derivatives not designated as hedging instruments are recognized currently in earnings as a component of operating revenues (for power contracts and Heat Rate swaps and options), fuel and purchased energy expense (for natural gas contracts) and interest expense (for interest rate swaps).
Mark-to-Market Activity — A component of operating revenues (for power contracts), fuel and purchased energy expense (for natural gas contracts) and interest expense (for interest rate swaps), includes realized settlements and unrealized mark-to-market gains and losses resulting from general market price movements on power, natural gas and interest rate swap derivative instruments not designated or not qualifying as cash flow hedges. Gains and losses due to ineffectiveness on commodity hedging instruments are also included in unrealized mark-to-market gains and losses.
Significant judgment and estimates used in accounting for our derivative instruments include contract interpretation, valuation techniques and assumptions, assumptions used in forecasting future generation and market expectations. As defined by GAAP, fair value is the price that would be received to sell an asset or paid to
100
Table of Contents
Index to Financial Statements
transfer a liability in the principal or most advantageous market in an orderly transaction between market participants at the measurement date (exit price). GAAP establishes a fair value hierarchy which classifies fair value measurements from level 1 through level 3 based upon the inputs used to measure fair value.
The following is a summary of the most significant estimates and assumptions associated with the calculation of fair value of our commodity derivative instruments.
Pricing — We utilize market data, such as pricing services and broker quotes, and assumptions that we believe market participants would use in pricing our assets or liabilities including assumptions about risks and the risks inherent to the inputs in the valuation technique. These inputs can be readily observable, market corroborated or generally unobservable. The market data obtained from broker pricing services is evaluated to determine the nature of the quotes obtained and, where accepted as a reliable quote, used to validate our assessment of fair value; however, other qualitative assessments are used to determine the level of activity in any given market. We primarily apply the market approach and income approach for recurring fair value measurements and utilize what we believe to be the best available information. We utilize valuation techniques that seek to maximize the use of observable inputs and minimize the use of unobservable inputs. We classify fair value balances based on the observability of those inputs.
Valuation Techniques — In certain instances, we utilize models to measure fair value. These models are primarily industry-standard models, including the Black-Scholes pricing model, that incorporate various assumptions, including quoted interest rates and time value, as well as other relevant economic measures. Our valuation models may incorporate historical correlation information and extrapolate available broker and other information to future periods. In cases where there is no corroborating market information available to support significant model inputs, we initially use the transaction price as the best estimate of fair value.
Credit Reserves — We assess non-performance risk by adjusting the fair value of our derivatives based on the credit standing of the counterparties involved and the impact of credit enhancements, if any. Such valuation adjustments represent the amount of probable loss due to default either by us or a third party. Our credit valuation methodology is based on a quantitative approach which allocates a credit adjustment to the fair value of derivative transactions based on the net exposure of each counterparty. We develop our credit reserve based on our expectation of the market participants’ perspective of potential credit exposure. Our calculation of the credit reserve on net asset positions is based on available market information including credit default swap rates, credit ratings and historical default information. We also incorporate non-performance risk in net liability positions based on an assessment of our potential risk of default.
See Notes 8 and 9 of the Notes to Consolidated Financial Statements for further discussion of our derivative instruments.
Accounting for VIEs and Financial Statement Consolidation Criteria
We consolidate all VIEs where we have determined that we are the primary beneficiary. This determination is made at the inception of our involvement with the VIE and, in accordance with GAAP, is updated only in response to a reconsideration event. We consider both qualitative and quantitative factors to form a conclusion as to whether we, or another interest holder, absorbs a majority of the entity’s risk of expected losses, receives a majority of the entity’s potential for expected residual returns, or both.
Making these determinations can require the use of significant judgment, both on a qualitative and quantitative basis, which include, but are not limited to:
| • | consideration of the design of the VIE, its purpose and variability is designed to create and pass along to its interest holders; |
| • | preparation of future expected financial results and future expected cash flows from the VIE; |
101
Table of Contents
Index to Financial Statements
| • | assigning probabilities to future events, markets and potential outcomes, such as the exercise of purchase options; |
| • | estimates in future residual fair values of power plant assets years into the future; and |
| • | determinations of our counterparties’ reasons and intentions for entering into the VIE. |
If we determine that we will absorb a majority of a VIE’s expected losses, receive a majority of the entity’s potential for expected residual returns or both, we consolidate the VIE in accordance with GAAP into our Consolidated Financial Statements. Beginning on January 1, 2010, new accounting standards will change the approach for determination of the primary beneficiary and will require us to perform an ongoing reassessment of whether we continue to be the primary beneficiary, which may result in future deconsolidation or consolidation of our VIEs.
We do not consolidate VIE’s where we have determined, at the inception of our involvement with the VIE, that we are not the primary beneficiary. These include OMEC, a VIE and 100% owned subsidiary due to purchase option rights, a 50% joint venture interest in Greenfield LP and a 50% equity interest in Whitby where we do not have control and therefore do not consolidate. We account for these entities under the equity method of accounting and include our net equity interest in investments on our Consolidated Balance Sheets as we exercise significant influence over their operating and financial policies. Our equity interest in the net (income) loss from our unconsolidated VIE, joint venture and equity interest is recorded in (income) loss from unconsolidated investments in power plants.
Depreciation Expense
Determination of the appropriate depreciation method, proper useful lives and salvage values involves significant judgment, estimates, assumptions and historical experience. Changes in our estimates and methods can result in a significant impact in the amounts and timing of when we recognize depreciation expense and therefore significantly impact our financial condition and results of operations from period to period. Different depreciation methods can impact the timing and amount of deprecation expense affecting our results of operations and could result in different net book values of assets at a particular time during the useful life of the asset affecting our financial position. Estimates of useful lives also significantly impact the timing and amounts of depreciation expense and include significant estimates. If useful lives are too short then the asset is depreciated too quickly and depreciation expense is overstated. Estimated useful lives can significantly decrease if routine maintenance is not performed, premature mechanical failure of the asset occurs, significant increases in the planned level of usage occur, advances in technology make the asset obsolete, or if there are adverse changes in environmental regulations. Our depreciable cost basis of our assets is reduced by their estimated salvage values. Estimates involved with salvage values include future estimated costs of dismantlement and repair, market prices, environmental regulations and technological advancements. Dependent upon our ability to accurately estimate salvage values and the timing of disposal, the salvage values actually realized for our assets could significantly increase or decrease resulting in additional gains or losses in the year of disposal.
We depreciate our assets under the straight line method over the shorter of their estimated useful lives or lease term using an estimated salvage value which approximates 10% of the depreciable cost basis for our power plant assets where we own the land or have a favorable option to purchase the land at conclusion of the lease term and approximately 0.15% of the depreciable costs basis for our rotable spares equipment. We use component depreciation method for our rotable parts and composite depreciation method for all the other power plant asset groups and Geysers Assets. During 2009, we reviewed our accounting policies related to depreciation including our estimates of useful lives and salvage values. We determined changing from composite depreciation to component depreciation for our rotable natural gas-fired power plant assets, and changing our Geysers Assets depreciation from the units of production method to the straight line method was preferable under GAAP. In addition, we completed a depreciable life study of our natural gas-fired power plants and Geysers Assets, and
102
Table of Contents
Index to Financial Statements
determined that a change in the depreciable lives of our natural gas-fired power plants and Geysers Assets was appropriate. See Note 3 of the Notes to Consolidated Financial Statements for further discussion regarding our changes in depreciation and the effective date of our changes.
Impairment Evaluation of Long-Lived Assets
We evaluate our long-lived assets, such as property, plant and equipment, equity method investments, turbine equipment, patents, and specifically identified intangibles, when events or changes in circumstances indicate that the carrying value of such assets may not be recoverable. Examples of such events or changes in circumstances are:
| • | a significant decrease in the market price of a long-lived asset; |
| • | a significant adverse change in the manner an asset is being used or its physical condition; |
| • | an adverse action by a regulator or legislature or an adverse change in the business climate; |
| • | an accumulation of costs significantly in excess of the amount originally expected for the construction or acquisition of an asset; |
| • | a current-period loss combined with a history of losses or the projection of future losses; or |
| • | a change in our intent about an asset from an intent to hold to a greater than 50% likelihood that an asset will be sold or disposed of before the end of its previously estimated useful life. |
When we believe an impairment condition may have occurred, we are required to estimate the undiscounted future cash flows associated with a long-lived asset or group of long-lived assets at the lowest level for which identifiable cash flows are largely independent of the cash flows of other assets and liabilities for long-lived assets that are expected to be held and used. Equipment assigned to each power plant is not evaluated for impairment separately; instead, we evaluate our operating power plants and related equipment as a whole unit.
All construction and development projects are reviewed for impairment whenever there is an indication of potential reduction in fair value. If it is determined that it is no longer probable that the projects will be completed and all capitalized costs recovered through future operations, the carrying values of the projects would be written down to their fair value.
When we determine that our assets meet the assets held-for-sale criteria, they are reported at the lower of the carrying amount or fair value less the cost to sell. We are also required to evaluate our equity method investments to determine whether or not they are impaired when the value is considered an “other than a temporary” decline in value.
If we determine that the undiscounted cash flows from an asset to be held and used are less than the carrying amount of the asset, or if we have classified an asset as held for sale, we must estimate fair value to determine the amount of any impairment charge.
The following summarizes some of the most significant estimates and assumptions used in evaluating if we have an impairment charge.
Undiscounted Expected Future Cash Flows — In order to estimate future cash flows, we consider historical cash flows, existing and future contracts and PPA’s and changes in the market environment and other factors that may affect future cash flows. To the extent applicable, the assumptions we use are consistent with forecasts that we are otherwise required to make (for example, in preparing our other earnings forecasts). Certain of our operating power plants are located in regions with depressed demand and Commodity Margin. Our
103
Table of Contents
Index to Financial Statements
forecasts generally assume that Commodity Margin will increase in future years in these regions as the supply and demand relationships improve. The use of this method involves inherent uncertainty. We use our best estimates in making these evaluations and consider various factors, including forward price curves for power and fuel costs and forecasted operating costs. However, actual future market prices and project costs could vary from the assumptions used in our estimates, and the impact of such variations could be material.
Fair Value — Generally, fair value is determined using valuation techniques such as the present value of expected future cash flows. We also discount the estimated future cash flows associated with the asset using a single interest rate representative of the risk involved with such an investment including contract terms, tenor and credit risk of counterparts. We may also consider prices of similar assets, consult with brokers, or employ other valuation techniques. We use our best estimates in making these evaluations; however, actual future market prices and project costs could vary from the assumptions used in our estimates, and the impact of such variations could be material.
The evaluation and measurement of impairments for equity method investments involve the same uncertainties as described for long-lived assets that we own directly. Similarly, our estimates that we make with respect to our equity and cost-method investments are subjective, and the impact of variations in these estimates could be material.
See Note 2 of the Notes to Consolidated Financial Statements for further discussion of our impairment evaluation of long-lived assets.
Accounting for Income Taxes
To arrive at our consolidated income tax provision and other tax balances, significant judgment and estimates are required. Although we believe that our estimates are reasonable, no assurance can be given that the final tax outcome of these matters will not be different than that which is reflected in our historical tax provisions and accruals. Such differences could have a material impact on our income tax provision, other tax accounts and net income in the period in which such determination is made.
Our federal income tax reporting group is comprised primarily of two groups, CCFC and its subsidiaries, which we refer to as the CCFC group, and Calpine Corporation and its subsidiaries other than CCFC, which we refer to as the Calpine group. In 2005, CCFCP issued the CCFCP Preferred Shares, which resulted in the deconsolidation of the CCFC group for income tax purposes. On July 1, 2009, the CCFCP Preferred Shares were redeemed; however, CCFCP continues to be a partnership and therefore, the CCFC group remains deconsolidated from Calpine Corporation for federal income tax reporting purposes.
As of December 31, 2009, our NOL and credit carryforwards consists of federal carryforwards of approximately $7.5 billion which expire between 2021 and 2029. This includes an NOL carryforward of approximately $513 million for the CCFC group. GAAP requires that we consider all available evidence, both positive and negative, and tax planning strategies to determine whether, based on the weight of that evidence, a valuation allowance is needed to reduce the benefit of the deferred tax assets. Future realization of the tax benefit of an existing deductible temporary difference or carryforward ultimately depends on the existence of sufficient taxable income of the appropriate character within the carryback or carryforward periods available under the tax law.
In the ordinary course of business, there are many transactions and calculations where the ultimate tax outcome is uncertain. Some of these uncertainties arise as a consequence of the treatment of capital assets, financing transactions, multistate taxation of operations and segregation of foreign and domestic income and expense to avoid double taxation. We recognize the financial statement effects of a tax position when it is more likely than not, based on the technical merits, that the position will be sustained upon examination. A tax position that meets the more-likely-than-not recognition threshold is measured as the largest amount of tax benefit that is
104
Table of Contents
Index to Financial Statements
greater than 50% likely of being realized upon ultimate settlement with a taxing authority. We derecognize previously recognized tax positions in the first period in which it is no longer more likely than not that the tax position would be sustained upon examination. The determination and calculation of uncertain tax positions involves significant judgment in the application of complex tax laws. Resolution of these uncertainties in a manner inconsistent with our expectations could have a material impact on our financial condition or results of operations. As of December 31, 2009, we have $98 million of unrecognized tax benefits from uncertain tax positions.
See Note 11 of the Notes to Consolidated Financial Statements for further discussion of our accounting for income taxes.
Item 7A. Quantitative and Qualitative Disclosures about Market Risk
The information required hereunder is set forth under Item 7. “Management’s Discussion and Analysis of Financial Condition and Results of Operations — Risk Management and Commodity Accounting.”
Item 8. Financial Statements and Supplementary Data
The information required hereunder is set forth under “Report of Independent Registered Public Accounting Firm,” “Consolidated Balance Sheets,” “Consolidated Statements of Operations,” “Consolidated Statements of Comprehensive Income (Loss) and Stockholders’ Equity (Deficit),” “Consolidated Statements of Cash Flows,” and “Notes to Consolidated Financial Statements” included in the Consolidated Financial Statements that are a part of this Report. Other financial information and schedules are included in the Consolidated Financial Statements that are a part of this Report.
Item 9. Changes in and Disagreements with Accountants on Accounting and Financial Disclosure
None.
Item 9A. Controls and Procedures
Disclosure Controls and Procedures
We maintain disclosure controls and procedures that are designed to ensure that information required to be disclosed in our Exchange Act reports is recorded, processed, summarized, and reported within the time periods specified in the SEC’s rules and forms, and that such information is accumulated and communicated to our management, including our Chief Executive Officer and Chief Financial Officer, as appropriate, to allow timely decisions regarding required financial disclosure.
As of the end of the period covered by this Report, we carried out an evaluation, under the supervision and with the participation of our management, including our Chief Executive Officer and Chief Financial Officer, of the effectiveness of the design and operation of our disclosure controls and procedures as defined in Rule 13a-15(e) or Rule 15d-15(e) of the Exchange Act. Based upon, and as of the date of this evaluation, the Chief Executive Officer and the Chief Financial Officer concluded that our disclosure controls and procedures were effective such that the information relating to our Company, including our consolidated subsidiaries, required to be disclosed in our SEC reports is recorded, processed, summarized and reported within the time periods specified in SEC rules and forms, and is accumulated and communicated to our management, including our principal executive officer and principal financial and accounting officer, as appropriate to allow timely decisions regarding required disclosure.
Management’s Report on Internal Control over Financial Reporting
Our management is responsible for establishing and maintaining adequate internal control over financial reporting. Our internal control over financial reporting is a process designed to provide reasonable assurance
105
Table of Contents
Index to Financial Statements
regarding the reliability of financial reporting and the preparation of financial statements for external purposes in accordance with GAAP.
Our internal control over financial reporting includes those policies and procedures that:
| • | pertain to the maintenance of records that, in reasonable detail, accurately and fairly reflect the transactions and dispositions of our assets; |
| • | provide reasonable assurance that transactions are recorded as necessary to permit preparation of financial statements in accordance with GAAP, and that our receipts and expenditures are being made only in accordance with authorizations of our management and directors; and |
| • | provide reasonable assurance regarding prevention or timely detection of unauthorized acquisition, use, or disposition of our assets that could have a material effect on our financial statements. |
Management has assessed the effectiveness of our internal control over financial reporting as of December 31, 2009. In making its assessment of internal control over financial reporting, management used the criteria described in Internal Control — Integrated Framework issued by the Committee of Sponsoring Organizations of the Treadway Commission.
Based on management’s assessment, we have concluded that our internal control over financial reporting was effective as of December 31, 2009.
The effectiveness of our internal control over financial reporting as of December 31, 2009, has been audited by PricewaterhouseCoopers LLP, an independent registered public accounting firm, as stated in their report which appears herein.
Changes in Internal Control Over Financial Reporting
During the fourth quarter of 2009, there were no changes in our internal control over financial reporting that materially affected, or are reasonably likely to materially affect, our internal control over financial reporting.
None.
106
Table of Contents
Index to Financial Statements
Item 10. Directors, Executive Officers and Corporate Governance
Identification of Executive Officers
Set forth in the table below is a list of our executive officers, together with certain biographical information, including their ages as of the date of this Report:
| Name |
Age | Principal Occupation | ||
| Jack A. Fusco |
47 | President and Chief Executive Officer | ||
| Zamir Rauf |
50 | Executive Vice President and Chief Financial Officer | ||
| W. Thaddeus Miller |
59 | Executive Vice President, Chief Legal Officer and Secretary | ||
| John B. Hill |
42 | Executive Vice President and Chief Commercial Officer | ||
| Jim D. Deidiker |
54 | Senior Vice President and Chief Accounting Officer | ||
| Gary M. Germeroth |
51 | Executive Vice President and Chief Risk Officer |
Jack A. Fusco has served as our President and Chief Executive Officer and as a member of our Board of Directors since August 10, 2008. From July 2004 to February 2006, Mr. Fusco served as the Chairman and Chief Executive Officer of Texas Genco LLC. From 2002 through July 2004, Mr. Fusco was an exclusive energy investment advisor for Texas Pacific Group. From November 1998 until February 2002, Mr. Fusco served as President and Chief Executive Officer of Orion Power Holdings, Inc. Prior to joining Orion Power Holdings, Inc., Mr. Fusco was a Vice President at Goldman Sachs Power, an affiliate of Goldman, Sachs & Co. Prior to joining Goldman Sachs Power, Mr. Fusco was Executive Director of International Development and Operations for Pacific Gas & Electric Company’s non-regulated subsidiary PG&E Enterprises, Inc. Mr. Fusco obtained a Bachelor of Science Degree in Mechanical Engineering from California State University, Sacramento. Mr. Fusco served as a director of Foster Wheeler Ltd., a global engineering and construction contractor and power equipment supplier, until February 2009.
Zamir Rauf has served as our Executive Vice President and Chief Financial Officer since December 17, 2008, after serving as Interim Chief Financial Officer from June 4, 2008. Previously, he served as our Senior Vice President, Finance and Treasurer from September 2007 until his appointment as Interim Chief Financial Officer. Since joining the Company in February 2000, Mr. Rauf has served as Manager, Finance from February 2000 to April 2001, Director, Finance from April 2001 to December 2002, Vice President, Finance from December 2002 to July 2005 and Senior Vice President, Finance from July 2005 to September 2007. Prior to joining the Company, Mr. Rauf held various accounting and finance roles with Enron North America and Dynegy Inc., as well as credit and lending roles with Comerica Bank. Mr. Rauf earned his Bachelor of Arts in Business and Commerce and Masters in Business Administration — Finance from the University of Houston.
W. Thaddeus Miller has served as our Executive Vice President, Chief Legal Officer and Secretary since August 12, 2008. Prior to joining the Company, Mr. Miller most recently served as Executive Vice President and Chief Legal Officer of Texas Genco LLC from December 14, 2004 until 2006. From 2002 to 2004, Mr. Miller was a consultant to Texas Pacific Group, a private equity firm. From 1999 to 2002, he served as Executive Vice President and Chief Legal Officer of Orion Power Holdings, Inc., an independent power producer. From 1994 to 1999, Mr. Miller was a Vice President of Goldman Sachs & Co., where he focused on wholesale electric and other energy commodity trading. Before joining Goldman Sachs & Co., Mr. Miller was a partner in a New York law firm. Mr. Miller earned his Bachelor of Science degree from the U.S. Merchant Marine Academy and his Juris Doctor from St. John’s School of Law. In addition, Mr. Miller was an officer in the U.S. Coast Guard from 1973 through 1976.
John B. (Thad) Hill has served as our Executive Vice President and Chief Commercial Officer since September 1, 2008. Prior to joining the Company, Mr. Hill most recently served as Executive Vice President of NRG Energy, Inc. since February 2006 and President of NRG Texas LLC since December 2006. Prior to joining
107
Table of Contents
Index to Financial Statements
NRG Energy, Inc., Mr. Hill was Executive Vice President of Strategy and Business Development at Texas Genco LLC from 2005 to 2006. From 1995 to 2005, Mr. Hill was with Boston Consulting Group, Inc., where he rose to Vice President and Director and led the North American energy practice, serving companies in the power and gas sector with a focus on commercial and strategic issues. Mr. Hill received his Bachelor of Arts degree from Vanderbilt University and a Master of Business Administration degree from the Amos Tuck School of Dartmouth College.
Jim D. Deidiker has served as our Senior Vice President and Chief Accounting Officer since January 6, 2009. Prior to joining the Company, Mr. Deidiker most recently served as Vice President and Controller of Texas Genco LLC from 2005 to 2006 where he was responsible for financial and public reporting as well as management of the accounting function. From 1998 to 2005, Mr. Deidiker served as Managing Director & Vice President, Administration of AEP Energy Services, Inc. where he was responsible for management of the accounting function, financial reporting, contract administration and risk management for the gas pipeline and trading segment of AEP Energy Services, Inc. Mr. Deidiker obtained a Bachelor of Science in Accounting from Southwest Missouri State University and a Master in Business Administration from the University of Houston. In addition, Mr. Deidiker is a Certified Public Accountant and Certified Management Accountant.
Gary M. Germeroth has served as our Executive Vice President and Chief Risk Officer since June 2007. Mr. Germeroth’s responsibilities include maintaining oversight of our risk management framework and assuring that our complex risks are communicated and understood throughout the organization. Prior to joining the Company, Mr. Germeroth worked for PA Consulting Group, Inc. and its predecessor firm, Hagler Bailly Risk Advisors, since 1999. Prior to joining PA Consulting, Mr. Germeroth held a variety of controllership, risk control and treasury positions at various entities in his energy career. Mr. Germeroth has more than 29 years of experience in energy strategy and risk management, having directed a variety of commercial strategy, enterprise risk management and corporate restructuring projects for multiple companies. Mr. Germeroth has led efforts related to corporate governance, portfolio risk evaluation, operational risk management, strategic options analysis, management of portfolio capital requirements, organizational and business process design, transaction settlement and financial accounting. Mr. Germeroth obtained a Bachelor of Science in Finance from the University of Denver.
The remaining information required by this Item under the captions “Board Meeting and Board Committee Information,” “Corporate Governance Matters” and “Proposal 1 — Election of Directors” is incorporated herein by reference to our proxy statement for the 2010 annual meeting of stockholders to be held on May 19, 2010.
Item 11. Executive Compensation
Information appearing under this Item is incorporated herein by reference to our proxy statement for the 2010 annual meeting of stockholders to be held May 19, 2010.
Item 12. Security Ownership of Certain Beneficial Owners and Management and Related Stockholder Matters
Information appearing under this Item is incorporated herein by reference to our proxy statement for the 2010 annual meeting of stockholders to be held May 19, 2010.
Item 13. Certain Relationships and Related Transactions and Director Independence
Information appearing under this Item is incorporated herein by reference to our proxy statement for the 2010 annual meeting of stockholders to be held May 19, 2010.
Item 14. Principal Accounting Fees and Services
Information appearing under this Item is incorporated herein by reference to our proxy statement for the 2010 annual meeting of stockholders to be held May 19, 2010.
108
Table of Contents
Index to Financial Statements
Item 15. Exhibits, Financial Statement Schedule
| Page | ||
| (a)-1. Financial Statements and Other Information |
||
| Calpine Corporation and Subsidiaries |
||
| 117 | ||
| Consolidated Statements of Operations for the Years Ended December 31, 2009, 2008 and 2007 |
118 | |
| 119 | ||
| 120 | ||
| Consolidated Statements of Cash Flows for the Years Ended December 31, 2009, 2008 and 2007 |
121 | |
| Notes to Consolidated Financial Statements for the Years Ended December 31, 2009, 2008 and 2007 |
123 | |
| (a)-2. Financial Statement Schedule |
||
| Calpine Corporation and Subsidiaries |
||
| 188 | ||
| (c)-1. Financial Statements and Other Information |
||
| Otay Mesa Energy Center, LLC |
||
| 190 | ||
| 191 | ||
| 192 | ||
| 193 | ||
| 194 | ||
| 195 | ||
| 212 |
109
Table of Contents
Index to Financial Statements
| Exhibit Number |
Description | |
| 2.1 | Debtors’ Sixth Amended Joint Plan of Reorganization Pursuant to Chapter 11 of the United States Bankruptcy Code (incorporated by reference to Exhibit 2.1 to the Company’s Current Report on Form 8-K filed with the SEC on December 27, 2007). | |
| 2.2 | Findings of Fact, Conclusions of Law, and Order Confirming Sixth Amended Joint Plan of Reorganization Pursuant to Chapter 11 of the Bankruptcy Code (incorporated by reference to Exhibit 2.2 to the Company’s Current Report on Form 8-K filed with the SEC on December 27, 2007). | |
| 3.1 | Amended and Restated Certificate of Incorporation of the Company, as amended (incorporated by reference to Exhibit 3.1 to the Company’s Current Report on Form 8-K filed with the SEC on February 1, 2008). | |
| 3.2 | Amended and Restated By-Laws of the Company (as amended through May 7, 2009) (incorporated by reference to Exhibit 3.2 to the Company’s Quarterly Report on Form 10-Q for the quarter ended June 30, 2009, filed with the SEC on July 31, 2009). | |
| 4.1 | Indenture, dated as of June 13, 2003, between Power Contract Financing, L.L.C. and Wilmington Trust Company, as trustee, accounts agent, paying agent and registrar, including form of 6.256 senior secured notes due 2010 (incorporated by reference to Exhibit 4.4 to the Company’s Quarterly Report on Form 10-Q for the quarter ended June 30, 2003, filed with the SEC on August 14, 2003). | |
| 4.2 | Indenture, dated as of September 30, 2003, among Gilroy Energy Center, LLC, each of Creed Energy Center, LLC and Goose Haven Energy Center, as guarantors, and Wilmington Trust Company, as trustee and collateral agent, including form of 4.00% senior secured notes due 2011 (incorporated by reference to Exhibit 4.6 to the Company’s Quarterly Report on Form 10-Q for the quarter ended September 30, 2003, filed with the SEC on November 13, 2003). | |
| 4.3 | Third Priority Indenture, dated as of March 23, 2004, among Calpine Generating Company, LLC, CalGen Finance Corp. and Manufacturers and Traders Trust Company (as successor trustee to Wilmington Trust FSB), as trustee, including form of third priority secured floating rate notes due 2011 (incorporated by reference to Exhibit 4.21 to the Company’s Annual Report on Form 10-K for the year ended December 31, 2003, filed with the SEC on March 25, 2004). | |
| 4.4 | Indenture, dated as of June 2, 2004, between Power Contract Financing III, LLC and Wilmington Trust Company, as trustee, accounts agent, paying agent and registrar, including form of senior secured notes due 2010 (incorporated by reference to Exhibit 4.6 to the Company’s Quarterly Report on Form 10-Q for the quarter ended June 30, 2004, filed with the SEC on August 9, 2004). | |
| 4.5 | Indenture, dated May 19, 2009, among Calpine Construction Finance Company, L.P. and CCFC Finance Corp., the guarantors named therein, and Wilmington Trust Company, as trustee, including form of 8.00% senior secured notes due 2016 (incorporated by reference to Exhibit 4.1 to our Current Report on Form 8-K filed with the SEC on May 22, 2009). | |
| 4.6 | Indenture, dated October 21, 2009, between the Company and Wilmington Trust Company, as trustee, including form of 7.25% senior secured notes due 2017 (incorporated by reference to Exhibit 4.1 to the Company’s Current Report on Form 8-K filed with the SEC on October 26, 2009). | |
| 4.7 | Registration Rights Agreement, dated January 31, 2008, among the Company and each Participating Shareholder named therein (incorporated by reference to Exhibit 10.1 to the Company’s Current Report on Form 8K filed with the SEC on February 6, 2008). | |
| 10.1 | Financing Agreements | |
110
Table of Contents
Index to Financial Statements
| Exhibit Number |
Description | |
| 10.1.1.1 | Credit Agreement, dated as of January 31, 2008, among the Company, as borrower, Goldman Sachs Credit Partners L.P., Credit Suisse, Deutsche Bank Securities Inc. and Morgan Stanley Senior Funding, Inc., as co-documentation agents and as co-syndication agents, General Electric Capital Corporation, as sub-agent for the revolving lenders, Goldman Sachs Credit Partners L.P., as administrative agent and as collateral agent and each of the financial institutions from time to time party thereto (incorporated by reference to Exhibit 4.1 to the Company’s Current Report on Form 8-K filed with the SEC on February 1, 2008). | |
| 10.1.1.2 | First Amendment to Credit Agreement and Second Amendment to Collateral Agency and Intercreditor Agreement, dated as of August 20, 2009, among the Company, certain of the Company’s subsidiaries as guarantors, the financial institutions party thereto as lenders and Goldman Sachs Credit Partners L.P., as administrative agent and collateral agent (incorporated by reference to Exhibit 10.2 to the Company’s Current Report on Form 8-K filed with the SEC on August 26, 2009). | |
| 10.1.1.3 | Guaranty and Collateral Agreement, dated as of January 31, 2008, made by the Company and certain of the Company’s subsidiaries party thereto in favor of Goldman Sachs Credit Partners, L.P., as collateral agent (incorporated by reference to Exhibit 10.1.3 to the Company’s Annual Report on Form 10-K for the year ended December 31, 2007, filed with the SEC on February 29, 2008). | |
| 10.1.1.4 | Commodity Collateral Revolving Credit Agreement, dated as of July 8, 2008, among Calpine Corporation as Borrower, Goldman Sachs Credit Partners L.P. as Payment Agent, sole Lead Arranger and sole Bookrunner, and the Lenders from time to time party thereto (incorporated by reference to Exhibit 10.1 to the Company’s Current Report on Form 8-K filed with the SEC on July 14, 2008). | |
| 10.1.5 | Credit Agreement, dated as of June 24, 2004, among Riverside Energy Center, LLC, the Lenders named therein, Union Bank of California, N.A., as the Issuing Bank, Credit Suisse First Boston, acting through its Cayman Islands Branch, as Lead Arranger, Book Runner, Administrative Agent and Collateral Agent, and CoBank, ACB, as Syndication Agent (incorporated by reference to Exhibit 10.1.9 to the Company’s Annual Report on Form 10-K for the year ended December 31, 2004, filed with the SEC on March 31, 2005). | |
| 10.1.6 | Credit Agreement, dated as of June 24, 2004, among Rocky Mountain Energy Center, LLC, the Lenders named therein, Union Bank of California, N.A., as the Issuing Bank, Credit Suisse First Boston, acting through its Cayman Islands Branch, as Lead Arranger, Book Runner, Administrative Agent and Collateral Agent, and CoBank, ACB, as Syndication Agent (incorporated by reference to Exhibit 10.1.10 to the Company’s Annual Report on Form 10-K for the year ended December 31, 2004, filed with the SEC on March 31, 2005). | |
| 10.1.7 | Amended and Restated Credit Agreement, dated as of November 24, 2009, among Calpine Steamboat Holdings, LLC, Calyon New York Branch, as lead arranger, co-book runner, administrative agent, collateral agent and Security Fund LC issuer, WestLB AG, New York Branch, as lead arranger, co-book runner and syndication agent, CoBank ACB and The Bank of Tokyo-Mitsubishi UFJ, LTD., New York Branch, as lead arrangers, co-book runners and co-documentation agents, Landesbank Hessen-Thüringen, Natixis, New York Branch, The Governor & Company of the Bank of Ireland and Bayerische Hypo-Und Vereinsbank AG, New York Branch, as lead arrangers, and the lenders named therein (incorporated by reference to Exhibit 10.1 to the Company’s Current Report on Form 8-K filed with the SEC on November 30, 2009). | |
| 10.2 | Management Contracts or Compensatory Plans or Arrangements | |
| 10.2.1.1 | Employment Agreement, dated August 10, 2008, between the Company and Jack A. Fusco (incorporated by reference to Exhibit 10.1 to the Company’s Current Report on Form 8-K filed with the SEC on August 12, 2008).† | |
111
Table of Contents
Index to Financial Statements
| Exhibit Number |
Description | |
| 10.2.1.2 | Calpine Corporation Executive Sign On Non-Qualified Stock Option Agreement (Jack A. Fusco) (incorporated by reference to Exhibit 10.2 to the Company’s Current Report on Form 8-K filed with the SEC on August 12, 2008).† | |
| 10.2.2 | Letter Agreement, dated December 17, 2008, between the Company and Zamir Rauf (incorporated by reference to Exhibit 10.1 to the Company’s Current Report on Form 8-K filed with the SEC on December 19, 2008).† | |
| 10.2.3.1 | Letter Agreement, dated September 1, 2008, between the Company and John B. Hill (incorporated by reference to Exhibit 10.1 to the Company’s Current Report on Form 8-K filed with the SEC on September 4, 2008).† | |
| 10.2.3.2 | Calpine Corporation Executive Sign On Non-Qualified Stock Option Agreement (John B. Hill) (incorporated by reference to Exhibit 10.2 to the Company’s Current Report on Form 8-K filed with the SEC on September 4, 2008).† | |
| 10.2.4.1 | Employment Agreement, dated August 11, 2008, between the Company and W. Thaddeus Miller (incorporated by reference to Exhibit 10.2.7 to the Company’s Quarterly Report on Form 10-Q for the quarter ended September 30, 2008, filed with the SEC on November 7, 2008).† | |
| 10.2.4.2 | Calpine Corporation Executive Sign On Non-Qualified Stock Option Agreement (Miller) (incorporated by reference to Exhibit 4.4 to the Company’s Registration Statement on Form S-8 (Registration No. 333-153860) filed with the SEC on October 6, 2008).† | |
| 10.2.5 | Calpine Corporation U.S. Severance Program.*† | |
| 10.2.6 | Calpine Corporation 2009 Calpine Incentive Plan (incorporated by reference to Exhibit 10.2 to the Company’s Quarterly Report on Form 10-Q for the quarter ended March 31, 2009, filed with the SEC on May 8, 2009).† | |
| 10.2.7 | Calpine Corporation 2008 Calpine Incentive Plan (incorporated by reference to Exhibit 10.2.9 to the Company’s Quarterly Report on Form 10-Q for the quarter ended September 30, 2008, filed with the SEC on November 7, 2008).† | |
| 10.2.8.1 | Calpine Corporation 2008 Equity Incentive Plan (incorporated by reference to Exhibit 4.5 to the Company’s Registration Statement on Form S-8 (No. 333-149074) filed with the SEC on February 6, 2008).† | |
| 10.2.8.2 | Form of Non-Qualified Stock Option Agreement (Pursuant to the 2008 Equity Incentive Plan) (incorporated by reference to Exhibit 10.4.3 to the Company’s Quarterly Report on Form 10-Q for the quarter ended March 31, 2008, filed with the SEC on May 12, 2008).† | |
| 10.2.8.3 | Form of Restricted Stock Agreement (Pursuant to the 2008 Equity Incentive Plan) (incorporated by reference to Exhibit 10.4.4 to the Company’s Quarterly Report on Form 10-Q for the quarter ended March 31, 2008, filed with the SEC on May 12, 2008).† | |
| 10.2.8.4 | Director’s Restricted Stock Unit Agreement (Pursuant to the 2008 Equity Incentive Plan) between the Company and Mr. William J. Patterson (incorporated by reference to Exhibit 10.4.6 to the Company’s Quarterly Report on Form 10-Q for the quarter ended March 31, 2008, filed with the SEC on May 12, 2008).† | |
| 10.2.8.5 | Restricted Stock Unit Election Form between the Company and William J. Patterson (incorporated by reference to Exhibit 10.4.7 to the Company’s Quarterly Report on Form 10-Q for the quarter ended March 31, 2008, filed with the SEC on May 12, 2008).† | |
| 10.2.9.1 | Calpine Corporation 2008 Director Incentive Plan (incorporated by reference to Exhibit 4.4 to the Company’s Registration Statement on Form S-8 (No. 333-149074) filed with the SEC on February 6, 2008).† | |
112
Table of Contents
Index to Financial Statements
| Exhibit Number |
Description | |
| 10.2.9.2 | Amendment No. 1 to the Calpine Corporation 2008 Director Incentive Plan (incorporated by reference to the Company’s Annual Report on Form 10-K for the year ended December 31, 2008, filed with the SEC on February 27, 2009).† | |
| 10.2.9.3 | Form of Restricted Stock Agreement (Pursuant to the 2008 Director Incentive Plan) (incorporated by reference to Exhibit 10.4.5 to the Company’s Quarterly Report on Form 10-Q for the quarter ended March 31, 2008, filed with the SEC on May 12, 2008).† | |
| 10.2.10 | Calpine Corporation Change in Control and Severance Benefits Plan.*† | |
| 10.2.11 | Letter Agreement, dated December 30, 2008, between the Company and Jim D. Deidiker (incorporated by reference to Exhibit 10.1 to the Company’s Current Report on Form 8-K filed with the SEC on January 8, 2009).† | |
| 10.2.12 | Letter re Employment Offer, dated February 6, 2009, between the Company and Michael D. Rogers (incorporated by reference to Exhibit 10.1 to the Company’s Quarterly Report on Form 10-Q for the quarter ended March 31, 2009, filed with the SEC on May 7, 2009).† | |
| 18.1 | Letter of preferability regarding change in accounting principle from PricewaterhouseCoopers LLP, Independent Registered Public Accounting Firm.* | |
| 21.1 | Subsidiaries of the Company.* | |
| 23.1 | Consent of PricewaterhouseCoopers LLP, Independent Registered Public Accounting Firm.* | |
| 23.2 | Consent of PricewaterhouseCoopers LLP, Independent Registered Public Accounting Firm.* | |
| 24.1 | Power of Attorney of Officers and Directors of Calpine Corporation (set forth on the signature pages of this report).* | |
| 31.1 | Certification of the Chief Executive Officer Pursuant to Rule 13a-14(a) or Rule 15d-14(a) under the Securities Exchange Act of 1934, as Adopted Pursuant to Section 302 of the Sarbanes-Oxley Act of 2002.* | |
| 31.2 | Certification of the Senior Vice President and Chief Financial Officer Pursuant to Rule 13a-14(a) or Rule 15d-14(a) under the Securities Exchange Act of 1934, as Adopted Pursuant to Section 302 of the Sarbanes-Oxley Act of 2002.* | |
| 32.1 | Certification of Chief Executive Officer and Chief Financial Officer Pursuant to 18 U.S.C. Section 1350, as Adopted Pursuant to Section 906 of the Sarbanes-Oxley Act of 2002.* | |
| * | Filed herewith. |
| † | Management contract or compensatory plan or arrangement. |
113
Table of Contents
Index to Financial Statements
Pursuant to the requirements of Section 13 or 15(d) of the Securities Exchange Act of 1934, the registrant has duly caused this Report to be signed on its behalf by the undersigned thereunto duly authorized.
| CALPINE CORPORATION | ||
| By: | /s/ ZAMIR RAUF Zamir Rauf | |
| Executive Vice President and Chief Financial Officer (principal financial officer) | ||
Date: February 24, 2010
114
Table of Contents
Index to Financial Statements
KNOW ALL PERSONS BY THESE PRESENT: That the undersigned officers and directors of Calpine Corporation do hereby constitute and appoint W. Thaddeus Miller the lawful attorney and agent or attorneys and agents with power and authority to do any and all acts and things and to execute any and all instruments which said attorneys and agents, or either of them, determine may be necessary or advisable or required to enable Calpine Corporation to comply with the Securities and Exchange Act of 1934, as amended, and any rules or regulations or requirements of the Securities and Exchange Commission in connection with this Report. Without limiting the generality of the foregoing power and authority, the powers granted include the power and authority to sign the names of the undersigned officers and directors in the capacities indicated below to this Report or amendments or supplements thereto, and each of the undersigned hereby ratifies and confirms all that said attorneys and agents, or either of them, shall do or cause to be done by virtue hereof. This Power of Attorney may be signed in several counterparts.
IN WITNESS WHEREOF, each of the undersigned has executed this Power of Attorney as of the date indicated opposite the name.
Pursuant to the requirements of the Securities Exchange Act of 1934, this Report has been signed below by the following persons on behalf of the registrant and in the capacities and on the dates indicated.
| Signature |
Title |
Date | ||
| /s/ JACK A. FUSCO Jack A. Fusco |
President, Chief Executive Officer and Director (principal executive officer) | February 24, 2010 | ||
| /s/ ZAMIR RAUF Zamir Rauf |
Executive Vice President and Chief Financial Officer (principal financial officer) | February 24, 2010 | ||
| /s/ JIM D. DEIDIKER Jim D. Deidiker |
Chief Accounting Officer (principal accounting officer) | February 24, 2010 | ||
| /s/ FRANK CASSIDY Frank Cassidy |
Director | February 24, 2010 | ||
| /s/ ROBERT C. HINCKLEY Robert C. Hinckley |
Director | February 24, 2010 | ||
| /s/ DAVID C. MERRITT David C. Merritt |
Director | February 24, 2010 | ||
| /s/ W. BENJAMIN MORELAND W. Benjamin Moreland |
Director | February 24, 2010 | ||
| /s/ ROBERT MOSBACHER, JR. Robert Mosbacher, Jr. |
Director | February 24, 2010 | ||
| /s/ DENISE M. O’LEARY Denise M. O’Leary |
Director | February 24, 2010 | ||
| /s/ WILLIAM J. PATTERSON William J. Patterson |
Director | February 24, 2010 | ||
| /s/ J. STUART RYAN J. Stuart Ryan |
Director | February 24, 2010 | ||
115
Table of Contents
Index to Financial Statements
CALPINE CORPORATION AND SUBSIDIARIES
INDEX TO CONSOLIDATED FINANCIAL STATEMENTS
December 31, 2009
116
Table of Contents
Index to Financial Statements
Report of Independent Registered Public Accounting Firm
To the Board of Directors
and Stockholders of Calpine Corporation
In our opinion, the consolidated financial statements listed in the index appearing under item 15(a)-1 present fairly, in all material respects, the financial position of Calpine Corporation and its subsidiaries at December 31, 2009 and 2008, and the results of their operations and their cash flows for each of the three years in the period ended December 31, 2009 in conformity with accounting principles generally accepted in the United States of America. In addition, in our opinion, the financial statement schedule listed in the index appearing under item 15(a)-2 presents fairly, in all material respects, the information set forth therein when read in conjunction with the related consolidated financial statements. Also in our opinion, the Company maintained, in all material respects, effective internal control over financial reporting as of December 31, 2009, based on criteria established in Internal Control—Integrated Framework issued by the Committee of Sponsoring Organizations of the Treadway Commission (COSO). The Company’s management is responsible for these financial statements and financial statement schedule, for maintaining effective internal control over financial reporting and for its assessment of the effectiveness of internal control over financial reporting, appearing under Item 9A. Our responsibility is to express opinions on these financial statements, on the financial statement schedule, and on the Company’s internal control over financial reporting based on our integrated audits. We conducted our audits in accordance with the standards of the Public Company Accounting Oversight Board (United States). Those standards require that we plan and perform the audits to obtain reasonable assurance about whether the financial statements are free of material misstatement and whether effective internal control over financial reporting was maintained in all material respects. Our audits of the financial statements included examining, on a test basis, evidence supporting the amounts and disclosures in the financial statements, assessing the accounting principles used and significant estimates made by management, and evaluating the overall financial statement presentation. Our audit of internal control over financial reporting included obtaining an understanding of internal control over financial reporting, assessing the risk that a material weakness exists, and testing and evaluating the design and operating effectiveness of internal control based on the assessed risk. Our audits also included performing such other procedures as we considered necessary in the circumstances. We believe that our audits provide a reasonable basis for our opinions.
As discussed in Note 3 to the consolidated financial statements, the Company changed its method of depreciation for certain of its property, plant and equipment assets in 2009.
A company’s internal control over financial reporting is a process designed to provide reasonable assurance regarding the reliability of financial reporting and the preparation of financial statements for external purposes in accordance with generally accepted accounting principles. A company’s internal control over financial reporting includes those policies and procedures that (i) pertain to the maintenance of records that, in reasonable detail, accurately and fairly reflect the transactions and dispositions of the assets of the company; (ii) provide reasonable assurance that transactions are recorded as necessary to permit preparation of financial statements in accordance with generally accepted accounting principles, and that receipts and expenditures of the company are being made only in accordance with authorizations of management and directors of the company; and (iii) provide reasonable assurance regarding prevention or timely detection of unauthorized acquisition, use, or disposition of the company’s assets that could have a material effect on the financial statements.
Because of its inherent limitations, internal control over financial reporting may not prevent or detect misstatements. Also, projections of any evaluation of effectiveness to future periods are subject to the risk that controls may become inadequate because of changes in conditions, or that the degree of compliance with the policies or procedures may deteriorate.
/s/ PricewaterhouseCoopers LLP
Houston, Texas
February 24, 2010
117
Table of Contents
Index to Financial Statements
CALPINE CORPORATION AND SUBSIDIARIES
CONSOLIDATED STATEMENTS OF OPERATIONS
For the Years Ended December 31, 2009, 2008 and 2007
| 2009 | 2008 | 2007 | ||||||||||
| (in millions, except share and per share amounts) | ||||||||||||
| Operating revenues |
$ | 6,564 | $ | 9,937 | $ | 7,970 | ||||||
| Cost of revenue: |
||||||||||||
| Fuel and purchased energy expense |
3,897 | 7,281 | 5,683 | |||||||||
| Plant operating expense |
897 | 918 | 749 | |||||||||
| Depreciation and amortization expense |
467 | 433 | 463 | |||||||||
| Operating asset impairments |
4 | 33 | 44 | |||||||||
| Other cost of revenue |
84 | 114 | 136 | |||||||||
| Total cost of revenue |
5,349 | 8,779 | 7,075 | |||||||||
| Gross profit |
1,215 | 1,158 | 895 | |||||||||
| Sales, general and other administrative expense |
183 | 215 | 146 | |||||||||
| (Income) loss from unconsolidated investments in power plants |
(50 | ) | 229 | 21 | ||||||||
| Other operating expense |
18 | 26 | 23 | |||||||||
| Income from operations |
1,064 | 688 | 705 | |||||||||
| Interest expense |
829 | 1,071 | 2,019 | |||||||||
| Interest (income) |
(16 | ) | (47 | ) | (64 | ) | ||||||
| Debt extinguishment costs |
76 | 13 | (1 | ) | ||||||||
| Other (income) expense, net |
16 | 14 | (138 | ) | ||||||||
| Income (loss) before reorganization items, income taxes and discontinued operations |
159 | (363 | ) | (1,111 | ) | |||||||
| Reorganization items |
(1 | ) | (302 | ) | (3,258 | ) | ||||||
| Income (loss) before income taxes and discontinued operations |
160 | (61 | ) | 2,147 | ||||||||
| Income tax expense (benefit) |
15 | (47 | ) | (546 | ) | |||||||
| Income (loss) before discontinued operations |
145 | (14 | ) | 2,693 | ||||||||
| Discontinued operations, net of tax expense of $14 in 2008 |
— | 23 | — | |||||||||
| Net income |
145 | 9 | 2,693 | |||||||||
| Net loss attributable to the noncontrolling interest |
4 | 1 | — | |||||||||
| Net income attributable to Calpine |
$ | 149 | $ | 10 | $ | 2,693 | ||||||
| Basic earnings (loss) per common share: |
||||||||||||
| Weighted average shares of common stock outstanding (in thousands) |
485,659 | 485,054 | 479,235 | |||||||||
| Income (loss) before discontinued operations attributable to Calpine |
$ | 0.31 | $ | (0.03 | ) | $ | 5.62 | |||||
| Discontinued operations, net of tax, attributable to Calpine |
— | 0.05 | — | |||||||||
| Net income per common share attributable to Calpine — basic |
$ | 0.31 | $ | 0.02 | $ | 5.62 | ||||||
| Diluted earnings (loss) per common share: |
||||||||||||
| Weighted average shares of common stock outstanding (in thousands) |
486,319 | 485,546 | 479,478 | |||||||||
| Income (loss) before discontinued operations attributable to Calpine |
$ | 0.31 | $ | (0.03 | ) | $ | 5.62 | |||||
| Discontinued operations, net of tax, attributable to Calpine |
— | 0.05 | — | |||||||||
| Net income per common share attributable to Calpine — diluted |
$ | 0.31 | $ | 0.02 | $ | 5.62 | ||||||
The accompanying notes are an integral part of these Consolidated Financial Statements.
118
Table of Contents
Index to Financial Statements
CALPINE CORPORATION AND SUBSIDIARIES
CONSOLIDATED BALANCE SHEETS
December 31, 2009 and 2008
| 2009 | 2008 | |||||||
| (in millions, except share and per share amounts) |
||||||||
| ASSETS | ||||||||
| Current assets: |
||||||||
| Cash and cash equivalents |
$ | 989 | $ | 1,657 | ||||
| Accounts receivable, net of allowance of $14 and $42 |
747 | 846 | ||||||
| Accounts receivable, related party |
3 | 4 | ||||||
| Inventory |
209 | 163 | ||||||
| Margin deposits and other prepaid expense |
490 | 776 | ||||||
| Restricted cash, current |
508 | 337 | ||||||
| Derivative assets, current |
1,119 | 3,653 | ||||||
| Other current assets |
34 | 64 | ||||||
| Total current assets |
4,099 | 7,500 | ||||||
| Property, plant and equipment, net |
11,583 | 11,908 | ||||||
| Restricted cash, net of current portion |
54 | 166 | ||||||
| Investments |
214 | 144 | ||||||
| Long-term derivative assets |
127 | 404 | ||||||
| Other assets |
573 | 616 | ||||||
| Total assets |
$ | 16,650 | $ | 20,738 | ||||
| LIABILITIES & STOCKHOLDERS’ EQUITY | ||||||||
| Current liabilities: |
||||||||
| Accounts payable |
$ | 578 | $ | 574 | ||||
| Accrued interest payable |
54 | 85 | ||||||
| Debt, current portion |
463 | 716 | ||||||
| Derivative liabilities, current |
1,360 | 3,799 | ||||||
| Income taxes payable |
7 | 5 | ||||||
| Other current liabilities |
287 | 437 | ||||||
| Total current liabilities |
2,749 | 5,616 | ||||||
| Debt, net of current portion |
8,996 | 9,756 | ||||||
| Deferred income taxes, net of current portion |
54 | 93 | ||||||
| Long-term derivative liabilities |
197 | 698 | ||||||
| Other long-term liabilities |
208 | 203 | ||||||
| Total liabilities |
12,204 | 16,366 | ||||||
| Commitments and contingencies (see Note 17) |
||||||||
| Stockholders’ equity: |
||||||||
| Preferred stock, $.001 par value per share; authorized 100,000,000 shares, none issued and outstanding at December 31, 2009 and 2008 |
— | — | ||||||
| Common stock, $.001 par value per share; authorized 1,400,000,000 shares, 443,325,827 shares issued and 442,998,255 shares outstanding at December 31, 2009 and 429,025,057 shares issued and 428,960,025 shares outstanding at December 31, 2008 |
1 | 1 | ||||||
| Treasury stock, at cost, 327,572 shares and 65,032 shares at December 31, 2009 and December 31, 2008, respectively |
(3 | ) | (1 | ) | ||||
| Additional paid-in capital |
12,256 | 12,217 | ||||||
| Accumulated deficit |
(7,540 | ) | (7,689 | ) | ||||
| Accumulated other comprehensive loss |
(266 | ) | (158 | ) | ||||
| Total Calpine stockholders’ equity |
4,448 | 4,370 | ||||||
| Noncontrolling interest |
(2 | ) | 2 | |||||
| Total stockholders’ equity |
4,446 | 4,372 | ||||||
| Total liabilities and stockholders’ equity |
$ | 16,650 | $ | 20,738 | ||||
The accompanying notes are an integral part of these Consolidated Financial Statements.
119
Table of Contents
Index to Financial Statements
CALPINE CORPORATION AND SUBSIDIARIES
CONSOLIDATED STATEMENTS OF COMPREHENSIVE INCOME (LOSS) AND
STOCKHOLDERS’ EQUITY (DEFICIT)
For the Years Ended December 31, 2009, 2008 and 2007
| Common Stock |
Treasury Stock |
Additional Paid-In Capital |
Retained Earnings (Accumulated Deficit) |
Accumulated Other Comprehensive Income (Loss) |
Noncontrolling Interest |
Total Stockholders’ Equity (Deficit) |
||||||||||||||||||||||
| (in millions except share amounts) | ||||||||||||||||||||||||||||
| Balance, December 31, 2006 |
$ | 1 | $ | — | $ | 3,270 | $ | (10,378 | ) | $ | (46 | ) | $ | 3 | $ | (7,150 | ) | |||||||||||
| Return of 50,000,000 shares of loaned common stock |
— | — | (145 | ) | — | — | — | (145 | ) | |||||||||||||||||||
| Returnable shares |
— | — | 145 | — | — | — | 145 | |||||||||||||||||||||
| Stock-based compensation (income) |
— | — | (7 | ) | — | — | — | (7 | ) | |||||||||||||||||||
| Total stockholders’ deficit before comprehensive income (loss) items |
(7,157 | ) | ||||||||||||||||||||||||||
| Net income |
— | — | — | 2,693 | — | — | 2,693 | |||||||||||||||||||||
| Loss on cash flow hedges before reclassification adjustment for cash flow hedges realized in net income |
— | — | — | — | (196 | ) | — | (196 | ) | |||||||||||||||||||
| Reclassification adjustment for cash flow hedges realized in net income |
— | — | — | — | 13 | — | 13 | |||||||||||||||||||||
| Foreign currency translation gain |
— | — | — | — | 12 | — | 12 | |||||||||||||||||||||
| Income tax expense |
— | — | — | — | (14 | ) | — | (14 | ) | |||||||||||||||||||
| Total comprehensive income |
2,508 | |||||||||||||||||||||||||||
| Balance, December 31, 2007 |
$ | 1 | $ | — | $ | 3,263 | $ | (7,685 | ) | $ | (231 | ) | $ | 3 | $ | (4,649 | ) | |||||||||||
| Cancellation of Calpine Corporation common stock |
(1 | ) | — | (3,263 | ) | — | — | — | (3,264 | ) | ||||||||||||||||||
| Issuance of reorganized Calpine Corporation common stock in accordance with our Plan of Reorganization |
1 | — | 12,166 | — | — | — | 12,167 | |||||||||||||||||||||
| Treasury stock transactions |
— | (1 | ) | — | — | — | — | (1 | ) | |||||||||||||||||||
| Stock-based compensation expense |
— | — | 50 | — | — | — | 50 | |||||||||||||||||||||
| Proceeds received from the exercise of warrants |
— | — | 1 | — | — | — | 1 | |||||||||||||||||||||
| Cumulative effect of adjustment from adoption of fair value measurement standards, net of tax of $8 million |
— | — | — | (14 | ) | — | — | (14 | ) | |||||||||||||||||||
| Total stockholders’ equity before comprehensive income (loss) items |
4,290 | |||||||||||||||||||||||||||
| Net income (loss) |
— | — | — | 10 | — | (1 | ) | 9 | ||||||||||||||||||||
| Gain on cash flow hedges before reclassification adjustment for cash flow hedges realized in net income |
— | — | — | — | 141 | — | 141 | |||||||||||||||||||||
| Reclassification adjustment for cash flow hedges realized in net income |
— | — | — | — | 27 | — | 27 | |||||||||||||||||||||
| Foreign currency translation loss |
— | — | — | — | (19 | ) | — | (19 | ) | |||||||||||||||||||
| Income tax expense |
— | — | — | — | (76 | ) | — | (76 | ) | |||||||||||||||||||
| Total comprehensive income |
82 | |||||||||||||||||||||||||||
| Balance, December 31, 2008 |
$ | 1 | $ | (1 | ) | $ | 12,217 | $ | (7,689 | ) | $ | (158 | ) | $ | 2 | $ | 4,372 | |||||||||||
| Treasury stock transactions |
— | (2 | ) | — | — | — | — | (2 | ) | |||||||||||||||||||
| Stock-based compensation expense |
— | — | 38 | — | — | — | 38 | |||||||||||||||||||||
| Other |
— | — | 1 | — | — | — | 1 | |||||||||||||||||||||
| Total stockholders’ equity before comprehensive income (loss) items |
4,409 | |||||||||||||||||||||||||||
| Net income (loss) |
— | — | — | 149 | — | (4 | ) | 145 | ||||||||||||||||||||
| Gain on cash flow hedges before reclassification adjustment for cash flow hedges realized in net income |
— | — | — | — | 180 | — | 180 | |||||||||||||||||||||
| Reclassification adjustment for cash flow hedges realized in net income |
— | — | — | — | (335 | ) | — | (335 | ) | |||||||||||||||||||
| Foreign currency translation gain |
— | — | — | — | 4 | — | 4 | |||||||||||||||||||||
| Income tax benefit |
— | — | — | — | 43 | — | 43 | |||||||||||||||||||||
| Total comprehensive income |
37 | |||||||||||||||||||||||||||
| Balance, December 31, 2009 |
$ | 1 | $ | (3 | ) | $ | 12,256 | $ | (7,540 | ) | $ | (266 | ) | $ | (2 | ) | $ | 4.446 | ||||||||||
The accompanying notes are an integral part of these Consolidated Financial Statements.
120
Table of Contents
Index to Financial Statements
CALPINE CORPORATION AND SUBSIDIARIES
CONSOLIDATED STATEMENTS OF CASH FLOWS
For the Years Ended December 31, 2009, 2008 and 2007
| 2009 | 2008 | 2007 | ||||||||||
| (in millions) | ||||||||||||
| Cash flows from operating activities: |
||||||||||||
| Net income |
$ | 145 | $ | 9 | $ | 2,693 | ||||||
| Adjustments to reconcile net income to net cash provided by operating activities: |
||||||||||||
| Depreciation and amortization expense(1) |
556 | 544 | 554 | |||||||||
| (Income) loss from unconsolidated investments in power plants |
(50 | ) | 229 | 21 | ||||||||
| Debt extinguishment costs |
37 | 7 | — | |||||||||
| Deferred income taxes |
16 | 27 | (517 | ) | ||||||||
| Impairment loss |
4 | 46 | 46 | |||||||||
| Gain on sale of discontinued operations |
— | (37 | ) | — | ||||||||
| Loss on disposal of assets, excluding reorganization items |
37 | 36 | 31 | |||||||||
| Unrealized mark-to-market activity, net |
(89 | ) | (24 | ) | 52 | |||||||
| Return on investment in unconsolidated subsidiaries |
11 | — | — | |||||||||
| Stock-based compensation expense (income) |
38 | 50 | (1 | ) | ||||||||
| Reorganization items |
(6 | ) | (359 | ) | (3,342 | ) | ||||||
| Other |
6 | 16 | (2 | ) | ||||||||
| Change in operating assets and liabilities, net of effects of acquisitions: |
||||||||||||
| Accounts receivable |
108 | 375 | (194 | ) | ||||||||
| Derivative instruments |
(118 | ) | 234 | (34 | ) | |||||||
| Other assets |
235 | (101 | ) | (102 | ) | |||||||
| Accounts payable, LSTC and accrued expenses |
(19 | ) | (215 | ) | 931 | |||||||
| Other liabilities |
(150 | ) | (343 | ) | 51 | |||||||
| Net cash provided by operating activities |
761 | 494 | 187 | |||||||||
| Cash flows from investing activities: |
||||||||||||
| Purchases of property, plant and equipment |
(179 | ) | (143 | ) | (196 | ) | ||||||
| Proceeds from sale of power plants, turbines and investments |
— | 413 | 541 | |||||||||
| Proceeds from sale of discontinued operations |
— | 79 | — | |||||||||
| Cash acquired due to reconsolidation of Canadian Debtors and other deconsolidated foreign entities |
— | 64 | — | |||||||||
| Contributions to unconsolidated investments |
(19 | ) | (17 | ) | (68 | ) | ||||||
| Return of investment from unconsolidated investments |
9 | 27 | 179 | |||||||||
| (Increase) decrease in restricted cash |
(59 | ) | 78 | 37 | ||||||||
| Cash effect of deconsolidation of VIEs |
— | (2 | ) | (29 | ) | |||||||
| Other |
(2 | ) | 17 | 9 | ||||||||
| Net cash provided by (used in) investing activities |
(250 | ) | 516 | 473 | ||||||||
| Cash flows from financing activities: |
||||||||||||
| Repayments of notes payable |
(106 | ) | (99 | ) | (135 | ) | ||||||
| Borrowings from CCFC New Notes |
955 | — | — | |||||||||
| Repayments of CCFC Old Notes |
(781 | ) | (4 | ) | (4 | ) | ||||||
| Borrowings from project financing |
79 | 357 | 21 | |||||||||
| Repayments of project financing |
(121 | ) | (275 | ) | (88 | ) | ||||||
| Repayments of CalGen Secured Debt |
— | — | (224 | ) | ||||||||
| Borrowings under DIP Facility |
— | — | 614 | |||||||||
| Repayments of DIP Facility |
— | (98 | ) | (38 | ) | |||||||
| Borrowings under First Lien Facilities |
— | 4,248 | — | |||||||||
| Repayments of First Lien Facilities |
(785 | ) | (1,475 | ) | — | |||||||
| Borrowings under Commodity Collateral Revolver |
— | 100 | — | |||||||||
| Repayments of Second Priority Debt |
— | (3,672 | ) | — | ||||||||
| Proceeds from sale of ULC I notes |
— | — | 151 | |||||||||
| Repayments on capital leases |
(43 | ) | (42 | ) | (35 | ) | ||||||
| Redemptions of preferred interests |
(310 | ) | (166 | ) | (9 | ) | ||||||
| Financing costs |
(65 | ) | (207 | ) | (81 | ) | ||||||
| Derivative contracts classified as financing activities |
— | 64 | — | |||||||||
| Other |
(2 | ) | 1 | 6 | ||||||||
| Net cash provided by (used in) financing activities |
(1,179 | ) | (1,268 | ) | 178 | |||||||
| Net (decrease) increase in cash and cash equivalents |
(668 | ) | (258 | ) | 838 | |||||||
| Cash and cash equivalents, beginning of period |
1,657 | 1,915 | 1,077 | |||||||||
| Cash and cash equivalents, end of period |
$ | 989 | $ | 1,657 | $ | 1,915 | ||||||
The accompanying notes are an integral part of these Consolidated Financial Statements.
121
Table of Contents
Index to Financial Statements
CALPINE CORPORATION AND SUBSIDIARIES
CONSOLIDATED STATEMENTS OF CASH FLOWS — (Continued)
| 2009 | 2008 | 2007 | |||||||||
| (in millions) | |||||||||||
| Cash paid (received) during the period for: |
|||||||||||
| Interest, net of amounts capitalized |
$ | 761 | $ | 1,060 | $ | 1,143 | |||||
| Income taxes |
$ | 7 | $ | 74 | $ | 1 | |||||
| Reorganization items included in operating activities, net |
$ | 5 | $ | 120 | $ | 126 | |||||
| Reorganization items included in investing activities, net |
$ | — | $ | (418 | ) | $ | (582 | ) | |||
| Reorganization items included in financing activities, net |
$ | — | $ | — | $ | 74 | |||||
| Supplemental disclosure of non-cash investing and financing activities: |
|||||||||||
| Settlement of commodity contract with project financing |
$ | 79 | $ | — | $ | — | |||||
| Change in capital expenditures included in accounts payable |
$ | 6 | $ | 13 | $ | 1 | |||||
| Issuance of First Lien Notes in exchange for First Lien Credit Facility term loans |
$ | 1,200 | $ | — | $ | — | |||||
| Amended Steamboat project debt |
$ | 448 | $ | — | $ | — | |||||
| Settlement of LSTC through issuance of reorganized Calpine Corporation common stock |
$ | — | $ | 5,200 | $ | — | |||||
| DIP Facility borrowings converted into exit financing under our First Lien Facilities |
$ | — | $ | 3,872 | $ | — | |||||
| Settlement of Convertible Senior Notes and Unsecured Senior Notes with reorganized Calpine Corporation common stock |
$ | — | $ | 3,703 | $ | — | |||||
| DIP Facility borrowings used to extinguish the Original DIP Facility principal $(989), CalGen Secured Debt principal $(2,309) and operating liabilities $(88) |
$ | — | $ | — | $ | 3,386 | |||||
| Project financing $(159) and operating liabilities $(33) extinguished with sale of Aries Power Plant |
$ | — | $ | — | $ | 192 | |||||
| Return of loaned common stock |
$ | — | $ | — | $ | 145 | |||||
| Letter of credit draws under the CalGen Secured Debt used for operating activities |
$ | — | $ | — | $ | 16 | |||||
| Fair value of Metcalf cooperation agreement, with offsets to notes payable $(6) and operating liabilities $(6) |
$ | — | $ | — | $ | 12 | |||||
| (1) | Includes depreciation and amortization that is recorded in sales, general and other administrative expense and interest expense on our Consolidated Statements of Operations. |
The accompanying notes are an integral part of these Consolidated Financial Statements.
122
Table of Contents
Index to Financial Statements
CALPINE CORPORATION AND SUBSIDIARIES
NOTES TO CONSOLIDATED FINANCIAL STATEMENTS
For the Years Ended December 31, 2009, 2008 and 2007
1. Organization and Operations
We are an independent wholesale power generation company engaged in the ownership and operation of natural gas-fired and geothermal power plants in North America. We have a significant presence in the major competitive power markets in the U.S., including California and Texas. We sell wholesale power, steam, capacity, renewable energy credits and ancillary services to our customers, including industrial companies, retail power providers, utilities, municipalities, independent electric system operators, marketers and others. We engage in the purchase of natural gas as fuel for our power plants and in related natural gas transportation and storage transactions, and in the purchase of electric transmission rights to deliver power to our customers. We also enter into natural gas and power, commodity and financial derivative transactions to economically hedge our business risks and optimize our portfolio of power plants.
2. Summary of Significant Accounting Policies
Basis of Presentation and Principles of Consolidation
Our Consolidated Financial Statements have been prepared in accordance with GAAP and include the accounts of all majority-owned subsidiaries that are not VIEs and all VIEs where we have determined we are the primary beneficiary. Intercompany transactions have been eliminated in consolidation.
Equity Method Investments — We use the equity method of accounting to record our net interest in OMEC, a VIE where we have determined that we are not the primary beneficiary, Greenfield LP, a joint venture interest, and Whitby, a less-than-majority equity interest in which we exercise significant influence over operating and financial policies. Our share of net income (loss) is calculated according to our equity ownership or according to the terms of the applicable partnership agreement. See Note 4 for further discussion of our VIEs and unconsolidated investments.
Deconsolidations / Consolidations — As a result of filings by the Canadian Debtors under the CCAA in the Canadian Court, we deconsolidated the Canadian Debtors and their direct and indirect subsidiaries, constituting most of our foreign entities as of December 20, 2005, the Petition Date, as we determined that the administration of the CCAA proceedings in a jurisdiction other than that of the U.S. Debtors’ Chapter 11 cases resulted in a loss of the elements of control necessary for consolidation and we fully impaired our investment in the Canadian Debtors and other deconsolidated foreign entities. On February 8, 2008, the Canadian Effective Date, the Canadian Court ordered and declared that the CCAA proceedings were terminated. The termination of the CCAA proceedings and our emergence from Chapter 11 proceedings in the U.S. allowed us to maintain our equity interest in the Canadian Debtors and other deconsolidated foreign entities, whose principal assets included various working capital items and a 50% ownership interest in Whitby, an equity method investment. As a result, we regained control over the Canadian Debtors and other deconsolidated foreign entities, which were reconsolidated into our Consolidated Financial Statements as of the Canadian Effective Date. See Note 16 for a further discussion on our emergence from Chapter 11.
We accounted for the reconsolidation under the purchase method in a manner similar to a step acquisition. The excess of the fair market value of the reconsolidated net assets over the carrying value of our investment balance of $0 amounted to approximately $133 million. We recorded the Canadian assets acquired and the liabilities assumed based on their estimated fair value, with the exception of Whitby. We reduced the fair value of our Whitby equity investment (approximately $62 million) to $0 on the Canadian Effective Date and recorded the $71 million balance of the excess as a gain in reorganization items on our 2008 Consolidated Statement of Operations.
123
Table of Contents
Index to Financial Statements
CALPINE CORPORATION AND SUBSIDIARIES
NOTES TO CONSOLIDATED FINANCIAL STATEMENTS — (Continued)
For the Years Ended December 31, 2009, 2008 and 2007
During the second quarter of 2007, we deconsolidated OMEC. We deconsolidated RockGen in January 2008 and Auburndale in August 2008, and subsequently reconsolidated RockGen in December 2008. See Note 4 for further discussion of our VIEs.
Reclassifications
Certain reclassifications have been made to our December 31, 2008 Consolidated Balance Sheet, and our Consolidated Statements of Operations and Consolidated Statements of Cash Flows for the years ended December 31, 2008 and 2007 to conform to the current year presentation. Our reclassifications are summarized as follows:
| • | We adopted the new accounting standards under GAAP for noncontrolling interests in consolidated financial statements effective January 1, 2009, and accordingly have reclassified minority interest as “noncontrolling interest,” a component of stockholders’ equity, on our Consolidated Balance Sheets and included “net loss attributable to the noncontrolling interest” as a separate line item on our Consolidated Statements of Operations. See “New Accounting Standards and Disclosure Requirements” for a further discussion regarding this requirement. |
| • | We have reclassified certain amounts on our Consolidated Statements of Cash Flows for years ended December 31, 2008 and 2007, to separately report non-cash debt extinguishment costs of $7 million for the year ended December 31, 2008, previously reflected in depreciation and amortization expense and unrealized mark-to-market activity of $(24) million and $52 million previously reflected in our changes in derivative instruments included within our cash flows provided by operating activities. |
Use of Estimates in Preparation of Financial Statements
The preparation of financial statements in conformity with GAAP requires management to make estimates and assumptions that affect the reported amounts of assets, liabilities, revenues, expenses and related disclosures included in our Consolidated Financial Statements. Actual results could differ from those estimates.
Fair Value of Financial Instruments and Derivatives
The carrying values of accounts receivable, accounts payable and other receivables and payables approximate their respective fair values due to their short-term maturities. See Note 7 for disclosures regarding the fair value of our debt instruments and Notes 8 and 9 for disclosures regarding the fair values of our derivative instruments.
Concentrations of Credit Risk
Financial instruments that potentially subject us to credit risk consist of cash and cash equivalents, restricted cash, accounts and notes receivable and derivative assets. Certain of our cash and cash equivalents, as well as our restricted cash balances, exceed FDIC insured limits or are invested in money market accounts with investment banks that are not FDIC insured. We place our cash and cash equivalents and restricted cash in what we believe to be credit-worthy financial institutions and certain of our money market accounts invest in U.S. Treasury securities or other obligations issued or guaranteed by the U.S. Government, its agencies or instrumentalities. Additionally, we actively monitor the credit risk of our receivable and derivative counterparties. Our accounts and notes receivable are concentrated within entities engaged in the energy industry,
124
Table of Contents
Index to Financial Statements
CALPINE CORPORATION AND SUBSIDIARIES
NOTES TO CONSOLIDATED FINANCIAL STATEMENTS — (Continued)
For the Years Ended December 31, 2009, 2008 and 2007
mainly within the U.S. We generally have not collected collateral for accounts receivable from utilities and end-user customers; however, we may require collateral in the future. For financial and commodity counterparties, we evaluate the net accounts receivable, accounts payable and fair value of commodity contracts and may require security deposits, cash margin or letters of credit to be posted if our exposure reaches a certain level or their credit rating declines.
Cash and Cash Equivalents
We consider all highly liquid investments with an original maturity of three months or less to be cash equivalents. We have certain project finance facilities and lease agreements that require us to establish and maintain segregated cash accounts, which have been pledged as security in favor of the lenders under such project finance facilities, and the use of certain cash balances on deposit in such accounts is limited, at least temporarily, to the operations of the respective projects. At December 31, 2009 and 2008, we had cash and cash equivalents of $264 million and $296 million, respectively, that were subject to such project finance facilities and lease agreements.
Restricted Cash
Certain of our debt agreements, lease agreements or other operating agreements require us to establish and maintain segregated cash accounts, the use of which are restricted. These amounts are held by depository banks in order to comply with the contractual provisions requiring reserves for payments such as for debt service, rent, major maintenance and debt repurchases or with applicable regulatory requirements. Funds that can be used to satisfy obligations due during the next 12 months are classified as current restricted cash, with the remainder classified as non-current restricted cash. Restricted cash is generally invested in accounts earning market rates; therefore, the carrying value approximates fair value. Such cash is excluded from cash and cash equivalents on our Consolidated Balance Sheets and Statements of Cash Flows.
The table below represents the components of our restricted cash as of December 31, 2009 and 2008 (in millions):
| 2009 | 2008 | |||||||||||||||||
| Current | Non-Current | Total | Current | Non-Current | Total | |||||||||||||
| Debt service |
$ | 193 | $ | 25 | $ | 218 | $ | 102 | $ | 121 | $ | 223 | ||||||
| Rent reserve |
34 | — | 34 | 34 | — | 34 | ||||||||||||
| Construction/major maintenance |
87 | 22 | 109 | 72 | 18 | 90 | ||||||||||||
| Security/project/insurance |
146 | — | 146 | 96 | 1 | 97 | ||||||||||||
| Other |
48 | 7 | 55 | 33 | 26 | 59 | ||||||||||||
| Total |
$ | 508 | $ | 54 | $ | 562 | $ | 337 | $ | 166 | $ | 503 | ||||||
125
Table of Contents
Index to Financial Statements
CALPINE CORPORATION AND SUBSIDIARIES
NOTES TO CONSOLIDATED FINANCIAL STATEMENTS — (Continued)
For the Years Ended December 31, 2009, 2008 and 2007
Of our restricted cash at December 31, 2009 and 2008, $292 million and $265 million, respectively, relate to the assets of the following entities, each of which is an entity with its legal existence separate from us and our other subsidiaries (in millions):
| 2009 | 2008 | |||||
| PCF |
$ | 159 | $ | 159 | ||
| Gilroy Energy Center, LLC |
34 | 35 | ||||
| Rocky Mountain Energy Center, LLC |
48 | 29 | ||||
| Riverside Energy Center, LLC |
42 | 33 | ||||
| Calpine King City Cogen, LLC |
8 | 8 | ||||
| PCF III |
1 | 1 | ||||
| Total |
$ | 292 | $ | 265 | ||
Accounts Receivable and Payable
Accounts receivable and payable represent amounts due from customers and owed to vendors. Accounts receivable are recorded at invoiced amounts, net of reserves and allowances, and do not bear interest. Receivable balances greater than 30 days past due are individually reviewed for collectability, and if deemed uncollectible, are charged off against the allowance accounts after all means of collection have been exhausted and the potential for recovery is considered remote. We use our best estimate to determine the required allowance for doubtful accounts based on a variety of factors, including the length of time receivables are past due, economic trends and conditions affecting our customer base, significant one-time events and historical write-off experience. Specific provisions are recorded for individual receivables when we become aware of a customer’s inability to meet its financial obligations. We review the adequacy of our reserves and allowances quarterly.
The accounts receivable and payable balances also include settled but unpaid amounts relating to marketing, hedging and optimization activities of CES. Some of these receivables and payables with individual counterparties are subject to master netting arrangements whereby we legally have a right of offset and we settle the balances net. However, for balance sheet presentation purposes and to be consistent with the way we present the majority of amounts related to marketing, hedging and optimization activities on our Consolidated Statements of Operations, we present our receivables and payables on a gross basis. We do not have any significant off balance sheet credit exposure related to our customers.
Counterparty Credit Risk
Our counterparties primarily consist of three categories of entities who participate in the wholesale energy markets:
| • | financial institutions and trading companies; |
| • | regulated utilities, municipalities, cooperatives and other retail power suppliers; and |
| • | oil, natural gas, chemical and other energy-related industrial companies. |
We have exposure to trends within the energy industry, including declines in the creditworthiness of our marketing counterparties. Currently, certain of our marketing counterparties within the energy industry have
126
Table of Contents
Index to Financial Statements
CALPINE CORPORATION AND SUBSIDIARIES
NOTES TO CONSOLIDATED FINANCIAL STATEMENTS — (Continued)
For the Years Ended December 31, 2009, 2008 and 2007
below investment grade credit ratings. Our risk control group manages counterparty credit risk and monitors our net exposure with each counterparty on a daily basis. The analysis is performed on a mark-to-market basis using forward curves. The net exposure is compared against a counterparty credit risk threshold which is determined based on each counterparty’s credit rating and evaluation of their financial statements. We utilize these thresholds to determine the need for additional collateral or restriction of activity with the counterparty. We do not currently have any significant exposure to counterparties that are not paying on a current basis.
Inventory
Inventory primarily consists of spare parts, stored natural gas, emission reduction credits and natural gas exchange imbalances. Inventory, other than spare parts, is stated primarily at the lower of cost or market value under the weighted average cost method. Spare parts inventory is valued at weighted average cost and the costs are expensed to plant operating costs or capitalized to property, plant and equipment as the parts are utilized and consumed.
Collateral
We use margin deposits, prepayments and letters of credit as credit support with and from our counterparties for commodity procurement and risk management activities. In addition, we have granted additional first priority liens on the assets currently subject to first priority liens under our First Lien Credit Facility as collateral under certain of our power and natural gas agreements that qualify as “eligible commodity hedge agreements” under our First Lien Credit Facility and certain of our interest rate swap agreements in order to reduce the cash collateral and letters of credit that we would otherwise be required to provide to our counterparties under such agreements. The counterparties under such agreements would share the benefits of the collateral subject to such first priority liens ratably with the lenders under our First Lien Credit Facility. See Note 10 for a further discussion on our amounts and use of collateral.
Deferred Financing Costs
Costs incurred related to the issuance of debt instruments are deferred and amortized over the term of the related debt using a method that approximates the effective interest rate method. However, when the timing of debt transactions involve contemporaneous exchanges of cash between us and the same creditor(s) in connection with the issuance of a new debt obligation and satisfaction of an existing debt obligation, deferred financing costs are accounted for depending on whether the transaction qualifies as an extinguishment or modification, which requires us to either write off the original deferred financing costs and capitalize the new issuance costs, or continue to amortize the original deferred financing costs and immediately expense the new issuance costs.
Property, Plant and Equipment, Net
Property, plant, and equipment items are recorded at cost. We capitalize costs incurred in connection with the construction of power plants, the development of geothermal properties and the refurbishment of major turbine generator equipment. When capital improvements to leased power plants meet our capitalization criteria they are capitalized as leasehold improvements and amortized over the shorter of the term of the lease or the economic life of the capital improvement. We expense maintenance when the service is performed for work that does not meet our capitalization criteria. Our current capital expenditures at our Geysers Assets are those incurred for proven reserves and reservoir replenishment (primarily water injection), pipeline and power generation assets and drilling of “development wells” as all drilling activity has been performed within the
127
Table of Contents
Index to Financial Statements
CALPINE CORPORATION AND SUBSIDIARIES
NOTES TO CONSOLIDATED FINANCIAL STATEMENTS — (Continued)
For the Years Ended December 31, 2009, 2008 and 2007
known boundaries of the steam reservoir. We have capitalized costs incurred during ownership consisting of additions, repairs or replacements when they appreciably extend the life, increase the capacity or improve the efficiency or safety of the property. Such costs are expensed when they do not meet the above criteria. We purchased our Geysers Assets as a proven steam reservoir and accounted for the assets under purchase accounting. All well costs, except well workovers, have been capitalized since our purchase date. Exploration activities are extremely limited and are not material to our overall capital expenditures or our fixed assets. We drilled one deep test well in the Glass Mountain area in northern California in 2001, which produced economically viable quantities of steam. Immaterial holding costs at Glass Mountain are expensed.
We depreciate our assets under the straight line method over the shorter of their estimated useful life or lease term using an estimated salvage value which approximates 10% of the depreciable cost basis for our power plant assets where we own the land or have a favorable option to purchase the land at conclusion of the lease term and approximately 0.15% of the depreciable costs basis for our rotable spares equipment. During 2009, we reviewed our accounting policies related to depreciation including our estimates of useful lives. We determined changing from composite depreciation to component depreciation for our rotable natural gas-fired power plant assets, and changing our Geysers Assets depreciation from the units of production method to the straight line method was preferable under GAAP. We also revised our estimates of useful lives. See Note 3 for further discussion regarding our changes in depreciation and the effective date of our changes.
Generally, upon normal retirement of assets under the composite depreciation method, the costs of such assets are retired against accumulated depreciation and no gain or loss is recorded. For the retirement of assets under the component depreciation method, generally, the costs and related accumulated depreciation of such assets are removed from our Consolidated Balance Sheets and a gain or loss is recorded.
Impairment Evaluation of Long-Lived Assets (Including Intangibles and Investments)
We evaluate our long-lived assets, such as property, plant and equipment, equity method investments, turbine equipment patents and specifically identifiable intangibles for impairment, when events or changes in circumstances indicate that the carrying value of such assets may not be recoverable. Examples of such events or changes in circumstances are:
| • | a significant decrease in the market price of a long-lived asset; |
| • | a significant adverse change in the manner an asset is being used or its physical condition; |
| • | an adverse action by a regulator or legislature or an adverse change in the business climate; |
| • | an accumulation of costs significantly in excess of the amount originally expected for the construction or acquisition of an asset; |
| • | a current-period loss combined with a history of losses or the projection of future losses; or |
| • | a change in our intent about an asset from an intent to hold to a greater than 50% likelihood that an asset will be sold or disposed of before the end of its previously estimated useful life. |
When we believe an impairment condition may have occurred, we are required to estimate the undiscounted future cash flows associated with a long-lived asset or group of long-lived assets at the lowest level for which identifiable cash flows are largely independent of the cash flows of other assets and liabilities for long-lived assets that are expected to be held and used. Equipment assigned to each power plant is not evaluated for impairment separately; instead, we evaluate our operating power plants and related equipment as a whole unit.
128
Table of Contents
Index to Financial Statements
CALPINE CORPORATION AND SUBSIDIARIES
NOTES TO CONSOLIDATED FINANCIAL STATEMENTS — (Continued)
For the Years Ended December 31, 2009, 2008 and 2007
All construction and development projects are reviewed for impairment whenever there is an indication of potential reduction in fair value. If it is determined that it is no longer probable that the projects will be completed and all capitalized costs will be recovered through future operations, the carrying values of the projects would be written down to their fair value.
In order to estimate future cash flows, we consider historical cash flows, existing and future contracts and PPAs and changes in the market environment and other factors that may affect future cash flows. To the extent applicable, the assumptions we use are consistent with forecasts that we are otherwise required to make (for example, in preparing our other earnings forecasts). The use of this method involves inherent uncertainty. We use our best estimates in making these evaluations and consider various factors, including forward price curves for power and fuel costs and forecasted operating costs. However, actual future market prices and project costs could vary from the assumptions used in our estimates, and the impact of such variations could be material.
When we determine that our assets meet the assets held-for-sale criteria, they are reported at the lower of the carrying amount or fair value less the cost to sell.
If we determine that the undiscounted cash flows from an asset to be held and used are less than the carrying amount of the asset, or if we have classified an asset as held for sale, we must estimate fair value to determine the amount of any impairment charge.
Generally, fair value will be determined using valuation techniques such as the present value of expected future cash flows. We will also discount the estimated future cash flows associated with the asset using a single interest rate representative of the risk involved with such an investment including contract terms, tenor and credit risk of counterparts. We may also consider prices of similar assets, consult with brokers, or employ other valuation techniques. We use our best estimates in making these evaluations and consider various factors, including forward price curves for power and fuel costs and forecasted operating costs. However, actual future market prices and project costs could vary from the assumptions used in our estimates, and the impact of such variations could be material.
We are also required to evaluate our equity method investments to determine whether or not they are impaired when the value is considered an “other than a temporary” decline in value. The evaluation and measurement of impairments for equity method investments involve the same uncertainties as described for long-lived assets that we own directly. Similarly, our estimates that we make with respect to our equity method investments are subjective, and the impact of variations in these estimates could be material.
During 2009, we reviewed our power plants and determined that no events or changes in circumstances indicated that impairment conditions had occurred. However, based upon a sales agreement with a third party we wrote-down our natural gas reserves by approximately $4 million. The following table details impairment charges recorded during the years ended December 31, 2009, 2008 and 2007 (in millions):
| 2009 | 2008 | 2007 | |||||||
| Operating asset impairments |
$ | 4 | $ | 33 | $ | 44 | |||
| Impairment of equity method investment(1) |
— | 180 | — | ||||||
| Equipment, development project and other impairment charges(2) |
— | 13 | 2 | ||||||
| Impairments included in reorganization items |
— | — | 120 | ||||||
| Total impairment charges |
$ | 4 | $ | 226 | $ | 166 | |||
| (1) | Amounts are included in (income) loss from unconsolidated investments in power plants on our Consolidated Statements of Operations. |
129
Table of Contents
Index to Financial Statements
CALPINE CORPORATION AND SUBSIDIARIES
NOTES TO CONSOLIDATED FINANCIAL STATEMENTS — (Continued)
For the Years Ended December 31, 2009, 2008 and 2007
| (2) | Amounts are included in other operating expense on our Consolidated Statements of Operations. |
During the year ended December 31, 2008, we recorded an impairment loss of $180 million as a result of the anticipated sale of our investment in Auburndale as further described in Note 4. An additional impairment charge of $33 million was recorded at December 31, 2008, for our Auburndale Peaking Energy Center (a separate power plant from Auburndale) which did not receive an expected contract renewal resulting in reduced future expected cash flows. Additionally, we recorded impairments related to certain development projects that we determined were not probable of completion as of December 31, 2008. For the year ended December 31, 2007, we recorded operating asset impairment charges primarily related to the Bethpage Power Plant as additional competition from new transmission lines reduced future expected cash flows and we recorded $120 million in reorganization items primarily related to the sale of our interest in Acadia PP.
Asset Retirement Obligation
We record all known asset retirement obligations for which the liability’s fair value can be reasonably estimated. Over time, the liability is accreted to its present value each period and the capitalized cost is depreciated over the useful life of the related asset. At December 31, 2009 and 2008, our asset retirement obligation liabilities were $48 million and $47 million, respectively, primarily relating to land leases upon which our power plants are built and the requirement that the property meet specific conditions upon its return.
Revenue Recognition
Our operating revenues are composed of the following:
| • | power and steam revenue consisting of fixed capacity payments, which are not related to generation, variable payments, which are related to generation, host steam and RECs from our Geysers Assets, and other revenues such as RMR Contracts, resource adequacy and certain ancillary service revenues; |
| • | revenues from derivative instruments as a result of our marketing, hedging and optimization activities; and |
| • | other service revenues including revenue related to the sales of combustion turbine component parts and services from PSM prior to its sale in March 2007. |
Power and Steam
Physical Commodity Contracts — We recognize revenue primarily from the sale of power or host steam, thermal energy for sale to our customers for use in industrial or other heating operations, upon transmission and delivery to the customer.
We also routinely enter into physical commodity contracts for sales of our generated power to manage risk and capture the value inherent in our generation. Such contracts often meet the criteria of a derivative but are generally eligible for the normal purchase normal sale exemption. Certain other contracts do not meet the definition of a derivative and may be considered physical executory contracts or leases. We apply lease or traditional accrual accounting to these contracts that are exempt from derivative accounting or do not meet the definition of a derivative instrument. Additionally, we determine whether the financial statement presentation of revenues should be on a gross or net basis.
130
Table of Contents
Index to Financial Statements
CALPINE CORPORATION AND SUBSIDIARIES
NOTES TO CONSOLIDATED FINANCIAL STATEMENTS — (Continued)
For the Years Ended December 31, 2009, 2008 and 2007
With respect to our physical executory contracts, where we act as a principal, we take title of the commodities and assume the risks and rewards of ownership by receiving the natural gas and using the natural gas in our operations to generate and deliver the power. Where we act as principal, we record settlement of our physical commodity contracts on a gross basis. Where we do not take title of the commodities but receive a net variable payment to convert natural gas into power and steam in a tolling operation, we record the variable payment as revenue but do not record any fuel and purchased energy expense. Our physical commodity contracts are not entered into for the purpose of settling on a net basis with another counterparty.
RMR Contracts, resource adequacy and other ancillary revenues are recognized when contractually earned and consist of revenues received from our customers either at the market price or a contract price.
Leases — Contracts accounted for as operating leases, such as certain tolling agreements, with minimum lease rentals which vary over time must be levelized. Generally, we levelize these contract revenues on a straight-line basis over the term of the contract.
The total contractual future minimum lease receipts for these contracts are as follows (in millions):
| 2010 |
$ | 186 | |
| 2011 |
190 | ||
| 2012 |
181 | ||
| 2013 |
146 | ||
| 2014 |
103 | ||
| Thereafter |
807 | ||
| Total |
$ | 1,613 | |
Accounting for Derivative Instruments
We enter into a variety of derivative instruments to include both exchange traded and OTC power and natural gas forwards, options as well as instruments that settle on the power price to natural gas price relationships (Heat Rate swaps and options) and interest rate swaps. The majority of this activity is related to the fuel and power price risk associated with our generation assets and our contractual obligations. We recognize all derivative instruments that qualify for derivative accounting treatment as either assets or liabilities and measure those instruments at fair value unless they qualify for the normal purchase normal sale exemption.
Operating revenues, fuel and purchased energy expense and gains and losses on interest rate swaps derived from marketing, hedging and optimization activities that qualify for hedge accounting are recorded in the period and same financial statement line item as the hedged item. We present the cash flows from our derivatives in the same category as the item being hedged within operating activities on our Consolidated Statements of Cash Flows unless they contain an other-than-insignificant financing element in which case their cash flows are classified within financing activities. Hedge accounting requires us to formally document, designate and assess the effectiveness of transactions that receive hedge accounting. For operating revenues, fuel and purchased energy expense and gains and losses on interest rate swaps derived from marketing, hedging and optimization activities that do not qualify for hedge accounting treatment and for certain forward physical PPAs that do not qualify for the normal purchase normal sale exemption under derivative accounting, changes in fair value are recognized currently into earnings as mark-to-market activity.
Accounting for derivatives at fair value requires us to make estimates about future prices during periods for which price quotes are not available from sources external to us, in which case we rely on internally
131
Table of Contents
Index to Financial Statements
CALPINE CORPORATION AND SUBSIDIARIES
NOTES TO CONSOLIDATED FINANCIAL STATEMENTS — (Continued)
For the Years Ended December 31, 2009, 2008 and 2007
developed price estimates. During periods where external price quotes are not available, we derive such future price estimates based on an extrapolation of prices from periods where external price quotes are available. We perform this extrapolation using liquid and observable market prices and extending those prices to an internally generated long-term price forecast based on a generalized equilibrium model.
We adopted the new accounting requirements related to disclosures about derivative instruments and hedging activities as of January 1, 2009, which required enhanced disclosures about an entity’s derivative and hedging activities to enable investors to better understand their effects on the entity’s financial position, financial performance and cash flows as well as qualitative disclosures about our fair value amounts of gains and losses associated with derivative instruments and disclosures about credit-risk-related contingent features in derivative contracts. See Note 9 for further information regarding our accounting for derivative instruments.
Fuel and Purchased Energy Expense
Fuel and purchased energy expense is composed of the cost of natural gas purchased from third parties for the purposes of consumption in our power plants as fuel expense, and the cost of power and natural gas purchased from third parties for marketing, hedging and optimization activities as well as unrealized mark-to-market gains and losses resulting from general market price movements against certain derivative natural gas contracts that do not qualify for hedge accounting treatment.
Plant Operating Expense
Plant operating expense primarily includes employee expenses, repairs and maintenance, insurance and property taxes. We recognize expense when the service is performed.
Income Taxes
Income taxes are accounted for under the asset and liability method. Deferred tax assets and liabilities are recognized for the future tax consequences attributable to differences between the financial statement carrying values of existing assets and liabilities and their respective tax basis and tax credit and NOL carryforwards. Deferred tax assets and liabilities are measured using enacted tax rates expected to apply to taxable income in the years in which temporary differences are expected to be recovered or settled. The effect on deferred tax assets and liabilities due to a change in tax rates is recognized in income in the period that includes the enactment date.
We recognize the financial statement effects of a tax position when it is more likely than not, based on the technical merits, that the position will be sustained upon examination. A tax position that meets the more-likely-than-not recognition threshold is measured as the largest amount of tax benefit that is greater than 50% likely of being realized upon ultimate settlement with a taxing authority. We reverse a previously recognized tax position in the first period in which it is no longer more likely than not that the tax position would be sustained upon examination. See Note 11 for a further discussion on our income taxes.
Earnings (Loss) per Share
Basic earnings (loss) per share is calculated using the weighted average shares outstanding during the period and includes restricted stock units for which no future service is required as a condition to the delivery of the underlying common stock. Diluted earnings (loss) per share is calculated by adjusting the weighted average shares outstanding by the dilutive effect of share-based awards using the treasury stock method.
132
Table of Contents
Index to Financial Statements
CALPINE CORPORATION AND SUBSIDIARIES
NOTES TO CONSOLIDATED FINANCIAL STATEMENTS — (Continued)
For the Years Ended December 31, 2009, 2008 and 2007
In accordance with GAAP, entities that have entered into a forward contract that requires physical settlement by repurchase of a fixed number of the issuer’s equity shares of common stock in exchange for cash shall exclude the common shares to be redeemed or repurchased when calculating basic and diluted earnings (loss) per share. Our share lending agreement, which terminated in 2007 upon the return to us of all the loaned shares, did not provide for cash settlement, but rather physical settlement was required (i.e., the shares had to be and were returned by the end of the arrangement). Consequently, the loaned shares of common stock subject to the share lending agreement were excluded from our earnings (loss) per share calculation for the year ended December 31, 2007. See Note 12 for a further discussion of our earnings (loss) per share.
Stock-Based Compensation
We have selected the Black-Scholes option-pricing model to estimate the fair value of our employee stock options on the grant date. The Black-Scholes option-pricing model takes into account certain variables, which are further explained in Note 13.
Accounting for Reorganization
During the period December 20, 2005, through January 31, 2008, we conducted our business in the ordinary course as debtors-in-possession under the protection of the Bankruptcy Courts. We emerged from Chapter 11 on January 31, 2008. In accordance with financial reporting by entities in reorganization under the Bankruptcy Code prescribed by GAAP, certain income, expenses, realized gains and losses and provisions for losses that were realized or incurred in our Chapter 11 cases are recorded in reorganization items on our Consolidated Statements of Operations. In connection with our emergence from Chapter 11, we recorded certain “plan effect” adjustments to our Consolidated Balance Sheet as of the Effective Date in order to reflect certain provisions of our Plan of Reorganization. See Note 16 for a further discussion on our emergence from Chapter 11.
New Accounting Standards and Disclosure Requirements
Accounting Standards Codification and GAAP Hierarchy — Effective for interim and annual periods ending after September 15, 2009, the Accounting Standards Codification, or ASC, and related disclosure requirements issued by the Financial Accounting Standards Board, FASB, became the single official source of authoritative, nongovernmental GAAP. The ASC simplifies GAAP, without change, by consolidating the numerous predecessor accounting standards and requirements into logically organized topics. All other literature not included in the ASC is non-authoritative. We adopted the ASC during 2009, which did not have any impact on our results of operations, financial condition or cash flows as it does not represent new accounting literature or requirements; however, it did change our references to authoritative sources of GAAP to the new ASC nomenclature.
Fair Value Measurements of Non-Financial Assets and Non-Financial Liabilities — Effective for interim and annual periods beginning after November 15, 2008, GAAP includes new standards related to fair value measurements for non-financial assets and liabilities. These new standards do not apply to assets and liabilities that were not previously required to be recorded at fair value, but do apply when other accounting standards require fair value measurements. The new standards also define fair value, establish a framework for measuring fair value under GAAP and enhance disclosures about fair value measurements. We adopted the new standards with respect to non-financial assets and non-financial liabilities as of January 1, 2009, which did not have a material effect on our results of operations, financial position or cash flows; however, adoption may impact measurements of asset impairments and asset retirement obligations if they occur in the future.
133
Table of Contents
Index to Financial Statements
CALPINE CORPORATION AND SUBSIDIARIES
NOTES TO CONSOLIDATED FINANCIAL STATEMENTS — (Continued)
For the Years Ended December 31, 2009, 2008 and 2007
Determining Fair Value in Inactive Markets — Effective for interim and annual periods beginning after June 15, 2009, GAAP includes new accounting standards for determining fair value when the volume and level of activity for the asset or liability have significantly decreased and the identifying transactions are not orderly. The new standards apply to all fair value measurements when appropriate. Among other things, the new standards:
| • | affirm that the objective of fair value, when the market for an asset is not active, is the price that would be received in a sale of the asset in an orderly transaction; |
| • | clarify certain factors and provide additional factors for determining whether there has been a significant decrease in market activity for an asset when the market for that asset is not active; |
| • | provide that a transaction for an asset or liability may not be presumed to be distressed (not orderly) simply because there has been a significant decrease in the volume and level of activity for the asset or liability, rather, a company must determine whether a transaction is not orderly based on the weight of the evidence, and provide a non-exclusive list of the evidence that may indicate that a transaction is not orderly; and |
| • | require disclosure in interim and annual periods of the inputs and valuation techniques used to measure fair value and any change in valuation technique (and the related inputs) resulting from the application of the standard, including quantification of its effects, if practicable. |
These new accounting standards must be applied prospectively and retrospective application is not permitted. We adopted these new standards during 2009, which resulted in a clarification of existing accounting guidance with no change to our accounting policies and had no effect on our results of operations, cash flows or financial position. See Note 8 for disclosure of our fair value measurements.
Noncontrolling Interests in Consolidated Financial Statements — Effective for interim and annual periods beginning after December 15, 2008, GAAP includes new accounting standards and disclosure requirements for noncontrolling ownership interests in subsidiaries held by parties other than the parent, the amount of consolidated net income attributable to the parent and to the noncontrolling interest, and changes in a parent’s ownership interest while the parent retains a controlling financial interest in its subsidiary. In addition, the new standards established principles for valuation of retained noncontrolling equity investments and measurement of gain or loss when a subsidiary is deconsolidated as well as disclosure requirements to clearly identify and distinguish between interests of the parent and the interests of the noncontrolling owners. We adopted these new standards as of January 1, 2009, which did not have a material impact on our results of operations, financial position or cash flows; however, adoption did result in the reclassification of minority interest to noncontrolling interest on our Consolidated Balance Sheets and Statements of Operations.
Disclosures About Derivative Instruments and Hedging Activities — Effective for interim and annual periods beginning after November 15, 2008, GAAP includes enhanced disclosure requirements relating to an entity’s derivative and hedging activities to enable investors to better understand their effects on the entity’s financial position, financial performance, and cash flows. We adopted the new disclosure requirements as of January 1, 2009. Adoption resulted in additional disclosures related to our derivatives and hedging activities including additional disclosures regarding our objectives for entering into derivative transactions, increased balance sheet and financial performance disclosures, volume information and credit enhancement disclosures. See Note 9 for our derivative disclosures.
134
Table of Contents
Index to Financial Statements
CALPINE CORPORATION AND SUBSIDIARIES
NOTES TO CONSOLIDATED FINANCIAL STATEMENTS — (Continued)
For the Years Ended December 31, 2009, 2008 and 2007
Subsequent Events — Effective for interim and annual periods ending after June 15, 2009, GAAP includes general standards of accounting for and disclosure of events that occur after the balance sheet date but before financial statements are issued or are available to be issued. The new standards do not change the accounting for subsequent events; however, they do require disclosure, on a prospective basis, of the date through which an entity has evaluated subsequent events. We adopted these new standards during 2009, which had no impact on our results of operations, financial condition or cash flows. We have evaluated subsequent events up to the time of issuance of this Report to the SEC on February 24, 2010.
Consolidation of Variable Interest Entities — Effective for interim and annual periods beginning after November 15, 2009, with earlier application prohibited, GAAP includes new standards for determining which enterprise has a controlling financial interest in a VIE and amends guidance for determining whether an entity is a VIE. The new standards will also add reconsideration events for determining whether an entity is a VIE and will require ongoing reassessment of which entity is determined to be the VIE’s primary beneficiary as well as enhanced disclosures about the enterprise’s involvement with a VIE. We are currently assessing the future impact these new standards will have on our results of operations, financial position or cash flows; however, it is possible this new standard could result in the future deconsolidation or consolidation of our VIEs. See Note 4 for a discussion of our VIEs.
Fair Value Measurements and Disclosures — In January 2010, FASB issued Accounting Standards Update 2010-06, “Fair Value Measurements and Disclosures” to enhance disclosure requirements relating to different levels of assets and liabilities measured at fair value and to clarify certain existing disclosures. The update requires disclosure of transfers in and out of levels 1 and 2 and gross presentation of purchases, sales, issuances and settlements in the level 3 reconciliation of beginning and ending balances. The new disclosure requirements relating to level 3 activity are effective for interim and annual periods beginning after December 15, 2010 and all the other requirements are effective for interim and annual periods beginning after December 15, 2009. Since this update only requires additional disclosures, we do not expect this standard to have a material impact on our results of operations, cash flows or financial position.
3. Property, Plant and Equipment, Net
As of December 31, 2009 and 2008, the components of property, plant and equipment, are stated at cost less accumulated depreciation as follows (in millions):
| 2009 | 2008 | |||||||
| Buildings, machinery and equipment |
$ | 13,373 | $ | 13,360 | ||||
| Geothermal properties |
1,050 | 979 | ||||||
| Other |
232 | 258 | ||||||
| 14,655 | 14,597 | |||||||
| Less: Accumulated depreciation |
(3,322 | ) | (2,932 | ) | ||||
| 11,333 | 11,665 | |||||||
| Land |
74 | 76 | ||||||
| Construction in progress |
176 | 167 | ||||||
| Property, plant and equipment, net |
$ | 11,583 | $ | 11,908 | ||||
Total depreciation expense, including amortization of leased assets, for the years ended December 31, 2009, 2008 and 2007, was $469 million, $437 million and $472 million, respectively.
135
Table of Contents
Index to Financial Statements
CALPINE CORPORATION AND SUBSIDIARIES
NOTES TO CONSOLIDATED FINANCIAL STATEMENTS — (Continued)
For the Years Ended December 31, 2009, 2008 and 2007
We have various debt instruments that are collateralized by certain of our property, plant and equipment. See Note 7 for a detailed discussion of such instruments.
Change in Depreciation Methods, Useful Lives and Salvage Values
During 2009, we reviewed our accounting policies related to depreciation including our estimates of useful lives and salvage values. As further described below, effective October 1, 2009, we made two changes to our methods of depreciation including (i) changing from composite depreciation to component depreciation for our rotable parts utilized in our natural gas-fired power plants and (ii) changing from the units of production method to the straight line method for our Geysers Assets. In addition, we completed a life study for each of our natural gas-fired power plants and our Geysers Assets, and changed our estimate of their remaining useful lives and the salvage values of our rotable parts utilized in our natural gas-fired power plants.
Component Depreciation for Rotable Parts at our Natural Gas-Fired Power Plants — Historically, we have used the composite depreciation method for all of our natural gas-fired power plant assets. Under this method, all assets comprising each power plant were combined into one group and depreciated under a composite depreciation rate. Our power plants undergo scheduled and unscheduled outages to replace and repair rotable parts over the course of their useful lives. Our rotable parts generally have shorter useful lives than the remainder of our power plant assets. In conjunction with our recent plant maintenance activities and concurrently with our useful life study, we have created records in sufficient detail to support componentizing our rotable parts for our natural gas-fired power plant assets for purposes of calculating depreciation. We believe that component depreciation method is preferable, since depreciating the individual rotable parts over their individual useful lives would be a more precise method of depreciation compared to historical composite depreciation method.
As a result, the useful lives of our rotable parts are now generally estimated to range from 3 to 18 years. Furthermore, we have reduced our estimate of salvage value for our rotable parts to 0.15% from 10% of original cost to reflect our expectation with these separable parts. Our change in the method of depreciation for rotable parts is considered a change in accounting estimate inseparable from a change in accounting principle, and will result in changes to our depreciation expense prospectively.
Prior to October 2009, our composite useful lives for our natural gas-fired power plant assets, including our rotable parts, were 35 years and 40 years for our combined-cycle and our simple-cycle power plant assets, respectively. Based in part on the effect to our composite pools resulting from the componentization of our rotable parts, and the results of our useful life study, we have revised the estimated useful lives of our composite pools to 37 years and 47 years for our combined-cycle and simple-cycle power plant assets, respectively. Our change in useful lives is considered a change in accounting estimate and will result in changes to our depreciation expense prospectively.
Straight Line Method for our Geysers Assets — Historically, our Geysers Assets have used units of production depreciation. Our units of production depreciation rate was calculated using a depreciable base of the net book value of the Geysers Assets plus the expected future capital expenditures over the economic life of the geothermal reserves. The rate of depreciation per MWh was determined by dividing the depreciable base by total expected future generation. We historically viewed the geothermal steam being produced at our Geysers Assets to be a depleting asset. Accordingly, the total expected future generation used to develop our depreciation rate per MWh was limited by our estimate of the geothermal steam produced at our Geysers Assets. Over the past ten years, we have signed long-term contracts with municipalities in proximity to our Geysers Assets which allows us to receive, on average, 15 million gallons of reclaimed wastewater a day which is injected into the reservoir to replenish natural steam withdrawn for the production of power. As a result, steam flow decline rates have become very small. The expectation, as a result of the water injection program, is that the steam reservoir at
136
Table of Contents
Index to Financial Statements
CALPINE CORPORATION AND SUBSIDIARIES
NOTES TO CONSOLIDATED FINANCIAL STATEMENTS — (Continued)
For the Years Ended December 31, 2009, 2008 and 2007
our Geysers Assets will be able to supply economic quantities of steam for the foreseeable future. Therefore, the total expected future generation used to develop our depreciation rate per MWh is no longer limited by the existence of geothermal steam, but instead is limited by the physical useful life of the Geysers Assets. Accordingly, we have changed our depreciation method from the units of production method to the straight line method of depreciation for our Geysers Assets because we believe the straight line method is preferable since it is more systematic and rational under our circumstances. As a result of this change, and based in part on the results of our separate useful life study, we are now using estimates of the remaining composite useful lives of our Geysers Assets which are 59 years and 13 years for our Geysers steam extraction and gathering assets and our Geysers power plant assets, respectively. Our change in the method of depreciation for our Geysers Assets is considered a change in accounting estimate inseparable from a change in accounting principle, and will result in changes to depreciation expense prospectively.
The changes described above resulted in an increase in our historical depreciation expense of approximately $28 million related to our natural gas-fired power plants and a decrease in historical depreciation expense of approximately $3 million for our Geysers Assets for a net decrease to our income from operations and our net income attributable to Calpine of approximately $25 million or approximately $(0.05) to our basic and diluted earnings per share for the year ended December 31, 2009.
Buildings, Machinery and Equipment
This component primarily includes power plants and related equipment. Included in buildings, machinery and equipment are assets under capital leases. See Note 7 for further information regarding these assets under capital leases.
Other
This component primarily includes software and emission reduction credits that are power plant specific and not available to be sold.
Capitalized Interest
The total amount of interest capitalized was $8 million, $20 million and $26 million for the years ended December 31, 2009, 2008 and 2007, respectively.
4. Variable Interest Entities and Unconsolidated Investments
We consolidate all VIEs where we have determined that we are the primary beneficiary. This determination is made at the inception of our involvement with the VIE and, in accordance with GAAP, is updated only in response to a reconsideration event. Beginning on January 1, 2010, new accounting standards will change the approach for the determination of the primary beneficiary and will require us to perform an ongoing reassessment of our VIEs to determine the primary beneficiary, which may result in future deconsolidation or consolidation of our VIEs. We consider both qualitative and quantitative factors to form a conclusion as to whether we, or another interest holder, absorbs a majority of the entity’s risk of expected losses, receives a majority of the entity’s potential for expected residual returns, or both. Our consolidated VIEs are aggregated into the following classifications in order of priority:
| • | Consolidated VIEs with Purchase Options — Certain of our subsidiaries have PPAs or other agreements that provide third parties the option to purchase power plant assets, an equity interest, or a portion of the future cash flows generated from an asset. For these VIEs, we determined at the time |
137
Table of Contents
Index to Financial Statements
CALPINE CORPORATION AND SUBSIDIARIES
NOTES TO CONSOLIDATED FINANCIAL STATEMENTS — (Continued)
For the Years Ended December 31, 2009, 2008 and 2007
| we entered into the contractual arrangement that consolidation was appropriate as exercise of the option was considered unlikely or would not provide the majority of the risk or reward from the project. |
| • | Consolidated Subsidiaries with Project Debt — Certain of our subsidiaries have project debt that contains provisions which we have determined create variability. We retain ownership and absorb the full risk of loss and potential for reward once the project debt is paid in full. Actions by the lender to assume control of collateral can occur only under limited circumstances such as upon the occurrence of an event of default, which we have determined to be unlikely. Accordingly, we are the primary beneficiary of these VIEs. See Note 7 for further information regarding our project debt and Note 2 for information regarding our restricted cash balances. |
| • | Consolidated Subsidiaries with PPAs — Certain of our 100% owned subsidiaries have PPAs that are deemed to be a form of subordinated financial support and thus constitute a VIE. For all such VIEs, we have determined that we are the primary beneficiary as we retain the primary risk of loss over the life of the project. |
| • | Other Consolidated VIEs — Our other consolidated VIEs primarily consist of monetized assets secured by financing. For each of these arrangements we are the primary beneficiary as we retain both the primary risk of loss and potential for reward associated with the assets of the subsidiary. |
The tables below detail the assets and liabilities (excluding intercompany balances which are eliminated in consolidation) for our VIEs, combined by VIE classification, that were included in our Consolidated Balance Sheets as of December 31, 2009 and 2008 (in millions):
Condensed Combined VIE Assets and Liabilities
| 2009 | ||||||||||||
| Purchase Options |
Project Debt | PPAs | Other | |||||||||
| Assets: |
||||||||||||
| Current assets |
$ | 288 | $ | 396 | $ | 78 | $ | 204 | ||||
| Restricted cash, net of current portion |
16 | 12 | 17 | — | ||||||||
| Property, plant and equipment, net |
2,560 | 3,038 | 1,349 | — | ||||||||
| Other assets |
101 | 57 | 38 | — | ||||||||
| Total assets(1) |
$ | 2,965 | $ | 3,503 | $ | 1,482 | $ | 204 | ||||
| Liabilities: |
||||||||||||
| Current liabilities |
$ | 143 | $ | 97 | $ | 34 | $ | 175 | ||||
| Long-term debt |
1,091 | 1,940 | 11 | — | ||||||||
| Long-term derivative liabilities |
— | 6 | — | — | ||||||||
| Other liabilities |
9 | 11 | 8 | — | ||||||||
| Total liabilities(1) |
$ | 1,243 | $ | 2,054 | $ | 53 | $ | 175 | ||||
138
Table of Contents
Index to Financial Statements
CALPINE CORPORATION AND SUBSIDIARIES
NOTES TO CONSOLIDATED FINANCIAL STATEMENTS — (Continued)
For the Years Ended December 31, 2009, 2008 and 2007
| 2008 | ||||||||||||
| Purchase Options |
Project Debt | PPAs | Other | |||||||||
| Assets: |
||||||||||||
| Current assets |
$ | 224 | $ | 369 | $ | 152 | $ | 103 | ||||
| Restricted cash, net of current portion |
3 | 16 | 27 | 111 | ||||||||
| Property, plant and equipment, net |
2,863 | 2,438 | 1,413 | — | ||||||||
| Other assets |
94 | 32 | 7 | 4 | ||||||||
| Total assets(1) |
$ | 3,184 | $ | 2,855 | $ | 1,599 | $ | 218 | ||||
| Liabilities: |
||||||||||||
| Current liabilities |
$ | 204 | $ | 412 | $ | 33 | $ | 142 | ||||
| Long-term debt |
1,413 | 1,313 | 58 | 131 | ||||||||
| Long-term derivative liabilities |
11 | 14 | — | — | ||||||||
| Other liabilities |
10 | 5 | 9 | — | ||||||||
| Total liabilities(1) |
$ | 1,638 | $ | 1,744 | $ | 100 | $ | 273 | ||||
| (1) | The assets and liabilities listed above for our VIEs with purchase options may not be indicative of our risk of loss. Some of the above VIEs include sale options that are held by us or purchase options held by others, some are for only a minority interest, some are only for a portion of a VIE’s total assets and liabilities and some are only effective upon the occurrence of an event of default. |
Unconsolidated VIEs and Investments
We do not consolidate OMEC, a VIE where we have determined that we are not the primary beneficiary. We also have a joint venture interest in Greenfield LP and a less-than-majority equity interest in Whitby where we do not have control and therefore do not consolidate. We account for these entities under the equity method of accounting and include our net equity interest in investments on our Consolidated Balance Sheets as we exercise significant influence over their operating and financial policies. Our equity interest in the net (income) loss from our unconsolidated VIE, joint venture and equity interest is recorded in (income) loss from unconsolidated investments in power plants on our Consolidated Statements of Operations.
At December 31, 2009 and 2008, our equity method investments included on our Consolidated Balance Sheets were comprised of the following (in millions):
| Ownership Interest as of December 31, 2009 |
2009 | 2008 | ||||||
| OMEC |
100% | $ | 144 | $ | 98 | |||
| Greenfield LP |
50% | 70 | 46 | |||||
| Whitby |
50% | — | — | |||||
| Total investments |
$ | 214 | $ | 144 | ||||
139
Table of Contents
Index to Financial Statements
CALPINE CORPORATION AND SUBSIDIARIES
NOTES TO CONSOLIDATED FINANCIAL STATEMENTS — (Continued)
For the Years Ended December 31, 2009, 2008 and 2007
The following details our (income) loss and distributions from unconsolidated investments in power plants for the years ended December 31, 2009, 2008 and 2007 (in millions):
| (Income) Loss from Unconsolidated Investments in Power Plants |
Distributions | |||||||||||||||||||
| 2009 | 2008 | 2007 | 2009 | 2008 | 2007 | |||||||||||||||
| OMEC |
$ | (32 | ) | $ | 55 | $ | 9 | $ | 9 | $ | — | $ | — | |||||||
| Greenfield LP |
(16 | ) | 5 | 12 | 9 | 24 | 104 | |||||||||||||
| RockGen |
— | (9 | ) | — | — | — | — | |||||||||||||
| Whitby |
(2 | ) | (2 | ) | — | 2 | 3 | — | ||||||||||||
| Auburndale |
— | 180 | — | — | — | — | ||||||||||||||
| Total |
$ | (50 | ) | $ | 229 | $ | 21 | $ | 20 | $ | 27 | $ | 104 | |||||||
Our risk of loss related to our unconsolidated VIE, OMEC, is limited to our investment balance and our operational risks during the period we operate OMEC. The debt on the books of our unconsolidated investments is not reflected on our Consolidated Balance Sheets. As of December 31, 2009 and 2008, equity method investee debt was approximately $873 million and $697 million, respectively. Based on our pro rata share of each of the investments, our share of such debt would be approximately $624 million and $477 million as of December 31, 2009 and 2008, respectively.
OMEC — OMEC, an indirect wholly owned subsidiary, is the owner of the Otay Mesa Energy Center, a 608 MW natural gas-fired power plant in southern San Diego County, California. OMEC began commercial operations on October 3, 2009. OMEC has a ten-year tolling agreement with SDG&E. We do not consolidate OMEC as a result of a put option held by OMEC to sell the Otay Mesa Energy Center for $280 million to SDG&E, and a call option held by SDG&E to purchase the Otay Mesa Energy Center for $377 million at the end of the tolling agreement. We determined SDG&E has a greater variability of risk compared to us and we are not the primary beneficiary.
OMEC has a $377 million non-recourse project finance facility construction loan, which converted to a term loan on November 13, 2009 and matures in April 2019. Borrowings under the project finance facility are initially priced at LIBOR plus 1.5%. The term loan bears interest at LIBOR plus 1.25%. We contributed $19 million and $9 million for the years ended December 31, 2009 and 2008, respectively, as an additional investment in OMEC.
Greenfield LP — Greenfield LP is a limited partnership between certain subsidiaries of ours and a third party which operates the Greenfield Energy Centre, a 1,005 MW natural gas-fired power plant in Ontario, Canada. We and a third party each hold a 50% joint venture interest in Greenfield LP. Greenfield LP holds an 18-year term loan in the amount of CAD $648 million. Borrowings under the project finance facility bear interest at Canadian LIBOR plus 1.125% or Canadian prime rate plus 0.125%. We contributed nil and $8 million for the years ended December 31, 2009 and 2008, respectively, as an additional investment in Greenfield LP.
Whitby — Represents our 50% investment in Whitby held by our Canadian subsidiaries, which were reconsolidated on the Canadian Effective Date.
RockGen — On December 6, 2007, our subsidiary RockGen, which had leased the RockGen Energy Center from the RockGen Owner Lessors pursuant to a sale and leaseback arrangement, entered into a settlement agreement and a purchase and sale agreement with the RockGen Owner Lessors to purchase the RockGen Energy
140
Table of Contents
Index to Financial Statements
CALPINE CORPORATION AND SUBSIDIARIES
NOTES TO CONSOLIDATED FINANCIAL STATEMENTS — (Continued)
For the Years Ended December 31, 2009, 2008 and 2007
Center for an allowed general unsecured claim of approximately $145 million. While the allowed claim was approved by the U.S. Bankruptcy Court in December 2007, the purchase agreement was conditional upon certain events before title could transfer to us. All of the conditions were satisfied in January 2008 and the acquisition of RockGen Energy Center assets closed on January 15, 2008.
On January 15, 2008, we closed on our purchase of the RockGen Energy Center assets which terminated the prior sale-leaseback agreement and also required us to reconsider if we were RockGen’s primary beneficiary. RockGen’s PPA with WP&L contained a call option which allowed WP&L and related parties to purchase the RockGen Energy Center assets at a fixed price on May 31, 2009, provided they gave us 180-days prior written notice. The call option effectively created a ceiling value for us and absorbed the majority of the expected change in fair value of the RockGen Energy Center assets and transferred it to WP&L. As a result, we determined that we were not RockGen’s primary beneficiary. Accordingly, we deconsolidated RockGen during the first quarter of 2008, and accounted for our investment in RockGen under the equity method through December 2, 2008.
On December 2, 2008, (180 days prior to May 31, 2009) WP&L’s period to exercise the purchase option expired without providing written notification. This resulted in a reconsideration event and we determined that expiration of the option eliminated the transfer of the risk of loss and potential for future reward to us and that we are RockGen’s primary beneficiary. We reconsolidated RockGen as of December 2, 2008. The expiration of the purchase option also terminated WP&L’s variable interest and RockGen is no longer a VIE. The reconsolidation resulted in the addition to our Consolidated Balance Sheet of $141 million in property, plant and equipment, $11 million in other assets and $2 million in liabilities and removal of $150 million representing our investment balance in RockGen.
Auburndale — Auburndale was an unconsolidated subsidiary accounted for under the equity method of accounting for the period from August 21, 2008 through the date of its sale on November 21, 2008. Prior to August 21, 2008, we consolidated Auburndale as we determined that we were Auburndale’s primary beneficiary. Pomifer, an unrelated party, held a preferred interest which entitled it to approximately 70% of Auburndale’s cash distributions through 2013. Pomifer also held an option which, upon exercise, entitled Pomifer to an additional 20% of Auburndale’s cash distributions through 2013, as well as certain drag-along rights that would require us to sell our remaining interest in Auburndale should Pomifer sell its interest in Auburndale. On August 21, 2008, Pomifer exercised its option to the additional 20% of cash distributions, which required us, under GAAP, to reconsider whether we remained Auburndale’s primary beneficiary. We determined that we were no longer Auburndale’s primary beneficiary and we deconsolidated Auburndale during the third quarter of 2008. On September 30, 2008, Pomifer notified us of their intent to exercise their drag-along rights. Accordingly, we determined that a sale of our remaining interest was probable. We compared our expected proceeds from such sale to the net book value of our interest in Auburndale at September 30, 2008, to determine if an impairment existed and, as a result, recorded an impairment loss of approximately $180 million, which is included in our (income) loss from unconsolidated investments in power plants on our Consolidated Statement of Operations during the year ended December 31, 2008. We sold our remaining interest in Auburndale on November 21, 2008.
Inland Empire Energy Center Put and Call Options — We hold a call option to purchase the Inland Empire Energy Center development project (a 775 MW natural gas-fired power plant located in California) from GE that may be exercised between years 7 and 14 of the life of the power plant. GE holds a put option whereby they can require us to purchase the power plant, if certain plant performance criteria are met during year 15 of the life of the power plant. We determined that we were not the primary beneficiary of the Inland Empire power plant as we do not absorb the majority of the risk of loss associated with the project due to, but not limited to, the fact that GE will continue to manage and fully fund the operation of the power plant. Additionally, if we
141
Table of Contents
Index to Financial Statements
CALPINE CORPORATION AND SUBSIDIARIES
NOTES TO CONSOLIDATED FINANCIAL STATEMENTS — (Continued)
For the Years Ended December 31, 2009, 2008 and 2007
purchase the power plant under the call or put options, GE will continue to provide critical power plant maintenance services throughout the remaining estimated useful life of the power plant.
Significant Subsidiary — OMEC meets the criteria of a significant subsidiary as defined under SEC guidelines based upon the relationship of our equity income from our investment in this subsidiary to our consolidated net income before income taxes. Condensed combined financial statements for our unconsolidated subsidiaries are set forth below (in millions):
Condensed Combined Balance Sheets
of Our Unconsolidated Subsidiaries
December 31, 2009 and 2008
| 2009 | 2008 | |||||
| Assets: |
||||||
| Cash and cash equivalents |
$ | 33 | $ | 39 | ||
| Current assets |
133 | 91 | ||||
| Property, plant and equipment, net |
1,220 | 1,006 | ||||
| Other assets |
54 | 95 | ||||
| Total assets |
$ | 1,440 | $ | 1,231 | ||
| Liabilities: |
||||||
| Current maturities of long-term debt |
$ | 37 | $ | 24 | ||
| Current liabilities |
117 | 97 | ||||
| Long-term debt |
836 | 673 | ||||
| Long-term derivative liabilities |
95 | 154 | ||||
| Other liabilities |
47 | 48 | ||||
| Total liabilities |
1,132 | 996 | ||||
| Member’s interest |
308 | 235 | ||||
| Total liabilities and member’s interest |
$ | 1,440 | $ | 1,231 | ||
Condensed Combined Statements of Operations
of Our Unconsolidated Subsidiaries
For the Years Ended December 31, 2009, 2008 and 2007
| 2009 | 2008(1) | 2007(1) | |||||||||
| Revenues |
$ | 256 | $ | 121 | $ | 42 | |||||
| Operating expenses |
195 | 106 | 35 | ||||||||
| Impairment of equity method investment |
— | 180 | — | ||||||||
| Income (loss) from operations |
61 | (165 | ) | 7 | |||||||
| Interest (income) expense |
2 | 12 | (1 | ) | |||||||
| Other (income) expense, net |
5 | 58 | 17 | ||||||||
| Net income (loss) |
$ | 54 | $ | (235 | ) | $ | (9 | ) | |||
| (1) | Amounts include results from Auburndale and RockGen during the periods they were deconsolidated in 2008. Amounts prior to OMEC’s deconsolidation in the second quarter of 2007 are included in our Consolidated Statements of Operations. |
142
Table of Contents
Index to Financial Statements
CALPINE CORPORATION AND SUBSIDIARIES
NOTES TO CONSOLIDATED FINANCIAL STATEMENTS — (Continued)
For the Years Ended December 31, 2009, 2008 and 2007
5. Other Assets
As of December 31, 2009 and 2008, the components of other assets were as follows (in millions):
| 2009 | 2008 | |||||
| Prepaid lease, net of current portion |
$ | 127 | $ | 115 | ||
| Notes receivable, net of current portion |
68 | 83 | ||||
| Deferred financing costs, net of current portion |
176 | 211 | ||||
| Deposits |
38 | 26 | ||||
| Intangible assets, net |
74 | 77 | ||||
| Other |
90 | 104 | ||||
| Other assets |
$ | 573 | $ | 616 | ||
Prepaid Lease, Net of Current Portion — Included in prepaid lease, net of current portion, are operating leases for South Point Energy Center, Gilroy Energy Center and Kennedy International Airport Power Plant at December 31, 2009. At December 31, 2008, operating leases for South Point Energy Center and Gilroy Energy Center were included in prepaid lease, net of current portion.
Notes Receivable, Net of Current Portion — Notes receivable, net of current portion, primarily consists of a secured financing for the sale of a note receivable from PG&E with an original net book value of $157 million in December 2003 for $133 million in cash. We recorded the transaction as a secured financing, with an offsetting note payable of $133 million. The notes receivable balance and note payable balance are both reduced as PG&E makes payments to the buyers of the notes receivable. The $24 million difference between the original $157 million net book value of the notes receivable at the transaction date and the $133 million cash received is recognized as additional interest expense over the repayment term. The fair value of the note receivable as of December 31, 2009 and 2008, was $83 million and $96 million, respectively.
Deferred Financing Costs, Net of Current Portion — Deferred financing costs related to the issuance of our debt. See Note 7 for further discussion of our debt.
Deposits — Deposits include margin deposits as well as other deposits.
Intangible Assets, Net — Intangible assets, net, include lease levelization costs and power sales agreement amounts.
Other — Other consists of our long-term deferred tax asset, project development costs and deferred transmission credits.
6. Asset Sales and Purchase
2008
On January 15, 2008, we purchased the RockGen Energy Center from the RockGen Owner Lessors. RockGen previously leased the RockGen Energy Center from the RockGen Owner Lessors, which are not affiliates of ours, pursuant to a leveraged operating lease. We purchased the RockGen Energy Center for an allowed general unsecured claim of approximately $145 million, plus interest. As a result of the lease termination and related acquisition, we recorded $102 million in reorganization items on our 2007 Consolidated Statement of Operations to expense prepaid lease assets related to the RockGen Energy Center.
143
Table of Contents
Index to Financial Statements
CALPINE CORPORATION AND SUBSIDIARIES
NOTES TO CONSOLIDATED FINANCIAL STATEMENTS — (Continued)
For the Years Ended December 31, 2009, 2008 and 2007
On February 14, 2008, we completed the sale of substantially all of the assets comprising the Hillabee development project, a partially completed 774 MW combined-cycle power plant located in Alexander City, Alabama, to CER Generation, LLC for approximately $156 million, plus the assumption of certain liabilities. We recorded a pre-tax gain of approximately $63 million in the first quarter of 2008, which is included in reorganization items on our 2008 Consolidated Statement of Operations.
On March 5, 2008, we completed the sale of substantially all of the assets comprising the Fremont development project, a partially completed 550 MW natural gas-fired power plant located in Fremont, Ohio, to First Energy Generation Corp. for approximately $254 million, plus the assumption of certain liabilities. We recorded a pre-tax gain of approximately $136 million in the first quarter of 2008, which is included in reorganization items on our 2008 Consolidated Statement of Operations.
On August 21, 2008, Pomifer exercised its purchase option to purchase additional cash distributions of 20% through 2013 from Auburndale as further described in Note 4. On September 30, 2008, we received notice that Pomifer had entered into an asset purchase agreement with a third party and that Pomifer intended to exercise its drag-along rights to sell 100% of Auburndale. We recorded an impairment loss of approximately $180 million based upon the anticipated sales proceeds. We sold our remaining interest in Auburndale on November 21, 2008.
The sales of the Hillabee and Fremont development projects and the sale of Auburndale did not meet the criteria for discontinued operations due to our continuing activity in the markets in which these power plants were located; therefore, the results of operations for all periods prior to sale are included in our continuing operations.
2007
On January 16, 2007, we completed the sale of the Aries Power Plant, a 590 MW natural gas-fired power plant in Pleasant Hill, Missouri, to Dogwood Energy LLC, an affiliate of Kelson Holdings, LLC, for $234 million plus certain per diem expenses incurred by us for running the power plant after December 21, 2006, through the closing of the sale. We recorded a pre-tax gain of approximately $78 million included in reorganization items on our Consolidated Statements of Operations. As part of the sale we were also required to use a portion of the proceeds received to repay approximately $159 million principal amount of financing obligations, $8 million in accrued interest, $11 million in accrued swap liabilities and $14 million in debt pre-payment, and make whole premium fees to our project lenders.
On February 21, 2007, we completed the sale of substantially all of the assets of the Goldendale Energy Center, a 247 MW natural gas-fired power plant located in Goldendale, Washington, to Puget Sound Energy LLC for approximately $120 million, plus the assumption by Puget Sound Energy LLC of certain liabilities. We recorded a pre-tax gain of approximately $31 million included in reorganization items on our 2007 Consolidated Statements of Operations.
On March 22, 2007, we completed the sale of substantially all of the assets of PSM, a designer, manufacturer and marketer of turbine and combustion components, to Alstom Power Inc. for approximately $242 million, plus the assumption by Alstom Power Inc. of certain liabilities. In connection with the sale, we entered into a parts supply and development agreement with PSM whereby we committed to purchase turbine parts and other services totaling approximately $200 million over a five-year period. We recorded a pre-tax gain of $135 million included in reorganization items on our 2007 Consolidated Statements of Operations.
144
Table of Contents
Index to Financial Statements
CALPINE CORPORATION AND SUBSIDIARIES
NOTES TO CONSOLIDATED FINANCIAL STATEMENTS — (Continued)
For the Years Ended December 31, 2009, 2008 and 2007
On July 6, 2007, we completed the sale of the Parlin Power Plant, a 118 MW natural gas-fired power plant in Parlin, New Jersey, to EFS Parlin Holdings, LLC, an affiliate of General Electric Capital Corporation, for approximately $3 million in cash, plus the assumption by EFS Parlin Holdings, LLC of certain liabilities and the agreement to waive certain asserted claims against the Parlin Power Plant. We recorded a pre-tax gain of approximately $40 million included in reorganization items on our 2007 Consolidated Statements of Operations.
On September 13, 2007, we completed the sale of our 50% interest in Acadia PP, the owner of the Acadia Energy Center, a 1,212 MW natural gas-fired power plant located near Eunice, Louisiana, to Cajun Gas Energy, L.L.C. for consideration totaling approximately $189 million consisting of $104 million in cash and the payment of $85 million in priority distributions due to Cleco Corp. (the indirect owner, through its wholly owned subsidiary, Acadia Power Holdings, LLC, of the remaining 50% ownership interest in Acadia PP) in accordance with the limited liability company agreement, plus the assumption by Cajun Gas Energy, L.L.C. of certain liabilities. We recorded a pre-tax loss of $6 million, after recording a pre-tax, predominately non-cash impairment charge of approximately $89 million, to record our interest in Acadia PP at fair value less the cost to sell, both charges are included in reorganization items on our Consolidated Statements of Operations. Additionally, in connection with the sale, we entered into a settlement agreement with Cleco Corp., which was approved by the U.S. Bankruptcy Court on May 9, 2007, under which Cleco Corp. received an allowed unsecured claim against us in the amount of $85 million as a result of the rejection by CES of two long-term PPAs for the output of the Acadia Energy Center and our guarantee of those agreements. We recorded expense of $85 million for this allowed claim during the second quarter of 2007, which is included in reorganization items on our 2007 Consolidated Statements of Operations.
The sales of the Aries Power Plant, the Goldendale Energy Center, the Parlin Power Plant and our interest in Acadia PP did not meet the criteria for discontinued operations due to our continuing activity in the markets in which these power plants operate or were located; therefore, the results of operations for all periods prior to sale are included in our continuing operations. Similarly, we have determined that the sale of PSM did not meet the criteria for discontinued operations due to our continuing involvement through the parts supply and development agreement; therefore, the results of operations for all periods prior to sale are included in our continuing operations.
Discontinued Operations
On December 1, 2008, the U.S. Bankruptcy Court finalized the settlement with Rosetta for all of our outstanding claims related to our domestic oil and gas assets we sold to Rosetta for $1.1 billion in 2005. Under the settlement, Rosetta paid us $97 million; we completed the transfer of certain other assets; we and Rosetta extended an existing natural gas purchase agreement for an additional ten years; and we and Rosetta executed mutual releases.
The original sale of our domestic oil and gas assets was recorded as discontinued operations on our 2005 Consolidated Statement of Operations. Of the $97 million settlement proceeds received, $79 million was associated with the certain other assets with a remaining net book value of approximately $42 million related to our domestic oil and gas assets we sold to Rosetta in 2005. The resulting $37 million gain is reflected as discontinued operations on our 2008 Consolidated Statement of Operations. The remaining $18 million settlement proceeds received was associated with the agreed upon fraudulent conveyance of $12 million, which is included in reorganization items on our 2008 Consolidated Statement of Operations, and approximately $6 million in revenues collected by Rosetta during the litigation period on assets retained by us.
145
Table of Contents
Index to Financial Statements
CALPINE CORPORATION AND SUBSIDIARIES
NOTES TO CONSOLIDATED FINANCIAL STATEMENTS — (Continued)
For the Years Ended December 31, 2009, 2008 and 2007
The table below presents the components of our discontinued operations for the year ended December 31, 2008 (in millions):
| 2008 | |||
| Income from discontinued operations before taxes |
$ | 37 | |
| Less: Income tax expense |
14 | ||
| Discontinued operations, net of tax |
$ | 23 | |
7. Debt
Our debt at December 31, 2009 and 2008, was as follows (in millions):
| 2009 | 2008 | |||||
| First Lien Credit Facility |
$ | 4,661 | $ | 6,645 | ||
| First Lien Notes |
1,200 | — | ||||
| Commodity Collateral Revolver |
100 | 100 | ||||
| Project financing |
1,562 | 1,525 | ||||
| CCFC New Notes |
959 | — | ||||
| CCFC Old Notes and CCFC Term Loans |
— | 778 | ||||
| Preferred interests |
25 | 335 | ||||
| Notes payable and other borrowings |
253 | 356 | ||||
| Capital lease obligations |
699 | 733 | ||||
| Total debt |
9,459 | 10,472 | ||||
| Less: Current maturities |
463 | 716 | ||||
| Debt, net of current portion |
$ | 8,996 | $ | 9,756 | ||
Annual Debt Maturities
Contractual annual principal repayments or maturities of debt instruments as of December 31, 2009, are as follows (in millions):
| 2010 |
$ | 477 | |
| 2011 |
642 | ||
| 2012 |
275 | ||
| 2013 |
156 | ||
| 2014 |
4,463 | ||
| Thereafter |
3,508 | ||
| Total debt |
9,521 | ||
| Less: Discount |
62 | ||
| Total |
$ | 9,459 | |
146
Table of Contents
Index to Financial Statements
CALPINE CORPORATION AND SUBSIDIARIES
NOTES TO CONSOLIDATED FINANCIAL STATEMENTS — (Continued)
For the Years Ended December 31, 2009, 2008 and 2007
First Lien Facilities
Upon our emergence from Chapter 11, we converted the approximately $4.9 billion of loans and commitments outstanding under our DIP Facility (including the $1.0 billion revolver) into loans and commitments under our approximately $7.3 billion of First Lien Facilities. Our First Lien Facilities provided for approximately $2.1 billion in senior secured term loans and $300 million in senior secured bridge loans in addition to the loans and commitments that had been available under the DIP Facility. Our First Lien Facilities include:
| • | Our First Lien Credit Facility, comprised of: |
| i. | approximately $6.0 billion of senior secured term loans; |
| ii. | a $1.0 billion senior secured revolving facility; and |
| iii. | the ability to raise up to $2.0 billion of incremental term loans available on a senior secured basis in order to refinance secured debt of subsidiaries under an “accordion” provision; and |
| • | a bridge facility, which, prior to its repayment as described below, provided for a $300 million senior secured bridge term loan. |
On the Effective Date, we fully drew on our approximately $6.0 billion of senior secured term loans and $300 million bridge facility and we drew approximately $150 million under the $1.0 billion senior secured revolving facility. The proceeds of the drawdowns, above the amounts that had been applied under the DIP Facility, were used to repay a portion of the Second Priority Debt, fund distributions under our Plan of Reorganization to holders of other secured claims and to pay fees, costs, commissions and expenses in connection with our First Lien Facilities and the implementation of our Plan of Reorganization.
The bridge facility was repaid in full on March 6, 2008, in accordance with its terms with proceeds from the sales of the Hillabee and Fremont development project assets. Prior to repayment, borrowings under the bridge facility bore interest at LIBOR plus 2.875% per annum.
On October 2, 2008, we borrowed $725 million under our First Lien Credit Facility revolving facility. The borrowing was made as a base rate loan which initially bore interest at the base rate (5% on date of borrowing) plus 1.875% per annum. Proceeds from the borrowing were invested in money market funds, which are mainly invested in U.S. Treasury securities or other obligations issued or guaranteed by the U.S. government, its agencies or instrumentalities. On September 28, 2009, we repaid $725 million previously drawn under our First Lien Credit Facility revolver from cash on hand.
As of December 31, 2009, under our First Lien Credit Facility, we had approximately $4.7 billion outstanding under the term loan facilities and $206 million of letters of credit issued against the revolver. Borrowings of term loans under our First Lien Credit Facility bear interest at a floating rate, at our option, of LIBOR plus 2.875% per annum or base rate plus 1.875% per annum. First Lien Credit Facility term loans require quarterly payments of principal equal to 0.25% of the original principal amount of First Lien Credit Facility term loans. Our First Lien Credit Facility matures on March 29, 2014.
The obligations under our First Lien Credit Facility are unconditionally guaranteed by certain of our direct and indirect domestic subsidiaries and are secured by a security interest in substantially all of the tangible and intangible assets of Calpine Corporation and certain of the guarantors. The obligations under our First Lien
147
Table of Contents
Index to Financial Statements
CALPINE CORPORATION AND SUBSIDIARIES
NOTES TO CONSOLIDATED FINANCIAL STATEMENTS — (Continued)
For the Years Ended December 31, 2009, 2008 and 2007
Credit Facility are also secured by a pledge of the equity interests of the direct subsidiaries of certain of the guarantors, subject to certain exceptions, including exceptions for equity interests in foreign subsidiaries, existing contractual prohibitions and prohibitions under other legal requirements. Our First Lien Credit Facility contains restrictions, including limiting our ability to, among other things:
| • | incur additional indebtedness and issue certain stock; |
| • | make prepayments on or purchase certain indebtedness in whole or in part; |
| • | pay dividends and other distributions with respect to our stock or repurchase our stock or make other restricted payments; |
| • | use money borrowed under our First Lien Credit Facility for non-guarantors (including foreign subsidiaries); |
| • | make certain investments; |
| • | create or incur liens; |
| • | consolidate or merge with another entity, or allow one of our subsidiaries to do so; |
| • | lease, transfer or sell assets and use proceeds of permitted asset leases, transfers or sales; |
| • | pay dividends or make other distributions from certain of our subsidiaries up to Calpine Corporation; |
| • | make capital expenditures beyond specified limits; |
| • | engage in certain business activities; |
| • | enter into certain transactions with our affiliates; and |
| • | acquire power plants or other businesses. |
Our First Lien Credit Facility also requires compliance with financial covenants that include a maximum ratio of total net debt to Consolidated EBITDA (as defined in the First Lien Credit Facility), a minimum ratio of Consolidated EBITDA to cash interest expense, and a maximum ratio of total senior net debt to Consolidated EBITDA.
Amendment of First Lien Credit Facility and Issuance of First Lien Notes due 2017
We executed the First Amendment to Credit Agreement and Second Amendment to Collateral Agency and Intercreditor Agreement dated as of August 20, 2009, which amended both the First Lien Credit Facility Credit Agreement and the First Lien Credit Facility Collateral Agency and Intercreditor Agreement. The amendment provides additional flexibility with our capital structure and First Lien Credit Facility by granting us the option, subject to certain conditions, to buy back debt at a discount using cash on hand via an auction process; to offer first lien bonds in exchange for or to retire First Lien Credit Facility term loans; to issue up to $2.0 billion of first lien bonds in lieu of issuing first lien term loans under the accordion provision of our First Lien
148
Table of Contents
Index to Financial Statements
CALPINE CORPORATION AND SUBSIDIARIES
NOTES TO CONSOLIDATED FINANCIAL STATEMENTS — (Continued)
For the Years Ended December 31, 2009, 2008 and 2007
Credit Facility; and to extend all or a portion of the revolver and term loan maturities, on revised terms, subject to acceptance by applicable lenders. In addition, the amendment provides for the aggregation of various investment and capital expenditure baskets for covenant purposes.
We subsequently issued approximately $1.2 billion aggregate principal amount of First Lien Notes in a private placement on October 21, 2009. We received no net cash proceeds from the transaction. The offer and sale of our First Lien Notes was consummated as a permitted debt exchange pursuant to our First Lien Credit Facility in exchange for a like principal amount of First Lien Credit Facility term loans. Upon their exchange for First Lien Notes, such term loans were canceled and may not be redrawn. Our First Lien Notes bear interest at 7.25% per annum payable on April 15 and October 15 of each year, beginning on April 15, 2010. Our First Lien Notes will mature on October 15, 2017; however, among other things, prior to October 15, 2012, we may redeem up to 35% of the aggregate principal amount of our First Lien Notes with the net cash proceeds of certain equity offerings, at a price equal to 107.25% of the aggregate principal amount thereof, plus accrued and unpaid interest. Beginning on October 15, 2013, we may redeem all or a portion of our First Lien Notes at a premium as defined in the indenture governing our First Lien Notes, plus accrued and unpaid interest. Our First Lien Notes are guaranteed by each of our current and future domestic subsidiaries that is a borrower or guarantor under our First Lien Credit Facility and our First Lien Notes rank equally in right of payment with all of our and the guarantors’ other existing and future senior indebtedness, and will be effectively subordinated in right of payment to all existing and future liabilities of our subsidiaries that do not guarantee our First Lien Notes. Our First Lien Notes are secured equally and ratably with indebtedness under our First Lien Credit Facility by a first-priority lien, subject to certain exceptions and permitted liens, on substantially all of our and certain of the guarantors’ existing and future assets.
Subject to certain qualifications and exceptions, our First Lien Notes will, among other things, limit our ability and the ability of the guarantors to:
| • | incur or guarantee additional first lien indebtedness; |
| • | enter into certain prohibited commodity hedge agreements; |
| • | enter into sale and leaseback transactions; |
| • | create or incur liens; and |
| • | consolidate, merge or transfer all or substantially all of our assets and the assets of our restricted subsidiaries on a combined basis. |
In connection with the amendment of our First Lien Credit Facility and issuance of our First Lien Notes, we recorded approximately $25 million in debt extinguishment costs related to the retirement of the term loans under our First Lien Credit Facility and approximately $25 million in new deferred financing costs on our Consolidated Balance Sheet during 2009.
149
Table of Contents
Index to Financial Statements
CALPINE CORPORATION AND SUBSIDIARIES
NOTES TO CONSOLIDATED FINANCIAL STATEMENTS — (Continued)
For the Years Ended December 31, 2009, 2008 and 2007
Project Financing
The components of our project financing are (in millions, except for interest rates):
| Outstanding at December 31, | Weighted Average Effective Interest Rates(2) |
|||||||||||
| 2009 | 2008 | 2009 | 2008 | |||||||||
| Bethpage Energy Center 3, LLC due 2020-2025(1) |
$ | 107 | $ | 112 | 7.0 | % | 6.9 | % | ||||
| Gilroy Energy Center, LLC due 2011 |
76 | 113 | 7.3 | 7.3 | ||||||||
| Blue Spruce due 2017 |
76 | 83 | 4.9 | 5.8 | ||||||||
| Riverside Energy Center, LLC due 2011 |
311 | 328 | 7.6 | 9.3 | ||||||||
| Rocky Mountain Energy Center, LLC due 2011 |
140 | 164 | 7.7 | 9.9 | ||||||||
| Metcalf due 2015 |
261 | 264 | 7.0 | 7.9 | ||||||||
| Steamboat due 2017 |
452 | 453 | 6.9 | 6.5 | ||||||||
| Deer Park due 2012 |
128 | — | 7.5 | — | ||||||||
| Other |
11 | 8 | — | — | ||||||||
| Total |
$ | 1,562 | $ | 1,525 | ||||||||
| (1) | Represents a weighted average of first and second lien loans. |
| (2) | Our weighted average interest rate calculation includes the amortization of deferred financing costs and debt discount. |
Our project financings are collateralized solely by the capital stock or partnership interests, physical assets, contracts and/or cash flows attributable to the entities that own the power plants. The lenders recourse under these project financings is limited to such collateral.
On November 24, 2009, Steamboat amended and extended the terms of its credit agreement. The Steamboat Amended Credit Facility increases the amount of term loans outstanding by $17 million from $448 million to $465 million. The increase in the borrowing was used to pay accrued and unpaid interest, breakage costs and other fees in connection with closing the Steamboat Amended Credit Facility. The Steamboat Amended Credit Facility also provides for a “security fund” letter of credit facility of up to $11 million and a “DSR” letter of credit facility of up to approximately $23 million. The maturity date of the term loans facilities has been extended from December 2011 to November 24, 2017. The security fund letter of credit facility, matures on November 24, 2017 with the term loans and the DSR letter of credit facility matures on September 29, 2017. We recorded approximately $7 million in new deferred financing costs on our Consolidated Balance Sheet as of December 31, 2009, and approximately $2 million in debt extinguishment costs related to the write-off of the old deferred financing costs on our Consolidated Statement of Operations for the year ended December 31, 2009.
Interest on the term loans is at a base rate or LIBOR (as defined in the Steamboat Amended Credit Facility) as elected by Steamboat plus a rate margin which escalates from 2.875% to 3.375% (less 1% for a base rate loan) during the term of the Steamboat Amended Credit Facility. Principal and interest are due and payable on the last banking day of each calendar quarter. Steamboat may, at its option convert the interest rate on all or a portion of the amounts outstanding under the term loans to the one month, three month or six month LIBOR rate plus the rate margin and may convert any LIBOR rate loan back to a base rate loan. Both the security fund and “DSR” letter of credit facilities incur a commitment fee equal to 1.0% for the average unutilized letters of credit and a letter of credit participation fee equal to the rate margin for the stated amount of the issued letters of credit. Under the Steamboat Amended Credit Facility we are required to hedge a minimum of 75% of our interest rate exposure, and as of
150
Table of Contents
Index to Financial Statements
CALPINE CORPORATION AND SUBSIDIARIES
NOTES TO CONSOLIDATED FINANCIAL STATEMENTS — (Continued)
For the Years Ended December 31, 2009, 2008 and 2007
December 31, 2009, we have hedged approximately 95% of this interest rate exposure with interest rate swaps. See Note 9 for further discussion regarding our interest rate swaps.
Subject to certain limitations and minimum amounts, Steamboat may elect to permanently reduce the commitment amounts under both the security fund and DSR letter of credit facilities and prepay, without penalty, in whole or in part, the amounts outstanding under the term loans. The Steamboat Amended Credit Facility contains certain restrictive covenants and allows for acceleration of the debt in the event of certain defaults and is secured, subject to certain exceptions and permitted liens, by all real and personal property of Steamboat and its wholly owned subsidiaries, Freeport Energy Center and Mankato Power Plant.
On January 21, 2009, Deer Park, our indirect wholly owned subsidiary, closed on $156 million of senior secured credit facilities, which include a $150 million term facility and a $6 million letter of credit facility. Proceeds received were used to settle an existing commodity contract of approximately $79 million, pay financing and legal fees of approximately $8 million and fund approximately $22 million in restricted cash. The remainder was distributed to Calpine Corporation for general corporate purposes. The senior term loan facility matures on January 21, 2012, and bears interest of LIBOR plus 3.5% or base rate plus 2.5% at Deer Park’s option.
On June 10, 2008, Metcalf, an indirect wholly owned subsidiary, closed on a $265 million new term loan facility. The proceeds were used to repay Metcalf’s existing $100 million term loan facility and $155 million preferred interests. The new term loan facility, which matures on June 10, 2015, bears interest at Metcalf’s option at LIBOR plus 3.25% or base rate plus 2.25% and is secured by the assets of Metcalf and the sole member interest held by Metcalf’s parent, Metcalf Holdings, LLC. In connection with this refinancing, we recorded $6 million in loss on debt extinguishment, related to the write-off of deferred financing costs of $3 million and prepayment penalties of $3 million, which are recorded in debt extinguishment costs on our 2008 Consolidated Statement of Operations.
On February 1, 2008, Blue Spruce, an indirect wholly owned subsidiary, entered into a $90 million senior term loan. Net proceeds from the senior term loan were used to refinance all outstanding indebtedness under the existing Blue Spruce term loan facility, to pay fees and expenses related to the transaction and for general corporate purposes. The senior term loan carries interest at a base rate plus 0.63% which escalates to 1.50% or LIBOR plus 1.63%, which escalates to 2.50% over the life of the senior term loan and matures December 31, 2017. The senior term loan is secured by the assets of Blue Spruce. In connection with this refinancing, we recorded $7 million in loss on debt extinguishment, related to the write-off of deferred financing costs of $4 million and prepayment penalties of $3 million, which are recorded in debt extinguishment costs on our 2008 Consolidated Statement of Operations.
CCFC New Notes, CCFC Old Notes and CCFC Term Loans
On May 19, 2009, our wholly owned subsidiaries, CCFC and CCFC Finance, issued approximately $1.0 billion aggregate principal amount of CCFC New Notes in a private placement. Interest on the CCFC New Notes accrues at the rate of 8.0% per annum and is payable semi-annually in arrears on each June 1 and December 1, commencing on December 1, 2009. The CCFC New Notes, which mature on June 1, 2016, are guaranteed by two of CCFC’s subsidiaries. The CCFC New Notes and the related guarantees are secured, subject to certain exceptions and permitted liens, by all real and personal property of CCFC and CCFC’s material subsidiaries (including the CCFC Guarantors), consisting primarily of six natural gas power plants as well as the equity interests in CCFC and the CCFC Guarantors. The CCFC New Notes are not guaranteed by Calpine Corporation and are without recourse to Calpine Corporation or any of our other non-CCFC or CCFC Finance subsidiaries or assets. The net proceeds received of $939 million, together with CCFC cash on hand of $271 million, were used to:
| • | repay the $364 million outstanding under the CCFC Term Loans on May 19, 2009; |
151
Table of Contents
Index to Financial Statements
CALPINE CORPORATION AND SUBSIDIARIES
NOTES TO CONSOLIDATED FINANCIAL STATEMENTS — (Continued)
For the Years Ended December 31, 2009, 2008 and 2007
| • | redeem the $415 million outstanding principal amount of CCFC Old Notes on June 18, 2009; |
| • | distribute $327 million to CCFC’s indirect parent, CCFCP, which was used by CCFCP to redeem its $300 million CCFCP Preferred Shares discussed below on or before July 1, 2009; and |
| • | in each case, pay any interest, prepayment penalties and other amounts due through the date of such repayment or redemption. |
In connection with the CCFC Refinancing, we recorded $49 million in debt extinguishment costs for the year ended December 31, 2009. Debt extinguishment costs are comprised of $7 million from the write-off of unamortized deferred financing costs and unamortized debt discount, $24 million of prepayment penalties related to redemption of the CCFC Old Notes, $2 million from the write-off of unamortized deferred financing costs and unamortized debt discount and $16 million related to prepayment penalties related to the redemption of the CCFCP Preferred Shares.
We also recorded approximately $21 million in new deferred financing costs on our Consolidated Balance Sheet upon closing the CCFC Refinancing.
The components of the CCFC financing are (in millions, except for interest rates):
| Outstanding at December 31, | Weighted Average Effective Interest Rates(2) |
|||||||||||
| 2009 | 2008 | 2009 | 2008 | |||||||||
| CCFC Old Notes(1) |
$ | — | $ | 412 | — | % | 12.6 | % | ||||
| CCFC Term Loans(1) |
— | 366 | — | 10.3 | ||||||||
| CCFC New Notes |
959 | — | 8.9 | — | ||||||||
| Total CCFC financing |
$ | 959 | $ | 778 | ||||||||
| (1) | The CCFC Old Notes and CCFC Term Loans were repaid with the proceeds from the CCFC New Notes during 2009. |
| (2) | Our weighted average interest rate calculation includes the amortization of deferred financing costs and debt discount. |
Preferred Interests
Our preferred interests meet the criteria of mandatorily redeemable financial instruments and are therefore classified as debt. The components of preferred interests are as follows (in millions, except for interest rates):
| Outstanding at December 31, | Weighted Average Effective Interest Rates(2) |
|||||||||||
| 2009 | 2008 | 2009 | 2008 | |||||||||
| Preferred interest in GEC Holdings, LLC due 2011 |
$ | 25 | $ | 35 | 13.9 | % | 14.8 | % | ||||
| Preferred interest in CCFCP due 2011(1) |
— | 300 | — | 13.5 | ||||||||
| Total preferred interests |
$ | 25 | $ | 335 | ||||||||
| (1) | Amounts were repaid with the proceeds from the CCFC New Notes during 2009. |
| (2) | Our weighted average interest rate calculation includes the amortization of deferred financing costs. |
152
Table of Contents
Index to Financial Statements
CALPINE CORPORATION AND SUBSIDIARIES
NOTES TO CONSOLIDATED FINANCIAL STATEMENTS — (Continued)
For the Years Ended December 31, 2009, 2008 and 2007
Notes Payable and Other Borrowings
The components of notes payable and other borrowings are (in millions, except for interest rates):
| Outstanding at December 31, | Weighted Average Effective Interest Rates(2) |
|||||||||||
| 2009 | 2008 | 2009 | 2008 | |||||||||
| PCF III due 2010(1) |
$ | 84 | $ | 76 | 11.3 | % | 10.2 | % | ||||
| PCF due 2010(1) |
55 | 159 | 9.6 | 9.6 | ||||||||
| Gilroy note payable due 2014 |
77 | 89 | 10.6 | 10.7 | ||||||||
| Whitby Holdings due 2017 |
31 | 26 | 8.9 | 9.5 | ||||||||
| Other |
6 | 6 | 4.8 | 6.0 | ||||||||
| Total notes payable and other borrowings |
$ | 253 | $ | 356 | ||||||||
| (1) | Amounts were repaid from cash on hand on February 1, 2010 and February 5, 2010, for PCF and PCF III, respectively. |
| (2) | Our weighted average interest rate calculation includes the amortization of deferred financing costs and debt discount. |
Capital Lease Obligations
The following is a schedule by year of future minimum lease payments under capital leases together with the present value of the net minimum lease payments as of December 31, 2009 (in millions):
| 2010 |
$ | 98 | |
| 2011 |
99 | ||
| 2012 |
96 | ||
| 2013 |
92 | ||
| 2014 |
79 | ||
| Thereafter |
802 | ||
| Total minimum lease payments |
1,266 | ||
| Less: Amount representing interest |
567 | ||
| Present value of net minimum lease payments |
$ | 699 | |
The primary types of property leased by us are power plants and related equipment. The leases generally provide for the lessee to pay taxes, maintenance, insurance, and certain other operating costs of the leased property. The remaining lease terms range up to 39 years (including lease renewal options). Some of the lease agreements contain customary restrictions on dividends, additional debt and further encumbrances similar to those typically found in project financing agreements. As of both December 31, 2009 and 2008, the asset balances for the leased assets totaled approximately $1.3 billion with accumulated amortization of $349 million and $279 million, respectively. See Note 17 for a discussion of capital leases guaranteed by Calpine Corporation.
Other Financing Agreements
During the first quarter of 2008, we entered into a letter of credit facility related to our subsidiary Calpine Development Holdings, Inc. under which up to $150 million is available for letters of credit. On December 11, 2009, we amended the letter of credit facility to extend the maturity from January 31, 2010 to December 11,
153
Table of Contents
Index to Financial Statements
CALPINE CORPORATION AND SUBSIDIARIES
NOTES TO CONSOLIDATED FINANCIAL STATEMENTS — (Continued)
For the Years Ended December 31, 2009, 2008 and 2007
2012, with an option to increase the letters of credit available from $150 million to $200 million by satisfying certain conditions. As of December 31, 2009 and 2008, $116 million and $148 million in letters of credit, respectively, had been issued under this facility.
On July 8, 2008, we entered into the Commodity Collateral Revolver, a two-year, $300 million secured revolving credit facility, which shares the benefits of the collateral subject to the liens under our First Lien Credit Facility ratably with the lenders under our First Lien Credit Facility. At closing, we borrowed an initial advance of $100 million. Amounts borrowed under the Commodity Collateral Revolver were used to collateralize obligations to counterparties under eligible commodity hedge agreements. On August 13, 2009, we terminated $200 million of the remaining availability under the Commodity Collateral Revolver in accordance with its terms as energy commodity prices were not expected to exceed stated thresholds in the near future and it was considered unlikely that any of the $200 million remaining availability would be available to us. The $100 million currently outstanding under the Commodity Collateral Revolver will mature on July 8, 2010, and bears interest at LIBOR plus 2.875% per annum.
On June 25, 2008, we entered into the Knock-in Facility, a 12-month, $200 million unsecured letter of credit facility. Availability of letters of credit for issuance under the Knock-in Facility were up to a total maximum availability of $200 million contingent on natural gas futures contract prices exceeding certain thresholds, with initial availability for up to $50 million. The Knock-in Facility matured on June 30, 2009, and is no longer available.
Letters of Credit Facilities
The table below represents amounts issued under our letter of credit facilities as of December 31, 2009 and 2008 (in millions):
| 2009 | 2008 | |||||
| First Lien Credit Facility |
$ | 206 | $ | 259 | ||
| Calpine Development Holdings, Inc. |
116 | 148 | ||||
| Knock-in Facility(1) |
— | 50 | ||||
| Various project financing facilities |
90 | 99 | ||||
| Total |
$ | 412 | $ | 556 | ||
| (1) | The Knock-in Facility matured on June 30, 2009, and is no longer available. |
154
Table of Contents
Index to Financial Statements
CALPINE CORPORATION AND SUBSIDIARIES
NOTES TO CONSOLIDATED FINANCIAL STATEMENTS — (Continued)
For the Years Ended December 31, 2009, 2008 and 2007
Fair Value of Debt
We record our debt instruments based on contractual terms, net of any applicable premium or discount. We did not elect to apply the alternative GAAP provisions of the fair value option for recording financial assets and financial liabilities at fair value on our Consolidated Financial Statements. We measured the fair value of our debt instruments as of December 31, 2009, using market information including credit default swap rates and historical default information, quoted market prices or dealer quotes for the identical liability when traded as an asset and discounted cash flow analyses based on our current borrowing rates for similar types of borrowing arrangements. The following table details the fair values and carrying values of our debt instruments as of December 31, 2009 and 2008 (in millions):
| 2009 | 2008 | |||||||||||
| Fair Value | Carrying Value |
Fair Value | Carrying Value | |||||||||
| First Lien Credit Facility |
$ | 4,402 | $ | 4,661 | $ | 4,812 | $ | 6,645 | ||||
| First Lien Notes |
1,138 | 1,200 | — | — | ||||||||
| Commodity Collateral Revolver |
94 | 100 | 85 | 100 | ||||||||
| Project financing |
1,542 | 1,562 | 1,420 | 1,525 | ||||||||
| CCFC New Notes |
1,030 | 959 | — | — | ||||||||
| CCFC Old Notes and CCFC Term Loans |
— | — | 727 | 778 | ||||||||
| Preferred interests |
25 | 25 | 305 | 335 | ||||||||
| Notes payable and other borrowings |
241 | 253 | 330 | 356 | ||||||||
| Total |
$ | 8,472 | $ | 8,760 | $ | 7,679 | $ | 9,739 | ||||
8. Fair Value Measurements
Derivatives — We enter into a variety of derivative instruments, which include physical commodity contracts and financial commodity instruments such as OTC and exchange traded swaps, futures, options, forward agreements and instruments that settle on the power price to natural gas price relationships (Heat Rate swaps and options) for the purchase and sale of power, natural gas, and emission allowances as well as interest rate swaps.
Our level 1 fair value derivative instruments primarily consist of natural gas swaps, futures and options traded on the NYMEX.
Our level 2 fair value derivative instruments primarily consist of interest rate swaps and OTC power and natural gas forwards for which market-based pricing inputs are observable. Generally, we obtain our level 2 pricing inputs from markets such as the Intercontinental Exchange. In certain instances, our level 2 derivative instruments may utilize models to measure fair value. These models are primarily industry-standard models that incorporate various assumptions, including quoted interest rates, correlation, volatility, as well as other relevant economic measures. Substantially all of these assumptions are observable in the marketplace throughout the full term of the instrument, can be derived from observable data or are supported by observable levels at which transactions are executed in the marketplace.
Our level 3 fair value derivative instruments primarily consist of our OTC power and natural gas forwards and options where pricing inputs are unobservable, as well as other complex and structured transactions. Complex or structured transactions are tailored to our or our customers’ needs and can introduce the need for
155
Table of Contents
Index to Financial Statements
CALPINE CORPORATION AND SUBSIDIARIES
NOTES TO CONSOLIDATED FINANCIAL STATEMENTS — (Continued)
For the Years Ended December 31, 2009, 2008 and 2007
internally-developed model inputs which might not be observable in or corroborated by the market. When such inputs have a significant impact on the measurement of fair value, the instrument is categorized in level 3. Our valuation models may incorporate historical correlation information and extrapolate available broker and other information to future periods. In cases where there is no corroborating market information available to support significant model inputs, we initially use the transaction price as the best estimate of fair value. OTC options are valued using industry-standard models, including the Black-Scholes pricing model. At each balance sheet date, we perform an analysis of all instruments subject to fair value measurement and include in level 3 all of those whose fair value is based on significant unobservable inputs.
We utilize market data, such as pricing services and broker quotes, and assumptions that we believe market participants would use in pricing our assets or liabilities including assumptions about risks and the risks inherent to the inputs in the valuation technique. These inputs can be either readily observable, market corroborated or generally unobservable. The market data obtained from broker pricing services is evaluated to determine the nature of the quotes obtained and, where accepted as a reliable quote, used to validate our assessment of fair value; however, other qualitative assessments are used to determine the level of activity in any given market. We primarily apply the market approach and income approach for recurring fair value measurements and utilize what we believe to be the best available information. We utilize valuation techniques that seek to maximize the use of observable inputs and minimize the use of unobservable inputs. We classify fair value balances based on the observability of those inputs.
The primary factors affecting the fair value of our commodity derivative instruments at any point in time are the volume of open derivative positions (MMBtu and MWh); market price levels, primarily for power and natural gas; our credit standing and that of our counterparties; and prevailing interest rates. Prices for power and natural gas are volatile, which can result in material changes in the fair value measurements reported in our financial statements in the future.
The fair value of our derivatives includes consideration of our credit standing, the credit standing of our counterparties and the impact of credit enhancements, if any. We have also recorded credit reserves in the determination of fair value based on our expectation of how market participants would determine fair value. Such valuation adjustments are generally based on market evidence, if available, or our best estimate.
Margin Deposits — Our margin deposits are cash and cash equivalents and are generally classified within level 1 of the fair value hierarchy as the amounts approximate fair value.
156
Table of Contents
Index to Financial Statements
CALPINE CORPORATION AND SUBSIDIARIES
NOTES TO CONSOLIDATED FINANCIAL STATEMENTS — (Continued)
For the Years Ended December 31, 2009, 2008 and 2007
The following tables present our financial assets and liabilities that were accounted for at fair value on a recurring basis as of December 31, 2009 and 2008, by level within the fair value hierarchy. Financial assets and liabilities are classified in their entirety based on the lowest level of input that is significant to the fair value measurement. Our assessment of the significance of a particular input to the fair value measurement requires judgment, and may affect the valuation of fair value assets and liabilities and their placement within the fair value hierarchy levels.
| Assets and Liabilities with Recurring Fair Value Measures as of December 31, 2009 | ||||||||||||
| Level 1 | Level 2 | Level 3 | Total | |||||||||
| (in millions) | ||||||||||||
| Assets: |
||||||||||||
| Cash equivalents(1) |
$ | 1,306 | $ | — | $ | — | $ | 1,306 | ||||
| Margin deposits(2) |
413 | — | — | 413 | ||||||||
| Commodity derivative instruments |
953 | 204 | 71 | 1,228 | ||||||||
| Interest rate swaps |
— | 18 | — | 18 | ||||||||
| Total assets |
$ | 2,672 | $ | 222 | $ | 71 | $ | 2,965 | ||||
| Liabilities: |
||||||||||||
| Margin deposits held by us posted by our counterparties(2) |
$ | 9 | $ | — | $ | — | $ | 9 | ||||
| Commodity derivative instruments |
1,096 | 91 | 33 | 1,220 | ||||||||
| Interest rate swaps |
— | 337 | — | 337 | ||||||||
| Total liabilities |
$ | 1,105 | $ | 428 | $ | 33 | $ | 1,566 | ||||
| Assets and Liabilities with Recurring Fair Value Measures as of December 31, 2008 | ||||||||||||
| Level 1 | Level 2 | Level 3 | Total | |||||||||
| (in millions) | ||||||||||||
| Assets: |
||||||||||||
| Cash equivalents(1) |
$ | 2,092 | $ | — | $ | — | $ | 2,092 | ||||
| Margin deposits(2) |
653 | — | — | 653 | ||||||||
| Commodity derivative instruments |
3,263 | 634 | 160 | 4,057 | ||||||||
| Total assets |
$ | 6,008 | $ | 634 | $ | 160 | $ | 6,802 | ||||
| Liabilities: |
||||||||||||
| Margin deposits held by us posted by our counterparties(2) |
$ | 169 | $ | — | $ | — | $ | 169 | ||||
| Commodity derivative instruments |
3,515 | 475 | 55 | 4,045 | ||||||||
| Interest rate swaps |
— | 452 | — | 452 | ||||||||
| Total liabilities |
$ | 3,684 | $ | 927 | $ | 55 | $ | 4,666 | ||||
| (1) | Amounts represent cash equivalents invested in money market accounts and are included in cash and cash equivalents and restricted cash on our Consolidated Balance Sheets. As of December 31, 2009 and 2008, we had cash equivalents of $770 million and $1,597 million included in cash and cash equivalents and $536 million and $495 million included in restricted cash, respectively. |
| (2) | Margin deposits and margin deposits held by us posted by our counterparties represent cash collateral paid between our counterparties and us to support our commodity contracts. |
157
Table of Contents
Index to Financial Statements
CALPINE CORPORATION AND SUBSIDIARIES
NOTES TO CONSOLIDATED FINANCIAL STATEMENTS — (Continued)
For the Years Ended December 31, 2009, 2008 and 2007
Gains or losses associated with level 3 balances may not necessarily reflect trends occurring in the underlying business. Further, unrealized gains and losses for the period from level 3 items are often offset by unrealized gains and losses on positions classified in levels 1 or 2, as well as positions that have been realized during the period. Certain of our level 3 balances qualify for cash flow hedge accounting for which any unrealized gains and losses are recorded in OCI. Gains and losses for level 3 balances that do not qualify for hedge accounting are recorded in earnings.
The following table sets forth a reconciliation of changes in the fair value of our net derivative assets (liabilities) classified as level 3 in the fair value hierarchy for the years ended December 31, 2009 and 2008 (in millions):
| 2009 | 2008 | |||||||
| Balance, beginning of period |
$ | 105 | $ | (23 | )(1) | |||
| Realized and unrealized gains (losses): |
||||||||
| Included in net income(2) |
19 | 57 | ||||||
| Included in OCI |
(4 | ) | 229 | |||||
| Purchases, issuances and settlements, net |
(48 | ) | (97 | ) | ||||
| Transfers in and/or out of level 3(3) |
(34 | ) | (61 | ) | ||||
| Balance, end of period |
$ | 38 | $ | 105 | ||||
| Change in unrealized gains relating to instruments still held at end of period(2) |
$ | 19 | $ | 57 | ||||
| (1) | Our portfolio of derivative assets and liabilities is adjusted for the day one loss of $(22) million, excluding the tax benefit of $8 million, recognized upon adoption of the new fair value measurement standards on January 1, 2008. |
| (2) | Includes $5 million and $78 million recorded in operating revenues (for power contracts and Heat Rate swaps and options) and $14 million and $(21) million recorded in fuel and purchased energy expense (for natural gas contracts) for the years ended December 31, 2009 and 2008, respectively as shown on our Consolidated Statements of Operations. |
| (3) | We transfer amounts among levels of the fair value hierarchy as of the end of each period. |
158
Table of Contents
Index to Financial Statements
CALPINE CORPORATION AND SUBSIDIARIES
NOTES TO CONSOLIDATED FINANCIAL STATEMENTS — (Continued)
For the Years Ended December 31, 2009, 2008 and 2007
9. Derivative Instruments
The following tables reflect the amounts that were recorded as derivative assets and liabilities on our Consolidated Balance Sheets at December 31, 2009 and 2008, for our derivative instruments (in millions):
| 2009 | |||||||||||
| Interest Rate Swaps |
Commodity Instruments |
Total Derivative Instruments |
|||||||||
| Derivative assets, current |
$ | — | $ | 1,119 | $ | 1,119 | |||||
| Long-term derivative assets |
18 | 109 | 127 | ||||||||
| Total derivative assets |
$ | 18 | $ | 1,228 | $ | 1,246 | |||||
| Derivative liabilities, current |
$ | 202 | $ | 1,158 | $ | 1,360 | |||||
| Long-term derivative liabilities |
135 | 62 | 197 | ||||||||
| Total derivative liabilities |
$ | 337 | $ | 1,220 | $ | 1,557 | |||||
| Net derivative assets (liabilities) |
$ | (319 | ) | $ | 8 | $ | (311 | ) | |||
| 2008 | |||||||||||
| Interest Rate Swaps |
Commodity Instruments |
Total Derivative Instruments |
|||||||||
| Derivative assets, current |
$ | — | $ | 3,653 | $ | 3,653 | |||||
| Long-term derivative assets |
— | 404 | 404 | ||||||||
| Total derivative assets |
$ | — | $ | 4,057 | $ | 4,057 | |||||
| Derivative liabilities, current |
$ | 179 | $ | 3,620 | $ | 3,799 | |||||
| Long-term derivative liabilities |
273 | 425 | 698 | ||||||||
| Total derivative liabilities |
$ | 452 | $ | 4,045 | $ | 4,497 | |||||
| Net derivative assets (liabilities) |
$ | (452 | ) | $ | 12 | $ | (440 | ) | |||
Commodity Instruments — We are exposed to changes in prices for the purchase and sale of power, natural gas and other energy commodities. We use derivatives, which include physical commodity contracts and financial commodity instruments such as OTC and exchange traded swaps, futures, options, forward agreements and instruments that settle on the power price to natural gas price relationships (Heat Rate swaps and options) for the purchase and sale of power, natural gas, and emission allowances to attempt to maximize the risk-adjusted returns by economically hedging a portion of the commodity price risk associated with our assets. These transactions primarily act as fair value and cash flow hedges. By entering into these transactions, we are able to economically hedge a portion of our spark spread at estimated generation and prevailing price levels.
Interest Rate Swaps — A significant portion of our debt is indexed to base rates, primarily LIBOR. We use interest rate swaps to adjust the mix between fixed and floating rate debt to hedge our interest rate risk for potential adverse changes in interest rates. These transactions primarily act as cash flow hedges for our variable rate debt.
As of December 31, 2009, the maximum length of our PPAs extend approximately 22 years into the future and the maximum length of time over which we were hedging using commodity and interest rate derivative instruments was 3 and 16 years, respectively.
159
Table of Contents
Index to Financial Statements
CALPINE CORPORATION AND SUBSIDIARIES
NOTES TO CONSOLIDATED FINANCIAL STATEMENTS — (Continued)
For the Years Ended December 31, 2009, 2008 and 2007
Accounting for Derivative Instruments
We recognize all derivative instruments that qualify for derivative accounting treatment as either assets or liabilities and measure those instruments at fair value unless they qualify for, and we elect, the normal purchase normal sale exemption. Unless these instruments settle by means of the physical delivery of a commodity, revenues and expenses derived from these instruments that qualify for hedge accounting are recorded in the period and same financial statement line item as the hedged item. Hedge accounting requires us to formally document, designate and assess the effectiveness of transactions that receive hedge accounting. We present the cash flows from our derivatives in the same category as the item being hedged within operating activities on our Consolidated Statements of Cash Flows unless they contain an other-than-insignificant financing element in which case their cash flows are classified within financing activities.
Cash Flow Hedges — We report the effective portion of the unrealized gain or loss on a derivative instrument designated and qualifying as a cash flow hedging instrument as a component of OCI and reclassify such gains and losses into earnings in the same period during which the hedged forecasted transaction affects earnings. Gains and losses due to ineffectiveness on commodity hedging instruments are included in unrealized mark-to-market gains and losses and are recognized currently in earnings as a component of operating revenues (for power contracts), fuel and purchased energy expense (for natural gas contracts) and interest expense (for interest rate swaps). If it is determined that the forecasted transaction is no longer probable of occurring, then hedge accounting will be discontinued prospectively. If the hedging instrument is terminated or de-designated prior to the occurrence of the hedged forecasted transaction, the gain or loss associated with the hedge instrument remains deferred in OCI until such time as the forecasted transaction impacts earnings, or until it is determined that the forecasted transaction is probable of not occurring.
Fair Value Hedges — Changes in fair value of derivatives designated as fair value hedges and the corresponding changes in the fair value of the hedged risk attributable to a recognized asset or liability, or unrecognized firm commitment are recorded in earnings. If the fair value hedge is effective, the amounts recorded will offset in earnings. If the underlying asset, liability or firm commitment being hedged is disposed of or otherwise terminated, the gain or loss associated with the underlying hedged item is recognized currently in earnings. If the hedging instrument is terminated or de-designated prior to the settlement of the hedged asset, liability or firm commitment, the carrying amount of the hedged item is adjusted by any gain or loss from the hedging instrument and remains until the hedged item is recognized in earnings. We had no fair value hedges at December 31, 2009; however, we had one fair value hedge at December 31, 2008 related to PCF.
Derivatives Not Designated as Hedging Instruments — Along with our portfolio of hedging instruments, we enter into power, natural gas and interest rate transactions that primarily act as economic hedges to our asset portfolio, but either do not qualify as hedges under hedge accounting guidelines or qualify under the hedge accounting guidelines and the hedge accounting designation has not been elected, such as commodity futures, forwards, options, fixed for floating swaps and instruments that settle on power price to natural gas price relationships (Heat Rate swaps and options). Changes in fair value of derivatives not designated as hedging instruments are recognized currently in earnings as a component of operating revenues (for power contracts and Heat Rate swaps and options), fuel and purchased energy expense (for natural gas contracts) and interest expense (for interest rate swaps).
160
Table of Contents
Index to Financial Statements
CALPINE CORPORATION AND SUBSIDIARIES
NOTES TO CONSOLIDATED FINANCIAL STATEMENTS — (Continued)
For the Years Ended December 31, 2009, 2008 and 2007
Derivatives Included on Our Consolidated Balance Sheet
The following table presents the fair values of our net derivative instruments recorded on our Consolidated Balance Sheet by hedge type and location at December 31, 2009 (in millions):
| Fair Value of Derivative Assets(1) |
Fair Value of Derivative Liabilities(2) | |||||
| Derivatives designated as cash flow hedging instruments: |
||||||
| Interest rate swaps |
$ | 18 | $ | 324 | ||
| Commodity instruments |
213 | 80 | ||||
| Total derivatives designated as cash flow hedging instruments |
$ | 231 | $ | 404 | ||
| Derivatives not designated as hedging instruments: |
||||||
| Interest rate swaps |
$ | — | $ | 13 | ||
| Commodity instruments |
1,015 | 1,140 | ||||
| Total derivatives not designated as hedging instruments |
$ | 1,015 | $ | 1,153 | ||
| Total derivatives |
$ | 1,246 | $ | 1,557 | ||
| (1) | Included in derivative assets on our Consolidated Balance Sheet as of December 31, 2009. |
| (2) | Included in derivative liabilities on our Consolidated Balance Sheet as of December 31, 2009. |
We execute forward physical and financial commodity purchase and sales agreements to hedge our exposure to underlying commodity risk. Through hedging and optimization activities it is not uncommon for us to purchase and sell forward natural gas and power in both the physical and financial markets. As of December 31, 2009, the net forward notional buy (sell) position of our outstanding commodity and interest rate swap contracts that did not qualify under the normal purchase normal sale exemption were as follows (in millions):
| Derivative Instruments |
Notional Volumes |
|||
| Power (MWh) |
(52 | ) | ||
| Natural gas (MMBtu) |
78 | |||
| Interest rate swaps |
$ | 7,324 | ||
Certain of our derivative instruments contain credit-contingent provisions that require us to maintain our current credit rating or higher from each of the major credit rating agencies. If our credit rating were to be downgraded, it could require us to post additional collateral or could potentially allow our counterparty to request immediate, full settlement on certain derivative instruments in liability positions. The aggregate fair value of our derivative liabilities with credit-contingent provisions as of December 31, 2009, was $156 million for which we have posted collateral of $5 million by posting margin deposits or granted additional first priority liens on the assets currently subject to first priority liens under our First Lien Credit Facility. However, if our credit rating were downgraded, we estimate that any additional collateral would not be material and that no counterparty could request immediate, full settlement.
161
Table of Contents
Index to Financial Statements
CALPINE CORPORATION AND SUBSIDIARIES
NOTES TO CONSOLIDATED FINANCIAL STATEMENTS — (Continued)
For the Years Ended December 31, 2009, 2008 and 2007
Derivatives Included on Our Consolidated Statements of Operations, OCI and AOCI
Changes in the fair values of our derivative instruments (both assets and liabilities) are reflected either in cash for option premiums paid or collected, in OCI, net of tax, for the effective portion of derivative instruments which qualify for cash flow hedge accounting treatment, or on our Consolidated Statements of Operations as a component of mark-to-market activity within our net income.
The following tables detail the components of our total mark-to-market activity for both the net realized gain (loss) and the net unrealized gain (loss) recognized from our derivative instruments not designated as hedging instruments and where these components were recorded on our Consolidated Statements of Operations for the years ended December 31, 2009, 2008 and 2007 (in millions):
| 2009 | 2008 | 2007 | ||||||||||
| Realized gain (loss) |
||||||||||||
| Interest rate swaps |
$ | (35 | ) | $ | (11 | ) | $ | 5 | ||||
| Commodity derivative instruments(1) |
37 | (146 | ) | 40 | ||||||||
| Total realized gain (loss) |
$ | 2 | $ | (157 | ) | $ | 45 | |||||
| Unrealized gain (loss)(2) |
||||||||||||
| Interest rate swaps |
$ | 10 | $ | (11 | ) | $ | (17 | ) | ||||
| Commodity derivative instruments |
79 | 35 | (35 | ) | ||||||||
| Total unrealized gain (loss) |
$ | 89 | $ | 24 | $ | (52 | ) | |||||
| Total mark-to-market activity |
$ | 91 | $ | (133 | ) | $ | (7 | ) | ||||
| (1) | Balance includes a non-cash gain from amortization of prepaid power sales agreements of approximately nil, $40 million and $54 million for the years ended December 31, 2009, 2008 and 2007, respectively. |
| (2) | Changes in unrealized gains and losses include hedge ineffectiveness and adjustments to reflect changes in credit default risk exposure. |
| 2009 | 2008 | 2007 | ||||||||||
| Power contracts included in operating revenues |
$ | 7 | $ | 232 | $ | 252 | ||||||
| Natural gas contracts included in fuel and purchased energy expense |
109 | (343 | ) | (247 | ) | |||||||
| Interest rate swaps included in interest expense |
(25 | ) | (22 | ) | (12 | ) | ||||||
| Total mark-to-market activity |
$ | 91 | $ | (133 | ) | $ | (7 | ) | ||||
The following table details the effect of our net derivative instruments that qualified for hedge accounting treatment on our Consolidated Statements of Operations and OCI, and the ineffectiveness related to our hedging instruments for the year ended December 31, 2009 (in millions):
| Gain (Loss) Recognized in OCI (Effective Portion) |
Gain (Loss) Reclassified from OCI into Income (Effective Portion)(3) |
Gain (Loss) Reclassified from OCI into Income (Ineffective Portion) |
||||||||||
| Commodity derivative instruments |
$ | (280 | ) | $ | 549 | (1) | $ | — | (2) | |||
| Interest rate swaps included in interest expense |
125 | (214 | ) | — | ||||||||
| Total |
$ | (155 | ) | $ | 335 | $ | — | |||||
| (1) | Included in operating revenues and fuel and purchased energy expense on our Consolidated Statement of Operations. |
162
Table of Contents
Index to Financial Statements
CALPINE CORPORATION AND SUBSIDIARIES
NOTES TO CONSOLIDATED FINANCIAL STATEMENTS — (Continued)
For the Years Ended December 31, 2009, 2008 and 2007
| (2) | The ineffective portion of gains (losses) reclassified from AOCI into income on commodity hedging instruments was $2 million and $(2) million for the years ended December 31, 2008 and 2007, respectively. |
| (3) | Cumulative net cash flow hedge losses included in AOCI were $261 million and $149 million at December 31, 2009 and 2008, respectively. |
Assuming constant December 31, 2009 power and natural gas prices and interest rates, we estimate that pre-tax net losses of $94 million would be reclassified from AOCI into earnings during the next 12 months as the hedged transactions settle; however, the actual amounts that will be reclassified will likely vary based on changes in natural gas and power prices as well as interest rates. Therefore, we are unable to predict what the actual reclassification from AOCI into earnings (positive or negative) will be for the next 12 months.
10. Use of Collateral
We use margin deposits, prepayments and letters of credit as credit support with and from our counterparties for commodity procurement and risk management activities. In addition, we have granted additional first priority liens on the assets currently subject to first priority liens under our First Lien Credit Facility as collateral under certain of our power and natural gas agreements that qualify as “eligible commodity hedge agreements” under our First Lien Credit Facility and certain of our interest rate swap agreements in order to reduce the cash collateral and letters of credit that we would otherwise be required to provide to the counterparties under such agreements. The counterparties under such agreements would share the benefits of the collateral subject to such first priority liens ratably with the lenders under our First Lien Credit Facility.
The table below summarizes the balances outstanding under margin deposits, natural gas and power prepayments, and exposure under letters of credit and first priority liens for commodity procurement and risk management activities as of December 31, 2009 and 2008 (in millions):
| 2009 | 2008 | |||||
| Margin deposits(1) |
$ | 413 | $ | 653 | ||
| Natural gas and power prepayments |
34 | 60 | ||||
| Total margin deposits and natural gas and power prepayments with our counterparties(2) |
$ | 447 | $ | 713 | ||
| Letters of credit issued |
$ | 353 | $ | 455 | ||
| First priority liens under power and natural gas agreements(3) |
— | — | ||||
| First priority liens under interest rate swap agreements |
333 | 477 | ||||
| Total letters of credit and first priority liens with our counterparties |
$ | 686 | $ | 932 | ||
| Margin deposits held by us posted by our counterparties(1)(4) |
$ | 9 | $ | 169 | ||
| Letters of credit posted with us by our counterparties |
70 | 95 | ||||
| Total margin deposits and letters of credit posted with us by our counterparties |
$ | 79 | $ | 264 | ||
| (1) | Balances are subject to master netting arrangements and presented on a gross basis on our Consolidated Balance Sheets. |
| (2) | $426 million and $693 million were included in margin deposits and other prepaid expense on our Consolidated Balance Sheets at December 31, 2009 and 2008, respectively, and $21 million and $20 million were included in other assets at December 31, 2009 and 2008, respectively. |
163
Table of Contents
Index to Financial Statements
CALPINE CORPORATION AND SUBSIDIARIES
NOTES TO CONSOLIDATED FINANCIAL STATEMENTS — (Continued)
For the Years Ended December 31, 2009, 2008 and 2007
| (3) | The fair value of our commodity derivative instruments collateralized by first priority liens included assets of $123 million and $201 million at December 31, 2009 and 2008, respectively; therefore, there was no collateral exposure at December 31, 2009 and 2008. |
| (4) | Included in other current liabilities on our Consolidated Balance Sheets. |
Future collateral requirements for cash, first priority liens and letters of credit may increase or decrease based on the extent of our involvement in hedging and optimization contracts, movements in commodity prices, and also based on our credit ratings and general perception of creditworthiness in our market.
11. Income Taxes
Income Tax Expense (Benefit)
The jurisdictional components of income (loss) from continuing operations before income tax expense (benefit) and discontinued operations, attributable to Calpine, for the years ended December 31, 2009, 2008 and 2007, are as follows (in millions):
| 2009 | 2008 | 2007 | |||||||||
| U.S. |
$ | 151 | $ | (30 | ) | $ | 2,160 | ||||
| International |
13 | (30 | ) | (13 | ) | ||||||
| Total |
$ | 164 | $ | (60 | ) | $ | 2,147 | ||||
The components of income tax expense (benefit) from continuing operations for the years ended December 31, 2009, 2008 and 2007, consisted of the following (in millions):
| 2009 | 2008 | 2007 | ||||||||||
| Current: |
||||||||||||
| Federal |
$ | (2 | ) | $ | (10 | ) | $ | (25 | ) | |||
| State |
(2 | ) | 2 | 11 | ||||||||
| Foreign |
3 | (66 | ) | (15 | ) | |||||||
| Total current |
(1 | ) | (74 | ) | (29 | ) | ||||||
| Deferred: |
||||||||||||
| Federal |
13 | 24 | (449 | ) | ||||||||
| State |
4 | 3 | (68 | ) | ||||||||
| Foreign |
(1 | ) | — | — | ||||||||
| Total deferred |
16 | 27 | (517 | ) | ||||||||
| Total income tax expense (benefit) |
$ | 15 | $ | (47 | ) | $ | (546 | ) | ||||
164
Table of Contents
Index to Financial Statements
CALPINE CORPORATION AND SUBSIDIARIES
NOTES TO CONSOLIDATED FINANCIAL STATEMENTS — (Continued)
For the Years Ended December 31, 2009, 2008 and 2007
For the years ended December 31, 2009, 2008 and 2007, our income tax rates did not bear a customary relationship to statutory income tax rates, primarily as a result of the impact of our valuation allowance, state income taxes and changes in unrecognized tax benefits. A reconciliation of the federal statutory rate of 35% to our effective rate from continuing operations for the years ended December 31, 2009, 2008 and 2007, is as follows:
| 2009 | 2008 | 2007 | |||||||
| Federal statutory tax expense (benefit) rate |
35.0 | % | (35.0 | )% | 35.0 | % | |||
| State tax expense (benefit), net of federal benefit |
0.8 | 9.7 | (2.6 | ) | |||||
| Depletion in excess of basis |
— | (12.1 | ) | — | |||||
| Valuation allowances |
(116.8 | ) | 323.6 | 5.7 | |||||
| Foreign taxes |
(7.3 | ) | (78.7 | ) | 1.6 | ||||
| Non-deductible reorganization items |
1.1 | (118.3 | ) | (65.2 | ) | ||||
| Income from cancellation of indebtedness |
54.1 | 43.7 | — | ||||||
| Intraperiod allocation pursuant to OCI |
35.6 | (124.2 | ) | — | |||||
| Bankruptcy settlement |
— | (92.5 | ) | — | |||||
| Change in unrecognized tax benefits |
1.1 | 5.8 | (1.9 | ) | |||||
| Permanent differences and other items |
5.5 | (0.3 | ) | 2.0 | |||||
| Effective income tax expense (benefit) rate |
9.1 | % | (78.3 | )% | (25.4 | )% | |||
Deferred Tax Assets and Liabilities
The components of the deferred income taxes, net of current portion as of December 31, 2009 and 2008, are as follows (in millions):
| 2009 | 2008 | |||||||
| Deferred tax assets: |
||||||||
| NOL and credit carryforwards |
$ | 3,209 | $ | 3,310 | ||||
| Taxes related to risk management activities and derivatives |
81 | 10 | ||||||
| Reorganization items and impairments |
571 | 583 | ||||||
| Foreign capital losses |
68 | 51 | ||||||
| Other differences |
10 | 6 | ||||||
| Deferred tax assets before valuation allowance |
3,939 | 3,960 | ||||||
| Valuation allowance |
(2,572 | ) | (2,685 | ) | ||||
| Total deferred tax assets |
1,367 | 1,275 | ||||||
| Deferred tax liabilities: property, plant and equipment |
(1,417 | ) | (1,352 | ) | ||||
| Net deferred tax liability |
(50 | ) | (77 | ) | ||||
| Less: Current portion deferred tax asset (liability) |
(8 | ) | 1 | |||||
| Less: Non-current deferred tax asset |
12 | 15 | ||||||
| Deferred income taxes, net of current portion |
$ | (54 | ) | $ | (93 | ) | ||
For federal income tax reporting purposes, our consolidated GAAP financial reporting group is comprised primarily of two groups, CCFC and its subsidiaries, which we refer to as the CCFC group, and Calpine Corporation and its subsidiaries other than CCFC, which we refer to as the Calpine group. In 2005, CCFCP issued the CCFCP Preferred Shares, which resulted in the deconsolidation of the CCFC group for income tax
165
Table of Contents
Index to Financial Statements
CALPINE CORPORATION AND SUBSIDIARIES
NOTES TO CONSOLIDATED FINANCIAL STATEMENTS — (Continued)
For the Years Ended December 31, 2009, 2008 and 2007
purposes. On July 1, 2009, the CCFCP Preferred Shares were redeemed; however, CCFCP continues to be a partnership and therefore, the CCFC group remains deconsolidated from Calpine Corporation for federal income tax reporting purposes. As of December 31, 2009, the CCFC group did not have a valuation allowance recorded against its deferred tax assets due to management’s assessment that the CCFC group would more likely than not utilize its NOLs prior to their expiration.
In accordance with GAAP, intraperiod tax allocation provisions require allocation of a tax benefit to continuing operations due to current OCI gains. We have recorded a tax expense of $43 million included in our income before discontinued operations on our 2009 Consolidated Statement of Operations, with an offsetting $43 tax benefit in OCI and $0 tax benefit in income from discontinued operations. We recorded a tax benefit of $90 million included in our loss before discontinued operations on our 2008 Consolidated Statement of Operations, with an offsetting $76 million tax expense in OCI and a $14 million tax expense in income from discontinued operations.
NOL Carryforwards — Our carryforwards consist primarily of federal NOL carryforwards of approximately $7.5 billion, which expire between 2021 and 2029, and state NOL carryforwards of approximately $4.6 billion, which expire between 2010 and 2029. The NOL carryforwards available are subject to limitations on their annual usage. This includes an NOL carryforward of approximately $513 million for the CCFC group. Under federal and applicable state income tax laws, a corporation is generally permitted to deduct from taxable income in any year NOLs carried forward from prior years subject to certain time limitations as prescribed by the taxing authorities. In addition, we have approximately $1.1 billion in foreign NOLs, substantially all of which are offset with a full valuation allowance.
Under federal income tax law, our NOL carryforwards can be utilized to reduce future taxable income subject to certain limitations, including if we were to undergo an ownership change as defined by Section 382 of the IRC. We experienced an ownership change on the Effective Date as a result of the cancellation of our old common stock and the distribution of our new common stock pursuant to our Plan of Reorganization. However, this ownership change and resulting annual limitations are not expected to result in the expiration of our NOL carryforwards if we are able to generate sufficient future taxable income within the carryforward periods. Additionally, as of December 31, 2009, approximately $2.0 billion of our $7.5 billion NOLs are not limited under Section 382 of the IRC. When considering our annual Section 382 limitations in addition to our NOLs that are not limited, our total unlimited NOLs available to offset future income are approximately $3.9 billion, as of December 31, 2009. However, if a subsequent ownership change were to occur as a result of future transactions in our stock, accompanied by a significant reduction in our market value immediately prior to the ownership change, our ability to utilize the NOL carryforwards may be significantly limited, including the $2.0 billion of NOLs that are not currently limited by Section 382 of the IRC.
To manage the risk of significant limitations on our ability to utilize our tax NOL carryforwards, our amended and restated certificate of incorporation permits our Board of Directors to meet to determine whether to impose certain transfer restrictions on our common stock in the following circumstances: if, prior to February 1, 2013, our Market Capitalization declines by at least 35% from our Emergence Date Market Capitalization of approximately $8.6 billion (in each case, as defined in and calculated pursuant to our amended and restated certificate of incorporation) and at least 25 percentage points of shift in ownership has occurred with respect to our equity for purposes of Section 382 of the IRC. We believe, as of the filing of this Report, we have experienced declines in our stock price of more than 35% from our Emergence Date Market Capitalization. While we don’t believe an ownership change of 25 percentage points has occurred, the change in ownership is only slightly less than 25%. Accordingly, the transfer restrictions have not been put in place by our Board of
166
Table of Contents
Index to Financial Statements
CALPINE CORPORATION AND SUBSIDIARIES
NOTES TO CONSOLIDATED FINANCIAL STATEMENTS — (Continued)
For the Years Ended December 31, 2009, 2008 and 2007
Directors; however, if both of the foregoing events were to occur together and our Board of Directors were to elect to impose them, they could become operative in the future. There can be no assurance that the circumstances will not be met in the future, or in the event that they are met, that our Board of Directors would choose to impose these restrictions or that, if imposed, such restrictions would prevent an ownership change from occurring.
Should our Board of Directors elect to impose these restrictions, they shall have the authority and discretion to determine and establish the definitive terms of the transfer restrictions provided that they apply to purchases by owners of 5% or more of our common stock including any owners who would become owners of 5% or more of our common stock via such purchase. The transfer restrictions will not apply to the disposition of shares provided they are not purchased by a 5% or more owner.
Valuation Allowance — GAAP requires that we consider all available evidence, both positive and negative, and tax planning strategies to determine whether, based on the weight of that evidence, a valuation allowance is needed to reduce the value of deferred tax assets. Future realization of the tax benefit of an existing deductible temporary difference or carryforward ultimately depends on the existence of sufficient taxable income of the appropriate character within the carryback or carryforward periods available under the tax law. Due to our history of losses, we were unable to assume future profits; however, at December 31, 2007, we were able to consider available tax planning strategies due to our expected emergence from Chapter 11. Future income from reversals of existing taxable temporary differences and tax planning strategies allowed a larger portion of the deferred tax assets to be offset against deferred tax liabilities resulting in a significant release of previously recorded valuation allowance.
As of December 31, 2009, we have provided a valuation allowance of approximately $2.6 billion on certain federal, state and foreign tax jurisdiction deferred tax assets to reduce the gross amount of these assets to the extent necessary to result in an amount that is more likely than not of being realized. The net change in our valuation allowance was a decrease of $113 million for the year ended December 31, 2009, and an increase of $284 million and $80 million for the years ended December 31, 2008 and 2007, respectively; all primarily related to our estimates of our ability to utilize our NOL carryforwards.
Canadian Tax Audits — In September 2009, we received notice from the Canadian Revenue Authority, or CRA, of their intent to conduct a limited scope income tax audit on four of our Canadian subsidiaries for the tax years ending 2005 – 2008. We have timely responded to their request for information and the CRA has not provided us with a timetable for their completion of the audit. At this time, we are unable to determine the likelihood that the outcome could have a material adverse impact to us.
Unrecognized Tax Benefits
As of December 31, 2009, we had unrecognized tax benefits of $98 million. If recognized, $41 million of our unrecognized tax benefits could impact the annual effective tax rate and $57 million related to deferred tax assets, of which, $48 million could be offset against the recorded valuation allowance and $9 million could reduce our deferred tax assets resulting in no impact to our effective tax rate. We also had accrued interest and penalties of $17 million for income tax matters as of December 31, 2009. The amount of unrecognized tax benefits increased by $8 million for the year ended December 31, 2009, primarily as a result of an increase of approximately $11 million for withholding taxes and foreign exchange losses and reductions of approximately $1 million due to cash settlements and $2 million in other non-cash settlements with various state taxing authorities.
167
Table of Contents
Index to Financial Statements
CALPINE CORPORATION AND SUBSIDIARIES
NOTES TO CONSOLIDATED FINANCIAL STATEMENTS — (Continued)
For the Years Ended December 31, 2009, 2008 and 2007
A reconciliation of the beginning and ending amounts of our unrecognized tax benefits for the years ended December 31, 2009 and 2008, is as follows (in millions):
| 2009 | 2008 | 2007 | ||||||||||
| Balance, beginning of period |
$ | (90 | ) | $ | (173 | ) | $ | (240 | ) | |||
| Increases related to prior year tax positions |
(11 | ) | (2 | ) | (28 | ) | ||||||
| Decreases related to prior year tax positions |
2 | 6 | 8 | |||||||||
| Increases related to current year tax positions |
— | (7 | ) | — | ||||||||
| Settlements |
1 | 84 | 87 | |||||||||
| Decrease related to lapse of statute of limitations |
— | 2 | — | |||||||||
| Balance, end of period |
$ | (98 | ) | $ | (90 | ) | $ | (173 | ) | |||
We believe it is reasonably possible that a decrease of up to $1 million in unrecognized tax benefits related primarily to state tax exposures could be recorded within the next 12 months as a result of settlements with the tax authorities. We remain subject to various audits and reviews by state taxing authorities; however, we do not expect these will have a material effect on our tax provision. Any NOLs we claim in future years to reduce taxable income could be subject to U.S. Internal Revenue Service examination regardless of when the NOLs occurred. Due to our significant NOLs, any adjustment to our federal returns would likely result in a reduction of deferred tax assets rather than a cash payment of income taxes.
12. Earnings (Loss) per Share
Pursuant to our Plan of Reorganization, all shares of our common stock outstanding prior to the Effective Date were canceled and the issuance of 485 million new shares of reorganized Calpine Corporation common stock was authorized to resolve allowed unsecured claims. A portion of the 485 million authorized shares was immediately distributed, and the remainder was reserved for distribution to holders of certain disputed claims that, although allowed as of the Effective Date, are unresolved. To the extent that any of the reserved shares remain undistributed upon resolution of the disputed claims, such shares will not be returned to us but rather will be distributed pro rata to claimants with allowed claims to increase their recovery. Therefore, pursuant to our Plan of Reorganization, all 485 million shares ultimately will be distributed. Accordingly, although the reserved shares are not yet issued and outstanding, all conditions of distribution had been met for these reserved shares as of the Effective Date, and such shares are considered issued and are included in our calculation of weighted average shares outstanding. We also include restricted stock units for which no future service is required as a condition to the delivery of the underlying common stock in our calculation of weighted average shares outstanding.
Reconciliations of the amounts used in the basic and diluted earnings (loss) per common share computations for the years ended December 31, 2009, 2008 and 2007, are as follows (shares in thousands):
| 2009 | 2008 | 2007 | ||||
| Diluted weighted average shares calculation: |
||||||
| Weighted average shares outstanding (basic) |
485,659 | 485,054 | 479,235 | |||
| Share-based awards |
660 | 492 | 243 | |||
| Weighted average shares outstanding (diluted) |
486,319 | 485,546 | 479,478 | |||
168
Table of Contents
Index to Financial Statements
CALPINE CORPORATION AND SUBSIDIARIES
NOTES TO CONSOLIDATED FINANCIAL STATEMENTS — (Continued)
For the Years Ended December 31, 2009, 2008 and 2007
We excluded the following items from diluted earnings (loss) per common share for the years ended December 31, 2009, 2008 and 2007 (shares in thousands):
| 2009 | 2008 | 2007 | ||||
| Share-based awards(1) |
13,158 | 7,259 | 17,315 | |||
| Common stock warrants(1)(2) |
— | 29,158 | — | |||
| Convertible Senior Notes(3) |
— | — | 399,914 | |||
| Deutsche Bank AG London loaned shares(4) |
— | — | 17,401 |
| (1) | Excluded from diluted weighted average shares outstanding as these share-based awards are anti-dilutive in accordance with the calculation under the treasury stock method prescribed by GAAP or because our closing stock price had not reached the price at which the shares vest. |
| (2) | Pursuant to our Plan of Reorganization, holders of allowed interests (primarily holders of our old common stock canceled on the Effective Date) received a pro rata share of warrants to purchase approximately 48.5 million shares of our new, reorganized Calpine Corporation common stock at $23.88 per share. Warrants for 21,499 shares of common stock were exercised prior to expiration. The remaining warrants expired unexercised on August 25, 2008. |
| (3) | Excluded from diluted weighted average shares outstanding as the conversion rights were terminated upon our Chapter 11 filings. |
| (4) | Excluded from basic and diluted weighted average shares outstanding as the share lending agreement with Deutsche Bank AG London required physical settlement of these common shares. |
Although earnings (loss) per share information for the years ended December 31, 2007, is presented, it is not comparable to the information presented for the years ended December 31, 2009 and 2008, due to the changes in our capital structure on the Effective Date, which also included termination of all outstanding convertible securities.
13. Stock-Based Compensation
Calpine Equity Incentive Plans
The Calpine Equity Incentive Plans were approved as part of our Plan of Reorganization. These plans are administered by the Compensation Committee of our Board of Directors and provide for the issuance of equity awards to all employees as well as the non-employee members of our Board of Directors. The equity awards may include incentive or non-qualified stock options, restricted stock, restricted stock units, stock appreciation rights, performance compensation awards, and other stock-based awards. Under the MEIP and DEIP there are 14,833,000 shares and 167,000 shares, respectively, of our common stock available for issuance to participants.
The equity awards granted under the Calpine Equity Incentive Plans include both graded and cliff vesting options, which vest over periods between one and five years, contain contractual terms of seven and ten years and are subject to forfeiture provisions under certain circumstances, including termination of employment prior to vesting. In addition, employment inducement options to purchase a total of 4,636,734 shares were granted outside of the Calpine Equity Incentive Plans in connection with our hiring of a new Chief Executive Officer and a new Chief Legal Officer in August 2008, and a new Chief Commercial Officer in September 2008. No grants of options or shares of restricted stock were made outside of the Calpine Equity Incentive Plans during the year
169
Table of Contents
Index to Financial Statements
CALPINE CORPORATION AND SUBSIDIARIES
NOTES TO CONSOLIDATED FINANCIAL STATEMENTS — (Continued)
For the Years Ended December 31, 2009, 2008 and 2007
ended December 31, 2009. Each of the employment inducement options vests over a period of five years, contains a contractual term of seven years and is subject to forfeiture under certain circumstances, including termination of employment prior to vesting.
We use the Black-Scholes option-pricing model to estimate the fair value of our employee stock options on the grant date, which takes into account the exercise price and expected term of the stock option, the current price of the underlying stock and its expected volatility, expected dividends on the stock, and the risk-free interest rate for the expected term of the stock option as of the grant date. For our restricted stock and restricted stock units, we use our closing stock price on the date of grant, or the last trading day preceding the grant date for restricted stock granted on non-trading days, as the fair value for measuring compensation expense. Stock-based compensation expense is recognized over the period in which the related employee services are rendered. The service period is generally presumed to begin on the grant date and end when the equity award is fully vested. Stock options granted to our retirement eligible employees are fully vested on the date of retirement and therefore, compensation cost for those options is recognized on the date of grant. Restricted stock granted to our retirement eligible employees are cancelled on the date of retirement. We use the graded vesting attribution method to recognize fair value of the equity award over the service period. For example, the graded vesting attribution method views one three-year option grant with annual graded vesting as three separate sub-grants, each representing 33 1/3% of the total number of stock options granted. The first sub-grant vests over one year, the second sub-grant vests over two years and the third sub-grant vests over three years. A three-year option grant with cliff vesting is viewed as one grant vesting over three years.
Stock-based compensation expense (income) recognized was $38 million, $50 million and $(1) million for the years ended December 31, 2009, 2008 and 2007, respectively. We did not record any tax benefits related to stock-based compensation expense in any period as we are not benefiting from a significant portion of our deferred tax assets, including deductions related to stock-based compensation expense. In addition, we did not capitalize any stock-based compensation expense as part of the cost of an asset for the years ended December 31, 2009, 2008 and 2007. At December 31, 2009, there was unrecognized compensation cost of $29 million related to options, $11 million related to restricted stock and nil related to restricted stock units, which is expected to be recognized over a weighted average period of 1.9 years for options, 1.7 years for restricted stock and 0.4 years for restricted stock units. We issue new shares from our reserves set aside for the Calpine Equity Incentive Plans and employment inducement options when stock options are exercised and for other stock-based awards.
A summary of all of our non-qualified stock option activity for the Calpine Equity Incentive Plans for the year ended December 31, 2009, is as follows:
| Number of Options |
Weighted Average Exercise Price |
Weighted Average Remaining Term (in years) |
Aggregate Intrinsic Value (in millions) | |||||||
| Outstanding — December 31, 2008 |
12,840,754 | $ | 19.72 | 7.5 | $ | — | ||||
| Granted |
929,651 | $ | 9.46 | |||||||
| Exercised |
— | $ | — | |||||||
| Forfeited |
259,775 | $ | 17.70 | |||||||
| Expired |
278,111 | $ | 17.29 | |||||||
| Outstanding — December 31, 2009 |
13,232,519 | $ | 19.09 | 6.6 | $ | 2 | ||||
| Exercisable — December 31, 2009 |
4,115,177 | $ | 18.71 | 7.0 | $ | — | ||||
| Vested and expected to vest — December 31, 2009 |
13,082,032 | $ | 19.14 | 6.6 | $ | 2 | ||||
170
Table of Contents
Index to Financial Statements
CALPINE CORPORATION AND SUBSIDIARIES
NOTES TO CONSOLIDATED FINANCIAL STATEMENTS — (Continued)
For the Years Ended December 31, 2009, 2008 and 2007
The total intrinsic value of our employee stock options exercised was nil for which we received approximately $1 million in cash proceeds during the year ended December 31, 2007, and there were no employee stock options exercised during the years ended December 31, 2009 and 2008.
The fair value of options granted during the years ended December 31, 2009 and 2008, was determined on the grant date using the Black-Scholes pricing model. Certain assumptions were used in order to estimate fair value for options as noted in the following table. No options were granted during the year ended December 31, 2007.
| 2009 | 2008 | |||||||
| Expected term (in years)(1) |
6.0 – 6.5 | 5.0 – 6.1 | ||||||
| Risk-free interest rate(2) |
2.3 – 2.9 | % | 1.0 – 3.3 | % | ||||
| Expected volatility(3) |
52.1 – 73.0 | % | 34.8 – 98.0 | % | ||||
| Dividend yield(4) |
— | — | ||||||
| Weighted average grant-date fair value (per option) |
$ | 5.67 | $ | 6.48 | ||||
| (1) | Expected term calculated using the simplified method prescribed by the SEC. |
| (2) | Zero Coupon U.S. Treasury rate or equivalent based on expected term. |
| (3) | For the year ended December 31, 2009, we calculated volatility using the implied volatility of our exchange traded stock options. For the year ended December 31, 2008, we calculated volatility using the weighted average implied volatility of our industry peers’ exchange traded stock options. |
| (4) | We are currently prohibited under our First Lien Credit Facility and certain of our other debt agreements from paying any cash dividends on our common stock. |
No restricted stock or restricted stock units have been granted other than under the Calpine Equity Incentive Plans. A summary of our restricted stock and restricted stock unit activity for the Calpine Equity Incentive Plans for the year ended December 31, 2009, is as follows:
| Number of Restricted Stock Awards |
Weighted Average Grant-Date Fair Value | ||||
| Nonvested — December 31, 2008 |
1,742,242 | $ | 16.69 | ||
| Granted |
1,470,358 | $ | 9.49 | ||
| Forfeited |
260,092 | $ | 13.57 | ||
| Vested |
905,909 | $ | 16.60 | ||
| Nonvested — December 31, 2009 |
2,046,599 | $ | 11.95 | ||
The total fair value of our restricted stock that vested during the years ended December 31, 2009 and 2008, was $8 million and $3 million, respectively, and no restricted stock or restricted stock units vested during the year ended December 31, 2007.
171
Table of Contents
Index to Financial Statements
CALPINE CORPORATION AND SUBSIDIARIES
NOTES TO CONSOLIDATED FINANCIAL STATEMENTS — (Continued)
For the Years Ended December 31, 2009, 2008 and 2007
14. Defined Contribution Plans
We maintain two defined contribution savings plans that are intended to be tax exempt under Sections 401(a) and 501(a) of the IRC. Our non-union plan generally covers employees who are not covered by a collective bargaining agreement, and our union plan covers employees who are covered by a collective bargaining agreement. We recorded expenses for these plans of $9 million, $10 million and $9 million for the years ending December 31, 2009, 2008 and 2007, respectively.
Beginning January 1, 2008, the employer profit sharing contribution of 3% was eliminated and the employer matching contribution was increased to 100% of the first 5% of compensation a participant defers for the non-union plan. Beginning January 1, 2007, the employee deferral limits were increased from 60% to 75% of compensation under both plans.
15. Capital Structure
Common Stock
Pursuant to our Plan of Reorganization, all shares of our common stock outstanding prior to the Effective Date were canceled, and we authorized the issuance of 485 million new shares of reorganized Calpine Corporation common stock. As of December 31, 2009, approximately 440 million shares have been distributed to holders of allowed unsecured claims and approximately 45 million shares remain in reserve for distribution to holders of disputed claims whose claims ultimately become allowed. See Note 16 for further discussion of the shares of reorganized Calpine Corporation common stock.
Our authorized common stock consists of 1.4 billion shares of Calpine Corporation common stock. Common stock issued as of December 31, 2009 and 2008, was 443,325,827 shares and 429,025,057 shares, respectively, at a par value of $0.001 per share. Common stock outstanding as of December 31, 2009 and 2008, was 442,998,255 and 428,960,025, respectively.
The table below summarizes our common stock activity since our emergence from Chapter 11 on the Effective Date. All shares of our common stock outstanding prior to the Effective Date were canceled and common stock activity prior to the Effective Date is not presented below as it is no longer meaningful.
| Shares Issued |
Shares Held in Treasury |
Shares Held in Reserve |
Inter- Creditor Disputes |
Total | |||||||||
| Implementation of our Plan of Reorganization |
410,992,508 | — | 64,255,231 | 9,752,261 | 485,000,000 | ||||||||
| Resolution of claims |
16,093,028 | — | (16,093,028 | ) | — | — | |||||||
| Exercise of warrants |
21,499 | — | — | — | 21,499 | ||||||||
| Restricted stock, net of forfeitures |
1,739,522 | — | — | — | 1,739,522 | ||||||||
| Vested restricted stock |
178,500 | (65,032 | ) | — | 113,468 | ||||||||
| Balance at December 31, 2008 |
429,025,057 | (65,032 | ) | 48,162,203 | 9,752,261 | 486,874,489 | |||||||
| Resolution of claims/inter-creditor disputes |
13,167,420 | — | (3,415,159 | ) | (9,752,261 | ) | — | ||||||
| Restricted stock, net of forfeitures |
230,161 | — | — | — | 230,161 | ||||||||
| Vested restricted stock |
903,189 | (262,540 | ) | — | — | 640,649 | |||||||
| Balance at December 31, 2009 |
443,325,827 | (327,572 | ) | 44,747,044 | — | 487,745,299 | |||||||
172
Table of Contents
Index to Financial Statements
CALPINE CORPORATION AND SUBSIDIARIES
NOTES TO CONSOLIDATED FINANCIAL STATEMENTS — (Continued)
For the Years Ended December 31, 2009, 2008 and 2007
Treasury Stock
As of December 31, 2009 and 2008, we had treasury stock of 327,572 shares and 65,032 shares, respectively, with a cost of $3 million and $1 million, respectively, which consists of our common stock withheld to satisfy federal, state and local income tax withholding requirements for employee restricted stock awards that vested in 2009 and 2008.
16. Our Emergence from Chapter 11
Summary of Proceedings
Summary of Proceedings and General Bankruptcy Matters — From the Petition Date through the Effective Date, we operated as a debtor-in-possession under the protection of the U.S. Bankruptcy Court following filings by Calpine Corporation and 274 of its wholly owned U.S. subsidiaries of voluntary petitions for relief under Chapter 11 of the Bankruptcy Code. In addition, during that period, 12 of our Canadian subsidiaries that had filed for creditor protection under the CCAA also operated as debtors-in-possession under the jurisdiction of the Canadian Court.
During the pendency of our Chapter 11 cases through the Effective Date, pursuant to automatic stay provisions under the Bankruptcy Code and orders granted by the Canadian Court, all actions to enforce or otherwise effect repayment of liabilities preceding the Petition Date as well as all pending litigation against the Calpine Debtors generally were stayed. Following the Effective Date, actions to enforce or otherwise effect repayment of liabilities preceding the Petition Date, as well as pending litigation against the Calpine Debtors related to such liabilities generally have been permanently enjoined. Any unresolved claims will continue to be subject to the claims reconciliation process under the supervision of the U.S. Bankruptcy Court. However, certain pending litigation related to pre-petition liabilities may proceed in courts other than the U.S. Bankruptcy Court to the extent the parties to such litigation have obtained relief from the permanent injunction.
Plan of Reorganization — On June 20, 2007, the U.S. Debtors filed the Debtors’ Joint Plan of Reorganization and related Disclosure Statement, which were subsequently amended on each of August 27, September 18, September 24, September 27 and December 13, 2007. On December 19, 2007, we filed the Sixth Amended Joint Plan of Reorganization. As a result of the modifications to our Plan of Reorganization as well as settlements reached by stipulation with certain creditors, all classes of creditors entitled to vote ultimately voted to approve our Plan of Reorganization. Our Plan of Reorganization, established the total enterprise value of the reorganized U.S. Debtors for purposes of our Plan of Reorganization at $18.95 billion and provided for the amendment and restatement of our certificate of incorporation and the adoption of the Calpine Equity Incentive Plans. Our Plan of Reorganization also provided for the treatment of claims against and interests in the U.S. Debtors. Allowed administrative, tax and secured claims generally have been or are being paid in cash and cash equivalents or, with respect to certain secured claims, had the collateral securing such claims returned to the secured creditor. Allowed unsecured claims generally have been or are being paid with a distribution of common stock. Pursuant to our Plan of Reorganization, 485 million shares of common stock were authorized to be issued to settle such claims.
Through the filing of this Report, approximately 440 million shares have been distributed to holders of allowed unsecured claims and approximately 45 million shares remain in reserve for distribution to holders of disputed claims whose claims ultimately become allowed. We estimate that the number of shares reserved is sufficient to satisfy the U.S. Debtors’ obligations under our Plan of Reorganization even if all disputed unsecured
173
Table of Contents
Index to Financial Statements
CALPINE CORPORATION AND SUBSIDIARIES
NOTES TO CONSOLIDATED FINANCIAL STATEMENTS — (Continued)
For the Years Ended December 31, 2009, 2008 and 2007
claims ultimately become allowed. As disputed claims are resolved, the claimants receive distributions of shares from the reserve on the same basis as if such distributions had been made on or about the Effective Date. To the extent that any of the reserved shares remain undistributed upon resolution of the remaining disputed claims, such shares will not be returned to us but rather will be distributed pro rata to claimants with allowed claims to increase their recovery. We are not required to issue additional shares above the 485 million shares authorized to settle unsecured claims, even if the shares remaining for distribution are not sufficient to fully pay all allowed unsecured claims. Accordingly, resolution of these claims could have a material effect on creditor recoveries under our Plan of Reorganization as the total number of shares of common stock that remain available for distribution upon resolution of disputed claims is limited pursuant to our Plan of Reorganization. However, certain disputed claims, including prepayment premium and default interest claims asserted by the holders of CalGen Third Lien Debt, may be required to be settled with available cash and cash equivalents to the extent reorganized Calpine Corporation common stock held in reserve pursuant to our Plan of Reorganization for such claims is insufficient in value to satisfy such claims in full. To the extent that holders of the CalGen Third Lien Debt have claims that remain unsettled or outstanding, they assert that they continue to have preferential lien rights to the assets of Calpine Generating Company, LLC (a wholly owned indirect subsidiary of ours consisting of 13 natural gas-fired power plants) that have priority over our other debt securing these assets. No assurances can be given that settlements may not be materially higher or lower than confirmed in our Plan of Reorganization or than we originally estimated.
Pursuant to our Plan of Reorganization, we were also authorized to issue up to 15 million shares under the Calpine Equity Incentive Plans, and as of December 31, 2009, approximately 11.7 million share-based awards, net of forfeitures, had been issued under the Calpine Equity Incentive Plans. Holders of allowed interests in Calpine Corporation (primarily holders of Calpine Corporation common stock existing as of the Petition Date) received a pro rata share of warrants to purchase approximately 48.5 million shares of reorganized Calpine Corporation common stock at $23.88 per share. Warrants for 21,499 shares of common stock were exercised prior to expiration. The remaining unexercised warrants expired on August 25, 2008. Proceeds received of approximately $1 million from the exercise of the warrants were recorded as additional paid-in capital.
Our common stock is listed on the NYSE. Our common stock began “when issued” trading on the NYSE under the symbol “CPN-WI” on January 16, 2008, and began “regular way” trading on the NYSE under the symbol “CPN” on February 7, 2008. Our authorized equity consists of 1.5 billion shares comprising 1.4 billion shares of common stock, par value $.001 per share, and 100 million shares of preferred stock which preferred stock may be issued in one or more series, with such voting rights and other terms as our Board of Directors determines.
In connection with the consummation of our Plan of Reorganization, we closed on our approximately $7.3 billion of First Lien Facilities, comprising the approximately $4.9 billion of outstanding loan amounts and commitments under the DIP Facility (including the $1.0 billion revolver), which were converted into exit financing under our First Lien Credit Facility, approximately $2.1 billion of additional term loan facilities under our First Lien Credit Facility and $300 million of term loans under the bridge facility. Amounts drawn under our First Lien Facilities at closing were used to fund cash payment obligations under our Plan of Reorganization including the repayment of a portion of the Second Priority Debt and the payment of administrative claims and other pre-petition claims, as well as to pay fees and expenses in connection with our First Lien Facilities and for working capital and general corporate purposes. The bridge facility was repaid in full on March 6, 2008, in accordance with its terms.
In connection with our emergence from Chapter 11, we recorded certain “plan effect” adjustments to our Consolidated Balance Sheet as of the Effective Date in order to reflect certain provisions of our Plan of
174
Table of Contents
Index to Financial Statements
CALPINE CORPORATION AND SUBSIDIARIES
NOTES TO CONSOLIDATED FINANCIAL STATEMENTS — (Continued)
For the Years Ended December 31, 2009, 2008 and 2007
Reorganization. These adjustments included the distribution of approximately $4.1 billion in cash and the authorized issuance of 485 million shares of reorganized Calpine Corporation common stock primarily for the discharge of LSTC, repayment of the Second Priority Debt and for various other administrative and other post- petition claims. As a result, our equity increased by approximately $8.9 billion. We borrowed approximately $6.4 billion under our First Lien Facilities, which was used to repay the outstanding term loan balance of $3.9 billion (excluding the unused portion under the $1.0 billion revolver) under our DIP Facility. The remaining net proceeds of approximately $2.5 billion were used to fund cash payment obligations under our Plan of Reorganization including the repayment of a portion of the Second Priority Debt and the payment of administrative claims.
CCAA Proceedings — Upon the application of the Canadian Debtors and other deconsolidated foreign entities, on February 8, 2008, the Canadian Court ordered and declared that the unsecured notes issued by ULC I were canceled and discharged on February 4, 2008; the Canadian Debtors had completed all distributions previously ordered in full satisfaction of the pre-filing claims against them; the Canadian Debtors had otherwise fully complied with all orders of the Canadian Court; and the proceedings under the CCAA were terminated, including the stay of proceedings.
Applicability of Fresh Start Accounting
At the Effective Date, we did not meet the requirements under GAAP to adopt fresh start accounting because the reorganization value of our assets exceeded the total of post-petition liabilities and allowed claims.
U.S. Debtors Condensed Combined Financial Statements
Basis of Presentation — The U.S. Debtors’ Condensed Combined Financial Statements exclude the financial statements of our consolidated subsidiaries and affiliates that were not U.S. Debtors. Transactions and balances of receivables and payables between U.S. Debtors were eliminated in consolidation.
Condensed combined financial statements of the U.S. Debtors are set forth below (in millions):
Condensed Combined Statement of Operations
For the Year Ended December 31, 2007
| 2007 | ||||
| Total revenue |
$ | 7,440 | ||
| Total cost of revenue |
7,174 | |||
| Operating (income) expense(1) |
(39 | ) | ||
| Income from operations |
305 | |||
| Interest expense |
1,606 | |||
| Other (income) expense, net |
(118 | ) | ||
| Reorganization items, net |
(3,240 | ) | ||
| Income before income taxes |
2,057 | |||
| Income tax benefit |
(346 | ) | ||
| Net income |
$ | 2,403 | ||
| (1) | Includes equity in income (loss) of affiliates. |
175
Table of Contents
Index to Financial Statements
CALPINE CORPORATION AND SUBSIDIARIES
NOTES TO CONSOLIDATED FINANCIAL STATEMENTS — (Continued)
For the Years Ended December 31, 2009, 2008 and 2007
Condensed Combined Statement of Cash Flows
For the Year Ended December 31, 2007
| 2007 | ||||
| Net cash provided by (used in): |
||||
| Operating activities |
$ | (93 | ) | |
| Investing activities |
504 | |||
| Financing activities |
404 | |||
| Net increase in cash and cash equivalents |
815 | |||
| Cash and cash equivalents, beginning of period |
883 | |||
| Cash and cash equivalents, end of period |
$ | 1,698 | ||
| Net cash paid for reorganization items included in operating activities |
$ | 126 | ||
| Net cash received from reorganization items included in investing activities |
$ | (576 | ) | |
| Net cash paid for reorganization items included in financing activities |
$ | 74 | ||
Interest Expense — We recorded $135 million in post-petition interest from January 1, 2008, through the Effective Date. As our Plan of Reorganization was confirmed on December 19, 2007, we recorded interest expense in December 2007 for allowed claims under our Plan of Reorganization of $347 million related to post-petition interest on LSTC incurred from the Petition Date through December 31, 2007. This amount represents non-cash value to be satisfied through distributions of shares of Calpine Corporation’s reorganized common stock. Prior to recording the post-petition interest on LSTC in December 2007, interest expense related to pre-petition LSTC was reported only to the extent that it was paid during the pendency of our Chapter 11 cases or was permitted by the Cash Collateral Order or other orders of the U.S. Bankruptcy Court. Contractual interest (at non-default rates) owed to unrelated parties on pre-petition LSTC not reflected on our Consolidated Financial Statements was $157 million for the year ended December 31, 2007. Additionally, we made periodic cash adequate protection payments to the holders of Second Priority Debt; originally payments were made only through June 30, 2006, but, by order entered December 28, 2006, the U.S. Bankruptcy Court modified the Cash Collateral Order to provide for periodic adequate protection payments on a quarterly basis to the holders of the Second Priority Debt through December 31, 2007. Upon confirmation of our Plan of Reorganization, the obligations to the holders of the Second Priority Debt were fully satisfied. Therefore, we have reported the full amount of the adequate protection payments as interest expense on our Consolidated Statements of Operations together with the remaining contractual interest through December 31, 2007, on the Second Priority Debt.
Reorganization Items
Reorganization items represent the direct and incremental costs related to our Chapter 11 cases. These include professional and trustee fees, pre-petition liability claim adjustments and losses that are probable and can be estimated, net of interest income earned on accumulated cash during the Chapter 11 process and net of gains on the sale of assets or resulting from certain settlement agreements related to our restructuring activities. We expect to continue to pay professional and trustee fees related to our Chapter 11 cases through 2010 and thereafter until the claims resolution process is completed and our Chapter 11 case is formally dismissed by the U.S. Bankruptcy Court; however, we do not expect such fees to be material in the future and do not anticipate that we will separately report future fees as reorganization items on our Consolidated Statements of Operations beginning in 2010.
176
Table of Contents
Index to Financial Statements
CALPINE CORPORATION AND SUBSIDIARIES
NOTES TO CONSOLIDATED FINANCIAL STATEMENTS — (Continued)
For the Years Ended December 31, 2009, 2008 and 2007
The table below lists the significant components of reorganization items for the years ended December 31, 2009, 2008 and 2007 (in millions):
| 2009 | 2008 | 2007 | ||||||||||
| Provision for expected allowed claims |
$ | (2 | ) | $ | (95 | ) | $ | (3,687 | ) | |||
| Professional and trustee fees |
1 | 85 | 217 | |||||||||
| Gains on asset sales |
— | (206 | ) | (285 | ) | |||||||
| Asset impairments |
— | — | 120 | |||||||||
| Gain on reconsolidation of Canadian Debtors and other deconsolidated foreign entities |
— | (71 | ) | — | ||||||||
| DIP Facility and First Lien Facilities financing and CalGen Secured Debt repayment costs |
— | (4 | ) | 202 | ||||||||
| Interest (income) on accumulated cash |
— | (7 | ) | (59 | ) | |||||||
| Other |
— | (4 | ) | 234 | ||||||||
| Total reorganization items |
$ | (1 | ) | $ | (302 | ) | $ | (3,258 | ) | |||
Provision for Expected Allowed Claims — Represents the change in our estimate of the expected allowed claims. During the year ended December 31, 2008, our provision for expected allowed claims consisted primarily of a $62 million credit related to the settlement of claims with the Canadian Debtors and other deconsolidated foreign entities, a $12 million credit related to our settlement with Rosetta and a $34 million credit for RockGen from a prior period which we determined was not material to any period. During the year ended December 31, 2007, our provision for expected allowed claims consisted primarily of a credit of $4.1 billion resulting from the Canadian Settlement Agreement.
Gains on Asset Sales — Represents gains on the sales of the Hillabee and Fremont development project assets for the year ended December 31, 2008. See Note 6 for further discussion of our sales of Hillabee and Fremont. The sales of these assets and utilization of the sales proceeds to repay our $300 million bridge facility were part of our Plan of Reorganization and are included in reorganization items even though the sales closed subsequent to the Effective Date. The amounts recorded for the year ended December 31, 2007, primarily represent the gains recorded on the sales of the assets of Aries Power Plant, Goldendale Energy Center and PSM.
Asset Impairments — Impairment charges for the year ended December 31, 2007, primarily relate to recording our interest in Acadia PP at fair value less costs to sell.
Other — Other reorganization items consist primarily of adjustments for foreign exchange rate changes on LSTC denominated in a foreign currency and governed by foreign law, employee severance and emergence incentive costs during the year ended December 31, 2007.
17. Commitments and Contingencies
Long-Term Service Agreements
As of December 31, 2009, the total estimated commitments for LTSAs associated with turbines installed or in storage were approximately $84 million. These commitments are payable over the terms of the respective agreements, which range from 1 to 7 years. LTSA future commitment estimates are based on the stated payment terms in the contracts at the time of execution and are subject to an annual inflationary adjustment. Certain of
177
Table of Contents
Index to Financial Statements
CALPINE CORPORATION AND SUBSIDIARIES
NOTES TO CONSOLIDATED FINANCIAL STATEMENTS — (Continued)
For the Years Ended December 31, 2009, 2008 and 2007
these agreements have terms that allow us to cancel the contracts for a fee. If we cancel such contracts, the estimated commitments remaining for LTSAs would be reduced. We had no LTSA cancellation charges for the years ended December 31, 2009, 2008 and 2007.
Power Plant Operating Leases
We have entered into certain long-term operating leases for power plants, extending through 2049, including renewal options. Some of the lease agreements provide for renewal options at fair value, and some of the agreements contain customary restrictions on dividends, additional debt and further encumbrances similar to those typically found in project finance agreements. Payments on our operating leases, which may contain escalation clauses or step rent provisions, are recognized on a straight-line basis. Certain capital improvements associated with leased power plants may be deemed to be leasehold improvements and are amortized over the shorter of the term of the lease or the economic life of the capital improvement. Future minimum lease payments under these leases are as follows (in millions):
| Initial Year |
2010 | 2011 | 2012 | 2013 | 2014 | Thereafter | Total | ||||||||||||||||
| Watsonville |
1995 | $ | 1 | $ | — | $ | — | $ | — | $ | — | $ | — | $ | 1 | ||||||||
| Greenleaf |
1998 | 7 | 7 | 7 | 7 | 3 | — | 31 | |||||||||||||||
| KIAC |
2000 | 25 | 25 | 24 | 24 | 24 | 119 | 241 | |||||||||||||||
| South Point |
2001 | 10 | 67 | 5 | 5 | 5 | 216 | 308 | |||||||||||||||
| Total |
$ | 43 | $ | 99 | $ | 36 | $ | 36 | $ | 32 | $ | 335 | $ | 581 | |||||||||
During the years ended December 31, 2009, 2008 and 2007, rent expense for power plant operating leases amounted to $47 million, $46 million and $54 million, respectively. As of December 31, 2009, we guarantee $308 million of the total future minimum lease payments of our consolidated subsidiaries.
Production Royalties and Leases
We are committed under numerous geothermal leases and right-of-way, easement and surface agreements. The geothermal leases generally provide for royalties based on production revenue with reductions for property taxes paid. The right-of-way, easement and surface agreements are based on flat rates or adjusted based on Consumer Price Index changes and are not material. Under the terms of most geothermal leases, the royalties accrue as a percentage of power revenues. Certain properties also have net profits and overriding royalty interests that are in addition to the land base lease royalties. Some lease agreements contain clauses providing for minimum lease payments to lessors if production temporarily ceases or if production falls below a specified level.
Production royalties for natural gas-fired and geothermal power plants for the years ended December 31, 2009, 2008 and 2007, were $22 million, $33 million and $27 million, respectively.
178
Table of Contents
Index to Financial Statements
CALPINE CORPORATION AND SUBSIDIARIES
NOTES TO CONSOLIDATED FINANCIAL STATEMENTS — (Continued)
For the Years Ended December 31, 2009, 2008 and 2007
Office and Equipment Leases
We lease our corporate, regional and satellite offices, as well as some of our office equipment, under noncancellable operating leases extending through 2014. Future minimum lease payments under these leases are as follows (in millions):
| 2010 |
$ | 15 | |
| 2011 |
13 | ||
| 2012 |
12 | ||
| 2013 |
11 | ||
| 2014 |
1 | ||
| Thereafter |
— | ||
| Total |
$ | 52 | |
Lease payments are subject to adjustments for our pro rata portion of annual increases or decreases in building operating costs. During the years ended December 31, 2009, 2008 and 2007, rent expense for noncancellable operating leases was $12 million, $14 million and $10 million, respectively.
Natural Gas Purchases
We enter into natural gas purchase contracts of various terms with third parties to supply natural gas to our natural gas-fired cogeneration projects. The majority of our purchases are made in the spot market or under index-priced contracts. At December 31, 2009, we had future commitments of approximately $4.7 billion of notional volume for natural gas purchases under contracts with terms from 1 to 16 years, and one contract with a term of 31 years.
Guarantee Commitments
As part of our normal business operations, we enter into various agreements providing, or otherwise arranging, financial or performance assurance to third parties on behalf of our subsidiaries in the ordinary course of such subsidiaries’ respective business. Such arrangements include guarantees, standby letters of credit and surety bonds for power and natural gas purchase and sale arrangements and contracts associated with the development, construction, operation and maintenance of our fleet of power plants. These arrangements are entered into primarily to support or enhance the creditworthiness otherwise attributed to a subsidiary on a stand-alone basis, thereby facilitating the extension of sufficient credit to accomplish the subsidiaries’ intended commercial purposes.
At December 31, 2009, guarantees of subsidiary debt, standby letters of credit and surety bonds to third parties and guarantees of subsidiary operating lease payments and their respective expiration dates were as follows (in millions):
| Guarantee Commitments |
2010 | 2011 | 2012 | 2013 | 2014 | Thereafter | Total | ||||||||||||||
| Guarantee of subsidiary debt(1) |
$ | 73 | $ | 72 | $ | 70 | $ | 66 | $ | 54 | $ | 647 | $ | 982 | |||||||
| Standby letters of credit(2)(4) |
384 | 28 | — | — | — | — | 412 | ||||||||||||||
| Surety bonds(3)(4)(5) |
— | — | — | — | — | 4 | 4 | ||||||||||||||
| Guarantee of subsidiary operating lease payments(4) |
10 | 67 | 5 | 5 | 5 | 216 | 308 | ||||||||||||||
| Total |
$ | 467 | $ | 167 | $ | 75 | $ | 71 | $ | 59 | $ | 867 | $ | 1,706 | |||||||
| (1) | Represents Calpine Corporation guarantees of certain power plant capital leases and related interest. All guaranteed capital leases are recorded on our Consolidated Balance Sheets. |
179
Table of Contents
Index to Financial Statements
CALPINE CORPORATION AND SUBSIDIARIES
NOTES TO CONSOLIDATED FINANCIAL STATEMENTS — (Continued)
For the Years Ended December 31, 2009, 2008 and 2007
| (2) | The standby letters of credit disclosed above represent those disclosed in Note 7. |
| (3) | The majority of surety bonds do not have expiration or cancellation dates. |
| (4) | These are off balance sheet obligations. |
| (5) | As of December 31, 2009, $4 million of cash collateral is outstanding related to these bonds. |
We routinely arrange for the issuance of letters of credit and various forms of surety bonds to third parties in support of our subsidiaries’ contractual arrangements of the types described above and may guarantee the operating performance of some of our partially owned subsidiaries up to our ownership percentage. The letters of credit issued under various credit facilities support CES risk management and other operational and construction activities. In the event a subsidiary were to fail to perform its obligations under a contract supported by such a letter of credit or surety bond, and the issuing bank or surety were to make payment to the third party, we would be responsible for reimbursing the issuing bank or surety within an agreed timeframe, typically a period of one to ten days. To the extent liabilities are incurred as a result of activities covered by letters of credit or the surety bonds, such liabilities are included on our Consolidated Balance Sheets.
In connection with our purchase and sale agreements, we have frequently provided for indemnification by each of the purchaser and the seller, and/or their respective parent, to the counterparty for liabilities incurred as a result of a breach of a representation or warranty by the indemnifying party. These indemnification obligations generally have a discrete term and are intended to protect the parties against risks that are difficult to predict or impossible to quantify at the time of the consummation of a particular transaction.
Additionally, we and our subsidiaries from time to time assume other indemnification obligations in conjunction with transactions other than purchase or sale transactions. These indemnification obligations generally have a discrete term and are intended to protect our counterparties against risks that are difficult to predict or impossible to quantify at the time of the consummation of a particular transaction, such as the costs associated with litigation that may result from the transaction.
Litigation
We are party to various litigation matters, including regulatory and administrative proceedings arising out of the normal course of business, the more significant of which are summarized below. The ultimate outcome of each of these matters cannot presently be determined, nor can the liability that could potentially result from a negative outcome be reasonably estimated presently for every case. The liability we may ultimately incur with respect to any one of these matters in the event of a negative outcome may be in excess of amounts currently accrued with respect to such matters and, as a result of these matters, may potentially be material to our financial position or results of operations. We review our litigation activities and determine if an unfavorable outcome to us is considered “remote,” “reasonably possible” or “probable” as defined by GAAP. Where we have determined an unfavorable outcome is probable and is reasonably estimable, we have accrued for potential litigation losses. During the pendency of our Chapter 11 cases through the Effective Date, pursuant to automatic stay provisions under the Bankruptcy Code and orders granted by the Canadian Court, all actions to enforce or otherwise effect repayment of liabilities preceding the Petition Date, as well as all pending litigation against the Calpine Debtors, generally were stayed. Following the Effective Date, pending actions to enforce or otherwise effect repayment of
180
Table of Contents
Index to Financial Statements
CALPINE CORPORATION AND SUBSIDIARIES
NOTES TO CONSOLIDATED FINANCIAL STATEMENTS — (Continued)
For the Years Ended December 31, 2009, 2008 and 2007
liabilities preceding the Petition Date, as well as pending litigation against the U.S. Debtors related to such liabilities, generally have been permanently enjoined. Any unresolved claims will continue to be subject to the claims reconciliation process under the supervision of the U.S. Bankruptcy Court. However, certain pending litigation related to pre-petition liabilities may proceed in courts other than the U.S. Bankruptcy Court to the extent the parties to such litigation have obtained relief from the permanent injunction. In particular, certain pending actions against us are anticipated to proceed as described below. See Note 16 for information regarding our emergence from our Chapter 11 and our CCAA proceedings. In addition to the Chapter 11 cases and CCAA proceedings (in connection with which certain of the matters described below arose), and the other matters described below, we are involved in various other claims and legal actions, including regulatory and administrative proceedings arising out of the normal course of our business. We do not expect that the outcome of such other claims and legal actions will have a material adverse effect on our financial position or results of operations.
Hawaii Structural Ironworkers Pension Fund v. Calpine, et al. — This case was filed in San Diego County Superior Court on March 11, 2003, and later transferred, on a defense motion, to Santa Clara County Superior Court. Defendants in this case are Calpine Corporation, Peter Cartwright, Ann B. Curtis, John Wilson, Kenneth Derr, George Stathakis, Credit Suisse First Boston LLC, Banc of America Securities LLC, Deutsche Bank Securities, Inc. and Goldman Sachs & Co. The Hawaii Structural Ironworkers Pension Trust Fund alleges that the prospectus and registration statement for an April 2002 offering of Calpine Corporation securities contained false or misleading statements. The action was temporarily stayed during Calpine Corporation’s Chapter 11 filings.
On December 19, 2007, Calpine Corporation entered into an agreement with the Hawaii Structural Ironworkers Pension Trust Fund to allow the action to proceed to the extent there was insurance coverage available to Calpine Corporation.
The parties attended mediation on June 1, 2009, and settlement discussions continued thereafter. On October 12, 2009, the parties executed a Stipulation of Settlement, which settled the matter for $43 million contingent upon court approval. Pursuant to the December 19, 2007 agreement, Calpine Corporation’s portion of the settlement is to be satisfied solely from applicable insurance coverage and will not require cash payment from Calpine. Preliminary approval of the class action settlement was granted by Santa Clara Superior Court on October 26, 2009, and final approval was ordered by the Santa Clara Superior Court on February 3, 2010. We now consider this matter closed.
Pit River Tribe, et al. v. Bureau of Land Management, et al. — On June 17, 2002, the Pit River Tribe filed suit against the BLM and other federal agencies in the U.S. District Court for the Eastern District of California seeking to enjoin further exploration, construction and development of the Calpine Fourmile Hill Project in the Glass Mountain and Medicine Lake geothermal areas. The complaint challenged the validity of the decisions of the BLM and the U.S. Forest Service to permit the development of the proposed project under two geothermal mineral leases previously issued by the BLM. The lawsuit also sought to invalidate the leases. Only declaratory and equitable relief was sought.
The case was temporarily stayed during our Chapter 11 case; however, we and the Pit River Tribe filed a stipulation to lift the automatic stay. On November 5, 2006, the U.S. Court of Appeals for the Ninth Circuit issued a decision granting the plaintiffs relief by holding that the BLM had not complied with the National Environmental Policy Act, and other procedural requirements and, therefore, held that the lease extensions were invalid. The U.S. Court of Appeals for the Ninth Circuit remanded the matter back to the U.S. District Court to implement its decision.
181
Table of Contents
Index to Financial Statements
CALPINE CORPORATION AND SUBSIDIARIES
NOTES TO CONSOLIDATED FINANCIAL STATEMENTS — (Continued)
For the Years Ended December 31, 2009, 2008 and 2007
On December 22, 2008, the U.S. District Court ruled that the lease extension for the two Fourmile Hill leases and the approval to construct a proposed 49.9 MW Fourmile Hill power plant should be remanded to the federal agencies for curative action. The Pit River Tribe timely appealed the Court’s December 22, 2008 order. Briefing of the appeal is complete and we were granted our motion for an expedited hearing. The U.S. Court of Appeals for the Ninth Circuit hearing on the merits of the Pit River Tribe’s appeal is scheduled to be heard on March 10, 2010.
Appeal of Confirmation Order — Several parties filed appeals in the U.S. District Court for the Southern District of New York seeking reconsideration of the Confirmation Order of the U.S. Bankruptcy Court, despite the effectiveness of our Plan of Reorganization. On June 6, 2008, the U.S. District Court for the Southern District of New York entered an order denying the appeals, finding that all of the appeals were equitably moot. One of the shareholders (Mr. Felluss) filed a motion for reconsideration, which was denied on June 24, 2008. On July 3, 2008, Mr. Felluss filed a notice of appeal with the Second Circuit. In addition, on August 8, 2008, Mr. Felluss filed a motion with the Second Circuit seeking to stay the expiration of the warrants that had been issued pursuant to our Plan of Reorganization and were scheduled to expire August 25, 2008; the Second Circuit denied that motion on August 27, 2008. Mr. Felluss’ appeal was heard by the Second Circuit on November 10, 2009, and denied by Summary Order on November 25, 2009. On December 25, 2009, Mr. Felluss filed a petition for rehearing with the Second Circuit. On January 11, 2010, the Second Circuit denied the petition. Unless Mr. Felluss files a petition for review with the U.S. Supreme Court in the next 90 days, we will consider this matter closed.
Environmental Matters
We are subject to complex and stringent environmental laws and regulations related to the operation of our power plants. On occasion, we may incur environmental fees, penalties and fines associated with the normal operation of our power plants. We do not, however, have environmental violations or other matters that would have a material impact on our financial condition, results of operations or cash flows or that would significantly change our operations. A summary of our larger environmental matters are as follows:
Texas City and Clear Lake Environmental Matters — As part of an internal review of our Texas City and Clear Lake power plants, we determined that these power plants were in violation of the requirements of the Acid Rain Program found in Title 40 of the U.S. Federal Code of Regulations, Parts 72-78. We self-reported the excess emissions to the Texas Commission on Environmental Quality, or TCEQ, and the EPA, and paid the appropriate fees. Compliance agreements between each power plant and the TCEQ were executed on September 26, 2008, and limit enforcement by the TCEQ. The EPA does have authority and discretion to issue substantial fines that could be material; however, based on the circumstances and on consideration of recent cases addressed by the agencies involved, we do not believe that the maximum penalty will be assessed or that penalties, if any, resulting from these matters will have a material adverse effect on our business, financial condition or results of operations.
San Diego Air Pollution Control District — The San Diego Air Pollution Control District issued OMEC a notice of violation on August 28, 2009, for failing to install an auxiliary boiler required by the permit issued by the San Diego Air Pollution Control District. OMEC entered into a compliance agreement on September 18, 2009, under which it paid the San Diego Air Pollution Control District a civil penalty, made a contribution to the San Diego Air Pollution Control District’s Air Quality Improvement Trust Fund, and agreed to install an auxiliary boiler by November 30, 2009 and to install control system software to reduce emissions occurring during gas turbine startup. As of December 31, 2009, we have satisfied all of the terms of the compliance agreement and consider this matter closed.
182
Table of Contents
Index to Financial Statements
CALPINE CORPORATION AND SUBSIDIARIES
NOTES TO CONSOLIDATED FINANCIAL STATEMENTS — (Continued)
For the Years Ended December 31, 2009, 2008 and 2007
Other Contingencies
Lyondell Bankruptcy — On January 6, 2009, Lyondell Chemical Co. and certain of its subsidiaries, including Houston Refining LP, filed for protection under Chapter 11 in the U.S. Bankruptcy Court. Channel Energy Center, a 608 MW natural gas-fired cogeneration power plant located in Houston, Texas, leases its project site from Houston Refining LP and is granted certain easements in, over, under and on the site pursuant to the lease. Channel Energy Center provides power and steam to Houston Refining LP pursuant to a power services agreement and, pursuant to a power plant services agreement, provides clarified water and treated water to Houston Refining LP. Channel Energy Center is provided with raw water, refinery gas and certain other power plant services by Houston Refining LP.
The Lyondell debtors may exercise their right under the Bankruptcy Code to reject the lease, the power services agreement and/or the power plant services agreement. The potential damages to us if any or all of these agreements are rejected are uncertain and would represent an unsecured bankruptcy claim with Lyondell. To the extent that any such damages would be recoverable under the laws of the State of Texas, the governing law under the agreements, they would be treated as an unsecured claim against the Lyondell debtors in bankruptcy. The percentage of recovery on unsecured claims in the Lyondell bankruptcy is unknown at this time, but is expected to be low.
We continue to monitor this matter closely and will seek vigorously to protect our rights under our various agreements with the Lyondell debtors.
18. Segment and Significant Customer Information
We are an independent wholesale power company. We own and operate natural gas-fired and geothermal power plants in North America and have a significant presence in the major competitive power markets in the U.S., including California and Texas. We assess our business on a regional basis due to the impact on our financial performance of the differing characteristics of these regions, particularly with respect to competition, regulation and other factors impacting supply and demand. Our reportable segments are West (including geothermal), Texas, Southeast and North (including Canada). We continue to evaluate the optimal manner in which we assess our performance including our segments and future changes may result.
Commodity Margin includes our power and steam revenues, sales of purchased power and natural gas, capacity revenue, REC revenue, sales of surplus emission allowances, transmission revenue and expenses, fuel and purchased energy expense, RGGI compliance costs, and cash settlements from our marketing, hedging and optimization activities that are included in mark-to-market activity, but excludes the unrealized portion of our mark-to-market activity and other revenue. Commodity Margin is a key operational measure reviewed by our chief operating decision maker to assess the performance of our segments.
183
Table of Contents
Index to Financial Statements
CALPINE CORPORATION AND SUBSIDIARIES
NOTES TO CONSOLIDATED FINANCIAL STATEMENTS — (Continued)
For the Years Ended December 31, 2009, 2008 and 2007
During the first quarter of 2009, we began assessing the performance of our regional segments to include the allocation (based upon each regional segment’s MWh) of revenues and expenses from our fuel management, Turbine Maintenance Group and certain non-region specific natural gas marketing and optimization and other corporate activities, which had formerly been separately reported as our “Other” segment. Additionally, we have modified our definition of Commodity Margin to include cash settlements from our marketing, hedging and optimization activities that were previously included in mark-to-market activity. Our 2008 and 2007 segment information has been reclassified to conform to the current year presentation. Financial data for our segments were as follows (in millions):
| Year Ended December 31, 2009 | ||||||||||||||||||||||
| West | Texas | Southeast | North | Consolidation and Elimination |
Total | |||||||||||||||||
| Revenues from external customers |
$ | 3,412 | $ | 1,816 | $ | 778 | $ | 558 | $ | — | $ | 6,564 | ||||||||||
| Intersegment revenues |
28 | 63 | 97 | 16 | (204 | ) | — | |||||||||||||||
| Total operating revenues |
$ | 3,440 | $ | 1,879 | $ | 875 | $ | 574 | $ | (204 | ) | $ | 6,564 | |||||||||
| Commodity Margin |
$ | 1,346 | $ | 644 | $ | 304 | $ | 268 | $ | — | $ | 2,562 | ||||||||||
| Add: Mark-to-market commodity activity, net and other revenue(1) |
143 | (40 | ) | (5 | ) | 46 | (44 | ) | 100 | |||||||||||||
| Less: |
||||||||||||||||||||||
| Plant operating expense |
437 | 232 | 134 | 91 | 3 | 897 | ||||||||||||||||
| Depreciation and amortization expense |
205 | 125 | 79 | 66 | (8 | ) | 467 | |||||||||||||||
| Other cost of revenue(2) |
62 | 13 | 10 | 30 | (32 | ) | 83 | |||||||||||||||
| Gross profit |
785 | 234 | 76 | 127 | (7 | ) | 1,215 | |||||||||||||||
| Other operating expenses |
53 | 68 | 29 | 1 | — | 151 | ||||||||||||||||
| Income from operations |
732 | 166 | 47 | 126 | (7 | ) | 1,064 | |||||||||||||||
| Interest expense, net of interest income |
813 | |||||||||||||||||||||
| Debt extinguishment costs and other (income) expense, net |
92 | |||||||||||||||||||||
| Income before reorganization items and income taxes |
159 | |||||||||||||||||||||
| Reorganization items |
(1 | ) | ||||||||||||||||||||
| Income before income taxes |
$ | 160 | ||||||||||||||||||||
184
Table of Contents
Index to Financial Statements
CALPINE CORPORATION AND SUBSIDIARIES
NOTES TO CONSOLIDATED FINANCIAL STATEMENTS — (Continued)
For the Years Ended December 31, 2009, 2008 and 2007
| Year Ended December 31, 2008 | |||||||||||||||||||||||
| West | Texas | Southeast | North | Consolidation and Elimination |
Total | ||||||||||||||||||
| Revenues from external customers |
$ | 4,243 | $ | 3,806 | $ | 1,245 | $ | 643 | $ | — | $ | 9,937 | |||||||||||
| Intersegment revenues |
49 | 252 | 229 | 25 | (555 | ) | — | ||||||||||||||||
| Total operating revenues |
$ | 4,292 | $ | 4,058 | $ | 1,474 | $ | 668 | $ | (555 | ) | $ | 9,937 | ||||||||||
| Commodity Margin |
$ | 1,255 | $ | 726 | $ | 264 | $ | 279 | $ | — | $ | 2,524 | |||||||||||
| Add: Mark-to-market commodity activity, net and other revenue(1) |
(31 | ) | 195 | 36 | (40 | ) | (28 | ) | 132 | ||||||||||||||
| Less: |
|||||||||||||||||||||||
| Plant operating expense |
434 | 267 | 128 | 108 | (19 | ) | 918 | ||||||||||||||||
| Depreciation and amortization expense |
190 | 124 | 69 | 56 | (6 | ) | 433 | ||||||||||||||||
| Other cost of revenue(2) |
71 | 12 | 59 | 26 | (21 | ) | 147 | ||||||||||||||||
| Gross profit |
529 | 518 | 44 | 49 | 18 | 1,158 | |||||||||||||||||
| Other operating expenses |
155 | 91 | 212 | 12 | — | 470 | |||||||||||||||||
| Income (loss) from operations |
374 | 427 | (168 | ) | 37 | 18 | 688 | ||||||||||||||||
| Interest expense, net of interest income |
1,024 | ||||||||||||||||||||||
| Debt extinguishment costs and other (income) expense, net |
27 | ||||||||||||||||||||||
| Loss before reorganization items, income taxes and discontinued operations |
(363 | ) | |||||||||||||||||||||
| Reorganization items |
(302 | ) | |||||||||||||||||||||
| Loss before income taxes and discontinued operations |
$ | (61 | ) | ||||||||||||||||||||
185
Table of Contents
Index to Financial Statements
CALPINE CORPORATION AND SUBSIDIARIES
NOTES TO CONSOLIDATED FINANCIAL STATEMENTS — (Continued)
For the Years Ended December 31, 2009, 2008 and 2007
| Year Ended December 31, 2007 | |||||||||||||||||||||
| West | Texas | Southeast | North | Consolidation and Elimination |
Total | ||||||||||||||||
| Revenues from external customers |
$ | 3,649 | $ | 2,665 | $ | 1,036 | $ | 620 | $ | — | $ | 7,970 | |||||||||
| Intersegment revenues |
50 | 15 | 144 | 12 | (221 | ) | — | ||||||||||||||
| Total operating revenues |
$ | 3,699 | $ | 2,680 | $ | 1,180 | $ | 632 | $ | (221 | ) | $ | 7,970 | ||||||||
| Commodity Margin |
$ | 1,172 | $ | 505 | $ | 256 | $ | 278 | $ | — | $ | 2,211 | |||||||||
| Add: Mark-to-market commodity activity, net and other revenue(1) |
51 | 57 | 14 | 2 | (48 | ) | 76 | ||||||||||||||
| Less: |
|||||||||||||||||||||
| Plant operating expense |
346 | 193 | 133 | 88 | (11 | ) | 749 | ||||||||||||||
| Depreciation and amortization expense |
209 | 123 | 79 | 55 | (3 | ) | 463 | ||||||||||||||
| Other cost of revenue(2) |
68 | 9 | 35 | 69 | (1 | ) | 180 | ||||||||||||||
| Gross profit |
600 | 237 | 23 | 68 | (33 | ) | 895 | ||||||||||||||
| Other operating expenses |
93 | 62 | 35 | 30 | (30 | ) | 190 | ||||||||||||||
| Income (loss) from operations |
507 | 175 | (12 | ) | 38 | (3 | ) | 705 | |||||||||||||
| Interest expense, net of interest income |
1,955 | ||||||||||||||||||||
| Debt extinguishment costs and other (income) expense, net |
(139 | ) | |||||||||||||||||||
| Loss before reorganization items and income taxes |
(1,111 | ) | |||||||||||||||||||
| Reorganization items |
(3,258 | ) | |||||||||||||||||||
| Income before income taxes |
$ | 2,147 | |||||||||||||||||||
| (1) | Mark-to-market commodity activity represents the unrealized portion of our mark-to-market activity, net, as well as a non-cash gain from amortization of prepaid power sales agreements included in operating revenues and fuel and purchased energy expense on our Consolidated Statements of Operations. |
| (2) | Excludes $5 million of RGGI compliance costs for the year ended December 31, 2009, and nil for the years ended December 31, 2008 and 2007, respectively, which were included as a component of Commodity Margin, and includes operating asset impairments of $4 million, $33 million and $44 million for the years ended December 31, 2009, 2008 and 2007, respectively. |
186
Table of Contents
Index to Financial Statements
CALPINE CORPORATION AND SUBSIDIARIES
NOTES TO CONSOLIDATED FINANCIAL STATEMENTS — (Continued)
For the Years Ended December 31, 2009, 2008 and 2007
Significant Customer
We did not have a customer that accounted for more than 10% of our annual consolidated revenues for the years ended December 31, 2009 and 2008. For the year ended December 31, 2007, we had one significant customer that accounted for more than 10% of our annual consolidated revenues: CDWR. CDWR revenues were $1.1 billion for the year ended December 31, 2007. Our receivables from CDWR were $95 million as of December 31, 2007. CDWR revenues were attributable to our West segment.
19. Quarterly Consolidated Financial Data (unaudited)
Our quarterly operating results have fluctuated in the past and may continue to do so in the future as a result of a number of factors, including, but not limited to, our restructuring activities including asset sales, the completion of development projects, the timing and amount of curtailment of operations under the terms of certain PPAs, the degree of risk management and marketing, hedging and optimization activities, and variations in levels of production. Furthermore, the majority of the dollar value of capacity payments under certain of our PPAs are received during the months of May through October.
| Quarter Ended | |||||||||||||||
| December 31 | September 30 | June 30 | March 31 | ||||||||||||
| (in millions, except per share amounts) | |||||||||||||||
| 2009 |
|||||||||||||||
| Operating revenues |
$ | 1,569 | $ | 1,847 | $ | 1,471 | $ | 1,677 | |||||||
| Gross profit |
234 | 493 | 206 | 282 | |||||||||||
| Income from operations |
201 | 437 | 175 | 251 | |||||||||||
| Net income (loss) attributable to Calpine |
$ | (43 | ) | $ | 238 | $ | (78 | ) | $ | 32 | |||||
| Basic earnings (loss) per common share: |
|||||||||||||||
| Net income (loss) attributable to Calpine |
$ | (0.09 | ) | $ | 0.49 | $ | (0.16 | ) | $ | 0.07 | |||||
| Diluted earnings (loss) per common share: |
|||||||||||||||
| Net income (loss) attributable to Calpine |
$ | (0.09 | ) | $ | 0.49 | $ | (0.16 | ) | $ | 0.07 | |||||
| 2008 |
|||||||||||||||
| Operating revenues |
$ | 1,968 | $ | 3,190 | $ | 2,828 | $ | 1,951 | |||||||
| Gross profit (loss) |
177 | 534 | 476 | (29 | ) | ||||||||||
| Income (loss) from operations(1) |
65 | 272 | 433 | (82 | ) | ||||||||||
| Income (loss) before discontinued operations attributable to Calpine |
(132 | ) | 136 | 197 | (214 | ) | |||||||||
| Discontinued operations, net of tax |
23 | — | — | — | |||||||||||
| Net income (loss) attributable to Calpine |
$ | (109 | ) | $ | 136 | $ | 197 | $ | (214 | ) | |||||
| Basic earnings (loss) per common share: |
|||||||||||||||
| Income (loss) before discontinued operations |
$ | (0.27 | ) | $ | 0.28 | $ | 0.41 | $ | (0.44 | ) | |||||
| Discontinued operations, net of tax, attributable to Calpine |
0.05 | — | — | — | |||||||||||
| Net income (loss) attributable to Calpine |
$ | (0.22 | ) | $ | 0.28 | $ | 0.41 | $ | (0.44 | ) | |||||
| Diluted earnings (loss) per common share: |
|||||||||||||||
| Income (loss) before discontinued operations attributable to Calpine |
$ | (0.27 | ) | $ | 0.28 | $ | 0.41 | $ | (0.44 | ) | |||||
| Discontinued operations, net of tax, attributable to Calpine |
0.05 | — | — | — | |||||||||||
| Net income (loss) attributable to Calpine |
$ | (0.22 | ) | $ | 0.28 | $ | 0.41 | $ | (0.44 | ) | |||||
| (1) | As a result of the anticipated sale of Auburndale during 2008, we recorded an impairment loss of approximately $180 million, which is included in income from operations on our 2008 Consolidated Statements of Operations. See Notes 4 and 6 for more information. |
187
Table of Contents
Index to Financial Statements
CALPINE CORPORATION AND SUBSIDIARIES
SCHEDULE II VALUATION AND QUALIFYING ACCOUNTS
| Description |
Balance at Beginning of Year |
Charged to Expense |
Charged to AOCI |
Reductions(1) | Other(2) | Balance at End of Year | ||||||||||||||
| (in millions) | ||||||||||||||||||||
| Year ended December 31, 2009 |
||||||||||||||||||||
| Allowance for doubtful accounts |
$ | 42 | $ | 2 | $ | — | $ | (30) | $ | — | $ | 14 | ||||||||
| Deferred tax asset valuation allowance |
2,685 | (113 | ) | — | — | — | 2,572 | |||||||||||||
| Year ended December 31, 2008 |
||||||||||||||||||||
| Allowance for doubtful accounts |
$ | 54 | $ | 15 | $ | — | $ | (27 | ) | $ | — | $ | 42 | |||||||
| Allowance for doubtful accounts with related party Canadian Debtors and other deconsolidated foreign entities |
10 | — | — | (10 | ) | — | — | |||||||||||||
| Reserve for notes receivable |
39 | — | — | (39 | ) | — | — | |||||||||||||
| Reserve for interest and notes receivable with related party Canadian Debtors and other deconsolidated foreign entities |
83 | — | — | (83 | ) | — | — | |||||||||||||
| Deferred tax asset valuation allowance |
2,401 | (194 | ) | — | — | 478 | 2,685 | |||||||||||||
| Year ended December 31, 2007 |
||||||||||||||||||||
| Allowance for doubtful accounts |
$ | 32 | $ | 52 | $ | — | $ | (30 | ) | $ | — | $ | 54 | |||||||
| Allowance for doubtful accounts with related party Canadian Debtors and other deconsolidated foreign entities |
71 | 3 | — | (64 | ) | — | 10 | |||||||||||||
| Reserve for notes receivable |
36 | 3 | — | — | — | 39 | ||||||||||||||
| Reserve for interest and notes receivable with related party Canadian Debtors and other deconsolidated foreign entities |
227 | — | — | (144 | ) | — | 83 | |||||||||||||
| Gross reserve for California refund liability |
13 | — | — | (13 | ) | — | — | |||||||||||||
| Deferred tax asset valuation allowance |
2,321 | 565 | — | (485 | ) | — | 2,401 | |||||||||||||
| (1) | Represents write-offs of accounts considered to be uncollectible and recoveries of amounts previously written off or reserved. |
| (2) | The adjustment of $478 million represents the additions resulting from our reconsolidation of our Canadian Debtors and other deconsolidated foreign entities and the difference in the amounts disclosed in our prior 10-K and the final amount as filed in our 2007 tax return. There was no impact to our Statement of Operations for the year ended December 31, 2008. |
188
Table of Contents
Index to Financial Statements
OTAY MESA ENERGY CENTER, LLC
INDEX TO FINANCIAL STATEMENTS
December 31, 2009
| Page | ||
| 190 | ||
| 191 | ||
| 192 | ||
| 193 | ||
| 194 | ||
| 195 |
189
Table of Contents
Index to Financial Statements
Report of Independent Registered Public Accounting Firm
To the Member of
Otay Mesa Energy Center, LLC
In our opinion, the accompanying balance sheets and the related statements of operations, comprehensive income (loss) and member’s interest, and cash flows present fairly, in all material respects, the financial position of Otay Mesa Energy Center, LLC at December 31, 2009 and 2008, and the results of its operations and its cash flows for each of the two years in the period ended December 31, 2009 and for the period from May 1, 2007 (date of inception) to December 31, 2007 in conformity with accounting principles generally accepted in the United States of America. These financial statements are the responsibility of the Company’s management. Our responsibility is to express an opinion on these financial statements based on our audits. We conducted our audits of these statements in accordance with the standards of the Public Company Accounting Oversight Board (United States). Those standards require that we plan and perform the audit to obtain reasonable assurance about whether the financial statements are free of material misstatement. An audit includes examining, on a test basis, evidence supporting the amounts and disclosures in the financial statements, assessing the accounting principles used and significant estimates made by management, and evaluating the overall financial statement presentation. We believe that our audits provide a reasonable basis for our opinion.
/s/ PricewaterhouseCoopers LLP
Houston, Texas
February 24, 2010
190
Table of Contents
Index to Financial Statements
(Previously a Development Stage Company)
BALANCE SHEETS
December 31, 2009 and 2008
| 2009 | 2008 | |||||
| (in thousands) | ||||||
| ASSETS | ||||||
| Current assets: |
||||||
| Cash and cash equivalents |
$ | 7,509 | $ | 11,486 | ||
| Restricted cash |
7,672 | 70 | ||||
| Accounts receivable, related party |
10,578 | — | ||||
| Deferred income taxes, current |
387 | 513 | ||||
| Materials and supplies |
1,410 | — | ||||
| Prepaid expenses and other current assets |
235 | 433 | ||||
| Deferred transmission credits, related party |
— | 22,661 | ||||
| Total current assets |
27,791 | 35,163 | ||||
| Property, plant and equipment, net |
542,002 | 462,713 | ||||
| Intangible assets, net |
43,430 | 46,119 | ||||
| Deferred financing costs, net |
7,047 | 7,776 | ||||
| Deferred lease levelization receivable |
2,047 | — | ||||
| Total assets |
$ | 622,317 | $ | 551,771 | ||
| LIABILITIES & MEMBER’S INTEREST | ||||||
| Current liabilities: |
||||||
| Accounts payable, trade |
$ | 1,975 | $ | 28,716 | ||
| Accounts payable, related party |
4,479 | 4,733 | ||||
| Derivative liabilities, current |
16,744 | 12,322 | ||||
| Project financing, current |
9,949 | 2,487 | ||||
| Accrued interest payable |
4,314 | 951 | ||||
| Other current liabilities |
82 | 1,759 | ||||
| Income tax payable, related party |
28 | 28 | ||||
| Total current liabilities |
37,571 | 50,996 | ||||
| Project financing, net of current portion |
364,564 | 253,870 | ||||
| Written call option |
46,119 | 46,119 | ||||
| Long-term derivative liabilities |
25,893 | 72,251 | ||||
| Deferred income taxes, net of current portion |
387 | 513 | ||||
| Asset retirement obligations |
786 | 612 | ||||
| Other long-term liabilities |
998 | 627 | ||||
| Total liabilities |
476,318 | 424,988 | ||||
| Commitments and contingencies (see Note 11) |
||||||
| Member’s interest |
145,999 | 126,783 | ||||
| Total liabilities and member’s interest |
$ | 622,317 | $ | 551,771 | ||
The accompanying notes are an integral part of these Financial Statements.
191
Table of Contents
Index to Financial Statements
(Previously a Development Stage Company)
STATEMENTS OF OPERATIONS
For the Years Ended December 31, 2009 and 2008,
and the Period May 1, 2007 to December 31, 2007
| 2009 | 2008 | 2007 | ||||||||||
| (in thousands) | ||||||||||||
| Operating revenues, related party |
$ | 20,398 | $ | — | $ | — | ||||||
| Cost of revenue: |
||||||||||||
| Plant operating expense, related party |
2,454 | — | — | |||||||||
| Plant operating expense |
387 | — | — | |||||||||
| Depreciation and amortization expense |
5,097 | — | — | |||||||||
| Project development expense |
2,949 | 507 | — | |||||||||
| Sales, general and other administrative expense |
3,674 | 436 | 99 | |||||||||
| Asset impairment expense |
1,647 | — | — | |||||||||
| Accretion of asset retirement obligations |
72 | 53 | 5 | |||||||||
| Total cost of revenue |
16,280 | 996 | 104 | |||||||||
| Income (loss) from operations |
4,118 | (996 | ) | (104 | ) | |||||||
| Interest expense |
(23,120 | ) | 52,934 | 8,562 | ||||||||
| Interest (income) |
(658 | ) | (1,706 | ) | (382 | ) | ||||||
| Liquidating damages |
6,050 | — | — | |||||||||
| Other expense |
195 | — | — | |||||||||
| Income (loss) before income taxes |
21,651 | (52,224 | ) | (8,284 | ) | |||||||
| Income tax expense |
— | 28 | — | |||||||||
| Net income (loss) |
$ | 21,651 | $ | (52,252 | ) | $ | (8,284 | ) | ||||
The accompanying notes are an integral part of these Financial Statements.
192
Table of Contents
Index to Financial Statements
(Previously a Development Stage Company)
STATEMENTS OF COMPREHENSIVE INCOME (LOSS) AND
MEMBER’S INTEREST
For the Years Ended December 31, 2009 and 2008,
and the Period May 1, 2007 to December 31, 2007
| Member’s Interest |
Accumulated Deficit |
Accumulated Other Comprehensive Income (Loss) |
Total Member’s Interest |
Comprehensive Income (Loss) |
||||||||||||||||
| (in thousands) | ||||||||||||||||||||
| Contributions from member on May 1, 2007 |
$ | 203,360 | $ | — | $ | — | $ | 203,360 | ||||||||||||
| Contributions from member |
331 | — | — | 331 | ||||||||||||||||
| Comprehensive loss from interest rate swaps |
— | — | (9,696 | ) | (9,696 | ) | $ | (9,696 | ) | |||||||||||
| Net loss |
— | (8,284 | ) | — | (8,284 | ) | (8,284 | ) | ||||||||||||
| Total comprehensive loss |
$ | (17,980 | ) | |||||||||||||||||
| Balance, December 31, 2007 |
203,691 | (8,284 | ) | (9,696 | ) | 185,711 | ||||||||||||||
| Contributions from member |
10,336 | — | — | 10,336 | ||||||||||||||||
| Comprehensive loss from interest rate swaps |
— | — | (17,012 | ) | (17,012 | ) | $ | (17,012 | ) | |||||||||||
| Net loss |
— | (52,252 | ) | — | (52,252 | ) | (52,252 | ) | ||||||||||||
| Total comprehensive loss |
$ | (69,264 | ) | |||||||||||||||||
| Balance, December 31, 2008 |
214,027 | (60,536 | ) | (26,708 | ) | 126,783 | ||||||||||||||
| Contributions from member |
4,250 | — | — | 4,250 | ||||||||||||||||
| Distributions to member |
(9,130 | ) | — | — | (9,130 | ) | ||||||||||||||
| Comprehensive gain from interest rate swaps |
— | — | 334 | 334 | $ | 334 | ||||||||||||||
| Reclassification adjustment for losses included in net income |
— | — | 2,111 | 2,111 | 2,111 | |||||||||||||||
| Net income |
— | 21,651 | — | 21,651 | 21,651 | |||||||||||||||
| Total comprehensive income |
$ | 24,096 | ||||||||||||||||||
| Balance, December 31, 2009 |
$ | 209,147 | $ | (38,885 | ) | $ | (24,263 | ) | $ | 145,999 | ||||||||||
The accompanying notes are an integral part of these Financial Statements.
193
Table of Contents
Index to Financial Statements
(Previously a Development Stage Company)
STATEMENTS OF CASH FLOWS
For the Years Ended December 31, 2009 and 2008,
and the Period May 1, 2007 to December 31, 2007
| 2009 | 2008 | 2007 | ||||||||||
| (in thousands) | ||||||||||||
| Cash flows from operating activities: |
||||||||||||
| Net income (loss) |
$ | 21,651 | $ | (52,252 | ) | $ | (8,284 | ) | ||||
| Adjustments to reconcile net income (loss) to net cash used in operating activities: |
||||||||||||
| Depreciation expense |
4,055 | — | — | |||||||||
| Amortization of intangible assets |
1,042 | — | — | |||||||||
| Asset impairment expense |
1,647 | — | — | |||||||||
| Amortization of deferred financing costs |
226 | — | — | |||||||||
| Accretion of asset retirement obligations |
72 | 53 | 5 | |||||||||
| Unrealized mark-to-market activities, net |
(39,492 | ) | 49,644 | 8,561 | ||||||||
| Lease levelization expense (revenue), net |
(1,676 | ) | — | — | ||||||||
| Change in deferred transmission expense |
— | (1,630 | ) | — | ||||||||
| Change in operating assets and liabilities: |
||||||||||||
| Prepaid expense and other current assets |
(235 | ) | — | (1,390 | ) | |||||||
| Accounts receivable, related party |
(10,578 | ) | — | — | ||||||||
| Deferred transmission credits, related party |
3,795 | — | — | |||||||||
| Accounts payable, related party |
3,572 | — | — | |||||||||
| Materials and supplies |
(1,410 | ) | — | — | ||||||||
| Accrued interest payable |
3,439 | 518 | — | |||||||||
| Other current liabilities |
(5 | ) | — | — | ||||||||
| Accounts payable, trade |
884 | 18 | — | |||||||||
| Income tax payable, related party |
— | 28 | 95 | |||||||||
| Net cash used in operating activities |
(13,013 | ) | (3,621 | ) | (1,013 | ) | ||||||
| Cash flows from investing activities: |
||||||||||||
| Purchases of property, plant and equipment |
(115,127 | ) | (179,594 | ) | (97,296 | ) | ||||||
| Increase in restricted cash |
(7,602 | ) | (70 | ) | — | |||||||
| Transmission credit proceeds |
19,045 | — | — | |||||||||
| Transmission credit expenditures, related party |
(226 | ) | (9,313 | ) | (3,091 | ) | ||||||
| Net cash used in investing activities |
(103,910 | ) | (188,977 | ) | (100,387 | ) | ||||||
| Cash flows from financing activities: |
||||||||||||
| Borrowings under project financing |
120,643 | 193,157 | 63,200 | |||||||||
| Repayment of project financing |
(2,487 | ) | — | — | ||||||||
| Distributions to member |
(9,130 | ) | — | — | ||||||||
| Contributions from member |
4,250 | 10,336 | 46,980 | |||||||||
| Deferred financing costs |
(330 | ) | (495 | ) | (7,694 | ) | ||||||
| Net cash provided by financing activities |
112,946 | 202,998 | 102,486 | |||||||||
| Net (decrease) increase in cash and cash equivalents |
(3,977 | ) | 10,400 | 1,086 | ||||||||
| Cash and cash equivalents, beginning of period |
11,486 | 1,086 | — | |||||||||
| Cash and cash equivalents, end of period |
$ | 7,509 | $ | 11,486 | $ | 1,086 | ||||||
| Cash paid during the period for: |
||||||||||||
| Interest, net of amounts capitalized |
$ | 12,727 | $ | 2,771 | $ | — | ||||||
| Income taxes |
$ | — | $ | — | $ | — | ||||||
| Supplemental disclosure of non-cash investing and financing activities: |
||||||||||||
| Change in property, plant and equipment financed by accounts payable and other liabilities |
$ | (33,097 | ) | $ | 15,376 | $ | 17,308 | |||||
| Amortization of deferred financing costs capitalized to property, plant and equipment |
$ | 524 | $ | 381 | $ | 31 | ||||||
| Additions to property, plant and equipment |
$ | 790 | $ | 1,848 | $ | — | ||||||
| Contributions of assets and liabilities from member |
$ | — | $ | — | $ | 156,711 | ||||||
The accompanying notes are an integral part of these Financial Statements.
194
Table of Contents
Index to Financial Statements
(Previously a Development Stage Company)
NOTES TO FINANCIAL STATEMENTS
For the Years Ended December 31, 2009 and 2008,
and the Period May 1, 2007 to December 31, 2007
1. Organization and Operations
Otay Mesa Energy Center, LLC (previously a development stage company), a Delaware limited liability company, is an indirect, wholly owned subsidiary of Calpine Corporation (“Calpine Corp.”). OMEC was formed for the purpose of developing, constructing, financing, operating and maintaining Otay Mesa Energy Center, a 608 MW peak capacity, natural gas-fired, combined-cycle power plant (the “Plant”) located in San Diego County, California. The Plant commenced operations on October 3, 2009 (the “Commercial Operations Date”). The Plant sells capacity under a long-term PPA with a related party, SDG&E. See Note 8 for additional discussion.
Management believes the Plant meets the current requirements for status as an EWG, as defined by PUHCA 2005. An EWG is defined as the owner or operator of an electric generation plant used exclusively for the wholesale generation and sale of electric power.
Prior to 2007, all activities related to the development and construction of the Plant were conducted by Calpine Corp. and certain of its affiliates. Effective May 1, 2007, OMEC entered into various agreements, including the PPA Reinstatement Agreement, the Contribution and Transfer Agreement and the Ground Sublease and Easement Agreement (collectively, the “Agreements”), by and among OMEC, Calpine Corp. and SDG&E. In accordance with the Agreements, Calpine Corp. and certain of its affiliates contributed all cash, property and equipment, and other assets and liabilities associated with the Plant to OMEC and assigned certain related contracts to OMEC.
Calpine assigned its leasehold interest under the Ground Sublease and Easement Agreement (the “Sublease Agreement”) to SDG&E. The Sublease Agreement includes a put option by OMEC to sell, and a call option by SDG&E to buy, the Plant at the end of the term of the PPA. See Note 3 for additional discussion. Management of Calpine Corp. determined that the PPA, along with the put and call options, absorb the majority of the risk from OMEC such that OMEC is a VIE and Calpine Corp. is not the primary beneficiary during the period May 1, 2007 to December 31, 2009. As there was a new primary beneficiary as of May 1, 2007, there was a change in the basis of accounting. As a result, the assets and liabilities contributed by Calpine Corp. and certain of its affiliates were measured at fair value as of May 1, 2007, (the “Contribution Date”). Prior to the Commercial Operations Date, OMEC devoted substantially all its efforts to constructing the Plant.
2. Business Risks
Several current issues in the power industry could have an effect on OMEC’s financial performance. Some of the business risks and uncertainties that could cause future results to differ from historical results include, but are not limited to:
| • | The uncertain length and severity of the current depressed general financial and economic conditions and its impacts on OMEC’s business, including demand for power and the ability of OMEC’s contractual counterparties to perform under their contracts with OMEC; |
| • | OMEC’s ability to manage its customer and counterparty exposure and credit risk; |
| • | Regulation in the markets in which OMEC participates and OMEC’s ability to effectively respond to changes in federal, state and regional laws and regulations, including environmental regulations; |
195
Table of Contents
Index to Financial Statements
OTAY MESA ENERGY CENTER, LLC
(Previously a Development Stage Company)
NOTES TO FINANCIAL STATEMENTS — (Continued)
For the Years Ended December 31, 2009 and 2008,
and the Period May 1, 2007 to December 31, 2007
| • | Natural disasters such as hurricanes, earthquakes and floods, or acts of terrorism that may impact the Plant or the market it serves; |
| • | Seasonal fluctuations of OMEC’s results and exposure to variations in weather patterns; |
| • | Disruptions in or limitations on the transportation of natural gas and transmission of power; |
| • | Present and possible future claims, litigation and enforcement actions; |
| • | Risks associated with the operation of a power plant including unscheduled outages; and |
| • | The expiration or termination of OMEC’s PPA with SDG&E and the related results on revenues. |
3. Summary of Significant Accounting Policies
Basis of Presentation
The financial statements have been prepared in accordance with GAAP. The financial statements reflect all costs of doing business, including those incurred by Calpine Corp. on OMEC’s behalf. Costs that are clearly identifiable as being applicable to OMEC have been allocated to OMEC by Calpine Corp. Centralized departments that serve all business units have allocated costs to OMEC using relevant allocation measures, primarily budgeted productivity. The most significant costs in this category include salaries and benefits of certain employees, legal and other professional fees, information technology costs and facilities costs, including office rent. Calpine Corp. corporate costs that clearly relate to other business segments of Calpine Corp. have not been allocated to OMEC.
Use of Estimates in Preparation of Financial Statements
The preparation of the financial statements in conformity with GAAP requires management to make estimates and assumptions that affect the reported amounts of assets, liabilities, revenues, expenses and related disclosure in these financial statements. Actual results could differ from those estimates.
Fair Value of Financial Instruments
The carrying value of cash and cash equivalents, restricted cash, accounts receivable, accounts payable and other current liabilities approximate their respective fair values due to their short-term maturities. See Note 5 for disclosures regarding the fair value of OMEC’s project financing. See Note 6 for disclosures regarding the fair value of OMEC’s derivative instruments.
Concentration of Credit Risk
Financial instruments that potentially subject OMEC to credit risk consist primarily of cash and cash equivalents, restricted cash, accounts receivable and derivative instruments. Cash and cash equivalent balances, as well as restricted cash balances, may exceed FDIC limits or are invested in money market accounts with investment banks that are not FDIC insured. OMEC places cash and cash equivalents and restricted cash in what
196
Table of Contents
Index to Financial Statements
OTAY MESA ENERGY CENTER, LLC
(Previously a Development Stage Company)
NOTES TO FINANCIAL STATEMENTS — (Continued)
For the Years Ended December 31, 2009 and 2008,
and the Period May 1, 2007 to December 31, 2007
it believes to be credit-worthy financial institutions, and certain money market accounts invest in U.S. Treasury securities or other obligations issued or guaranteed by the U.S. Government, its agencies or instrumentalities. The counterparty to the interest rate swaps is a major financial institution. Management does not believe there is significant risk to OMEC relating to the financial institutions. OMEC sells power to a public utility under a long-term agreement, and accounts receivable are concentrated with SDG&E. OMEC has exposure to trends within the energy industry, including declines in the creditworthiness of SDG&E. OMEC generally has not collected collateral or other security to support its power-related accounts receivable. OMEC does not believe there is significant credit risk associated with SDG&E.
Cash and Cash Equivalents
OMEC considers all highly liquid investments with an original maturity of three months or less to be cash equivalents.
Restricted Cash
OMEC is required to maintain cash balances that are restricted by the provisions of its financing agreement, which restricts the use of certain cash inflows received during the construction phase and after achieving commercial operations. These amounts are held by a depository bank in order to comply with the contractual provisions regarding reserves for operating, maintenance, debt service, and restricted distributions to OMEC’s parent. Funds that can be used to satisfy obligations due during the next 12 months are classified as current restricted cash. Restricted cash is generally invested in accounts earning market rates; therefore, the carrying value approximates fair value. Such cash is excluded from cash and cash equivalents in the Balance Sheets and Statements of Cash Flows.
Accounts Receivable and Payable
Accounts receivable and payable represent amounts due from customers, including related parties, and owed to both related party and third-party vendors. Accounts receivable are recorded at invoiced amounts, net of reserves and allowances, and do not bear interest. Receivable balances greater than 30 days past due are individually reviewed for collectability, and if deemed uncollectible, are charged off against the allowance accounts after all means of collection have been exhausted and the potential for recovery is considered remote. Management uses their best estimate to determine the required allowance for doubtful accounts based on a variety of factors, including the length of time receivables are past due, economic trends and significant one-time events. Specific provisions are recorded for individual receivables when management becomes aware of a customer’s inability to meet its financial obligations. Management reviews the adequacy of the reserves and allowances quarterly. As of December 31, 2009 and 2008, OMEC determined that no allowance for doubtful accounts was required.
Capitalized Interest
OMEC capitalized interest on capital invested in the Plant during the advanced stages of development and the construction period. OMEC’s qualifying assets included all of its construction in progress. Interest capitalized totaled $5.8 million and $9.2 million for the years ended December 31, 2009 and 2008, respectively, and $1.4 million for the period May 1, 2007 to December 31, 2007. Upon commencement of commercial operations
197
Table of Contents
Index to Financial Statements
OTAY MESA ENERGY CENTER, LLC
(Previously a Development Stage Company)
NOTES TO FINANCIAL STATEMENTS — (Continued)
For the Years Ended December 31, 2009 and 2008,
and the Period May 1, 2007 to December 31, 2007
of the Plant, capitalized interest, as a component of the total cost of the Plant, is amortized over the estimated useful life of the Plant.
Derivative Instruments
OMEC entered into derivative instruments to manage its interest rate risk on its project financing. OMEC recognizes all derivative instruments that qualify for derivative accounting treatment as either assets or liabilities and measures those instruments at fair value. OMEC presents cash flows from interest rate swaps within operating activities on the Statements of Cash Flows.
Gains and losses on interest rate swaps that qualify for hedge accounting are recorded in the period and same financial statement line item as the hedged item. Hedge accounting requires management to formally document, designate and assess the effectiveness of transactions that receive hedge accounting. For gains and losses on interest rate swaps that do not qualify for or have not been documented for hedge accounting treatment, changes in fair value are recognized currently into earnings.
Accounting for derivatives at fair value requires management to make estimates about future prices during periods for which price quotes are not available from external sources, in which case management relies on internally developed price estimates. During periods where external price quotes are not available, management derives such future price estimates based on an extrapolation of prices from periods where external price quotes are available. Management performs this extrapolation using liquid and observable market prices and extending those prices to an internally generated long-term price forecast based on a generalized equilibrium model.
Materials and Supplies
Materials and supplies consist of spare parts and are valued at weighted average cost. Costs are expensed to plant operating expense or capitalized into property, plant and equipment as the parts are utilized and consumed.
Property, Plant and Equipment, Net
Property, plant, and equipment items are recorded at cost. OMEC capitalizes costs incurred in connection with the construction of the Plant and the refurbishment of major turbine generator equipment. Annual planned maintenance is expensed when the service is performed. The Plant’s assets, excluding rotable parts, are depreciated on a composite basis over a useful life of 37 years, utilizing the straight-line method and an estimated salvage value of 10% of the depreciable cost basis. Rotable parts are depreciated on a component basis, which generally ranges from 3 to 18 years, utilizing the straight-line method, with an estimated salvage value of 0.15% of the depreciable cost basis.
Impairment Evaluation of Long-Lived Assets
Management evaluates long-lived assets for impairment when such events or changes in circumstances indicate that the carrying value of such assets may not be recoverable. When management believes an impairment condition may have occurred, they are required to estimate the undiscounted future cash flows associated with a long-lived asset or group of long-lived assets at the lowest level for which identifiable cash flows are largely independent of the cash flows of other assets and liabilities for long-lived assets that are
198
Table of Contents
Index to Financial Statements
OTAY MESA ENERGY CENTER, LLC
(Previously a Development Stage Company)
NOTES TO FINANCIAL STATEMENTS — (Continued)
For the Years Ended December 31, 2009 and 2008,
and the Period May 1, 2007 to December 31, 2007
expected to be held and used. Such cash flows do not include interest or tax expense cash outflows. In the event such cash flows are not expected to be sufficient to recover the recorded value of the assets, the assets are written down to their estimated fair values. Except as noted below at Intangible Assets, Net, no impairment charge was recorded for the years ended December 31, 2009 and 2008, and for the period May 1, 2007 to December 31, 2007.
Intangible Assets, Net
Intangible assets consist of contractual rights and the put option included within the Agreements that were recorded at fair value on the Contribution Date, when Calpine Corp. contributed assets and liabilities to OMEC. Intangible assets with finite lives are amortized on a straight-line basis over their estimated useful lives and are reviewed for impairment whenever changes in circumstances indicate that the carrying amount of the asset may not be recoverable. Contractual rights under the Agreements totaled $42.6 million and began amortizing on the Commercial Operations Date. The contractual rights are subject to amortization over the 10-year term of the PPA on a straight-line basis. Amortization expense on the contractual rights totaled $1.0 million for the year ended December 31, 2009 and is included in depreciation and amortization expense in the Statement of Operations. The put option included within the Agreements is generally exercisable 180 days after the ninth anniversary of the commercial operation date through the tenth anniversary and allows OMEC to put the Plant to SDG&E for $280.0 million. The put had a value of $3.5 million at inception and is reviewed at least annually for impairment. During 2009, management determined that the put option was impaired based on an evaluation of the likelihood that the option will be exercised. As a result of this evaluation, management recorded asset impairment expense of $1.6 million in the Statement of Operations for the year ended December 31, 2009. No impairment expense was recorded for the years ended December 31, 2008, and for the period May 1, 2007 to December 31, 2007.
The Agreements also include a call option whereby SDG&E may purchase the Plant for $377.0 million. The call option is valued at $46.1 million and is generally exercisable between the ninth and tenth anniversaries of the Plant’s Commercial Operations Date. The carrying value of the call will be adjusted at the time the option is exercised or expires.
Asset Retirement Obligations
OMEC records all known asset retirement obligations for which the liability’s fair value can be reasonably estimated. Over time, the liability is accreted to its present value each period, and the capitalized cost is depreciated over the useful life of the related asset. OMEC’s asset retirement obligations primarily relate to land leases upon which the Plant is built.
Deferred Financing Costs
Costs incurred related to the issuance of debt instruments are deferred and amortized over the term of the related debt using the effective interest rate method. Prior to the Commercial Operations Date, amortization costs of $0.5 million and $0.4 million for the years ended December 31, 2009 and 2008, respectively, and nil for the period May 1, 2007 to December 31, 2007, were capitalized to construction in progress and are subject to amortization over the estimated useful life of the Plant. Subsequent to the Commercial Operations Date, amortization costs of $0.2 million were included in interest expense in the Statement of Operations for the year ended December 31, 2009.
199
Table of Contents
Index to Financial Statements
OTAY MESA ENERGY CENTER, LLC
(Previously a Development Stage Company)
NOTES TO FINANCIAL STATEMENTS — (Continued)
For the Years Ended December 31, 2009 and 2008,
and the Period May 1, 2007 to December 31, 2007
Revenue Recognition
Contracts accounted for as operating leases, such as certain tolling agreements, with minimum lease rentals that vary over time must be levelized. The PPA with SDG&E is a tolling agreement that meets the criteria of an operating lease. OMEC levelizes the minimum lease payments on a straight-line basis over the term of the contract.
Project Development Expense
Project development expense represents costs incurred by OMEC prior to the Commercial Operations Date related to anticipated post-operational needs of the Plant. Such costs included hiring and training of operations personnel, which are not subject to capitalization under GAAP and were expensed as incurred.
Income Taxes
OMEC is a single member limited liability company whose tax results are included in the consolidated U.S. federal and state income tax returns of Calpine Corp. and is treated as a taxable entity for financial reporting purposes. For separate company financial reporting purposes, income taxes are calculated by OMEC on a separate return basis.
Income taxes are accounted for under the asset and liability method. OMEC has reported its assets and liabilities at fair value as of the Contribution Date; however, the deferred tax assets and liabilities are recorded based on Calpine Corp.’s original basis as there was no change in the tax entity. Deferred tax assets and liabilities are recognized for the future tax consequences attributable to differences between the financial statement carrying values of existing assets and liabilities and their respective tax bases and net operating loss and tax credit carryforwards. Deferred tax assets and liabilities are measured using enacted tax rates expected to apply to taxable income in the years in which temporary differences are expected to be recovered or settled. The effect on deferred tax assets and liabilities due to a change in tax rates is recognized in income in the period that includes the enactment date. OMEC recognizes interest and penalties incurred in income tax expense in the statements of operations. For the years ended December 31, 2009 and 2008, OMEC did not incur any tax-related penalties or interest.
OMEC recognizes the financial statement effects of a tax position when it is more likely than not, based on the technical merits, that the position will be sustained upon examination. A tax position that meets the more-likely-than-not recognition threshold is measured as the largest amount of tax benefit that is greater than 50% likely of being realized upon ultimate settlement with a taxing authority. OMEC reverses a previously recognized tax position in the first period in which it is no longer more likely than not that the tax position would be sustained upon examination. See Note 9 for further discussion on OMEC’s income taxes.
New Accounting Standards and Disclosure Requirements
Accounting Standards Codification and GAAP Hierarchy — Effective for interim and annual periods ending after September 15, 2009, the Accounting Standards Codification, or ASC, and related disclosure requirements issued by the Financial Accounting Standards Board became the single official source of authoritative, nongovernmental GAAP. The ASC simplifies GAAP, without change, by consolidating the
200
Table of Contents
Index to Financial Statements
OTAY MESA ENERGY CENTER, LLC
(Previously a Development Stage Company)
NOTES TO FINANCIAL STATEMENTS — (Continued)
For the Years Ended December 31, 2009 and 2008,
and the Period May 1, 2007 to December 31, 2007
numerous, predecessor accounting standards and requirements into logically organized topics. All other literature not included in the ASC is non-authoritative. Management adopted the ASC as of September 30, 2009, which did not have any impact on the results of operations, financial condition or cash flows as it does not represent new accounting literature or requirements; however, it did change references within this report to authoritative sources of GAAP to the new ASC nomenclature.
Fair Value Measurements of Non-Financial Assets and Non-Financial Liabilities — Effective for interim and annual periods beginning after November 15, 2008, GAAP includes new standards related to fair value measurements for non-financial assets and liabilities. These new standards do not apply to assets and liabilities that were not previously required to be recorded at fair value, but do apply when other accounting standards require fair value measurements. The new standards also define fair value, establish a framework for measuring fair value under GAAP and enhance disclosures about fair value measurements. Management adopted the new standards with respect to non-financial assets and non-financial liabilities as of January 1, 2009, which did not have a material effect on the results of operations, financial position or cash flows; however, adoption may impact measurements of asset impairments and asset retirement obligations if they occur in the future.
Disclosures About Derivative Instruments and Hedging Activities — Effective for interim and annual periods beginning after November 15, 2008, GAAP includes enhanced disclosure requirements relating to an entity’s derivative and hedging activities to enable investors to better understand their effects on the entity’s financial position, financial performance, and cash flows. OMEC adopted the new disclosure requirements as of January 1, 2009. Adoption resulted in additional disclosures related to OMEC’s derivatives and hedging activities including additional disclosures regarding OMEC’s objectives for entering into derivative transactions, increased balance sheet and financial performance disclosures, volume information and credit enhancement disclosures. See Note 7 for OMEC’s derivative disclosures.
Fair Value Measurements and Disclosures — In January 2010, FASB issued Accounting Standards Update 2010-06, “Fair Value Measurements and Disclosures” to enhance disclosure requirements relating to different levels of assets and liabilities measured at fair value and to clarify certain existing disclosures. The update requires disclosure of transfers in and out of levels 1 and 2 and gross presentation of purchases, sales, issuances and settlements in the level 3 reconciliation of beginning and ending balances. The new disclosure requirements relating to level 3 activity are effective for interim and annual periods beginning after December 15, 2010 and all the other requirements are effective for interim and annual periods beginning after December 15, 2009. Since this update only requires additional disclosures, management does not expect this standard to have a material impact on OMEC’s results of operations, cash flows or financial position.
Subsequent Events — Effective for interim and annual periods ending after June 15, 2009, GAAP includes general standards of accounting for and disclosure of events that occur after the balance sheet date but before financial statements are issued or are available to be issued. The new standards do not change the accounting for subsequent events; however, they do require disclosure, on a prospective basis, of the date an entity has evaluated subsequent events. Management adopted these new standards for the year ended December 31, 2009, which had no impact on OMEC’s results of operations, financial condition or cash flows. Management has evaluated subsequent events up to the time of issuance of this Report on February 24, 2010.
201
Table of Contents
Index to Financial Statements
OTAY MESA ENERGY CENTER, LLC
(Previously a Development Stage Company)
NOTES TO FINANCIAL STATEMENTS — (Continued)
For the Years Ended December 31, 2009 and 2008,
and the Period May 1, 2007 to December 31, 2007
4. Property, Plant and Equipment, Net
As of December 31, 2009 and 2008, property, plant and equipment, are stated at cost less accumulated depreciation as follows (in thousands):
| 2009 | 2008 | ||||||
| Building, machinery and equipment |
$ | 529,364 | $ | — | |||
| Construction in progress |
— | 446,020 | |||||
| Emission reduction credits |
16,693 | 16,693 | |||||
| 546,057 | 462,713 | ||||||
| Less: Accumulated depreciation |
(4,055 | ) | — | ||||
| Property, plant and equipment, net |
$ | 542,002 | $ | 462,713 | |||
5. Project Financing
On the Contribution Date, OMEC entered into a credit agreement with a group of lenders for $377.0 million (the “Credit Agreement”). The project financing is collateralized by OMEC’s assets and is non-recourse to Calpine Corp. and its other affiliates. The project financing was used to fund the construction activities for the Plant. The construction loan converted to a term loan on November 13, 2009, after the Plant satisfied conversion requirements of the Credit Agreement. The term loan matures on April 30, 2019.
Borrowings under the Credit Agreement bear variable interest that, depending on the specific terms of the loan, are calculated based on adjusted LIBOR plus an applicable margin of 1.5%. The effective interest rate was approximately 7.1% for both the years ended December 31, 2009 and 2008, and 6.5% for the period May 1, 2007 to December 31, 2007. The Credit Agreement requires OMEC to maintain certain covenants, including debt service coverage and debt to equity ratios, once the Plant commenced commercial operations, as well as certain other funding and performance covenants.
As of December 31, 2009, the scheduled maturities of the project financing are as follows (in thousands):
| 2010 |
$ | 9,949 | |
| 2011 |
9,949 | ||
| 2012 |
9,949 | ||
| 2013 |
9,949 | ||
| 2014 |
9,949 | ||
| Thereafter |
324,768 | ||
| Total |
$ | 374,513 | |
Under GAAP, OMEC measures the fair value of its project financing using discounted cash flow analyses based on current borrowing rates for similar types of borrowing arrangements. The estimated fair value of the project financing was $339.4 million and $227.0 million as of December 31, 2009 and 2008, respectively, with the increase in fair value primarily due to additional borrowings under the project financing in 2009.
202
Table of Contents
Index to Financial Statements
OTAY MESA ENERGY CENTER, LLC
(Previously a Development Stage Company)
NOTES TO FINANCIAL STATEMENTS — (Continued)
For the Years Ended December 31, 2009 and 2008,
and the Period May 1, 2007 to December 31, 2007
6. Fair Value Measurements
Financial Instruments
OMEC has cash equivalents that are classified within level 1 of the fair value hierarchy as the amounts approximate fair value. These financial instruments are invested in money market accounts and included in cash and cash equivalents and restricted cash on the Balance Sheets.
Interest Rate Swaps
A significant portion of OMEC’s debt is indexed to LIBOR. Management uses interest rate swaps to effectively convert a portion of the floating rate component of the debt to a fixed rate. These transactions act as economic hedges for the interest cash flow. Interest rate swaps are measured at their fair value and recorded as either assets or liabilities. OMEC does not use interest rate derivative instruments for trading purposes.
The fair value of OMEC’s interest rate swaps is determined based on observable market-based pricing inputs, and the swaps are classified as level 2 derivative instruments. Generally, management obtains level 2 pricing inputs from markets such as Bloomberg. In certain instances, level 2 derivative instruments may utilize models to measure fair value. These models are primarily industry-standard models that incorporate various assumptions, including quoted interest rates, correlation, volatility, as well as other relevant economic measures. Substantially all of these assumptions are observable in the marketplace throughout the full term of the instrument, can be derived from observable data or are supported by observable levels at which transactions are executed in the marketplace.
OMEC utilizes market data, such as pricing services and broker quotes, and assumptions that management believes market participants would use in pricing assets or liabilities including assumptions about risks and the risks inherent to the inputs in the valuation technique. These inputs can be readily observable, market corroborated or generally unobservable. The market data obtained from broker pricing services is evaluated to determine the nature of the quotes obtained and, where accepted as a reliable quote, used to validate management’s assessment of fair value; however, other qualitative assessments are used to determine the level of activity in any given market. OMEC primarily applies the market approach and income approach for recurring fair value measurements and utilizes what management believes to be the best available information. The valuation techniques used seek to maximize the use of observable inputs and minimize the use of unobservable inputs. The fair value balances are classified based on the observability of those inputs.
The fair value of OMEC’s derivatives includes consideration of OMEC’s credit standing and the credit standing of its counterparties. OMEC has also recorded credit reserves in the determination of fair value based on management’s expectation of how market participants would determine fair value. Such valuation adjustments are generally based on market evidence, if available, or management’s best estimate.
The following tables present OMEC’s financial assets and liabilities that were accounted for at fair value on a recurring basis as of December 31, 2009 and 2008, by level within the fair value hierarchy. Financial assets and liabilities are classified in their entirety based on the lowest level of input that is significant to the fair value measurement. Management’s assessment of the significance of a particular input to the fair value measurement
203
Table of Contents
Index to Financial Statements
OTAY MESA ENERGY CENTER, LLC
(Previously a Development Stage Company)
NOTES TO FINANCIAL STATEMENTS — (Continued)
For the Years Ended December 31, 2009 and 2008,
and the Period May 1, 2007 to December 31, 2007
requires judgment, and may affect the valuation of fair value assets and liabilities and their placement within the fair value hierarchy levels.
| December 31, 2009 | ||||||||||||
| Level 1 | Level 2 | Level 3 | Total | |||||||||
| (in thousands) | ||||||||||||
| Assets: |
||||||||||||
| Cash equivalents(1) |
$ | 15,099 | $ | — | $ | — | $ | 15,099 | ||||
| Total assets |
$ | 15,099 | $ | — | $ | — | $ | 15,099 | ||||
| Liabilities: |
||||||||||||
| Interest rate swaps |
$ | — | $ | 42,637 | $ | — | $ | 42,637 | ||||
| Total liabilities |
$ | — | $ | 42,637 | $ | — | $ | 42,637 | ||||
| December 31, 2008 | ||||||||||||
| Level 1 | Level 2 | Level 3 | Total | |||||||||
| (in thousands) | ||||||||||||
| Assets: |
||||||||||||
| Cash equivalents(1) |
$ | 11,556 | $ | — | $ | — | $ | 11,556 | ||||
| Total assets |
$ | 11,556 | $ | — | $ | — | $ | 11,556 | ||||
| Liabilities: |
||||||||||||
| Interest rate swaps |
$ | — | $ | 84,573 | $ | — | $ | 84,573 | ||||
| Total liabilities |
$ | — | $ | 84,573 | $ | — | $ | 84,573 | ||||
| (1) | As of December 31, 2009, and 2008, cash equivalents of $7.4 million and $11.5 million were included in cash and cash equivalents, and $7.7 million and $0.1 million were included in restricted cash, respectively. |
7. Derivative Instruments
Accounting for Derivative Instruments
Cash Flow Hedges — OMEC reports the effective portion of the unrealized gain or loss on a derivative instrument designated and qualifying as a cash flow hedging instrument as a component of OCI and reclassifies such gains and losses into earnings in the same period during which the hedged forecasted transaction affects earnings. Gains and losses due to ineffectiveness on commodity hedging instruments are included in unrealized gains and losses and are recognized currently in earnings as interest expense. If it is determined that the forecasted transaction is no longer probable of occurring, then hedge accounting will be discontinued prospectively. If the hedging instrument is terminated or de-designated prior to the occurrence of the hedged forecasted transaction, the gain or loss associated with the hedge instrument remains deferred in OCI until such time as the forecasted transaction impacts earnings, or until it is determined that the forecasted transaction is probable of not occurring.
Derivatives Not Designated as Hedging Instruments — OMEC enters into interest rate transactions that primarily act as economic hedges, but either do not qualify as hedges under hedge accounting guidelines or qualify under the hedge accounting guidelines and the hedge accounting designation has not been elected. Changes in fair value of derivatives not designated as hedging instruments are recognized currently in earnings as interest expense.
204
Table of Contents
Index to Financial Statements
OTAY MESA ENERGY CENTER, LLC
(Previously a Development Stage Company)
NOTES TO FINANCIAL STATEMENTS — (Continued)
For the Years Ended December 31, 2009 and 2008,
and the Period May 1, 2007 to December 31, 2007
OMEC designated interest rate swap agreements as cash flow hedges of the project financing on October 31, 2007 and discontinued the cash flow hedge designation on March 31, 2008. During this period, changes in the fair value related to the effective portion of the swap agreements were recorded to AOCI. Prior to October 31, 2007, changes in the fair value of interest rate swaps totaling $8.3 million were recorded as interest expense in the Statement of Operations. During the three months ended March 31, 2008, OMEC recognized an unrealized loss in AOCI totaling $17.0 million. Subsequent to March 31, 2008, changes in the fair value of the swap agreements were recorded in earnings as a component of interest expense.
As of December 31, 2009, the net forward notional buy (sell) position of OMEC’s outstanding interest rate swap contracts were as follows (in thousands):
| Derivative Instruments |
Notional Volumes | ||
| Interest rate swaps |
$ | 374,513 | |
Changes in the fair values of derivative instruments (both assets and liabilities) are reflected either in OCI, net of tax, for the effective portion of derivative instruments which qualify for cash flow hedge accounting treatment, or on the Statements of Operations as a component of interest expense within net income.
The following table details the components of total mark-to-market activity for both the net realized gain (loss) and the net unrealized gain (loss) recognized from OMEC’s interest rate swaps included in interest expense in the Statements of Operations for the years ended December 31, 2009 and 2008, and the period May 1, 2007 to December 31, 2007 (in thousands):
| 2009 | 2008 | 2007 | ||||||||||
| Realized gain (loss) |
$ | (14,652 | ) | $ | (3,631 | ) | $ | (38 | ) | |||
| Unrealized gain (loss) |
39,492 | (49,644 | ) | (8,561 | ) | |||||||
| Total mark-to-market gain (loss) |
$ | 24,840 | $ | (53,275 | ) | $ | (8,599 | ) | ||||
For the years ended December 31, 2009 and 2008, OMEC recorded losses to increase interest expense of $2.1 million and $0, respectively, and $0 for the period May 1, 2007 to December 31, 2007, based on the reclassification adjustment from AOCI into earnings. OMEC currently estimates that pre-tax losses of approximately $6.9 million would be reclassified from AOCI into earnings during the 12 months ended December 31, 2010.
8. Related Party Transactions
Project Management Agreement
On the Contribution Date, OMEC entered into an agreement (the “PMA”) with Calpine Construction Management Company, Inc. (“CCMCI”), an indirect, wholly owned subsidiary of Calpine Corp., whereby CCMCI would provide all project management and procurement services, installation services, commissioning services and post completion services for the construction of the Plant. After completion of the performance
205
Table of Contents
Index to Financial Statements
OTAY MESA ENERGY CENTER, LLC
(Previously a Development Stage Company)
NOTES TO FINANCIAL STATEMENTS — (Continued)
For the Years Ended December 31, 2009 and 2008,
and the Period May 1, 2007 to December 31, 2007
conditions stipulated in the PMA, including payment of outstanding balances, the PMA will be terminated. Under the PMA, OMEC incurred costs of $19.7 million and $4.4 million for the years ended December 31, 2009 and 2008, respectively, and $3.0 million for the period May 1, 2007 to December 31, 2007, which were capitalized to property, plant and equipment. Additionally, the PMA required CCMCI to pay delay liquidated damages to OMEC in the amount of $101,000 per day in the event that the project completion did not occur on or before the guaranteed completion date of May 1, 2009. Liquidating damages to OMEC under the PMA totaled $15.1 million and were recorded as a reduction in amounts capitalized to property, plant and equipment. As of December 31, 2009 and 2008, accounts payable to CCMCI totaled $0.3 million and $0.8 million, respectively.
Operations and Maintenance Agreement
OMEC has contracted with Calpine Operating Services Company, Inc. (“COSCI”), an indirect, wholly owned subsidiary of Calpine Corp. for the operation and maintenance of the Plant under an agreement (the “O&M Agreement”) dated May 1, 2007. The O&M Agreement is effective through the maturity date of the project financing, with provisions for successive one-year renewals. Under the terms of the O&M Agreement, COSCI is obligated to perform all operation and maintenance services in connection with the business, including operation, repair and maintenance, administrative and billing services, technical analyses and contract administration. OMEC reimburses COSCI for its direct costs, including direct labor costs and other costs incurred in the performance of the services. The O&M Agreement stipulates a quarterly administrative fee of $125,000, which is subject to annual escalation. For the years ended December 31, 2009 and 2008, OMEC recorded expenses under the O&M Agreement of $2.5 million and $0, respectively, and $0 for the period May 1, 2007 to December 31, 2007, inclusive of reimbursable expenses. As of December 31, 2009 and 2008, accounts payable to COSCI totaled $0.9 million and $0, respectively.
Activity with Calpine Corp.
On the Contribution Date, Calpine Corp. contributed cash, property, plant and equipment, other assets and liabilities to OMEC under the Contribution and Transfer Agreement dated October 23, 2006. Calpine Corp. contributed its benefit to payments under a note receivable in the amount of $1.7 million for the year ended December 31, 2008, and $0.1 million for the period May 1, 2007 to December 31, 2007. In addition to the payments due under the note receivable, Calpine Corp. contributed $4.3 million and $8.6 million of cash to OMEC for the years ended December 31, 2009 and 2008, respectively, and $0.3 million for the period May 1, 2007 to December 31, 2007, to support construction-related activities.
During 2009, OMEC made a cash distribution to Calpine Corp. for $9.1 million in accordance with the terms of the Credit Agreement. OMEC also recorded cost allocations from Calpine Corp. for centralized services for $2.3 million, which are included in general and administrative expense in the Statement of Operations for the year ended December 31, 2009.
At December 31, 2009 and 2008, OMEC had accounts payable to other Calpine Corp. affiliates of $3.3 million and $3.9 million, respectively, resulting from transactions in the ordinary course of business.
Amended and Restated Power Purchase Agreement
On May 1, 2007, OMEC entered into the PPA with SDG&E, a related party, to sell all power capacity of the Plant upon achieving commercial operations. The PPA has a term of 10 years from the commencement of
206
Table of Contents
Index to Financial Statements
OTAY MESA ENERGY CENTER, LLC
(Previously a Development Stage Company)
NOTES TO FINANCIAL STATEMENTS — (Continued)
For the Years Ended December 31, 2009 and 2008,
and the Period May 1, 2007 to December 31, 2007
commercial operation of the Plant. Under the terms of the PPA, OMEC receives monthly payments, primarily consisting of a capacity component, variable operation and maintenance component and a start-up payment. In addition, SDG&E is responsible for fuel supply and transportation to the Plant.
The PPA meets the criteria of an operating lease, with the capacity payments levelized on a straight-line basis over the term of the agreement. Minimum payments due to OMEC under the PPA are as follows (in thousands):
| 2010 |
$ | 72,553 | |
| 2011 |
70,763 | ||
| 2012 |
70,763 | ||
| 2013 |
70,763 | ||
| 2014 |
70,763 | ||
| Thereafter |
337,960 | ||
| Total |
$ | 693,565 | |
At December 31, 2009 and 2008, OMEC had accounts receivable from SDG&E related to the PPA of $10.6 million and $0, respectively.
Under the terms of the PPA, OMEC was required to pay liquidating damages of $50,000 per day if commercial operations did not commence before the guaranteed commercial operations date of May 30, 2009. OMEC recorded liquidating damages to SDG&E totaling $6.1 million, which are included in the Statement of Operations for the year ended December 31, 2009.
Restated Interconnection Facility Agreement
On May 1, 2007, Calpine Corp. assigned the Restated Interconnections Facility Agreement (“RIFA”) and Restated Interconnection Agreement (“RIA”) with SDG&E to OMEC. The RIFA agreement requires SDG&E to design, engineer, construct and install the switchyard facilities and perform transmission upgrades in which OMEC will reimburse SDG&E. As of December 31, 2008, OMEC had recorded $22.7 million, including $8.6 million contributed from Calpine Corp., for network upgrades and accrued interest under the RIFA, which is included in deferred transmission credits, related party in the balance sheet. During the year ended December 31, 2009, additional upgrade costs and accrued interest totaling $0.8 million were recorded under the RIFA. At the Commercial Operations Date, OMEC was entitled to a repayment for the cost of the interconnection facilities that were considered network upgrades, including interest from the time the original payments were made. During the year ended December 31, 2009, OMEC received $23.5 million from SDG&E for repayment of the cost of transmission facilities.
207
Table of Contents
Index to Financial Statements
OTAY MESA ENERGY CENTER, LLC
(Previously a Development Stage Company)
NOTES TO FINANCIAL STATEMENTS — (Continued)
For the Years Ended December 31, 2009 and 2008,
and the Period May 1, 2007 to December 31, 2007
9. Income Taxes
OMEC accrues taxes at the enacted statutory rates. The income tax provision reflected in the statements of operations for the years ended December 31, 2009 and 2008, and for the period May 1, 2007 to December 31, 2007, consisted of the following (in thousands):
| 2009 | 2008 | 2007 | |||||||
| Current: |
|||||||||
| Federal |
$ | — | $ | — | $ | — | |||
| State |
— | 28 | — | ||||||
| Total current |
— | 28 | — | ||||||
| Deferred: |
|||||||||
| Federal |
— | — | — | ||||||
| State |
— | — | — | ||||||
| Total deferred |
— | — | — | ||||||
| Total income tax expense |
$ | — | $ | 28 | $ | — | |||
A reconciliation of the U.S. federal statutory rate of 35% to the effective tax rate for the years ended December 31, 2009 and 2008, and for the period May 1, 2007 to December 31, 2007, is as follows:
| 2009 | 2008 | 2007 | |||||||
| Federal statutory tax expense rate |
35 | % | 35 | % | 35 | % | |||
| Change in valuation allowance |
(35 | ) | (35 | ) | (35 | ) | |||
| Effective income tax expense rate |
0 | % | 0 | % | 0 | % | |||
The components of deferred taxes as of December 31, 2009 and 2008, are as follows (in thousands):
| 2009 | 2008 | |||||||
| Deferred tax assets: |
||||||||
| Deferred financing costs |
$ | 122 | $ | 122 | ||||
| Derivative instruments |
18,692 | 37,076 | ||||||
| Written call option |
20,219 | 20,219 | ||||||
| Net operating loss carryover |
20,430 | 2,495 | ||||||
| Property, plant and equipment |
78,175 | 85,783 | ||||||
| Deferred tax assets before valuation allowance |
137,638 | 145,695 | ||||||
| Less: Valuation allowance |
(118,080 | ) | (125,476 | ) | ||||
| Total deferred tax assets |
19,558 | 20,219 | ||||||
| Deferred tax liabilities: |
||||||||
| Intangible asset |
(19,496 | ) | (20,219 | ) | ||||
| Prepaid expenses |
(62 | ) | — | |||||
| Total deferred tax liabilities |
(19,558 | ) | (20,219 | ) | ||||
| Net deferred tax asset |
— | — | ||||||
| Less: Current portion deferred tax asset |
387 | 513 | ||||||
| Deferred income taxes, net of current portion |
$ | (387 | ) | $ | (513 | ) | ||
208
Table of Contents
Index to Financial Statements
OTAY MESA ENERGY CENTER, LLC
(Previously a Development Stage Company)
NOTES TO FINANCIAL STATEMENTS — (Continued)
For the Years Ended December 31, 2009 and 2008,
and the Period May 1, 2007 to December 31, 2007
For the year ended December 31, 2009, OMEC had U.S. federal and state NOL carryforwards of $50.3 million and $31.9 million, respectively, which will expire between 2022 and 2029 for both state and U.S. federal purposes if not utilized. These NOL carryforwards include the effects of activities conducted by Calpine Corp. on OMEC’s behalf from 2002 to April 30, 2007, prior to the Contribution Date. In addition, as a result of the bankruptcy filing discussed in Note 10 and other factors, Calpine Corp. concluded that impairment indicators existed for certain long-lived assets during 2005. These long-lived assets were evaluated for impairment based on probability-weighted alternatives of utilizing the assets versus reselling the assets to third parties. Prior to 2007, impairment and other charges totaling approximately $195.0 million were recorded to reduce the assets to their estimated realizable value which were included in Calpine Corp.’s original basis contributed to OMEC in May 2007 and resulted in a deferred tax asset.
In assessing the realizability of deferred tax assets, management considers whether it is more likely than not that some portion or all of the deferred tax assets will not be realized. The ultimate realization of deferred tax assets is dependent upon the generation of future taxable income during the periods in which those temporary differences become deductible. A valuation allowance is recorded when it is more likely than not that a deferred tax asset will not be realized. Based on the weight of available positive and negative evidence, management determined it was appropriate to record a valuation allowance on all deferred tax assets at both December 31, 2009 and 2008, to the extent not offset by taxable income generated by reversing temporary differences of the appropriate character within the carryback or carryforward periods. As a result, OMEC has provided a valuation allowance of $118.1 million and $125.5 million as of December 31, 2009 and 2008, respectively.
OMEC’s unrecognized tax benefit decreased during 2009, due to elimination of the uncertain tax position. When the Plant achieved commercial operations, management reassessed the tax basis of the assets. As the tax basis of the assets was adjusted, the uncertain tax position was resolved. A reconciliation of the beginning and ending amount of the unrecognized tax benefits is as follows (in thousands):
| 2009 | 2008 | ||||||
| Balance, beginning of period |
$ | 2,107 | $ | 2,091 | |||
| Increase related to current year tax positions |
— | 16 | |||||
| Decrease related to prior year tax positions |
(2,107 | ) | — | ||||
| Balance, end of period |
$ | — | $ | 2,107 | |||
10. Impact of Calpine Corp.’s Bankruptcy
On December 20, 2005, Calpine Corp. and certain of its subsidiaries, including CCMCI and COSCI, but not OMEC, filed voluntary petitions for relief under Chapter 11 of the Bankruptcy Code in the U.S. Bankruptcy Court. The Calpine Debtors’ plan of reorganization, as approved by its creditors, was confirmed by the Bankruptcy Court on December 19, 2007, and became effective on January 31, 2008. While OMEC was not a Calpine Debtor, it did have agreements with Calpine Debtors. During the bankruptcy cases, both CCMCI and COSCI assumed and continued to perform under their agreements with OMEC.
209
Table of Contents
Index to Financial Statements
OTAY MESA ENERGY CENTER, LLC
(Previously a Development Stage Company)
NOTES TO FINANCIAL STATEMENTS — (Continued)
For the Years Ended December 31, 2009 and 2008,
and the Period May 1, 2007 to December 31, 2007
11. Commitments and Contingencies
Letter of Credit
As of December 31, 2008, OMEC had a letter of credit available, but not drawn upon, of $25.0 million. The purpose of the letter of credit was to secure OMEC’s obligations to SDG&E during the construction period, as required under the PPA. The letter of credit was cancelled in October 2009.
Ground Sublease and Easement Agreement
On May 1, 2007, OMEC entered into the Sublease Agreement with Calpine Corp. Calpine Corp. subsequently assigned its leasehold interest under the Sublease Agreement to SDG&E. The Sublease Agreement expires on July 7, 2032, and has provisions for two ten-year renewal terms. As subrent under this agreement, OMEC shall pay to SDG&E base subrent equal to $1.00 per year and shall pay directly to the lessor on SDG&E’s behalf all of the other amounts owing by SDG&E under the original ground lease (whether as rent, additional rent or otherwise) including taxes and similar charges that SDG&E is obligated to pay under the original ground lease. Under the Sublease Agreement, OMEC has an option to require SDG&E to sell its leasehold interest in the site to OMEC if the call and put options discussed in Note 3 are not exercised. Ground lease expense is levelized over the term of the agreement. Ground lease expense totaled $0.3 million and $0, net of expenses capitalized to property, plant and equipment of $0.9 million and $1.2 million, for the years ended December 31, 2009 and 2008, respectively. Costs incurred under the Sublease Agreement totaled $0.8 million for the period May 1, 2007 to December 31, 2007, and were capitalized to property, plant and equipment. The Sublease Agreement is accounted for as an operating lease. Minimum lease payments are levelized over the term of the agreement, and the resulting deferred lease levelization liability is included in other long-term liabilities on the Balance Sheets.
As of December 31, 2009, minimum lease payments are as follows (in thousands):
| 2010 |
$ | 903 | |
| 2011 |
931 | ||
| 2012 |
958 | ||
| 2013 |
987 | ||
| 2014 |
1,017 | ||
| Thereafter |
23,801 | ||
| Total |
$ | 28,597 | |
Parcel One Lease Agreement
On May 1, 2007, Calpine Corp. assigned the Parcel One Lease Agreement to OMEC whereby OMEC paid an annual reservation fee, which was amortized monthly to construction in progress until such time as the land was parceled and available for lease. On January 10, 2008, OMEC made the annual reservation fee payment of $0.6 million for the year ended December 31, 2008. On June 17, 2008, the Parcel One Lease Agreement was amended to reflect reparcelization of the lessor’s land and to identify the specific parcels, now called Parcel 1
210
Table of Contents
Index to Financial Statements
OTAY MESA ENERGY CENTER, LLC
(Previously a Development Stage Company)
NOTES TO FINANCIAL STATEMENTS — (Continued)
For the Years Ended December 31, 2009 and 2008,
and the Period May 1, 2007 to December 31, 2007
and Parcel 2, which the lessor leased to OMEC. The amended lease expired on June 30, 2009 and was not renewed by OMEC.
Litigation
OMEC is involved in various legal and litigation matters arising in the normal course of business. Management does not expect that the outcome of these proceedings will have a material adverse effect on OMEC’s financial position, results of operations or cash flows.
211
Table of Contents
Index to Financial Statements
| Exhibit Number |
Description | |
| 2.1 | Debtors’ Sixth Amended Joint Plan of Reorganization Pursuant to Chapter 11 of the United States Bankruptcy Code (incorporated by reference to Exhibit 2.1 to the Company’s Current Report on Form 8-K filed with the SEC on December 27, 2007). | |
| 2.2 | Findings of Fact, Conclusions of Law, and Order Confirming Sixth Amended Joint Plan of Reorganization Pursuant to Chapter 11 of the Bankruptcy Code (incorporated by reference to Exhibit 2.2 to the Company’s Current Report on Form 8-K filed with the SEC on December 27, 2007). | |
| 3.1 | Amended and Restated Certificate of Incorporation of the Company, as amended (incorporated by reference to Exhibit 3.1 to the Company’s Current Report on Form 8-K filed with the SEC on February 1, 2008). | |
| 3.2 | Amended and Restated By-Laws of the Company (as amended through May 7, 2009) (incorporated by reference to Exhibit 3.2 to the Company’s Quarterly Report on Form 10-Q for the quarter ended June 30, 2009, filed with the SEC on July 31, 2009). | |
| 4.1 | Indenture, dated as of June 13, 2003, between Power Contract Financing, L.L.C. and Wilmington Trust Company, as trustee, accounts agent, paying agent and registrar, including form of 6.256 senior secured notes due 2010 (incorporated by reference to Exhibit 4.4 to the Company’s Quarterly Report on Form 10-Q for the quarter ended June 30, 2003, filed with the SEC on August 14, 2003). | |
| 4.2 | Indenture, dated as of September 30, 2003, among Gilroy Energy Center, LLC, each of Creed Energy Center, LLC and Goose Haven Energy Center, as guarantors, and Wilmington Trust Company, as trustee and collateral agent, including form of 4.00% senior secured notes due 2011 (incorporated by reference to Exhibit 4.6 to the Company’s Quarterly Report on Form 10-Q for the quarter ended September 30, 2003, filed with the SEC on November 13, 2003). | |
| 4.3 | Third Priority Indenture, dated as of March 23, 2004, among Calpine Generating Company, LLC, CalGen Finance Corp. and Manufacturers and Traders Trust Company (as successor trustee to Wilmington Trust FSB), as trustee, including form of third priority secured floating rate notes due 2011 (incorporated by reference to Exhibit 4.21 to the Company’s Annual Report on Form 10-K for the year ended December 31, 2003, filed with the SEC on March 25, 2004). | |
| 4.4 | Indenture, dated as of June 2, 2004, between Power Contract Financing III, LLC and Wilmington Trust Company, as trustee, accounts agent, paying agent and registrar, including form of senior secured notes due 2010 (incorporated by reference to Exhibit 4.6 to the Company’s Quarterly Report on Form 10-Q for the quarter ended June 30, 2004, filed with the SEC on August 9, 2004). | |
| 4.5 | Indenture, dated May 19, 2009, among Calpine Construction Finance Company, L.P. and CCFC Finance Corp., the guarantors named therein, and Wilmington Trust Company, as trustee, including form of 8.00% senior secured notes due 2016 (incorporated by reference to Exhibit 4.1 to our Current Report on Form 8-K filed with the SEC on May 22, 2009). | |
| 4.6 | Indenture, dated October 21, 2009, between the Company and Wilmington Trust Company, as trustee, including form of 7.25% senior secured notes due 2017 (incorporated by reference to Exhibit 4.1 to the Company’s Current Report on Form 8-K filed with the SEC on October 26, 2009). | |
| 4.7 | Registration Rights Agreement, dated January 31, 2008, among the Company and each Participating Shareholder named therein (incorporated by reference to Exhibit 10.1 to the Company’s Current Report on Form 8K filed with the SEC on February 6, 2008). | |
| 10.1 | Financing Agreements | |
212
Table of Contents
Index to Financial Statements
| Exhibit Number |
Description | |
| 10.1.1.1 | Credit Agreement, dated as of January 31, 2008, among the Company, as borrower, Goldman Sachs Credit Partners L.P., Credit Suisse, Deutsche Bank Securities Inc. and Morgan Stanley Senior Funding, Inc., as co-documentation agents and as co-syndication agents, General Electric Capital Corporation, as sub-agent for the revolving lenders, Goldman Sachs Credit Partners L.P., as administrative agent and as collateral agent and each of the financial institutions from time to time party thereto (incorporated by reference to Exhibit 4.1 to the Company’s Current Report on Form 8-K filed with the SEC on February 1, 2008). | |
| 10.1.1.2 | First Amendment to Credit Agreement and Second Amendment to Collateral Agency and Intercreditor Agreement, dated as of August 20, 2009, among the Company, certain of the Company’s subsidiaries as guarantors, the financial institutions party thereto as lenders and Goldman Sachs Credit Partners L.P., as administrative agent and collateral agent (incorporated by reference to Exhibit 10.2 to the Company’s Current Report on Form 8-K filed with the SEC on August 26, 2009). | |
| 10.1.1.3 | Guaranty and Collateral Agreement, dated as of January 31, 2008, made by the Company and certain of the Company’s subsidiaries party thereto in favor of Goldman Sachs Credit Partners, L.P., as collateral agent (incorporated by reference to Exhibit 10.1.3 to the Company’s Annual Report on Form 10-K for the year ended December 31, 2007, filed with the SEC on February 29, 2008). | |
| 10.1.1.4 | Commodity Collateral Revolving Credit Agreement, dated as of July 8, 2008, among Calpine Corporation as Borrower, Goldman Sachs Credit Partners L.P. as Payment Agent, sole Lead Arranger and sole Bookrunner, and the Lenders from time to time party thereto (incorporated by reference to Exhibit 10.1 to the Company’s Current Report on Form 8-K filed with the SEC on July 14, 2008). | |
| 10.1.5 | Credit Agreement, dated as of June 24, 2004, among Riverside Energy Center, LLC, the Lenders named therein, Union Bank of California, N.A., as the Issuing Bank, Credit Suisse First Boston, acting through its Cayman Islands Branch, as Lead Arranger, Book Runner, Administrative Agent and Collateral Agent, and CoBank, ACB, as Syndication Agent (incorporated by reference to Exhibit 10.1.9 to the Company’s Annual Report on Form 10-K for the year ended December 31, 2004, filed with the SEC on March 31, 2005). | |
| 10.1.6 | Credit Agreement, dated as of June 24, 2004, among Rocky Mountain Energy Center, LLC, the Lenders named therein, Union Bank of California, N.A., as the Issuing Bank, Credit Suisse First Boston, acting through its Cayman Islands Branch, as Lead Arranger, Book Runner, Administrative Agent and Collateral Agent, and CoBank, ACB, as Syndication Agent (incorporated by reference to Exhibit 10.1.10 to the Company’s Annual Report on Form 10-K for the year ended December 31, 2004, filed with the SEC on March 31, 2005). | |
| 10.1.7 | Amended and Restated Credit Agreement, dated as of November 24, 2009, among Calpine Steamboat Holdings, LLC, Calyon New York Branch, as lead arranger, co-book runner, administrative agent, collateral agent and Security Fund LC issuer, WestLB AG, New York Branch, as lead arranger, co-book runner and syndication agent, CoBank ACB and The Bank of Tokyo-Mitsubishi UFJ, LTD., New York Branch, as lead arrangers, co-book runners and co-documentation agents, Landesbank Hessen-Thüringen, Natixis, New York Branch, The Governor & Company of the Bank of Ireland and Bayerische Hypo-Und Vereinsbank AG, New York Branch, as lead arrangers, and the lenders named therein (incorporated by reference to Exhibit 10.1 to the Company’s Current Report on Form 8-K filed with the SEC on November 30, 2009). | |
| 10.2 | Management Contracts or Compensatory Plans or Arrangements | |
213
Table of Contents
Index to Financial Statements
| Exhibit Number |
Description | |
| 10.2.1.1 | Employment Agreement, dated August 10, 2008, between the Company and Jack A. Fusco (incorporated by reference to Exhibit 10.1 to the Company’s Current Report on Form 8-K filed with the SEC on August 12, 2008).† | |
| 10.2.1.2 | Calpine Corporation Executive Sign On Non-Qualified Stock Option Agreement (Jack A. Fusco) (incorporated by reference to Exhibit 10.2 to the Company’s Current Report on Form 8-K filed with the SEC on August 12, 2008).† | |
| 10.2.2 | Letter Agreement, dated December 17, 2008, between the Company and Zamir Rauf (incorporated by reference to Exhibit 10.1 to the Company’s Current Report on Form 8-K filed with the SEC on December 19, 2008).† | |
| 10.2.3.1 | Letter Agreement, dated September 1, 2008, between the Company and John B. Hill (incorporated by reference to Exhibit 10.1 to the Company’s Current Report on Form 8-K filed with the SEC on September 4, 2008).† | |
| 10.2.3.2 | Calpine Corporation Executive Sign On Non-Qualified Stock Option Agreement (John B. Hill) (incorporated by reference to Exhibit 10.2 to the Company’s Current Report on Form 8-K filed with the SEC on September 4, 2008).† | |
| 10.2.4.1 | Employment Agreement, dated August 11, 2008, between the Company and W. Thaddeus Miller (incorporated by reference to Exhibit 10.2.7 to the Company’s Quarterly Report on Form 10-Q for the quarter ended September 30, 2008, filed with the SEC on November 7, 2008).† | |
| 10.2.4.2 | Calpine Corporation Executive Sign On Non-Qualified Stock Option Agreement (Miller) (incorporated by reference to Exhibit 4.4 to the Company’s Registration Statement on Form S-8 (Registration No. 333-153860) filed with the SEC on October 6, 2008).† | |
| 10.2.5 | Calpine Corporation U.S. Severance Program.*† | |
| 10.2.6 | Calpine Corporation 2009 Calpine Incentive Plan (incorporated by reference to Exhibit 10.2 to the Company’s Quarterly Report on Form 10-Q for the quarter ended March 31, 2009, filed with the SEC on May 8, 2009).† | |
| 10.2.7 | Calpine Corporation 2008 Calpine Incentive Plan (incorporated by reference to Exhibit 10.2.9 to the Company’s Quarterly Report on Form 10-Q for the quarter ended September 30, 2008, filed with the SEC on November 7, 2008).† | |
| 10.2.8.1 | Calpine Corporation 2008 Equity Incentive Plan (incorporated by reference to Exhibit 4.5 to the Company’s Registration Statement on Form S-8 (No. 333-149074) filed with the SEC on February 6, 2008).† | |
| 10.2.8.2 | Form of Non-Qualified Stock Option Agreement (Pursuant to the 2008 Equity Incentive Plan) (incorporated by reference to Exhibit 10.4.3 to the Company’s Quarterly Report on Form 10-Q for the quarter ended March 31, 2008, filed with the SEC on May 12, 2008).† | |
| 10.2.8.3 | Form of Restricted Stock Agreement (Pursuant to the 2008 Equity Incentive Plan) (incorporated by reference to Exhibit 10.4.4 to the Company’s Quarterly Report on Form 10-Q for the quarter ended March 31, 2008, filed with the SEC on May 12, 2008).† | |
| 10.2.8.4 | Director’s Restricted Stock Unit Agreement (Pursuant to the 2008 Equity Incentive Plan) between the Company and Mr. William J. Patterson (incorporated by reference to Exhibit 10.4.6 to the Company’s Quarterly Report on Form 10-Q for the quarter ended March 31, 2008, filed with the SEC on May 12, 2008).† | |
| 10.2.8.5 | Restricted Stock Unit Election Form between the Company and William J. Patterson (incorporated by reference to Exhibit 10.4.7 to the Company’s Quarterly Report on Form 10-Q for the quarter ended March 31, 2008, filed with the SEC on May 12, 2008).† | |
214
Table of Contents
Index to Financial Statements
| Exhibit Number |
Description | |
| 10.2.9.1 | Calpine Corporation 2008 Director Incentive Plan (incorporated by reference to Exhibit 4.4 to the Company’s Registration Statement on Form S-8 (No. 333-149074) filed with the SEC on February 6, 2008).† | |
| 10.2.9.2 | Amendment No. 1 to the Calpine Corporation 2008 Director Incentive Plan (incorporated by reference to the Company’s Annual Report on Form 10-K for the year ended December 31, 2008, filed with the SEC on February 27, 2009).† | |
| 10.2.9.3 | Form of Restricted Stock Agreement (Pursuant to the 2008 Director Incentive Plan) (incorporated by reference to Exhibit 10.4.5 to the Company’s Quarterly Report on Form 10-Q for the quarter ended March 31, 2008, filed with the SEC on May 12, 2008).† | |
| 10.2.10 | Calpine Corporation Change in Control and Severance Benefits Plan.*† | |
| 10.2.11 | Letter Agreement, dated December 30, 2008, between the Company and Jim D. Deidiker (incorporated by reference to Exhibit 10.1 to the Company’s Current Report on Form 8-K filed with the SEC on January 8, 2009).† | |
| 10.2.12 | Letter re Employment Offer, dated February 6, 2009, between the Company and Michael D. Rogers (incorporated by reference to Exhibit 10.1 to the Company’s Quarterly Report on Form 10-Q for the quarter ended March 31, 2009, filed with the SEC on May 7, 2009).† | |
| 18.1 | Letter of preferability regarding change in accounting principle from PricewaterhouseCoopers LLP, Independent Registered Public Accounting Firm.* | |
| 21.1 | Subsidiaries of the Company.* | |
| 23.1 | Consent of PricewaterhouseCoopers LLP, Independent Registered Public Accounting Firm.* | |
| 23.2 | Consent of PricewaterhouseCoopers LLP, Independent Registered Public Accounting Firm.* | |
| 24.1 | Power of Attorney of Officers and Directors of Calpine Corporation (set forth on the signature pages of this report).* | |
| 31.1 | Certification of the Chief Executive Officer Pursuant to Rule 13a-14(a) or Rule 15d-14(a) under the Securities Exchange Act of 1934, as Adopted Pursuant to Section 302 of the Sarbanes-Oxley Act of 2002.* | |
| 31.2 | Certification of the Senior Vice President and Chief Financial Officer Pursuant to Rule 13a-14(a) or Rule 15d-14(a) under the Securities Exchange Act of 1934, as Adopted Pursuant to Section 302 of the Sarbanes-Oxley Act of 2002.* | |
| 32.1 | Certification of Chief Executive Officer and Chief Financial Officer Pursuant to 18 U.S.C. Section 1350, as Adopted Pursuant to Section 906 of the Sarbanes-Oxley Act of 2002.* | |
| * | Filed herewith. |
| † | Management contract or compensatory plan or arrangement. |
215